application of bioinformatics tools in gel-based proteomics
TRANSCRIPT

23
Application of Bioinformatics Tools in Gel-Based Proteomics
Kah Wai Lin, Min Jia and Serhiy Souchelnytskyi Department of Oncology-Pathology,
Karolinska Institutet, Stockholm Sweden
1. Introduction
Personalized medicine is the most promising approaches in the treatment of various diseases, especially cancer. The use of appropriate biomarkers for personalized treatment has advantage over conventional therapeutics approach, as it confer maximum effectiveness with minimum side effect. Personalized treatment can be achieved by implementation of omic studies in clinical practices. Application of genomic, transcriptomic, proteomic and metabolomic studies deliver a vast amount of data that lead to the discovery of novel biomarkers for diagnostic, prognostic and therapeutic purposes. Therefore, further exploration in omic study could lead to the implementation of personalized medicine as a standard therapeutic scheme in the clinic. Proteomics is a global study of entire proteins of cell, tissue and organism in a particular condition and time point (Graves & Haystead, 2002). Proteomics is a very comprehensive discipline that includes the study of expression, function, localization, structure, modification, and protein-protein interaction (Graves & Haystead, 2002; Lim & Elenitoba-Johnson, 2004). A proteomics experiment generates vast amount of data that require further analysis, and systems biology is the main approach. Systems biology is an integrative science that studies the complex behavior of biological entities at the systems level (Kitano, 2002a, 2002b). Integrating the proteomics data into systems biology language is an important approach in understanding the behavior of the complex organisms at various levels (Souchelnytskyi, 2005). In recent years, our knowledge of proteomics and system biology is growing rapidly and create an excitement in scientific community because of its potential in novel biomarker and drug discovery (Duncan & Hunsucker, 2005). Proteomics studies are highly dependent on the technology for protein separation and identification, and bioinformatics for data analysis. By protein separation techniques, gel-based and liquid chromatography (LC)-based approaches represent the primary stream in proteomics. In gel-based approach, that is, conventional 2D gel electrophoresis (2D-GE) and 2D differential gel electrophoresis (2D-DIGE), the proteins are separated by their molecular weight and isoelectric point. In LC-based approach, the proteins or peptides are separated by using high performance liquid chromatography (Aebersold & Mann, 2003; Cravatt et al., 2007). The identification and characterization of proteins or peptides by mass spectrometry are followed after separation (Kolker et al., 2006). In more recent years, antibody-based methods emerging as important approaches in proteomics. These approaches included the
www.intechopen.com

Integrative Proteomics
426
use of immunohistochemistry (IHC) on tissue microarrays (TMAs), reverse phase protein arrays (RPPAs) and serum-based diagnostic assays using antibody arrays (Borrebaeck & Wingren, 2007; Brennan, O'Connor et al., 2010; Wingren & Borrebaeck, 2004). In the present article, we focus our discussion on the various ways of translating gel-based proteomics data into systems biology using different bioinformatics approaches. Firstly, we will discuss the dataset from gel-based proteomics, including the acquisition of primary data and type of data for bioinformatics analysis. In the subsequent section, we will discuss the several way of analyzing the data acquired from gel-based proteomics, which included the ontological-based classification, hierarchical clustering, systems and network analysis (Table 1). We will focus our discussion on the general concepts of the analysis, type of
Ontological Classification Hierarchical Clustering Systems and Network
Analysis
Query Tools
GO-TermFinder
(Boyle et al., 2004)
AmiGO
(Carbon et al., 2009)
MatchMiner
(Bussey et al., 2003)
Visualization Tools
GoMiner
(Bussey et al., 2003)
FatiGO
(Al-Shahrour et al., 2004,
2007)
Onto-Express
(Draghici et al., 2003; Khatri
et al., 2002)
GOSurfer
(Zhong et al., 2004)
GOTM
(Zhang et al., 2004)
Cluster+TreeView
(Eisen et al., 1998)
PermutMatrix
(Caraux & Pinloche, 2005)
POMELO II
(Morrissey & Diaz-Uriarte,
2009)
Genesis (Sturn et al., 2002)
Osprey
(Breitkreutz et al., 2002)
BioLayout
(Enright & Ouzounis, 2001)
CellDesigner
(Funahashi et al., 2007)
Cytoscape
(Kohl et al. 2011)
Table 1. List of bioinformatics tools that are commonly used for gel-based proteomics.
www.intechopen.com
Application of Bioinformatics Tools in Gel-Based Proteomics
427
datasets used and bioinformatics software. Some examples of studies and future directions are presented for each approach.
2. Dataset in gel-based proteomics
The general workflow of bioinformatics analysis of gel-based proteomics is shown in figure 1. In gel-based proteomics, various types of datasets can be generated. There can be an annotated 2D gel, mass spectra, and list of identified proteins (Taylor et al., 2003). These dataset can be qualitative or quantitative. In this review, we focus on the analysis of 2 type of datasets generated from annotated 2D gel, i.e. global expression profile and differential expression profile. By identifying the protein spots on a 2D gel, a comprehensive, global protein expression profile can be generated. This approach can deliver a list of proteins expressed in a cell or tissue in a particular condition, which is exceptionally useful in understanding their biological characteristic. An example is a recent study on proteome profiling of breast epithelial cells with various proliferation potential. This study generate the most comprehensive 2D protein expression map with 183 proteins identified in 184A1 cells and 318 proteins identified in MCF10A cells, which lead to the understanding of their biological properties and delivered a list of potential biomarkers of early event of tumorigenesis (Bhaskaran et al., 2009). By identifying the protein spots in 2D gels that are different in their staining intensity in different conditions, a differential expression profile can be generated. Various biological questions can be addressed by differential expression analysis. The proteome changes upon drugs treatment can be studied by comparing the 2D gel of a particular cell treated with and without drugs. For example, cellular response to histone deacetylase inhibitor in colon cancer cells was evaluated by such approach (Milli et al., 2008). Besides, various disease stages can also be compared, for example, a list of proteins were identified to be differentially regulated between normal liver tissue and hepatocellular carcinoma (Corona et al. 2010). Furthermore, the dynamic changes of proteome can also be studied. By comparing the differential expressed proteins in the neuroblastoma grown in mice in different time interval reveal the proteome changes of the disease progression and effect of host-tumor interaction (Turner et al., 2009). Therefore, differential expression analysis of 2D gels often called comparative proteomics. By applying various systems biology analysis tools, these proteomics dataset can further improve our insight into particular biological questions. The first objective of gel-based proteomics data mining is to search for protein of biological importance, such as diagnostic biomarker and potential drug target. By comparing two or more predefined biological conditions, we can precisely define the proteins of interest among thousands of spots in the 2D gel (Meunier et al., 2007). This can be achieved by using differential expression proteome profile, or by comparative analysis of two or more global protein expression profiles. The second objective of gel-based proteomics data mining is to use clustering approach to group or classify the proteins. This is important for understanding the complex biological systems, such as classification of tumor according to the expression of proteins, for the diagnostics and therapeutics purposes (Meunier et al., 2007). This approach can be achieved by applying the bioinformatics tools on both differential expression and global expression profile. In the subsequent section, we will discuss the analysis of gel-based proteomics dataset by using various approaches, and their biological significance.
www.intechopen.com

Integrative Proteomics
428
Fig. 1. General workflow of bioinformatics analysis of gel-based proteomics. Once the 2D
gels are generated, 2 type of dataset can be acquired from annotated gel, i.e. global
expression and differential expression profiles. These datasets can be used for further
analysis by various approaches, such as ontological classification, hierarchical clustering and
systems/network analysis. These analysis approaches can improve our insight into
particular biological questions, such as discovery of novel disease biomarkers for diagnosis
and prognosis, drug target, study of disease mechanism and disease classification.
3. Ontological classification
The postgenomic era has brought an exponential growth of biological databases. In recent years, researchers have begun to use unique identifiers to describe components of a database, and the relationship between them. The concept of unique identifiers forms the basis of ontology. Ontology can be described by a set of representative, unambiguous and non-redundant vocabulary or identifier, which define classes, relations, functions, objects and theories (Gruber, 1993). It is not only represents an individual component but also its related components. For instance, in anatomy ontology, stomach is define as an organ with cavity which continuous proximally with oesophagus and distally with small intestine; it is member of viscera of abdomen; it is part of gastrointestinal tract; it is supplied by left and right gastric artery; etc (Detwiler et al., 2003). The Open Biomedical Ontology (OBO) consortium (http://www.obofoundry.org/) provides a resource where biomedical ontologies are presented in a standard format. Ontology-based approaches for data integration provide a platform of communication
www.intechopen.com
Application of Bioinformatics Tools in Gel-Based Proteomics
429
between researchers. It also allowed the retrieval/query of information across multiple resources and more efficient data mining and exploration. To gain the functional insight in a large-scale proteomics study, the traditional “literature mining” method is laborious and inefficient. Therefore, ontology-based approach is an effective solution. In gel-based proteomics, the large dataset can be annotated and explored by application of Gene Ontology (GO) (http://www.geneontology.org/). Gene Ontology is a part of the Open Biomedical Ontologies (OBO), which is the most widely used ontology in biomedical research community (Smith et al., 2007). The main objective of GO is to produce a controlled and unified vocabulary for genes and gene products, such as proteins, that can be applied to all organisms. Furthermore, classification of these components in defined groups or classes allowed us to gain the functional insight in the large-scale proteomics data. GO annotation organizes genes or gene products into hierarchical order based on 3 categories: cellular component, biological process and molecular function (The Gene Ontology Consortium, 2000). Cellular component describe the localization of particular active gene products in the cells or its extracellular environment. It may be particular cellular structure, e.g. mitochondrion, Golgi apparatus; or gene products groups, e.g. proteosome, ribosome. Biological process describes the biochemical reaction of gene products in the cells. Examples of higher order categories are cell death, signal transduction. Examples of lower order categories are lipid metabolism, purine metabolism. Molecular function describes the elemental activities of gene products at molecular levels. Examples of higher order categories are enzyme, cytoskeletal regulator. Examples of lower order categories are glycine dehydrogenase, apoptosis activator. Since March 2007, 25,000 unique GO identifiers have been created, these provide researchers a broad set of descriptors for cellular component, biological process and molecular function for genes and their products (Dimmer et al., 2008). There are various GO tools available (table 1). The complete list of tools can be found in http://www.geneontology.org/. These tools belong to either query tools or visualization tools. Prior to analysis, the genes or proteins have to be converted from generic or common name into the unique identifier, i.e. GO term, by using query tools. The most commonly used query tools are GO-TermFinder (Boyle et al., 2004), AmiGO (Carbon et al., 2009), and MatchMiner (Bussey et al., 2003). For example, the GO identifier for cyclin D3 is CCND3. Once the list of GO identifiers are generated, visualization the data are carried out, using the tools such as GoMiner (Bussey et al., 2003), FatiGO (Al-Shahrour et al., 2004, 2007), Onto-Express (Draghici et al., 2003; Khatri et al., 2002), GOSurfer (Zhong et al., 2004), and GOTM (Zhang et al., 2004). These tools provide visualization of data in the form of either AmiGo view or Direct Acyclic Graph (DAG) view (Figure 2). AmiGO view is in the form of expandable tree structures, and it is linked to external databases, such as NCBI and CGAP. DAG is similar to hierarchies but differ in that a more specialized and narrower term or “child” can be related to more than one less specialized and broader term or “parent”. Each term are represented by a node and they connected by path in hierarchical order. Each node can often be reached from multiple paths, which allow the comparison of genes/gene products involved in more than one molecular function or biological processes. In gel-based proteomics, data generated from global expression and differential expression profiles can be used for ontological-based classification. Many studies suggested that ontological classification is a powerful tool in functional characterization of the cells in gel-based proteomics studies. For instance, a study from Alfonso et al. showed the use of
www.intechopen.com

Integrative Proteomics
430
Fig. 2. Data visualization of ontological-based classification. Gene Ontology tools, such as GoMiner (Bussey et al., 2003) showed in this figure, provide visualization of data in the form of either AmiGo view or Direct Acyclic Graph (DAG) view. (a) AmiGO view is in the form of expandable tree structures, and it is linked to external databases. (b) In DAG view, each GO term are represented by a node and they connected by path in hierarchical order. Each node can often be reached from multiple paths, which allow the comparison of genes/gene products involved in more than one category.
ontological classification in a gel-based proteomics study to provide a functional insight of the colorectal cancer. In this study, 41 out of 52 analyzed proteins were unambiguously identified as being differentially expressed in colorectal cancer (Alfonso et al., 2005). An ontology analysis of these proteins revealed that they were mainly involved in regulation of transcription, cellular reorganization and cytoskeleton, cell communication and signal transduction, and protein synthesis and folding (Alfonso et al., 2005). Another example is the study of proteome changes in human T cells during peak HIV infection using 2D differential gel electrophoresis. In this study, ontological classification showed that very high proportion of differentially expressed mitochondrial and metabolic pathway proteins were identified, suggesting that metabolic reprogramming occurs upon HIV infection of T cells (Ringrose et al., 2008). Although current proteomics study benefit from using Gene Ontology, the major drawback is that Gene Ontology does not describe and annotate the multiple forms of a gene, such as alternative slicing, proteolytic cleavage and post-translational modification. Therefore, Gene Ontology cannot describe the functional stage of the gene products. In recent year, Protein Ontology (PRO) database has been created, which provide a formal classification of proteins (Natale et al., 2007, 2011; Reeves et al., 2008). The PRO included the classification of proteins based on the basis of evolutionary relationships and the structured representation of multiple protein forms of a gene. An initial attempt in applying PRO for the annotation of TGF-beta signalling proteins showed that PRO provide a more accurate annotation and also facilitate various analysis, such as cross-species analysis, pathway analysis and disease
www.intechopen.com

Application of Bioinformatics Tools in Gel-Based Proteomics
431
modelling (Arighi et al., 2009). Despite of that, implementation of PRO in proteomics study is still in the infancy stage and there is no tools developed for the analysis of large-scale proteomics data. This implicates that further refinement and development of tools for PRO is needed in order to fill the gap.
4. Hierarchical clustering
Hierarchical clustering is a powerful approach for analyzing and visualizing the large proteomics dataset. Cluster analysis was initially designed for transcriptomics studies, such as analysis of microarray data, to explore the similarity between samples based on the pattern of gene expression (Eisen et al., 1998). In recent years, the hierarchical clustering has been adapted to the proteomics study. It enables the proteins to be grouped or classified blindly according to their expression profiles. It is a useful approach in understanding the interdependencies of protein in expression profile, molecular classification and protein signature discovery of diseases, and the dynamic changes of protein expression. The major principle of hierarchical clustering is based on the dissimilarity or distance between the samples. In proteomics data analysis, this can be calculated by using Pearson correlation coefficient or Euclidean distance. Once the distant matrix is calculated, agglomerative clustering algorithm is performed. In proteomics, unweighted paired group average linkage (UPGMA), complete linkage, and Ward’s methods are the most commonly used algorithms. The final results are presented as dendrogram or heat map (Meunier et al., 2007). In dendrogram, proteins which are closely related will appear on the same branches. The length of branch represents the strength of relationship, where shorter the branch, closer the relationship. In a heat map, group of similar expression will appear as a pattern of cluster with same color. In either presentation method, the ultimate aim is to find the cluster which indicates a similar biological function related to disease mechanism for diagnosis and prognosis purpose. There are several tools available for hierarchical clustering, for example, Cluster+TreeView (Eisen et al., 1998), PermutMatrix (Caraux & Pinloche, 2005), POMELO II (Morrissey & Diaz-Uriarte, 2009), and Genesis (Sturn et al., 2002). However, most currently available tools are mainly developed for transcriptomics study, i.e. analysis of cDNA microarray data. They are based on different algorithms, and only some of them can be well adapted to the proteomics data analysis, such as Cluster+TreeView and PermutMatrix (Eisen et al., 1998). The general workflow of hierarchical clustering analysis using PermutMatrix, is discussed here. The proteomics data is presented in the form of standard text file that contains the data matrix: columns represent the sample, i.e. gels with various biological classes or groups, and row represent proteins of interests. Thereafter, the selection of clustering parameters for both distance and aggregation procedures, followed by the application of hierarchical clustering analysis. The result of clustering can be visualized in the form of dendrogram of gel samples and proteins, and heatmap of the clustered data matrix (Meunier et al., 2007) (Figure 3). Many studies proven that hierarchical clustering is a powerful tool in analysis of large proteomics dataset. Hierarchical clustering can be use for analysis of differential expression protein or global protein expression profiles from the 2D gel. Studies suggested that hierarchical clustering is a powerful tool for discovery of protein signatures or cluster of proteins for molecular classification of diseases, especially cancer. These was shown in
www.intechopen.com

Integrative Proteomics
432
Fig. 3. Data visualization of hierarchical clustering. Using PermutMatrix (Caraux & Pinloche, 2005), hierarchical clustering are presented as dendrogram or heat map. In dendrogram, proteins which are closely related will appear on the same branches. The length of branch represents the strength of relationship, where shorter the branch, closer the relationship. In heat map, group of similar expression will appear as a pattern of cluster with same color.
several recent studies that hierarchical clustering facilitates accurate molecular classification
of vaginal and cervical cancer (Hellman et al., 2004), ovarian cancer (Alaiya et al., 2002), lung
cancer (Wingren & Borrebaeck, 2004), soft-tissue sarcoma (Suehara et al., 2006), based on
their protein expression profile from 2D gel. These studies might lead to the discovery of
tumour-specific markers among the differentially expressed proteins. Besides, hierarchical
clustering facilitates the discovery of protein signature for prediction of disease progression.
This was shown by the study of a set of 20 protein spots that could predict the survival of
patients with lung adenocarcinoma (Chen et al., 2003). Many studies showed the similarity in methodology between transcriptomics and proteomics data analysis using hierarchical clustering approach. As such, many bioinformatics tools that are developed for microarray study can be adapted to gel-based proteomics studies. However, special attentions are needed, as not all the algorithms used for transcriptomics study can be used in proteomics study (Meunier et al., 2007). Without strong knowledge of these algorithms, hierarchical clustering analysis of proteomics data
www.intechopen.com

Application of Bioinformatics Tools in Gel-Based Proteomics
433
could lead to false result and ambiguity. This implicate that the development of new tools of hierarchical clustering analysis for proteomics study is needed to fulfil the demand of ever-growing proteomics society.
5. Systems and network analysis
The behaviour of a biological system, such as cells, is the consequence of complex interaction between their individual components, such as DNAs, proteins, metabolites, and other biological active molecules. In the past decades, signalling pathway has been the only approach to understand the interaction between these components. However, it is impossible to predict the behaviour of biological systems solely from understanding of their individual component or single signalling pathway. Integration of signalling pathways into a higher order biological network is a very crucial approach for studying the complex behaviour of a biological system. These can be achieved by implementation of systems and network analysis tools. In addition, the recent success of genomics and proteomics technologies generates a vast amount of data that has increased the quest for the systems and network analysis tools. Over the past few years, application of system and network analysis in genomics and proteomics study had showed a great promise in understanding of complex behaviours of biological systems. Global mapping of the cells or organelles using these tools enable us to discover, visualize and explore the behaviour of the biological systems relevant to our experimental design. In addition, by studying the topological, functional, and dynamic properties of biological networks, the regulatory and control mechanism of the cells underlying the changes of environment can be explored. An example is a study of the over-expression of certain signalling pathway of the tumor cells under the challenge with chemotherapeutics drug (Barabasi & Oltvai, 2004; Kwoh & Ng, 2007). Networks are displayed as graphs, which represented by nodes and edges/links. These graphs differ from the ontological and hierarchical clustering in that each node is not a function, but a component, such as gene or protein; or a substrate/product of a reaction. Nodes are displayed in various shapes, which represent various types of molecules, such as genes, proteins, and metabolites. The nodes are connected with each other by the edges or links. Edges or links represent the biological relationships between the nodes, such as induction, activation, inhibition, post-translational modification, enzymatic-substrate reaction, and physical binding. The interaction between the nodes can be directed or undirected. In directed network, the link between two nodes has a defined direction, for example, the induction of activation of a protein by an enzyme. In undirected network, the link does not have specific direction, for example, protein-protein interaction or physical binding. Network can provide a framework from which complex regulatory information can be extracted. Most of the biological networks are scale-free, in which most of the nodes have only a few links, while a few nodes with a very large number of links, which are called hubs (Barabasi & Oltvai, 2004). The general principle of network construction is based on the known interaction pair of gene or protein. In brief, Swiss-Prot and GeneBank accession numbers from the experimental dataset are used to search against the external databases that contain information about the interaction between the genes or proteins. Subsequently, the genes or proteins from the experiment data were integrated and merged with their known interacting partners and pathways. This process is continued until all proteins of interest are included into the network.
www.intechopen.com
Integrative Proteomics
434
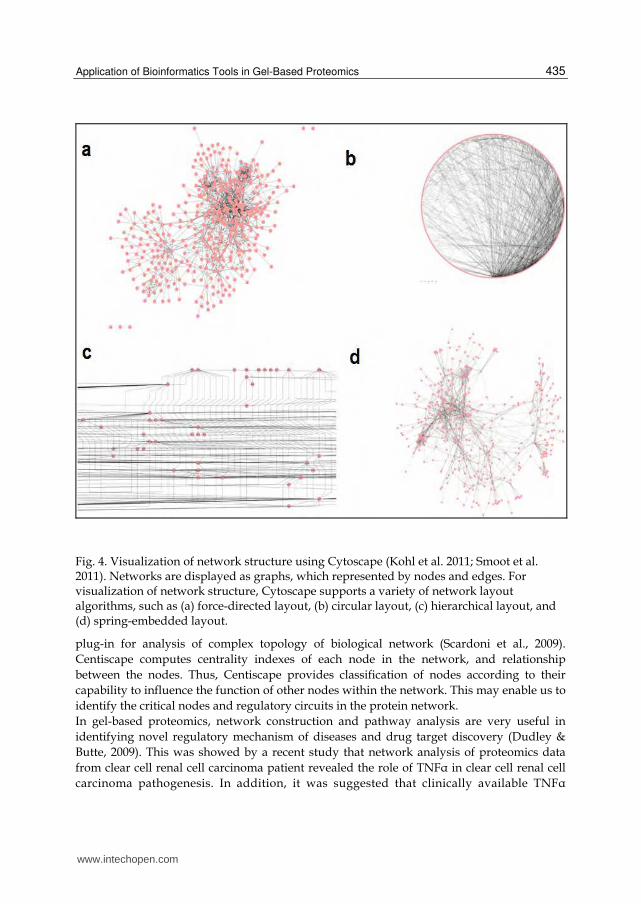
There are a number of available tools for construction and analysis of networks (Thomas & Bonchev, 2010), such as Osprey, (Breitkreutz et al., 2002), BioLayout (Enright & Ouzounis, 2001), CellDesigner (Funahashi et al., 2007), and Cytoscape (Kohl et al. 2011; Smoot et al. 2011). Each tool has distinct functional features. Although most of these tools were initially designed for genomics data analysis, most of them are well adapted for proteomics data analysis. For gel-based proteomics, both global expression profile and differential expression profile can be used to construct the network, depending on the experimental design and question to be answered. Here we show an example of workflow of network analysis in gel-based proteomics, by using Cytoscape. Cytoscape is open source software that provides basic functionality for integrating proteomics data on the network, editing and visualization of network, and also implementation of external plug-ins for network analysis. Data generated from gel-based proteomics, i.e. the list of the proteins, are integrated with the graph using tools for network construction, such as MiMi (Gao et al., 2009), cPath (Cerami et al., 2006) and BioNetBuilder (Avila-Campillo et al., 2007). Subsequently, using the annotation tools, the node and edge can be annotated with attribute and expression data, such as expression ratio obtained from 2D gel analysis. For visualization of network structure, Cytoscape supports a variety of network layout algorithms, such as spring-embedded layout, circular layout and hierarchical layout (Figure 4). In order to reduce the complexity of a large network, user can selectively display the set of nodes and edges in the graph, using graph selection and filtering tools. Nodes and edges can be selected according to a wide variety of criteria, including selection by name or by the property of the attribute (Figure 5). Besides, Cytoscape are supported by filtering tools that includes a Minimum Neighbors filter, Local Distance filter, Differential Expression filter, or the combination filter. Minimum Neighbors filter selects nodes having a minimum number of neighbors within a specified distance in the network. Local Distance filter selects nodes within a specified distance of a group of nodes. Differential Expression filter selects nodes according to their expression data. Combination filter selects nodes by combinations of other filters (Shannon et al., 2003). When the network construction is complete, user can implement various external plug-ins for analysis of the network. This is one of the most powerful functionality of Cytoscape for solving biological questions by mean of network exploration. There is a variety of plug-ins which is commonly used in network analysis. Several examples of Cytoscape plug-ins for network analysis, such as MCODE (Bader & Hogue, 2003), NetworkAnalyzer (Assenov et al., 2008) and Centiscape (Scardoni et al., 2009), are discussed here. MCODE is a plug-in that search for clusters or highly interconnected regions in the network (Bader & Hogue, 2003). In protein network, clusters are often attribute to a groups of proteins that represent a proteins family or protein-protein interaction networks, therefore, finding the cluster enable us to define the region of functional importance. NetworkAnalyzer is a Java plug-in that analyses and visualizes the molecular interaction networks (Assenov et al., 2008). NetworkAnalyzer computes different parameters that describe the network topology, such as diameter of a network, average number of neighbours, and numbers of connected pairs of nodes. NetworkAnalyzer also compute more complex parameters, for example, node degree distribution, topological coefficients, shortest path length distribution, closeness centrality and neighbourhood connectivity distribution. These topology parameters enable us to understanding the property of biological network, such as protein signalling network, protein-protein interaction network, that are of biological importance. Centiscape is another
www.intechopen.com
Application of Bioinformatics Tools in Gel-Based Proteomics
435
Fig. 4. Visualization of network structure using Cytoscape (Kohl et al. 2011; Smoot et al. 2011). Networks are displayed as graphs, which represented by nodes and edges. For visualization of network structure, Cytoscape supports a variety of network layout algorithms, such as (a) force-directed layout, (b) circular layout, (c) hierarchical layout, and (d) spring-embedded layout.
plug-in for analysis of complex topology of biological network (Scardoni et al., 2009).
Centiscape computes centrality indexes of each node in the network, and relationship
between the nodes. Thus, Centiscape provides classification of nodes according to their
capability to influence the function of other nodes within the network. This may enable us to
identify the critical nodes and regulatory circuits in the protein network.
In gel-based proteomics, network construction and pathway analysis are very useful in
identifying novel regulatory mechanism of diseases and drug target discovery (Dudley &
Butte, 2009). This was showed by a recent study that network analysis of proteomics data
from clear cell renal cell carcinoma patient revealed the role of TNFα in clear cell renal cell
carcinoma pathogenesis. In addition, it was suggested that clinically available TNFα
www.intechopen.com

Integrative Proteomics
436
Fig. 5. Graph selection tool in Cytoscape (Kohl et al. 2011; Smoot et al. 2011). User can use graph selection tool to reduce the complexity of the graph. In this example, the components of ERBB pathway were selected and coloured (green) using selection tools.
inhibitors, such as thalidomide and etanercept can be used for the treatment of renal cell carcinoma (Perroud et al., 2006). Besides, network analysis is an indispensable tool in understanding the complex biological behaviour of the cells. A recent study showed that network analysis of gel-based proteome reveal the similarities in regulatory mechanism by MCF10A and 184A1 cells. Network analysis showed the involvement of TNF, AKT, F2 and IGF hubs in both cell types, but cell cycle regulation and mitogenic signaling networks are more representative in MCF10A cells, as compared to 184A1 cells. Study of the network also showed that enhanced expression of cell cycle and proliferation-related proteins, such as CDK4 and cyclin D3 may have an important contribution to increased proliferation rate of breast epithelial cells at the early event of tumorigenesis (Bhaskaran et al., 2009). Network and pathway analysis is a robust approach in analyzing large proteomics dataset. However, there are several major limitations. Network analysis is unbiased and hypothesis-free because the built of network are based on known interaction sets that recruited from published data. As a consequent, network analysis is not able to uncover the new or unknown pathway and interaction. On the other hand, the qualities of network are dependent on the limitation of high-throughput experiments where the data were recruited
www.intechopen.com

Application of Bioinformatics Tools in Gel-Based Proteomics
437
from. For instance, protein-protein interaction studies that generate a high proportion of false-positive result will affect the quality of network based on this data (Arrell & Terzic, 2010). Nevertheless, network analysis remains a powerful tool in understanding the gel-based proteomics data, and it can serve as a good starting point for a further exploration of the dataset.
6. Concluding remarks
Tremendous effort have been made during past decade in understanding the biology of normal and diseased cells at systemic level. Proteomics is one of the most promising approaches in generating functional insight of biological systems. Recent advancement in protein separation and identification technology leads to the generation of enormous amount of data which implicate that importance of bioinformatics analysis. However, this renders a great challenge for biomedical researchers in selecting the suitable strategies in bioinformatics analysis of proteomics data. This article gives an overview of various analysing strategies in gel-based proteomics; we hope that this will help biomedical researchers to derive more biologically meaningful information from their data. These effort will render a direct impact in the in-depth understanding of biological behaviour of cells, ultimately implemented in clinical applications.
7. References
Aebersold, R. & Mann, M. (2003). Mass spectrometry-based proteomics. Nature, Vol.422,
No.6928, pp. 198-207, ISSN 0028-0836
Al-Shahrour, F.; Diaz-Uriarte, R. & Dopazo, J. (2004). FatiGO: a web tool for finding
significant associations of Gene Ontology terms with groups of genes.
Bioinformatics, Vol.20, No.4, pp. 578-580, ISSN 1367-4803
Al-Shahrour, F.; Minguez, P.; Tarraga, J.; Medina, I.; Alloza, E.; Montaner, D. & Dopazo, J.
(2007). FatiGO +: a functional profiling tool for genomic data. Integration of
functional annotation, regulatory motifs and interaction data with microarray
experiments. Nucleic Acids Research, Vol.35, pp. W91-96, ISSN 1362-4962
Alaiya, A. A.; Franzen, B.; Hagman, A.; Dysvik, B.; Roblick, U. J.; Becker, S.; Moberger, B.;
Auer, G. & Linder, S. (2002). Molecular classification of borderline ovarian tumors
using hierarchical cluster analysis of protein expression profiles. International
Journal of Cancer, Vol.98, No.6, pp. 895-899, ISSN 0020-7136
Alfonso, P.; Nunez, A.; Madoz-Gurpide, J.; Lombardia, L.; Sanchez, L. & Casal, J. I. (2005).
Proteomic expression analysis of colorectal cancer by two-dimensional differential
gel electrophoresis. Proteomics, Vol.5, No.10, pp. 2602-2611, ISSN 1615-9853
Arighi, C. N.; Liu, H.; Natale, D. A.; Barker, W. C.; Drabkin, H.; Blake, J. A.; Smith, B. & Wu,
C. H. (2009). TGF-beta signaling proteins and the Protein Ontology. BMC
Bioinformatics, Vol.10, No. S5, pp. S3, ISSN 1471-2105
Arrell, D. K. & Terzic, A. Network systems biology for drug discovery. Clinical Pharmacology
and Therapeutics, Vol.88, No.1, pp. 120-125, ISSN 1532-6535
Assenov, Y.; Ramirez, F.; Schelhorn, S. E.; Lengauer, T. & Albrecht, M. (2008). Computing
topological parameters of biological networks. Bioinformatics, Vol.24, No.2, pp. 282-
284, ISSN 1367-4811
www.intechopen.com
Integrative Proteomics
438
Avila-Campillo, I.; Drew, K.; Lin, J.; Reiss, D. J. & Bonneau, R. (2007). BioNetBuilder:
automatic integration of biological networks. Bioinformatics, Vol.23, No.3, pp. 392-
393, ISSN 1367-4811
Bader, G. D. & Hogue, C. W. (2003). An automated method for finding molecular complexes
in large protein interaction networks. BMC Bioinformatics, Vol.4, No., pp. 2, ISSN
1471-2105
Barabasi, A. L. & Oltvai, Z. N. (2004). Network biology: understanding the cell's functional
organization. Nat Rev Genet, Vol.5, No.2, pp. 101-113, ISSN 1471-0056
Bhaskaran, N.; Lin, K. W.; Gautier, A.; Woksepp, H.; Hellman, U. & Souchelnytskyi, S.
(2009). Comparative proteome profiling of MCF10A and 184A1 human breast
epithelial cells emphasized involvement of CDK4 and cyclin D3 in cell
proliferation. Proteomics - Clinical Applications, Vol.3, No.1, pp. 68-77, ISSN 1862-
8354
Borrebaeck, C. A. & Wingren, C. (2007). High-throughput proteomics using antibody
microarrays: an update. Expert Review of Molecular Diagnostics, Vol.7, No.5, pp. 673-
686, ISSN 1744-8352
Boyle, E. I.; Weng, S.; Gollub, J.; Jin, H.; Botstein, D.; Cherry, J. M. & Sherlock, G. (2004).
GO::TermFinder--open source software for accessing Gene Ontology information
and finding significantly enriched Gene Ontology terms associated with a list of
genes. Bioinformatics, Vol.20, No.18, pp. 3710-3715, ISSN 1367-4803
Breitkreutz, B. J.; Stark, C. & Tyers, M. (2002). Osprey: a network visualization system.
Genome Biology, Vol.3, No.12, pp. PREPRINT0012, ISSN 1465-6914
Brennan, D. J.; O'Connor, D. P.; Rexhepaj, E.; Ponten, F. & Gallagher, W. M (2010).
Antibody-based proteomics: fast-tracking molecular diagnostics in oncology.
Nature Review Cancer, Vol.10, No.9, pp. 605-617, ISSN 1474-1768
Bussey, K. J.; Kane, D.; Sunshine, M.; Narasimhan, S.; Nishizuka, S.; Reinhold, W. C.;
Zeeberg, B.; Ajay, W. & Weinstein, J. N. (2003). MatchMiner: a tool for batch
navigation among gene and gene product identifiers. Genome Biology, Vol.4, No.4,
pp. R27, ISSN 1465-6914
Caraux, G. & Pinloche, S. (2005). PermutMatrix: a graphical environment to arrange gene
expression profiles in optimal linear order. Bioinformatics, Vol.21, No.7, pp. 1280-
1281, ISSN 1367-4803
Carbon, S.; Ireland, A.; Mungall, C. J.; Shu, S.; Marshall, B. & Lewis, S. (2009). AmiGO:
online access to ontology and annotation data. Bioinformatics, Vol.25, No.2, pp. 288-
289, ISSN 1367-4811
Cerami, E. G.; Bader, G. D.; Gross, B. E. & Sander, C. (2006). cPath: open source software for
collecting, storing, and querying biological pathways. BMC Bioinformatics, Vol.7,
pp. 497, 1471-2105
Chen, G.; Gharib, T. G.; Wang, H.; Huang, C. C.; Kuick, R.; Thomas, D. G.; Shedden, K. A.;
Misek, D. E.; Taylor, J. M.; Giordano, T. J.; Kardia, S. L.; Iannettoni, M. D.; Yee, J.;
Hogg, P. J.; Orringer, M. B.; Hanash, S. M. & Beer, D. G. (2003). Protein profiles
associated with survival in lung adenocarcinoma. The Proceedings of National
Academy of Sciences USA, Vol.100, No.23, pp. 13537-13542, ISSN 0027-8424
Corona, G.; De Lorenzo, E.; Elia, C.; Simula, M. P.; Avellini, C.; Baccarani, U.; Lupo, F.;
Tiribelli, C.; Colombatti, A. & Toffoli, G (2010). Differential proteomic analysis of
www.intechopen.com

Application of Bioinformatics Tools in Gel-Based Proteomics
439
hepatocellular carcinoma. International Journal of Oncology, Vol.36, No.1, pp. 93-99,
ISSN 1791-2423
Cravatt, B. F.; Simon, G. M. & Yates, J. R., 3rd. (2007). The biological impact of mass-
spectrometry-based proteomics. Nature, Vol.450, No.7172, pp. 991-1000, ISSN 1476-
4687
Detwiler, L. T.; Mejino Jr, J. V.; Rosse, C. & Brinkley, J. F. (2003). Efficient web-based
navigation of the Foundational Model of Anatomy. AMIA Annual Symposium
Proceedings, pp. 829, ISSN 1942-597X
Dimmer, E. C.; Huntley, R. P.; Barrell, D. G.; Binns, D.; Draghici, S.; Camon, E. B.; Hubank,
M.; Talmud, P. J.; Apweiler, R. & Lovering, R. C. (2008). The Gene Ontology -
Providing a Functional Role in Proteomic Studies. Proteomics, Vol.8 No.23-24, ISSN
1615-9861
Draghici, S.; Khatri, P.; Bhavsar, P.; Shah, A.; Krawetz, S. A. & Tainsky, M. A. (2003). Onto-
Tools, the toolkit of the modern biologist: Onto-Express, Onto-Compare, Onto-
Design and Onto-Translate. Nucleic Acids Research, Vol.31, No.13, pp. 3775-3781,
ISSN 1362-4962
Dudley, J. T. & Butte, A. J. (2009). Identification of discriminating biomarkers for human
disease using integrative network biology. Pacific Symposium of Biocomputing, pp.
27-38, ISSN 1793-5091
Duncan, M. W. & Hunsucker, S. W. (2005). Proteomics as a tool for clinically relevant
biomarker discovery and validation. Experimental Biology and Medicine (Maywood),
Vol.230, No.11, pp. 808-817, ISSN 1535-3702
Eisen, M. B.; Spellman, P. T.; Brown, P. O. & Botstein, D. (1998). Cluster analysis and display
of genome-wide expression patterns. The Proceedings of National Academy of Sciences
USA, Vol.95, No.25, pp. 14863-14868, ISSN 0027-8424
Enright, A. J. & Ouzounis, C. A. (2001). BioLayout--an automatic graph layout algorithm
for similarity visualization. Bioinformatics, Vol.17, No.9, pp. 853-854, ISSN 1367-
4803
Funahashi, A.; Jouraku, A.; Matsuoka, Y. & Kitano, H. (2007). Integration of CellDesigner
and SABIO-RK. In Silico Biology, Vol.7, No.S2, pp. S81-90, 1386-6338
Gao, J.; Ade, A. S.; Tarcea, V. G.; Weymouth, T. E.; Mirel, B. R.; Jagadish, H. V. & States, D. J.
(2009). Integrating and annotating the interactome using the MiMI plugin for
cytoscape. Bioinformatics, Vol.25, No.1, pp. 137-138, ISSN 1367-4811
Graves, P. R. & Haystead, T. A. (2002). Molecular biologist's guide to proteomics.
Microbiology and Molecular Biology Review, Vol.66, No.1, pp. 39-63; ISSN 1092-2172
Gruber, T. R. (1993). A translation approach to portable ontologies. Knowledge Acquisition,
Vol.5, pp. 199-220,
Hellman, K.; Alaiya, A. A.; Schedvins, K.; Steinberg, W.; Hellstrom, A. C. & Auer, G. (2004).
Protein expression patterns in primary carcinoma of the vagina. British Journal of
Cancer, Vol.91, No.2, pp. 319-326, ISSN 0007-0920
Khatri, P.; Draghici, S.; Ostermeier, G. C. & Krawetz, S. A. (2002). Profiling gene expression
using onto-express. Genomics, Vol.79, No.2, pp. 266-270, ISSN 0888-7543
Kitano, H. (2002). Computational systems biology. Nature, Vol.420, No.6912, pp. 206-210,
ISSN 0028-0836
www.intechopen.com

Integrative Proteomics
440
Kitano, H. (2002). Systems biology: a brief overview. Science, Vol.295, No.5560, pp. 1662-
1664, ISSN 1095-9203
Kohl, M.; Wiese, S. & Warscheid, B. (2011). Cytoscape: software for visualization and
analysis of biological networks. Methods in Molecular Biology, Vol.696, pp. 291-303,
ISSN 1940-6029
Kolker, E.; Higdon, R. & Hogan, J. M. (2006). Protein identification and expression analysis
using mass spectrometry. Trends in Microbiology, Vol.14, No.5, pp. 229-235, 0966-
842X
Kwoh, C. K. & Ng, P. Y. (2007). Network analysis approach for biology. Cellular and
Molecular Life Sciences, Vol.64, No.14, pp. 1739-1751, ISSN 1420-682X
Li, L. S.; Kim, H.; Rhee, H.; Kim, S. H.; Shin, D. H.; Chung, K. Y.; Park, K. S.; Paik, Y. K. &
Chang, J. (2004). Proteomic analysis distinguishes basaloid carcinoma as a distinct
subtype of nonsmall cell lung carcinoma. Proteomics, Vol.4, No.11, pp. 3394-3400,
ISSN 1615-9853
Lim, M. S. & Elenitoba-Johnson, K. S. (2004). Proteomics in pathology research. Laboratory
Investigation, Vol.84, No.10, pp. 1227-1244, ISSN 0023-6837
Meunier, B.; Dumas, E.; Piec, I.; Bechet, D.; Hebraud, M. & Hocquette, J. F. (2007).
Assessment of hierarchical clustering methodologies for proteomic data mining.
Journal of Proteome Research, Vol.6, No.1, pp. 358-366, 1535-3893
Milli, A.; Cecconi, D.; Campostrini, N.; Timperio, A. M.; Zolla, L.; Righetti, S. C.; Zunino, F.;
Perego, P.; Benedetti, V.; Gatti, L.; Odreman, F.; Vindigni, A. & Righetti, P. G.
(2008). A proteomic approach for evaluating the cell response to a novel histone
deacetylase inhibitor in colon cancer cells. Biochimica et Biophysica Acta, Vol.1784,
No.11, pp. 1702-1710, ISSN 0006-3002
Morrissey, E. R. & Diaz-Uriarte, R. (2009). Pomelo II: finding differentially expressed
genes. Nucleic Acids Research, Vol.37, No.Web Server issue, pp. W581-586, ISSN
1362-4962
Natale, D. A.; Arighi, C. N.; Barker, W. C.; Blake, J.; Chang, T. C.; Hu, Z.; Liu, H.; Smith, B. &
Wu, C. H. (2007). Framework for a protein ontology. BMC Bioinformatics, Vol.8
Suppl 9, No., pp. S1, ISSN 1471-2105
Natale, D. A.; Arighi, C. N.; Barker, W. C.; Blake, J. A.; Bult, C. J.; Caudy, M.; Drabkin, H. J.;
D'Eustachio, P.; Evsikov, A. V.; Huang, H.; Nchoutmboube, J.; Roberts, N. V.;
Smith, B.; Zhang, J. & Wu, C. H. (2011). The Protein Ontology: a structured
representation of protein forms and complexes. Nucleic Acids Research, Vol.39, pp.
D539-545, ISSN 1362-4962
Perroud, B.; Lee, J.; Valkova, N.; Dhirapong, A.; Lin, P. Y.; Fiehn, O.; Kultz, D. & Weiss, R. H.
(2006). Pathway analysis of kidney cancer using proteomics and metabolic
profiling. Molecular Cancer, Vol.5, pp. 64, ISSN 1476-4598
Reeves, G. A.; Eilbeck, K.; Magrane, M.; O'Donovan, C.; Montecchi-Palazzi, L.; Harris, M. A.;
Orchard, S.; Jimenez, R. C.; Prlic, A.; Hubbard, T. J.; Hermjakob, H. & Thornton, J.
M. (2008). The Protein Feature Ontology: a tool for the unification of protein feature
annotations. Bioinformatics, Vol.24, No.23, pp. 2767-2772, ISSN 1367-4811
Ringrose, J. H.; Jeeninga, R. E.; Berkhout, B. & Speijer, D. (2008). Proteomic studies reveal
coordinated changes in T-cell expression patterns upon infection with human
www.intechopen.com
Application of Bioinformatics Tools in Gel-Based Proteomics
441
immunodeficiency virus type 1. Journal of Virology, Vol.82, No.9, pp. 4320-4330,
ISSN 1098-5514
Scardoni, G.; Petterlini, M. & Laudanna, C. (2009). Analyzing biological network parameters
with CentiScaPe. Bioinformatics, Vol.25, No.21, pp. 2857-2859, ISSN 1367-4811
Shannon, P.; Markiel, A.; Ozier, O.; Baliga, N. S.; Wang, J. T.; Ramage, D.; Amin, N.;
Schwikowski, B. & Ideker, T. (2003). Cytoscape: a software environment for
integrated models of biomolecular interaction networks. Genome Research, Vol.13,
No.11, pp. 2498-2504, ISSN 1088-9051
Smith, B.; Ashburner, M.; Rosse, C.; Bard, J.; Bug, W.; Ceusters, W.; Goldberg, L. J.;
Eilbeck, K.; Ireland, A.; Mungall, C. J.; Leontis, N.; Rocca-Serra, P.; Ruttenberg,
A.; Sansone, S. A.; Scheuermann, R. H.; Shah, N.; Whetzel, P. L. & Lewis, S.
(2007). The OBO Foundry: coordinated evolution of ontologies to support
biomedical data integration. Nature Biotechnology, Vol.25, No.11, pp. 1251-1255,
ISSN 1087-0156
Smoot, M. E.; Ono, K.; Ruscheinski, J.; Wang, P. L. & Ideker, T. (2011). Cytoscape 2.8: new
features for data integration and network visualization. Bioinformatics, Vol.27, No.3,
pp. 431-432, ISSN 1367-4811
Souchelnytskyi, S. (2005). Bridging proteomics and systems biology: what are the roads to
be traveled? Proteomics, Vol.5, No.16, pp. 4123-4137, ISSN 1615-9853
Sturn, A.; Quackenbush, J. & Trajanoski, Z. (2002). Genesis: cluster analysis of microarray
data. Bioinformatics, Vol.18, No.1, pp. 207-208, ISSN 1367-4803
Suehara, Y.; Kondo, T.; Fujii, K.; Hasegawa, T.; Kawai, A.; Seki, K.; Beppu, Y.; Nishimura, T.;
Kurosawa, H. & Hirohashi, S. (2006). Proteomic signatures corresponding to
histological classification and grading of soft-tissue sarcomas. Proteomics, Vol.6,
No.15, pp. 4402-4409, ISSN 1615-9853
Taylor, C. F.; Paton, N. W.; Garwood, K. L.; Kirby, P. D.; Stead, D. A.; Yin, Z.; Deutsch, E.
W.; Selway, L.; Walker, J.; Riba-Garcia, I.; Mohammed, S.; Deery, M. J.; Howard,
J. A.; Dunkley, T.; Aebersold, R.; Kell, D. B.; Lilley, K. S.; Roepstorff, P.; Yates, J.
R., 3rd; Brass, A.; Brown, A. J.; Cash, P.; Gaskell, S. J.; Hubbard, S. J. & Oliver, S.
G. (2003). A systematic approach to modeling, capturing, and disseminating
proteomics experimental data. Nature Biotechnology, Vol.21, No.3, pp. 247-254,
ISSN 1087-0156
Thomas, S. & Bonchev, D. (2010). A survey of current software for network analysis in
molecular biology. Hum Genomics, Vol.4, No.5, pp. 353-360, ISSN 1479-7364
Turner, K. E.; Kumar, H. R.; Hoelz, D. J.; Zhong, X.; Rescorla, F. J.; Hickey, R. J.; Malkas, L.
H. & Sandoval, J. A. (2009). Proteomic analysis of neuroblastoma
microenvironment: effect of the host-tumor interaction on disease progression.
Journal of Surgical Research, Vol.156, No.1, pp. 116-122, ISSN 1095-8673
Wingren, C. & Borrebaeck, C. A. (2004). High-throughput proteomics using antibody
microarrays. Expert Rev Proteomics, Vol.1, No.3, pp. 355-364, ISSN 1744-8387
Zhang, B.; Schmoyer, D.; Kirov, S. & Snoddy, J. (2004). GOTree Machine (GOTM): a web-
based platform for interpreting sets of interesting genes using Gene Ontology
hierarchies. BMC Bioinformatics, Vol.5, No., pp. 16, ISSN 1471-2105
www.intechopen.com

Integrative Proteomics
442
Zhong, S.; Storch, K. F.; Lipan, O.; Kao, M. C.; Weitz, C. J. & Wong, W. H. (2004). GoSurfer: a
graphical interactive tool for comparative analysis of large gene sets in Gene
Ontology space. Applied Bioinformatics, Vol.3, No.4, pp. 261-264, ISSN 1175-5636
www.intechopen.com
Integrative ProteomicsEdited by Dr. Hon-Chiu Leung
ISBN 978-953-51-0070-6Hard cover, 442 pagesPublisher InTechPublished online 24, February, 2012Published in print edition February, 2012
InTech EuropeUniversity Campus STeP Ri Slavka Krautzeka 83/A 51000 Rijeka, Croatia Phone: +385 (51) 770 447 Fax: +385 (51) 686 166www.intechopen.com
InTech ChinaUnit 405, Office Block, Hotel Equatorial Shanghai No.65, Yan An Road (West), Shanghai, 200040, China
Phone: +86-21-62489820 Fax: +86-21-62489821
Proteomics was thought to be a natural extension after the field of genomics has deposited significant amountof data. However, simply taking a straight verbatim approach to catalog all proteins in all tissues of differentorganisms is not viable. Researchers may need to focus on the perspectives of proteomics that are essentialto the functional outcome of the cells. In Integrative Proteomics, expert researchers contribute both historicalperspectives, new developments in sample preparation, gel-based and non-gel-based protein separation andidentification using mass spectrometry. Substantial chapters are describing studies of the sub-proteomes suchas phosphoproteome or glycoproteomes which are directly related to functional outcomes of the cells.Structural proteomics related to pharmaceutics development is also a perspective of the essence.Bioinformatics tools that can mine proteomics data and lead to pathway analyses become an integral part ofproteomics. Integrative proteomics covers both look-backs and look-outs of proteomics. It is an ideal referencefor students, new researchers, and experienced scientists who want to get an overview or insights into newdevelopment of the proteomics field.
How to referenceIn order to correctly reference this scholarly work, feel free to copy and paste the following:
Kah Wai Lin, Min Jia and Serhiy Souchelnytskyi (2012). Application of Bioinformatics Tools in Gel-BasedProteomics, Integrative Proteomics, Dr. Hon-Chiu Leung (Ed.), ISBN: 978-953-51-0070-6, InTech, Availablefrom: http://www.intechopen.com/books/integrative-proteomics/application-of-bioinformatics-tools-in-gel-based-proteomics

© 2012 The Author(s). Licensee IntechOpen. This is an open access articledistributed under the terms of the Creative Commons Attribution 3.0License, which permits unrestricted use, distribution, and reproduction inany medium, provided the original work is properly cited.