application of autonomous driving technology to...
TRANSCRIPT
Application of Autonomous Driving Technology to Transit -
Functional Capabilities for Safety and Capacity
Presentation to Federal Transit Administration and
American Public Transportation Association July 30, 2013
Jerome M. Lutin, Ph.D., P.E. Alain L. Kornhauser, Ph.D.

NHTSA Preliminary Policy on Automated Vehicles
Level 0 (No automation) • The human is in complete and sole control of safety-critical functions (brake, throttle, steering) at all
times. Level 1 (Function-specific automation) • The human has complete authority, but cedes limited control of certain functions to the vehicle in certain
normal driving or crash imminent situations. Example: electronic stability control Level 2 (Combined function automation) • Automation of at least two control functions designed to work in harmony (e.g., adaptive cruise control
and lane centering) in certain driving situations. • Enables hands-off-wheel and foot-off-pedal operation. • Driver still responsible for monitoring and safe operation and expected to be available at all times to
resume control of the vehicle. Example: adaptive cruise control in conjunction with lane centering Level 3 (Limited self-driving) • Vehicle controls all safety functions under certain traffic and environmental conditions. • Human can cede monitoring authority to vehicle, which must alert driver if conditions require transition to
driver control. • Driver expected to be available for occasional control. Example: Google car Level 4 (Full self-driving automation) • Vehicle controls all safety functions and monitors conditions for the entire trip. • The human provides destination or navigation input but is not expected to be available for control during
the trip. Vehicle may operate while unoccupied. • Responsibility for safe operation rests solely on the automated system

Functional Capabilities for Safety and Capacity
Many Autonomous Vehicle Level 2 Capabilities Now Available in Auto Market – Adapt Packages for Transit
• Blind spot monitoring (for vehicles and pedestrians) • Driver fatigue and attentiveness monitoring • Cooperative Adaptive Cruise Control • Autonomous emergency braking • Lane departure detection and warning • Lane keeping assistance • Collision warning and mitigation • Obstacle detection • Parking assist

2002-2012 Safety and Claims Data for Service Directly Operated by NJ TRANSIT Bus Operations
Total for Period 2002-2012
Annual Average
Incidents 3,077 280 Collisions 1,753 159 Injuries 4,417 402 Fatalities 25 2.3 Estimated Bus Claims $112,400,000 $10,220,000 Peak Buses n/a 1,769 Total Buses Operated n/a 2,106 Estimated Bus Claims/Total Buses Operated
$53,305 $4,846
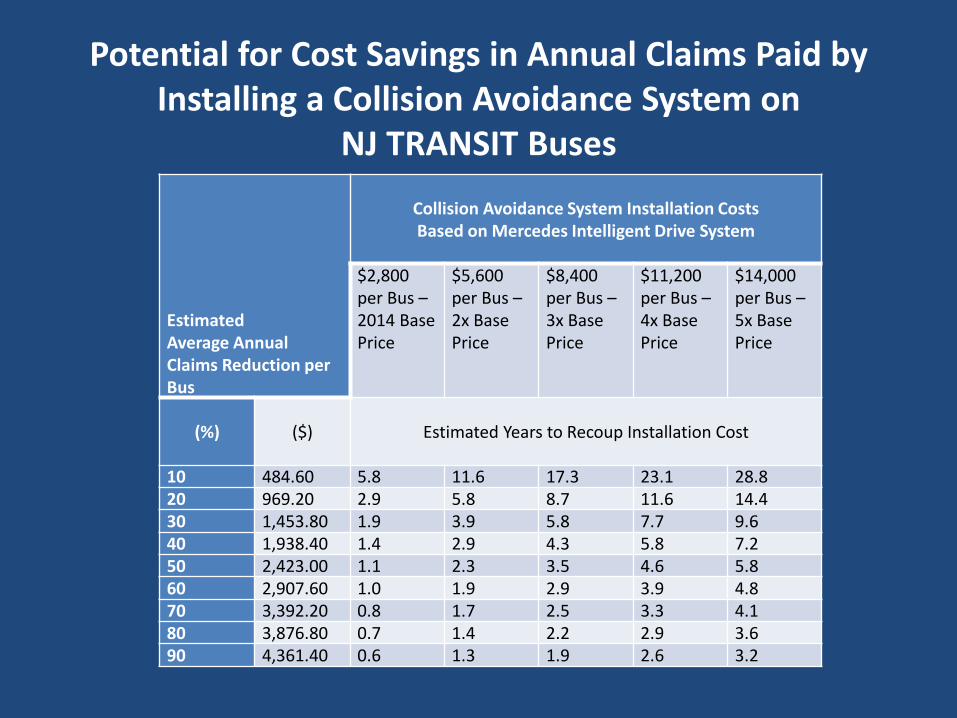
Potential for Cost Savings in Annual Claims Paid by
Installing a Collision Avoidance System on NJ TRANSIT Buses
Estimated Average Annual Claims Reduction per Bus
Collision Avoidance System Installation Costs Based on Mercedes Intelligent Drive System
$2,800 per Bus – 2014 Base Price
$5,600 per Bus – 2x Base Price
$8,400 per Bus – 3x Base Price
$11,200 per Bus – 4x Base Price
$14,000 per Bus – 5x Base Price
(%)
($)
Estimated Years to Recoup Installation Cost
10 484.60 5.8 11.6 17.3 23.1 28.8 20 969.20 2.9 5.8 8.7 11.6 14.4 30 1,453.80 1.9 3.9 5.8 7.7 9.6 40 1,938.40 1.4 2.9 4.3 5.8 7.2 50 2,423.00 1.1 2.3 3.5 4.6 5.8 60 2,907.60 1.0 1.9 2.9 3.9 4.8 70 3,392.20 0.8 1.7 2.5 3.3 4.1 80 3,876.80 0.7 1.4 2.2 2.9 3.6 90 4,361.40 0.6 1.3 1.9 2.6 3.2

A Capacity Bonus for NJ TRANSIT Exclusive Bus Lane (XBL) to New York City
Source: Port Authority of New York and New Jersey

Port Authority Bus Terminal (PABT) New York City
Source: Google Earth 2013

Port Authority Bus Terminal (PABT) New York City
Source: Google Maps 2013

Increasing Bus Capacity To Mid-town Manhattan Would Involve Three
Elements:
• Increasing the capacity of the PABT, particularly to accommodate
outbound passengers in the PM peak* • Increasing the capacity to feed buses into the terminal for PM
outbound service, either by making bus storage space available in Manhattan or by expediting the PM eastbound flow of buses through the Lincoln Tunnel.
• Increasing the AM peak hour flow of buses through the XBL
*currently under study

Potential Increased Capacity of Exclusive Bus Lane (XBL) Using Cooperative
Adaptive Cruise Control (CACC) (Assumes 45 foot (13.7 m) buses @ with 57 seats)
Average Interval
Between Buses
(seconds)
Average Spacing
Between Buses (ft)
Average Spacing
Between Buses (m)
Buses Per Hour
Additional Buses per
Hour
Seated Passengers Per Hour
Increase in Seated
Passengers per Hour
1 6 2 3,600 2,880 205,200 164,160
2 47 14 1,800 1,080 102,600 61,560
3 109 33 1,200 480 68,400 27,360
4 150 46 900 180 51,300 10,260
5 (Base) 212 64 720 - 41,040 -

Costs of Bus Crashes – Industry Wide
Intangible • Human loss and suffering • Media attention • Good will Tangible • Personal injury claims • Property damage claims • Workers compensation • Insurance premiums
• Vehicle repair • Legal services • Passenger and service delays • Lost fare revenue • D & A testing • Overtime • Sick time • Accident investigation • Vehicle recovery • Hearings and discipline

NTD 2011 Bus Incidents for All Transit Agencies
Collisions With Other Vehicle
2,693
With Person 427
With Fixed Object
66
With Rail Vehicle 0
With Bus Vehicle 46
With Other 28
Collision Total 3,260
Fire Total 304
Security Total 403
NOC Total 5,539
Incident Total 9,506

NTD 2011 Bus Injuries and Fatalities for All Transit Agencies
Fatalities Injuries
Passenger 8 7,262
Rev Facility Occupant 7 2,107
Employees Operator 3 923
Employee 0 66
Total Employees 3 989
Other Worker 0 3
Other Bicyclist 4 123
Ped in Crossing 11 109
Ped not in Crossing
18 124
Other Vehicle Occupant
32 1,594
Other 4 615
Trespasser 0 0
Suicide 5 2
Other Total 74 2,567
Total 92 12,928
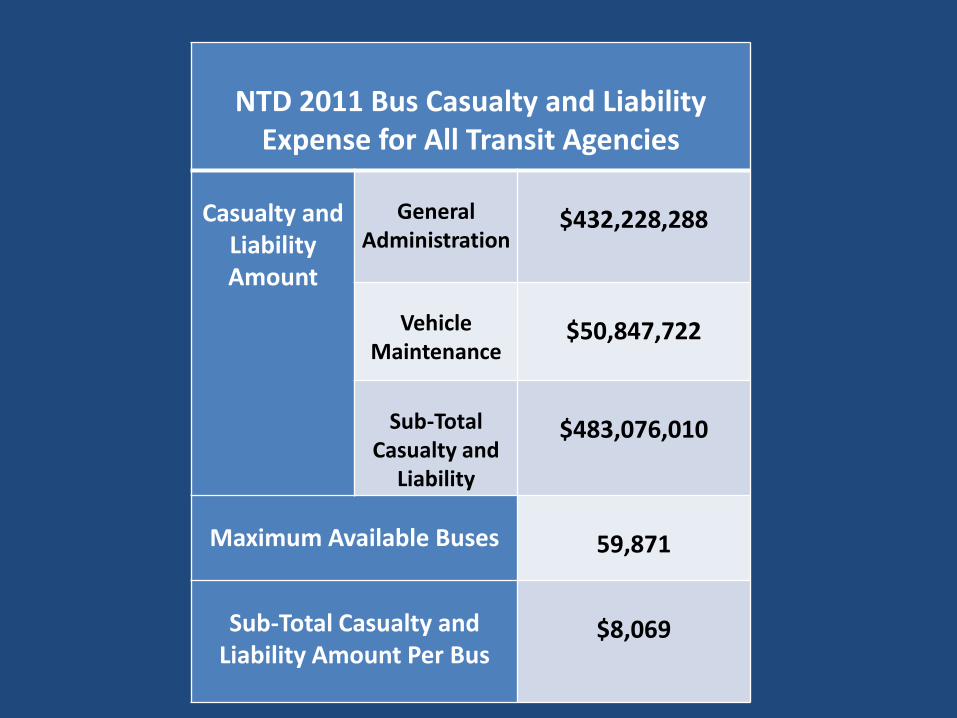
NTD 2011 Bus Casualty and Liability
Expense for All Transit Agencies
Casualty and Liability Amount
General Administration
$432,228,288
Vehicle Maintenance
$50,847,722
Sub-Total Casualty and
Liability
$483,076,010
Maximum Available Buses
59,871
Sub-Total Casualty and Liability Amount Per Bus
$8,069
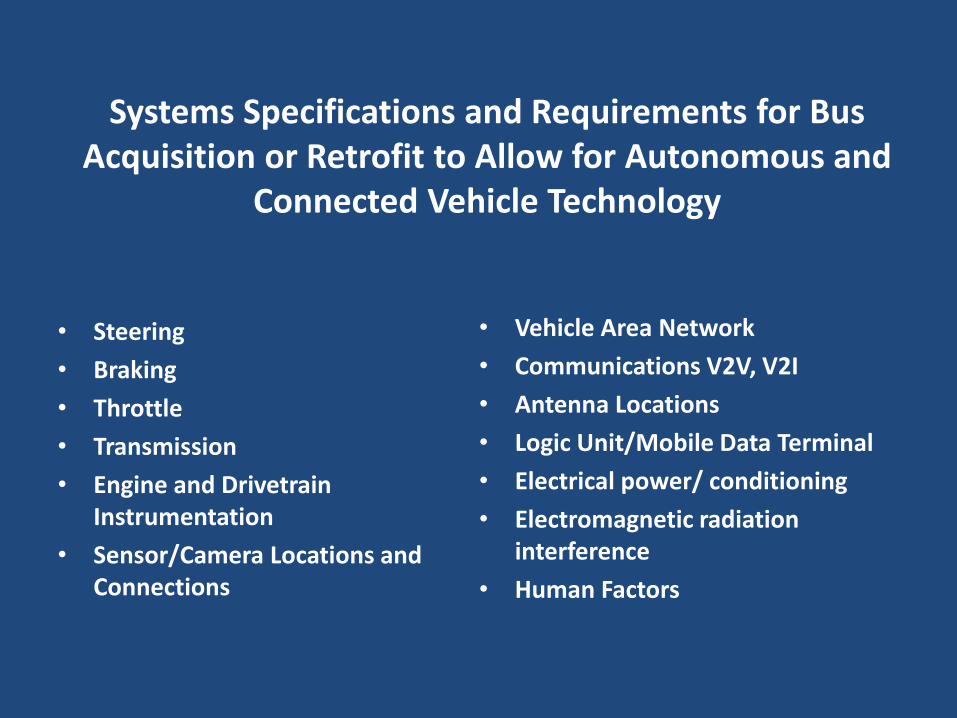
Systems Specifications and Requirements for Bus Acquisition or Retrofit to Allow for Autonomous and
Connected Vehicle Technology
• Steering
• Braking
• Throttle
• Transmission
• Engine and Drivetrain Instrumentation
• Sensor/Camera Locations and Connections
• Vehicle Area Network
• Communications V2V, V2I
• Antenna Locations
• Logic Unit/Mobile Data Terminal
• Electrical power/ conditioning
• Electromagnetic radiation interference
• Human Factors

Need Open Architectures and Standards
• Avoid problems of legacy systems and sole source procurements
• Modular systems and components
• Standard interfaces between systems and components
• Multiple sources and innovation from vendors
• “Plug and play”

Conclusion – Next Steps Draft Work Program - Priorities
• Estimating benefits of adopting collision avoidance technology – analysis of collision and claims data
• Opportunities to enhance performance and capacity by using autonomous technology – industry collaboration
• Specifications and standards for new technology
• Prototype development