application of an x-ray fluorescence instrument to
TRANSCRIPT

Application of an X-ray Fluorescence Instrument to Helicopter Wear Debris Analysis
Andrew Becker
Air Vehicles Division Defence Science and Technology Organisation
DSTO-TR-2116
ABSTRACT This report describes the application of an X-ray Fluorescence (XRF) instrument to determine the composition of wear debris collected from helicopter magnetic chip detectors and oil filters. The Twin-X XRF (assessed in this report) is a commercially produced bench-top XRF and has not previously been applied to wear debris analysis of Australian Defence Force aircraft. The primary aim is to establish its ability to identify the composition of wear debris locally (i.e. at the operational base level). This will enable timely and informed decisions to be made regarding maintenance action following magnetic chip detector indications or oil filter bypass events. This report has shown that the Twin-X XRF is capable of providing valuable information about the composition of wear debris from aircraft oil-wetted systems.
RELEASE LIMITATION
Approved for public release

Published by Air Vehicles Division DSTO Defence Science and Technology Organisation 506 Lorimer St Fishermans Bend, Victoria 3207 Australia Telephone: (03) 9626 7000 Fax: (03) 9626 7999 © Commonwealth of Australia 2008 AR-014-162 April 2008 APPROVED FOR PUBLIC RELEASE

Application of an X-ray Fluorescence Instrument to Helicopter Wear Debris Analysis
Executive Summary This report describes the application of an X-ray Fluorescence (XRF) instrument to material identification of wear debris. In particular, this report focuses on analysing wear debris captured by helicopter magnetic chip detectors and oil filters using the commercial Twin-X XRF. Identification of the wear debris material type is considered crucial for making an informed and accurate decision about the health of internal dynamic components and any subsequent maintenance action. Traditionally wear debris analysis in the field has consisted of rudimentary manual particle counting and coarse morphological examination at best. At present, the elemental composition of the alloy is usually only undertaken by laboratories such as DSTO, however some Royal Australian Air Force bases employ Scanning Electron Microscopes (SEM) for this purpose. SEMs are comparatively bulkier, more complicated to use and substantially more expensive in terms of both capital cost and on-going support. The availability of simple to use commercial XRF equipment means that analysis of wear debris composition can now be done at the operational base level. The primary advantage of localised analysis is to provide timely information on the likely source of the debris, thus enabling an informed decision to be made regarding possible maintenance action. The information obtained from this type of instrument can both confirm the need to remove a piece of machinery from an airframe or prevent the premature removal of machinery if debris is assessed as being inconsequential or benign. It is acknowledged that laboratory analysis may still be needed in a substantially reduced number of cases. The work conducted by DSTO included customisation of the instrument for aircraft wear debris analysis and creation of analytical methods and procedures to enable the instrument to be used reliably by non-laboratory staff. The instrument has been delivered to the Naval Air Station at HMAS Albatross and a small number of Defence civilian staff have been trained in its use. HMAS Albatross was selected as the initial site for this instrument as a Condition and Health Monitoring Cell is already established there. Whilst there are some minor limitations of the XRF compared to an SEM with Energy Dispersive Spectroscopy (EDS), the instrument performed extremely well and is expected to produce tangible benefit for RAN helicopter machinery health assessment. The instrument has been demonstrated to be a potential candidate for replacement of the cumbersome and relatively expensive SEM units currently deployed to selected RAAF bases. Other bases currently without the ability to determine composition could use this technology to enhance the maintenance decision making process.


Authors
Andrew Becker Air Vehicles Division Mr Becker joined the Royal Australian Navy (RAN) in 1986 as a helicopter technician working on Sea King helicopters. He was selected for RAN-sponsored degree studies in 1989 and graduated from RMIT in 1993 with a Bachelor of Mechanical Engineering degree (Honours). Mr Becker then served as an Officer in the Marine Engineering branch of the RAN, during which time he served primarily in the guided missile destroyer HMAS Brisbane. He was then selected for an exchange posting to the Royal Navy technical training establishment HMS Sultan. Mr Becker resigned his RAN commission in 1998 and joined DSTO. Since then he has focused on applied condition monitoring of aircraft propulsion systems. Mr Becker recently completed an attachment to Pratt and Whitney (East Hartford, Connecticut, USA), working on the Prognostics and Health Management system for the F135 Joint Strike Fighter engine. Mr Becker has also completed a Masters Degree in Maintenance and Reliability Engineering (Monash University).
____________________ ________________________________________________


Contents
1. INTRODUCTION ............................................................................................................... 1
2. AIM ........................................................................................................................ 2
3. XRF THEORY ....................................................................................................................... 2 3.1 Theory of Operation................................................................................................. 2 3.2 Twin-X Specifications .............................................................................................. 3
3.2.1 Overview of Twin-X XRF ......................................................................... 3 3.2.2 Operational Range..................................................................................... 3 3.2.3 Consumables .............................................................................................. 4
4. XRF OHS REQUIREMENTS............................................................................................. 4 4.1 Department of Defence ARPANSA Licence Requirements............................. 4 4.2 Exposure Limits......................................................................................................... 5 4.3 Routine Requirements and Documentation........................................................ 5
4.3.1 Radiation survey........................................................................................ 5 4.3.2 Maintenance Requirements and Records............................................... 5 4.3.3 Other Documentation ............................................................................... 6
5. XRF APPLIED TO WEAR DEBRIS .................................................................................. 6 5.1 Obtaining a Spectrum Using Twin-X ................................................................... 7
5.1.1 Identifying Peaks ..................................................................................... 11 5.1.2 Special Cases – Magnesium and Aluminium...................................... 14
5.2 Flow Chart ................................................................................................................ 17 5.3 Pseudo-Standards ................................................................................................... 17
5.3.1 Using Pseudo-Standards ........................................................................ 19 5.4 Metal Maps............................................................................................................... 21
5.4.1 Seahawk .................................................................................................... 21 5.4.2 Sea King .................................................................................................... 21
5.5 Exporting Spectra.................................................................................................... 21 5.6 Comparison with SEM EDS results .................................................................... 22
5.6.1 AISI M50 Bearing steel............................................................................ 22 5.6.2 AISI 9310 Gear Steel ................................................................................ 23 5.6.3 431 Stainless Steel .................................................................................... 24 5.6.4 Estimated Percentage Composition ...................................................... 25
5.7 Calibration................................................................................................................ 26 5.8 Database Back Up ................................................................................................... 27 5.9 Twin-X Specific Issues........................................................................................... 27
5.9.1 Aluminium and Magnesium ................................................................. 27 5.9.2 Labelling ................................................................................................... 27 5.9.3 Exporting Spectra .................................................................................... 27 5.9.4 Results Menu............................................................................................ 28
5.10 Summary of Routine Requirements.................................................................... 28

6. WEAR DEBRIS ANALYSIS – GENERAL..................................................................... 28 6.1 Wear Debris Causes................................................................................................ 28 6.2 Ferrous Debris ......................................................................................................... 31 6.3 Non-Ferrous Debris ................................................................................................ 31 6.4 Procedures for Analysing Wear Debris .............................................................. 31
6.4.1 Overall Procedure.................................................................................... 31 6.4.2 Filter Debris .............................................................................................. 32 6.4.3 Magnetic Chip Detector Debris ............................................................. 32
7. DISCUSSION..................................................................................................................... 35
8. CONCLUSION................................................................................................................... 36
9. RECOMMENDATIONS .................................................................................................. 36
10. ACKNOWLEDGEMENTS............................................................................................... 36
11. REFERENCES..................................................................................................................... 37
APPENDIX A: RADIATION SURVEY PROCEDURE................................................. 39
APPENDIX B: METAL IDENTIFICATION FLOW CHART FOR TWIN-X XRF ... 41
APPENDIX C: SEAHAWK/BLACK HAWK METAL MAP ........................................ 43 C.1. Engines ............................................................................................. 43 C.2. Main Module................................................................................... 44 C.3. Intermediate Gearbox.................................................................... 45 C.4. Tail Rotor Gearbox......................................................................... 45
APPENDIX D: SEA KING METAL MAP........................................................................ 47 D.1. Engines ............................................................................................. 47 D.2. Main Rotor Gearbox ...................................................................... 47 D.3. Intermediate Gearbox.................................................................... 48 D.4. Tail Rotor Gearbox......................................................................... 49
APPENDIX E: ASSEMBLY OF TWIN-X SAMPLE HOLDER .................................... 51
APPENDIX F: FILTER DEBRIS EXTRACTION AND ANALYSIS PROCEDURE...........54

DSTO-TR-2116
1
1. Introduction
A generally accepted definition of Wear Debris Analysis (WDA) associated with aircraft is the assessment of wear-related debris from an oil-wetted system (typically the lubrication systems) in terms of quantity, morphology and composition. Whilst Original Equipment Manufacturer (OEM) guidance is usually available for in-field assessment of quantity and sometimes morphology, the composition of debris has only been done on an ad-hoc basis using a Scanning Electron Microscope (SEM) fitted with Energy Dispersive Spectroscopy (EDS) capability. Some Royal Australian Air Force (RAAF) bases have SEM EDS instruments and the DSTO Aircraft Forensic Engineering (AFE) group have also provided this service to the Australian Defence Force (ADF). Determination of the composition of debris is required to identify the source of the debris, which then enables the significance of the debris to be assessed. Subsequently, an informed decision can then be made regarding any maintenance action for the subject machinery. Accurate information about quantity, morphology and composition can provide valuable confirmation that a critical piece of machinery (for example a bearing or gear) is degraded or failing. Conversely it can help prevent the unnecessary removal of high value machinery from aircraft due to benign debris such as residual machining swarf. It can also be useful for focusing repair effort at overhaul facilities by aiding the identification of suspect sub-components. Where overhaul condition reports are requested following the removal of engines or gearboxes, the XRF results could be used to target specific components for condition assessment, potentially saving some of the substantial cost associated with these reports. Whilst there are a number of techniques that can be used for WDA, the primary methods currently used in the ADF are:
1. the assessment of magnetic chip detector debris, 2. the assessment of oil filter debris, and 3. the analysis of entrained particulate in oil samples using the Spectrometric Oil
Analysis (SOA) technique. SOA has had a varied history in the ADF and the particle size limitation (typically less than eight microns) is generally not fully appreciated by those reviewing the analysis results. The trend towards finer filtration in aircraft engines and gearboxes also hampers any value obtained from an SOA program; finer filtration is consider more beneficial than SOA in terms of maximising machinery life [1]. A tool to enable the determination of debris composition would enhance the decision making process associated with wear debris from both magnetic chip detectors and oil filters. The use of SEM EDS to conduct this type of non-laboratory compositional assessment is expensive (in terms of both the capital cost and annual service contract) and imposes a substantial training burden. Additionally, the SEM microscopic function (for which the SEM was primarily intended) is seldom used for WDA since a good quality optical microscope is sufficient for morphological assessment. This report discusses the application of a tool not previously used in the ADF for the assessment of debris

DSTO-TR-2116
2
composition that has now been transitioned to the Navy Aviation Systems Program Office (NASPO) Condition and Health Monitoring Cell (CHMC) at HMAS Albatross. In June 2007 DSTO proposed that the Royal Australian Navy (RAN) fund the purchase of an Oxford Instruments Twin-X X-ray Fluorescence (XRF) instrument under the RAN Minors Funding program. This particular instrument was selected based on previous related work done by the United Kingdom Ministry of Defence (UK MOD) Materials Integrity Group (MIG) and Qinetiq [2]. Additional key attributes considered during the selection phase were size, ruggedness, simplicity of use and whether substantial in-country technical support existed. The proposal was successful and DSTO undertook to customise the XRF for wear debris analysis and assess the performance of the instrument when applied to WDA; advice on commissioning and training requirements was also provided by DSTO.
2. Aim
The aim of this report is to assess the Twin-X XRF when applied to the analysis of wear debris from helicopter oil-wetted systems and provide detailed operating procedures for this function. This report also describes the customisation of the Twin-X XRF carried out by DSTO to enable WDA to be carried out by staff at an operational base.
3. XRF Theory
3.1 Theory of Operation
X-rays are defined as part of the electromagnetic radiation spectrum with a wavelength greater than light (typically in the range 10-8 to 10-13 m) [3]. X-rays are further classified as ionising radiation since they have sufficient energy to remove electrons from an atomic orbit. The energy of X-rays is measured in kilo electron volts (keV). Generally, in instruments such as this, X-rays are generated when high voltage is applied to an evacuated X-ray tube. Electrons generated by the high voltage element within the X-ray tube are then slowed down by a target within the tube. Deceleration of the electrons causes a Bremsstrahlung (from the German Braking Radiation) X-ray to be produced; it is this X-ray that is then used to fluoresce the sample. X-ray fluorescence is initiated by using Bremsstrahlung X-rays to eject an electron from an inner orbit of an atom. Once the electron has been ejected from the atom, another electron from an outer shell drops to the lower energy shell to replace the ejected electron. In the process of changing from a higher to a lower energy shell, a characteristic X-ray is released (i.e. the sample fluoresces). X-ray fluorescence spectroscopy involves detecting and identifying the characteristic X-rays that are emitted when the sample fluoresces (see Figure 1). The characteristic X-rays emitted from the sample are unique to each element and thus serve as an identifier for the material composition.

DSTO-TR-2116
3
Figure 1: XRF Principal using Aluminium atom as an example
3.2 Twin-X Specifications
3.2.1 Overview of Twin-X XRF
The Twin-X XRF is a fully enclosed bench-top XRF device with two analysis heads. It has the ability to analyse a range of materials in either solid, liquid, powder or paste form. A maximum of ten samples can be analysed at one time using the rotating sample tray. The instrument has a 260 mm LCD display and the in-built computer can accommodate peripheral devices such as CD burner and printer. Twin-X uses a dedicated software program to operate the instrument, which runs on an embedded Windows 2000 operating system. When the X-ray tube is activated, two yellow radiation signs illuminate on top of the instrument: if the lights are extinguished the unit is not producing any X-rays. The unit can only produce X-rays when the lid is shut and the three lid interlocks confirm the lid is shut properly. The instrument has an operating temperature range of between 10OC to 35OC. A helium supply of 35 kPa 7kPa is required when using the Focus 5+ analysis head (see section 3.2.2). The instrument weighs 43 kg and should not be lifted by one person. The X-ray tube window and detector contain beryllium (Be), which in normal use is not harmful but can become harmful if these components are damaged; suspected damage to the X-ray tube or detector window from rough handling or dropping should be immediately reported to the manufacturers, Oxford Instruments. 3.2.2 Operational Range
The Twin-X XRF has a stated operational range (in terms of element detection) from magnesium (Mg) to uranium (U) using two X-ray detection sensors: a FOCUS 5+ detector
AlX-ray tube
X-ray
Detector
1. Incident X-ray
4. Characteristic X-ray
2. Ejected electron0
1000
2000
3000
4000
5000
6000
7000
0 200 400 600 800 1000 1200 1400
XRF Spectrum showing Al peak
3. Outer electron replaces ejected

DSTO-TR-2116
4
and a PIN detector. The Focus 5+ detector is used to detect elements from magnesium (Mg) to zinc (Zn), whilst the PIN detector is used to detect elements from calcium (Ca) to uranium (U) [4]. Elements between calcium (Ca) to zinc (Zn) can be detected by either detector, however it is usual to use the PIN detector. The PIN detector uses an air environment and the FOCUS 5+ detector uses a helium purge that allows greater detection efficiency when measuring the low-energy (lighter) elements. Each X-ray tube has a maximum power rating of 30 kW and each detector uses a palladium (Pd) target. 3.2.3 Consumables
The Twin-X XRF uses a small quantity of helium gas when analysing elements with the FOCUS 5+ detector. Given the relatively low usage of helium anticipated, it is recommended that a small cylinder (for example 1.5 m3) with a regulator that has suitable pressure range (no more than 0-200 kPa) be used. The Twin-X requires a minimum helium (He) purity of 99% at a pressure of 35 kPa +/- 7 kPa (5 psig +/- 1 psig), which is commercially available. DSTO recommends that laboratory grade purity (typically 99.995% pure or better) be used. The sample preparation requires the use of X-ray transparent film which should only be used once. Oxford Instruments provide a variety of different types, however the Poly 4 film is recommended for this application. Some debris may require adhering to the sample holder and whilst the manufacturer recommends a special X-ray transparent tape called J-Lar, DSTO have found that the ubiquitous clear pressure sensitive tape (sticky tape or Scotch Magic™ tape) performs adequately for WDA applications.
4. XRF OHS Requirements
4.1 Department of Defence ARPANSA Licence Requirements
The Twin-X is classified as a fully enclosed XRF analysis unit and its use is governed by the Defence Safety Manual (SAFETYMAN) Volume 1, part 4 Chapter 1 (Ionising Radiation) [5]. SAFETYMAN in turn refers to the Australian Radiation Protection and Nuclear Safety Agency (ARPANSA) Defence License and Defence Handbook. The Defence Handbook classifies this type of equipment as a ‘Fully Enclosed X-ray Analysis Unit’ and rates it as a ‘Yellow’ (Low Hazard) device [6]. The standard licence conditions for this classification of equipment [7] state that:
1. Section 4 of the Radiation Health Series (RHS) No.9 (Code of Practice for Protection Against Ionising Radiation Emitted from X-ray Analysis Equipment) [8] must be complied with,
2. Any person who uses the equipment has radiation safety training at least to a four hour approved ‘radiation awareness’ standard
3. The equipment standards meet RHS No.9 Section 5 4. The work procedures outlined in RHS No.9 Section 6 are complied with, and 5. That any repairs to the instrument are conducted by a certified repairer (in this case
only Oxford Instruments technical staff are authorised to repair the instrument).

DSTO-TR-2116
5
4.2 Exposure Limits
The Twin-X XRF is a fully enclosed device and the manufacturer does not require (nor recommend) the use of personal dosimeters for users. Since the maximum instrument radiation dose rate possible is less than 0.1 μSv/hr (at 5 cm from casing), Department of Defence users are not classified as Occupationally Exposed Radiation Workers [9]. This means that exposure limits applicable to the general public apply to Department of Defence users of this equipment. The exposure limits for the general public are shown in Table 1. Even if this unit was used constantly for an entire year and the user stood within 5 cm of the casing for the entire year (impossible), the general public exposure limit would not be exceeded. It should be noted that the radiation surveys conducted by DSTO have not detected any radiation above background.
Table 1: Radiation dose limits applicable to Twin-X shown in red (General Public limit) [10]
4.3 Routine Requirements and Documentation
4.3.1 Radiation survey
Although there is no requirement to perform any routine radiation survey for this type of equipment [11,12,13], DSTO recommends an annual radiation survey be conducted. Radiation surveys should also be conducted after the unit has been transported off-site (not a normal occurrence for this instrument) and following any maintenance (see section 4.3.2). The procedure shown in Appendix A must be used for the radiation survey to ensure the unit is surveyed whilst operating at full power. Radiation surveys will be co-ordinated by the instrument custodian within NASPO CHMC. 4.3.2 Maintenance Requirements and Records
Oxford Instruments recommends an annual service be conducted on this instrument [14]. It is a requirement of the ARPANSA licence that only qualified technicians perform maintenance on fully enclosed XRF instruments. In this case the Twin-X instrument must

DSTO-TR-2116
6
only be maintained by Oxford Instruments technical staff; a description of the maintenance conducted must be recorded in the XRF maintenance log. 4.3.3 Other Documentation
A log book must be maintained that identifies a serial number, the user, date, aircraft or machinery serial number and any other comments relevant to the analysis. Both this log and the maintenance log should be routinely reviewed by the XRF custodian.
5. XRF Applied to Wear Debris
The benefits of applying the XRF technique to wear debris analysis have been demonstrated elsewhere [15,16], however the primary advantages are the ability to determine the composition of unidentified metallic debris coupled with no practical upper size limitation for wear debris. The minimum practical size limit of debris is in the order of 50 to 100 microns; identification of the alloying elements in debris smaller than this can become difficult. The envisaged application of the Twin-X XRF is the determination of the composition of magnetic chip detector debris and filter debris; this will assist in identifying the source of the subject debris. Knowing the source of the debris is critical for making a decision about the health of the machinery sub-system in question. Whilst there is guidance in place for the quantity and morphology of wear debris (to varying degrees), timely information regarding the composition will provide added confidence about the machinery health. Additionally, analysis of debris can also be used to prevent the premature removal of aircraft machinery for benign debris such as residual machining swarf or foreign metals. With the introduction of modern fine filtration systems, the value of routine SOA is questionable. Whilst SOA can perform adequately on unfiltered systems such as Intermediate gearboxes or Tail Rotor gearboxes, finely filtered systems (such as engines and some Main Rotor Gearboxes) remove much of the debris that SOA can detect (below eight micron [17]). The benefits to machinery component life associated with finer filtration (i.e. cleaner oil) are considerable [18] and are considered to outweigh any benefits seen from the SOA programs, particularly in the military context. The dilemma, however, is how to adequately detect machinery failure if it occurs with fine filtration in place; in reality filter analysis and chip detector analysis are the only practical options available for legacy aircraft. The method of determining the source of debris using the XRF has three basic steps:
1. Produce a characteristic spectrum of the captured debris, 2. Identify the elements represented by peaks in the spectrum, and 3. Identify the material by:
a. Following the flow chart (see section 5.2 and Appendix B), b. Overlaying the pseudo-standards (see section 5.3) that have been preloaded
in the XRF (optional), and

DSTO-TR-2116
7
c. Using the metal maps included herein to determine likely sources. 5.1 Obtaining a Spectrum Using Twin-X
Whilst the Twin-X was designed as a quality assurance tool for industry, it can also produce a characteristic spectrum for a sample. Producing the characteristic spectrum will be the prime use of this instrument applied to WDA. It is important to remember that proper procedural hygiene when preparing samples will ensure an accurate result; the instrument cannot discriminate between contamination and sample. The following steps should be followed to obtain a spectrum:
1. Prepare a new sample holder in accordance with Appendix E and place the sample in the holder. Close the Twin-X lid.
2. Log in to the Twin-X program (see Figure 2). There are currently four log ins available for use by NASPO CHMC staff as well as one DSTO log in and a generic log in for use by Oxford Instruments service engineers.
Figure 2: Twin-X login screen
3. The Main Analysis screen will appear (see Figure 3). Type a name for the sample in the Label field. The following naming convention should be followed: [tail number][parent machine][day][month][year]. For example, the analysis of a piece of debris from the tail rotor gearbox of Seahawk 888 and collected on the 28th of September 2008 would be named: N24-888TRGB28SEP08. Should two spectra be needed for a particular sample then the second and subsequent spectra should have the suffix -2, -3 etc added to the name. For example, the second spectra taken from the sample previously mentioned would be labelled: N24-888TRGB28SEP08-2.
4. Select a method from the drop-down menu. If the material is magnetic, select the Magnetic Unknown method. If the material is non-magnetic, select the Non-

DSTO-TR-2116
8
magnetic Unknown option. These methods have been developed by DSTO to simplify the analysis procedure. The Magnetic Unknown method does two optimised analyses in sequence: the first looks at the vanadium (V) to zinc (Zn) region of interest (approximately 4.9 – 8.6 keV) and encompasses the majority of significant elements relevant to machinery wear debris analysis. The second analysis is optimised for detection of molybdenum (Mo), which has its primary peak at approximately 17.4 keV. The molybdenum analysis will also confirm the presence of elements such as silver (Ag), and cadmium (Cd). When retrieving the results from this method, the user will be prompted to select either the V-Zn or Mo results. The V-Zn spectra should be analysed first and then the Mo spectra retrieved to determine if molybdenum (Mo) is present. The Magnesium or Aluminium option will be discussed in section 5.1.2.
Figure 3: Main Analysis Menu
5. Select Accept 6. Select Start and the analysis will begin. Figure 4 shows the screen that will appear
during the analysis. The following colour code is used on this screen: a. Red: indicates the analysis has not commenced b. Yellow: indicates the analysis is in progress, and c. Green: indicates the analysis has finished.

DSTO-TR-2116
9
Figure 4: Main analysis screen shown during analysis phase
7. On completion of the method the results screen will appear (Figure 5); the spectrum has been created and will be viewed in the next step. Results for the Magnetic Unknown method show the approximate percentage of chromium (Cr) contained in the sample, which is essential for the correct identification of steels using the flow chart. Similarly, some key elements are reported for the Non-magnetic Unknown method. All elements present in the sample are determined by identifying the peaks present in the spectrum (section 5.1.1)
Figure 5: Results screen showing approximate percentage composition of chromium (Cr)
DSTO-TR-2116
10
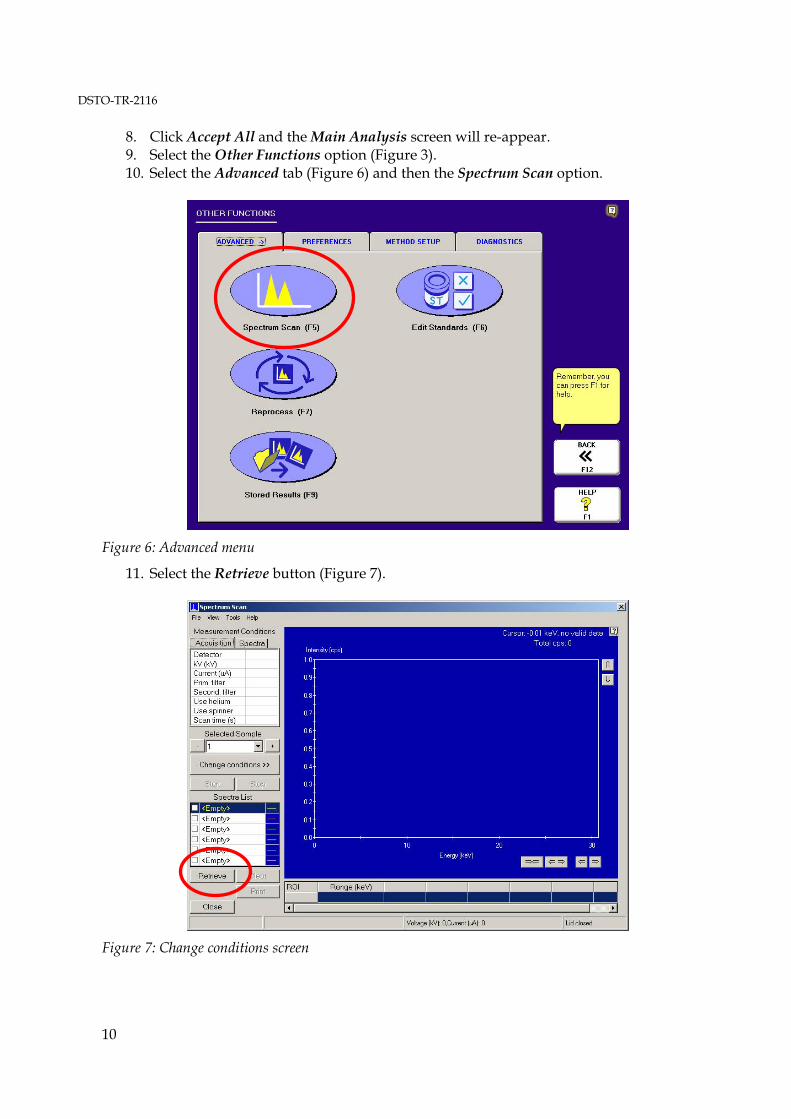
8. Click Accept All and the Main Analysis screen will re-appear. 9. Select the Other Functions option (Figure 3). 10. Select the Advanced tab (Figure 6) and then the Spectrum Scan option.
Figure 6: Advanced menu
11. Select the Retrieve button (Figure 7).
Figure 7: Change conditions screen

DSTO-TR-2116
11
12. Select the sample name from the left hand menu bar (Figure 8) and click on OK. The spectrum will appear. As previously noted, the Magnetic Unknown method produces two optimised spectra (V-Zn and Mo); it is recommended that the V-Zn spectrum be used initially to identify the majority of peaks and then the Mo spectrum be used to determine if molybdenum (Mo), silver (Ag) or cadmium (Cd) are present in the sample.
Figure 8: Retrieve data screen
5.1.1 Identifying Peaks
Having obtained the spectrum the next phase involves a detailed analysis of the elements present in the spectrum. The following procedure should be used to identify the peaks present in a spectrum:
1. With the spectrum showing on the Spectrum Scan screen, click on the Tools menu and select the Identify Peaks option. The Identify Peaks screen will then appear (Figure 9). It is important to note that the height of the peak represents the approximate proportion of the particular element in the material. Iron (Fe) will always dominate the spectrum for steels, but it is of little use identifying the origin; the alloying elements are the key to identifying the metal.

DSTO-TR-2116
12
Figure 9: Identify Peaks screen showing possible elements for selected peak
2. To simplify the identification of possible elements for a given peak, it is
recommended that the Line Filter be set for K only. To do this, de-select the All box and then de-select the L and M boxes (see Figure 10). At this point place the cursor anywhere in the blue region and right click. Select the Smooth Data option to make peak identification easier.
3. Place the cursor on the highest peak and a series of elements will appear in the Lines within search range table. Typically, the element that has an intensity of 100 is the true element. The intensities can also be thought of as probabilities and therefore an intensity of 100 indicates the element is almost certainly in the actual sample. Most elements encountered in wear debris analysis will produce two or more peaks for each element. The secondary peaks are a good confirmation that the element does exist in the sample. In Figure 10 chromium (Cr) is shown twice in the table (with an intensity of 100 and 50), so this peak will be attributed to chromium (Cr). To label the peak, select the particular element from the Lines within search range table and then select the Series button in the Label row. Two peaks should then be labelled with Cr.

DSTO-TR-2116
13
Figure 10: Example of the Identify Peaks screen showing recommended Line Filter settings
4. Repeat the labelling process for the next highest peak and then continue repeating until no peaks remain unlabelled. Note that some peaks will be small and may require re-scaling of the plot by moving the cursor onto the plot, clicking once and dragging upwards. The arrow buttons can also be used to maximize the spectral information in the view window. The instrument has a palladium (Pd) target and will always produce a small peak at approximately 2.8 keV; this peak should be disregarded. Where strong iron (Fe) peaks are present, a harmonic pair of peaks can appear at twice the value of the iron peaks (i.e. at approximately 12.79 keV); these peaks should also be disregarded.
5. The final spectrum should show all of the peaks labelled as shown in Figure 11.
DSTO-TR-2116
14
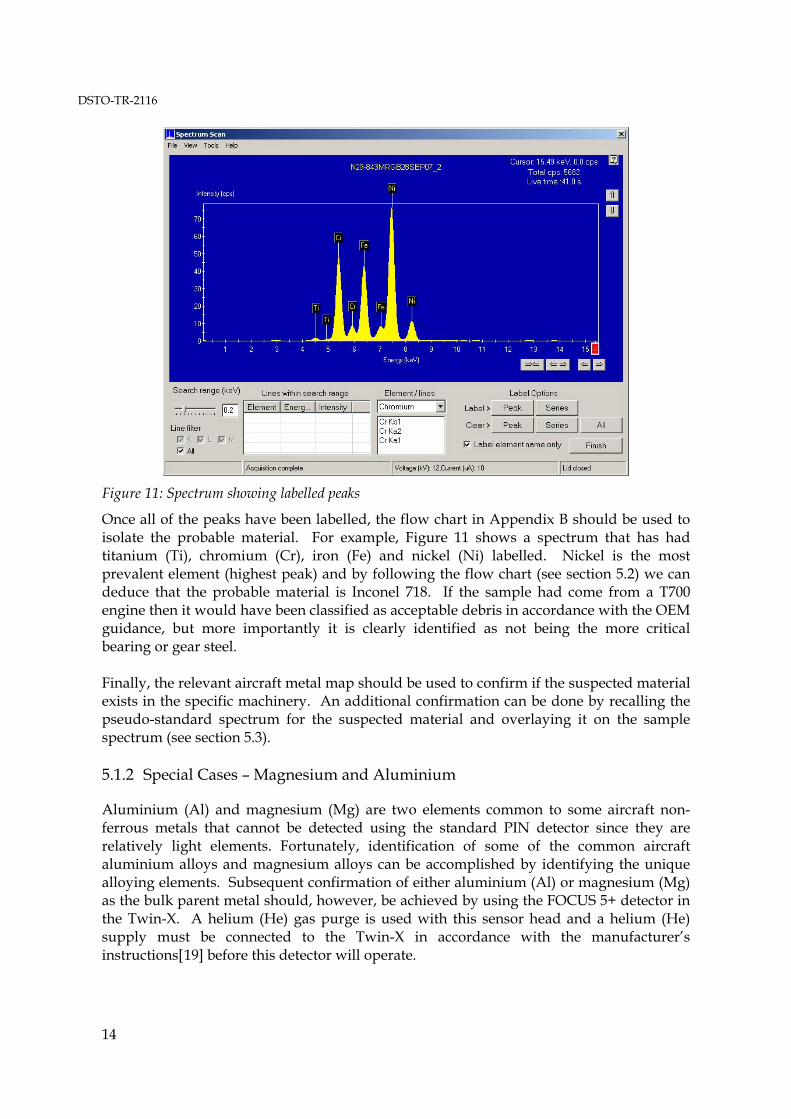
Figure 11: Spectrum showing labelled peaks
Once all of the peaks have been labelled, the flow chart in Appendix B should be used to isolate the probable material. For example, Figure 11 shows a spectrum that has had titanium (Ti), chromium (Cr), iron (Fe) and nickel (Ni) labelled. Nickel is the most prevalent element (highest peak) and by following the flow chart (see section 5.2) we can deduce that the probable material is Inconel 718. If the sample had come from a T700 engine then it would have been classified as acceptable debris in accordance with the OEM guidance, but more importantly it is clearly identified as not being the more critical bearing or gear steel. Finally, the relevant aircraft metal map should be used to confirm if the suspected material exists in the specific machinery. An additional confirmation can be done by recalling the pseudo-standard spectrum for the suspected material and overlaying it on the sample spectrum (see section 5.3). 5.1.2 Special Cases – Magnesium and Aluminium
Aluminium (Al) and magnesium (Mg) are two elements common to some aircraft non-ferrous metals that cannot be detected using the standard PIN detector since they are relatively light elements. Fortunately, identification of some of the common aircraft aluminium alloys and magnesium alloys can be accomplished by identifying the unique alloying elements. Subsequent confirmation of either aluminium (Al) or magnesium (Mg) as the bulk parent metal should, however, be achieved by using the FOCUS 5+ detector in the Twin-X. A helium (He) gas purge is used with this sensor head and a helium (He) supply must be connected to the Twin-X in accordance with the manufacturer’s instructions[19] before this detector will operate.

DSTO-TR-2116
15
A method has been created to enable confirmation of either aluminium (Al) or magnesium (Mg) as the bulk parent metal in a non-ferrous sample. This can be selected from the Method drop down menu on the Main Analysis screen. This method does two analyses sequentially: the first is optimised for aluminium (Al) and the next is optimised for magnesium (Mg). The peak height from each analysis is then automatically compared to determine which is the likely parent metal. Figure 12 shows the two sequential analysis results obtained from using this method to analyse an aluminium alloy sample. The results clearly show the strong peak resulting from the aluminium-optimised analysis (red trace) compared to the flat peak from the magnesium-optimised analysis (yellow trace). Figure 13 shows similar results for a magnesium alloy sample using the same method. This technique has been shown to reliably identify the correct parent metal when analysing typical magnesium and aluminium alloys from aircraft oil-wetted systems.
Figure 12: Comparison of aluminium (red) and magnesium (yellow) spectra for an aluminium (Al)
sample. Since aluminium (Al) has the higher peak, it would be attributed as the true parent metal.
The following procedure should be used to confirm either aluminium (Al) or magnesium (Mg) as the bulk parent metal:
1. Ensure helium (He) supply valve is on and regulator pressure gauge reads 35 kPa ± 7 kPa.
2. From the Main Analysis Menu (see Figure 14) select the sample tray of interest (typically sample tray number 1).
3. Click on the Method drop-down box and select the Aluminium or Magnesium method.
4. Type the sample name into the Label field 5. Click on Accept. 6. Click the green Start button and the analysis will commence. Analysis takes
approximately 3 minutes, after which the results will be displayed on the screen.

DSTO-TR-2116
16
At this stage the report can be viewed with the spectrum. Press Accept All to save the results and return to the Main Analysis screen.
Figure 13: Comparison of aluminium (Al) spectra (yellow) and magnesium (Mg) spectra (red) for a
magnesium (Mg) alloy sample (ZE41A).
Figure 14: Main analysis Menu showing sample tray number 1 selected and the “Aluminium or
Magnesium” method selected.

DSTO-TR-2116
17
5.2 Flow Chart
The flow chart contained in Appendix B is used to determine the likely metal alloy based on the elements identified in the spectrum. The flow chart has been developed based on Seahawk (also applicable to the Australian Army Black Hawk) and Sea King systems, however the alloys shown also represent those of significance in the majority of ADF aircraft oil-wetted lubrication systems. Where a particular aircraft has a metal of interest that does not appear in the flow chart then DSTO should be consulted to produce a revised version. Having identified the peaks present in the spectrum, the user follows the flow chart until one or more probable metals are identified. Once the probable alloys have been identified the applicable metal map (see section 5.4) can be consulted to determine the likely origin of the debris; this then enables a criticality assessment to be made. Aluminium (Al) and magnesium (Mg) are not specifically used as identifiers during the initial trial of this equipment at HMAS Albatross since they must be analysed using the FOCUS 5+ detection head with helium (He) purge (see section 5.1.2). The helium purge part of this system is expected to be implemented within the first 12 months of operation. Fortunately the alloying elements present in most of these types of alloys are sufficient for identification. For example the magnesium alloy ZE41A has the following identifying alloying elements: neodymium (Nd), zinc (Zn) and zirconium (Zr). 5.3 Pseudo-Standards
To assist with identification of actual aircraft wear debris, pseudo-standards were produced by DSTO for the majority of materials that were known to exist in aircraft oil-wetted systems. Pseudo-standards are simply pieces of known metal alloys that were used to produce characteristic spectra for each alloy. The pseudo-standards were analysed in the XRF and the spectra saved in the Twin-X database. The spectra are intended to be used as a reference library and can be retrieved and then overlayed with a spectra from an unidentified sample; this should be used to confirm an identification made using the flow chart (see section 5.2). Up to six spectra can be displayed on the screen at any one time, each in a different colour. Whilst the height of peaks will differ (between the pseudo-standard and the sample spectra), the primary aim is identifying the presence of an elemental peak and, where necessary, calculation of approximate composition percentages using peak height ratios. These pseudo-standards can also be used as a convenient calibration to check that the instrument is providing accurate results (see section 5.7). All of the pseudo-standards have an identifying letter engraved on them to ensure their identity (see Figure 15). The reverse side of the sample was polished with Struers 1200 grit silicon carbide paper, however polishing is not a normal sample preparation requirement for the Twin-X (see Figure 16). The samples were placed polished side down in the standard Twin-X sample holder using the Poly 4 (4 micron thick polypropylene) X-ray transparent film window on the bottom; the XRF measurement is made through this window. Table 2 shows the current list of pseudo-standards and the respective identification letter; other alloys will be added as they become available.

DSTO-TR-2116
18
Figure 15: Example of a Pseudo-standard showing engraved identification letter
Figure 16: Pseudo-standard showing polished surface; this surface should face down in the sample
holder

DSTO-TR-2116
19
Table 2: Identifying letters for Pseudo-standards
Identifying Letter Metal Alloy A AISI 9310 steel B SAE 52100 steel C AISI M50 steel D AISI 4130 steel E AISI 4320 steel F AISI 4340 steel G 6061 aluminium alloy H ZE41A-T5 magnesium alloy I AISI 431 stainless steel J Ti-6Al-4V titanium alloy K Inconel 718 L 7075 T6 Aluminium alloy M AISI 304 stainless N 356 aluminium O SAE 841 Bronze P Pyrowear 53 alloy steel
5.3.1 Using Pseudo-Standards
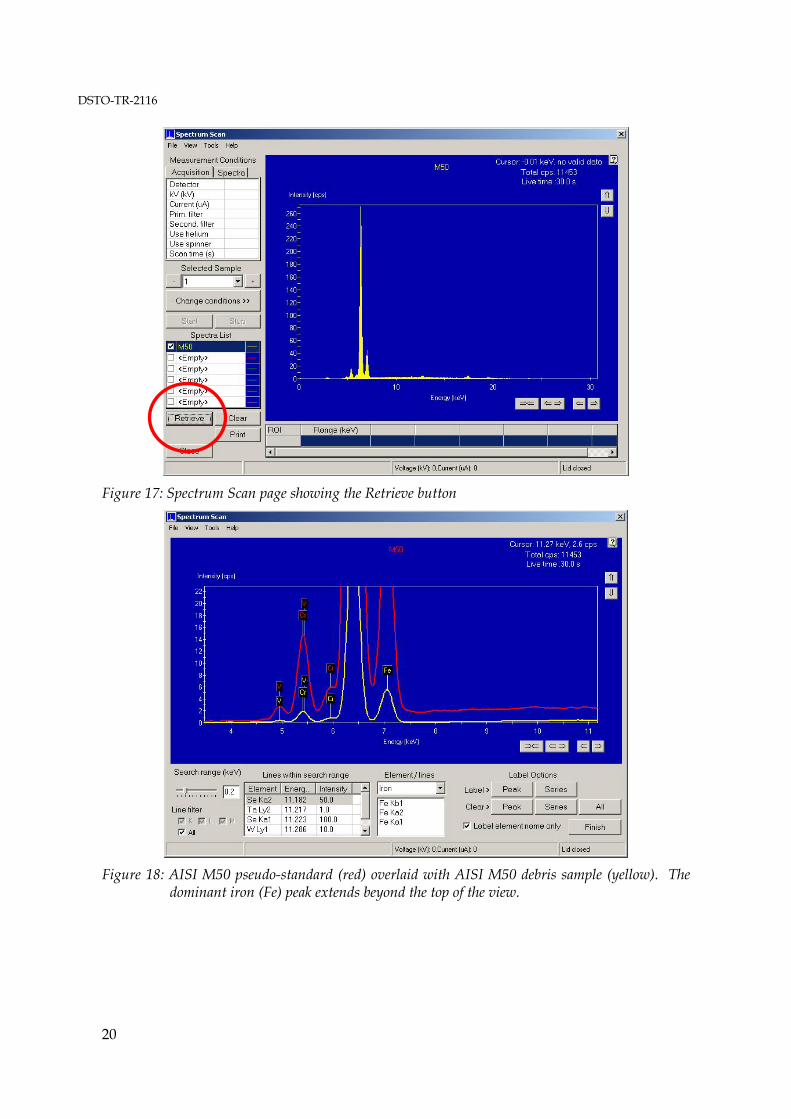
Having labelled the sample’s peaks and followed the flow chart, one further option is to retrieve the pseudo-standard spectra of the suspected metal for comparison with the sample. This is done by pressing the Retrieve button in the bottom left corner of the Spectrum Scan screen (see Figure 17). Select the material identified during the flow chart process from the list of available pseudo-standards, which have the word ‘Standard’ following the alloy name. Figure 18 shows the AISI M50 bearing steel pseudo-standard overlaid with an AISI M50 debris sample. Whilst the peaks are different heights the spectral composition (i.e. what peaks are present) can be matched.
DSTO-TR-2116
20
Figure 17: Spectrum Scan page showing the Retrieve button
Figure 18: AISI M50 pseudo-standard (red) overlaid with AISI M50 debris sample (yellow). The
dominant iron (Fe) peak extends beyond the top of the view.
DSTO-TR-2116
21
5.4 Metal Maps
5.4.1 Seahawk
A metal map is a table of oil-wetted components showing the material specification for each and usually the part number as well. A metal map is essential for WDA as it enables the likely source of the debris to be identified and therefore a risk weighting applied to the debris sample. DSTO have compiled a metal map for the Seahawk (also applicable to the Australian Army Black Hawk) that shows the material specifications for the primary components of the oil-wetted systems in the engine and gearboxes (see Appendix C). With the information available it was not possible to provide part numbers for the main module or intermediate gearbox, however part numbers are not considered essential since component descriptions are provided (i.e. bearing, gear, shaft etc). The metal map for the T700 engines is based on the General Electric T700 wear debris handbook [20]. 5.4.2 Sea King
Details of the Sea King metal map have been extracted from DSTO failure reports [21] and information received from the Materials Integrity Group (UK MOD) regarding wear debris analysis on Sea King helicopters [22,23] (See Appendix D). Due to the impending planned withdrawal date of this aircraft, the metal map has not been fully populated. 5.5 Exporting Spectra
As discussed later (see section 5.9.3) the available methods for exporting spectra from the Twin-X instrument are somewhat convoluted; the most efficient method is outlined below. In order to export the spectra it must first be converted to a bitmap as follows:
1. With the labelled spectrum showing on the Identify Peaks screen (see section 5.1.1), press the Print Screen button on the Twin-X keypad.
2. Press the [CTRL] and [ESC] keys to open the Windows Desktop 3. Select Programs, Accessories, Paint 4. When the Paint program opens select Edit, Paste and Yes 5. When the spectrum appears select File and Save As. Select the desired folder
location (typically a suitably named sub-folder within the My Pictures folder is adequate), type a file name and click OK.
6. Close the Paint program. Next the bitmap image is transferred to an approved Defence Restricted Network (DRN) USB memory device (typically a thumb drive) as follows:
1. Install the memory device in the Twin-X USB port. For convenience a USB extender lead has been installed to facilitate easy access to the Twin-X USB port located on the rear of the unit.
2. Press the [CTRL] and [ESC] keys to open the Windows Desktop if it is not already open.
3. Locate the applicable file via Documents, My Documents, My Pictures and then the applicable folder. Select the image file and click Copy.
DSTO-TR-2116
22
4. Paste the image into the USB memory device. 5. Select the Safely Remove Hardware option from the taskbar at the bottom of the
Desktop screen. Remove the USB memory device and transfer to a DRN computer. 5.6 Comparison with SEM EDS results
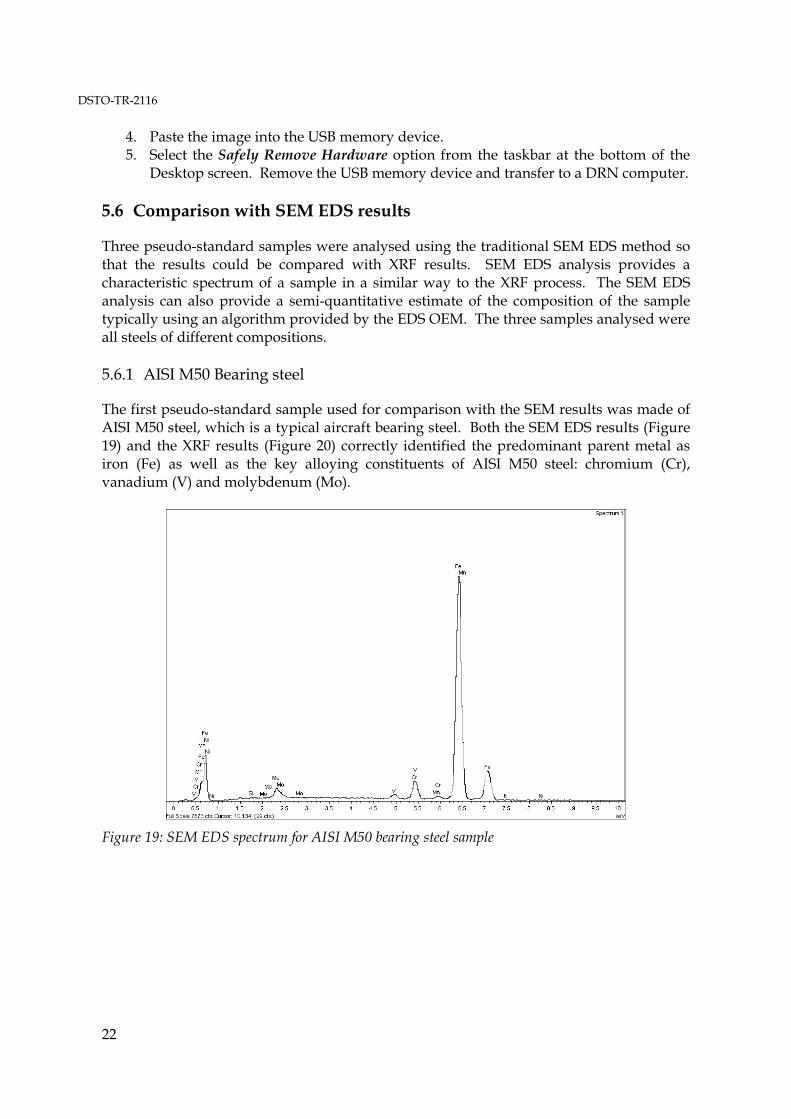
Three pseudo-standard samples were analysed using the traditional SEM EDS method so that the results could be compared with XRF results. SEM EDS analysis provides a characteristic spectrum of a sample in a similar way to the XRF process. The SEM EDS analysis can also provide a semi-quantitative estimate of the composition of the sample typically using an algorithm provided by the EDS OEM. The three samples analysed were all steels of different compositions. 5.6.1 AISI M50 Bearing steel
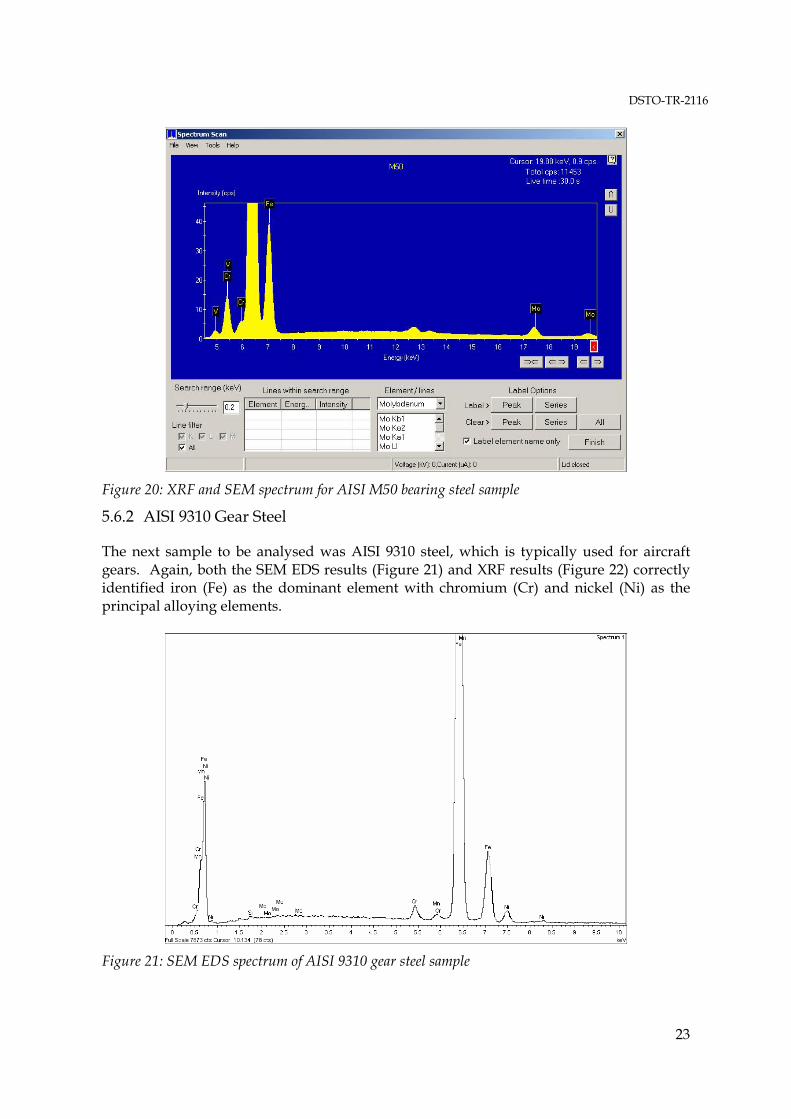
The first pseudo-standard sample used for comparison with the SEM results was made of AISI M50 steel, which is a typical aircraft bearing steel. Both the SEM EDS results (Figure 19) and the XRF results (Figure 20) correctly identified the predominant parent metal as iron (Fe) as well as the key alloying constituents of AISI M50 steel: chromium (Cr), vanadium (V) and molybdenum (Mo).
Figure 19: SEM EDS spectrum for AISI M50 bearing steel sample
DSTO-TR-2116
23
Figure 20: XRF and SEM spectrum for AISI M50 bearing steel sample
5.6.2 AISI 9310 Gear Steel
The next sample to be analysed was AISI 9310 steel, which is typically used for aircraft gears. Again, both the SEM EDS results (Figure 21) and XRF results (Figure 22) correctly identified iron (Fe) as the dominant element with chromium (Cr) and nickel (Ni) as the principal alloying elements.
Figure 21: SEM EDS spectrum of AISI 9310 gear steel sample

DSTO-TR-2116
24
Figure 22: XRF analysis of AISI 9310 gear steel sample
5.6.3 431 Stainless Steel
The final sample analysed using the SEM EDS was made of 431 stainless steel. Both the SEM EDS results (Figure 23) and the XRF results (Figure 24) correctly identified iron (Fe) as the predominant metal as well as the principal alloying elements of chromium (Cr) and nickel (Ni).
Figure 23: SEM EDS analysis of 431 stainless steel sample

DSTO-TR-2116
25
Figure 24: XRF analysis of 431 stainless steel sample
5.6.4 Estimated Percentage Composition
One of the advantages of spectral analysis is that it can provide an estimated percentage composition for the various constituent elements. Table 3 compares the XRF percentage composition with the SEM EDS estimation (by algorithm) and the actual specification for each of the three samples. Whilst the XRF results are not as close to the specification as the SEM EDS results, the approximation is still considered very good and would not impact the final in-field identification of the sample. The XRF percentage compositions were calculated manually using a rudimentary ratio of peak heights of the principal elements in each sample spectrum. Using the area under the peaks could provide more accurate results, but this cannot be practically implemented in the Twin-X XRF at this stage. The following rudimentary formula was used to calculate the estimated percentage composition from the XRF spectrum:
100)(____
)(___%_ ×∑
=cpsheightspeaktsignificanall
cpsheightpeakelementelementestimated
Where two (or more) peaks are labelled for a particular element the highest peak only should be used for the calculation of estimated percentage composition. Peak heights (intensity in cps) can be obtained by placing the cursor on the peak of interest and then reading off the amplitude from the Cursor display in the upper right hand corner of the screen (see Figure 24). As previously mentioned, the palladium (Pd) peak displayed at approximately 3 keV on all spectra is a by-product of the Twin-X XRF and should not be included in the calculation above. Further work investigating a more refined calculation of percentage composition should be undertaken by DSTO.

DSTO-TR-2116
26
Table 3: Comparison of sample percentage compositions
Material Principal Elements
XRF Estimated
Composition: (%)
Specified Composition
(%) [24]
SEM EDS Estimated
Composition (%)
AISI M50 Fe 92.0 Min 87.4 89.3 Cr 5.4 3.75 – 4.25 4.48 Mo* 1.5 4 – 4.5 4.46 V 1 0.9 – 1.1 1.08 AISI 9310 Fe 96.6 94 94.6 Cr 1.9 3.25 3.0 Ni 1.5 1.2 1.2 431 Fe 79.6 82 80.8 Cr 19.2 15 – 17 16 Ni 1.2 1.25 – 2.5 1.8 * Note Mo was outside the V-Zn region of interest originally used for this analysis and therefore exhibited an attenuated amplitude which subsequently underestimated the % composition. An additional analysis is now used in the Magnetic Unknown method that is optimised for identifying molybdenum (Mo) and does improve the estimated percentage.
5.7 Calibration
Whilst there is no routine calibration requirement for this instrument, DSTO recommends an annual calibration check using a pseudo-standard; this should be aligned with the annual service (see section 4.3.2). During the customisation process, DSTO identified an instance where the peak labelling became skewed, causing peaks to be mislabelled. To do a calibration check, select pseudo-samples K and M. These samples will produce two or more clear and distinct peaks which are needed for the calibration process. To conduct the calibration check, simply analyse each pseudo-sample using the Non-magnetic Unknown method and then label the peaks in accordance with section 5.1.1. If the labelled peaks match the expected peaks (shown in Table 4), then the instrument is fit for use. The calibration spectra should be saved (in accordance with section 5.5) and filed as a calibration report. If the labels do not match those expected, then contact Oxford Instruments or DSTO to step through the calibration correction procedure.
Table 4: Expected peaks for calibration pseudo-samples
Pseudo-standard Sample Alloy Expected Peaks (from largest to smallest)
K Inconel 718 Ni, Cr and Fe M AISI 304 stainless steel Fe, Cr and Ni

DSTO-TR-2116
27
5.8 Database Back Up
Whilst it is recommended that the analysis results be saved on the DRN, it is considered good practice to back up the Twin-X database annually. To back up the database log on and select the Other Functions option. Select the Preferences tab, then the Backup option and finally select Export Database. A database backup file will automatically be generated with the backup date in the file name. Note the location that the backup file is saved to and then save to a CD. 5.9 Twin-X Specific Issues
While the instrument was being customised and prepared by DSTO for the intended application, a number of relatively minor issues were identified that are worthy of documenting. Whilst none were critical to the application, they did represent inefficiencies. 5.9.1 Aluminium and Magnesium
The instrument cannot determine the presence of aluminium (Al) or magnesium (Mg) (or in fact elements below potassium (K) on the periodic table) without conducting a dedicated analysis that uses the FOCUS 5+ detector head in conjunction with a helium (He) gas purge. These two elements are relatively important in terms of non-ferrous aircraft debris and a specific method has been developed to determine which of these two elements is present. The method, however, cannot be used without the helium (He) purge, which is currently not installed at HMAS Albatross. It is anticipated that the helium (He) purge capability will be enabled within the first 12 months of operation. 5.9.2 Labelling
Once a spectrum has been acquired and the peaks have been labelled, the version of the spectrum saved in the Twin-X database does not retain the peak labels. When the saved version is retrieved for later analysis or export the peaks must be re-labelled. To address this issue, DSTO recommends that once the spectrum is initially labelled a screen image be saved and exported from the instrument (see section 5.5). 5.9.3 Exporting Spectra
There are two methods of exporting spectra from the Twin-X instrument and neither was found to be particularly efficient. The first method involves exporting the data as a comma delineated file that can be imported as data into a spreadsheet. Unfortunately this then necessitates re-plotting the data which is unnecessarily time consuming. The second method involves taking a screen image (see section 5.5) with the labelled spectra on the screen and then exporting it as an image file. Whilst this second method is still convoluted, it is the recommended method.
DSTO-TR-2116
28
5.9.4 Results Menu
The layout of the results menu consists of a chronological list of results that does not support any form of folder-based file organisation. Results cannot, therefore, be saved in folders under aircraft type or any form of file organisation. Additionally the name of the individual results cannot be edited once the analysis has been completed. To remedy this it is recommended that the results be removed from the database periodically and stored on the Defence Restricted Network (DRN). 5.10 Summary of Routine Requirements
Table 5 contains a summary of the annual routine tasks associated with the Twin-X instrument.
Table 5: Summary of Annual Twin-X Tasks
Task Number Task Description 1 Radiation survey (section 4.3.1) 2 Service (section 4.3.2) 3 Calibration check (section 5.7) 4 Database backup (section 5.8)
6. Wear Debris Analysis – General
This section provides general information regarding the analysis of wear debris particles; specifically size, shape and failure mode are discussed. This information has been included to augment the XRF-specific information and provide a single reference document. 6.1 Wear Debris Causes
Wear-related debris from oil-wetted systems can be attributed to three primary failure modes:
1. Fatigue (cyclic loading): These particles are generated in a load/unload (cyclic) environment and are a typical failure mode for a rolling element bearings and gears. Particles are generated when sub-surface cracks join together to a point where a small piece of material (known as a spall) is liberated from the parent surface. These particles can be tens of microns up to millimetres in length. Particles may show the machined surface very clearly on one side and a rough, crystalline surface on the reverse side where the crack has propagated (Figure 25). Sometimes the particles are rolled or kneaded as they exit the bearing or gear and appear as a flattened flake with cracked edges (Figure 26).

DSTO-TR-2116
29
Figure 25: Fatigue particle showing rough under-surface (left) and smooth machined raceway
(right)
Figure 26: Typical rolled fatigue spall particle
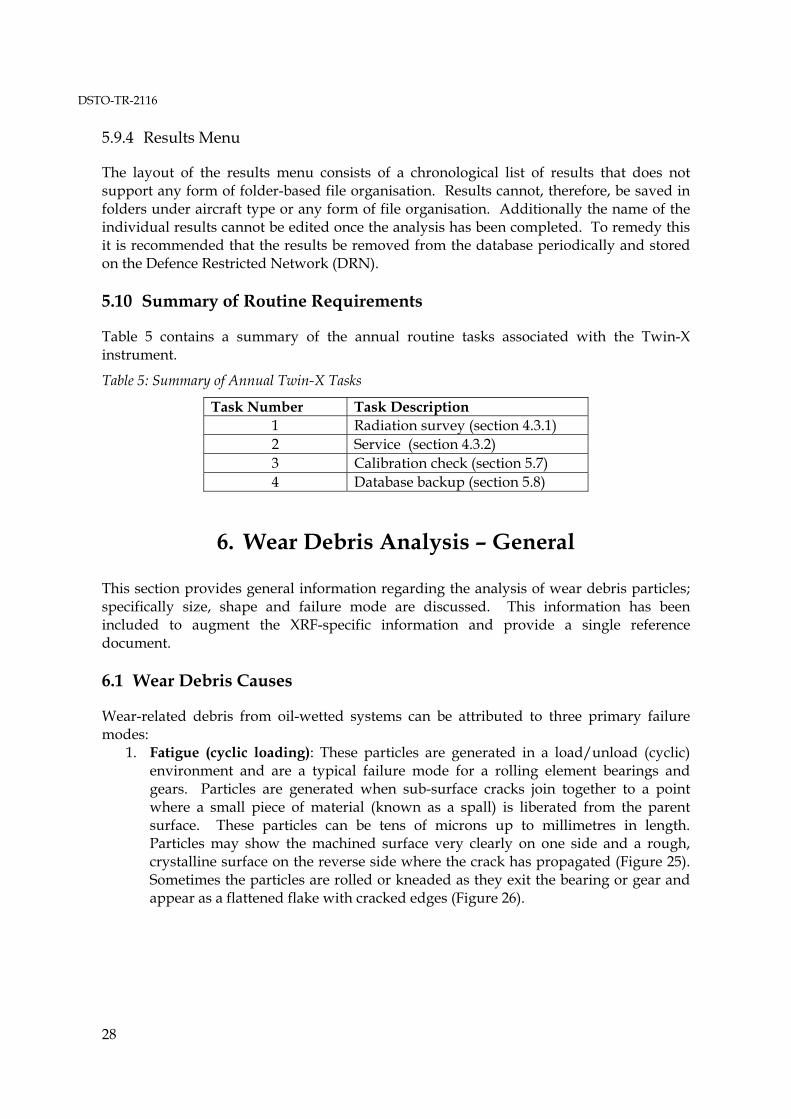
2. Abrasive (cutting): These particles result from hard contaminant particles entering the lubricating film. They become embedded in one surface and then act like a cutting tool on the opposing surface. The contaminants are usually dirt, sand or corrosion products. The resulting debris has the appearance of fine metal shavings similar to machining swarf (but much smaller). A typical feature of this type of particle is the curlicue shape (Figure 27).
DSTO-TR-2116
30
Figure 27: Typical abrasive wear debris showing characteristic curlicue shape [25]
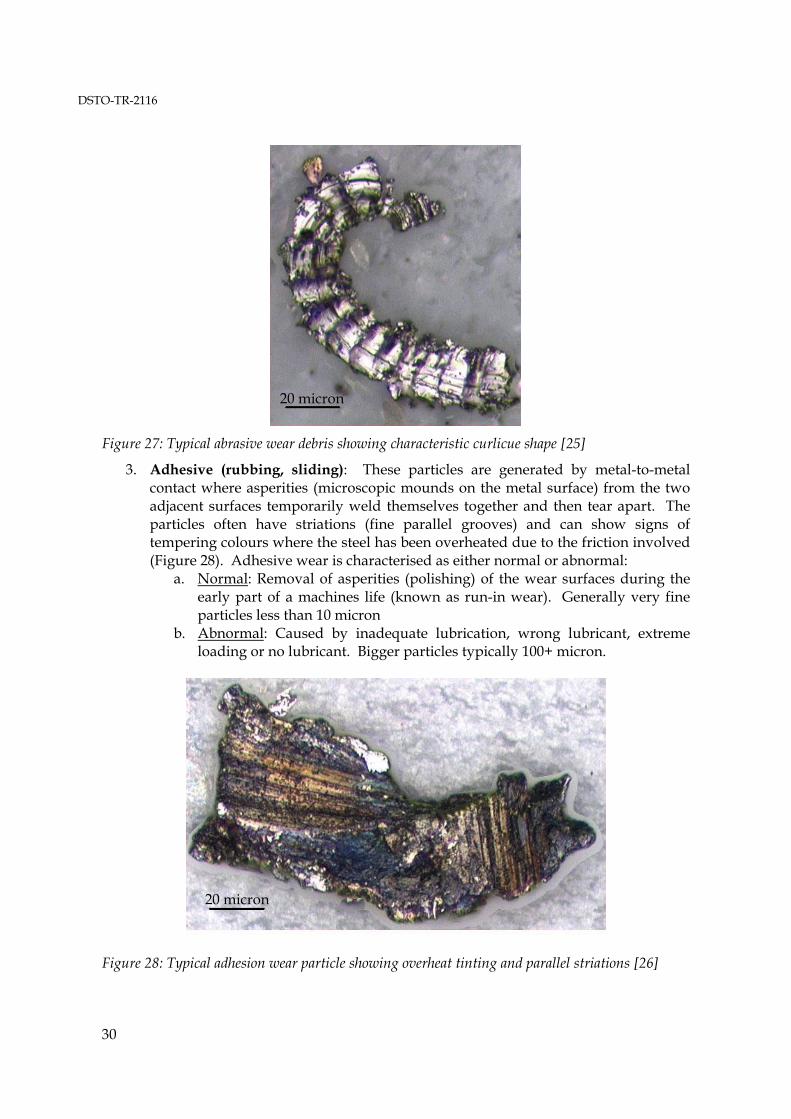
3. Adhesive (rubbing, sliding): These particles are generated by metal-to-metal contact where asperities (microscopic mounds on the metal surface) from the two adjacent surfaces temporarily weld themselves together and then tear apart. The particles often have striations (fine parallel grooves) and can show signs of tempering colours where the steel has been overheated due to the friction involved (Figure 28). Adhesive wear is characterised as either normal or abnormal:
a. Normal: Removal of asperities (polishing) of the wear surfaces during the early part of a machines life (known as run-in wear). Generally very fine particles less than 10 micron
b. Abnormal: Caused by inadequate lubrication, wrong lubricant, extreme loading or no lubricant. Bigger particles typically 100+ micron.
Figure 28: Typical adhesion wear particle showing overheat tinting and parallel striations [26]
20 micron
20 micron

DSTO-TR-2116
31
In order to adequately assess wear debris, the size, shape (morphology) and composition need to be determined. Whilst the size and shape can be determined using standard optical techniques, the XRF is intended to provide the composition element of the analysis. 6.2 Ferrous Debris
Wear debris that is ferrous is generally the most significant from oil-wetted aircraft systems. In particular debris that can be positively identified as being bearing steel or gear steel is normally cause for rejection of the engine or gearbox. Because bearings and gears are exposed to cyclic forces the predominant failure mode is fatigue-generated spallation, however the spallation site can be initiated by abrasion (for example a hard sand particle trapped between two bearing surfaces) or adhesion (breakdown of the lubrication film to the point where micro-welding commences). A variety of stainless steels are also found in RAN helicopter oil-wetted machinery. Generally there are only subtle differences in alloying element concentration between the various AISI 300 series stainless steels and these will generally not be distinguishable using the XRF. A sample that presents high percentages of chromium (Cr) or high percentages of chromium (Cr) and nickel (Ni) compared to the iron (Fe) peak should be classified generally as stainless steel; Table 6 shows typical percentage ranges expected for stainless steels when analysed with the Twin-X XRF; note that the percentages are calculated using the formula in section 5.6.4.
Table 6: Expected ranges of chromium and nickel percentages for Twin-X-analysed stainless steels
Stainless Steel Expected range for chromium (Cr) using XRF estimation
(%)
Expected range for nickel (Ni) using XRF estimation
(%) AISI 302, 304, 321 16 – 20+ 7-11+ AISI 440C 16 - 20+ nil 6.3 Non-Ferrous Debris
The main types of non-ferrous metal found in oil-wetted aircraft systems are: 1. Aluminium alloys (i.e. shims, oil jets and tubes) 2. Magnesium alloys (i.e. gearbox housing material), and 3. Titanium alloys (i.e. planetary carriers in epicyclic gearboxes)
Plating materials such as silver (Ag) and cadmium (Cd) are also present in most oil-wetted systems, however the debris can retain some adhered parent material (usually ferrous) and therefore can appear to exhibit some ferromagnetism. 6.4 Procedures for Analysing Wear Debris
6.4.1 Overall Procedure
Generally the process of aircraft wear debris analysis involves:

DSTO-TR-2116
32
1. The extraction of debris from filter or chip detector 2. Microscopic examination to determine debris size (using optical microscope) and
assessment against any OEM limits. 3. The assessment of morphology (shape, colour and characteristics) 4. The assessment of metal composition (using either XRF or SEM/EDS)
6.4.2 Filter Debris
The analysis of filter debris from RAN helicopters has, in the past, been tedious requiring the filter element to be shipped to DSTO for analysis. An in-field method is suggested here to enable NASPO to assess filter debris on-site thus saving turn-around time. The recommended procedure is detailed in Appendix F. Whilst relatively crude by laboratory standards, DSTO have confirmed an exceptionally high capture rate of significant debris (close to 100% of debris above 60 microns 1). The debris is deposited on a 60 micron filterpatch and then the ferrous debris can then be separated by using a magnetic separator as shown in Appendix F. Large representative particles can then be removed from the bulk debris and analysed individually if required. Whilst the in-field method is effective, consideration should be given to full or partial automation of filter debris analysis. One example of modern equipment designed for this purpose is the GasTOPs Filtercheck unit. This instrument extracts the debris, provides a quantitative count of ferrous and non-ferrous debris and finally deposits the debris on a filter patch for further compositional analysis or microscopy if needed. The primary advantages of this type of equipment are:
1. The quantitative count of ferrous and non-ferrous debris can be trended and limits set.
2. The instrument can be used locally and negates the need for shipping filters to laboratories
3. No solvents are used; the device uses the lubricant as the agitation media. It should be noted that these units are currently used on US Navy aircraft carriers for monitoring of the EA-6B Prowler fleet [27]. This type of equipment would augment the Twin-X XRF and provide an enhanced machinery health assessment capability. 6.4.3 Magnetic Chip Detector Debris
Magnetic chip detector debris captured on the wear debris collection cards currently used in the RAN cannot be placed directly into the XRF sample holder. The gum and backing cardboard used for these cards contains zinc (Zn), calcium (Ca), iron (Fe) and Titanium (Ti) in sufficient quantities to influence the results. Figure 29 shows the spectrum for a blank wear debris collection card.
1 Test carried out by DSTO as part of an assessment of the PWC PT-6A engine filterpatch procedure.

DSTO-TR-2116
33
Figure 29: XRF spectrum of a blank chip detector debris collection card
To avoid any confusion it is recommended that debris be captured by clear adhesive tape (such as the Scotch 500 brand) and then adhered to the white waxy portion of the debris collection card as shown in Figure 30. The white waxy portion was originally intended as a sacrificial cover for the gummed segment of the card, however it is adequate for enabling the removal of debris adhered to sticky tape from the card for analysis. The debris can then be easily removed with the tape and inserted into the XRF for analysis. New cards with no gummed area are being introduced to replace the current cards. If debris has been captured on the gummed section of the cards, it will need to be removed and placed in an appropriate XRF sample holder prior to analysing. Figure 31 shows the debris and tape placed inside the XRF sample holder ready for analysis.
Figure 30: Chip detector debris collection card showing debris taped to white waxy strip of card
(right hand extremity)
Debris taped to white waxy strip

DSTO-TR-2116
34
Figure 31: XRF sample holder showing debris and tape in position
Several adhesive tapes were tested in the XRF and in the absence of the OEM recommended J-Lar X-ray transparent tape, a clear pressure sensitive tape (common ‘sticky tape’) is adequate. Figure 32 shows the spectrum obtained from a piece of clear pressure sensitive tape. The Scotch Magic Tape™ variety of tape produced by 3M could also be used, however a small quantity of titanium is present in this tape and could be misinterpreted; Figure 33 shows a spectrum from a piece of 810D Scotch ‘Magic Tape™’ for comparison. The peak labelled as palladium (Pd) is a product of the XRF process and does not represent a constituent of the tapes analysed.
Figure 32: XRF spectrum of a piece of transparent pressure sensitive tape ('sticky tape')

DSTO-TR-2116
35
Figure 33: XRF spectrum of a piece of Scotch 'Magic Tape'
7. Discussion
Assessment of the Twin-X XRF instrument has shown that it can determine the composition of wear debris. It has also been shown that the Twin-X XRF can provide an estimated percentage composition of the principal elements in typical aircraft alloys (both ferrous and non-ferrous). Whilst the method of estimating the percentage composition does not appear to be as accurate as SEM EDS technique, this does not hinder the final identification of metal type and probable origin. Further refinement of the composition estimation is an area that should be pursued by DSTO. Detailed instructions and procedures have been included herein so that this report can be used as a reference guide for ADF users of this instrument. Despite the depth of this report, it is recognized that DSTO would continue to have a role in ad-hoc advice regarding analytical results. Additionally, the instrument OEM (Oxford Instruments) may also need to be consulted for some aspects of the instrument’s use. This report provides the information and procedures to initiate the application of the XRF to WDA, however metal maps for new aircraft (such as the MRH 90) should be obtained and additions made to the existing metal maps for completeness. The current metal maps contain sufficient detail to enable identification of debris from the significant oil-wetted dynamic components. Having assessed the instrument in a laboratory environment, the instrument has now been transitioned to NASPO for use by suitably trained NASPO staff. The value of the instrument within NASPO should also be reviewed after a suitable period (possibly two years) so that the application of this type of instrument to other ADF aviation bases can be evaluated; in particular it is thought that an XRF instrument could provide a substantially

DSTO-TR-2116
36
cheaper (and simpler) replacement option for the extant SEM instruments currently used at RAAF Edinburgh and RAAF Richmond.
8. Conclusion
This report has described the application of the Twin-X XRF instrument to the identification of wear debris from aircraft oil-wetted systems. Specifically, the Twin-X has shown that it can identify the composition of the key types of wear debris encountered in aircraft oil-wetted systems. Also contained herein is a flow chart and metal maps that enable identification of the type of material and potential origin of the debris. This type of device is seen as a suitable contender for replacement of the relatively expensive SEM units currently in service in parts of the RAAF; it may also provide useful service in other ADF operational environments.
9. Recommendations
This report recommends that: 1. The Twin-X XRF purchased by the RAN be utilised by NASPO for wear debris
analysis. 2. Further investigation be conducted into complimentary equipment to simplify
filter debris analysis. 3. That a bench top XRF be considered by AESSO as a suitable contender for
replacement for the existing SEM equipment used at some RAAF bases. 4. XRF be considered for enhancing the effectiveness of WDA at operational bases
that currently do not have the capability to determine debris composition 5. DSTO continue to investigate refinements to the method for estimating the
percentage composition of alloying elements using the Twin-X software.
10. Acknowledgements
The author would like to acknowledge the assistance of the following people in completing this work: Mr Otto Aberle (NASPO), Mr Dave Beattie (NASPO), Mr Rohan Byrnes (DSTO AFE), Mr Bill Peters (NASPO), Mr Matthew Prowse (NASPO), Mr Peter Stanhope (DSTO), Mr Andrew Vivian (DSTO).
DSTO-TR-2116
37
11. References
1 Bhachu, R., Sayles, R. and Macpherson, P.B., The Influence of Filtration on Rolling Element Bearing Life, Mechanical Failures Prevention Group, National Bureau of Standards Special Publication 640 0083-1883, 1982. 2 Email Colin Bird (UK MOD MIG WDSL) to Andrew Becker (DSTO) dated 11 May 2007. 3 Bueche, F., Introduction to Physics for Scientists and Engineers, 4th edition, page 603, McGraw-Hill Book Company, 1986. 4 Oxford Instruments Pty Ltd, Twin-X Operator Manual, page 3. 5 Defence Safety Manual (SAFETYMAN), Volume 1, Part 4, chapter 1 Ionizing Radiation Safety, 2002. 6 ARPANSA Licence Conditions Handbook – Defence Handbook, RB-STD-20-01 Revision 0, Table 1, 18 May 2001. 7 ARPANSA Licence Conditions Handbook – Part 3: Standard Licence Conditions for Source Licences, RB-STD-25-01 Revision 1, Table K, 18 May 2001. 8 National Health & Medical Research Council (NHMRC) Radiation Health Series (RHS) Number 9, Code of Practice for Protection Against Ionizing Radiation Emitted form X-ray Analysis Equipment (1984), June 1985, Australian Government Publishing Service, Canberra, Australia. 9 SAFETYMAN Vol. 1, Part 4, Annex C to Chapter 1 paragraphs 18 & 19 10 SAFETYMAN Vol. 1, Part 4, Appendix 1 to Annex C to Chapter 1 paragraph 2. 11 ARPANSA Licence Conditions Handbook – Part 3: Standard Licence Conditions for Source Licences, RB-STD-25-01 Revision 1, Table K, 18 May 2001. 12 National Health & Medical Research Council (NHMRC) Radiation Health Series (RHS) Number 9, Code of Practice for Protection Against Ionizing Radiation Emitted form X-ray Analysis Equipment (1984), June 1985, Australian Government Publishing Service, Canberra, Australia. 13 Email from John Frederiksen (ARPANSA) to Hans Kirkpatrick (Defence Safety Policy & Programs) dated 25 March 2008. 14 Email from Eddie Latuta (Oxford Instruments) to John Frederiksen (ARPANSA) dated 20 March 2008. 15 Toms, A., Jordan, E., The Success of Filter Debris Analysis for J52 Engine Condition Based Monitoring, 41st AIAA, Tucson AZ, July 2005. 16 Whitlock, R., Humphrey, G., Churchill, D., The Path to Affordable Long Term Failure Warning: The XRF-Wear Monitor, NASA report 19980210899; AD-A348000, 1998. 17 Roylance, B. J., Hunt, T.M., The Wear Debris Analysis Handbook, Coxmoor Publishing, 1999. 18 Bhachu, R., Sayles, R. and Macpherson, P.B., The Influence of Filtration on Rolling Element Bearing Life, Mechanical Failures Prevention Group, National Bureau of Standards Special Publication 640 0083-1883, 1982. 19 Oxford Instruments Twin-X Operator Manual, page 4. 20 T700/CT7 Turboshaft Lube System Debris Analysis Book, GE Aircraft Engines, Lynn Massachusetts, January 1993. 21 DSTO Aircraft Engineering Support Investigation DSTO-DP-0793, 13 July 2003. 22 Bird, C., Wear Debris Monitoring – Sea King Transmissions, Brief prepared for DSTO by UK MOD Materials Integrity Group, undated (thought to be November 2003). 23 Email Colin Bird (UK MOD MIG) to Andrew Becker (DSTO) dated 8 April 2008 24 MATWEB material property data website, www.Matweb.com 25 Image sourced from the United Kingdom Ministry of Defence Syclops Wear Debris Atlas, part of AP 119A-20006-1, 3rd edition, dated September 2001.

DSTO-TR-2116
38
26 Image sourced from the United Kingdom Ministry of Defence Syclops Wear Debris Atlas, part of AP 119A-20006-1, 3rd edition, dated September 2001. 27 Toms, A. M. and Jordan, E. J., The Success of Filter Debris Analysis for J52 Engine Condition Based Maintenance, 41st AIAA conference, Tulsa, USA, July 2005.

DSTO-TR-2116
39
Appendix A: Radiation Survey Procedure
To conduct a radiation survey on the Twin-X XRF instrument the following procedure must be followed to ensure the unit operates at full power:
1. A background radiation measurement in the vicinity of the instrument should always be conducted immediately prior to any radiation survey of the Twin-X XRF to prevent false attribution of radiation source.
2. If the instrument is turned off, turn it on and leave it running for approximately 20 minutes before commencing the survey.
3. Log on to the Twin-X program. 4. From the Main Menu screen select Other Functions 5. Select the Advanced tab (this will usually appear as the default) 6. Select the Spectrum Scan option. 7. On the Spectrum Scan page, select the Change Conditions option 8. On the Change Conditions screen select the following:
a. Click on the Custom Condition option b. Select the PIN detector c. Set the Tube voltage to 29 d. Set the Tube current to 100 e. Click OK
Figure A34: Spectrum Scan screen showing key parameters for radiation survey
9. The Spectrum Scan screen will now appear. Click Start. A prompt will appear for
a sample name. Type in Radiation Survey and then click on OK.
DSTO-TR-2116
40
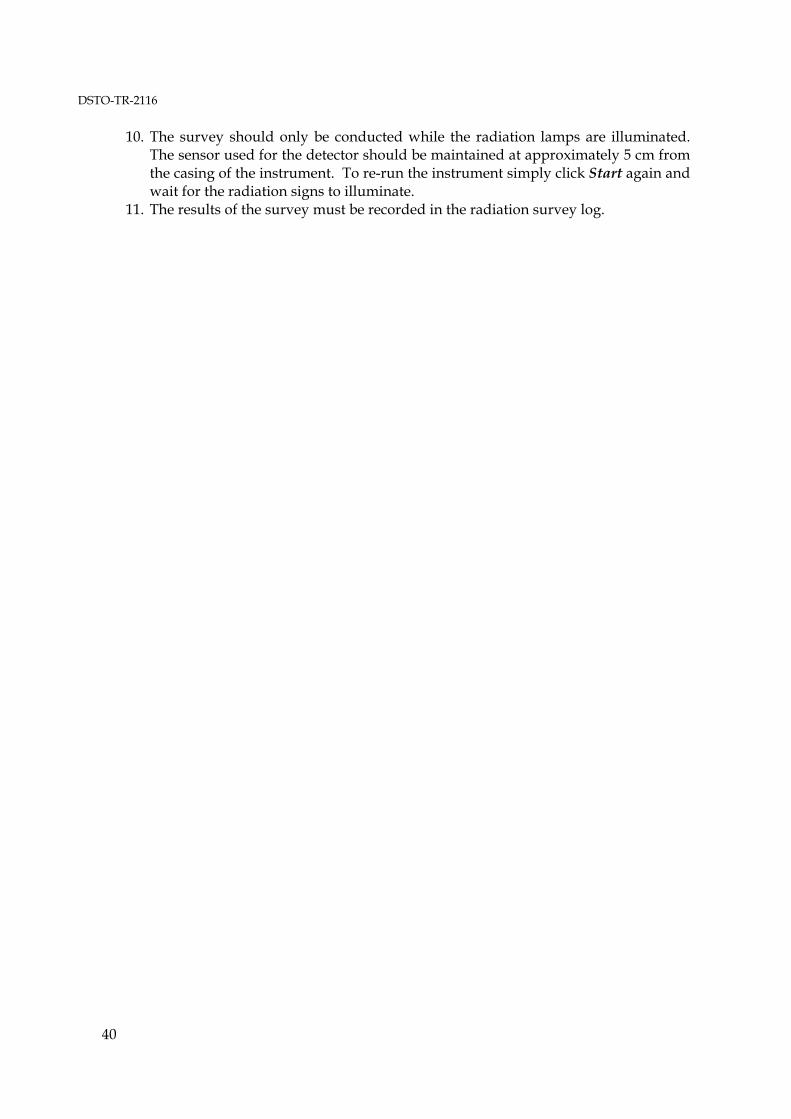
10. The survey should only be conducted while the radiation lamps are illuminated. The sensor used for the detector should be maintained at approximately 5 cm from the casing of the instrument. To re-run the instrument simply click Start again and wait for the radiation signs to illuminate.
11. The results of the survey must be recorded in the radiation survey log.

DSTO-TR-2116
41
Appendix B: Metal Identification Flow chart for Twin-X XRF
YES NO
Is chromium (Cr) greater than 0.5%?
YES
Probably M50 bearing steel Confirm with presence of
molybdenum (Mo) (See note 3 below)
NO
YES NO
YES NO
Is nickel (Ni) the dominant peak?
YES
Probably 718 Inco Confirm by presence of chromium
(Cr) and niobium (Nb)
NO
Is titanium (Ti) the dominant peak?
YES
Probably Ti-6Al-4V titanium alloy
Confirm by presence of vanadium (V)
NO
Is copper (Cu) the dominant peak?
YES NO
Is iron (Fe) the dominant peak?
Probably low alloy or mild steel Check for presence of other elements.
See note 2 below.
Are Chromium (Cr) AND
vanadium (V) present?
Is the percentage chromium (Cr) greater than 12%?
Is chromium (Cr) the only identifiable alloying element
(apart from iron (Fe))
YES
Probably 440C stainless steel
NO

DSTO-TR-2116
42
Notes:
1. This flow chart has been produced based on Seahawk (also applicable to Black Hawk) and Sea King helicopter oil-wetted lubrication systems. The alloys shown do, however represent the significant alloys found in the majority of ADF aircraft. Where a specific metal is not shown here but is known to be an important indicator for a particular aircraft, DSTO should be consulted to produce a modified chart to encompass the new metal.
2. Some bearings in Sea King gearboxes (in particular the Tail rotor Take Off (TTO) bearing in the MRGB) have low levels of alloying elements (less than 0.5%). It is therefore recommended that debris classified in this section of the flow chart be sent for laboratory analysis.
3. To confirm the presence of molybdenum (Mo) the Mo spectrum should be retrieved rather than the V-Zn spectrum (see section 5.4 step 4 for more information).
Is nickel (Ni) present?
YES
Probably stainless steel: • 302 • 304 • 321 Confirm with presence of nickel (Ni)
NO
Probably 9310 gear steel, 4320 steel, 4340 steel, S156
steel or S96 steel
Probably aluminium (Al) alloy:
• 356 aluminium alloy • 6061 aluminium alloy
Either: • Brass - confirm with
strong zinc (Zn) peak • Bronze - confirm with tin
(Sn) or lead (Pb) • 791 bronze – confirm
with 4% zinc (Zn), 4% lead (Pb) and 4% tin (Sn).
• ZE41A-T5 magnesium alloy - confirm with zinc (Zn), neodymium (Nd) and zirconium (Zr). Use Focus 5 sensor to confirm magnesium (Mg) is present (see section 5.4.3)
• 7075 aluminium alloy – confirm with chromium (Cr), iron (Fe) and zinc (Zn). Use Focus 5 sensor to confirm aluminium (Al) is present (see section 5.4.3)
Probably 4130 steel or S106 steel
Is manganese (Mn) present?
YES NO
Probably 52100 steel

DSTO-TR-2116
43
Appendix C: Seahawk/Black Hawk Metal Map
C.1. Engines
Material Composition Item Description Part Number Material Element % Weight
Bearings AISI M50 steel Fe Min 87.42 Cr 3.75 - 4.25 Mo 4.0 - 4.5 V 0.9 – 1.1 Other < 1 each Bearing cage 4340 steel (silver plated) Fe 96 Ni 1.83 Cr 0.7-0.9 Mn 0.7 Other < 1 each Residual machining swarf
Inco 718 Ni 50 -55
Cr 17 – 21 Fe 17 Nb 4.75 – 5.5 Mo 2.8 – 3.3 Other < 1 each Residual machining swarf
321 stainless steel Fe 69
Cr 17 Ni 11 Mn 2 Other < 1 each Locknuts in sumps Silver plating Ag > 90 Static sump seals Silver braze alloy2 Ag unknown Cu unknown Zn unknown
2 Exact composition is unknown for this alloy but is thought to contain silver (Ag), copper (Cu) and zinc (Zn). This material is easily identifiable using visual inspection as fine golden strands up to 20mm in length.

DSTO-TR-2116
44
C.2. Main Module
Material Composition Item Description Part Number Material Element % Weight
Bearings AISI M50 steel Fe Min 87.42 Cr 3.75 - 4.25 Mo 4.0 - 4.5 V 0.9 – 1.1 Other < 1 each Bearings SAE 52100 steel Fe 97 Cr 1.45 Other < 1 each Gears AISI 9310 steel Fe 94 Ni 3.25 Cr 1.2 Other < 1 each Shafts, nuts, clips 4340 steel Fe 96 Ni 1.83 Cr 0.7 – 0.9 Mn 0.7 Other < 1 each Shafts, nuts, clips 4130 steel Fe 97.3 – 98.2 Cr 0.8 – 1.1 Mn 0.4 – 0.6 Housings ZE41A-T5 Mg alloy Mg 94 Zn 3.5 – 5 Nd 0.75 – 1.75 Zr 0.4 – 1 Other < 1 each Planetary plate Ti-6Al-4V Ti alloy Ti 87.6 – 91 Al 5.5 – 6.75 V 3.5 – 4.5 Other < 1 each Jets, tubes & shims 6061-651 Al alloy Al 95.8 – 98.6 Mg 0.8 – 1.2 Other < 1 each Bushings Oilite Bronze Cu 87.5 – 90.5 Sn 9.5 – 10.5

DSTO-TR-2116
45
C.3. Intermediate Gearbox
Material Composition Item Description Part Number Material Element % Weight
Gears AISI 9310 steel cadmium (Cd)/silver (Ag) plated
Fe 94
Ni 3.25 Cr 1.2 Other < 1 each Bearings unknown C.4. Tail Rotor Gearbox
Material Composition Item Description Part Number Material Element % Weight
Gear 70358-06620-101 AISI 9310 steel cadmium (Cd)/silver (Ag) plated
Fe 94
70358-06620-102 Ni 3.25 70358-06619-101 Cr 1.2 Other < 1 each Retention plate 70358-06612-102 Ti-6Al-4V Ti alloy Ti 87.6 – 91 70357-06616-101 Al 5.5 – 6.75 V 3.5 – 4.5 Other < 1 each Bearings SB3314-101, -201 Unknown SB3266-102, -201 SB3353-101, -201 Housings 70358-26610-101 ZE41A-T5 Mg alloy Mg 94 70358-06606-102 Zn 3.5 – 5 Nd 0.75 – 1.75 Zr 0.4 – 1 Other < 1 each Bearing Liners/Sleeves
70358-06334-103, -104
4320 (Timken tube) Fe 96
70358-06307-108 Ni 1.83

DSTO-TR-2116
46
70358-06307-109 Mn 0.55 70358-06307-110 Cr 0.5 70358-06307-111 70358-06307-112 Other < 1 each 70358-06307-113 70357-06111-101 70357-06311-101 Inboard retention plate shim
70102-11110-041 7075 aluminium alloy Al 87.1 – 91.4
Zn 5.1 – 6.1 Mg 2.1 – 2.9 Cu 1.2 – 2 Washers/spacers 70358-06327-102 4340 steel Fe 96 70358-06323-102 Ni 1.83 70357-06311-102 Cr 0.7 – 0.9 70358-06334-103 Mn 0.7 70358-06334-104 Other < 1 each 70357-06311-101 Nuts, sleeves, studs
NAS509-5 4130 cadmium (Cd) plated
Fe 97.3 – 98.2
70358-06327-102 Cr 0.8 – 1.1 70358-06324-102 Mn 0.4 – 0.6 REA-048 SFJ101-13SA11A SFJ101-13SA10A RJ17135A-10

DSTO-TR-2116
47
Appendix D: Sea King Metal Map
D.1. Engines
Material Composition Item Description Part Number Material Element % Weight
Bearings unknown Auxiliary gears unknown D.2. Main Rotor Gearbox
Material Composition Item Description Part Number or description
Material Element % Weight
Gears AISI 9310 (also known as AMS 6265)
Fe 94
Ni 3.25 Cr 1.2 Other < 1 each Bearings Most MRGB
bearings and freewheel units
SAE 52100 steel Fe 97
Cr 1.45 Other < 1 each TTO roller Timken bearing steel
SAE 8719 Fe 97.6-98.4
Mn 0.6-0.8 Ni 0.4-0.7 Cr 0.4-0.6 Mo 0.2-0.3 TTO roller Timken bearing steel
SAE 4619 Fe 97
Ni 1.83 Mn 0.55 Other <0.5 TTO roller Timken bearing steel
SAE 8119 Fe 99
Cr 0.4 Ni 0.3 Mo 0.12

DSTO-TR-2116
48
Bearing retainers, liners, quill shaft, seal housings and
spacers
BS S96 steel Fe 94.3-95.9
Ni 2.3-2.8 Cr 0.5-0.8 Mn 0.45-0.7 Mo 0.45-0.65 Freewheel roller bearing
BS S106 steel (with SAE 52100)
Fe 94.1-95.8
Cr 3.0-3.5 Mo 0.5-0.7 Mn 0.4-0.7 Input pinion spur gear and bearing
BS S156 steel Fe 93
Ni 4.2 Cr 1.2 Other <1% Accessory gearbox git seal
WSS34-2
18/8 stainless (use 304 SS spectrum)
Fe 68
Cr 18 Ni 8 Mn 2 Other <1 % Epicyclic thrust washer
S6135-20676
SAE 791 copper (also known as UNS C54400
Cu 88
Zn 4 Sn 4 Pb 4 D.3. Intermediate Gearbox
Material Composition Item Description Part Number Material Element % Weight
Gears unknown Bearings Input outboard
(WSB3206) SAE 8119 steel Fe 99
Cr 0.4

DSTO-TR-2116
49
Ni 0.3 Mo 0.12 SAE 8719 steel Fe 97.6-98.4 Mn 0.6-0.8 Ni 0.4-0.7 Cr 0.4-0.6 Mo 0.2-0.3 Input inboard
(WSB3253) SAE 8019 steel unknown
Input inboard
(WSB3253) SAE 8719 steel Fe 97.6-98.4
Mn 0.6-0.8 Ni 0.4-0.7 Cr 0.4-0.6 Mo 0.2-0.3 Output inboard
(WSB3209) SAE 8019 steel unknown
Output inboard
(WSB3209) SAE 8119 steel Fe 99
Cr 0.4 Ni 0.3 Mo 0.12 Output outboard
(WSB3206-041) SAE 8719 steel Fe 97.6-98.4
Mn 0.6-0.8 Ni 0.4-0.7 Cr 0.4-0.6 Mo 0.2-0.3 D.4. Tail Rotor Gearbox
Material Composition Item Description Part Number Material Element % Weight
Gears unknown Bearings Input outboard
(WSB3160) SAE 8019 steel unknown
Input inboard
(WSB3208) SAE 8019 steel unknown

DSTO-TR-2116
50
Output inboard
(WSB3400) SAE 8219 steel unknown
SAE 8119 steel Fe 99 Cr 0.4 Ni 0.3 Mo 0.12 SAE 8719 steel Fe 97.6-98.4 Mn 0.6-0.8 Ni 0.4-0.7 Cr 0.4-0.6 Mo 0.2-0.3 Output
intermediate (WSB3306)
Unknown
Output outboard
(WSB1120-1) Unknown
Bearing liners BS S96 steel Fe 94.3-95.9 Ni 2.3-2.8 Cr 0.5-0.8 Mn 0.45-0.7 Mo 0.45-0.65
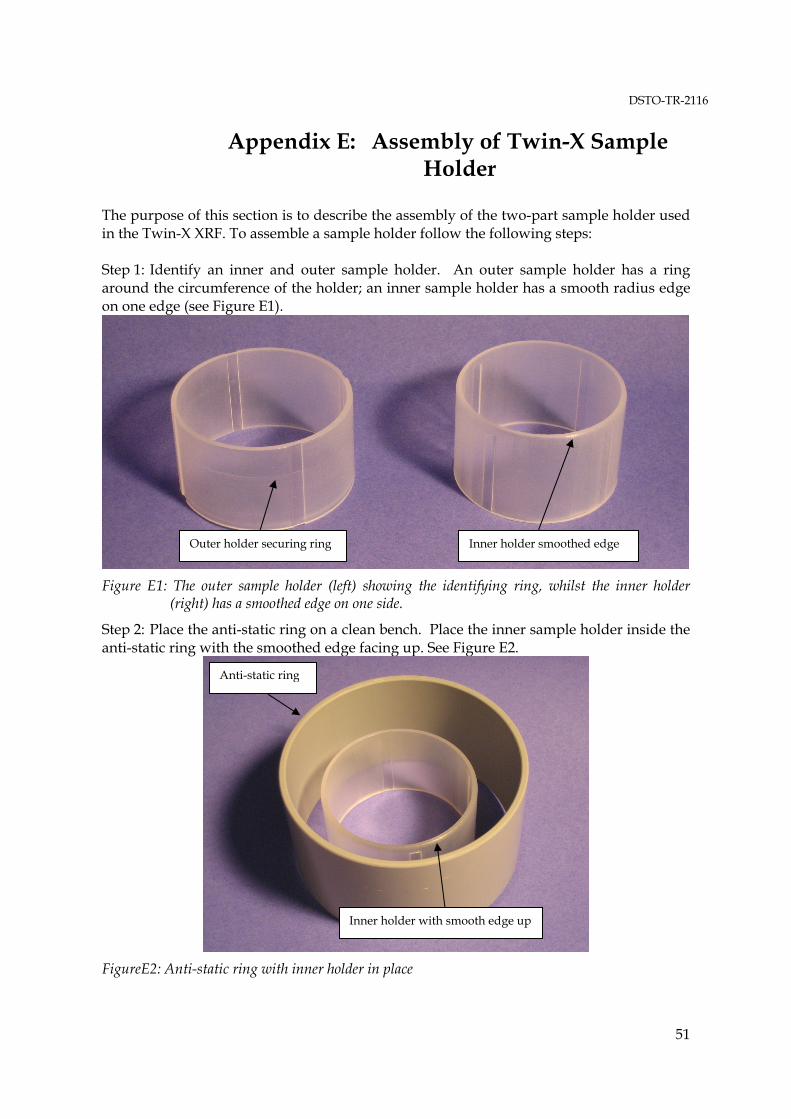
DSTO-TR-2116
51
Appendix E: Assembly of Twin-X Sample Holder
The purpose of this section is to describe the assembly of the two-part sample holder used in the Twin-X XRF. To assemble a sample holder follow the following steps: Step 1: Identify an inner and outer sample holder. An outer sample holder has a ring around the circumference of the holder; an inner sample holder has a smooth radius edge on one edge (see Figure E1).
Figure E1: The outer sample holder (left) showing the identifying ring, whilst the inner holder
(right) has a smoothed edge on one side.
Step 2: Place the anti-static ring on a clean bench. Place the inner sample holder inside the anti-static ring with the smoothed edge facing up. See Figure E2.
FigureE2: Anti-static ring with inner holder in place
Outer holder securing ring Inner holder smoothed edge
Inner holder with smooth edge up
Anti-static ring

DSTO-TR-2116
52
Step 3: Open the Poly 4 film box and carefully tear off a 50mm length of film. Do not drag the film over the serrated edge of the box as this will perforate the film. Unroll the film in an upwards direction first and then pull down over the serrated edge to cut the length required. See Figure E3.
Figure E3: Pull film up before tearing off over serrated edge.
Step 4: Place the film over the anti-static ring, then place the outer ring over the film and lower over the inner ring. The outer ring should have the securing ring uppermost. Continue to push down until a slight click is felt indicating the holder is assembled. No crinkles in the film should be present once the holders have clicked together. See Figure E4.
Figure E4: Outer holder being placed over the film and anti-static ring
Step 5: Remove the anti-static ring and the holder is now assembled and ready to accept a sample for analysis. Do not place holder film-side down on any surface once assembled as
Outer holder ring with securing ring uppermost

DSTO-TR-2116
53
contamination can adhere to the film and possibly confuse the analysis; always rest the holder with the film side uppermost. See Figure E5.
Figure E5: Removing anti-static ring after assembling sample holder.

DSTO-TR-2116
54
Appendix F: Filter Debris Extraction and Analysis Procedure
Step 1: Extract filter debris and deposit on a 60 micron filter patch. Finer filterpatches (i.e. 5 micron used with hydraulic fluid) should not be used as they will clog and obscure significant debris. Debris extraction can be achieved as follows:
1. Place rubber plugs in both ends of the filter element
2. Place filter element in a Nalgene plastic bottle half filled with a suitable solvent for
Mobil Jet Oil II (typically Isopropyl alcohol).
3. Replace Nalgene bottle lid and agitate (shake) for approximately 2 minutes. 4. Remove filter element from solvent slurry. Examine filter element to ensure any
large pieces of debris have been removed from the filter pleats. 5. Pass the slurry through a 60 micron nylon filter patch (Millipore part number
NY6004700) to capture all debris greater than 60 micron.
Fill to
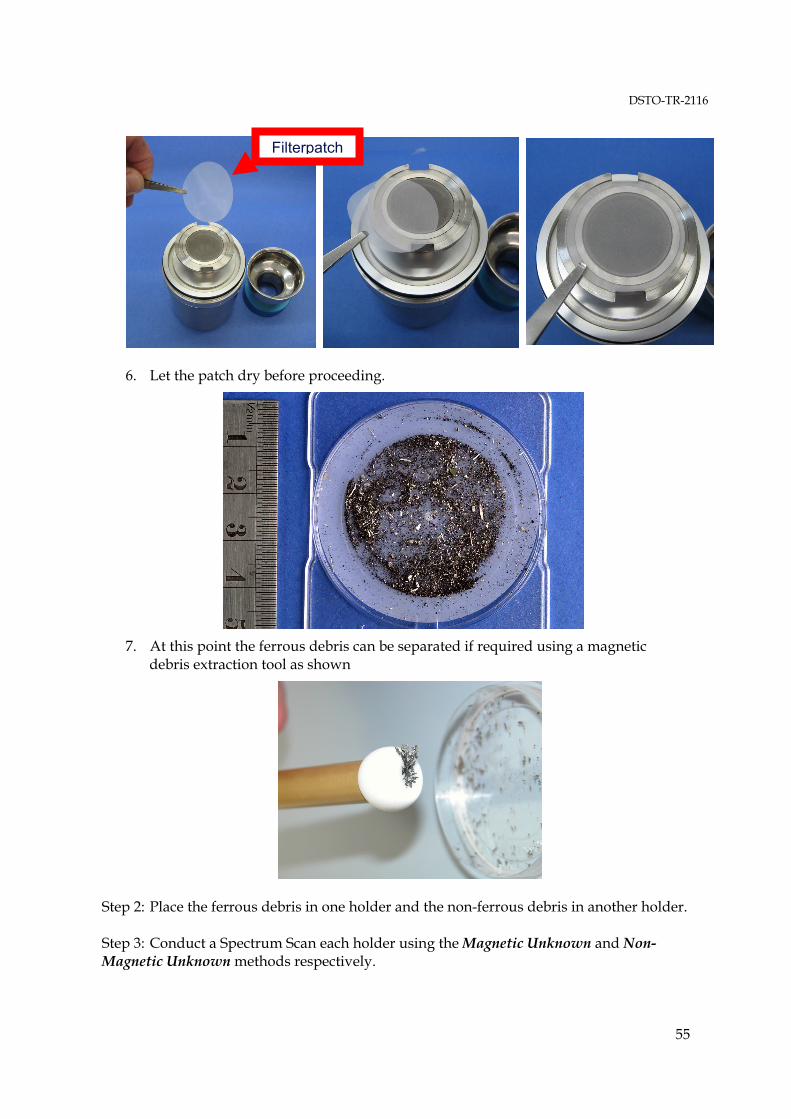
DSTO-TR-2116
55
6. Let the patch dry before proceeding.
7. At this point the ferrous debris can be separated if required using a magnetic
debris extraction tool as shown
Step 2: Place the ferrous debris in one holder and the non-ferrous debris in another holder. Step 3: Conduct a Spectrum Scan each holder using the Magnetic Unknown and Non-Magnetic Unknown methods respectively.
Filterpatch

DSTO-TR-2116
56
Step 4: Using an optical microscope select any large metallic particles for further individual analysis. Typically any metallic particles greater than 1 mm long (in any dimension) should be analysed. It may also be useful to analyse particles that are smaller but present in larger numbers. If possible collect a representative sample of the smaller but more prevalent debris and conduct an individual analysis. Step 5: Interpret the results, being particularly sensitive to bearing and gear steels.

Page classification: UNCLASSIFIED
DEFENCE SCIENCE AND TECHNOLOGY ORGANISATION
DOCUMENT CONTROL DATA 1. PRIVACY MARKING/CAVEAT (OF DOCUMENT)
2. TITLE Application of an X-ray Fluorescence Instrument to Helicopter Wear Debris Analysis
3. SECURITY CLASSIFICATION (FOR UNCLASSIFIED REPORTS THAT ARE LIMITED RELEASE USE (L) NEXT TO DOCUMENT CLASSIFICATION) Document (U) Title (U) Abstract (U)
4. AUTHOR(S) Andrew Becker
5. CORPORATE AUTHOR DSTO Defence Science and Technology Organisation 506 Lorimer St Fishermans Bend Victoria 3207 Australia
6a. DSTO NUMBER DSTO-TR-2116
6b. AR NUMBER AR-014-162
6c. TYPE OF REPORT Technical Report
7. DOCUMENT DATE April 2008
8. FILE NUMBER 2007/1156911/1
9. TASK NUMBER AIR 07/214
10. TASK SPONSOR NASPO
11. NO. OF PAGES 56
12. NO. OF REFERENCES 27
13. URL on the World Wide Web http://www.dsto.defence.gov.au/corporate/reports/DSTO-TR-2116.pdf
14. RELEASE AUTHORITY Chief, Air Vehicles Division
15. SECONDARY RELEASE STATEMENT OF THIS DOCUMENT
Approved for public release OVERSEAS ENQUIRIES OUTSIDE STATED LIMITATIONS SHOULD BE REFERRED THROUGH DOCUMENT EXCHANGE, PO BOX 1500, EDINBURGH, SA 5111 16. DELIBERATE ANNOUNCEMENT No Limitations 17. CITATION IN OTHER DOCUMENTS Yes 18. DSTO RESEARCH LIBRARY THESAURUS http://web-vic.dsto.defence.gov.au/workareas/library/resources/dsto_thesaurus.shtml Naval Helicopters, Wear, Materials characterisation, Spectroscopy 19. ABSTRACT This report describes the application of an X-ray Fluorescence (XRF) instrument to determine the composition of wear debris collected from helicopter magnetic chip detectors and oil filters. The Twin-X XRF (assessed in this report) is a commercially produced bench-top XRF and has not previously been applied to wear debris analysis of Australian Defence Force aircraft. The primary aim is to establish its ability to identify the composition of wear debris locally (i.e. at the operational base level). This will enable timely and informed decisions to be made regarding maintenance action following magnetic chip detector indications or oil filter bypass events. This report has shown that the Twin-X XRF is capable of providing valuable information about the composition of wear debris from aircraft oil-wetted systems.
Page classification: UNCLASSIFIED