application of an integrated petrophysical evaluation approach to
TRANSCRIPT

SPWLA 2nd
India Regional Symposium, November 19-20, 2009
1
APPLICATION OF AN INTEGRATED PETROPHYSICAL
EVALUATION APPROACH TO NORTH AMERICAN SHALE
GAS RESERVOIRS
Matt Bratovich
1 and Duane A. Sommer
1
1Baker Hughes Incorporated, Houston, Texas
Copyright 2009, held jointly by the Society of Petrophysicists and
Well Log Analysts (SPWLA) and the submitting authors.
This paper was prepared for presentation at the 2nd SPWLA India
Regional Symposium held in Mumbai, India, Nov 19-20, 2009.
______________________________________________________
ABSTRACT
Unconventional shale gas reservoir development has
rapidly increased over the last several years throughout
North America. Shale gas wells must be hydraulically
fracture stimulated to produce at economic rates and
horizontal wells are routinely utilized to maximize well
productivity.
Successful formation evaluation of these reservoirs
must address petrophysical, geomechanical and
geochemical properties of the rock. An integrated
petrophysical approach has been developed using
multiple logging technologies to: characterize reservoir
lithology and mineralogy, porosity, quantify the total
organic carbon (TOC) content, calculate a gas in place
(GIP) volume, identify and characterize fractures and
describe the total reservoir stress regime and rock
mechanical properties. A methodology has also been
developed using geochemical measurements to identify
lithofacies within the shale reservoir. By incorporating
geomechanical analyses with lithofacies determination
the intervals that are the most preferable for fracture
initiation as well as those most unfavorable can be
identified. These results are designed to allow an
operator to select the optimum horizontal lateral
location and identify the preferred lithofacies for
fracture initiation.
This paper is intended to provide an overview of the
usage of the technologies in the integrated approach;
which include resistivity, density, neutron, cross dipole
acoustic, magnetic resonance, acoustic and resistivity
imaging, mineral spectroscopy, spectral gamma ray and
core analyses. The references cited provide detailed
descriptions and explanations of the methodology
developed and used in specific North American shale
plays. Examples from some of the well known North
American shale plays illustrate the use of this integrated
approach.
INTRODUCTION
Shale gas reservoirs have over the last three to five
years emerged as the most active exploration and
development plays in North America. Figure 1
illustrates the geographic locations of shale basins in the
US. While many of these basins have had only limited
exploration, significant exploration and production
activity is taking place in the Marcellus, Haynesville,
Woodford, Fayetteville, and Barnett Shales. Exploration
is occurring at a rapid pace. The map in Figure 1 was
published in April 2009 but one of the newest plays is
not even on it; the Eagleford Shale in South Texas. In
addition to these US shale plays the Horn River Shale
and Montney Shale plays in western Canada are also
very active.
Organic shales have not always been a significant
exploration target. The first shale gas production in the
US took place in 1821 when a well was drilled to a
depth of 70 feet into the Upper Devonian Dunkirk shale
in Fredonia, New York (Ref. 1.). However, it was not
until two significant technological innovations were
introduced in the Barnett Shale play by Mitchell Energy
(purchased by Devon in 2002) that extensive
exploration and development of shale reservoirs across
North America began in earnest. Both of these
innovations resulted in larger well gas productivities. In
1997 Mitchell began using slickwater hydraulic
fracturing in the Barnett Shale. That technique was able
to effectively fracture a much larger volume of rock
than the previous approaches at a reduced cost. In 2002
Devon began experimenting with horizontal wells,
drilling 9 that year. By late 2003 to early 2004
horizontal drilling was being used by many Barnett
B

2nd
SPWLA-India Symposium, November 19-20, 2009
2
Shale operators. The technique often more than doubled
well productivities.
By the end of 2007 gas production from all
unconventional reservoirs provided 48% of the total US
gas production. Projections indicate that by 2020 they
will be providing roughly 69% of the total production
(Ref.2.). As indicated in Figure 2, the biggest
contribution to this increase is expected to come from
shale gas reservoirs.
Numerous industry, government and academic
researchers have conducted studies in several shale
basins to determine the geochemical, geologic,
petrophysical and geomechanical characteristics of each
shale gas reservoir. An additional goal of these studies
was to identify the critical formation evaluation
parameters that must be quantified in order to determine
if a specific shale well or play will be commercial.
Examining this collective research showed that while
each shale play is unique they share some common
characteristics. Shale gas reservoirs can generally be
described as dark grey to black organic shales with a
kerogen (TOC) content greater than 1% (usually much
higher). These reservoirs serve as both the source of the
gas as well as the reservoir rock. Gas is present both as
free gas in the shale as well as adsorbed gas associated
with the kerogen. Natural fractures play a role in
productivity of these reservoirs but their relative
importance varies from basin to basin. Often based on
our experience with conventional reservoirs, we tend to
expect a shale lithology to be rock having a high clay
content. Shale can also be defined as a fine grained
sedimentary rock composed of clay sized material.
Generally, the shale gas reservoirs in North America
meet the second definition. They are not composed
primarily by clay minerals but rather mixtures of clay to
silt sized fractions of many minerals including quartz,
feldspars, calcite, dolomite, siderite, clays, pyrite and
organic matter (kerogen) (Figure 3).
One of the most significant shared characteristics of
shale gas reservoirs is that they must be hydraulically
fracture stimulated in order to produce at economic
rates. Increasingly these reservoirs are being developed
using horizontal laterals. Using conventional
petrophysical evaluation methods it is difficult to
predict the success of a stimulation or completion
strategy. Operators need an approach which will assist
them in maximizing well productivity by designing and
implementing an effective stimulation program and
optimizing the location and orientation of the horizontal
lateral in the reservoir section (Ref. 5.).
DESCRIPTION OF THE INTEGRATED
PETROPHYSICAL APPROACH
Over a three year period an integrated approach was
developed which utilizes a variety of wireline, and or
LWD, technologies including resistivity, density,
neutron, cross dipole acoustic, nuclear magnetism,
acoustic and resistivity imaging, mineral spectroscopy,
spectral gamma ray and core analyses (Ref.5.). The
methodology has been successfully utilized by
operators in several different North American shale
plays including the Barnett Shale (Ref.5, Ref.6), the
Haynesville Shale (Ref.6, Ref.7), the Woodford Shale
(Ref. 8) the Marcellus Shale and the Eagleford Shale.
Figure 4 illustrates the technologies utilized and the
evaluation objectives each technology addresses
LITHOLOGY & MINERALOGY
The primary technology in the determination of
lithology and mineralogy utilized by the integrated
approach consists of a combination of a pulsed neutron
and a natural gamma ray spectroscopy tools. These
geochemical instruments investigate the inelastic,
capture and natural gamma ray energy spectra to obtain
elemental yields and weight fractions of various
elements including Al, C, Ca, Fe, Gd, K, Mg, S, Si, Th,
Ti and U. Lithology and mineralogy are then
determined by an expert system which uses the
elemental weight fractions from the geochemical
measurements as input. (Ref. 9, Ref. 10). Currently
eighteen minerals are quantified: illite, smectite,
kaolinite, chlorite, glauconite, apatite, zeolites, halite,
anhydrite, hematite, pyrite, siderite, dolomite, calcite,
K-feldspar, plagioclase, quartz and organic carbon,
which is identified either as kerogen, coal, or oil (Ref. 8,
Ref. 10).
Analysis of actual rock samples can provide
independent verification of the interpreted mineral
composition. Both X-Ray diffraction analyses, which
measure the amount of specific minerals in a rock
sample and X-Ray fluorescence analyses which
measure the amount of specific elements in a rock
sample are routinely obtained. Because of the
significant difference in the scale of the core analyses
measurements and the volume of rock measured by the
pulsed neutron and spectral gamma ray devices we do
not “calibrate” or force fit the interpreted results to
these analyses. Instead the analyses are used in a
comparative manner to confirm that the suite of
minerals as well as the relative amounts of each mineral
calculated from the logging measurements are
consistent with those measured from the rock samples.
B

SPWLA 2nd
India Regional Symposium, November 19-20, 2009
3
If discrepancies occur they are investigated and the
logging tool responses, processing methodology and
borehole environmental parameters and mud chemistry
information are all re-examined. Figure 5 shows a
comparison of XRD and XRF analyses to the pulsed
neutron measured elemental weights and computed
mineral composition for a sandstone reservoir (Ref. 9).
Various researchers conducted detailed geologic and
mineralogic studies utilizing wireline log data, detailed
geologic description and extensive core analyses from
whole core for individual shale gas reservoirs. They
identified lithofacies which are characterized by
differences in mineral composition, the amount of
kerogen present, depositional environment and changes
in the mechanical properties of the shale such as
brittleness or ductility of the rock. As shale gas
reservoirs must be hydraulically fractured to produce
economically, identifying the lithofacies which are most
favorable for gas production and fracture initiation and
discriminating the most unfavorable lithofacies is
critical for maximizing well productivity. In several of
the shale plays studied the most favorable lithofacies
was identified as a siliceous mudstone, characterized by
higher amounts of quartz which increased the
brittleness of the rock (Ref. 5, Ref. 7 and Ref. 8)
Using only the chemistry and mineralogic results
obtained from the pulsed neutron and spectral gamma
ray tools we were able to identify lithofacies in shale
gas reservoirs for use in the integrated petrophysical
model (Ref. 5, Ref. 7, Ref. 8 and Ref. 10). It should be
kept in mind however that there is no “typical” shale
gas reservoir mineralogy that is representative for all
plays and that the mechanical properties of a specific
lithofacies might be quite different between one shale
gas play and another. Figure 6 compares mineral
composition from four of the active US plays, the
Barnett Shale, Marcellus Shale, Eagleford Shale and the
Haynesville Shale (Each vertical division on the plots is
an incremental 10% weight fraction of the total matrix).
Observations: The Barnett Shale section has a much
higher percentage quartz content (50-70%) than the
other shales, while the Eagleford Shale has the highest
carbonate content (40-60%). The predominant clay type
in all these plays is illite/mixed layers although the
Marcellus Shale also has a 5-20% smectite component.
Examining the carbonates in the Marcellus Shale we see
more dolomite than in the other examples. The
Marcellus Shale also exhibits a more consistent pyrite
component.
TOC DETERMINATION
Increases in the amount of TOC present in a shale gas
well generally result in increased gas in place as
adsorbed gas is contained in the kerogen present in the
reservoir. Likewise increased well productivity also
generally correlates to increases in the net thickness of
the organic shale (Ref. 5). Several methods to determine
the amount of TOC present have been developed by the
industry using empirical relationships to various
conventional log responses such as resistivity, bulk
density and total gamma ray. However the accuracy of
these empirical approaches is often reduced by the
variable mineralogy present within a shale reservoir
(Ref. 5, Ref. 10). The integrated petrophysical approach
provides two independent measurements of TOC (Ref.
5, Ref. 8). A direct measurement of TOC is obtained
from the elemental carbon weight fraction measured in
the inelastic gamma ray energy spectrum by the pulsed
neutron mineral spectroscopy tool. The amount of the
measured carbon which is associated with the organic
material is calculated by subtracting the amount of
carbon required as a component of the inorganic
minerals determined by the expert system.
CTOC = Ctotal measured – CCalcite computed - CDolomite computed -
CSiderite computed
A second TOC calculation is made using NMR porosity
and fluid density measurements, the bulk density and
the expert system (mineralogic) derived inorganic
matrix density. The calculation is as follows:
1
fluidb
gr
TOCm
grm
TOCV
TOCm
grm
gr
TOCTOCm
Where
ρb is the bulk density
ρgr is the total grain density including inorganic
and organic matrix constituents
Ø is the NMR total porosity
ρfluid is the density of pore filling fluid, determined
from NMR fluid typing
VTOC is the volume fraction of organic matrix
components
mTOC is the mass fraction of organic matrix
components
B

2nd
SPWLA-India Symposium, November 19-20, 2009
4
ρTOC is the density of organic matrix components,
determined from core and/or computed
mineralogic TOC calibration
ρm is the density of inorganic matrix
components, determined using mineralogy
from geochemical logs
POROSITY AND GIP CALCULATION
Typical shale gas reservoir porosities are low, often in
the range of 3 to 6 %. Porosity calculations from
neutron and density measurements may have significant
uncertainties due to the variable mineralogies and the
variable amounts of low density organic material
present in these reservoirs. In the integrated
petrophysical approach porosity is preferably derived
from the NMR, which is not affected by lithologic or
mineralogic variations. Comparison of NMR total
porosities to core porosities in several shale plays has
shown good agreement (Ref. 8).
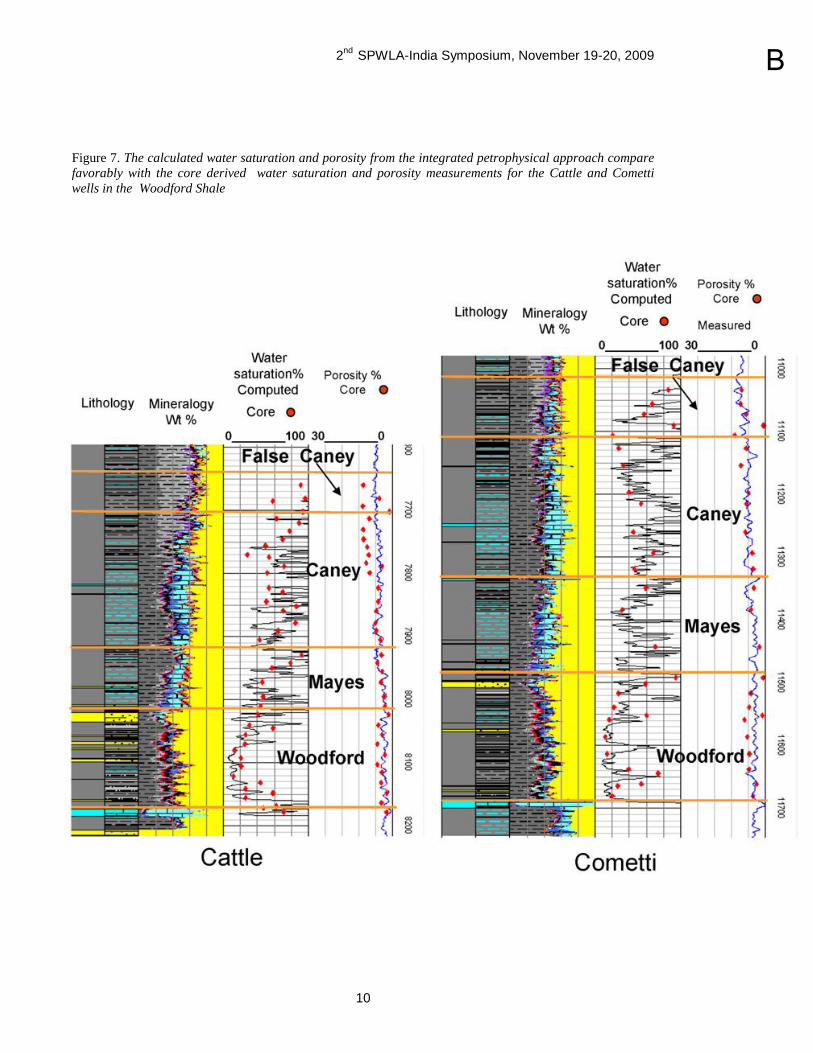
The gas-in-place determination in shale gas reservoirs
has two components, the free gas calculation and the
adsorbed gas calculation. In the thermogenic shale gas
reservoirs we have studied the free gas component is
felt to be the most significant. This may not be the case
in biogenic shale gas reservoirs. The free gas
calculation is made using a conventional Archie
petrophysical methodology; calculating water saturation
from measured resistivities with porosity derived from
the NMR device. Figure 7 shows the comparison of this
technique to core measured porosity and water
saturations for two wells in the Woodford Shale (Ref. 8).
GEOLOGIC CHARACTERIZATION
Most shale gas reservoirs have some degree of natural
fractures. Borehole imaging devices are utilized to
characterize the natural fracture networks, identifying
their orientation, determining if the fractures are open
or mineralized and discriminating between natural and
drilling induced fracturing. Major structural elements
such as faulting and unconformities must also be
located in order to evaluate the risk of water influx from
underlying formations after hydraulic fracturing.
GEOMECHANICAL ANALYSES
Detailed geomechanical analyses are required in order
to maximize well productivity in shale gas reservoirs.
Complete characterization of the in-situ stress
magnitudes and orientations is necessary to design
effective hydraulic fracturing and horizontal well
orientation strategies. In addition there are significant
differences in the mechanical properties of shale
lithofacies that are related to changing mineral
composition and amounts of organic material present.
In order to optimize the hydraulic fracturing
effectiveness the most favorable intervals to initiate
fractures must be identified. In the integrated
petrophysical approach in-situ geomechanical rock
properties are computed by integrating geochemistry,
mineralogy, NMR, density and acoustic analyses.
Standard dynamic mechanical properties including
Young’s Modulus and Poisson’s ratio are computed
from cross dipole acoustic and density log inputs.
Overburden and pore pressure gradients and the
maximum and minimum horizontal stress magnitudes
are computed. The orientations of the horizontal
stresses are derived from examination of the borehole
stress environment from image log and acoustic
anisotropy interpretation.
Shale gas reservoir researchers had determined that
differences in the mechanical properties of the shale
resulted from differences in the mineral composition.
In addition to the derivation of the “standard” dynamic
mechanical constants the integrated petrophysical
approach constructs a rock model based on the
variations in the mineralogy, TOC content and NMR
porosity. This model is then used in conjunction with
the stress regime information by a proprietary software
code called Logging Mechanical Properties (LMPTM
)
that emulates static mechanical properties including
Young’s modulus, Poisson’s ratio and compressive
strengths (at user specified confining pressures). A
minimum horizontal stress is also calculated (Ref. 7,
Ref. 5, Ref. 8). The workflow of the LMPTM
model is
illustrated in Figure 8.
SHALE LITHOFACIES UTILIZATION
As described earlier, in the integrated petrophysical
approach, shale lithofacies have been identified using
chemistry and mineralogic inputs. One of the objectives
of doing this is to locate the lithofacies that are most
favorable for gas recovery, have excellent TOC content
and brittleness. Often this is the siliceous mudstone
facies. The number and type of lithofacies may vary
from one shale gas play to another. Currently we have
validated lithofacies for the Barnett Shale, Woodford
Shale and Haynesville Shale and are developing models
for other shale plays. When the lithofacies information
is integrated with the geomechanical static properties
analyses, fracture indicators are calculated. Using a
“stop light” identification technique, the zones in a
given well that are most favorable for fracture initiation
B

SPWLA 2nd
India Regional Symposium, November 19-20, 2009
5
are flagged green and those that are the most
unfavorable flagged red When evaluated in context with
the other reservoir parameters the fracture indicators
and lithofacies flags can be utilized to recommend the
optimal location to place a horizontal lateral well or
evaluate probable hydraulic fracture design
effectiveness (Ref. 5, Ref. 7, Ref.8). Figures 9&10
describe the lithofacies and fracture indicators
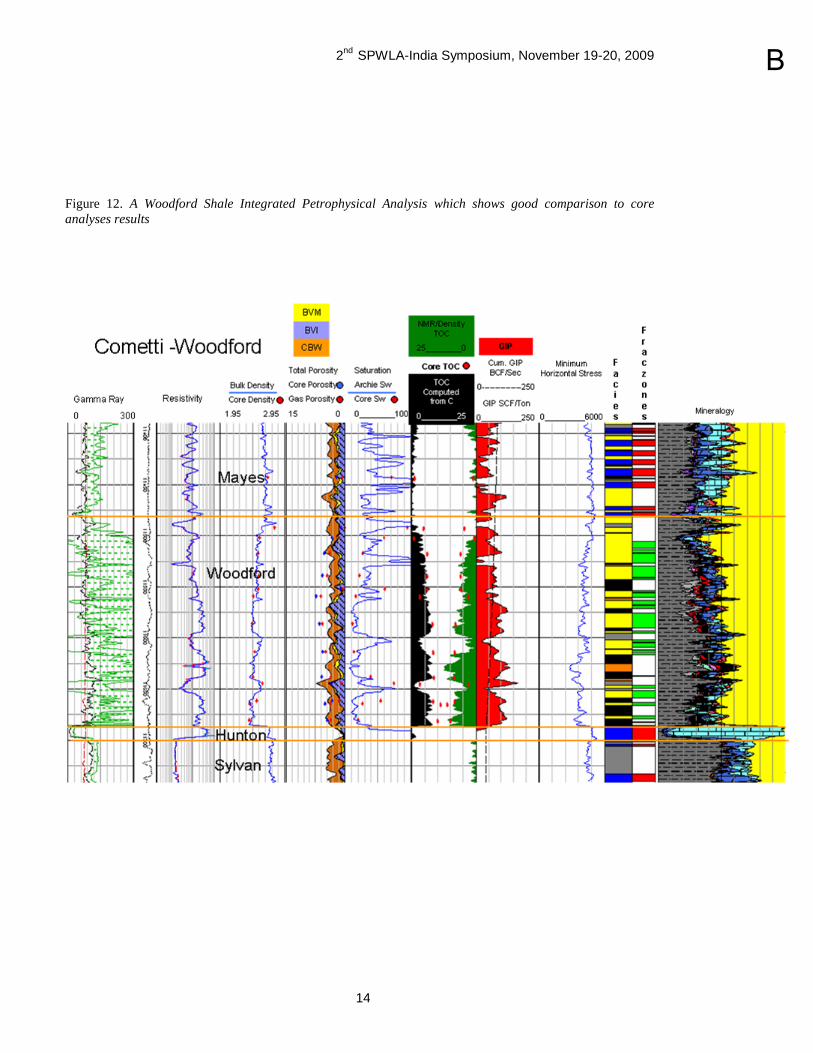
developed for the Barnett Shale (Ref. 5). Figures 11&12
describe the lithofacies and fracture indicators
developed for the Woodford Shale (Ref. 8).
CONCLUSIONS
An integrated petrophysical approach to evaluate shale
gas reservoirs has been developed which provides
advanced mineralogy, direct measurement of the TOC
content and detailed geomechanical analyses. The
methodology has been applied to several shale gas plays
in North America and can be used to assist in effective
hydraulic fracture stimulation design and optimizing the
location of horizontal laterals within shale reservoirs.
ACKNOWLEDGEMENTS
I need to acknowledge the numerous geoscientists and
engineers who were involved in the development of the
technical methodologies used in this approach and the
operating companies who allowed the interpreted
results their shale gas wells to be included.
REFERENCES
1. Hill, D., Lombardi, T., Martin, J., “Fractured
Shale Gas Potential in New York”,
Northeastern Geology and Environmental
Sciences, Vol. 26. p.8 2004
2. Givens, N., Hanqing, Z., “The Barnett Shale:
Not so simple after all”, AAPG Annual
Convention and Exhibition, 2004
3. Vidas, H., Hugman, B., “Availability,
Economics and Production Potential of North
American Unconventional Natural Gas
Supplies”, INGAA Foundation, 2008
4. Bowker, K, “The Barnett Shale Play of North
Texas: Myths Exposed, Truths Revealed”,
SPWLA Topical Conference, Canada, March
2005
5. Jacobi, D., Gladkikh, M., LeCompte, B.,
Hursan, G., Mendez, F., Longo, J., Ong, S.,
Bratovich, M., Patton, G., Shoemaker, P.,
“Integrated Petrophysical Evaluation of
Shale Gas Reservoirs”, SPE -114925-PP,
2008
6. Sommer, D., Pavlovic, M., “An Integrated
Approach to Shale Gas Evaluation”,
AAPG Annual Convention and Exhibition,
Denver, 2009
7. LeCompte, B., Franquet, J., Jacobi, D.,
“Evaluation of Haynesville Shale Vertical
Well Completions with a Mineralogy
Based Approach to Reservoir
Geomechanics”, SPE 124227, 2009
8. Jacobi, D., Brieg, J., LeCompte, B., Kopal,
M., Hursan, G., Mendez, F., Bliven, S.,
Longo, J., “Effective Geochemical
Characterization of Shale Gas Reservoirs
from the Wellbore Environment: Caney and
the Woodford Shale”, SPE 12431, 2009
9. Pemper, R., Sommer, D., Guo, P., Jacobi, D.,
Bliven, S., Rodriguez, E., Mendez, F., Han,
X., “A New Neutron Sonde for
Derivation of Formation Lithology and
Mineralogy”, SPE 102770, 2006
10. Pemper, R., Han, X., Mendez, F., Jacobi, D.,
LeCompte, B., Bratovich, M., Feuerbacher,
G., Bruner, M., Bliven, S., “The Direct
Measurement of Carbon in Wells Containing
Oil and Natural Gas Using a Pulsed
Neutron Mineralogy Tool”, SPE 124234,
2009
B

2nd
SPWLA-India Symposium, November 19-20, 2009
6
FIGURES
Figure 1. The Barnett, Haynesville, Woodford and Marcellus Shales are among the current most active shale
plays in the United States
Figure 2. Most of the projected increase in unconventional gas production is projected to come from shale
gas reservoirs
B

SPWLA 2nd
India Regional Symposium, November 19-20, 2009
7
Figure 3. The Barnett Shale is jet black in color, has a high percentage of Quartz and is over 91% clay sized particles
B

2nd
SPWLA-India Symposium, November 19-20, 2009
8
Figure 4. Shale gas petrophysical evaluation requires not only a variety of logging technologies but also
rock samples and a suite of core analyses
Figure 5. The comparison of log determined chemistry and mineralogy to core XRF and XRD analyses
results shows good agreement
B

SPWLA 2nd
India Regional Symposium, November 19-20, 2009
9
Figure 6. There is no “TYPICAL” Shale gas reservoir mineral composition. Significant variations can be seen between these
for active North American shale plays
B
2nd
SPWLA-India Symposium, November 19-20, 2009
10
Figure 7. The calculated water saturation and porosity from the integrated petrophysical approach compare
favorably with the core derived water saturation and porosity measurements for the Cattle and Cometti
wells in the Woodford Shale
B

SPWLA 2nd
India Regional Symposium, November 19-20, 2009
11
Figure 8. The LMPTM
workflow used in the integrated petrophysical approach provides mechanical rock properties that
incorporates changing mineral composition
Figure 9. Barnett Shale Lithofacies were developed and validated that allow the most favorable shale intervals to be identified
B

2nd
SPWLA-India Symposium, November 19-20, 2009
12
Figure 10. A Barnett Shale Integrated Petrophysical Analysis illustrating the use of lithofacies and frac
indicators for selection of horizontal lateral location
B

SPWLA 2nd
India Regional Symposium, November 19-20, 2009
13
Figure 11. Woodford Shale Lithofacies were also identified
B
2nd
SPWLA-India Symposium, November 19-20, 2009
14
Figure 12. A Woodford Shale Integrated Petrophysical Analysis which shows good comparison to core
analyses results
B