application note - digchipapplication-notes.digchip.com/027/27-46097.pdf · application note march...
TRANSCRIPT

Intel® IQ80310 DevelopmentToolsApplication Note
March 11, 2002
Document Number: 273664-001

2 Application Note
Intel® IQ80310 Development Tools
Information in this document is provided in connection with Intel® products. No license, express or implied, by estoppel or otherwise, to any intellectualproperty rights is granted by this document. Except as provided in Intel's Terms and Conditions of Sale for such products, Intel assumes no liabilitywhatsoever, and Intel disclaims any express or implied warranty, relating to sale and/or use of Intel products including liability or warranties relating tofitness for a particular purpose, merchantability, or infringement of any patent, copyright or other intellectual property right. Intel products are notintended for use in medical, life saving, or life sustaining applications.
Intel may make changes to specifications and product descriptions at any time, without notice.
Designers must not rely on the absence or characteristics of any features or instructions marked “reserved” or “undefined.” Intel reserves these forfuture definition and shall have no responsibility whatsoever for conflicts or incompatibilities arising from future changes to them.
The Intel® IQ80310 may contain design defects or errors known as errata which may cause the product to deviate from published specifications.Current characterized errata are available on request.
Intel® internal code names are subject to change.
Contact your local Intel sales office or your distributor to obtain the latest specifications and before placing your product order.
Copies of documents which have an ordering number and are referenced in this document, or other Intel literature may be obtained by calling1-800-548-4725 or by visiting Intel's website at http://www.intel.com.
Copyright© Intel Corporation, 2002
AlertVIEW, i960, AnyPoint, AppChoice, BoardWatch, BunnyPeople, CablePort, Celeron, Chips, Commerce Cart, CT Connect, CT Media, Dialogic,DM3, EtherExpress, ETOX, FlashFile, GatherRound, i386, i486, iCat, iCOMP, Insight960, InstantIP, Intel, Intel logo, Intel386, Intel486, Intel740,IntelDX2, IntelDX4, IntelSX2, Intel ChatPad, Intel Create&Share, Intel Dot.Station, Intel GigaBlade, Intel InBusiness, Intel Inside, Intel Inside logo, IntelNetBurst, Intel NetStructure, Intel Play, Intel Play logo, Intel Pocket Concert, Intel SingleDriver, Intel SpeedStep, Intel StrataFlash, Intel TeamStation,Intel WebOutfitter, Intel Xeon, Intel XScale, Itanium, JobAnalyst, LANDesk, LanRover, MCS, MMX, MMX logo, NetPort, NetportExpress, Optimizerlogo, OverDrive, Paragon, PC Dads, PC Parents, Pentium, Pentium II Xeon, Pentium III Xeon, Performance at Your Command, ProShare,RemoteExpress, Screamline, Shiva, SmartDie, Solutions960, Sound Mark, StorageExpress, The Computer Inside, The Journey Inside, This Way In,TokenExpress, Trillium, Vivonic, and VTune are trademarks or registered trademarks of Intel Corporation or its subsidiaries in the United States andother countries.
*Other names and brands may be claimed as the property of others.

Application Note 3
Intel® IQ80310 Development ToolsContents
Contents1.0 Introduction....................................................................................................................................7
1.1 Purpose ................................................................................................................................71.2 Intended Audience................................................................................................................71.3 Hardware Requirements.......................................................................................................71.4 Recommended Reading .......................................................................................................71.5 Before Beginning ..................................................................................................................8
2.0 Lab 1: Flash Recovery Utility (FRU)...........................................................................................10
3.0 Lab 2: ARM Boot Monitor ...........................................................................................................11
3.1 System Self-Tests...............................................................................................................123.2 Images in Flash ..................................................................................................................12
4.0 Lab 3: Using Metrowerks* CodeWarrior* ..................................................................................13
5.0 Lab 4: Using ARM Extended Debugger .....................................................................................15
6.0 Lab 5: Using ARM Boot Monitor to Load S-records (S-rec) ....................................................22
7.0 Lab 6: Using Redboot .................................................................................................................24
8.0 Lab 7: Using Redboot Monitor ...................................................................................................25
8.1 Error Codes ........................................................................................................................258.2 Reboot Memory Map ..........................................................................................................26
9.0 Lab 8: Using GNUPro Toolkit .....................................................................................................29
10.0 Lab 9: Example Using IPPs ........................................................................................................40
11.0 Lab 10: Using the Performance Monitor Unit (PMU) ................................................................44
12.0 Lab 11: Accessing Coprocessors ..............................................................................................46
13.0 Lab 12: Dynamic Frequency Change.........................................................................................48
14.0 Lab 13: Memory Management Unit (MMU) Architecture ..........................................................49

4 Application Note
Intel® IQ80310 Development ToolsContents
Figures
1 Intel® IQ80310 Evaluation Platform Board Memory Map ............................................................. 92 cyclone.mcp Screen ...................................................................................................................133 DeburRel Settings Screen .......................................................................................................... 144 Metrowerks CodeWarrior Prompt Pop-up Display......................................................................155 Choose Target Screen ............................................................................................................... 166 Remote Connection Screen (Initial View)................................................................................... 167 Remote Connection Screen (Selection View) ............................................................................ 178 AXD Debugger Screen ............................................................................................................... 199 DebugRel Settings Screen (Target Setting Select) ....................................................................2010 DebugRel Settings Screen (ARM fromELF Select) ....................................................................2111 DebugRel Settings Screen (ARM Linker Select) ........................................................................ 2312 Environmental Variables Screen ................................................................................................ 2913 Auto-Create Project Screen........................................................................................................ 3014 Project Editor - Soutce Navigator (test) Screen.......................................................................... 3115 Buld Settings Screen .................................................................................................................. 3216 Edit Target Screen (Project File Select) ..................................................................................... 3317 Edit Target Screen (Rules Select) ..............................................................................................3418 Build Rule Settings Screen......................................................................................................... 3519 Edit Target Screen...................................................................................................................... 3620 Build Test Screen ....................................................................................................................... 3721 blink.c Souce Window Screen .................................................................................................... 3822 Target Selection Screen (Run Software) .................................................................................... 3923 ippexample.mcp Screen ............................................................................................................. 4124 DebugRel Settings Screen (ARM C Compiler Select) ................................................................ 4225 Array Expansion Screen............................................................................................................. 4326 Register/Value Screen................................................................................................................ 4627 CPSR Screen ............................................................................................................................. 4728 Start Address Selection .............................................................................................................. 50
Tables
1 Boot-Loader Rotary Switch Settings............................................................................................. 8

Application Note 5
Intel® IQ80310 Development ToolsContents
Revision History
Date Revision Description
March 2002 001 Initial Release.

6 Application Note
Intel® IQ80310 Development ToolsContents
This page intentionally left blank.

Intel® IQ80310 Development ToolsIntroduction
Application Note 7
1.0 Introduction
1.1 Purpose
This document contains instructions for a user of the (Cyclone*) Intel® IQ80310 EvaluationPlatform Board (IQ80310), to become familiar with:
• Some of the development tools.
• For executing and debugging through sample code.
• To understand some of the enhanced features of the Intel® XScale™ microarchitecture (ARM*architecture compliant).
• Associated development tools.
1.2 Intended Audience
Any developer evaluating the Intel® IQ80310 Evaluation Platform Board.
1.3 Hardware Requirements
• IQ80310 and all accessories that come with the board.
• IQ80310 Backplane.
• ATX Power Supply (PSU).
• Old IDE Drive.
• PC Computer with PCI 2.1 Slot.
1.4 Recommended Reading
• Intel® XScale™ Core Developers Manual [273473].
• Intel® 80200 Processor based on Intel® XScale™ Microarchitecture Developer’s Manual [273411].
• Arm Architecture Reference Manual, Second Edition, Addison-Wesley: ISBN 0-201-73719-1

Intel® IQ80310 Development ToolsIntroduction
8 Application Note
1.5 Before Beginning
The IQ80310 is a software validation board for the Intel® 80310 I/O processor chipset (80310).
The board can be plugged into either a backplane or a desktop PCI slot.
When using a backplane, an ATX PSU is required.
Note: The IQ80310 only draws off the 3.3 V line of the power supply.
Most ATX PSUs regulate off the 5 V signal. When there is nothing drawing off the 5.5 V signalmost ATX PSU do not supply the 3.3 V correctly. This is noticed on the IQ80310, by the board notpowering On correctly, continuously resetting or hanging. To overcome this, it is recommend to puta load on the 5.5 V line of the PSU. An old IDE Hard drive can be used for this.
Important: When plugging the PSU into the backplane, make sure that the power supply is disconnected fromthe mains. Most ATX PSUs supply 5 V standby current even when turned Off, that could damagethe back plane.
The IQ80310 has a rotary switch to select which boot loader is used. Table 1 shows the related settings.
Table 1. Boot-Loader Rotary Switch Settings
Position Description
0 RedBoot* or VisionWear* Monitor or boot-loader for all RTOSs
1 RedBoot
2 Angel*
3 Angel
4 IxWorks*
5 VxWorks*
6 VxWorks
7 VxWorks
8 Bluecat*
9 HardHat*
A Nucleus*
B Intel-Reserved
C Intel-Reserved
D Intel-Reserved
E User Definable
F User Definable

Intel® IQ80310 Development ToolsIntroduction
Application Note 9
The memory map of the IQ80310 is shown in Figure 1:
Figure 1. Intel® IQ80310 Evaluation Platform Board Memory Map

Intel® IQ80310 Development ToolsLab 1: Flash Recovery Utility (FRU)
10 Application Note
2.0 Lab 1: Flash Recovery Utility (FRU)
The FRU allows re-programing and recovery of the content of the Flash memory on the IQ80310.
In order to reprogram and recover the content of the Flash, create a DOS boot diskette with FRUsoftware loaded on it. Here is how:
1. Loading a Flash image with the FRU:
a. Set board switch S3-1and S3-2 to the “On” position.
b. Reset the board.
c. Insert the IQ80310 Development CD in the CDROM.
d. Open the Board_FlashProgramming Folder.
e. Unzip the fruzip55.exe file and place it in a clean directory.
f. Execute install.exe and it builds a bootable floppy disc.
g. After this, the bootable floppy automatically runs the FRU program. Just insert the floppyinto the drive and reboot the system.
h. From the laptop, copy the image file that needs to be downloaded onto another floppy disk.
i. The image file required for the second lab is coyanosa.bin. It is located in theAFSv1_3/images/coyanosa.
Coyanosa.bin is a pre-complied image of the Arm Firmware suit bootloader, and includesAngle.
j. From the PC, locate and download the bin file. Note there is no need to override the startaddress.
k. When finished, set the board switch S3-1 and S3-2 to the “Off” position.

Intel® IQ80310 Development ToolsLab 2: ARM Boot Monitor
Application Note 11
3.0 Lab 2: ARM Boot Monitor
The Arm boot monitor is a program that runs on the Flash of the development board andcommunicates to a host computer via the serial port. The Boot monitor has the ability to downloadimages to Flash or RAM and run them, as well as run self-diagnostic tests. The Boot Monitor isbased on the ARM µHal (hardware abstraction layer) and, is used to initialize the board andchipset. It also includes Angle. Angle is a debug monitor that runs communicates to ARMeXtended Debugger* (AXD).
ARM Boot monitor (i.e., Angle) arranges the IQ80310 memory map in the same manner as otherboard ports:
• RAM Starts at address 0
• Flash Starts at 64 Mb (address 0x0400 0000)
• Others Mapped to the same virtual address as their physical locations
The purpose of this lab is to create a Hyper Terminal Connection between the IQ80310 and the PC.In addition, some instructions are provided to become familiarized with the available commands inthe menu.
Before creating a Hyper Terminal Connection, set the rotary switch on the board to the number 2.
1. To create a Hyper Terminal Connection:
a. Select Start → Programs → Accessories → Communications → HyperTerminal
b. Enter a name (e.g., boot) and choose the first icon (the one in which two telephones aredisplayed) for your connection. Click OK.
c. On the next window confirm that the COM1 port is used for the connection by clickingOK.
d. On the COM1 properties window, select 115200 bits per second as the baud rate (leavethe rest of the settings as they are) and click OK.
e. The Hyper Terminal connection is ready.
2. Menu commands:
a. Power On the board.
b. The following message should appear on the Hyper Terminal window:
Note: If there are problems displaying the message above, try to reset the board.
c. Type “h” (or “?”) to view the available commands (Note: ARM boot PROM is NOT casesensitive).
ARM bootPROM [Version 1.3] Rebuilt on Apr 11 2001 at 10:39:40
Running on a Coyanosa Evaluation Board
Board Revision V1.0, XScale 80310 Processor
Memory Size is 32704KBytes, Flash Size is 8MBytes
Copyright (c) ARM Limited 1999 - 2001. All rights reserved.
Board designed by Intel(r)
Hardware support provided at http://www.intel.com/
For help on the available commands type ? or h
boot Monitor >

Intel® IQ80310 Development ToolsLab 2: ARM Boot Monitor
12 Application Note
3.1 System Self-Tests
This command enables the user to check the Hyper Terminal Connection.
a. Type “t” to run the tests. All six LEDs blink in sequence.
3.2 Images in Flash
This command enables a view of the Flash images:
a. Type “x” to enter the Cyclone menu.
b. Type “h” to view the commands in the Cyclone menu.
c. Type “v” to view the images in Flash.
d. Type “R 911” to run Angel.
Angel is now running and communications are ready with Angel, from the AXD debugger asdescribed in Section 5.0, “Lab 4: Using ARM Extended Debugger” on page 15.
Note: An alternate way to run Angle is to set the rotary switch to number 3 and power On the IQ80310.
e. Close the Hyper Terminal Connection.

Intel® IQ80310 Development ToolsLab 3: Using Metrowerks* CodeWarrior*
Application Note 13
4.0 Lab 3: Using Metrowerks* CodeWarrior*
The aim of this lab is to get familiarized with the Codewarrior for the ARM Developer Suite. Thesteps to achieve this involve creating a project, adding source files to the new project, adjust theprocessor settings and finally compile and link the files.
Before moving on, make sure the ARM Developer Suite is installed on the PC. If not, install it fromthe ARM Developer Suite CD provided.
Run Codewarrior:
1. Create a new project:
a. Click on File → New
b. Select ARM Executable Image
c. Enter Project name: Cyclone
d. Use Set button to create a project directory (directory containing files)
e. Click OK to create the project
2. Add source files to the new project
Note: The source files added include two header files that contain register address and constant definitions(blink.h and led.h respectively). They also include the led.c file which flashes corresponding values tothe card LEDs. Finally, blik.c is included (main file), which flashes “80310” on the IQ80310 LEDs.
a. The Intel® IQ80310 Development CD is in the C:\Xscale\IQ80310_CD folder.
b. Navigate through the following folders/files: IQ80310 Sample Code→ IQ80310 Example LED Applications → LED
c. Extract the led.c, led.h, blink.c and blink.h files in a project directory.
d. From the menu select: Project → Add files.
e. Navigate to the project directory containing files to be added.
f. Select the files and click Add.
g. The window is similar to the one in Figure 2 below:
Figure 2. cyclone.mcp Screen

Intel® IQ80310 Development ToolsLab 3: Using Metrowerks* CodeWarrior*
14 Application Note
3. Enter processor settings:
a. Go to dropdown window and select DebugRel.
b. Click on the icon to show the DebugRel Settings window.
c. From the DebugRel Settings highlight the ARM C Compiler.
d. Select Xscale from the Architecture or Processor dropdown window.
e. Your window should look like the one in Figure 3 below.
f. Click Save and close window.
4. Compile and link files:
a. From the menu select: Project → Make.
Figure 3. DeburRel Settings Screen

Intel® IQ80310 Development ToolsLab 4: Using ARM Extended Debugger
Application Note 15
5.0 Lab 4: Using ARM Extended Debugger
This lab is indented to introduce the AXD. To achieve this, the source files added to the previous labare debugged and run. In addition, some important options of the ARM debugger are highlighted.
1. Debug the program:
a. Set rotary switch on the board to the number 3 and reset the evaluation board.
b. From the menu select : Project → Enable Debugger.
c. Select : Project → Debug
d. If this message appears click yes.
e. The AXD Debugger window appears on your screen.
f. From the AXD Debugger menu select: Options → Configure Target.
Figure 4. Metrowerks CodeWarrior Prompt Pop-up Display

Intel® IQ80310 Development ToolsLab 4: Using ARM Extended Debugger
16 Application Note
g. Highlight the ADP Remote_A.dll and click on Configure.
h. This .dll is used to debug with Angle.
i. When the Configure windows appears.
j. Click on Select to choose a device and then select ARM Serial Driver and click on OK.
Figure 5. Choose Target Screen
Figure 6. Remote Connection Screen (Initial View)

Intel® IQ80310 Development ToolsLab 4: Using ARM Extended Debugger
Application Note 17
k. Back at the “Remote_A Connection” window click on Configure (Figure 7).
Figure 7. Remote Connection Screen (Selection View)

Intel® IQ80310 Development ToolsLab 4: Using ARM Extended Debugger
18 Application Note
Set the Baud Rate to 115200.
Click on OK until all the configuration windows have closed.
1. To run the program:
a. From the AXD menu select: Execute→ Go.
b. Repeat the previous step. The LEDs on the board flash “80310” although it is verydifficult to observe since the values change too fast.
c. Choose Execute -> stop, to stop the program.
2. Become familiar with the AXD Debugger:
a. Breakpoints can be used to break execution or to output a string when the breakpointconditions are satisfied. Highlight line 21 or 22 of the program.
b. Click on the Toggle Breakpoint icon (not the Breakpoints one). Run the program severaltimes and observe the LED display.
c. )Watch the registers’ context and the values of the variables by clicking the and theicon on the toolbar, respectively.
d. Right click on the mouse and select Interleave Disassembly. The corresponding assemblycode is displayed on the screen. The screen is similar to Figure 8 below.

Intel® IQ80310 Development ToolsLab 4: Using ARM Extended Debugger
Application Note 19
The default output format of the linker is ELF. ELF format contains code, symbols, debuginformation, and address information.
3. Now use the post linker to create a S-Rec object:
a. Go back to Metrowerks CodeWarrior.
b. Go to the debug release settings, and choose the target settings.
c. Select post-linker as “ARM fromELF”.
Figure 8. AXD Debugger Screen

Intel® IQ80310 Development ToolsLab 4: Using ARM Extended Debugger
20 Application Note
d. Now go to the “ARM fromELF” tab.
e. As an output format choose “Motorola* 32-bit Hex”.
This generates an S-record that is used in the next lab.
f. Now rebuild the project by selecting Project->make or Bring up to date.
Figure 9. DebugRel Settings Screen (Target Setting Select)

Intel® IQ80310 Development ToolsLab 4: Using ARM Extended Debugger
Application Note 21
Figure 10. DebugRel Settings Screen (ARM fromELF Select)

Intel® IQ80310 Development ToolsLab 5: Using ARM Boot Monitor to Load S-records (S-rec)
22 Application Note
6.0 Lab 5: Using ARM Boot Monitor to Load S-records(S-rec)
In the first lab, the procedure for loading an image using the FRU was described. In this lab images filesare transferred in the memory of the board, over the serial cable, using the Motorola S-record format.
Motorola S-record format was devised for the purpose of encoding programs or data files in aprintable (ASCII) format. This allows viewing of the object file with standard tools and easy filetransfer between a host and a target.
1. Set up terminal with Xon/Xoff.
2. Type M to start transfer to RAM.
3. Do ASCII Text Transfer (on hyper terminal – do transfer send text file).
4. Transfer cyclone.m32. This is the S-rec file you created in the previose lab.
Dots appear as each block is loaded:
Load Motorola S-Records into flash
The S-Record loader only accepts input on the serial port.
Type Ctrl/C to exit loader.
................................
................................
...................
The LED Blink program should now run.
Note: The same principle can be used to download images directly into memory using the L commandfrom ARM boot monitor, but the image must be recompiled to locate in the flash region ofmemory. This is done in the linker section.

Intel® IQ80310 Development ToolsLab 5: Using ARM Boot Monitor to Load S-records (S-rec)
Application Note 23
Figure 11. DebugRel Settings Screen (ARM Linker Select)

Intel® IQ80310 Development ToolsLab 6: Using Redboot
24 Application Note
7.0 Lab 6: Using Redboot
Using the FRU utility as in Lab1, download Redboot.
Redboot images are available pre-compiled on the IQ80310 CD.
There are four version of the image.
• For RedBoot running from the Flash boot sector: - cyclone-rom
• For RedBoot running from Flash address 0x40000: cyclone-roma
• For RedBoot running from RAM with RedBoot in the Flash boot sector: - cyclone-ram.bin
• For RedBoot running from RAM with ARM bootloader in the Flash boot sector: -cyclone-rama.bin
For this lab use the ROMA image.

Intel® IQ80310 Development ToolsLab 7: Using Redboot Monitor
Application Note 25
8.0 Lab 7: Using Redboot Monitor
Redboot is the Red Hat Embedded debug and bootstrap. It features Serial and Network downloadand debug. It also includes a simple Flash file system.
Before moving on, rotate the rotary switch to the number 0, and reset the board.
Description: terminal emulator runs on host and communicates with the board via the serial cable.
Start: Power up the target board. While the 'reset' is asserted, the two 7-segment LEDs se-quentially display “88”, “02”, “66” and “01”. When RedBoot is successfully booted,it displays the characters “01” on the LEDs. If the final state of “01” does not occur,reset the processor again.
The time for reset is approximately 1 or 2 seconds.
8.1 Error Codes
RedBoot uses the two digit LED displays to indicate errors during board initialization. Possibleerror codes are:88 - Unknown Error
55 - I2C Error
FF - SDRAM Error
01 -No Error
Redboot turns On the MMU and uses virtual memory as shown in Section 8.2, “Reboot MemoryMap” on page 26:

Intel® IQ80310 Development ToolsLab 7: Using Redboot Monitor
26 Application Note
8.2 Reboot Memory Map
Physical Address Range Description
----------------------- ----------------------------------
0x00000000 - 0x00000fff flash Memory
0x00001000 - 0x00001fff 80312 Internal Registers
0x00002000 - 0x007fffff flash Memory
0x00800000 - 0x7fffffff PCI ATU Outbound Direct Window
0x80000000 - 0x83ffffff Primary PCI 32-bit Memory
0x84000000 - 0x87ffffff Primary PCI 64-bit Memory
0x88000000 - 0x8bffffff Secondary PCI 32-bit Memory
0x8c000000 - 0x8fffffff Secondary PCI 64-bit Memory
0x90000000 - 0x9000ffff Primary PCI IO Space
0x90010000 - 0x9001ffff Secondary PCI IO Space
0x90020000 - 0x9fffffff Unused
0xa0000000 - 0xbfffffff SDRAM
0xc0000000 - 0xefffffff Unused
0xf0000000 - 0xffffffff 80200 Internal Registers
Virtual Address Range C B Description
----------------------- - - ----------------------------------
0x00000000 - 0x00000fff Y Y SDRAM
0x00001000 - 0x00001fff N N 80312 Internal Registers
0x00002000 - 0x007fffff Y N flash Memory
0x00800000 - 0x7fffffff N N PCI ATU Outbound Direct Window
0x80000000 - 0x83ffffff N N Primary PCI 32-bit Memory
0x84000000 - 0x87ffffff N N Primary PCI 64-bit Memory
0x88000000 - 0x8bffffff N N Secondary PCI 32-bit Memory
0x8c000000 - 0x8fffffff N N Secondary PCI 64-bit Memory
0x90000000 - 0x9000ffff N N Primary PCI IO Space
0x90010000 - 0x9001ffff N N Secondary PCI IO Space
0xa0000000 - 0xa0000fff Y N flash
0xa0001000 - 0xbfffffff Y Y SDRAM
0xc0000000 - 0xcfffffff Y Y Cache Flush Region
0xf0000000 - 0xffffffff N N 80200 Internal Registers

Intel® IQ80310 Development ToolsLab 7: Using Redboot Monitor
Application Note 27
The first-level page table is located at 0xa000 4000. Two second-level tables are also used. Onesecond-level table is located at 0xa000 8000 and maps the first 1 MB of Flash. The othersecond-level table is at 0xa000 8400, and maps the first 1 MB of SDRAM.
1. To connecting with the Hyper Terminal:
a. In the existing Hyper Terminal Connection, go to Files → Properties → Configure →Port Settings.
b. The port settings are as follows:
- Bits per second: 115200
- Data bits: 8
- Parity: None
- Stop bits: 1
- Flow control: None
c. In order to start the Hyper Terminal Connection, select Call → Call from the HyperTerminal panel.
d. Reset the IQ80310d.
e. The Host screen reads:
RedBoot(tm) debug environment - built 17:13:00, Dec 11 2000
Platform: IQ80310 (XScale)
Copyright (C) 2000, Red Hat, Inc.
RAM: 0xa0000000-0xa2000000
FLASH: 0x00000000 - 0x00800000, 64 blocks of 0x00020000 bytes each.
IP: 192.168.0.1, Default server: 0.0.0.0
RedBoot>

Intel® IQ80310 Development ToolsLab 7: Using Redboot Monitor
28 Application Note
After booting the initial installation of RedBoot, this warning may be printed:
FLASH configuration checksum error or invalid key
For the moment do not worry, this warning is dealt with later.
1. IQ80310 Hardware Tests:
This section of the lab ensures correct hardware behaviour of the IQ80310.
a. Type “h” or “?” to view the available commands.
b. Type “diag” to view the list of diagnostics tests available.
c. Become familiar with the: Memory Tests(1), 7-Segment LED Tests (5), BackplaneDetection Test (6) and the External Timer Test (8).
d. Type “0” to exit the diagnostics tests.
2. Initialize the Flash memory:
The warning mentioned previously in this lab (FLASH configuration checksum error orinvalid key) is normal and indicates the Flash must be configured for use by RedBoot. Evenwhen the above message is not printed, it may be a good idea to reinitialise the Flash anyway.Do this with the fis init command as shown below:
Followed by the fconfig command (Note: The Local IP address, the Default server IP addressand the GDB connection port need to be filled in by the user):
RedBoot> fis init
About to initialize [format] FLASH image system - are you sure (y/n)? y
*** Initialize FLASH Image System
Warning: device contents not erased, some blocks may not be usable
... Unlock from 0x007e0000-0x00800000: .
... Erase from 0x007e0000-0x00800000: .
... Program from 0xa1fd0000-0xa1fd0400 at 0x007e0000: .
... Lock from 0x007e0000-0x00800000: .
RedBoot> fconfig
Run script at boot: false
Use BOOTP for network configuration: false
Local IP address: 0.0.0.0 192.168.1.153
Default server IP address: 0.0.0.0 192.168.1.10
GDB connection port: 0 1000
Network debug at boot time: false
Update RedBoot non-volatile configuration - are you sure (y/n)? y
... Unlock from 0x007c0000-0x007e0000: .
... Erase from 0x007c0000-0x007e0000: .
... Program from 0xa0013018-0xa0013418 at 0x007c0000: .
... Lock from 0x007c0000-0x007e0000: .

Intel® IQ80310 Development ToolsLab 8: Using GNUPro Toolkit
Application Note 29
9.0 Lab 8: Using GNUPro Toolkit
The objective of this lab is to introduce Red Hat GNUPro Toolchain. It presents how to installGNUPro on Windows, The Version of the GNU tool chain used for this lab was 010413. It alsodemonstrates how to compile, link, connect with a serial port and, run example code with theGNUPro toolkit. Example code blinks LEDs on the IQ80310 to provide feedback on the boardstate, resulting from register values being posted to memory map.
1. Install GNUPro on Windows:
a. Insert the GNUPro Toolkit CD and from Command prompt run install-gui.bat.
This can take a long time to install.
Note: After the installation, it is possible, due to a bug, to miss the cygwin1.dll file. This file is vital and ifmissing should be downloaded from the Red Hat website.
2. Add the path of the GNU Xscale tools to your environment variables:
(The steps detailed here relate to Windows 2000)
a. Right click on My Computer→ Properties.
b. Under Advanced select Environment Variables.
c. From the System variables highlight the Path variable as shown in Figure 12 below.
Figure 12. Environmental Variables Screen

Intel® IQ80310 Development ToolsLab 8: Using GNUPro Toolkit
30 Application Note
d. Click on Edit and on the confirmation window that appears click OK.
e. Finally, click OK both on the Environment Variable and the system Properties windows.
3. Test the path statement:
a. Select Start → Run and type “xscale-elf-gcc”.
b. A DOS box appears and disappears very quickly.
4. Compile, link and debug the software:
a. Create a new directory (e.g. c:\test).
b. Launch the project navigator “snavigator” (C→ Xscale → GNUPro → sn-xscale-010413 → H-i6860-pc-cygwin → bin → snavigator).
c. Create a new project in the empty directory you have created as shown in Figure 13 below:
Figure 13. Auto-Create Project Screen

Intel® IQ80310 Development ToolsLab 8: Using GNUPro Toolkit
Application Note 31
d. From Windows Explorer, copy the source code files (blink.c, blink.h, led.c, led.h) to theproject directory.
e. From the menu, select File→ Project Editor→ Add Files.
f. Select the source files and click OK (Figure 14).
g. From the Source Navigator Project Explorer menu, select Tools → Build settings.
Figure 14. Project Editor - Soutce Navigator (test) Screen

Intel® IQ80310 Development ToolsLab 8: Using GNUPro Toolkit
32 Application Note
h. Create a new build target, by typing the name of the target, into the empty text box at thebottom and then click Create (Figure 15).
Figure 15. Buld Settings Screen
Intel® IQ80310 Development ToolsLab 8: Using GNUPro Toolkit
Application Note 33
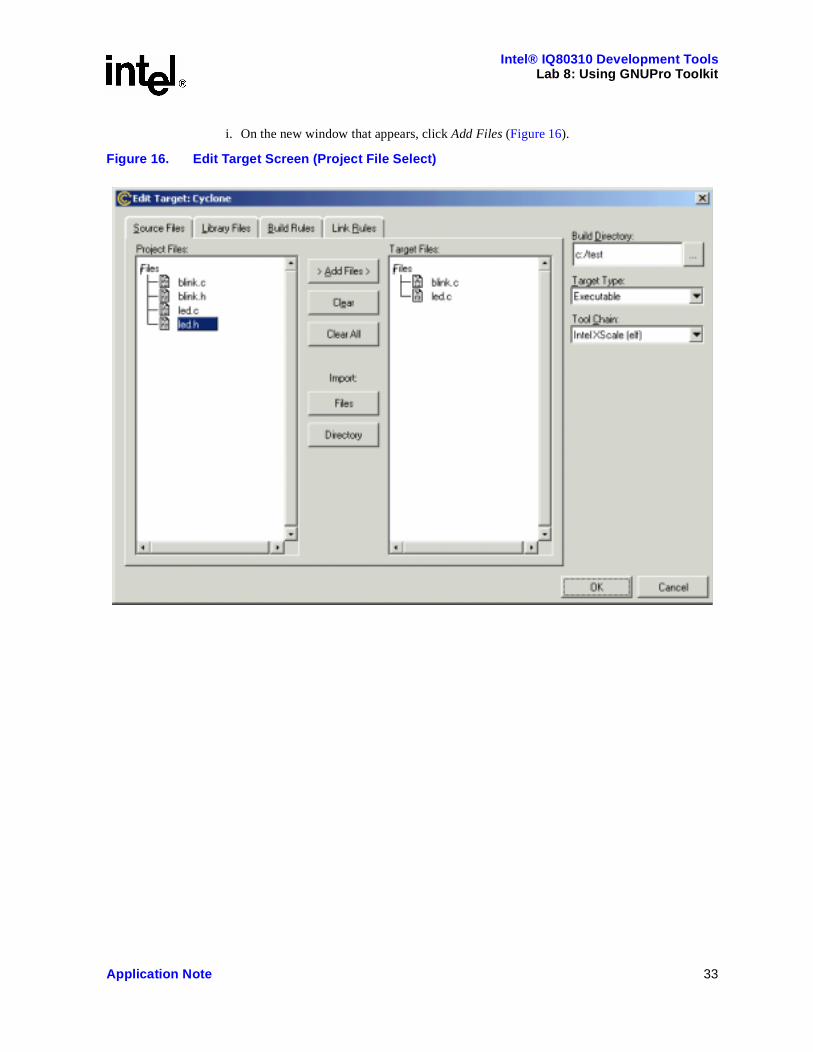
i. On the new window that appears, click Add Files (Figure 16).
Figure 16. Edit Target Screen (Project File Select)

Intel® IQ80310 Development ToolsLab 8: Using GNUPro Toolkit
34 Application Note
j. Select the Link Rules and enable the Debug Setting.
k. Click on the Build Rules tab (Figure 17).
Figure 17. Edit Target Screen (Rules Select)

Intel® IQ80310 Development ToolsLab 8: Using GNUPro Toolkit
Application Note 35
5. Edit the rule for a “c” file (double-click on the “C line”):
a. On the new window change the debug setting to “Standard Debug” (Figure 18) on theuser flags enter -specs=iq80310.specs.
Figure 18. Build Rule Settings Screen

Intel® IQ80310 Development ToolsLab 8: Using GNUPro Toolkit
36 Application Note
Figure 19. Edit Target Screen

Intel® IQ80310 Development ToolsLab 8: Using GNUPro Toolkit
Application Note 37
b. On the link rules tab in the linker flags field enter -specs=iq80310.specs.
c. This tells the linker specific configuration about the IQ80310 (e.g., Memory Map).
d. Click OK/Done until the main menu “symbols - source navigator” window appears.
e. From the tools menu, select build.
f. Change the build target to the build settings created (Figure 20).
Figure 20. Build Test Screen

Intel® IQ80310 Development ToolsLab 8: Using GNUPro Toolkit
38 Application Note
g. Click “Start”.
h. Click “Start” again.
i. Once compilation and link are complete, press Debug (Figure 21).
Figure 21. blink.c Souce Window Screen

Intel® IQ80310 Development ToolsLab 8: Using GNUPro Toolkit
Application Note 39
6. Run the software
a. Select File → Target Settings → Target Selection.
b. Set the target to Remote/serial.
c. Set the Baud Rate to 115200 and the Port to coml.
d. Your window is similar to Figure 22 below.
e. Click OK and Run the program.
Figure 22. Target Selection Screen (Run Software)

Intel® IQ80310 Development ToolsLab 9: Example Using IPPs
40 Application Note
10.0 Lab 9: Example Using IPPs
Intel® Integrated Performance Primitives (IPP) lab
IPP is a highly optimized processor-specific code, providing a wide variety of image, audio, videoand speech capabilities across Intel® microprocessor platforms. The aim of this lab is to introduceIPP for the Intel® XScale™ microarchitecture platform with the help of a simple example by usingthe IPPs to do a vector multiply.
Start Metrowerks CodeWarrior
1. Create new project:
a. Click on File → New.
b. Select ARM Executable Image.
c. Enter Project name: Ippexample.
d. Use Set button to create a project directory (directory containing files).
e. Click OK to create the project.
2. Add source files to the new project:
a. Download the IPPs in ELF format from:http://developer.intel.com/design/strong/swsup/ippsa111_lnx_legal.htm.
b. Extract the RPM and copy the following files: SPSA111LNX_r.a, ippSP.h, ippdefs.h, intoa project directory.
c. Copy the libgcc.a from the GNU tools in the directory:xscale-010413\H-i686-pc-cygwin\lib\gcc-lib\xscale-elf\2.9-xscale-010413\strongarm.
d. Create a source_code.c file in the project directory and enter the following code into thesource_code.c file:
#include <stdio.h>
/*#include "ippdefs.h"*/
#include "ippsp.h"
int main()
{
Ipp16s x[100], y[100], z[100];
int i;
/* Initialize x and y vector */
for ( i = 0; i < 100; i ++ ) {
x[i] = y[i] = i;
}
/* Add the vectors x and y, store result in the vector z */
ippsAdd_16s(x, y, z, 100);
/* print out the output */
for ( i = 0; i < 100; i ++ ) {
/* printf("%6d", z[i]);*/
if ( (i+1)%5 == 0 ) {
/* printf("\n");*/
}
}
return(0);
}

Intel® IQ80310 Development ToolsLab 9: Example Using IPPs
Application Note 41
e. From the menu select: Project → Add files.
f. Navigate to project directory containing files to be added.
g. Select the files and click Add
You’re project should like Figure 23 below:
Figure 23. ippexample.mcp Screen

Intel® IQ80310 Development ToolsLab 9: Example Using IPPs
42 Application Note
3. Enter processor settings:
a. Go to dropdown window and select DebugRel.
b. Go to icon DebugRel Settings window.
c. From the DebugRel Settings, highlight the ARM C Compiler.
d. Select Xscale from the Architecture or Processor dropdown window.
e. The window looks like the one in Figure 24 below.
f. Click Save and close window.
4. Compile and link files:
a. From the menu select: Project → Make.
5. Load and Run on Board (Windows Host):
a. Rotate the rotary switch on the board to number 3 and reset the evaluation board.
b. Create a Hyperlink Connection between your board and your PC.
c. Select Project→ Enable Debugger.
d. The AXD Debugger window should appear on your screen.
e. From the AXD Debugger menu select: Options → Configure Target.
f. Choose ADP remote connection and double-click on Configure.
g. On the window that appears click on Configure.
h. Set the Baud Rate to 115200.
Figure 24. DebugRel Settings Screen (ARM C Compiler Select)

Intel® IQ80310 Development ToolsLab 9: Example Using IPPs
Application Note 43
6. Run the program:
a. From the AXD menu select: Execute→ Go.
7. Play with the debugger:
a. Place a breakpoint in line 13 by clicking the Toggle Breakpoint icon.
b. Watch the values of the variables by clicking the icon on the toolbar.
c. Click on the expansion sign (+) on the left each one of the variables (x, y, z).
d. On the window that appears set the End Element to 15 and click on Limit Expansion.
e. Step in to the program by clicking F8 several times.
8. Discussion of results:
The source code in this lab creates three 3-dimensional arrays (x, y, z) of 100 elements each.Arrays x and y are initialised using the for loop in line 13. Array z stores the result of theaddition of the two arrays x and y according to the IPP function in line 13. This is obvious byobserving the values of the variables as we step in to the program.
Intel® Integrated Performance Primitives provide more than two thousands functions forsignal and image processing. Although the example in this lab is a simple one, it illustrateshow useful optimised IPP functions can be.
Figure 25. Array Expansion Screen

Intel® IQ80310 Development ToolsLab 10: Using the Performance Monitor Unit (PMU)
44 Application Note
11.0 Lab 10: Using the Performance Monitor Unit (PMU)
This lab uses the example code to access the PMU to count how many clock cycles a piece of codetakes to execute:
• The function Start_timer starts the PMU counting clock cycles.
• The function End_time stops the timer and returns the result of the PMU counter.
• The code between start_timer and end_timer is measured. The test is done 100 times to get theaverage. The results are stored in the array clock_cycles.
Important notes:
• This code does not check to see if the counter has overflowed.
• There is an overhead of several clock cycles in calling the start_timer and end_timer functions.
• There is an overhead of clock cycles caused by the debugger running in semi hosted mode andother things running in the background can also cause interrupts that will increase the clockcycles. That is why the test is done 100 times so an average can be taken.
/*.Function: Start_timer()********************************************************
** Description
** This function set the PMU to start timing.
** Remarks (optional)
** This function initiated to start timing the performance using PMU.
*********************************************************************/
#include <stdio.h>
void Start_timer()
{
int pmu_init_value = 0x706; /* clear ov flags, clk, perf ctrs */
__asm
{
mov R0, pmu_init_value
mcr p14, 0, R0, c0, c0, 0
orr R0, R0, #0x4 /* reset counter */
mcr p14, 0, R0, c0, c0, 0
orr R0, R0, #0x1 /* enable counters */
mcr p14, 0, R0, c0, c0, 0
} /* no outputs * : "r" (pmu_init_value) */
}
/*.Function: End_timer()**********************************************************
** .Description
** This function set the PMU to stop timing.
** .Return Value
** This function returns the number of clock cycles it took to run
** each test at the end of the function.
** .Remarks (optional)

Intel® IQ80310 Development ToolsLab 10: Using the Performance Monitor Unit (PMU)
Application Note 45
** This function initiated to stop timing the performance using PMU.
*********************************************************************/
unsigned End_timer()
{
unsigned clkval, cnt0, cnt1;
unsigned halt = 0x0;
__asm
{
mov r3,halt
mcr p14, 0, R3, c0, c0, 0 /* stop the pmu */
mrc p14, 0, R0, c1, c0, 0 /* read clk */
mrc p14, 0, R1, c2, c0, 0 /* read cnt0 */
mrc p14, 0, R2, c3, c0, 0 /* read cnt1 */
mov clkval,r0
mov cnt0,R1
mov cnt1,R2
}
/*
: "=r" (clkval), "=r" (cnt0), "=r" (cnt1)
: "r" (halt) );
*/
return clkval;
}
int main()
{
unsigned clockcycles[100];
int cnt;
int array_size=100;
int x[100];
int i;
for (i=0; i<100; ++i)
{
Start_timer();
for ( cnt = 0; cnt < 50; cnt ++ )
{
x[cnt] = cnt;
}
clockcycles[i] = End_timer();
printf("%d",clockcycles[i]);
}
}

Intel® IQ80310 Development ToolsLab 11: Accessing Coprocessors
46 Application Note
12.0 Lab 11: Accessing Coprocessors
This lab steps through code that accesses the co-processors, using the AXD debugger. Attempt todo the same thing using a supervisor mode:
1. Write some code to access CP 15:
e.g., read TBL mrc p15,0x0,r0,c2,c0,0
2. Step through it to make sure it worked.
3. Step through again, but this time set the CPSR to user mode.
4. To change the mode:
a. View the processor registers by clicking on the button.
b. View the Current register.
c. Double click on the value column of the cpsr register.
Figure 26. Register/Value Screen

Intel® IQ80310 Development ToolsLab 11: Accessing Coprocessors
Application Note 47
d. Change the mode from SVC to User.
5. Now step through the code again.
6. Set the access permission of CP0.
7. Do a CP0 instruction in system and user mode:
e.g., miaph acc0, r3, r4
Figure 27. CPSR Screen

Intel® IQ80310 Development ToolsLab 12: Dynamic Frequency Change
48 Application Note
13.0 Lab 12: Dynamic Frequency Change
This example code dynamically changes the frequency of the core.
By counting up though a loop and displaying the number on the LED. A delay proportional to theprocessor speed is caused by a loop of 25,000,000 interations. While the code runs, view theLEDs to see the change in speed.
Use the counting LED example and modify to change the core frequency dynamically:
unsigned CLKCFG = 0x7MOV R1, CLKCFG; New CCLKCFG value
MCR P14,0,R1,C6,C0,0; Change core clock frequency and wait for PLL; to re-lock
Example:/********************************************************************/
/* File: blink.c */
/* This program flashes "80310" on the Cyclone IQ80310 */
/* board LEDs. */
/********************************************************************/
#include <stdio.h>
#include <stdlib.h>
#include "led.h" /* Custom header file*/
#include "blink.h" /* Custom header file */
int main(void){
int i,z,x; /* index for counting*/
unsigned CLKCFG = 0x7;
while(1){ /* Infinite loop*/
for(z = 0; z <3 ; z++)
{
for(x=0;x<9;x++)
{
displayLED( leds[z],leds[1] ); /* LED display */
for(i=0;i<25000000 ;i++ ){} /* To create delay */
}
}
if (CLKCFG == 9)
CLKCFG = 2;
else
CLKCFG = 9 ;
__asm
{
MOV R1, CLKCFG
MCR P14,0,R1,c6,c0,0
}
}
return 1;
}

Intel® IQ80310 Development ToolsLab 13: Memory Management Unit (MMU) Architecture
Application Note 49
14.0 Lab 13: Memory Management Unit (MMU)Architecture
The MMU performs two primary functions:
• It translates virtual addresses into physical addresses
• It controls memory access permissions
In this lab we are going to explore the processes behind these functions based on a simple example.In other words, we are going to do manually what the computer does automatically. The MMUarchitecture is described in detail in the ARM Architectural Reference Manual, section 7.6
Note: The MMU supports memory accesses based on sections or pages:
• Sections – compromised of 1 MB blocks of memory
• Pages – compromised of 4 KB or 64 KB blocks of memory
However, since the Angel memory map includes no pages, the following example is based on a section.
The Aim of this exercise is to understand what the core does when decoding virtual memory doingthe same thing manually.
1. In this example you should decode the real physical address for the virtual address given below:
Virtual Address =
2. Determine the Translation Lookaside Buffer (TLB):
a. The address of the TLB is included in registers c0, c2 of coprocessor 15.
b. To read this address, repeat the first part of the Accessing Coprocessors lab (using theCopro_code.c file).
c. The address of TLB is copied in r0. It should be 0xA03F0000.
d. Write the address of the TLB in the box provided below:
TLB =
3. Determine the Page Descriptor Address:
The Page Descriptor Address is:
TLB =
plus the first three digits of the virtual address (bits 20-31):
Equals:
Page Descriptor Address =
0 0 0 2 0 0 0 0
0 0 0 2 0 0 0 0

Intel® IQ80310 Development ToolsLab 13: Memory Management Unit (MMU) Architecture
50 Application Note
4. Read the page descriptor from the address where the page descriptor is stored:
a. From the AXD menu select the memory icon .
b. On the new window that appears, type the page descriptor address in the Start address box.
c. Right click on the desired address, under the Address label and select:Format → Other→ Size 32 → Hex (Figure 28)
d. Copy the value of the page descriptor in the box provided below:
Page Descriptor =
5. Determine when the page descriptor points to a section (1 MB) or to a second-level page:
a. Convert the first byte into binary and translate the first two bits
b. The translation of the bits is done as follows:
i. 00 – Faultii. 01 – Pageiii. 10 – Sectioniv. 11 – Unpredictable
Figure 28. Start Address Selection

Intel® IQ80310 Development ToolsLab 13: Memory Management Unit (MMU) Architecture
Application Note 51
6. Determine the cache policy for this page by decoding the X, C, B bits in the page descriptorregister:
a. Remember that:
i. Bit 2 – Bii. Bit 3 – Ciii. Bit 12 – X
For more information refer to “Intel 80200 Processor based on Intel XScaleMicroarchitecture, Developer’s Manual”
b. X = ___ : C = ____: B = ____The Cache policy is ? _________________________________________
7. Determine the physical address:
a. Determine the section base address by looking at bits 20-31 (the first three digits) of thePage Descriptor:
Page descriptor =
b. Write down the last 5 digits of the virtual address in the box provided below:
Virtual Address =
c. The real Physical address is calculated by taking the first 3 digits of the Page descriptorfollowed by the last 5 digits of the Virtual address.
Physical Address =
8. ResultsThe physical address should be:
Physical Address =
A 0 0 2 0 0 0 0

Intel® IQ80310 Development ToolsLab 13: Memory Management Unit (MMU) Architecture
52 Application Note
This page intentionally left blank.