application-level debugging and profiling: gaps in the ......undetected network issues in...
TRANSCRIPT

For years instruction-level debuggers and profilers have improved in leaps and bounds. Similarly, system-level and network monitoring tools are increasingly ubiquitous. There is, however, a gulf between the two worlds which is widening as more and more processes and applications share system resources.
In this talk I will present the concepts of application-level tracing and what kind of information is available. I will run through the techniques for combining run-time data from different levels before moving onto some case studies. In particular I will present how a lack of application-level monitoring can lead to file-system bottlenecks and undetected network issues in distributed Linux HPC IT systems.
Application-Level Debugging and Profiling: Gaps in the Tool Ecosystem
Dr Rosemary Francis, Ellexus

Instruction-level code debugging
System-level monitoring of physical resources
Application-level Tracing
?

Who am I?
Technical Director, Ellexus Ltd
Specialists in:- Tracing Linux applications- Profiling application file IO
We work out why your application doesn't work where it should.
We take the guess-work out of build issues and installation problems.
PhD in Semiconductor Architecture and Electronic Design Automation (CAD)
Embedded Software and Digital Design
Too much time spent installing and configuring the CAD tools.
Too much time reading scripts.

What am I going to talk about?
Profiling and debugging technologies
Our tools and how they work
Gaps in the tooling ecosystem
What the future might look like

BreezeOriginally designed to help debug scripted flows Extended to solve
library dependency issues, track build dependencies and other system-level problems.

Breeze lets you compare applications
You can see what is different about a particular machine or user setting when it runs.

BreezeProfiling File IO
In 2012 we added file IO profiling for remote file systems.
We are increasingly being asked to solve file system, networking, power and memory issues.
Common factor: matching physical resource use with application stats

What else is available?
How does it work?

Instruction-level Debuggers
GDB swaps machine instructions for special 'breakpoint' instructions
Valgind rewrites the memory allocation code of your program
Lets you see the program in instruction-level detail
Difficult to get an overview
Measurement can change application behaviour

New Instruction-level Debuggers
UNDO takes snapshots so you can run your program backwards
Allinea DDT can debug parallel code across many machines
Debug symbols match the instructions to the code
Research into debug symbols continues to improve
Focus is on embedded, but what is embedded?

Application-level Debuggers: ptrace
Strace and Ltrace show system and library calls into the linux kernel
Both use a kernel facility called ptrace
They can solve some problems, but don't cope well with large applications
LinuxKernel GLibC Application
Systemcalls
Librarycalls
strace ltrace

Application-level Debuggers: LD_PRELOAD
Breeze and others like it use LD_PRELOAD instead of ptraceThis is a technique that involves overriding library functions
Provides a powerful interface that can trace and control the applicationCan easily be combined with other profiling data
LinuxKernel GLibC Application
Systemcalls
LibrarycallsBreeze
LD_PRELOADlibrary

LD_PRELOAD
int read(int fd, void *buf, int count){
int (*next_read)(int fd, void *buf, int count)next_read = dlsym(RTLD_NEXT, "read")breeze_print(getpid(), "read", "%d", fd);return next_read(fd, buf, count);
}
Override library functions by matching the function signatureUse the dlsym function to get the next loaded library function with that name

Multi-machine LD_PRELOAD
ssh user@host ls -l /tmp
ssh user@host -o SendEnv=LD_PRELOAD ls -l /tmp
Override exec() and re-write command arguements to modify remote jobs

Switching file systems with LD_PRELOAD
int open(const char *pathname, int flags){
...
char *alt_pathname;asprintf(&alt_pathname, "%s/%s", "/alt", pathname);return next_open(alt_pathname, flags);
}
Similar techniques can swap file systems, or suspend and resume jobs
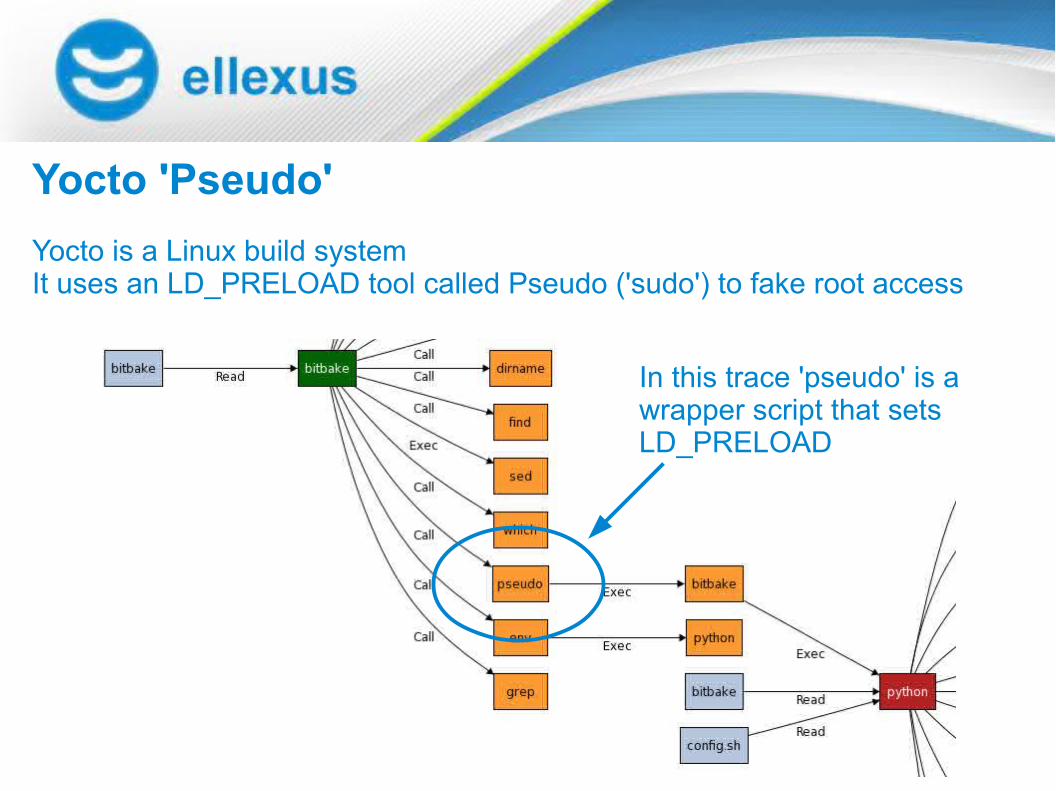
Yocto 'Pseudo'
In this trace 'pseudo' is a wrapper script that sets LD_PRELOAD
Yocto is a Linux build systemIt uses an LD_PRELOAD tool called Pseudo ('sudo') to fake root access

Yocto 'Pseudo' (2)The LD_PRELOAD library redirects calls to open() read() and write() into a database.
The build thinks it is running as root and accessing the file system as normal.
In fact the build is modifying files in the database via the pseudo library.

LinuxKernel
GLibC ApplicationPseudo
LD_PRELOADlibrary
GLibC
GLibCBreeze
LD_PRELOADlibrary
Getting it rightGlibC can have multiple versions of the same function.This is even more complicated when another preload library is used.
It is important to preserve the original behaviour of the program.
Most of our code is involved in picking the right 'next' library version to use

Why should you care about application tracing?

System Design Multi-machine jobs
Suspend resume
Hierarchical file-systems
Virtualisation
Homogenous hardware?- not cost effective
Bromium – custom stack with one VM per app
Job Scheduling
Virtualisation
Host OS

Case Study 1: ARM filesystem profilingNetworked filesystem with different performance for different areas
Network and filesystem are the main system bottlenecks
ARM scripted flow
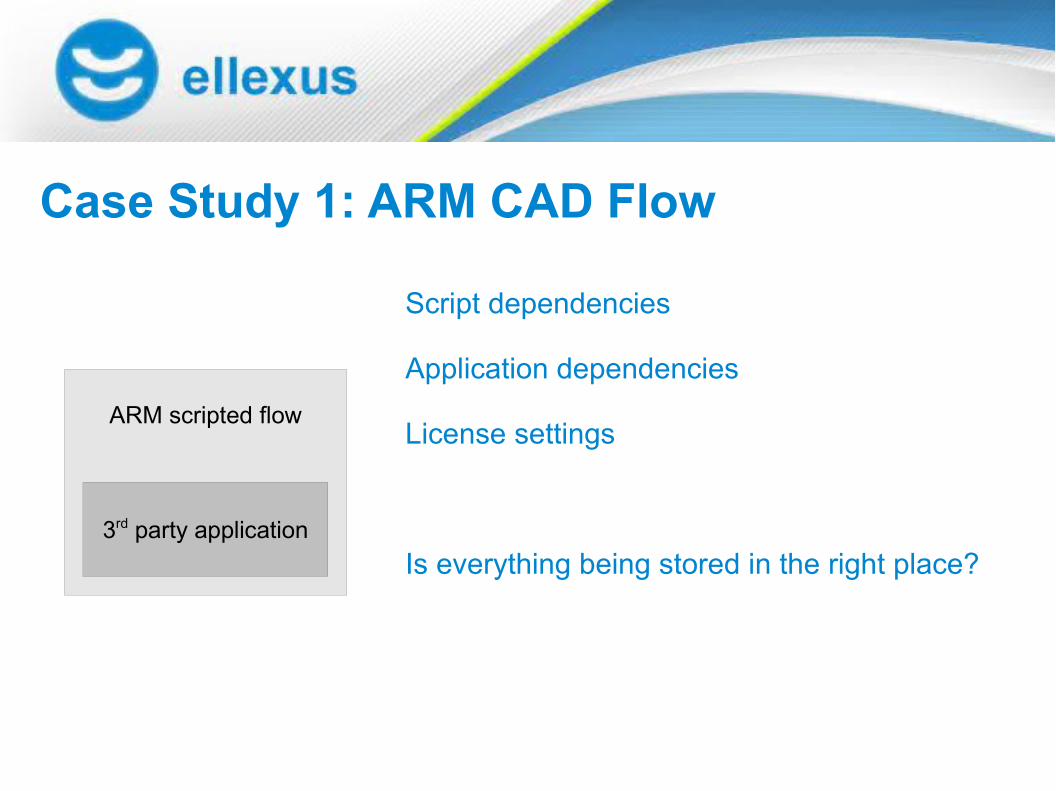
Case Study 1: ARM CAD Flow
3rd party application
Script dependencies
Application dependencies
License settings
Is everything being stored in the right place?

/scratch is written to at the start of the trace
/tmp is hardly used
Case Study 1: Profiling file IO results/scratch is medium-term storage and should only be used for results
We can see the writes at the end OK, but there are also lots of writes at the begining. This is a problem.

Case Study 2: Network IO License server connections
This application spends > 500ms connecting
Half of the connections fail- it wastes 200ms

Case Study 3: Cadence Client TechnologyOne user couldn't type anything in new login systems
The IT manager traced a startx session for that user
Using Breeze he saw that xmbind was sourcing the wrong key bindings

Case Study 3:
Tracing X
This time it was easy, but how long until we can't do this?

Where do we go from here?

Problem 1: Distributed applications
How do you profile an application that runs on many different systems?
Not necessarily any common factors between the platforms
Many components not fit for purpose

Problem 2: What should we measure?
File System Daemon
Disk / Network IO
Job Scheduler
Virtual Machine
User Application
Application Framework
OS space User space
Hard to combine different data sets
We can't measure everything
We don't want to reverse engineer every system we need to profile

Solution: Design for Profiling?We have all heard of Design For Test...
… introducing Design For Profiling
We can build programs with debug symbols and debug code
This should be built into the high-level system design
Profiling frameworks should be chosen at the start, not as an afterthought

Solution: Custom profiling frameworksBreeze: *Trace
Customisable LD_PRELOAD framework
Jtrace : Java profiling and debugging
Open Source framework for inserting java snipppets into classesLets you instrument the java class libraries
… what next??

Big Data: Monitor everything and correlateGrab information at all levels and look for trends
Difficult to get fine-grain covereage without harming performance
Could be the only way to improve performance in very complex systems
Cloud computing is only going to get more complicated
With enough data we could not only spot drops in performance, but we could predict resource needs such as memory consumption and power.
Now it's time for your ideas...
Thanks for listening
Dr Rosemary Francis, Technical [email protected]