application and effects of mouse foxp3 antibody … and molecular research 12 (4): 6535-6545 (2013)...
TRANSCRIPT
©FUNPEC-RP www.funpecrp.com.brGenetics and Molecular Research 12 (4): 6535-6545 (2013)
Application and effects of mouse Foxp3 antibody and fixation/permeabilization buffer on the detection of CD4+ regulatory T cells in various mammal species
Y.L. Sun1,2, G.G. Lin2, K. Zhang2, L.N. Wang2 and J.M. Li2
1Department of Laboratory Medicine, Key Laboratory of Clinical Laboratory Diagnostics in Universities of Shandong, Weifang Medical University, Weifang, China2National Center for Clinical Laboratories,Beijing Hospital of the Ministry of Health, Beijing, China
Corresponding author: J.M. LiE-mail: [email protected]
Genet. Mol. Res. 12 (4): 6535-6545 (2013)Received October 10, 2012Accepted September 15, 2013Published December 11, 2013DOI http://dx.doi.org/10.4238/2013.December.11.5
ABSTRACT. CD4+ regulatory T lymphocytes (Treg cells) play a crucial role in maintaining the normal immune homeostasis. Foxp3, as a key marker for Treg cells, is widely used to identify Treg cells, not only in humans but also in other species, like mouse, porcine, ovine, and bovine. To detect reproducible Treg cells is important for evaluating the state of the immune system, and thus, it is necessary to optimize Foxp3 staining. Here, we present a comparative study of MF23 and FJK-16s clones of anti-mouse Foxp3 antibodies, used in combination with two different fixation/permeabilization buffers. For Foxp3 staining, the fixation/permeabilization buffer and Foxp3 antibody FJK-16s clone from eBioscience were better than those from BD Pharmingen, with the best fluorochrome PE. Moreover, when using the best combination, there was a highly significant positive correlation between CD25+ T cells
6536
©FUNPEC-RP www.funpecrp.com.brGenetics and Molecular Research 12 (4): 6535-6545 (2013)
Y.L. Sun et al.
and CD25+Foxp3+ T cells. Therefore, the CD25 marker can be used as an alternative to the Foxp3 antibody. As FJK-16s is also applicable for detecting bovine, porcine, canine, ovine, and equine Foxp3 antibodies, these results will be helpful not only in quantifying the frequencies of mouse Treg cells, but also in accurately detecting Treg cells of the other species mentioned above by multicolor flow cytometry.
Key words: Foxp3; FJK-16s; MF23; CD4+ regulatory T lymphocytes; CD25
INTRODUCTION
CD4+ regulatory T lymphocytes (Treg cells) play a central and nonredundant role in the control of immune responses to self and nonself antigens (Sakaguchi et al., 2008). The best-characterized regulatory T cell populations are different from the other populations in mouse by their expressions of CD4 and high levels of CD25 (IL-2-receptor α-chain), and the forkhead/winged helix transcription factor called Foxp3 (Brunkow et al., 2001), which is a key regulatory protein for their development and function (Hori et al., 2003) and the definitive marker for mouse Treg cells (Fazekas de St Groth et al., 2011). Therefore, mouse Treg cells are often identified by panels of markers CD3+CD4+CD25+Foxp3+ (Hodgson et al., 2011).
Several publications noted concerns about the influence of different clones of Foxp3 anti-bodies coupled to different fluorochromes and paired with different fixation/permeabilization buf-fers on the staining of human Treg cells (Tran et al., 2007; Pillai and Karandikar, 2008; Grant et al., 2009; Law et al., 2009; Presicce et al., 2010). However, the variables influencing the staining of Treg cells in other mammal species have not been reported. Because there are no commercial specific Foxp3 antibodies for cattle, cat, pig, sheep, dog, and horse Treg cells, the antibodies for their homologous species are usually used in the studies, like mouse Foxp3 antibodies. In current studies, although several anti-mouse Foxp3 clones and corresponding buffer sets can be obtained, the FJK-16s clone from eBioscience (San Diego, CA, USA) is the most frequently used in pub-lished studies (Tsang et al., 2006; Izcue et al., 2008; Prochazkova et al., 2009; Janikashvili et al., 2011; Lei et al., 2011). Here, we chose C57BL/6 mice as a model, and compared two kinds of Foxp3 clones: MF23 from BD Pharmingen (San Diego, CA, USA) and FJK-16s. MF23 recog-nizes an epitope between the 1 and 87 amino acids in the N-terminal domain of the mouse Foxp3 protein, whereas FJK-16s maps the epitope to amino acids 75 and 125 of the mouse, rat, bovine (Gerner et al., 2010), porcine (Bolzer et al., 2009), canine (Pinheiro et al., 2011), ovine (Rocchi et al., 2011), and equine (Robbin et al., 2011) Foxp3 protein. Simultaneously, the Foxp3 buffer sets from the two vendors above were used in our system. Our results showed that the variability of the staining of mouse Treg cells depended not only on the fixation/permeabilization buffer, but also on the clone of anti-mouse Foxp3 antibody and the fluorochrome used.
MATERIAL AND METHODS
Cells
Peripheral blood mononuclear cells (PBMCs) and splenocytes were isolated from
6537
©FUNPEC-RP www.funpecrp.com.brGenetics and Molecular Research 12 (4): 6535-6545 (2013)
Influence of Foxp3 antibody/buffer on Tregs detection
C57BL/6J mice and filtered through 40-μm nylon cell strainers. For PBMCs, red blood cells were lysed with lysing buffer (BD Pharmingen). Spleen lymphocytes were separated in EZ-Sep™ mouse lymphocyte separation medium (Dakewe, Beijing, China). The cells were main-tained in phosphate-buffered saline (PBS) containing 1% fetal calf serum (FCS). The study was approved by the Ethics Committee of the National Center for Clinical Laboratories.
Antibodies
The antibodies to surface markers consisted of the following antibodies: anti-mouse CD3-PerCP-Cy5.5 (clone 145-2C11), anti-mouse CD4-FITC (clone RM4-5), anti-mouse CD25-PE (clone PC61), anti-mouse CD25-APC (clone PC61), and their isotype controls (all from BD Pharmingen). The antibodies to intracellular markers consisted of the following an-tibodies: anti-mouse Foxp3-Alexa Fluor 647 (clone MF23) and its isotype, anti-mouse Foxp3-PE (clone MF23) and its isotype (all from BD Pharmingen), and anti-mouse Foxp3-PE (clone FJK-16s) and its isotype (both from eBioscience). Each antibody was added at the recom-mended volume (1 μg/106 cells). One million cells were used for each test.
Immunofluorescence staining of cell surface antigens
Cell surface antibodies (anti-mouse CD3, CD4, CD25 coupled to corresponding fluo-rochromes and their isotype controls) were added to each sample, incubated for 20 min at room temperature, and washed with 1 mL PBS containing 1% FCS.
Fixation/permeabilization and Foxp3 staining
Foxp3 staining buffer set from eBioscience
After surface staining, 1 mL freshly prepared fixation/permeabilization buffer was added to each sample, mixed well, and incubated for 30 min at 4°C in the dark. Cells were washed once with 2 mL permeabilization buffer. Foxp3 antibodies were used to stain intracellular markers, washed twice with 2 mL permeabilization buffer, and then washed once with 1 mL PBS containing 1% FCS.
Mouse Foxp3 buffer set from BD Pharmingen
After surface staining, 2 mL freshly prepared cold mouse Foxp3 fixation buffer was added to each sample, mixed well, and incubated for 30 min at 4°C in the dark. Cells were washed once with 2 mL permeabilization buffer, incubated in 2 mL permeabilization buffer for 30 min at 37°C, and washed once with 2 mL PBS containing 1% FCS. Foxp3 antibodies were then added. A 30-min incubation at room temperature in the dark was followed by two washes with 2 mL PBS containing 1% FCS.
Compensation
Compensation controls were created for each fluorochrome in the Treg detection. Com-pensation tubes were checked to ensure that each stain was the brightest in its own channel.

6538
©FUNPEC-RP www.funpecrp.com.brGenetics and Molecular Research 12 (4): 6535-6545 (2013)
Y.L. Sun et al.
Flow cytometry data collection and analysis
Flow cytometry was performed with a FACSCalibur flow cytometer and the data were evaluated by the BD CellQuest analysis software (BD Bioscience, San Diego, CA, USA). The instrument setup was standardized to reduce experiment-to-experiment varia-tion. Before each experiment, the instrument was calibrated by using BD CaliBRITE 3 Beads and BD CaliBRITE APC Beads (BD Biosciences) according to the manufacturer instructions. Lymphocytes were gated based on their side scatter and forward scatter (SSC/FSC) characteristics. At least 30,000 gated lymphocytes were collected for each sample. CD3+CD4+ cells were gated within the lymphocyte gate. The CD25+Foxp3+ gate was set based on their isotypes. Treg cells were gated as CD25+Foxp3+ events as a percentage of CD3+CD4+ cells.
Statistical analysis
Results were analyzed using the GraphPad Prism 5 software (GraphPad, La Jolla, CA, USA) and statistical analyses were performed using the paired two-tailed Student t-test and correlation analysis. Statistical significance was defined as P < 0.05, P < 0.01, and P < 0.001.
RESULTS
This study first compared two clones of anti-mouse Foxp3 antibodies and two fixa-tion/permeabilization buffers from BD Pharmingen and eBioscience, using PBMCs and spleen lymphocytes from five mice. Then, the MF23 clones with two different fluorescences were also compared, when treated with two different fixation/permeabilization buffers. Next, the correlation between CD25+ T cells and CD25+Foxp3+ T cells was analyzed. Finally, we identified the alignments of Foxp3 amino acid residues 1-87 and 75-125 between mouse and eight other species.
Comparison of fixation/permeabilization buffers
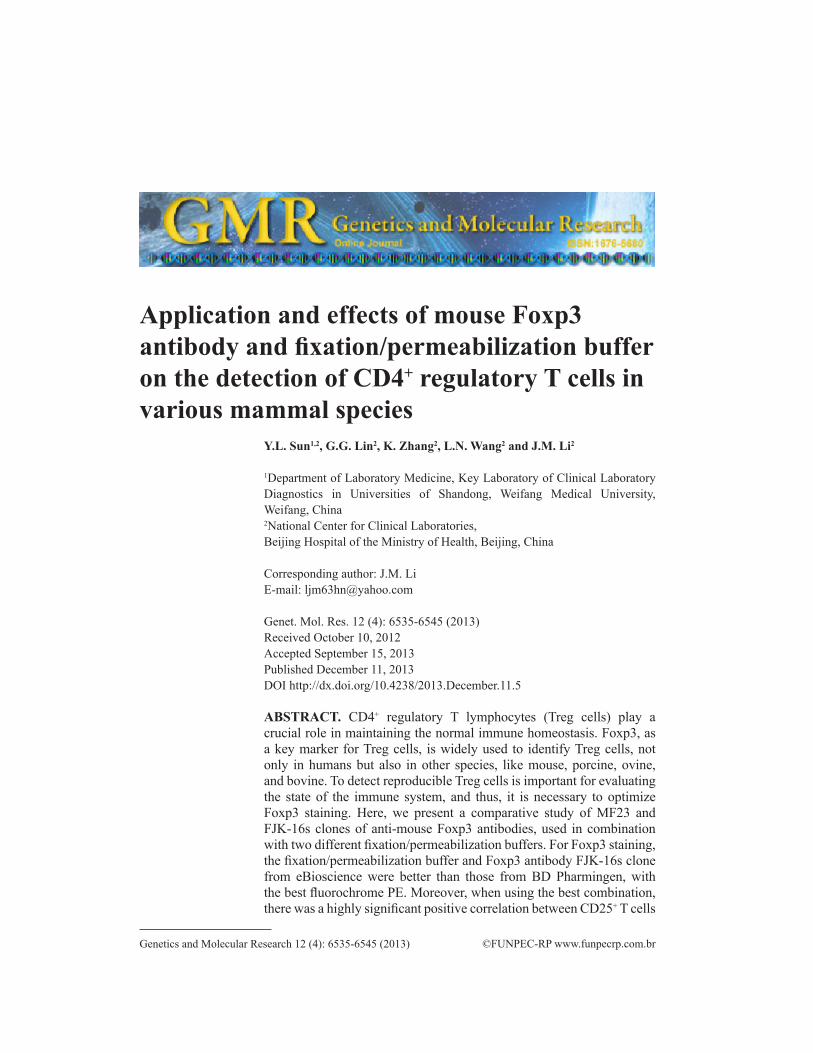
In this experiment, the FJK-16s clone was used with two fixation/permeabilization buffers, respectively. Each buffer was used according to the manufacturer instructions. We observed that fixation/permeabilization buffers affected the SSC/FSC characteristics of the cells (Figure 1, row 1), and this result was identical to the staining results of hu-man Treg cell (Hodgson et al., 2011). The CD3 staining was consistent, with 23 to 37% of CD3+ events in the lymphocyte gate of PBMCs and 22 to 29% in the spleen lymphocyte gate (Figure 1, row 2). Moreover, the CD4 staining was also consistent, with 48 to 58% of CD4+ events in the CD3+ lymphocyte gate of PBMCs or spleen (Figure 1, row 2). For CD25 staining, the staining percentages in the CD3+CD4+ lymphocyte gate of PBMCs and spleen were 4 to 10% and 7 to 13%, respectively (Figure 1, row 3). On the contrary, the staining levels of Foxp3+ cells in CD4+ T cells with the Foxp3 buffer set from BD Pharmingen were lower than with the Foxp3 staining buffer set from eBioscience, in PBMCs or spleens (P < 0.01) (Figure 1, row 3).
6539
©FUNPEC-RP www.funpecrp.com.brGenetics and Molecular Research 12 (4): 6535-6545 (2013)
Influence of Foxp3 antibody/buffer on Tregs detection
In PBMCs, compared with the control and with the eBioscience Foxp3 staining buffer set treatment, the signal-to-noise ratio (SNR) for CD3-PerCP-Cy5.5 with the BD Pharmingen Foxp3 buffer set treatment decreased markedly (P < 0.01) (Figure 2, column 1). On the con-trary, in spleens, the SNR rose significantly, especially compared with the eBioscience Foxp3 staining buffer set treatment (Figure 2, column 1). Furthermore, compared with the control, the SNR also decreased significantly with the eBioscience Foxp3 staining buffer set treatment in the spleen lymphocytes (P < 0.001), but not in PBMCs (P = 0.1096) (Figure 2, column 1). In PBMCs, the SNR for CD4-FITC with both Foxp3 buffer sets treatments was lower than the control (P < 0.05), but was not different between each other (Figure 2, column 2). However, in the spleen lymphocytes, only the SNR for CD4-FITC with the eBioscience Foxp3 staining buffer set treatment was lower than the control (P = 0.0307), but it did not decrease signifi-cantly compared with the BD Pharmingen Foxp3 buffer set treatment (P = 0.2478) (Figure 2, column 2). For Foxp3-PE staining, compared with the BD Pharmingen Foxp3 buffer set treat-ment, the SNR with the eBioscience Foxp3 staining buffer set treatment was higher whether in spleen lymphocytes (P < 0.0001) or in PBMCs (P = 0.0047) (Figure 2, column 3).
Comparison of mouse Foxp3 antibodies
In this set of experiments, two clones of anti-Foxp3 antibodies were used in combina-tion with the two Foxp3 buffer sets previously described, respectively (Figure 3). By using a CD25+Foxp3+ gate based on their isotype controls for CD25 staining and on CD3+CD4+CD25-
Figure 1. Comparison of fixation/permeabilization buffers. The Foxp3 antibodies used here were FJK-16s from eBioscience. The R1 plots are lymphocyte populations, gated based on SSC/FSC characteristics. The R3 gates are CD3+CD4+ cells, gated based on their isotypes, and the displayed numbers are CD3+CD4+ (above) and CD3+CD4- events (below) expressed as percentages of lymphocytes (R1). Then CD25 and Foxp3 gates were set based on their isotypes, and the displayed numbers are CD25+Foxp3+ (above) and CD25+Foxp3- events (below) expressed as percentages of CD4+ T cells. Columns 1 and 4 = control (no fixation/permeabilization); columns 2 and 5 = mouse Foxp3 buffer set from BD Pharmingen; columns 3 and 6 = Foxp3 staining buffer set from eBioscience. Columns 1-3 = PBMCs; columns 4-6 = spleen lymphocytes.

6540
©FUNPEC-RP www.funpecrp.com.brGenetics and Molecular Research 12 (4): 6535-6545 (2013)
Y.L. Sun et al.
T cells for the Foxp3 staining, the percentages of the Foxp3+ cells in CD3+CD4+ T cells were compared across the different staining conditions. Compared with the eBioscience Foxp3 buf-fer set treatment, the two clones combined with the BD Pharmingen Foxp3 buffer set treatment all yielded lower staining (Figure 3, row 1). Moreover, in the same fixation/permeabilization conditions, compared with another two Foxp3 antibodies, the best staining was obtained using the FJK-16s clone from eBioscience (Figure 3, column 3). Furthermore, for the MF23 clone, the Foxp3 staining obtained with Foxp3-PE from BD Pharmingen was lower than with Foxp3-Alexa Fluor 647, regardless of the buffer used (Figure 3, columns 1 and 2), but their SNRs were not different from each other (data not shown). Moreover, the SNR for Foxp3-PE from eBioscence was better than that from BD Pharmingen, regardless of the buffer used (P < 0.05). Therefore, the best antibody-buffer combination was the FJK-16s clone from eBioscience used with eBioscience Foxp3 staining buffer set (Figure 3, row 2, column 3).
Figure 2. Comparison of the signal-to-noise ratio (SNR) for different fluorochromes after different fixation/permeabilization buffer treatment. Fresh PBMCs and spleen lymphocytes from 4 mice were used in the same fixation/permeabilization conditions and the FJK-16s clone was used here. The gating strategy was the same as described in Figure 1. Row 1 = PBMCs; Row 2 = spleen lymphocytes. Control = no fixation/permeabilization; BD buffer set = mouse Foxp3 buffer set from BD Pharmingen; eBioscience buffer set = Foxp3 staining buffer set from eBioscience. *P < 0.05; **P < 0.01; ***P < 0.001; ns, P > 0.05.
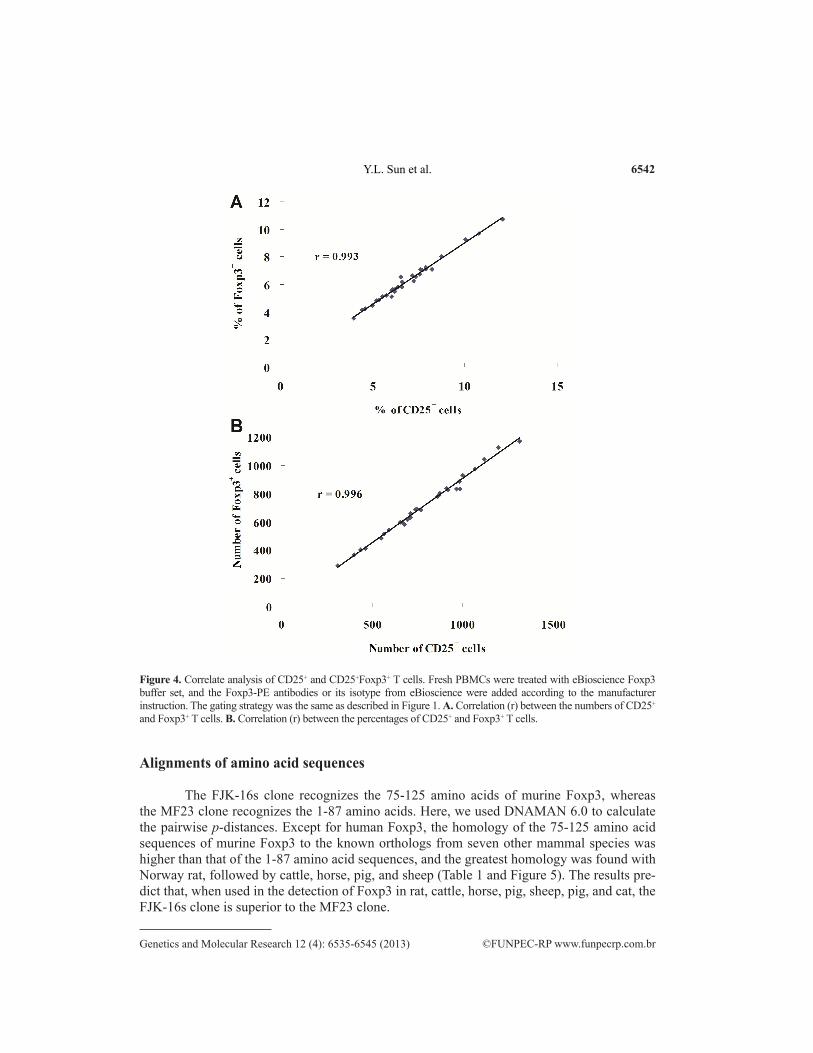
Correlation analysis between CD25+ and Foxp3+ T cells
CD25 and Foxp3 are thought to be the key markers of mouse CD4+ Treg cells, which are different from the markers of human CD4+ Treg cells (Law et al., 2009). To determine whether there was a correlation between CD25+ T cells and Foxp3+ T cells, we compared their numbers and percentages in CD4+ T cells of murine PBMCs, respectively. As demonstrated in Figure 4A, the numbers of CD25+ T cells were strongly correlated with the Foxp3+ T cells (r = 0.996). A practically identical correlation was also found when the percentages of CD25+ T cells and Foxp3+ T cells were compared (r = 0.993) (Figure 4B).

6541
©FUNPEC-RP www.funpecrp.com.brGenetics and Molecular Research 12 (4): 6535-6545 (2013)
Influence of Foxp3 antibody/buffer on Tregs detection
Figure 3. Comparison of mouse Foxp3 antibodies. Fresh spleen lymphocytes from 4 mice were used in the same fixation/permeabilization conditions and mouse Foxp3 antibodies were used here. The gating strategy was the same as described in Figure 1. A. Row 1 = treated with Foxp3 buffer set from BD Pharmingen; row 2 = treated with Foxp3 staining buffer set from eBioscience. Column 1 = MF23 clone with PE; column 2 = MF23 clone with Alexa Fluor 647; column 3 = FJK-16s clone with PE. B. Percentages of CD25+Foxp3+ events in CD4+ T cells. *P < 0.05; **P < 0.01; ***P < 0.001.
6542
©FUNPEC-RP www.funpecrp.com.brGenetics and Molecular Research 12 (4): 6535-6545 (2013)
Y.L. Sun et al.
Figure 4. Correlate analysis of CD25+ and CD25+Foxp3+ T cells. Fresh PBMCs were treated with eBioscience Foxp3 buffer set, and the Foxp3-PE antibodies or its isotype from eBioscience were added according to the manufacturer instruction. The gating strategy was the same as described in Figure 1. A. Correlation (r) between the numbers of CD25+ and Foxp3+ T cells. B. Correlation (r) between the percentages of CD25+ and Foxp3+ T cells.
Alignments of amino acid sequences
The FJK-16s clone recognizes the 75-125 amino acids of murine Foxp3, whereas the MF23 clone recognizes the 1-87 amino acids. Here, we used DNAMAN 6.0 to calculate the pairwise p-distances. Except for human Foxp3, the homology of the 75-125 amino acid sequences of murine Foxp3 to the known orthologs from seven other mammal species was higher than that of the 1-87 amino acid sequences, and the greatest homology was found with Norway rat, followed by cattle, horse, pig, and sheep (Table 1 and Figure 5). The results pre-dict that, when used in the detection of Foxp3 in rat, cattle, horse, pig, sheep, pig, and cat, the FJK-16s clone is superior to the MF23 clone.

6543
©FUNPEC-RP www.funpecrp.com.brGenetics and Molecular Research 12 (4): 6535-6545 (2013)
Influence of Foxp3 antibody/buffer on Tregs detection
DISCUSSION
The best flow cytometry staining panels to identify human Treg cells has been pub-lished by Law et al. (2009), but no study has determined the best combination of antibody and fixation/permeabilization buffer for the staining of Treg cells in PBMCs and spleen lym-phocytes in other mammal species. Therefore, we chose the mouse as a model, and compared two clones of anti-mouse Foxp3 antibodies and two Foxp3 staining buffer sets, which were the most frequently used in published studies in various species (Tsang et al., 2006; Izcue et al., 2008; Bolzer et al., 2009; Prochazkova et al., 2009; Gerner et al., 2010; Janikashvili et al., 2011; Lei et al., 2011; Pinheiro et al., 2011; Robbin et al., 2011; Rocchi et al., 2011).
Although they all identified a population of CD4+CD25+Foxp3+ T cells, the Foxp3 staining varied strikingly depending on the antibody or the fixation/permeabilization buffer used. Our results indicated that the fixation/permeabilization buffers had the most important influence on the quantity of mouse Treg cells. Notably, the clone of anti-mouse Foxp3 anti-bodies and fluorochromes also influenced the quality of Foxp3 staining. We observed that the FJK-16s clone coupled to PE yielded statistically higher levels of Foxp3 cells and clearer separation of Foxp3+ and Foxp3- populations than the other antibodies. Our findings highlight-ed that it was necessary to use the same staining conditions during the course of a particular study; for example, when measuring intergroup or intragroup variations over time. The align-ment results demonstrated that the homology of Foxp3 75-125 amino acids between mouse and other mammal species was greater than that of Foxp3 1-87 amino acids, and therefore,
Speciesa 1-87 amino acidsb 75-125 amino acidsb
Norway rat 95.402 96.078Cattle 80.460 94.118Dog 81.609 90.196Horse 81.609 94.118Pig 73.563 94.118Sheep 79.301 94.118Cat 78.161 92.157Human 63.218 23.529
Figure 5. Sequence alignment of Foxp3 amino acid residues 1–125 from various species. For scientific names and accession numbers of mammalian species examined in this study please refer to Table 1.
Table 1. Sequence alignment of Foxp3 amino residues 1-87 and 75-125 between murine and other mammalian species.
aAccession Nos. for protein sequences are given in parentheses: mouse = Mus musculus (NP_473380). Norway rat = Rattus norvegicus (NP_001101720); cattle = Bos taurus (NP_001039398); dog = Canis familiaris (NP_001161933); horse = Equus caballus (NP_001156744); pig = Sus scrofa (NP_001121910); sheep = ovis aries (NP_001138419.1); cat = Felis catus (NP_001077421); human = Homo sapiens (NP_001107849). bFoxp3 amino acid residues 1-87 and 75-125 represent the binding regions of the MF23 and the FJK-16s monoclonal antibodies, respectively. Sequence alignments were obtained from pairwise p-distances computed with DNAMAN 6.0.
6544
©FUNPEC-RP www.funpecrp.com.brGenetics and Molecular Research 12 (4): 6535-6545 (2013)
Y.L. Sun et al.
the FJK-16s clone is also more appropriate for the detection of bovine, porcine, canine, ovine, equine, and feline Foxp3.
However, the CD25 staining did not depend on the staining assay for mouse Treg cells, which was different from the staining of human CD25 (Shevach, 2001; Lühn et al., 2007). Furthermore, regardless of the percentage or the number, there was a highly significant positive correlation between CD25+ T cells and CD25+Foxp3+ T cells using the Foxp3-PE antibodies from eBioscience combined with its own Foxp3 staining buffer set. Therefore, the CD25 marker can be used as an alternative to the Foxp3 antibody in the detection of mouse Treg cells when using the combination mentioned above.
In brief, the present study aids in the optimization of flow cytometry staining panels for the identification of Treg cells in various mammal species, and highlights the importance of the choice of the antibody, fluorochrome, and fixation/permeabilization buffer to achieve optimal results, which should greatly facilitate comparative studies between these species and humans, and is helpful for future studies of human diseases based on these mammal models. Moreover, the results from this study will assist future work to characterize the function of the Treg cells in these animals, which is useful for addressing questions relevant to animal health.
ACKNOWLEDGMENTS
Research supported by the National Natural Science Foundation of China (Grant #81171981) and the National High Technology Research and Development Program of China (Grant #2011AA02A116).
REFERENCES
Bolzer K, Kaser T, Saalmuller A and Hammer SE (2009). Molecular characterisation of porcine Forkhead-box p3 (Foxp3). Vet. Immunol. Immunopathol. 132: 275-281.
Brunkow ME, Jeffery EW, Hjerrild KA, Paeper B, et al. (2001). Disruption of a new forkhead/winged-helix protein, scurfin, results in the fatal lymphoproliferative disorder of the scurfy mouse. Nat. Genet. 27: 68-73.
Fazekas de St Groth B, Zhu E, Asad S and Lee L (2011). Flow cytometric detection of human regulatory T cells. Meth. Mol. Biol. 707: 263-279.
Gerner W, Stadler M, Hammer SE, Klein D, et al. (2010). Sensitive detection of Foxp3 expression in bovine lymphocytes by flow cytometry. Vet. Immunol. Immunopathol. 138: 154-158.
Grant J, Bourcier K, Wallace S, Pan D, et al. (2009). Validated protocol for FoxP3 reveals increased expression in type 1 diabetes patients. Cytometry B Clin. Cytometry 76: 69-78.
Hodgson R, Christiansen D, Ziolkowski A, Mouhtouris E, et al. (2011). Prolonged xenograft survival induced by inducible costimulator-Ig is associated with increased forkhead box P3(+) cells. Transplantation 91: 1090-1097.
Hori S, Nomura T and Sakaguchi S (2003). Control of regulatory T cell development by the transcription factor Foxp3. Science 299: 1057-1061.
Izcue A, Hue S, Buonocore S, Arancibia-Carcamo CV, et al. (2008). Interleukin-23 restrains regulatory T cell activity to drive T cell-dependent colitis. Immunity 28: 559-570.
Janikashvili N, LaCasse CJ, Larmonier C, Trad M, et al. (2011). Allogeneic effector/memory Th-1 cells impair FoxP3+ regulatory T lymphocytes and synergize with chaperone-rich cell lysate vaccine to treat leukemia. Blood 117: 1555-1564.
Law JP, Hirschkorn DF, Owen RE, Biswas HH, et al. (2009). The importance of Foxp3 antibody and fixation/permeabilization buffer combinations in identifying CD4+CD25+Foxp3+ regulatory T cells. Cytometry A 75: 1040-1050.
Lei Y, Ripen AM, Ishimaru N, Ohigashi I, et al. (2011). Aire-dependent production of XCL1 mediates medullary accumulation of thymic dendritic cells and contributes to regulatory T cell development. J. Exp. Med. 208: 383-394.
Lühn K, Simmons CP, Moran E, Dung NT, et al. (2007). Increased frequencies of CD4+CD25high regulatory T cells in acute dengue infection. J. Exp. Med. 204: 979-985.
Pillai V and Karandikar NJ (2008). Attack on the clones? Human FOXP3 detection by PCH101, 236A/E7, 206D, and

6545
©FUNPEC-RP www.funpecrp.com.brGenetics and Molecular Research 12 (4): 6535-6545 (2013)
Influence of Foxp3 antibody/buffer on Tregs detection
259D reveals 259D as the outlier with lower sensitivity. Blood 111: 463-464.Pinheiro D, Singh Y, Grant CR, Appleton RC, et al. (2011). Phenotypic and functional characterization of a CD4+ CD25high
FOXP3high regulatory T-cell population in the dog. Immunology 132: 111-122.Presicce P, Moreno-Fernandez ME, Lages CS, Orsborn KI, et al. (2010). Association of two clones allows for optimal
detection of human FOXP3. Cytometry A 77: 571-579.Prochazkova J, Fric J, Pokorna K, Neuwirth A, et al. (2009). Distinct regulatory roles of transforming growth factor-beta
and interleukin-4 in the development and maintenance of natural and induced CD4+ CD25+ Foxp3+ regulatory T cells. Immunology 128: e670-e678.
Robbin MG, Wagner B, Noronha LE, Antczak DF, et al. (2011). Subpopulations of equine blood lymphocytes expressing regulatory T cell markers. Vet. Immunol. Immunopathol. 140: 90-101.
Rocchi MS, Wattegedera SR, Frew D, Entrican G, et al. (2011). Identification of CD4+CD25high Foxp3+ T cells in ovine peripheral blood. Vet. Immunol. Immunopathol. 144: 172-177.
Sakaguchi S, Yamaguchi T, Nomura T and Ono M (2008). Regulatory T cells and immune tolerance. Cell 133: 775-787.Shevach EM (2001). Certified professionals: CD4+CD25+ suppressor T cells. J. Exp. Med. 193: F41-F46.Tran DQ, Ramsey H and Shevach EM (2007). Induction of FOXP3 expression in naive human CD4+FOXP3- T cells by
T-cell receptor stimulation is transforming growth factor-beta dependent but does not confer a regulatory phenotype. Blood 110: 2983-2990.
Tsang J, Jiang S, Tanriver Y, Leung E, et al. (2006). In-vitro generation and characterisation of murine CD4+CD25+ regulatory T cells with indirect allospecificity. Int. Immunopharmacol. 6: 1883-1888.