applicability of electro-osmotic flow for the analysis of
TRANSCRIPT
RSC Advances
PAPER
Ope
n A
cces
s A
rtic
le. P
ublis
hed
on 1
3 Fe
brua
ry 2
020.
Dow
nloa
ded
on 1
2/1/
2021
1:4
7:18
PM
. T
his
artic
le is
lice
nsed
und
er a
Cre
ativ
e C
omm
ons
Attr
ibut
ion
3.0
Unp
orte
d L
icen
ce.
View Article OnlineView Journal | View Issue
Applicability of e
aUniversity of Maribor, Faculty of Me
Characterization and Processing of Poly
Slovenia. E-mail: [email protected] of Maribor, Faculty of Chemistr
17, 2000 Maribor, SloveniacAnton-Paar GmbH, Anton-Paar-Str. 20, A-8
† Electronic supplementary informationhydrodynamic diameter of latex tracerimage of latex tracer particle degradatparticles at differently applied voltages tpotential and effect of sample onto la10.1039/c9ra10414c
Cite this: RSC Adv., 2020, 10, 6777
Received 11th December 2019Accepted 6th February 2020
DOI: 10.1039/c9ra10414c
rsc.li/rsc-advances
This journal is © The Royal Society o
lectro-osmotic flow for theanalysis of the surface zeta potential†
Olivija Plohl, *a Lidija Fras Zemljic,a Sanja Potrcab and Thomas Luxbacher c
The analysis of the surface zeta potential (SZP) opens up new possibilities in the characterization of various
materials used for scientific or industrial applications. It provides at the same time insight into the material
surface chemistry and elucidates the interactions with charged species in the aqueous test solution. For this
purpose, an accurate, reliable and repeatable analysis of the SZP is the key factor. This work focuses on
a detailed and systematic comparison of two electrokinetic techniques, i.e. the mapping of the electro-
osmotic flow (EOF) and the measurement of the streaming potential (SP), for the surface zeta potential
(SZP) determination of several materials with varying properties. Both techniques have advantages as well
as drawbacks. The applicability of latex polymer material and inorganic tracer particles at varying ionic
strength, the interaction between oppositely charged tracer particles and solid surfaces, the assessment
of the pH dependence of the SZP and the isoelectric point (IEP), and the effects of sample porosity and
conductance have been investigated. Although in some cases the EOF method gives a SZP similar to the
streaming potential measurement, especially when the tracer particle exhibits the same charge as the
solid surface, it was revealed that reliable results were only obtained with the streaming potential and
streaming current method. Several obstacles such as elevated conductivity at higher ionic strength, the
applied voltage for the EM measurement, and the nature of tracer particles lower the accuracy and
reliability of the SZP determined by the EOF method. It was shown that the EOF method is not
applicable to oppositely charged surface and tracer particles and also limited to low salinity conditions
especially when using polymeric tracer particles. Although the EOF method does not require the
formation of a capillary flow channel, it disables a non-destructive SZP of fragile or valuable samples,
such as QCM-D sensors, in comparison to the SP approach.
1. Introduction
When materials are brought into contact with an aqueoussolution, they acquire a surface electric charge by differentprocesses such as ionization, ion adsorption or ion dissolution.The need for charge compensation leads to the formation of aninterfacial charge distribution in the aqueous phase that isdescribed by the model of the electric double layer. Electroki-netic phenomena are induced by the movement of one of thephases (solid or liquid) relative to the second phase. The elec-trokinetic behaviour depends on the electric potential at the
chanical Engineering, Laboratory for
mers, Smetanova 17, 2000 Maribor,
y and Chemical Engineering, Smetanova
054 Graz, Austria
(ESI) available: Zeta potential andparticles at different ionic strength;ion; size distribution of tracer latexogether with determined surface zetatex tracer particle stability. See DOI:
f Chemistry 2020
shear plane between the charged surface and the electrolytesolution. This potential at the shear plane is called the elec-trokinetic or z potential (ZP).1 Different electrokinetic effectsexist depending on the way how the movement is induced.Electrophoresis, electro-osmosis, the streaming potential (SP)and electroacoustic represent the four electrokinetic measure-ment techniques from which zeta potential (ZP) is derived.1,2
In general, ZP represents the charge at the solid–waterinterface that affects materials functionality and at the sametime is the crucial parameter for the determination of thematerial's isoelectric point. Surface zeta potential (SZP) analysisis a vital method for qualifying important features of newmaterials in technical (e.g., effects of fouling and cleaning ofmembranes used for water treatment,3,4 textile industry5–7) andbiomedical applications (e.g. biolm formation, haemocom-patible implants8–11). Furthermore, it enables to gain insightsinto modication processes that result from surface treatmentor surface interactions with biological or natural environmentsunder near-ambient conditions.1,2 Thus, SZP is a key parameterfor understanding surface properties and for developing newspecialized materials, e.g., biomaterials that get in contact withblood, or virus retention lters in biopharmaceutical segments
RSC Adv., 2020, 10, 6777–6789 | 6777

RSC Advances Paper
Ope
n A
cces
s A
rtic
le. P
ublis
hed
on 1
3 Fe
brua
ry 2
020.
Dow
nloa
ded
on 1
2/1/
2021
1:4
7:18
PM
. T
his
artic
le is
lice
nsed
und
er a
Cre
ativ
e C
omm
ons
Attr
ibut
ion
3.0
Unp
orte
d L
icen
ce.
View Article Online
that specically require accurate, reliable and reproduciblemacroscopic surface SZP analyses.
Materials macroscopic SZP is commonly determined usingthe established streaming potential technique. The measure-ment of the SP (and alternatively of the streaming current) is thedirect approach to the SZP, where liquid ow through a capillarygenerates an electric potential. A pressure gradient is appliedbetween both ends of a capillary ow channel, which generatesliquid ow and the streaming potential signal. This electroki-netic effect is used to assess the surface charge of macroscopicsolids with a at surface, but also with more complex surfacessuch as porous material, bers, and granular media.12 Recently,an alternative indirect measurement technique for SZP of atsurfaces was introduced,13 and is comprising phase analysislight scattering (PALS) using mostly polymeric tracer particlesthrough electro-osmotic ow (EOF) mapping in a simple dip cellarrangement. Several studies were reported on using EOF forSZP determination in a dip cell,13–21 in a coated microchannelthat measures the mobility of known ZP of tracer particles closeto the surface,22 in a quartz cell having mostly non-ionichydroxypropyl-coated polystyrene tracer particles23–35 or withmicroelectrophoresis instrumentation modied to accommo-date quartz capillaries using sulphated polystyrene latex parti-cles.36 It relies on the principle that the electrophoretic mobilityof tracer particles dispersed in a liquid is affected by the surfacewhen these particles approach the solid sample. Each techniqueshows advantages and drawbacks. The EOF method requires anapparently smaller sample size compared to the SP method butdisables a non-destructive zeta potential analysis of fragile orvaluable samples, e.g., QCM-D sensors.37 The solid sample isheld in such way that if tracer particles sediment they do notdeposit on the sample surface.13–15 The SP method is verycompetitive due to its versatility to determine the surface zetapotential for various geometries of solid samples such as atsurfaces, bers, or granular media. Despite of the knownreputation of the SP method, there the following drawbacks areproposed in the literature when using this method. These werecorrelated to the needs for a careful sealing of the sample in themeasuring cell to accept the applied pressure gradient, to thelimited sensitivity at higher salinity of the aqueous test solution,and that the SP technique typically requires an instrument thatis solely dedicated to the SZP analysis.13,14 However, for a state-of-the-art SP analyser, these drawbacks have been overcome. Onthe other hand several authors have reported SZP results forvarious material types (13–21,23–35) obtained by the EOFmethod (indifferent congurations) using mostly polymeric tracer parti-cles. The problems observed in these studies were associatedwith a high measurement uncertainty that consequently lowersthe quality of the data15,16,24,27,38–40 especially for more complexsample surfaces (nanobers, membranes), difficulties indetermining the surface IEP when oppositely charged tracerparticles were exposed,15,18,19,26,29 or the observation of polymerictracer particles sedimentation and degradation (colour changeof tracer particle dispersion), which is even more pronouncedunder elevated ionic strength,15,19,24,28 that limits the applica-bility of the EOF method at high salinity conditions. Moreover,results from the EOF method showed also bad reproducibility
6778 | RSC Adv., 2020, 10, 6777–6789
and questionable reliability.17,28–31,33 Results were of varyingquality, for instance with 14% difference in the SZP when usingtwo different tracer particles under otherwise same measure-ment conditions in the dip cell19 and frequently compared withresults obtained by the SP method, just to mention a few.13–21
Additionally, research showed that EOF is not applicable tooppositely charged surface and tracer particles.22 In anotherpaper the need for the selection of non-ionic tracer particles wasalso pointed out in order to avoid electrostatic adsorption.20 Asan example it was not possible to observe a positive zetapotential below the IEP of glass (negatively charged at neutralpH) using negatively charged tracer particles.26,34 Taking allthese limitations into account, the necessity for a reliable,repeatable and reproducible SZP with minor measurementuncertainty is of particular concern, especially for the charac-terization of surface properties of more delicate materials suchas membranes or biomaterials.
In spite of the already available investigations that comparedthe SP method with the EOF technique in the dip cell arrange-ment with few types of materials, such as different polymericmembranes,15 glass13,14 and PVDF foil,13 a comparison betweenboth techniques for a wider range of materials and the study ofthe individual inuences on the measurements is still missing.To our knowledge, no such study on the detailed comparison ofthe EOF and the SPmethods for a range of inert, conductive andhighly porous materials with diverse properties has beenundertaken yet.
The comparison of both electrokinetic techniques, EOF andSP, was conducted on various materials (i.e. polyamide thin-lmcomposite membrane, pristine and chitosan-coated poly-propylene foil, cellulose acetate lter, silicon oxide wafer andNi-based alloy) that cover a wide range of possible applications(microlters for biopharmaceutical applications, membranesfor desalination, food packaging, wet processing of semi-conductor wafers, etc) and challenge both measurement tech-niques. In this way, the role of the chemical nature, the size andthe charge of tracer particles as a function of ionic strength, pH,solid material's IEP, porosity and conductivity was examined.The SZP obtained with the EOF method was compared to theSZP determined from the SP measurement. For all measuringconditions we focused on the reliability, reproducibility andaccuracy of the obtained SZP from both measuring techniques.
2. Materials and methods
FeSO4$7H2O was purchased from Riedel-De Haen,Fe2(SO4)3$7H2O, HCl ($37%), tetraethylorthosilicate (TEOS,$98%) were all purchased from Sigma-Aldrich. NH4OH (25%aqueous solution), NaOH (>98%) and acetone ($99.5%) werepurchased from Honeywell. Absolute EtOH (anhydrous) was ob-tained from CarloErba and citric acid ($99.5%, water free), KCl,HCl, and KOH were purchased from Roth. Albumin V frombovine serum (BSA) was purchased from Merck KgaA (USA). Allchemicals were used as received, without any further purication.Ultrapure water (with a resistivity of 18.2 MU cm obtained fromMilli-Q, Millipore Corporation, Massachusetts, USA) was usedthroughout the experiments. A latex dispersion standard with
This journal is © The Royal Society of Chemistry 2020
Paper RSC Advances
Ope
n A
cces
s A
rtic
le. P
ublis
hed
on 1
3 Fe
brua
ry 2
020.
Dow
nloa
ded
on 1
2/1/
2021
1:4
7:18
PM
. T
his
artic
le is
lice
nsed
und
er a
Cre
ativ
e C
omm
ons
Attr
ibut
ion
3.0
Unp
orte
d L
icen
ce.
View Article Online
a conductivity of 0.4 mS cm�1 and pH 9 was provided by AntonPaar GmbH. A silica nanoparticle dispersion was prepared fromTM-40 colloidal silica, 40 wt% suspension in H2O (Ludox, Sigma-Aldrich), with a conductivity of 4.85 mS cm�1 and pH 8.5–9.5.
2.1 Solid samples
One of the initial goals to use the SZP analysis was the charac-terization of the surface and interfacial charge of at sheetpolymer membranes.3 We therefore included a polyamide thin-lm composite membrane for reverse osmosis (SW30-HR, DowChemical, USA). For equilibration the RO membrane wassoaked in Milli-Q water prior to the SZP analysis. A poly-propylene lm with 50 mm thickness was obtained fromGoodfellow (Huntingdon, UK). A single-side polished siliconwafer (150 mm, thickness 675 mm) with a 1000 �A thick siliconoxide coating was cut into pieces of 20 mm � 10 mm (SiegertWafer, Aachen, Germany). Cellulose acetate microltrationmembranes with 0.2 mm and 0.45 mm pore size were obtainedfrom Sartorius (Gottingen, Germany). A foil of Hastelloy C-276(NiMoCr alloy, thickness 1 mm) was purchased from Good-Fellow, UK.
2.2 Preparation of chitosan-based PP foil
To achieve positive charge of the surface, the PP foil was func-tionalized with coating based on polysaccharide chitosan. Thesurface of PP was rst cleaned ultrasonically in a bath of 70%ethanolic solution for 5 min, aerwards dried in an oven at40 �C and nally activated for 20 min using ultraviolet-ozonesurface treatment; during the activation process, the surfacebecomes more hydrophilic and consequently better adhesion ofdispersions is obtained. The PP foil was functionalized in twolayers (layer-by-layer composition): as a (1) layer 2 wt% chitosanmacromolecular solution was applied and (2) layer was formedwith dispersion of chitosan nanoparticles with embeddedcinnamon extract. All the details of a solution preparation arepresented in our recently published paper.41 Aer application ofeach layer the foil was dried at room temperature. For modi-cation of the surface, the method of printing using a magnetwas used (roll printing).
2.3 Preparation of tracer particle dispersion
2.3.1 Latex tracer particles. The conductivity of the latextracer particle dispersion was 0.4 mS cm�1, which correspondsto an aqueous KCl solution with an ionic strength of 2 mM. Thelatex tracer particles were diluted volumetrically by the sameamount of predened KCl solution, in order to obtain an ionicstrength 1, 2, 5 and 10 mM. Specically, the 0.5 mL of the tracerparticles was diluted by 0.5 mL of selected KCl solution toachieve the appropriate nal ionic strength. It has to be pointedout that the exact mass content of the latex particles wasunknown but remained constant in the series of particledispersions of different ionic strength. For each SZP measure-ment, the solid sample was rinsed several times with Milli-Qwater and a fresh dispersion of the tracer particles wasprepared.
This journal is © The Royal Society of Chemistry 2020
2.3.2 1 wt% Ludox. The 1 wt% Ludox tracer particledispersion was prepared by diluting the 40 wt% stock solutionwith 2 mM KCl. The pH of the dispersion was adjusted with0.05 M KOH or 0.05 M HCl to pH 3, 5, 7 and 9.
2.3.3 0.1 wt% MNPs@SiO2. Magnetic nanoparticles basedon maghemite (MNPs) were synthesized under air atmosphereby the coprecipitation of Fe2+ and Fe3+ ions. Briey, an aqueoussolution of Fe2+ and Fe3+ (V ¼ 250 mL) with a molar ratio ofn(Fe2+) : n(Fe3+) ¼ 2.4 : 1 ratio was prepared by dissolving ironsulphate in ultrapure water. Aerwards, diluted aqueousammonia solution was slowly added to iron salts solution at pH3 to precipitate iron hydroxides. For the formation of MNPs,125 mL of ammonia solution (25%) was added to the abovemixture and additionally agitated with a magnetic stirrer for30 min. As-prepared MNPs were cleaned several times withdiluted ammonia solution and ultrapure water. Then, the stablecolloidal dispersion of MNPs was prepared using adsorption ofcitric acid. Here, 0.6 g of as-prepared bare MNPs were redis-persed in 30 mL of ultrapure water and 2.5 mL (0.5 g mL�1)citric acid aqueous solution was added. The pHwas raised to 5.2with diluted ammonia solution and put under reux for 1.5 h at80 �C. Aer reuxing, the pH of cooled dispersion was set to�10 with ammonia solution (25%). Stable MNPs were thencoated with thin silica shell (MNPs@SiO2). NH4OH was addedto stable MNPs dispersion (15 mg mL�1, pH ¼ 10.6). Themixture was agitated for 15 min and added rapidly to thesolution of EtOH and TEOS (10 mg mL�1). This was followedwith pH setting to 10.6, using 25% NH4OH. The coating processwas le to proceed for 2 h under continuous stirring. The ob-tained core–shell MNPs@SiO2 were cleaned to remove theexcess reagents using absolute EtOH and ultrapure water. Thedetails about the preparation of the MNPs@SiO2 and abouttheir characteristics can be found in the following ref. 42 and43. For the EOF analysis, 0.1 wt% dispersions of MNPs@SiO2 in2 mM KCl were prepared with the pH adjusted to pH 3, 5, 7 and9. Prior to be used as a tracer particle dispersion and to removepossible agglomerates, the dispersion was additionally lteredusing a 1 mm lter.
2.3.4 1 wt% BSA in 2 mM KCl. A 1 wt% BSA solution in2 mMKCl was prepared from Albumin Fraction V powder. pH 3,7 and 9 of the BSA solution was adjusted with 0.05 M KOH or0.05 M HCl. Prior to use, the BSA solution was ltered througha 0.25 mm membrane lter to remove any possible presentagglomerates.
2.4 Electro-osmotic ow mapping
The EOF experiments were performed with a Zetasizer Nano ZSequipped with a He–Ne laser (l ¼ 633 nm) and the SZP acces-sories (Malvern, UK). The signal for dynamic light scattering(DLS) was detected at 173� and for the electrophoretic mobilitymeasurement at 13�. The SZP analysis were conducted by themethod described by the Corbett et al.13 Briey, for the SZPanalysis the sample was cut into rectangular pieces not largerthan 7 mm � 4 mm (L � W) and attached via a double-sidedadhesive tape to the sample holder (7 mm � 4 mm, poly(etherether ketone), PEEK) perpendicular between the electrodes of
RSC Adv., 2020, 10, 6777–6789 | 6779
RSC Advances Paper
Ope
n A
cces
s A
rtic
le. P
ublis
hed
on 1
3 Fe
brua
ry 2
020.
Dow
nloa
ded
on 1
2/1/
2021
1:4
7:18
PM
. T
his
artic
le is
lice
nsed
und
er a
Cre
ativ
e C
omm
ons
Attr
ibut
ion
3.0
Unp
orte
d L
icen
ce.
View Article Online
the dip cell. The completed SZP cell was then placed into theelectrophoretic light scattering (ELS) instrument. It should benoted that special care was taken not to damage the samplesurface during the attachment to the sample holder. A coarsealignment of the zero position of the sample stage was per-formed using the height alignment tool. A disposable cuvettewas lled with 1.2 mL of the prepared aqueous tracer particledispersion and then the SZP cell was inserted. The latter shouldbe done by tilting the cuvette in order to avoid any bubblesbeing caught between sample and electrodes, and to ensure thatthe sample plate was entirely submerged. The nal alignment ofthe sample stage was performed using the count rate meter ofthe Zetasizer soware (version 7.12). It should be noted thatspecial attention has to be paid for the ne alignment sincehitting the sample surface with the laser beam gives a falseindication about the zero-position location that signicantlylowers the quality of the data. The attenuator was set to 11 (i.e.,the full intensity of the laser beam was used) and forwardscatter was selected for monitoring the ELS signal. The numberof ELS runs for the EMmeasurement was selected automaticallyand the measurements of the EM for each surface displacementwas repeated 3 times. The SZP was evaluated from themeasurement of the EM at 4 displacements with a step size of125 mm. For the EM measurement the applied voltage, theattenuation of the laser beam, and the number of consecutiveruns were adjusted automatically with 3 repetitions at 1500 mmdisplacement. The apparent EM of the tracer particles (whichmay be converted to an apparent zeta potential) was measuredat surface displacements of 125, 250, 375 and 500 mm using theslow eld reversal mode while the tracer particle mobility itselfwasmeasured at 1500 mmusing the fast eld reversal mode. Themeasurement relies on the assumption that the EOF at the solidsurface decays with increasing distance from the surface. Closeto the surface the velocity of the tracer particles will be domi-nated by the electroosmotic ow, while at distances far awayfrom the surface it will be dominated by its EM.
The apparent – zeta potential zapparent is calculated at eachdisplacement from the mobility measurement by
zapparent ¼ mapparenth/(3rel30) (1)
where mapparent is the apparent EM, h is the solution viscosity,3rel is the dielectric coefficient of the solvent, and 30 is thevacuum permittivity.
The SZP is then calculated by eqn (2) using the zeta potentialof the tracer particle (determined at a distance far from thesurface) and the intercept on the y-axis, which is obtained bya linear extrapolation of the experimental data for the particlemobility at various distances from the solid surface.
Surface zeta potential ¼ �intercept + tracer zeta potential (2)
2.5 SP and streaming current method
The measurement of the SP Ustr (and alternatively of thestreaming current Istr) is the direct approach to the SZP. Liquidow through a capillary generates an electric potential. This
6780 | RSC Adv., 2020, 10, 6777–6789
electrokinetic effect is used to assess the SZP for macroscopicsolids with a at surface. A pressure gradient Dp is appliedbetween both ends of a rectangular ow channel, whichgenerates liquid ow and the SP signal. The SP is recordedwithin a range of pressure differences and the slope of the lineardependence (the SP coupling coefficient dUstr/dDp) is used tocalculate the SZP according to eqn (3):
2 ¼ dUstr/dDp � h/(3rel � 30)kB (3)
kB is the electric conductivity of the aqueous test solution.The SP measurements were performed with SurPASS 3
(Anton Paar GmbH, Austria) using the adjustable gap cell formounting samples with a at surface. A pair of each samplewith a size of 20 mm � 10 mm was mounted on the sampleholder using double-sided adhesive tape. The distance betweensample surfaces was adjusted to 110 � 10 mm. The electrolytesolutions were 2 and 10 mM KCl and the pH was automaticallyadjusted with 0.05 M KOH and 0.05 M HCl. Prior to themeasurement the solid sample was equilibrated at neutral pHwith several rinsing steps and then pH was set to the alkalinerange. A pressure gradient of 200–600 mbar was applied togenerate the SP or the streaming current, which was measuredusing a pair of AgCl electrodes. For each individual pH, 3measurements were performed and the average SZP is reported.The electrolyte pH and conductivity were monitored using pHand conductivity probe, and all the experiments were done atroom temperature. Between individual sample analyses, theelectrolyte system was thoroughly rinsed with ultra-pure waterto ensure that any prior solution was removed.
3. Results and discussion3.1 Verication of the EOF method
3.1.1 Latex tracer particles properties. Polymer latexdispersions are commercially available and frequently used astracer particles for EOF mapping of the SZP.13–21 The hydrody-namic diameter of the latex tracer particles as function of ionicstrength did not differ signicantly and was found to be around350–360 nm (Fig. SI1a and b†). It can be seen that the latexparticles exhibit a narrow size distribution with no agglomer-ates present. Additionally, the ZP of the latex tracer particles wasshown to be around �45 mV in 2 mM KCl at pH 9 and similarmagnitude was observed regardless of the ionic strength(Fig. SI1a and c†). Since the hydrodynamic diameter but also theZP of the polymer latex particles did not change signicantlywithin the selected range of ionic strength (1–10 mM), theseprobe particles showed suitable characteristics for being usedas tracer particles for EOF mapping.
3.1.2 Reverse osmosis (RO) membrane. We have exem-plarily selected a commercial thin-lm composite at sheetpolyamide membrane for reverse osmosis as a solid sample forstudying the effect of the ionic strength as this knowledge is ofparamount importance for the application of the ROmembraneat environmentally relevant conditions. For this purpose, theskin side of the RO membrane was subjected to the EOF anal-ysis (Fig. 1a). Here, the parameters of the EOF mode of
This journal is © The Royal Society of Chemistry 2020
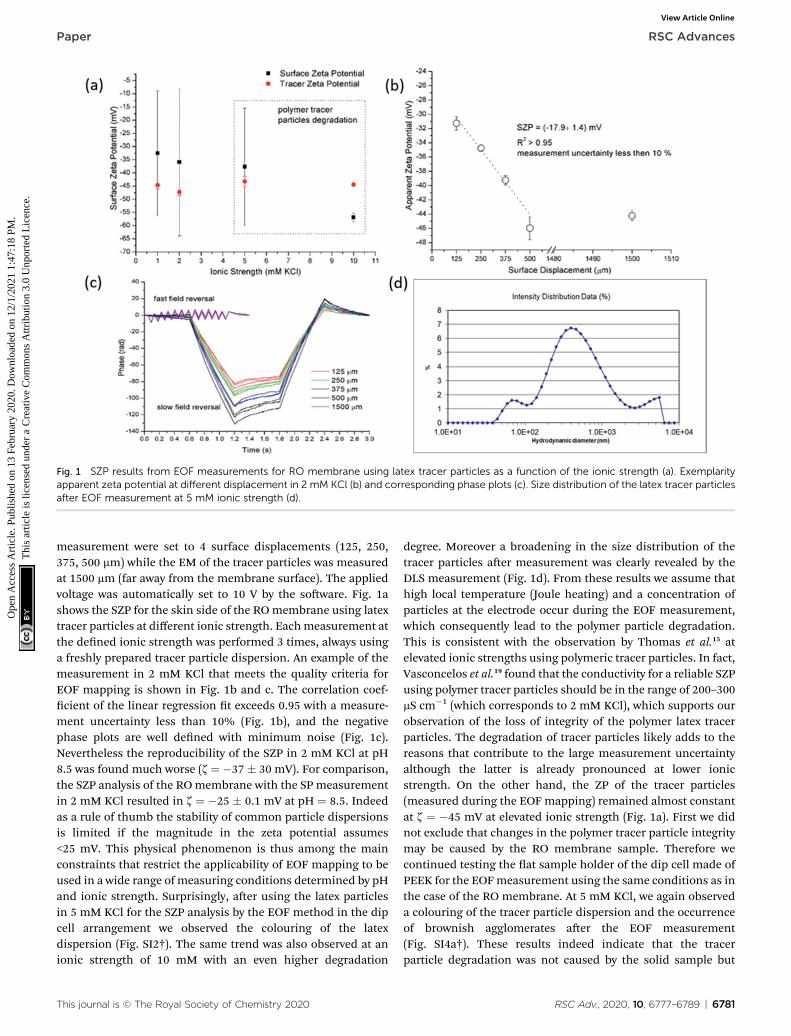
Fig. 1 SZP results from EOF measurements for RO membrane using latex tracer particles as a function of the ionic strength (a). Exemplarityapparent zeta potential at different displacement in 2 mM KCl (b) and corresponding phase plots (c). Size distribution of the latex tracer particlesafter EOF measurement at 5 mM ionic strength (d).
Paper RSC Advances
Ope
n A
cces
s A
rtic
le. P
ublis
hed
on 1
3 Fe
brua
ry 2
020.
Dow
nloa
ded
on 1
2/1/
2021
1:4
7:18
PM
. T
his
artic
le is
lice
nsed
und
er a
Cre
ativ
e C
omm
ons
Attr
ibut
ion
3.0
Unp
orte
d L
icen
ce.
View Article Online
measurement were set to 4 surface displacements (125, 250,375, 500 mm) while the EM of the tracer particles was measuredat 1500 mm (far away from the membrane surface). The appliedvoltage was automatically set to 10 V by the soware. Fig. 1ashows the SZP for the skin side of the ROmembrane using latextracer particles at different ionic strength. Eachmeasurement atthe dened ionic strength was performed 3 times, always usinga freshly prepared tracer particle dispersion. An example of themeasurement in 2 mM KCl that meets the quality criteria forEOF mapping is shown in Fig. 1b and c. The correlation coef-cient of the linear regression t exceeds 0.95 with a measure-ment uncertainty less than 10% (Fig. 1b), and the negativephase plots are well dened with minimum noise (Fig. 1c).Nevertheless the reproducibility of the SZP in 2 mM KCl at pH8.5 was found much worse (z ¼ �37 � 30 mV). For comparison,the SZP analysis of the ROmembrane with the SP measurementin 2 mM KCl resulted in z ¼ �25 � 0.1 mV at pH ¼ 8.5. Indeedas a rule of thumb the stability of common particle dispersionsis limited if the magnitude in the zeta potential assumes<25 mV. This physical phenomenon is thus among the mainconstraints that restrict the applicability of EOF mapping to beused in a wide range of measuring conditions determined by pHand ionic strength. Surprisingly, aer using the latex particlesin 5 mM KCl for the SZP analysis by the EOF method in the dipcell arrangement we observed the colouring of the latexdispersion (Fig. SI2†). The same trend was also observed at anionic strength of 10 mM with an even higher degradation
This journal is © The Royal Society of Chemistry 2020
degree. Moreover a broadening in the size distribution of thetracer particles aer measurement was clearly revealed by theDLS measurement (Fig. 1d). From these results we assume thathigh local temperature (Joule heating) and a concentration ofparticles at the electrode occur during the EOF measurement,which consequently lead to the polymer particle degradation.This is consistent with the observation by Thomas et al.15 atelevated ionic strengths using polymeric tracer particles. In fact,Vasconcelos et al.19 found that the conductivity for a reliable SZPusing polymer tracer particles should be in the range of 200–300mS cm�1 (which corresponds to 2 mM KCl), which supports ourobservation of the loss of integrity of the polymer latex tracerparticles. The degradation of tracer particles likely adds to thereasons that contribute to the large measurement uncertaintyalthough the latter is already pronounced at lower ionicstrength. On the other hand, the ZP of the tracer particles(measured during the EOF mapping) remained almost constantat z ¼ �45 mV at elevated ionic strength (Fig. 1a). First we didnot exclude that changes in the polymer tracer particle integritymay be caused by the RO membrane sample. Therefore wecontinued testing the at sample holder of the dip cell made ofPEEK for the EOFmeasurement using the same conditions as inthe case of the RO membrane. At 5 mM KCl, we again observeda colouring of the tracer particle dispersion and the occurrenceof brownish agglomerates aer the EOF measurement(Fig. SI4a†). These results indeed indicate that the tracerparticle degradation was not caused by the solid sample but
RSC Adv., 2020, 10, 6777–6789 | 6781
RSC Advances Paper
Ope
n A
cces
s A
rtic
le. P
ublis
hed
on 1
3 Fe
brua
ry 2
020.
Dow
nloa
ded
on 1
2/1/
2021
1:4
7:18
PM
. T
his
artic
le is
lice
nsed
und
er a
Cre
ativ
e C
omm
ons
Attr
ibut
ion
3.0
Unp
orte
d L
icen
ce.
View Article Online
occurred most likely due to the increased ionic strength. In theUzgiris dip cell arrangement44 the applied voltage determinesthe strength of the electric eld between the electrodes andtherefore the EM of the tracer particles. The SZP analysis in5 mM KCl was performed with a voltage of 10 V (this wasautomatically set in the Zetasizer soware). To see the effect ofthe applied voltage on the stability of the polymer latex tracerparticles, wemanually adjusted the voltage to 5 V, 10 V and 20 V,thereby keeping the ionic strength at 5 mM. The results of theseexperiments shown in Fig. SI4b† revealed an even worsebehaviour at a higher applied voltage with a completelydifferent size distribution of the latex tracer particles in 5 mMKCl aer completing the measurement (Fig. SI5†). The latterclearly indicates the unsuitability of this polymeric standardbeing used as tracer particles due to its degradation. The rstchange of the size distribution of tracer particles was observedalready at 5 V, while by increasing the voltage, the size distri-bution starts to broaden indicating the presence of agglomer-ates (Fig. SI3†). Moreover, with higher applied voltage also thelinear regression t resulted in a lower value of the correlationcoefficient, and the measurement uncertainty started toincrease (Fig. SI4b†).
Preliminary experiments clearly revealed that the standardpolymeric latex tracer particles are not suitable to be used astracer particles for the determination of the SZP using the EOFmode under certain conditions – especially in media close toambient conditions, where the materials' surfaces are exposedto even more complex aqueous environments. However, this isof paramount importance for measurements that allow for thephenomenological assessment of the solid materials' propertiesthat are mainly used for industrial purposes. Here, the accurateand reliable SZP analysis is important for the prediction of, e.g.,membrane performance. The lack of proper measurement canbe in the rst place attributed to polymeric tracer particledegradation (the degradation of the electrodes that are inte-grated in the dip cell was excluded) that signicantly inuencesthe absolute value and interpretation of the SZP. Furtherresearch was therefore focused on nding more inert, stableand appropriate inorganic tracer particles with a suitable size
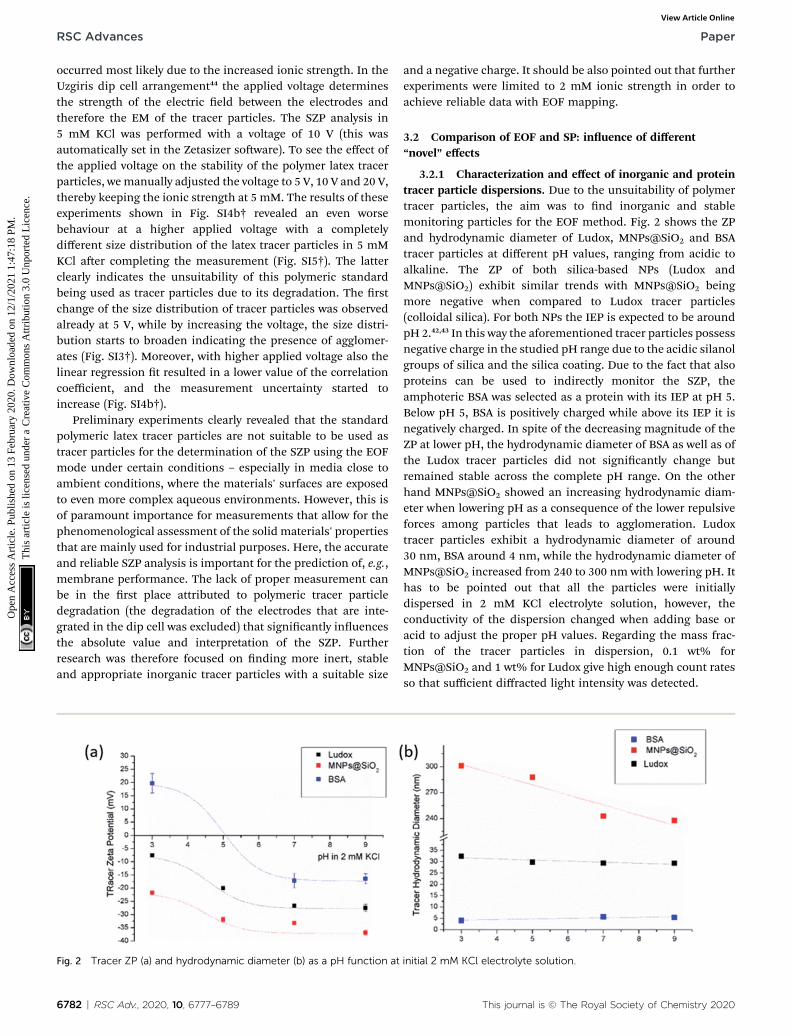
Fig. 2 Tracer ZP (a) and hydrodynamic diameter (b) as a pH function at
6782 | RSC Adv., 2020, 10, 6777–6789
and a negative charge. It should be also pointed out that furtherexperiments were limited to 2 mM ionic strength in order toachieve reliable data with EOF mapping.
3.2 Comparison of EOF and SP: inuence of different“novel” effects
3.2.1 Characterization and effect of inorganic and proteintracer particle dispersions. Due to the unsuitability of polymertracer particles, the aim was to nd inorganic and stablemonitoring particles for the EOF method. Fig. 2 shows the ZPand hydrodynamic diameter of Ludox, MNPs@SiO2 and BSAtracer particles at different pH values, ranging from acidic toalkaline. The ZP of both silica-based NPs (Ludox andMNPs@SiO2) exhibit similar trends with MNPs@SiO2 beingmore negative when compared to Ludox tracer particles(colloidal silica). For both NPs the IEP is expected to be aroundpH 2.42,43 In this way the aforementioned tracer particles possessnegative charge in the studied pH range due to the acidic silanolgroups of silica and the silica coating. Due to the fact that alsoproteins can be used to indirectly monitor the SZP, theamphoteric BSA was selected as a protein with its IEP at pH 5.Below pH 5, BSA is positively charged while above its IEP it isnegatively charged. In spite of the decreasing magnitude of theZP at lower pH, the hydrodynamic diameter of BSA as well as ofthe Ludox tracer particles did not signicantly change butremained stable across the complete pH range. On the otherhand MNPs@SiO2 showed an increasing hydrodynamic diam-eter when lowering pH as a consequence of the lower repulsiveforces among particles that leads to agglomeration. Ludoxtracer particles exhibit a hydrodynamic diameter of around30 nm, BSA around 4 nm, while the hydrodynamic diameter ofMNPs@SiO2 increased from 240 to 300 nm with lowering pH. Ithas to be pointed out that all the particles were initiallydispersed in 2 mM KCl electrolyte solution, however, theconductivity of the dispersion changed when adding base oracid to adjust the proper pH values. Regarding the mass frac-tion of the tracer particles in dispersion, 0.1 wt% forMNPs@SiO2 and 1 wt% for Ludox give high enough count ratesso that sufficient diffracted light intensity was detected.
initial 2 mM KCl electrolyte solution.
This journal is © The Royal Society of Chemistry 2020
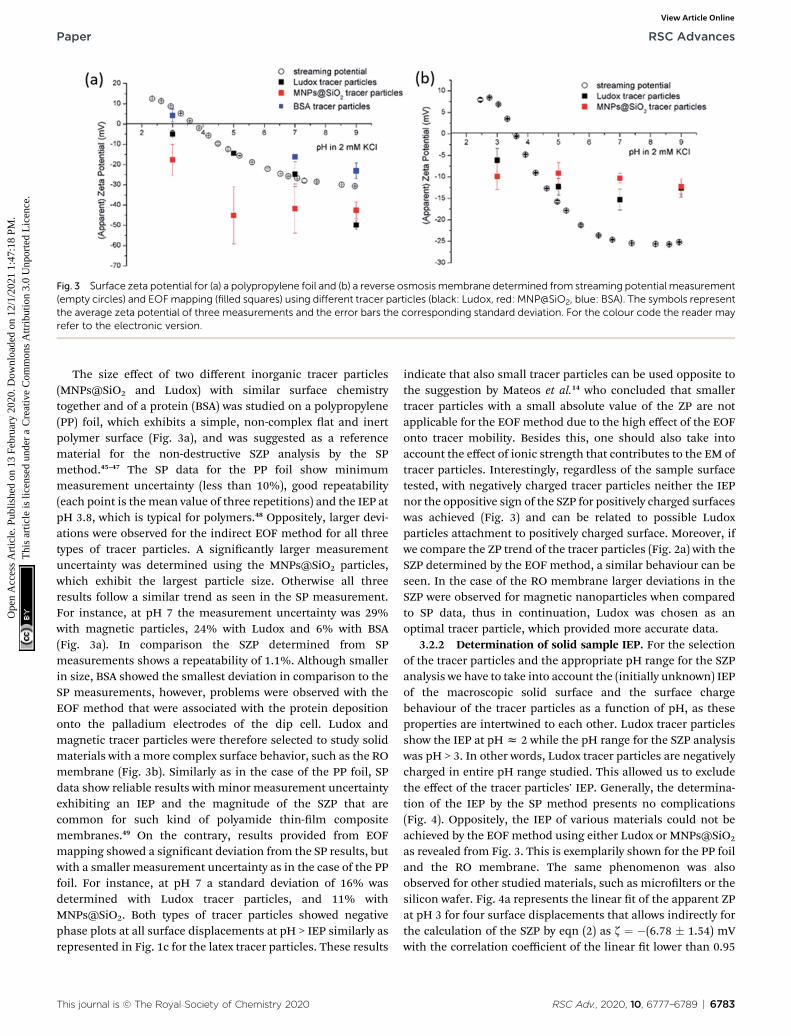
Fig. 3 Surface zeta potential for (a) a polypropylene foil and (b) a reverse osmosismembrane determined from streaming potential measurement(empty circles) and EOFmapping (filled squares) using different tracer particles (black: Ludox, red: MNP@SiO2, blue: BSA). The symbols representthe average zeta potential of three measurements and the error bars the corresponding standard deviation. For the colour code the reader mayrefer to the electronic version.
Paper RSC Advances
Ope
n A
cces
s A
rtic
le. P
ublis
hed
on 1
3 Fe
brua
ry 2
020.
Dow
nloa
ded
on 1
2/1/
2021
1:4
7:18
PM
. T
his
artic
le is
lice
nsed
und
er a
Cre
ativ
e C
omm
ons
Attr
ibut
ion
3.0
Unp
orte
d L
icen
ce.
View Article Online
The size effect of two different inorganic tracer particles(MNPs@SiO2 and Ludox) with similar surface chemistrytogether and of a protein (BSA) was studied on a polypropylene(PP) foil, which exhibits a simple, non-complex at and inertpolymer surface (Fig. 3a), and was suggested as a referencematerial for the non-destructive SZP analysis by the SPmethod.45–47 The SP data for the PP foil show minimummeasurement uncertainty (less than 10%), good repeatability(each point is the mean value of three repetitions) and the IEP atpH 3.8, which is typical for polymers.48 Oppositely, larger devi-ations were observed for the indirect EOF method for all threetypes of tracer particles. A signicantly larger measurementuncertainty was determined using the MNPs@SiO2 particles,which exhibit the largest particle size. Otherwise all threeresults follow a similar trend as seen in the SP measurement.For instance, at pH 7 the measurement uncertainty was 29%with magnetic particles, 24% with Ludox and 6% with BSA(Fig. 3a). In comparison the SZP determined from SPmeasurements shows a repeatability of 1.1%. Although smallerin size, BSA showed the smallest deviation in comparison to theSP measurements, however, problems were observed with theEOF method that were associated with the protein depositiononto the palladium electrodes of the dip cell. Ludox andmagnetic tracer particles were therefore selected to study solidmaterials with a more complex surface behavior, such as the ROmembrane (Fig. 3b). Similarly as in the case of the PP foil, SPdata show reliable results with minor measurement uncertaintyexhibiting an IEP and the magnitude of the SZP that arecommon for such kind of polyamide thin-lm compositemembranes.49 On the contrary, results provided from EOFmapping showed a signicant deviation from the SP results, butwith a smaller measurement uncertainty as in the case of the PPfoil. For instance, at pH 7 a standard deviation of 16% wasdetermined with Ludox tracer particles, and 11% withMNPs@SiO2. Both types of tracer particles showed negativephase plots at all surface displacements at pH > IEP similarly asrepresented in Fig. 1c for the latex tracer particles. These results
This journal is © The Royal Society of Chemistry 2020
indicate that also small tracer particles can be used opposite tothe suggestion by Mateos et al.14 who concluded that smallertracer particles with a small absolute value of the ZP are notapplicable for the EOF method due to the high effect of the EOFonto tracer mobility. Besides this, one should also take intoaccount the effect of ionic strength that contributes to the EM oftracer particles. Interestingly, regardless of the sample surfacetested, with negatively charged tracer particles neither the IEPnor the oppositive sign of the SZP for positively charged surfaceswas achieved (Fig. 3) and can be related to possible Ludoxparticles attachment to positively charged surface. Moreover, ifwe compare the ZP trend of the tracer particles (Fig. 2a) with theSZP determined by the EOF method, a similar behaviour can beseen. In the case of the RO membrane larger deviations in theSZP were observed for magnetic nanoparticles when comparedto SP data, thus in continuation, Ludox was chosen as anoptimal tracer particle, which provided more accurate data.
3.2.2 Determination of solid sample IEP. For the selectionof the tracer particles and the appropriate pH range for the SZPanalysis we have to take into account the (initially unknown) IEPof the macroscopic solid surface and the surface chargebehaviour of the tracer particles as a function of pH, as theseproperties are intertwined to each other. Ludox tracer particlesshow the IEP at pHz 2 while the pH range for the SZP analysiswas pH > 3. In other words, Ludox tracer particles are negativelycharged in entire pH range studied. This allowed us to excludethe effect of the tracer particles' IEP. Generally, the determina-tion of the IEP by the SP method presents no complications(Fig. 4). Oppositely, the IEP of various materials could not beachieved by the EOF method using either Ludox or MNPs@SiO2
as revealed from Fig. 3. This is exemplarily shown for the PP foiland the RO membrane. The same phenomenon was alsoobserved for other studied materials, such as microlters or thesilicon wafer. Fig. 4a represents the linear t of the apparent ZPat pH 3 for four surface displacements that allows indirectly forthe calculation of the SZP by eqn (2) as z ¼ �(6.78 � 1.54) mVwith the correlation coefficient of the linear t lower than 0.95
RSC Adv., 2020, 10, 6777–6789 | 6783

Fig. 4 Apparent zeta potential versus surface displacement for EOF method using Ludox tracer particles at pH 3 and initial 2 mM ionic strengthfor PP foil (a). In (b) corresponding phase plots are illustrated. The pressure ramp at pH 3 for PP foil obtained from SPmeasurement is shown in (c).
RSC Advances Paper
Ope
n A
cces
s A
rtic
le. P
ublis
hed
on 1
3 Fe
brua
ry 2
020.
Dow
nloa
ded
on 1
2/1/
2021
1:4
7:18
PM
. T
his
artic
le is
lice
nsed
und
er a
Cre
ativ
e C
omm
ons
Attr
ibut
ion
3.0
Unp
orte
d L
icen
ce.
View Article Online
(R2 ¼ 0.823). The bad correlation is in agreement with the cor-responding phase plots, which are undistinguishable and showa high degree of noise (Fig. 4b). Considering the IEP of the PPfoil we expect a positive SZP as obtained by the SP measure-ment. Such discrepancy was already reported for polymericmembranes.15 Therefore, the results obtained by the EOFmethod signicantly deviate from the expected SZP. The slopeof the dependence of the SP on the differential pressure for thePP foil at pH 3 clearly indicates a positive SZP (Fig. 4c). Theproblematic determination of the IEP has also been pointed outby other authors who reported that it was impossible to achievethe IEP using the EOF method in a microchannel congurationwith oppositely charged tracer particles and macroscopicsurface.22 The IEP could only be determined by extrapolation toz ¼ 0 mV.19 Another disadvantage of the EOF method is intro-duced by the increased conductivity at lower pH that causeschanges in the inorganic tracer particles' integrity (colouringand agglomeration of Ludox and MNPs@SiO2 tracer particles)at pH 5 and 3. This degradation has a negative impact on thequality of the obtained data and requires to use a fresh inor-ganic tracer particle dispersion for each separate measurement.
6784 | RSC Adv., 2020, 10, 6777–6789
Interestingly, by comparing the magnitude of the ZP of thetracer particle (Fig. 2a) and the solid surface (Fig. 4a), thesimilarity can be clearly recognized. The latter can possiblyindicate an adsorption of negatively charged Ludox tracerparticles onto the positively charged PP foil at pH 3. Hiratsukaet al.22 reported on a progressive attachment of tracer particlesonto an oppositely charged solid sample when using the EOFmethod in the microchannel conguration. As a next step westudied the effect of Ludox tracer particles on a positivelycharged solid surface at pH and ionic strength of the aqueoussolution appropriate for the EOF method.
3.2.3 Effect of opposite charge of solid surface. Theknowledge of an accurate SZP, for instance in active foodpackaging applications, where polymer lms are accordinglymodied to exhibit special features that prevents foodspoilage50 is of paramount importance. The polymer lms aremost of the times modied with different functional coatingsand successful surface modications can be followed by theSZP. Chitosan is commonly applied as an antimicrobialcoating.51–53 Therefore the SZP of a PP foil modied with chi-tosan, which introduces cationic charge (i.e. PP coated with
This journal is © The Royal Society of Chemistry 2020
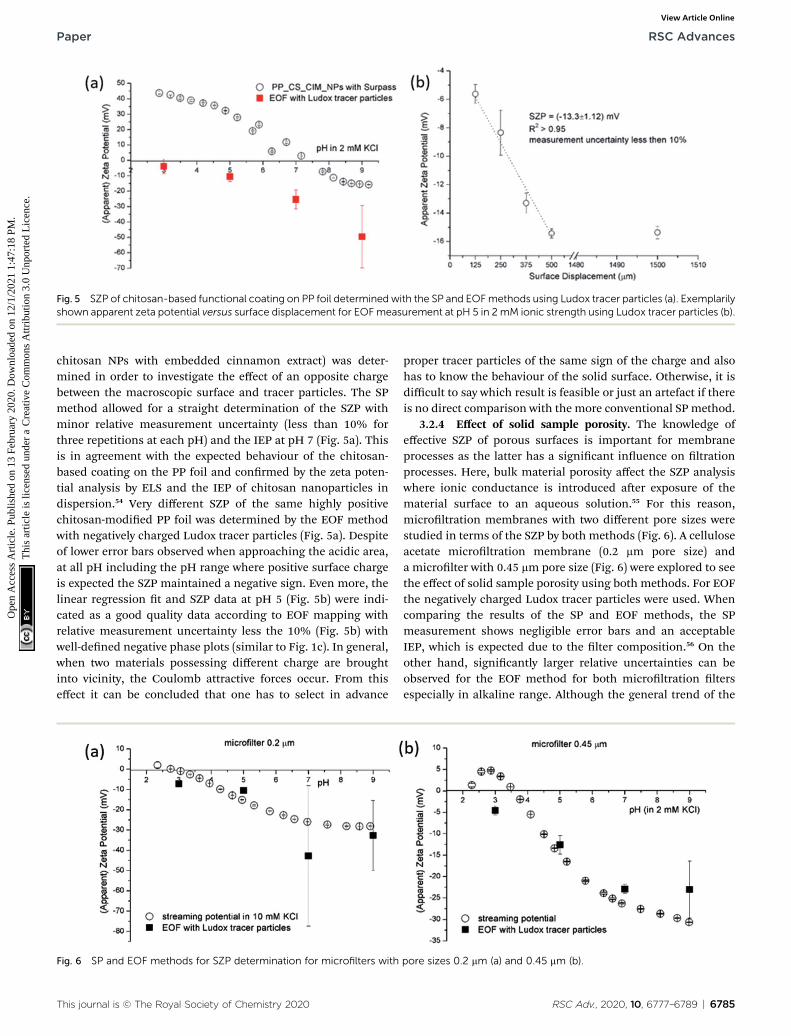
Fig. 5 SZP of chitosan-based functional coating on PP foil determined with the SP and EOFmethods using Ludox tracer particles (a). Exemplarilyshown apparent zeta potential versus surface displacement for EOFmeasurement at pH 5 in 2 mM ionic strength using Ludox tracer particles (b).
Paper RSC Advances
Ope
n A
cces
s A
rtic
le. P
ublis
hed
on 1
3 Fe
brua
ry 2
020.
Dow
nloa
ded
on 1
2/1/
2021
1:4
7:18
PM
. T
his
artic
le is
lice
nsed
und
er a
Cre
ativ
e C
omm
ons
Attr
ibut
ion
3.0
Unp
orte
d L
icen
ce.
View Article Online
chitosan NPs with embedded cinnamon extract) was deter-mined in order to investigate the effect of an opposite chargebetween the macroscopic surface and tracer particles. The SPmethod allowed for a straight determination of the SZP withminor relative measurement uncertainty (less than 10% forthree repetitions at each pH) and the IEP at pH 7 (Fig. 5a). Thisis in agreement with the expected behaviour of the chitosan-based coating on the PP foil and conrmed by the zeta poten-tial analysis by ELS and the IEP of chitosan nanoparticles indispersion.54 Very different SZP of the same highly positivechitosan-modied PP foil was determined by the EOF methodwith negatively charged Ludox tracer particles (Fig. 5a). Despiteof lower error bars observed when approaching the acidic area,at all pH including the pH range where positive surface chargeis expected the SZP maintained a negative sign. Even more, thelinear regression t and SZP data at pH 5 (Fig. 5b) were indi-cated as a good quality data according to EOF mapping withrelative measurement uncertainty less the 10% (Fig. 5b) withwell-dened negative phase plots (similar to Fig. 1c). In general,when two materials possessing different charge are broughtinto vicinity, the Coulomb attractive forces occur. From thiseffect it can be concluded that one has to select in advance
Fig. 6 SP and EOF methods for SZP determination for microfilters with
This journal is © The Royal Society of Chemistry 2020
proper tracer particles of the same sign of the charge and alsohas to know the behaviour of the solid surface. Otherwise, it isdifficult to say which result is feasible or just an artefact if thereis no direct comparison with the more conventional SP method.
3.2.4 Effect of solid sample porosity. The knowledge ofeffective SZP of porous surfaces is important for membraneprocesses as the latter has a signicant inuence on ltrationprocesses. Here, bulk material porosity affect the SZP analysiswhere ionic conductance is introduced aer exposure of thematerial surface to an aqueous solution.55 For this reason,microltration membranes with two different pore sizes werestudied in terms of the SZP by both methods (Fig. 6). A celluloseacetate microltration membrane (0.2 mm pore size) anda microlter with 0.45 mm pore size (Fig. 6) were explored to seethe effect of solid sample porosity using both methods. For EOFthe negatively charged Ludox tracer particles were used. Whencomparing the results of the SP and EOF methods, the SPmeasurement shows negligible error bars and an acceptableIEP, which is expected due to the lter composition.56 On theother hand, signicantly larger relative uncertainties can beobserved for the EOF method for both microltration ltersespecially in alkaline range. Although the general trend of the
pore sizes 0.2 mm (a) and 0.45 mm (b).
RSC Adv., 2020, 10, 6777–6789 | 6785
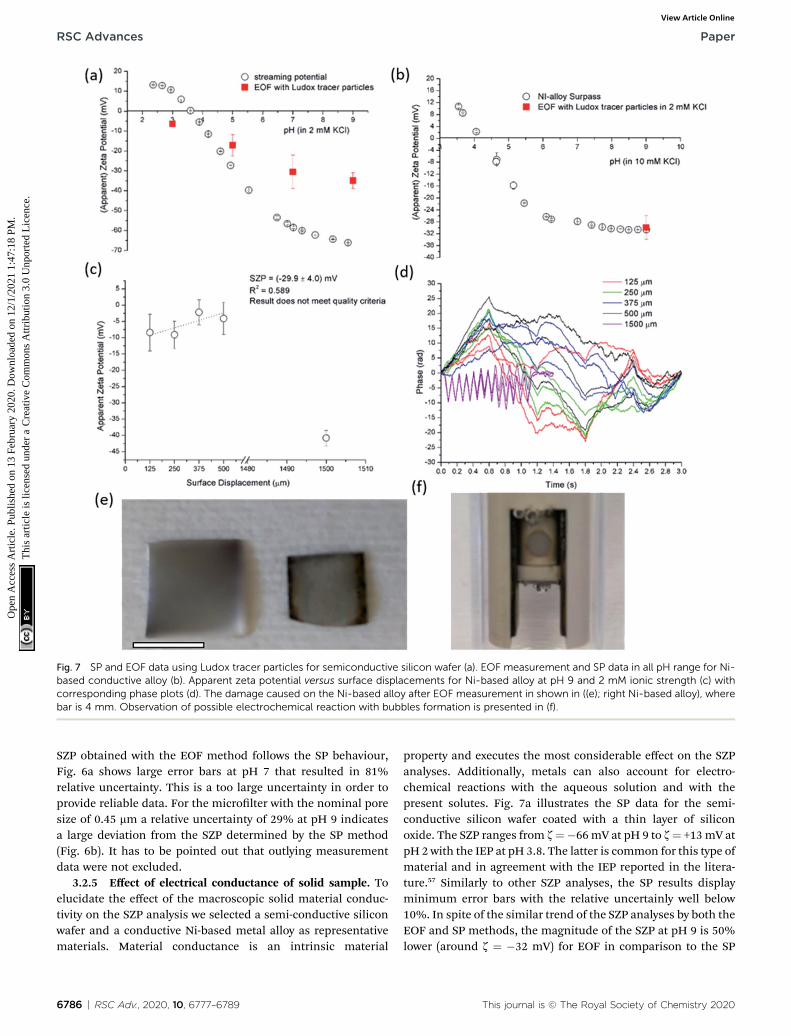
Fig. 7 SP and EOF data using Ludox tracer particles for semiconductive silicon wafer (a). EOF measurement and SP data in all pH range for Ni-based conductive alloy (b). Apparent zeta potential versus surface displacements for Ni-based alloy at pH 9 and 2 mM ionic strength (c) withcorresponding phase plots (d). The damage caused on the Ni-based alloy after EOF measurement in shown in ((e); right Ni-based alloy), wherebar is 4 mm. Observation of possible electrochemical reaction with bubbles formation is presented in (f).
RSC Advances Paper
Ope
n A
cces
s A
rtic
le. P
ublis
hed
on 1
3 Fe
brua
ry 2
020.
Dow
nloa
ded
on 1
2/1/
2021
1:4
7:18
PM
. T
his
artic
le is
lice
nsed
und
er a
Cre
ativ
e C
omm
ons
Attr
ibut
ion
3.0
Unp
orte
d L
icen
ce.
View Article Online
SZP obtained with the EOF method follows the SP behaviour,Fig. 6a shows large error bars at pH 7 that resulted in 81%relative uncertainty. This is a too large uncertainty in order toprovide reliable data. For the microlter with the nominal poresize of 0.45 mm a relative uncertainty of 29% at pH 9 indicatesa large deviation from the SZP determined by the SP method(Fig. 6b). It has to be pointed out that outlying measurementdata were not excluded.
3.2.5 Effect of electrical conductance of solid sample. Toelucidate the effect of the macroscopic solid material conduc-tivity on the SZP analysis we selected a semi-conductive siliconwafer and a conductive Ni-based metal alloy as representativematerials. Material conductance is an intrinsic material
6786 | RSC Adv., 2020, 10, 6777–6789
property and executes the most considerable effect on the SZPanalyses. Additionally, metals can also account for electro-chemical reactions with the aqueous solution and with thepresent solutes. Fig. 7a illustrates the SP data for the semi-conductive silicon wafer coated with a thin layer of siliconoxide. The SZP ranges from z¼�66mV at pH 9 to z¼ +13mV atpH 2 with the IEP at pH 3.8. The latter is common for this type ofmaterial and in agreement with the IEP reported in the litera-ture.57 Similarly to other SZP analyses, the SP results displayminimum error bars with the relative uncertainly well below10%. In spite of the similar trend of the SZP analyses by both theEOF and SP methods, the magnitude of the SZP at pH 9 is 50%lower (around z ¼ �32 mV) for EOF in comparison to the SP
This journal is © The Royal Society of Chemistry 2020
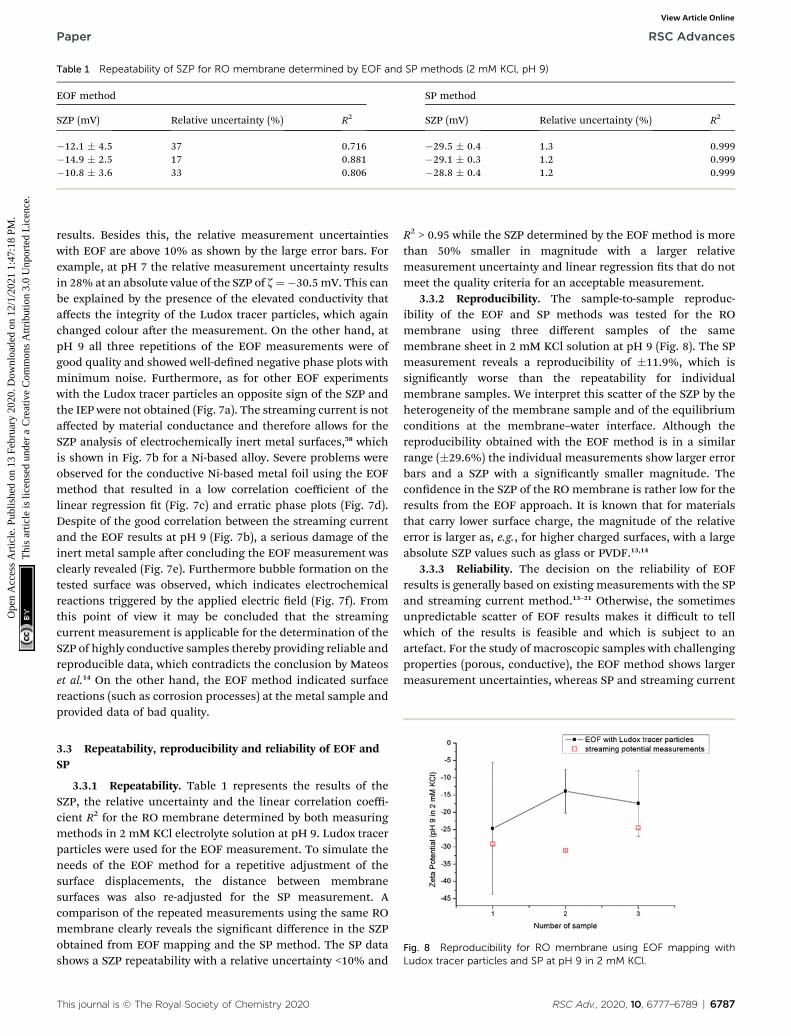
Table 1 Repeatability of SZP for RO membrane determined by EOF and SP methods (2 mM KCl, pH 9)
EOF method SP method
SZP (mV) Relative uncertainty (%) R2 SZP (mV) Relative uncertainty (%) R2
�12.1 � 4.5 37 0.716 �29.5 � 0.4 1.3 0.999�14.9 � 2.5 17 0.881 �29.1 � 0.3 1.2 0.999�10.8 � 3.6 33 0.806 �28.8 � 0.4 1.2 0.999
Paper RSC Advances
Ope
n A
cces
s A
rtic
le. P
ublis
hed
on 1
3 Fe
brua
ry 2
020.
Dow
nloa
ded
on 1
2/1/
2021
1:4
7:18
PM
. T
his
artic
le is
lice
nsed
und
er a
Cre
ativ
e C
omm
ons
Attr
ibut
ion
3.0
Unp
orte
d L
icen
ce.
View Article Online
results. Besides this, the relative measurement uncertaintieswith EOF are above 10% as shown by the large error bars. Forexample, at pH 7 the relative measurement uncertainty resultsin 28% at an absolute value of the SZP of z¼�30.5 mV. This canbe explained by the presence of the elevated conductivity thataffects the integrity of the Ludox tracer particles, which againchanged colour aer the measurement. On the other hand, atpH 9 all three repetitions of the EOF measurements were ofgood quality and showed well-dened negative phase plots withminimum noise. Furthermore, as for other EOF experimentswith the Ludox tracer particles an opposite sign of the SZP andthe IEP were not obtained (Fig. 7a). The streaming current is notaffected by material conductance and therefore allows for theSZP analysis of electrochemically inert metal surfaces,58 whichis shown in Fig. 7b for a Ni-based alloy. Severe problems wereobserved for the conductive Ni-based metal foil using the EOFmethod that resulted in a low correlation coefficient of thelinear regression t (Fig. 7c) and erratic phase plots (Fig. 7d).Despite of the good correlation between the streaming currentand the EOF results at pH 9 (Fig. 7b), a serious damage of theinert metal sample aer concluding the EOF measurement wasclearly revealed (Fig. 7e). Furthermore bubble formation on thetested surface was observed, which indicates electrochemicalreactions triggered by the applied electric eld (Fig. 7f). Fromthis point of view it may be concluded that the streamingcurrent measurement is applicable for the determination of theSZP of highly conductive samples thereby providing reliable andreproducible data, which contradicts the conclusion by Mateoset al.14 On the other hand, the EOF method indicated surfacereactions (such as corrosion processes) at the metal sample andprovided data of bad quality.
Fig. 8 Reproducibility for RO membrane using EOF mapping withLudox tracer particles and SP at pH 9 in 2 mM KCl.
3.3 Repeatability, reproducibility and reliability of EOF andSP
3.3.1 Repeatability. Table 1 represents the results of theSZP, the relative uncertainty and the linear correlation coeffi-cient R2 for the RO membrane determined by both measuringmethods in 2 mM KCl electrolyte solution at pH 9. Ludox tracerparticles were used for the EOF measurement. To simulate theneeds of the EOF method for a repetitive adjustment of thesurface displacements, the distance between membranesurfaces was also re-adjusted for the SP measurement. Acomparison of the repeated measurements using the same ROmembrane clearly reveals the signicant difference in the SZPobtained from EOF mapping and the SP method. The SP datashows a SZP repeatability with a relative uncertainty <10% and
This journal is © The Royal Society of Chemistry 2020
R2 > 0.95 while the SZP determined by the EOF method is morethan 50% smaller in magnitude with a larger relativemeasurement uncertainty and linear regression ts that do notmeet the quality criteria for an acceptable measurement.
3.3.2 Reproducibility. The sample-to-sample reproduc-ibility of the EOF and SP methods was tested for the ROmembrane using three different samples of the samemembrane sheet in 2 mM KCl solution at pH 9 (Fig. 8). The SPmeasurement reveals a reproducibility of �11.9%, which issignicantly worse than the repeatability for individualmembrane samples. We interpret this scatter of the SZP by theheterogeneity of the membrane sample and of the equilibriumconditions at the membrane–water interface. Although thereproducibility obtained with the EOF method is in a similarrange (�29.6%) the individual measurements show larger errorbars and a SZP with a signicantly smaller magnitude. Thecondence in the SZP of the RO membrane is rather low for theresults from the EOF approach. It is known that for materialsthat carry lower surface charge, the magnitude of the relativeerror is larger as, e.g., for higher charged surfaces, with a largeabsolute SZP values such as glass or PVDF.13,14
3.3.3 Reliability. The decision on the reliability of EOFresults is generally based on existing measurements with the SPand streaming current method.13–21 Otherwise, the sometimesunpredictable scatter of EOF results makes it difficult to tellwhich of the results is feasible and which is subject to anartefact. For the study of macroscopic samples with challengingproperties (porous, conductive), the EOF method shows largermeasurement uncertainties, whereas SP and streaming current
RSC Adv., 2020, 10, 6777–6789 | 6787

RSC Advances Paper
Ope
n A
cces
s A
rtic
le. P
ublis
hed
on 1
3 Fe
brua
ry 2
020.
Dow
nloa
ded
on 1
2/1/
2021
1:4
7:18
PM
. T
his
artic
le is
lice
nsed
und
er a
Cre
ativ
e C
omm
ons
Attr
ibut
ion
3.0
Unp
orte
d L
icen
ce.
View Article Online
show low measurement errors regardless of the samplecomplexity. One of the primary goals of the SZP analysis is thedetermination of the IEP. When comparing both techniques, weobserve problems to achieve the IEP by the EOF methodregardless of the type of material, which is not the case for theSP measurement. Increased ionic strength lowers the reliabilityof data obtained with the EOF method, which limits its appli-cation for environmentally relevant conditions. Even in dilutesolutions the EOF method fails to give reliable results at low pHdue to the increased conductivity that causes changes also inthe inorganic tracer particles' integrity. The analysis of oppo-sitely charged solid surfaces and tracer particles revealed againthe failure of the EOF method, which is caused by theunavoidable electrostatic attraction and requires the selectionof appropriate tracer particles depending on the (unknown)charge of the solid surface. A damage of the sample wasobserved in the case of the metal alloy (highly conductive),which limits the use of the EOF method to non-conductivematerials. Finally setting the zero position for the surfacedisplacement correlation is problematic since it signicantlyaffects the result of the EOF measurement.
4. Conclusions
In this report we compared in detail two different electrokineticphenomena for the SZP determination, i.e. the electro-osmoticow using tracer particles in a dip cell arrangement and theSP method. We took into account materials with differentsurface and bulk properties (roughness, porosity, electricconductivity) that are expected to inuence the SZP analysis. Forthe validation of the EOF mapping method, we investigated theeffects of the type of tracer particles, of the ionic strength, and ofthe applied voltage. The results revealed the unsuitability of thestandard latex dispersion to be used as tracer particles at anelectrolyte concentration exceeding 5 mM KCl, and at anapplied voltage between palladium electrodes of 5 V. Twodifferent silica-based tracer particles of different sizes were thuscompared, and more reliable data for the EOF method wereobtained with Ludox tracer particles. In general the indirect SZPanalysis by the EOF method showed a large difference andsignicantly higher measurement uncertainty when comparedto the SP method. Interestingly, for both negatively chargedtracer particles neither the IEP nor a positive sign of the SZPwere achieved for all solid samples studied. This was not thecase for the SP method. We explain the failure to obtaina positive SZP with negatively charged tracer particles bya possible electrostatic attraction of particles to the solidsurface. The effect of sample porosity was tested on usingmicroltration membranes with different pore size, which leadto large measurement uncertainties for the EOF method, whileminor error bars were obtained for the SP method. While thestreaming current measurement allowed for a reasonable andreliable SZP for conductive samples, several obstacles wereobserved during EOF mapping that resulted even in the surfacedamage of a stainless metal sample. Measurement repeat-ability, reproducibility and reliability for selected samples aresatisfactory when using the SP method, condence in for the
6788 | RSC Adv., 2020, 10, 6777–6789
SZP obtained by EOF mapping is rather low. The EOF methoddisables the use of the environmentally relevant ionic strengthdue to tracer particle degradation.
The benet of the EOFmethod is a smaller investment in theSZP accessory provided that a specic ELS instrument is alreadyavailable but the disadvantages are as obvious. We observea signicant consumption of tracer particles, which likelydegrade during the EOF measurement and require an exchangefor every single measurement. Moreover, longer measurementtimes are required correlated with the high labour cost andlonger measurement times. The manual adjustment of thesurface displacements using the dip cell and the preparation ofindividual dispersions of tracer particles at each pH requirea longer measurement time and the permanent attention of theoperator. On the other hand, only a fraction of the measuringtime and minimal user attention are required for the SPmethod.
In conclusion the reliability of SZP results obtained with theEOF method is recognized only by a comparison with the cor-responding SP measurement.
Conflicts of interest
There are no conicts to declare.
Acknowledgements
The nancial support of Ministry of Higher Education, Scienceand Sport of the Republic of Slovenia under contract C3330-17-529004 and from the Slovenian Research Agency (research corefunding no. P2-0118) is gratefully acknowledged.
References
1 R. J. Hunter, Zeta potential in colloid science: Principles andapplications, Academic Press, London, 1981.
2 D. J. Shaw, Introduction to colloid & surface chemistry,Butterworth-Heinemann, Oxford, 4th edn, 1992.
3 M. Elimelech, W. H. Chen and J. J. Waypa, Desalination,1994, 95, 269–286.
4 A. Imbrogno, A. Tiraferri, S. Abbenante, S. Weyand,R. Schwaiger, T. Luxbacher and A. I. Schafer, J. Membr. Sci.,2018, 549, 474–485.
5 K. Stana-Kleinschek and V. Ribitsch, Colloids Surf., A, 1998,140, 127–138.
6 A. M. Grancaric, A. Tarbuk and T. Pusic, Color. Technol.,2005, 121, 221–227.
7 I. Petrinic, H. Buksek, T. Luxbacher, T. Pusic and S. Bischof,J. Appl. Polym. Sci., 2018, 135, 1–8.
8 M. Espanol, G. Mestres, T. Luxbacher, J. B. Dory andM. P. Ginebra, ACS Appl. Mater. Interfaces, 2016, 8, 908–917.
9 M. Lorenzetti, G. Bernardini, T. Luxbacher, A. Santucci,S. Kobe and S. Novak, Biomed. Mater., 2015, 10, 45012.
10 B. J. Pedimonte, T. Moest, T. Luxbacher, C. Von Wilmowsky,T. Fey, K. A. Schlegel and P. Greil, Acta Biomater., 2014, 10,968–974.
This journal is © The Royal Society of Chemistry 2020

Paper RSC Advances
Ope
n A
cces
s A
rtic
le. P
ublis
hed
on 1
3 Fe
brua
ry 2
020.
Dow
nloa
ded
on 1
2/1/
2021
1:4
7:18
PM
. T
his
artic
le is
lice
nsed
und
er a
Cre
ativ
e C
omm
ons
Attr
ibut
ion
3.0
Unp
orte
d L
icen
ce.
View Article Online
11 M. S. Niepel, D. Peschel, X. Sisquella, J. A. Planell andT. Groth, Biomaterials, 2009, 30, 4939–4947.
12 V. Ribitsch, C. Jorde, J. Schurz and H. J. Jacobasch, Prog.Colloid Polym. Sci., 1988, 77, 49–54.
13 J. C. W. Corbett, F. Mcneil-watson, R. O. Jack andM. Howarth, Colloids Surf., A, 2012, 396, 169–176.
14 H. Mateos, A. Valentini, E. Robles, A. Brooker, N. Cioffi andG. Palazzo, Colloids Surf., A, 2019, 576, 82–90.
15 T. E. Thomas, S. Al Aani, D. L. Oatley-Radcliffe,P. M. Williams and N. Hilal, J. Membr. Sci., 2017, 523, 524–532.
16 M. A. E. Cruz, R. M. de Souza, L. G. Dias and A. P. Ramos,Thin Solid Films, 2017, 638, 433–440.
17 S. Al, C. J. Wright and N. Hilal, Desalination, 2018, 432, 115–127.
18 Y. Shim, H.-J. Lee, S. Lee, S.-H. Moon and J. Cho, Environ. Sci.Technol., 2002, 36, 3864–3871.
19 J. M. Vasconcelos, F. Zen, S. N. Stamatin, J. A. Behan andP. E. Colavita, Surf. Interface Anal., 2017, 49, 781–787.
20 N. J. W. Penfold, A. J. Parnell, M. Molina, P. Verstraete,J. Smets and S. P. Armes, Langmuir, 2017, 33, 14425–14436.
21 C. Zhao, G. Hu, D. Hou, L. Yu, Y. Zhao, J. Wang, A. Cao andY. Zhai, Sep. Purif. Technol., 2018, 202, 385–396.
22 K. Hiratsuka, T. Suzuki, E. Dzieminska and M. Ichiyanagi, J.Fluid Sci. Technol., 2018, 13, 1–14.
23 Y. Kakihana, L. Cheng, L. Fang, S. Wang, S. Jeon andD. Saeki, Colloids Surf., A, 2017, 533, 133–139.
24 H. Rho, K. Chon and J. Cho, Desalination, 2018, 427, 19–26.25 S. R. Suwarno, S. Hanada, T. H. Chong, S. Goto, M. Henmi
and A. G. Fane, Desalination, 2016, 387, 1–13.26 M. Kukizaki, Sep. Purif. Technol., 2009, 69, 87–96.27 T. Ishigami, K. Amano, A. Fujii, Y. Ohmukai, E. Kamio,
T. Maruyama and H. Matsuyama, Sep. Purif. Technol., 2012,99, 1–7.
28 T. Hongo-Hirasaki, M. Komuro and S. Ide, Biotechnol. Prog.,2010, 26(4), 1080–1087.
29 A. Hozumi, H. Inagai, Y. Yokogawa and T. Kameyama, ThinSolid Films, 2003, 437, 89–94.
30 M. J. Han, G. N. B. Barona and B. Jung, Desalination, 2011,270, 76–83.
31 N. Park, S. Lee, S. Yoon Ro, Y. Hoon Kim and J. Cho,Desalination, 2007, 202, 231–238.
32 J. Jang and W. Go, Fibers Polym., 2008, 9, 375–379.33 H. K. Shon, S. H. Kim, S. Vigneswaran, R. Ben Aim, S. Lee
and J. Cho, Desalination, 2009, 238, 10–21.34 P. Xu, E. Drewes, T.-U. Kim, C. Bellona and G. Amy, J. Membr.
Sci., 2006, 279, 165–175.35 S. Lee and J. Cho, Desalination, 2004, 160, 223–232.36 N. L. Burns, J. M. Van Alstine and J. M. Harris, Langmuir,
1995, 11, 2768–2776.
This journal is © The Royal Society of Chemistry 2020
37 B. Jachimska, S. Swiatek, J. I. Loch, K. Lewinski andT. Luxbacher, Bioelectrochemistry, 2018, 121, 95–104.
38 M. Vandenbossche, J. Dorst, M. Amberg, U. Schutz,P. Rupper, M. Heuberger and D. Hegemann, Polym.Degrad. Stab., 2018, 156, 259–268.
39 F. Croisier, P. Sibret, C. C. Dupont-Gillain, M. J. Genet,C. Detrembleur and C. Jerome, J. Mater. Chem. B, 2015, 3,3508–3517.
40 F. Croisier, G. Atanasova, Y. Poumay and C. Jerome, Adv.Healthcare Mater., 2014, 3, 2032–2039.
41 T. K. Glaser, O. Plohl, A. Vesel, U. Ajdnik, N. P. Ulrih,M. K. Hrncic, U. Bren and L. F. Zemljic, Materials, 2019,12, 2118.
42 O. Plohl, U. Ajdnik, S. Gyergyek, I. Ban, A. Vesel, T. K. Glaserand L. F. Zemljic, J. Environ. Chem. Eng., 2019, 7(1), 102913.
43 O. Plohl, M. Finsgar, S. Gyergyek, U. Ajdnik, I. Ban andL. Fras Zemljic, Nanomaterials, 2019, 9, 209.
44 E. E. Uzgiris, Prog. Surf. Sci., 1981, 10, 53–164.45 M. Bauman, A. Kosak, A. Lobnik, I. Petrinic and
T. Luxbacher, Colloids Surf., A, 2013, 422, 110–117.46 K. M. Ashraf, D. Giri, K. J. Wynne, D. A. Higgins and
M. M. Collinson, Langmuir, 2016, 32, 3836–3847.47 C. Wang, O. Zolotarskaya, K. M. Ashraf, X. Wen, D. E. Ohman
and K. J. Wynne, ACS Appl. Mater. Interfaces, 2019, 11, 20699–20714.
48 R. Zimmermann, U. Freudenberg, R. Schweiß, D. Kuttnerand C. Werner, Curr. Opin. Colloid Interface Sci., 2010, 15,196–202.
49 I. Owusu-Agyeman, A. Jeihanipour, T. Luxbacher andA. I. Schafer, J. Membr. Sci., 2017, 528, 82–94.
50 T. Tkavc, I. Petrinic, T. Luxbacher, A. Vesel, T. Ristic andL. F. Zemljic, Int. J. Adhes. Adhes., 2014, 48, 168–176.
51 T. Ristic, Z. Persin, M. Kralj Kuncic, I. Kosalec andL. F. Zemljic, Text. Res. J., 2019, 89, 748–761.
52 L. Fras-Zemljic, I. Kosalec, M. Munda, S. Strnad, M. Kolar,M. Bracic and O. Sauperl, Cellulose, 2015, 22, 1933–1942.
53 U. Ajdnik, L. F. Zemljic, M. Bracic, U. Maver, O. Plohl andJ. Rebol, Materials, 2019, 12, 1–20.
54 L. F. Zemljic, O. Plohl, A. Vesel, T. Luxbacher and S. Potrc,Int. J. Mol. Sci., 2020, 21, 495.
55 A. Yaroshchuk and T. Luxbacher, Langmuir, 2010, 26, 10882–10889.
56 A. E. Childress and S. S. Deshmukh, Desalination, 1998, 118,167–174.
57 S. Schwarz, K. J. Eichhorn, E. Wischerhoff andA. Laschewsky, Colloids Surf., A, 1999, 159, 491–501.
58 B. Martin Cabanas, J. Lutzenkirchen, S. Leclercq, P. Barbouxand G. Lefevre, J. Nucl. Mater., 2012, 430, 150–155.
RSC Adv., 2020, 10, 6777–6789 | 6789