applicability of an automatic surface detection approach ... · nates from the application of a...
TRANSCRIPT

This article was downloaded by: [The Nasa Goddard Library]On: 29 January 2015, At: 09:19Publisher: Taylor & FrancisInforma Ltd Registered in England and Wales Registered Number: 1072954 Registeredoffice: Mortimer House, 37-41 Mortimer Street, London W1T 3JH, UK
Click for updates
International Journal of RemoteSensingPublication details, including instructions for authors andsubscription information:http://www.tandfonline.com/loi/tres20
Applicability of an automatic surfacedetection approach to micro-pulsephoton-counting lidar altimetry data:implications for canopy height retrievalfrom future ICESat-2 dataMahsa S. Moussavia, Waleed Abdalatia, Ted Scambosab & AmyNeuenschwanderc
a Cooperative Institute for Research in Environmental Sciences(CIRES), University of Colorado, Boulder, CO, USAb National Snow and Ice Data Center (NSIDC), University ofColorado, Boulder, CO, USAc Applied Research Laboratories, University of Texas at Austin,Austin, TX, USAPublished online: 21 Jul 2014.
To cite this article: Mahsa S. Moussavi, Waleed Abdalati, Ted Scambos & Amy Neuenschwander(2014) Applicability of an automatic surface detection approach to micro-pulse photon-countinglidar altimetry data: implications for canopy height retrieval from future ICESat-2 data,International Journal of Remote Sensing, 35:13, 5263-5279, DOI: 10.1080/01431161.2014.939780
To link to this article: http://dx.doi.org/10.1080/01431161.2014.939780
PLEASE SCROLL DOWN FOR ARTICLE
Taylor & Francis makes every effort to ensure the accuracy of all the information (the“Content”) contained in the publications on our platform. However, Taylor & Francis,our agents, and our licensors make no representations or warranties whatsoever as tothe accuracy, completeness, or suitability for any purpose of the Content. Any opinionsand views expressed in this publication are the opinions and views of the authors,and are not the views of or endorsed by Taylor & Francis. The accuracy of the Contentshould not be relied upon and should be independently verified with primary sourcesof information. Taylor and Francis shall not be liable for any losses, actions, claims,proceedings, demands, costs, expenses, damages, and other liabilities whatsoever or

howsoever caused arising directly or indirectly in connection with, in relation to or arisingout of the use of the Content.
This article may be used for research, teaching, and private study purposes. Anysubstantial or systematic reproduction, redistribution, reselling, loan, sub-licensing,systematic supply, or distribution in any form to anyone is expressly forbidden. Terms &Conditions of access and use can be found at http://www.tandfonline.com/page/terms-and-conditions
Dow
nloa
ded
by [
The
Nas
a G
odda
rd L
ibra
ry]
at 0
9:19
29
Janu
ary
2015
Applicability of an automatic surface detection approach to micro-pulse photon-counting lidar altimetry data: implications for canopy
height retrieval from future ICESat-2 data
Mahsa S. Moussavia*, Waleed Abdalatia, Ted Scambosa,b, and Amy Neuenschwanderc
aCooperative Institute for Research in Environmental Sciences (CIRES), University of Colorado,Boulder, CO, USA; bNational Snow and Ice Data Center (NSIDC), University of Colorado, Boulder,
CO, USA; cApplied Research Laboratories, University of Texas at Austin, Austin, TX, USA
(Received 30 August 2013; accepted 13 June 2014)
We develop and validate an automated approach to determine canopy height, animportant metric for global biomass assessments, from micro-pulse photon-countinglidar data collected over forested ecosystems. Such a lidar system is planned to belaunched aboard the National Aeronautics and Space Administration’s follow-on Ice,Cloud and land Elevation Satellite mission (ICESat-2) in 2017. For algorithm devel-opment purposes in preparation for the mission, the ICESat-2 project team producedsimulated ICESat-2 data sets from airborne observations of a commercial micro-pulselidar instrument (developed by Sigma Space Corporation) over two forests in theeastern USA. The technique derived in this article is based on a multi-step mathema-tical and statistical signal extraction process which is applied to the simulated ICESat-2data set. First, ground and canopy surfaces are approximately extracted using thestatistical information derived from the histogram of elevations for accumulatedphotons in 100 footprints. Second, a signal probability metric is generated to helpidentify the location of ground, canopy-top, and volume-scattered photons. Accordingto the signal probability metric, the ground surface is recovered by locating thelowermost high-photon density clusters in each simulated ICESat-2 footprint.Thereafter, canopy surface is retrieved by finding the elevation at which the 95thpercentile of the above-ground photons exists. The remaining noise is reduced by cubicspline interpolation in an iterative manner. We validate the results of the analysisagainst the full-resolution airborne photon-counting lidar data, digital terrain models(DTMs), and canopy height models (CHMs) for the study areas. With ground surfaceresiduals ranging from 0.2 to 0.5 m and canopy height residuals ranging from 1.6 to2.2 m, our results indicate that the algorithm performs very well over forestedecosystems of canopy closure of as much as 80%. Given the method’s success in thechallenging case of canopy height determination, it is readily applicable to retrieval ofland ice and sea ice surfaces from micro-pulse lidar altimeter data. These results willadvance data processing and analysis methods to help maximize the ability of theICESat-2 mission to meet its science objectives.
1. Introduction
The Ice, Cloud, and land Elevation Satellite (ICESat) has returned unprecedented data onelevation changes over ice sheets, sea ice freeboard heights, cloud vertical distribution,and vegetation canopy height (e.g. Harding 2005; Kurtz et al. 2008; Zwally et al. 2005;Schutz et al. 2005; Shuman et al. 2006; Lefsky et al. 2005; Thomas et al. 2008; Yi,Zwally, and Sun 2005; Magruder et al. 2007; Fricker 2005; Kwok et al. 2007; Pang et al.
*Corresponding author. Email: [email protected]
International Journal of Remote Sensing, 2014Vol. 35, No. 13, 5263–5279, http://dx.doi.org/10.1080/01431161.2014.939780
© 2014 Taylor & Francis
Dow
nloa
ded
by [
The
Nas
a G
odda
rd L
ibra
ry]
at 0
9:19
29
Janu
ary
2015
2008; Zwally et al. 2008; Popescu et al. 2011; Rosette, North, and Suárez 2008). WithICESat’s successful demonstration of spaceborne lidar technology for cryosphere andecosystem applications, NASA (National Aeronautics and Space Administration) is devel-oping a follow-on mission, ICESat-2, scheduled to be launched around 2017. The ICESat-2 mission is expected to extend the time series of ICESat observations in order to fullycharacterize the trends in ice sheet and sea ice changes and detect the differences in thesetrends over time. It will carry a micro-pulse photon-counting lidar operating at 532 nmwavelength, named ATLAS (Advanced Topographic Laser Altimeter System) (Abdalatiet al. 2010). While measurement of land ice elevation, sea ice freeboard, and changes inthese variables is the primary science objective, estimation of terrestrial biomass andcarbon storage through assessments of vegetation canopy heights is an additional plannedcapability of the ICESat-2 mission (Abdalati et al. 2010). The mission’s ecosystemscience requirement states that ‘ICESat-2 shall produce elevation measurements thatenable independent determination of global vegetation height, with a groundtrack spacingof less than 2 km over a 2-year period (Level-1 science requirements and mission successcriteria available at http://icesat.gsfc.nasa.gov/icesat2/mission_overview.php)’.
As NASA moves forward with the development of the ICESat-2’s ATLAS instrument,the degree to which the current instrument design will yield data beneficial to thevegetation and ecosystem science community is not yet known. This uncertainty origi-nates from the application of a fundamentally different altimetry technology in ICESat-2as compared with the original ICESat mission. The use of a lower per-pulse laser energy(25–100 μJ) and photon-counting detection mechanism in the proposed ATLAS instru-ment configuration poses certain challenges for canopy height determination from futureICESat-2 data. Further challenges arise from the low reflectivity of soil (0.3) and vegeta-tion (0.1) and low atmospheric transmission at 532 nm. Depending upon vegetation type,crown density, atmospheric conditions, and solar elevation, the number of detected signalphotons reflected from the canopy-top and the underlying ground surface is expected torange between 0 and 10 for each laser shot. Additionally, the presence of photon eventsassociated with solar background noise and atmospheric scattering (above and within thecanopy and below the ground surface) further complicates the detection of signal returnsfrom vegetation and ground under canopy. The low signal levels, combined with thesubstantial background noise, will ultimately result in a very low signal-to-noise ratio(SNR) per footprint, introducing challenges to automatic retrieval of vegetation height.Therefore, sophisticated techniques are required to accurately extract the ground andcanopy surfaces to enable canopy height determination from future ICESat-2 data.Several Science Definition Team (SDT) members have been working to prototype auto-mated algorithms for canopy height determination. As part of ICESat-2’s SDT efforts andin direct support of the mission, we examine airborne micro-pulse lidar data, sub-sampledto the level expected for ICESat-2, in order to determine how best to extract vegetationcanopy height. Though not a definitive statement of what ICESat-2 capabilities will be,this work develops and validates an automated approach for vegetation height retrievalfrom micro-pulse photon-counting data that would be applicable to ICESat-2, and pro-vides important insights into the challenges to be expected and methods to overcomethem.
2. ICESat-2 measurement concept
The architecture of ICESat-2’s ATLAS instrument will differ from the Geoscience LaserAltimeter System (GLAS) that flew on ICESat. In contrast to GLAS’s single-beam, high-
5264 M.S. Moussavi et al.
Dow
nloa
ded
by [
The
Nas
a G
odda
rd L
ibra
ry]
at 0
9:19
29
Janu
ary
2015
energy, waveform-digitizing infrared lidar system, ATLAS will be a multi-beam, low-energy (25–100 μJ), photon-counting laser altimeter system operating at 532 nm (Yu et al.2010). The multi-beam design enables measurement of cross-track slopes on a per-orbitbasis, which were previously determined via several repeat-track and crossover analyses(Abdalati et al. 2010). The currently planned six-beam system has a 3 × 2 configuration,wider in cross-track direction, so that the footprints sweep out three pairs of tracks,consisting of strong and weak beams, that are separated by 3.3 km. Each laser pulsewill illuminate a 10 m-diameter spot on the ground every 70 cm (e.g. Abdalati et al. 2010;Yu et al. 2010).
The main differences between the ICESat-1 and -2 missions are the high- versus low-SNR system design and analogue versus digital detection mechanisms. In general, high-SNR systems, such as GLAS, favour simplified designs over weight, size, and powerconsumption, and do not use available photons efficiently (Cossio et al. 2010). ICESat-2’slidar, however, will rely on emission of much lower energy pulses at a higher repetitionrate ð10KHzÞ; which will enable a denser spatial sampling (Abdalati et al. 2010). Theaggregate pulse energy for 100 ATLAS strong-beam laser shots over a GLAS-equivalent70 m footprint is 10 mJ, which is about half that of GLAS.
The ATLAS instrument will record single photon events which are returned from afull distribution of surfaces illuminated by the laser pulse. With only a few detectedphotons per laser fire, accumulation of photon returns from hundreds of laser shots in thealong-track direction is required to reliably recover a target’s vertical structure (Degnan2002). The principal challenge in processing photon-counting data is the existence ofnoise photons due to ambient light and atmospheric scattering.
3. Collection of airborne micro-pulse lidar data over forested ecosystems
The ICESat-2 project team created ATLAS-like data from two airborne lidar campaignscollected by a commercial micro-pulse sensor developed by Sigma Space Corporation.During these campaigns in October 2009, the airborne micro-pulse lidar was flown overthe Pine Barren regions of Silas Little and Cedar Bridge in New Jersey and theSmithsonian Environmental Research Center (SERC) forest located in Maryland. Thedata are available from the NASA Goddard ICESat-2 website (http://icesat.gsfc.nasa.gov/icesat2/).
The Pine Barrens is a heavily forested, flat, and sandy ecosystem whose floracomposition is largely determined by fire frequency (Collins and Anderson 1994).Pitch pine (Pinus rigida) and shortleaf pine (Pinus echinata) are the most abundanttrees here. A variety of oaks grow among the pines, including black oak (Quercusvelutina), white oak (Quercus alba), post oak (Quercus stellata), chestnut (Quercusprinus), scarlet oak (Quercus coccinea), and blackjack oak (Quercus marilandica)(Collins and Anderson 1994). Here, the moderately dense canopy cover (70–80%)allows sunlight to penetrate and reach the forest floor, resulting in a well-developedand richly diversified understorey. In this article, the flightlines over the Pine Barrensare represented as Cedar-2 and Cedar-4.
The closed canopy SERC forests (with 33,500 trees of 84 species) are mostlycharacterized by their hardwood species. This site is mainly dominated by upland forestbut also comprises floodplain forests. The tree species in the upland forest include, but arenot limited to, the ‘tulip poplar’, several oaks (Quercus spp.), beech (Fagus grandifolia),and several hickories (Carya spp). The forest is also characterized by the mid-canopy ofred maple (Acer rubrum) and sour gum (Nyssa sylvatica), and an understorey composed
International Journal of Remote Sensing 5265
Dow
nloa
ded
by [
The
Nas
a G
odda
rd L
ibra
ry]
at 0
9:19
29
Janu
ary
2015

of American hornbeam (Carpinus caroliniana), spicebush (Lindera benzoin), and paw-paw (Asimina triloba). The tall floodplain forest (as high as 40 m) is largely dominated byash (Fraxinus spp), sycamore (Platanus occidentalis), and American elm (UlmusAmericana) (Parker 2012). The data acquired by a Sigma Space Corporation (Lanham,MD, USA) photon-counting lidar were collected along five tracks over the SERC forestsduring leaf-on conditions with canopy closure around 95%. Data over three of these tracks(represented in this article as SERC-1, SERC-3, and SERC-5) were used to create thesimulated ICESat-2 data.
Selection of these two forested ecosystems, the Pine Barrens and SERC, as study areasprovides an opportunity to assess the performance of the algorithm over moderately denseto dense canopy covers.
4. Simulated ICESat-2 data
To assess the performance of the automatic surface detection algorithm proposed in thisarticle, we used a simulated ICESat-2 data set that was created from the Sigma Space lidardata over two forested ecosystems (as discussed in the previous section). The SigmaSpace lidar instrument employed beam-scanning (100 beams), micro-pulse photon-count-ing technology operating at 532 nm, and a high repetition rate of 100 KHz (Barbieri et al.2009). Though employing similar technology, ICESat-2’s ATLAS instrument will haveonly six beams operating at fixed angles and a lower repetition rate of 10 kHz. As a resultof the design differences between the ATLAS instrument and the Sigma Space lidar, thecollected signal photon density was substantially higher than expected for ICESat-2.Hence, to produce ATLAS-like data, the airborne lidar data were down-sampled bothgeometrically and radiometrically (Herzfeld et al. 2013; Barbieri et al. 2009, 2010).
The data were first edited by Sigma Space such that many photons above the canopysurface and below the terrain surface were eliminated to produce a signal-only data set forfurther simulation. Then, the ICESat-2 project team resampled the photon returns in thesignal-only data set at a point spacing and photon density expected for ICESat-2 (Barbieriet al. 2009). A brief description of the methodology used to produce ICESat-2 simulateddata is provided below.
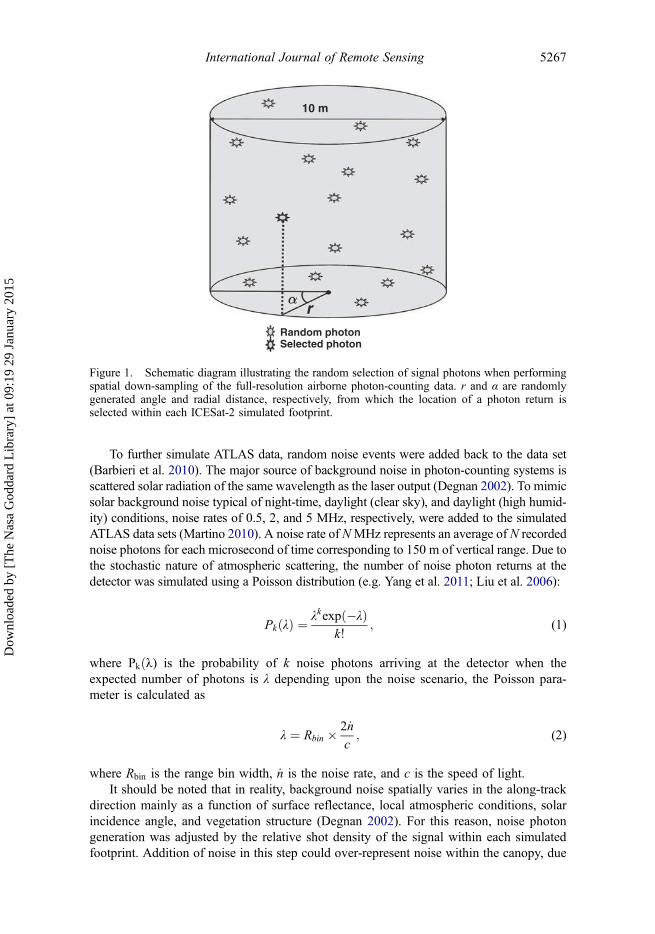
To emulate the spatial distribution of the future ICESat-2 data, 10 m-diameter foot-prints were specified every 70 cm along the aircraft ground track (Barbieri et al. 2009).For a given ICESat-2 footprint, the number of signal photons was calculated from aPoisson distribution with the mean parameter equal to the expected signal estimates, basedon the ATLAS instrument performance model for vegetated surfaces (Martino 2010). Themean number of signal photons per shot for our study sites was modelled at 1.93,representing the high-energy beam case in ICESat-2’s six-beam configuration (Martino2010). Within each simulated footprint, the location from which to select a return photonwas then determined by a randomly generated angle and radial distance. The radialdistance, r, was calculated from a Gaussian-weighted distribution (2-sigma diameter = 10m) and the angle α was calculated using a uniform distribution (Figure 1). The closestphoton to this location was selected within a 1 m buffer; however, if no photons werefound within this buffer size then none were selected for that footprint (Barbieri et al.2009). The choice of buffer size (also referred to as cap size) mainly depended on datadensity and computer time required for photon selection (see Herzfeld et al. (2013) fordetailed information). For each footprint location, random selection of photons wasrepeated until the desired number of photons (as specified by a Poisson distribution)was reached.
5266 M.S. Moussavi et al.
Dow
nloa
ded
by [
The
Nas
a G
odda
rd L
ibra
ry]
at 0
9:19
29
Janu
ary
2015
To further simulate ATLAS data, random noise events were added back to the data set(Barbieri et al. 2010). The major source of background noise in photon-counting systems isscattered solar radiation of the same wavelength as the laser output (Degnan 2002). To mimicsolar background noise typical of night-time, daylight (clear sky), and daylight (high humid-ity) conditions, noise rates of 0.5, 2, and 5 MHz, respectively, were added to the simulatedATLAS data sets (Martino 2010). A noise rate of NMHz represents an average of N recordednoise photons for each microsecond of time corresponding to 150 m of vertical range. Due tothe stochastic nature of atmospheric scattering, the number of noise photon returns at thedetector was simulated using a Poisson distribution (e.g. Yang et al. 2011; Liu et al. 2006):
PkðλÞ ¼ λkexpð�λÞk!
; (1)
where Pkðλ) is the probability of k noise photons arriving at the detector when theexpected number of photons is λ depending upon the noise scenario, the Poisson para-meter is calculated as
λ ¼ Rbin � 2 _n
c; (2)
where Rbin is the range bin width, _n is the noise rate, and c is the speed of light.It should be noted that in reality, background noise spatially varies in the along-track
direction mainly as a function of surface reflectance, local atmospheric conditions, solarincidence angle, and vegetation structure (Degnan 2002). For this reason, noise photongeneration was adjusted by the relative shot density of the signal within each simulatedfootprint. Addition of noise in this step could over-represent noise within the canopy, due
Random photon
rα
10 m
Selected photon
Figure 1. Schematic diagram illustrating the random selection of signal photons when performingspatial down-sampling of the full-resolution airborne photon-counting data. r and α are randomlygenerated angle and radial distance, respectively, from which the location of a photon return isselected within each ICESat-2 simulated footprint.
International Journal of Remote Sensing 5267
Dow
nloa
ded
by [
The
Nas
a G
odda
rd L
ibra
ry]
at 0
9:19
29
Janu
ary
2015
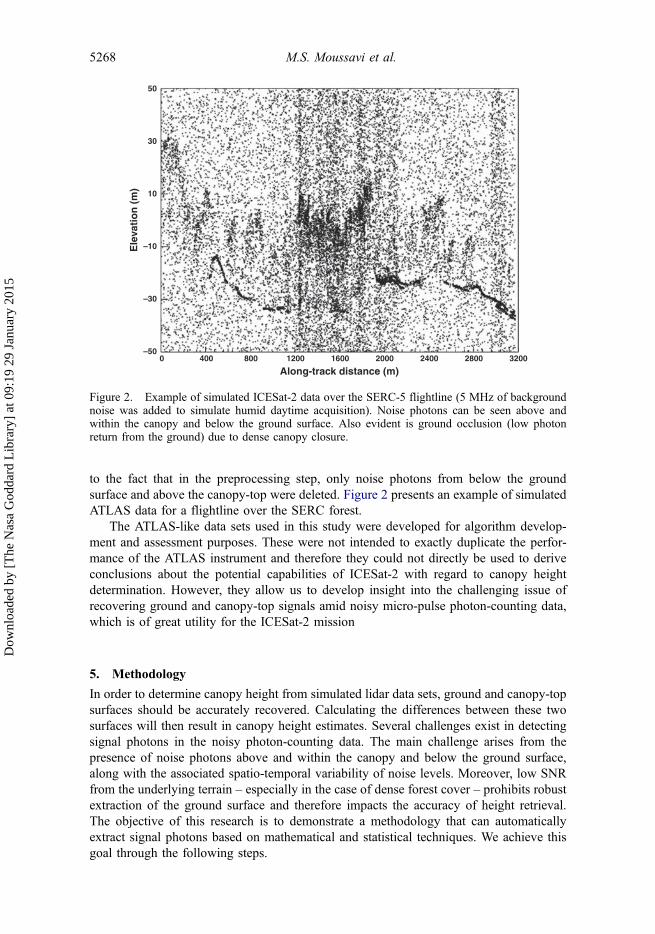
to the fact that in the preprocessing step, only noise photons from below the groundsurface and above the canopy-top were deleted. Figure 2 presents an example of simulatedATLAS data for a flightline over the SERC forest.
The ATLAS-like data sets used in this study were developed for algorithm develop-ment and assessment purposes. These were not intended to exactly duplicate the perfor-mance of the ATLAS instrument and therefore they could not directly be used to deriveconclusions about the potential capabilities of ICESat-2 with regard to canopy heightdetermination. However, they allow us to develop insight into the challenging issue ofrecovering ground and canopy-top signals amid noisy micro-pulse photon-counting data,which is of great utility for the ICESat-2 mission
5. Methodology
In order to determine canopy height from simulated lidar data sets, ground and canopy-topsurfaces should be accurately recovered. Calculating the differences between these twosurfaces will then result in canopy height estimates. Several challenges exist in detectingsignal photons in the noisy photon-counting data. The main challenge arises from thepresence of noise photons above and within the canopy and below the ground surface,along with the associated spatio-temporal variability of noise levels. Moreover, low SNRfrom the underlying terrain – especially in the case of dense forest cover – prohibits robustextraction of the ground surface and therefore impacts the accuracy of height retrieval.The objective of this research is to demonstrate a methodology that can automaticallyextract signal photons based on mathematical and statistical techniques. We achieve thisgoal through the following steps.
50
30
10
–10
–30
–500 400 800 1200 1600 2000
Along-track distance (m)
Ele
vati
on
(m
)
2400 2800 3200
Figure 2. Example of simulated ICESat-2 data over the SERC-5 flightline (5 MHz of backgroundnoise was added to simulate humid daytime acquisition). Noise photons can be seen above andwithin the canopy and below the ground surface. Also evident is ground occlusion (low photonreturn from the ground) due to dense canopy closure.
5268 M.S. Moussavi et al.
Dow
nloa
ded
by [
The
Nas
a G
odda
rd L
ibra
ry]
at 0
9:19
29
Janu
ary
2015

First, in order to roughly filter out noise events in the simulated ICESat-2 data, photonreturns from 100 laser shots (equivalent to a 70 m GLAS footprint) in the along-trackdirection are accumulated to subsequently generate a histogram of elevations. Here, weused an elevation bin size of 1 m and elevation range of 100 m to build the histogram. Thehistogram hðzÞ is smoothed by the central moving average method, formulated as
~hðz0;2qþ 1Þ ¼ 1
2qþ 1
Xq
k¼�q
hðzjÞ; (3)
where ~hðzÞ is the smoothed histogram, z is elevation, and q is the number of points aroundeach z0 2 fz�q; zqg over which averaging is performed (z�q and zq are the limits of theaveraging interval). The simulated data are then filtered according to the two ends of thehistogram with a three-standard deviation (3σÞ cut-off, removing the highest and lowestnoise events in the point cloud.
To approximate the location of signal photons, we calculate and analyse the cumula-tive elevation distribution for 100 footprints. The inflection point of the cumulativeelevation curve corresponds to the elevation at which the highest density of returnedphotons exists. In other words, the elevation interval within which the curve’s inflectionpoint falls represents the elevation range where a transition from low–high and high–lowphoton density occurs for the corresponding 70 m distance. We selected a 40 m elevationinterval around the inflection point to avoid over-filtering at this stage of the analysis.Photon events were classified as signal if they occurred within the 40 m elevation buffer.Extracted signal photons in this step could be those returning from either the canopy-top,the ground surface, or those reflected from within the canopy. Some background noisephotons are also misclassified as signal, but this is not of significance given that only anapproximation of signal locations is desired at this point.
To help identify signal photons more accurately, we generate a signal probabilitymetric that represents the normalized photon density around each photon in a rectangle inthe XZ plane (X is the along-track dimension and Z is the elevation dimension). The signalprobability vector (ΓÞfor all the photons in the point cloud ðGÞ is populated thus:
"Ψ iðxi; ziÞ 2 G; 1 � i � k;Di ¼ fΨðx; zÞjjx� xij � a&jz� zij � bg
γi ¼nðDiÞ
maxðnðDÞÞ ;Γ ¼
γ1γ2γ3
..
.
γk
26666664
37777775;
(4)
where Di defines a cloud of individual photons (ΨÞ, each at coordinates (x, z) around thecentre photon Ψ i at (xi, zi), from the first to the kth photon; a and b are the X and Zdimensions of the rectangle surrounding each photon Ψ i; γi is the normalized density ofphotons in each cloud Di, defined as the count of photons in each cloud (nðDiÞ) dividedby the maximum number of photons in any cloud (maxðnðDÞÞ); and Γ is the probabilityvector of all such normalized densities. We chose a ¼ 35 m to take advantage of thehorizontal trend in ground and canopy surfaces, and b ¼ 2 m to avoid mixed signals fromground and tree crown surfaces.
International Journal of Remote Sensing 5269
Dow
nloa
ded
by [
The
Nas
a G
odda
rd L
ibra
ry]
at 0
9:19
29
Janu
ary
2015

Points/photons with low signal probabilityðγÞ correspond well with the backgroundnoise photons (Figure 3); hence, to increase the SNR, these are removed from the pointcloud. For this purpose, a spline is fitted to the points of lowest signal probability. Photonsthat lie within 1–3 standard deviations of the spline, depending upon the noise scenario,are classified as noise and subsequently removed from the data. The filtered lidar datanow mainly consist of signal photons reflected from the ground surface/tree crowns andalso dense clusters of volume-scattered photons.
Using the filtered data, we recover the ground surface by finding the lowermostphotons in each 10 m-diameter footprint. To eliminate the outliers and reduce theeffect of misclassified noise photons, we use an iterative process based on cubic splineinterpolation. If photons lie within three standard deviations of the spline fit they areclassified as ground returns, otherwise they are removed. This process is repeatedthree times to ensure as much noise is removed as possible while still retainingenough data.
Once a ground surface is detected, we determine the canopy surface by finding theelevation at which 95% of above-ground photons exist in individual 10 m footprints. (Tomaintain consistency between algorithm development efforts, ICESat-2’s SDT proposedto define the canopy-top as where the 95th percentile of above-ground photons exists.) Toeliminate the remaining noise, the same filtering technique as in the ground location stepis performed. Finally, by applying the aforementioned sequence of processing steps anddifferencing the ground and canopy surfaces, we derive canopy height estimates from thesimulated ICESat-2 data.
1.0
0.8
0.6
0.4
0.2
0.00 300 600
Along-track distance (m)
Sig
nal
pro
bab
ility
900 1200 1500 1800 2100
Figure 3. Signal probability metric generated for Cedar-4 at Pine Barrens (5 MHz noise rate). Thismetric represents the normalized photon density around each photon in a rectangle in the XZ plane.The red points correspond to high-photon density clusters in the data; black points represent noisephotons to be removed; the blue line represents a spline fit to the lowermost high-density photons/points.
5270 M.S. Moussavi et al.
Dow
nloa
ded
by [
The
Nas
a G
odda
rd L
ibra
ry]
at 0
9:19
29
Janu
ary
2015
6. Results and validation
To investigate the performance of the proposed algorithm, we selected simulated ATLASdata sets of high laser energy and various noise levels. We then compared our ground andcanopy height estimates to those derived from the full-resolution photon-counting lidardata sets, a digital terrain model (DTM), and a canopy height model (CHM) at both SERCand the Pine Barrens forests. The DTMs and CHMs were previously generated fromindependent airborne discrete-return lidar data acquired in October 2008 and provided tothe ICESat-2 SDT for algorithm development and assessment purposes. It should be notedthat the statistics reported here do not necessarily reflect the absolute errors in canopyheight estimation. Several studies suggest that airborne lidars are likely to underestimatetree height (e.g. Morsdorf et al. 2008; Zimble et al. 2003; Hancock et al. 2011). Howeverthe only way to test the true performance of the algorithm and the micro-pulse instrumentwould be ground surveys, which were not possible in this work.
6.1. Algorithm performance assessment using full-resolution photon-counting data
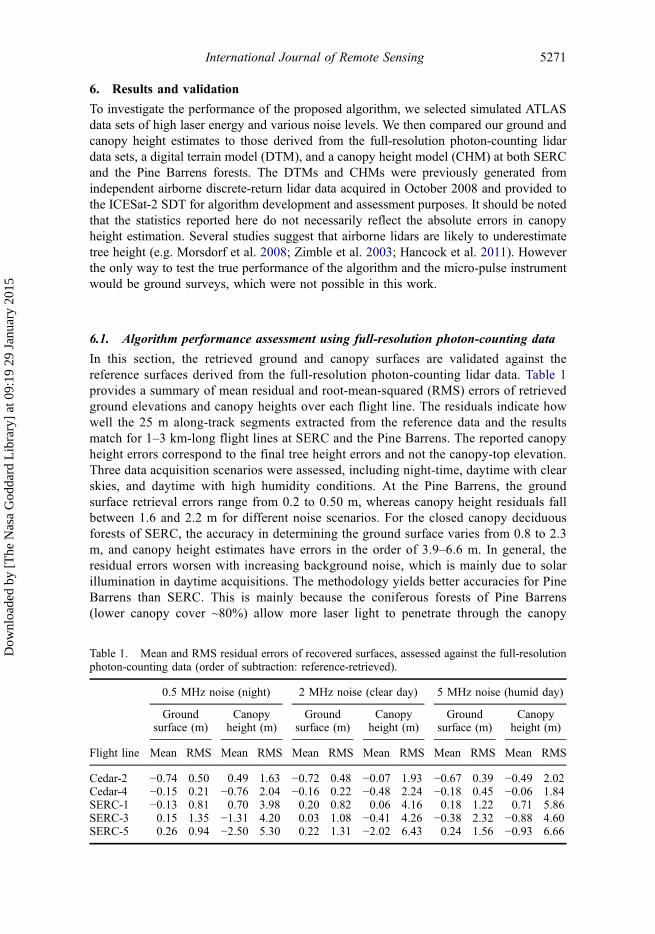
In this section, the retrieved ground and canopy surfaces are validated against thereference surfaces derived from the full-resolution photon-counting lidar data. Table 1provides a summary of mean residual and root-mean-squared (RMS) errors of retrievedground elevations and canopy heights over each flight line. The residuals indicate howwell the 25 m along-track segments extracted from the reference data and the resultsmatch for 1–3 km-long flight lines at SERC and the Pine Barrens. The reported canopyheight errors correspond to the final tree height errors and not the canopy-top elevation.Three data acquisition scenarios were assessed, including night-time, daytime with clearskies, and daytime with high humidity conditions. At the Pine Barrens, the groundsurface retrieval errors range from 0.2 to 0.50 m, whereas canopy height residuals fallbetween 1.6 and 2.2 m for different noise scenarios. For the closed canopy deciduousforests of SERC, the accuracy in determining the ground surface varies from 0.8 to 2.3m, and canopy height estimates have errors in the order of 3.9–6.6 m. In general, theresidual errors worsen with increasing background noise, which is mainly due to solarillumination in daytime acquisitions. The methodology yields better accuracies for PineBarrens than SERC. This is mainly because the coniferous forests of Pine Barrens(lower canopy cover ~80%) allow more laser light to penetrate through the canopy
Table 1. Mean and RMS residual errors of recovered surfaces, assessed against the full-resolutionphoton-counting data (order of subtraction: reference-retrieved).
0.5 MHz noise (night) 2 MHz noise (clear day) 5 MHz noise (humid day)
Groundsurface (m)
Canopyheight (m)
Groundsurface (m)
Canopyheight (m)
Groundsurface (m)
Canopyheight (m)
Flight line Mean RMS Mean RMS Mean RMS Mean RMS Mean RMS Mean RMS
Cedar-2 −0.74 0.50 0.49 1.63 −0.72 0.48 −0.07 1.93 −0.67 0.39 −0.49 2.02Cedar-4 −0.15 0.21 −0.76 2.04 −0.16 0.22 −0.48 2.24 −0.18 0.45 −0.06 1.84SERC-1 −0.13 0.81 0.70 3.98 0.20 0.82 0.06 4.16 0.18 1.22 0.71 5.86SERC-3 0.15 1.35 −1.31 4.20 0.03 1.08 −0.41 4.26 −0.38 2.32 −0.88 4.60SERC-5 0.26 0.94 −2.50 5.30 0.22 1.31 −2.02 6.43 0.24 1.56 −0.93 6.66
International Journal of Remote Sensing 5271
Dow
nloa
ded
by [
The
Nas
a G
odda
rd L
ibra
ry]
at 0
9:19
29
Janu
ary
2015

and hit the underlying ground surface. This results in a stronger return signal from theground and subsequently better canopy height retrieval accuracy. The strength of thistechnique is its success in detecting small changes in topography, since it relies on usinglocal neighbourhood information in two dimensions rather than aggregating signals overlong distances.
Figures 4 and 5 provide two examples of retrieved surfaces using this technique versusthe reference surfaces, superimposed on the simulated ICESat-2 data. These figuresindicate that the proposed technique can reliably recover top-of-canopy and groundsurfaces despite the low (high) signal (noise) levels.
50
45 (a)
40
35
30
25
20
15
10
5
0
–50 400 800 1200 1600
Along-track distance (m)
Ele
vati
on
(m
)
2000 2400 2800 3200
50
(b)45
40
35
30
25
20
15
10
5
0
–50 400 800 1200
Along-track distance (m)
Ele
vati
on
(m
)
1600 2000 2400 2800 3200
Simulated ICESat-2 dataReference TerrainRetrieved TerrainReference CanopyRetrieved Canopy
Figure 4. (a) Simulated ICESat-2 data over the Cedar-2 flight line with a background noise rateof 5 MHz; (b) Retrieved terrain and canopy surfaces over the Cedar-2 flight line overlaid onsimulated ICESat-2 data and compared against reference surfaces derived from full-resolutionphoton-counting data. Here, canopy height is retrieved with an average error value of −0.49 m andaccuracy of 2.02 m.
5272 M.S. Moussavi et al.
Dow
nloa
ded
by [
The
Nas
a G
odda
rd L
ibra
ry]
at 0
9:19
29
Janu
ary
2015

6.2. Algorithm performance assessment using DTM and CHM
To further assess the performance of the algorithm, the derived surfaces from the simulateddata were evaluated against the independent discrete-return airborne lidar-derived DTMs/CHMs for the study areas. Table 2 provides a summary of the mean and RMS residuals ofthe retrieved surfaces for all flight lines over the Pine Barrens and SERC.
At the Pine Barrens, the ground surface RMS residuals range from 0.3 to 0.5 m, andcanopy height estimates indicate residuals in the order of 3.1–3.7 m. At SERC, where thecanopy cover is significantly denser than that of the Pine Barrens, the ground and canopysurfaces were resolved to an average accuracy of 1.9 and 6.0 m, respectively.
50
(a)40
30
20
10
0
–10Ele
vati
on
(m
)
–20
–30
–40
–500 200 400 600 800 1000 1200 1400 1600 1800
Along-track distance (m)
50
(b)Simulated ICESat-2 dataReference TerrainRetrieved TerrainReference CanopyRetrieved Canopy
40
30
20
10
0
Ele
vati
on
(m
)
–10
–20
–30
–40
–500 200 400 600 800
Along-track distance (m)1000 1200 1400 1600 1800
Figure 5. (a) Simulated ICESat-2 data over the SERC-1 flight line with a background noise rateof 5 MHz; (b) Retrieved terrain and canopy surfaces over the SERC-1 flight line overlaid onsimulated ICESat-2 data and compared against reference surfaces derived from full-resolutionphoton-counting data. Here, canopy height is retrieved with an average error value of 0.71 m andaccuracy of 5.86 m.
International Journal of Remote Sensing 5273
Dow
nloa
ded
by [
The
Nas
a G
odda
rd L
ibra
ry]
at 0
9:19
29
Janu
ary
2015

It should be noted that there are differences inherent in the way the photon-countinglidar systems operate as opposed to discrete-return lidars from which the DTMs/CHMswere derived; thus vegetation is probably sampled quite differently. The ICESat-2 SDTperformed a comparative analysis between the full-resolution photon-counting data andthe DTM/CHM (Neuenschwander et al., unpublished data). They found that at the PineBarrens and SERC sites, the canopy height residuals include approximately 4 and 5 maverage biases, respectively, with RMS errors ranging from 3.4 to 5.6 m. This could bepartly explained by the difference in the way the canopy surface is delineated in these twotruth data sets. Moreover, because the CHM was gridded into a 1 m product, slightdifferences in geo-location could have caused discrepancies. The interpolation itself couldhave resulted in a loss of information and resolution affecting the residuals. As a result theresiduals we observed, when comparing the results to the DTMs/CHMs, are probablyoverestimated. Despite this limitation, in the absence of a ground truth data set, thiscomparison provides the only truly independent validation available.
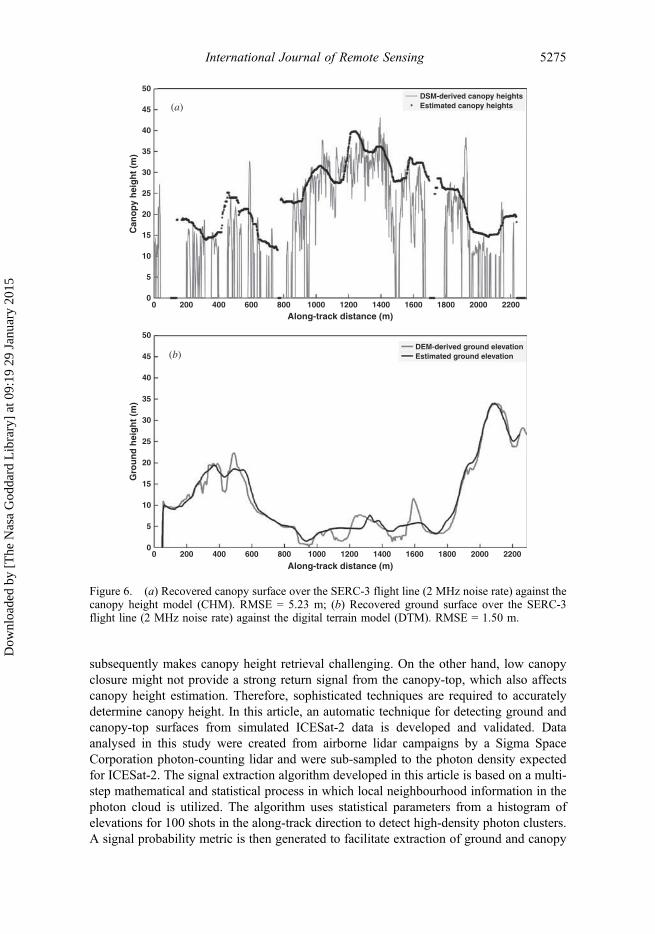
Figures 6 and 7 show examples of retrieved ground and canopy surfaces versus theDTM and CHM, respectively.
7. Conclusion
The ATLAS instrument on-board NASA’s ICESat-2 mission will use a technology newlyapplied to surface altimetry, with the main scientific objectives of measuring ice sheetelevation, sea ice freeboard (to enable thickness estimates), and canopy height (to enablevegetation biomass assessment). This new approach relies on using a high-repetition rate,low per-pulse laser energy (25–100 μJ), photon-counting detection mechanism. As theapplication of photon-counting altimetry from orbit has not previously been carried out,there are uncertainties about the data utility in regard to vegetation and ecosystem scienceobjectives. The main challenge arises, generally, from the combination of transmittinglow-energy laser pulses and the low reflectivity of soil and vegetation at the laserwavelength. Depending upon vegetation type, crown density, atmospheric conditions,and solar elevation, the number of detected signal photons reflected from the canopy-top and the underlying ground surface is expected to range between 0 and 10 for eachlaser shot. This, combined with solar background noise, will ultimately result in a verylow SNR per footprint.
High-density foliage limits the amount of laser energy that penetrates through thecanopy and reaches the surface. This results in low return from the ground, which
Table 2. Mean and RMS residual errors of recovered surfaces, assessed against DTM/CHM for thestudy area (order of subtraction: reference-retrieved).
0.5 MHz noise (night) 2 MHz noise (clear day) 5 MHz noise (humid day)
Groundsurface (m)
Canopyheight (m)
Groundsurface (m)
Canopyheight (m)
Groundsurface (m)
Canopyheight (m)
Flight line Mean RMS Mean RMS Mean RMS Mean RMS Mean RMS Mean RMS
Cedar-2 −0.74 0.37 −4.48 3.54 −0.71 0.37 −4.77 3.66 −0.68 0.43 −4.79 3.74Cedar-4 −0.29 0.30 −4.01 3.21 −0.30 0.30 −3.80 3.14 −0.28 0.52 −3.66 3.30SERC-1 −0.86 1.16 −2.02 6.32 −0.37 0.99 −2.97 6.28 −0.31 1.66 −2.79 6.53SERC-3 −0.06 1.49 −3.03 4.51 −0.42 1.50 −3.15 5.23 −1.15 3.23 −2.28 6.49SERC-5 −0.32 2.02 −4.80 5.48 −0.52 2.40 −4.18 5.47 −0.85 3.16 −3.42 6.37
5274 M.S. Moussavi et al.
Dow
nloa
ded
by [
The
Nas
a G
odda
rd L
ibra
ry]
at 0
9:19
29
Janu
ary
2015
subsequently makes canopy height retrieval challenging. On the other hand, low canopyclosure might not provide a strong return signal from the canopy-top, which also affectscanopy height estimation. Therefore, sophisticated techniques are required to accuratelydetermine canopy height. In this article, an automatic technique for detecting ground andcanopy-top surfaces from simulated ICESat-2 data is developed and validated. Dataanalysed in this study were created from airborne lidar campaigns by a Sigma SpaceCorporation photon-counting lidar and were sub-sampled to the photon density expectedfor ICESat-2. The signal extraction algorithm developed in this article is based on a multi-step mathematical and statistical process in which local neighbourhood information in thephoton cloud is utilized. The algorithm uses statistical parameters from a histogram ofelevations for 100 shots in the along-track direction to detect high-density photon clusters.A signal probability metric is then generated to facilitate extraction of ground and canopy
50
(a)DSM-derived canopy heightsEstimated canopy heights45
40
35
30
25
Can
op
y h
eig
ht
(m)
20
15
10
5
00 200 400 600 800 1200 1400 1600 1800 2000 22001000
Along-track distance (m)
50
(b)DEM-derived ground elevationEstimated ground elevation45
40
35
30
25
20
Gro
un
d h
eig
ht
(m)
15
10
5
00 200 400 600 800 1000
Along-track distance (m)1200 1400 1600 1800 2000 2200
Figure 6. (a) Recovered canopy surface over the SERC-3 flight line (2 MHz noise rate) against thecanopy height model (CHM). RMSE = 5.23 m; (b) Recovered ground surface over the SERC-3flight line (2 MHz noise rate) against the digital terrain model (DTM). RMSE = 1.50 m.
International Journal of Remote Sensing 5275
Dow
nloa
ded
by [
The
Nas
a G
odda
rd L
ibra
ry]
at 0
9:19
29
Janu
ary
2015

cover surfaces. Subsequently, an iterative cubic spline interpolation between classifiedground/canopy-top photons further refines the classification results and improves thedetection accuracy.
Validation of results against two reference data sets showed that ground/canopyelevation can be estimated from simulated ICESat-2 data with reasonably high accuracy.At the Pine Barrens, ground surfaces were recovered with an average RMS of 0.3 m andcanopy heights were resolved with an average accuracy of better than 3.0 m. However,canopy height retrievals over SERC forests, with significantly higher canopy cover, weremore challenging due to penetration of fewer photons through the dense layers of canopy.At SERC, the average residuals for ground surface and canopy-tops were 1.2 and 5.0 mrespectively.
The results presented here are for two temperate forests in the eastern USA, and thusthe conclusion should not be generalized to other biomes such as the dense, multi-layered
50DSM-derived canopy heightsEstimated canopy heights(a)45
40
35
30
25
20
Can
op
y h
eig
ht
(m)
15
10
5
0500 700 900 1100 1300 1500
Along-track distance (m)1700 1900 2100 2300 2500 2700
50DEM-derived ground elevationEstimated ground elevation(b)45
40
35
30
25
20
Gro
un
d h
eig
ht
(m)
15
10
5
0500 700 900 1100 1300 1500
Along-track distance (m)1700 1900 2100 2300 2500 2700
Figure 7. (a) Recovered canopy surface over the SERC-5 flight line (5 MHz noise rate) against thecanopy height model (CHM). RMSE = 6.37 m; (b) Recovered ground surface over the SERC-5flight line (5 MHz noise rate) against the digital terrain model (DTM). RMSE = 3.16 m.
5276 M.S. Moussavi et al.
Dow
nloa
ded
by [
The
Nas
a G
odda
rd L
ibra
ry]
at 0
9:19
29
Janu
ary
2015

canopy in tropical forests. Nonetheless, the algorithm performs reasonably well under abroad range of SNR scenarios. It should also be noted that regardless of the final ICESat-2instrument parameters, the algorithm will still be applicable for detecting ground/canopysurfaces. Moreover, due to the algorithm’s success in the challenging case of forestedecosystems, it is very likely to produce accurate results from photon-counting datacollected over land ice and sea ice.
There are limits to the applicability of laser altimetry over densely vegetated areas. Atsome point, the laser energy extinction is too high for any detectable returns to beexpected from the ground surface. This is especially the case for the ICESat-2 mission,since the instrument design is primarily driven by ice objectives. Despite this fact, ourresults suggest that ICESat-2 could provide valuable capabilities for determining forestcanopy height; however, the degree of its success in this regard remains a topic of ongoingresearch.
AcknowledgementsThis study was carried out in collaboration with the ICESat-2 project and Science Definition Team.We thank Bea Csatho, Thorsten Markus, Thomas Neumann, Benjamin Smith, and Ross Nelson(NASA – GSFC) for their support and helpful comments.
FundingThis work was supported by the National Aeronautics and Space Administration (NASA) [grantnumber NNX09AE54G].
ReferencesAbdalati, W., H. J. Zwally, R. Bindschadler, B. Csatho, S. Farrell, H. Fricker, D. Harding, R. Kwok,
M. Lefsky, T. Markus, A. Marshak, T. Neumann, S. Palm, R. Schutz, B. Smith, J. Spinhirn, C.Webb, and T. Neumann. 2010. “The ICESat-2 Laser Altimetry Mission.” Proceedings of theIEEE 98 (5): 735–751. doi:10.1109/JPROC.2009.2034765.
Barbieri, K., A. Brenner, T. Markus, T. Neumann, J. Saba, and D. Yi. 2009. Description ofSubsampling Algorithm for Sigma Space Data. Technical Report. Greenbelt, MD: NASAGoddard Space Flight Center.
Barbieri, K., A. Brenner, T. Markus, T. Neumann, J. Saba, D. Yi, and K. Brunt. 2010. Description ofICESat-II Simulated Data Created from Sigma Space MPL Laser Data. Technical Report.Greenbelt, MD: NASA Goddard Space Flight Center.
Collins, B. R., and K. H. Anderson. 1994. Plant Communities of New Jersey: A Study in LandscapeDiversity. New Brunswick, NJ: Rutgers University Press.
Cossio, T. K., K. C. Slatton, W. E. Carter, K. Y. Shrestha, and D. Harding. 2010. “Predicting SmallTarget Detection Performance of Low-SNR Airborne Lidar.” IEEE Journal of Selected Topics inApplied Earth Observations and Remote Sensing 3 (4): 672–688. doi:10.1109/JSTARS.2010.2053349.
Degnan, J. J. 2002. “Photon-Counting Multikilohertz Microlaser Altimeters for Airborne andSpaceborne Topographic Measurements.” Journal of Geodynamics 34 (3–4): 503–549.doi:10.1016/S0264-3707(02)00045-5.
Fricker, H. A. 2005. “Assessment of ICESat Performance at the Salar De Uyuni, Bolivia.”Geophysical Research Letters 32 (21): 3–7. doi:10.1029/2005GL023423.
Hancock, S., M. Disney, J. P. Muller, P. Lewis, and M. Foster. 2011. “A Threshold InsensitiveMethod for Locating the Forest Canopy Top with Waveform Lidar.” Remote Sensing ofEnvironment 115: 3286–3297. doi:10.1016/j.rse.2011.07.012.
Harding, D. J. 2005. “ICESat Waveform Measurements of Within-Footprint Topographic Relief andVegetation Vertical Structure.” Geophysical Research Letters 32 (21): 1–3. doi:10.1029/2005GL023471.
International Journal of Remote Sensing 5277
Dow
nloa
ded
by [
The
Nas
a G
odda
rd L
ibra
ry]
at 0
9:19
29
Janu
ary
2015

Herzfeld, U. C., B. W. Mcdonald, B. F. Wallin, T. A. Neumann, T. Markus, A. C. Brenner, and C.Field. 2013. “Algorithm for Detection of Ground and Canopy Cover in Micropulse Photon-Counting Lidar Altimeter Data in Preparation for the ICESat-2 Mission.” IEEE Transactions onGeoscience and Remote Sensing 1: 1–1.
Kurtz, N. T., T. Markus, D. J. Cavalieri, W. Krabill, J. G. Sonntag, and J. Miller. 2008. “Comparisonof ICESat Data with Airborne Laser Altimeter Measurements Over Arctic Sea Ice.” IEEETransactions on Geoscience and Remote Sensing 46 (7): 1913–1924. doi:10.1109/TGRS.2008.916639.
Kwok, R., G. F. Cunningham, H. J. Zwally, and D. Yi. 2007. “Ice, Cloud, and Land ElevationSatellite (ICESat) over Arctic Sea Ice: Retrieval of Freeboard.” Journal of GeophysicalResearch 112 (C12): C12013. doi:10.1029/2006JC003978.
Lefsky, M. A., D. J. Harding, M. Keller, W. B. Cohen, C. C. Carabajal, F. Espirito-Santo, M. O.Hunter, and R. De Oliveira. 2005. “Estimates of Forest Canopy Height and AbovegroundBiomass Using ICESat.” Geophysical Research Letters 32 (22): L22S02. doi:10.1029/2005GL023971.
Liu, Z., W. Hunt, M. Vaughan, C. Hostetler, M. Mcgill, K. Powell, D. Winker, and Y. Hu. 2006.“Estimating Random Errors Due to Shot Noise in Backscatter Lidar Observations.” AppliedOptics 45 (18): 4437–4447. doi:10.1364/AO.45.004437.
Magruder, L. A., C. E. Webb, T. J. Urban, E. C. Silverberg, and B. E. Schutz. 2007. “ICESatAltimetry Data Product Verification at White Sands Space Harbor.” IEEE Transactions onGeoscience and Remote Sensing 45 (1): 147–155. doi:10.1109/TGRS.2006.885070.
Martino, A. J. 2010. ATLAS Performance Spreadsheet. http://icesat.gsfc.nasa.gov/icesat2/data/sigma/sigma_data.php.
Morsdorf, F., O. Frey, E. Meier, K. I. Itten, and B. Allgöwer. 2008. “Assessment of the Influence ofFlying Altitude and Scan Angle on Biophysical Vegetation Products Derived from AirborneLaser Scanning.” International Journal of Remote Sensing 29 (5): 1387–1406. doi:10.1080/01431160701736349.
Pang, Y., M. A. Lefsky, H. E. Andersen, M. E. Miller, and K. Sherrill. 2008. “Validation of theICESat Vegetation Product Using Crown-Area-Weighted Mean Height Derived Using CrownDelineation with Discrete Return Lidar Data.” Canadian Journal of Remote Sensing 34 (S2):S471–S484. doi:10.5589/m08-074.
Parker, G. 2012. Smithsonian Environmental Research Center, Edgewater, MD, USA. http://www.ctfs.si.edu/site/SERC%3A+Smithsonian+Environmental+Research+Center.
Popescu, S. C., K. Zhao, A. Neuenschwander, and C. Lin. 2011. “Satellite Lidar Vs. Small FootprintAirborne Lidar: Comparing the Accuracy of Aboveground Biomass Estimates and ForestStructure Metrics at Footprint Level.” Remote Sensing of Environment 115 (11): 2786–2797.doi:10.1016/j.rse.2011.01.026.
Rosette, J. A., P. R. J. North, and J. C. Suárez. 2008. “Vegetation Height Estimates for a MixedTemperate Forest Using Satellite Laser Altimetry.” International Journal of Remote Sensing 29(5): 1475–1493. doi:10.1080/01431160701736380.
Schutz, B. E., H. J. Zwally, C. Shuman, D. Hancock, and J. P. Dimarzio. 2005. “Overview of theICESat Mission.” Geophysical Research Letters 32 (21): 1–4. doi:10.1029/2005GL024009.
Shuman, C., H. J. Zwally, B. E. Schutz, A. C. Brenner, J. P. Dimarzio, V. P. Suchdeo, and H. A.Fricker. 2006. “ICESat Antarctic Elevation Data: Preliminary Precision and AccuracyAssessment.” Geophysical Research Letters 33 (7): 10–13. doi:10.1029/2005GL025227.
Thomas, R., C. Davis, E. Frederick, W. Krabill, Y. Li, S. Manizade, and C. Martin. 2008. “AComparison of Greenland Ice-Sheet Volume Changes Derived from Altimetry Measurements.”Journal of Glaciology 54 (185): 203–212. doi:10.3189/002214308784886225.
Yang, Y., A. Marshak, S. P. Palm, T. Varnai, and W. J. Wiscombe. 2011. “Cloud Impact on SurfaceAltimetry from a Spaceborne 532-Nm Micropulse Photon-Counting Lidar: System Modeling forCloudy and Clear Atmospheres.” IEEE Transactions on Geoscience and Remote Sensing 49(12): 4910–4919. doi:10.1109/TGRS.2011.2153860.
Yi, D., H. J. Zwally, and X. Sun. 2005. “ICESat Measurement of Greenland Ice Sheet Surface Slopeand Roughness.” Annals of Glaciology 42 (1): 83–89. doi:10.3189/172756405781812691.
Yu, A. W., M. A. Stephen, S. X. Li, G. B. Shaw, A. Seas, E. Dowdye, E. Troupaki, P. Poulios, K.Mascetti, K. Mascetti, W. A. Clarkson, N. Hodgson, and R. K. Shori. 2010. “Space LaserTransmitter Development for ICESat-2 Mission.” Solid State Lasers XIX: Technology andDevices 7578: 757809-1–757809-11. doi:10.1117/12.843342.
5278 M.S. Moussavi et al.
Dow
nloa
ded
by [
The
Nas
a G
odda
rd L
ibra
ry]
at 0
9:19
29
Janu
ary
2015

Zimble, D. A., D. L. Evans, G. C. Carlson, R. C. Parker, C. G. Grado, and P. D. Gerard. 2003.“Characterizing Vertical Forest Structure Using Small-Footprint Airborne Lidar.” RemoteSensing of Environment 87: 171–182. doi:10.1016/S0034-4257(03)00139-1.
Zwally, H. J., M. B. Giovinetto, J. Li, H. G. Cornejo, M. A. Beckley, A. C. Brenner, J. L. Saba, andD. Yi. 2005. “Mass Changes of the Greenland and Antarctic Ice Sheets and Shelves andContributions to Sea-Level Rise: 1992–2002.” Journal of Glaciology 51 (175): 509–527.doi:10.3189/172756505781829007.
Zwally, H. J., D. Yi, R. Kwok, and Y. Zhao. 2008. “ICESat Measurements of Sea Ice Freeboard andEstimates of Sea Ice Thickness in the Weddell Sea.” Journal of Geophysical Research 113 (C2):C02S15. doi:10.1029/2007JC004284.
International Journal of Remote Sensing 5279
Dow
nloa
ded
by [
The
Nas
a G
odda
rd L
ibra
ry]
at 0
9:19
29
Janu
ary
2015