appetite and adiposity of the emu (dromaius novaehollandiae)
TRANSCRIPT

Appetite and adiposity of the emu
(Dromaius novaehollandiae).
by
Gemma Kate Graham
B.Sc. (Agric, Hons)
This thesis is presented for the degree of
Doctor of Philosophy of Animal Science
2002
The University of Western Australia
Faculty of Agriculture
Animal Science Group

Dedicated to
Jean Eiffler and Jim Graham
Who helped me choose a road less travelled.

Declaration
This thesis contains no experimental material that has been previously presented for any
degree at any university or institution. The experimental designs and manuscript
preparation were performed by myself, in consultation with m y supervisors, Dr Dominique
Blache, Dr Philip Vercoe and Professor Graeme Martin.
G e m m a Graham
March 2002

General Index
(Detailed indices are provided at the start of each chapter)
Page
Summary ii
Acknowledgements iv
Publications vi
Index to figures and tables vii
General Introduction 1
Chapter 1 Literature Review 3
Chapter 2 General Materials and Methods 29
Chapter 3 The emu obese gene 58
Chapter 4 The influence of dietary fat on food intake and adiposity 79
Chapter 5 The effect of dexamethasone on food intake, adiposity, 99
reproduction and the hypothalamic expression of N P Y in females
Chapter 6 Incubation-related changes in food intake, adiposity and the 125
hypothalamic expression of N P Y and VIP
Chapter 7 The effect of short-term starvation on the hypothalamic 146
expression of N P Y and VIP during a period of elevated appetite
General Discussion 162
Bibliography 166
Appendix 1. - abbreviations 202
Appendix 2. - list of suppliers and feed composition 205
Appendix 3. - response to comments made by thesis examiners 209

ii
Summary
Emus exhibit seasonal decreases in appetite and adiposity. Adipose tissue is the most
profitable component of the carcass. As such, the reduction in adipose stores limits
slaughtering to a brief window, and is a major constraint to productivity and industry
development. To minimise the detrimental effects of seasonality on the productivity of
farmed emus it is necessary to develop ways of manipulating appetite and adiposity. The
general model for the control of appetite and adiposity is mediation of appetite and satiety
centres in the hypothalamus by peripheral signals indicative of energy reserves and
metabolic status. The relevance of this general model to the emu has not been
investigated.
The general hypothesis in this thesis was that seasonal variation in appetite and adiposity
in the emu operates under the general model developed in other species. The experimental
models used to test the general hypothesis were increased appetite and adiposity (high fat
diet, dexamethasone treatment), decreased appetite and adiposity (incubation) and
increased appetite and decreased adiposity (starvation). To determine the role of leptin in
the control of appetite and adiposity attempts were made to clone and sequence the emu
leptin gene. The concentrations of metabolic hormones were measured in all of the
experiments, and the role of N P Y in the control of appetite and adiposity was investigated
by quantifying the m R N A expression of N P Y from the mediobasal hypothalamus and
preoptic area in the glucocorticoid treatment, incubation and starvation experiments.
NPY mRNA expression did not change in response to dexamethasone treatment or
starvation. There was no difference in N P Y expression between incubating and non-
incubating emus during the breeding season, despite large differences in their appetite and
adiposity. Attempts to clone and sequence emu leptin were unsuccessful and further
investigation of the relationship between leptin and N P Y was not possible. However, it
was demonstrated that emus have biologically active leptin by using a chicken leptin
bioassay developed in Friedman-Einat's laboratory. High fat diets and dexamethasone
treatment did not increase adiposity or food intake. Emus were relatively tolerant of
starvation. Short-term starvation did not increase corticosterone concentration or N P Y
expression, or induce the classical starvation response in metabolic hormone
concentrations that, in other species, would normally occur rapidly in response to

starvation. The hormone concentrations measured throughout these experiments were
appropriate to the physiological requirements of the birds, and indicate that efficient
mechanisms exist to defend the "set point" for energy reserves of the e m u at a level
appropriate to its needs and activities.
The fact that NPY gene expression is unchanged by starvation, incubation or
dexamethasone treatment does not rule out a role for N P Y in the hypothalamic control of
appetite. Other appetite mediators such as, leptin or corticotrophin-releasing hormone
(CRH), could, under the influence of photoperiod, inhibit N P Y action or responses.
Finally, it is apparent from the results that appetite and adiposity are tightly regulated in
the emu. The e m u also shows greater resistance to manipulation and tolerance of
starvation than other species. These features make disrupting energy balance to increase
adiposity a difficult enterprise for the farmer and, for the present, not feasible.

iv
Acknowledgements
I would like to offer m y sincere thanks to the following people:
• My supervisors, Dr Dominique Blache, Dr Philip Vercoe and Professor Graeme
Martin, for their support, guidance and friendship.
• The academic staff of the Animal Science Group at the University of Western
Australia, Emeritus Professor David Lindsay, Emeritus Professor Reg Moir, Professor
Graeme Martin, Dr Ian Williams, Dr John Milton, Dr Philip Vercoe, Dr Dominique
Blache, Dr Suzannah Williams, Dr Irek Malecki and Dr Roberta Bencini for their help
and friendship throughout m y endeavours.
• Technical and support staff past and present in the department, John Beesley, Rob
Davidson, Margaret Blackberry, Margaret Lalchere, Jen Slater, John Koppen and
Sarah-Jo Smith for lending a helping hand, supporting m y efforts and their valued
friendship.
• I would especially like to thank John Beesley for his ability to find what was needed
and somehow the money to pay for it, and Margaret Blackberry for helping in every
aspect of m y research. Without both of you this would never have been completed.
• My fellow postgraduate students completed and continuing, Lucia Chagas, Pietro Celi,
Agung Riono, Tejinder Sharma, Rachel Smith, Matt Thyer, Megan Trezona, Harriet
Mills, Sid Saxby, Dean Thomas, Kristen Wolfe, Craig Lawrence, Justin Bellanger,
Ahmed Ali, Judy Van Cleeff, Karen Williams, U m a Karki, and Georgett Banchero, for
their friendship, advice, invaluable assistance, support, counselling and laughter.
• The Rural Industries Research and Development Corporation for providing my
scholarship and assisting in m y travels as part of this research.
• Leon and Ray in the workshop, for all their fix-its and help.

V
• Peter Cowl at Shenton Park for his help with the emus and for taking such excellent
care of them.
• At Curtin University, Dr Emma Hammond for generously providing her emu cosmid
library and technical advice.
• Dr Christopher Ashwell, USDA, for the gift of vector DNA containing part of the
chicken leptin gene.
• At CSIRO, Dr Norm Adams and Mrs Jan Briegel for advice and encouragement.
• At the Roslin Institute, Scotland, Professor Peter Sharp and Dr Tim Boswell for their
support, advice and encouragement, and Beth Baines for her wonderful hospitality.
• At the Volcani Center, Israel, Dr Miri Einat and family for making my visit both
productive and enjoyable.
• Tom Trevlett from Davison Industries for the kind donation of full-fat canola meal for
m y first experiment.
• My parents, Heather and Laurie, for encouraging me to do whatever made me happy
and whose ability to overcome their dragons has always inspired me, and made m e
very proud.
• And last but by no means least, Daniel, who helped out with my experiments, rejoiced
in m y achievements, held m y hand and stopped m e from taking myself too seriously.

VI
Publications
Work presented at scientific meetings:
Graham G.K., Blache D., Blackberry M., Martin G.B.M. and Vercoe P.E. (1999) Partial
cloning of the emu obese gene sequence. Proceedings of the Combio 99
conference.
vii
Index to figures and tables
Figures
Page
1.1: Annual changes in feed intake and live weight of male and 5 female emus.
1.2: The control of food intake and adipose tissue deposition. 11
1.3: The hypothalamic-pituitary-adrenal axis: effects of endogenous 24 and exogenous glucocorticoids.
2.1: Live weight measurement of the emu. 31
2.2: Jugular bleeding of the emu. 33
2.3: An emu skull showing the placement of incisions through the 35 skull for brain removal.
2.4: Schematic saggital view of the avian brain showing the 35 microdissection sites for collection of the mediobasal hypothalamus ( M B H ) and preoptic area (POA) for R N A extraction and RPA.
4.1: Average daily feed intake for each week of the experiment for 85 male emus receiving either the low or high fat diet for 8 weeks.
4.2: Mean live weight of male emus offered low and high fat diets for 86
54 days.
4.3: Serum glucagon concentrations of male emus offered low and 88 high fat diets for 54 days.
4.4: Serum insulin concentration of male emus offered low and 89 high fat diets for 54 days.
4.5: Serum insulin/glucagon ratio of male emus offered low and 90 high fat diets for 54 days.
4.6: Serum triiodothyronine concentration in male emus offered low 91
and high fat diets for 54 days.
4.7: Serum thyroxine concentration in male emus offered low and 92
high fat diets for 54 days.
4.8: Serum T3/T4 ratio in male emus offered low and high fat diets for 93
54 days.

Figures (continued)
Page
5.1: The serum corticosterone concentration of emus treated with 105 subcutaneous dexamethasone implants of either 6 m g or 12 mg.
5.2: The NPY mRNA expression of female emus treated with either 110 dexamethasone or saline for 49 days.
5.3: Average daily feed intake per week of female emus treated with 112 either saline or dexamethasone for 49 days.
5.4: Live weight of female emus treated with either saline or 113 dexamethasone for 49 days, on Day -14, Day 14 and Day 49.
5.5: Serum insulin concentration of female emus treated with either 115 saline or dexamethasone for 49 days.
5.6: Blood glucose concentration of female emus treated with either 116 saline or dexamethasone for 49 days.
5.7: Serum thyroxine concentration of female emus treated with 117 either saline or dexamethasone for 49 days.
5.8: Serum triiodothyronine concentration of female emus treated 118 with either saline or dexamethasone for 49 days.
5.9: T3/T4 ratio of female emus treated with either saline or 119 dexamethasone for 49 days.
5.10: Serum luteinising hormone concentration of female emus 120 treated with either saline or dexamethasone for 49 days.
5.11: Serum corticosterone concentration of female emus treated with 121 either saline or dexamethasone for 49 days.
6.1: The NPY and VIP mRNA expression of incubating and 132 non-incubating male emus determined using the R P A technique.
6.2: The serum prolactin concentration from Week 3 to Week 6 of 134 incubation of incubating and non-incubating male emus.
6.3: Mean blood glucose concentrations from Week 3 to Week 6 of 135 incubation of incubating and non-incubating male emus.
6.4: Mean serum glucagon concentrations from Week 3 to Week 6 of 136 incubation of incubating and non-incubating male emus.
6.5: Mean serum insulin concentrations from Week 3 to Week 6 of 137 incubation of incubating and non-incubating male emus.

IX
Figures (continued)
Page
6.6: Mean serum insulin/glucagon ratio from W e e k 3 to Week 6 of 138 incubation of incubating and non-incubating male emus.
6.7: Mean serum triiodothyronine concentrations from Week 3 to Week 139 6 of incubation of incubating and non-incubating male emus.
6.8: Mean serum thyroxine concentrations from Week 3 to Week 6 140 of incubation of incubating and non-incubating male emus.
6.9: The T3/T4 ratio from Week 3 to Week 6 of incubation of incubating 141 and non-incubating male emus.
6.10: Mean serum corticosterone concentration from Week 3 to Week 6 142 of incubation of incubating and non-incubating male emus.
7.1: The sampling and measurement schedule for the pre-treatment and 149
treatment periods.
A3.1: Correlation analysis of the relationship between fat score and 214 percentage total adiposity of female emus in experiment 2 (saline treated = open circles and dexamethasone treated = solid circles).
A3.2: Liver tissue from female emus following chronic treatment with 216 either saline (left) or dexamethasone (right).
A3.3: Correlation analysis of the relationship between NPY gene expression 220
relative to P-actin and corticosterone concentration (non-incubators = open circles and incubators = solid circles).
Tables
2.1: Tissues weighed for each experiment. 32
2.2: Assay statistics. 51
2.3: The intra-assay coefficients of variation for the hormone assays 51 performed.
2.4: RNA polymerase and restriction enzymes required for each probe 54
to obtain sense and antisense strands.
2.5: Reagents for RPA hybridisation. 56
3.1: Volumes of reagents used in the reverse transcription reactions. 62
3.2: Volumes of reagents used in the polymerase chain reactions. 63
Tables (continued)
Page
3.3: Thermal cycling conditions used for the polymerase chain reaction. 63
3.4: Volumes of reagents used in nested PCR. 64
3.5: Volumes of reagents used in the ligation reaction. 65
3.6: Volumes of reagents used for colony PCR. 66
3.7: Volumes of reagents used for restriction digests of plasmids 68 containing chicken or mammalian leptin fragments.
3.8: The thermal cycling conditions for the Marathon RACE reactions. 72
3.9: Leptin receptor induction of the chicken leptin bioassay by emu 75
and chicken serum samples.
3.10: Leptin receptor induction of the chicken leptin receptor bioassay 76 by emu serum samples collected over the course of year.
4.1: Composition of the low and high fat diets. 82
4.2: Macronutrient and energy content of the low and high fat diets. 82
4.3: Total feed, protein, fibre, fat and energy intakes over 68 days 84 (includes pre-treatment period) of male emus fed low and high fat diets.
4.4: The fat content of muscle and liver tissue from male emus fed 87
either low or high fat diets for 54 days.
4.5: The body composition of male emus receiving either low or high 87
fat diets for 54 days.
5.1: The mRNA expression of NPY relative to G-actin of female emus 110
treated with either dexamethasone or saline for 49 days.
5.2: The carcass composition of female emus treated with either 111
dexamethasone or saline for 49 days.
5.3: The fat scores of female emus on Day 0 and Day 49 of treatment 114
with either dexamethasone or saline.
6.1: The mRNA expression of NPY and VIP relative to p-actin of 132
incubating and non-incubating male emus.
6.2: The total feed intake over Week 6 of incubation and the body 133 composition of incubating and non-incubating male emus at the end of
Week 6 of incubation.

XI
Tables (continued)
Page
7.1: The m R N A expression of N P Y and VIP in starved and control 152
male emus.
7.2: The average daily feed intake of male and female emus in control 152 and starved groups one week before, and during a subsequent one-week
treatment period.
7.3: The live weight of male and female emus in the control and starved 153 group before and after a 7 day treatment period.
7.4: The body composition of control and one week starved male emus. 153
7.5: Serum insulin concentrations of male and female emus in each 154 group before and after a 7 day treatment period.
7.6: Serum glucagon concentrations of male and female emus in each 154 group before and after a 7 day treatment period.
7.7: The insulin/glucagon ratio of male and female emus in each group 155 before and after a 7 day treatment period.
7.8: Serum thyroxine concentrations of male and female emus in each 155 group before and after a 7 day treatment period.
7.9: Serum triiodothyronine concentrations of male and female emus in 156 each group before and after a 7 day treatment period.
7.10: Serum T3/T4 ratio of male and female emus in each group before 156 and after a 7 day treatment period.
7.11: Serum corticosterone concentrations of male and female emus in 157 each group in each group before and after a 7 day treatment period.
7.12: Serum P-hydroxybutyrate concentrations of male and female emus 157 in each group in each group before and after a 7 day treatment period.
7.13: Serum urea concentrations of male and female emus in each group 158 in each group before and after a 7 day treatment period.
A3.1: The mRNA expression of NPY and VIP relative to p-actin of 219 incubating (n=3) and non-incubating (n=6) male emus.
A3.2: Correlation analysis comparing the expression of NPY relative to 220
P-actin in incubating and non-incubating male emus with corticosterone
and prolactin concentrations and the insulimglucagon ratio.

1
General Introduction

General Introduction 2
The emu has evolved in a harsh environment and is able to contend with extremes of
climate and food availability. A unique feature of the emu is its ability to fatten during the
summer, a time when individual birds can dramatically increase their food intake and fat
depot. As the oil produced from emu fat has proven therapeutic qualities there is the
potential for emu farming to become a successful commercial venture. However, this
potential is limited by the seasonal variation in appetite and subsequently adiposity, which
prevents consistent market supplies of emu products. The industry could overcome these
limitations if methods were developed to limit the decrease in food intake and reduction in
the fat depot over the breeding season.
In other species, mainly mammalian, an integrated model for the control of energy balance
has been developed. Metabolic hormones including, insulin, glucagon, thyroxine and
triiodothyronine, and leptin, from adipose tissue, are peripheral factors that control energy
balance through their effects on food intake and metabolic rate. One way that metabolic
hormones keep energy intake and energy expenditure equal is by acting on neuropeptides
involved in regulating appetite and satiety within the hypothalamus. One of the major
neuropeptides involved in appetite control is neuropeptide Y (NPY), and one of the major
regulators of N P Y gene expression is leptin. The control of appetite and adiposity by
N P Y , leptin and peripheral hormones has not been investigated in the emu. As such, w e
do not know how well this model for the control of energy balance applies to the emu.
The aim of this thesis has been to improve the understanding of the control of appetite and
adiposity in the emu. To address this aim, the general hypothesis of this thesis was that
seasonal variation in appetite and adiposity in the emu operates under the general model
developed in other species. The success of this study depends on how well the emu
adheres to the general model for the control of appetite and adiposity. Given the strong
evolutionary pressure for efficient use of available energy sources, the emu might have
adopted particular strategies to control its energy balance. However, by comparing the
emu to other species these strategies will be identified. In addition, it should be possible to
develop methods for successfully manipulating appetite and adiposity to improve
economic returns for the emu producer.

Chapter 1
Literature Review
Page
1. Introduction
2. The emu
3. E m u farming
3.1 History
3.2 Production constraints
3.3 Industry potential
4. Appetite and the regulation of adiposity
4.1 The lipostatic theory
4.2 Control by the hypothalamus
4.3 Fat deposition and mobilization
5. Understanding the control of appetite and adiposity in the emu
5.1 Leptin
5.2 Neuropeptide Y
5.3 Vasoactive intestinal peptide and prolactin
5.4 Metabolic and hormonal consequences of incubation
6. Manipulation of appetite and adiposity
6.1 High fat diets
6.2 Glucocorticoids
6.3 Starvation
7. Conclusions
4
4
6
6
6
8
9
9
9
10
14
14
16
18
19
20
20
22
25
28

Chapter 1 - Literature Review 4
1. Introduction
The biggest problem facing the emu industry is decreasing adiposity due to reduced
appetite during the breeding season. Adipose tissue is the major product of the emu. As
such, improving our understanding of how appetite and fat deposition are controlled will
enable the development of strategies to manipulate and maintain appetite and adiposity for
longer periods of time. In this review I will cover the biology of the emu, and the history,
constraints and potential of emu farming. Following on from this I will review the control
of appetite and adiposity and their manipulation.
2. The emu
Emus belong to a group of flightless birds collectively called ratites. The mature emu
stands up to two metres in height and weighs in the range of 30 to 50 kg. The feathers are
grey-brown in colour, with a lighter ruff around the neck. The face and part of the throat is
generally bare of feathers and grey-blue in colour, with females normally exhibiting darker
colouring (Mawson, 1992). Following pairing, the breeding season commences in M a y
and usually lasts until June, but can continue into October depending on seasonal
conditions such as rainfall.
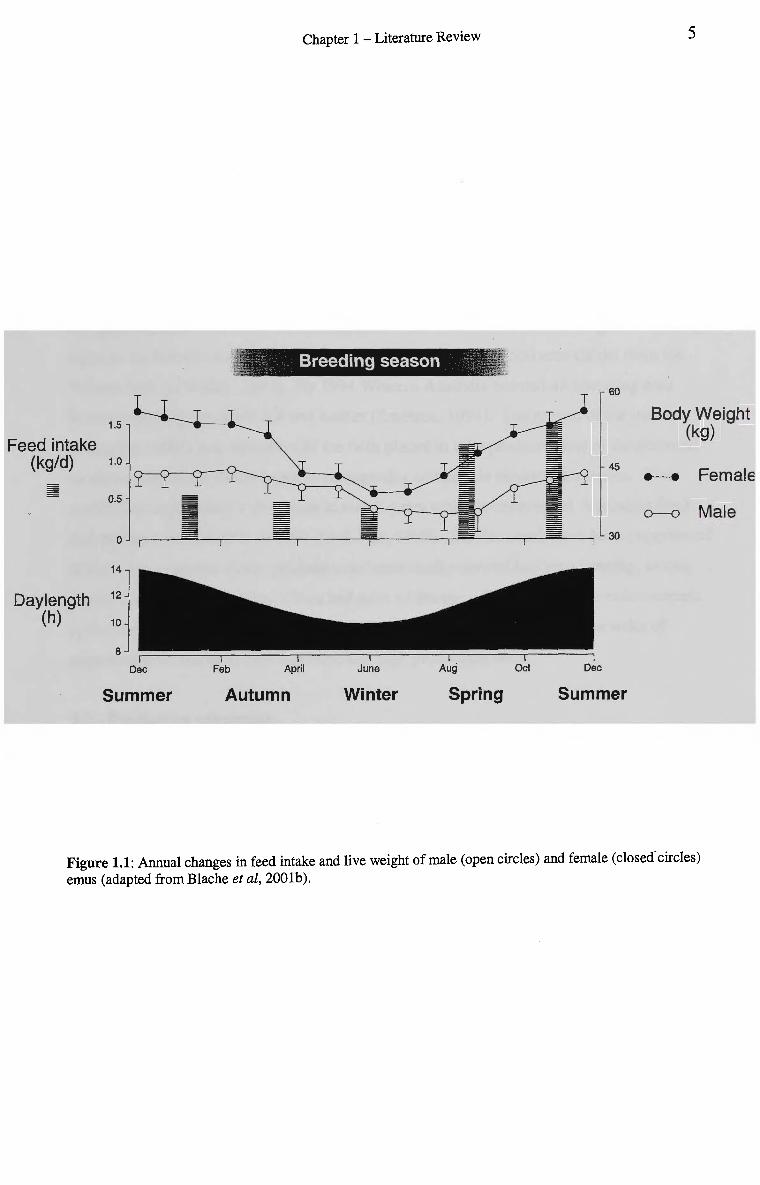
The onset of the breeding season occurs in response to decreasing day length (Blache &
Martin, 1999; Blache et al, 2001a). The breeding season is associated with a 30-50%
decrease in food intake and weight loss (Blake, 1996) (Fig. 1.1). The weight loss observed
is due to appetite suppression resulting from several causes related to, the onset of the
breeding season, broody behaviour by males while incubating eggs, and the egg laying
period for the females. The female on average lays fifteen eggs in her first season and 22
eggs in subsequent seasons (O'Malley, 1991). The eggs are incubated by the male, or in
incubators for 54 to 56 days (O'Malley, 1991). At the end of the breeding season appetite
increases and weight returns to pre-breeding levels. In the incubating male this is
particularly striking with a reversal from anorexia to a hyperphagic state. The hyperphagic
state enables the males to regain most of the weight lost (24%) within a three-week period
after the cessation of incubation (Van Cleeff, 2001).
Chapter 1 - Literature Review 5
Breeding season
1.5
Feed intake (kg/d) 10
0.5-
14
Daylength 12
(h) ~ 10
8
r60
45
30
Dec
Summer
Feb April June
Autumn Winter
Aug
Spring
Dec
Summer
Body Weight (kg)
•—• Female
o—o Male
Figure 1.1: Annual changes in feed intake and live weight of male (open circles) and female (closed'circles) emus (adapted from Blache et al, 2001b).
Chapter 1 - Literature Review °
3. E m u farming
3.1 - History
Commercial emu farming commenced at Kalannie in Western Australia in 1970 (O'Malley,
1993). Although the first farm closed in 1973 it proved to other producers, and the
government, that emus could be used successfully to produce high quality leather. O n the
basis of this success an experimental emu farm was set up at Wiluna by Applied Ecology,
to be run by the Ngangganawili Aboriginal Community as both a tourism and leather
production enterprise (O'Malley, 1993). Following this a private group, Dromaius Pty Ltd
set up an experimental farm at Mount Gibson. The State Government recognised farming
emus as 'technically feasible' in 1987 and approved the sale of 500 emu chicks from the
Wiluna farm (O'Malley, 1993). By 1994 Western Australia boasted 42 operating emu
farms producing emu meat, oil and leather (Smetana, 1994). The growth of the industry
during the 1990's was indicative of the faith placed in it by producers and of the potential
to utilise Australia's native fauna in ecologically sustainable production systems. The
market has experienced a downturn in recent years with the commercial Australian flock
numbering around 50,000 in 1999 (McKinna, 1999). Similar trends have been experienced
in the other countries where producers enthusiastically entered into emu fanning, among
them N e w Zealand, America, China and parts of Europe. The downturn in emu numbers
is the result of poor marketing of emu products (meat, leather and oil) in the wake of
exponential increases in bird numbers, and high production costs.
3.2 - Production constraints
The relative youth of the industry means that much of the information required for a
producer to decide on the best management practices is unknown for the emu. These
unknowns include scientific knowledge of the bird's nutritional requirements, the
heritability of economically significant traits and the correlations between these traits, and
how to manage birds to maximise production. At present the nutritional requirements and
heritability of traits have been based on extrapolation of those for other avian species,
usually the ostrich or chicken (O'Malley, 1996).
Another feature that has contributed to the emu industries problems is the high
reproductive rate of emus, which resulted in an exponential increase in their numbers once
farming commenced. The dramatic increase in bird numbers was problematic because the
development of markets for emu products did not keep pace with the increase in bird
numbers. Marketing groups still remain under a great deal of pressure to develop eager,

Chapter 1 - Literature Review '
receptive markets. To achieve and maintain these markets it is recognised as essential for
producers to reduce the costs of production by maximising productivity (Deeming &
Angel, 1996).
Therefore, maintaining the viability of the emu industry is dependent upon both
establishing stable markets for e m u products and maximising productivity. Maximising
productivity will reduce production costs and allow emu products to be more competitive
in the market place. To maximise the returns per head it is essential to determine the
optimal production conditions and methods for overcoming the utilisation of fat depots due
to breeding behaviour. Furthermore, it will be important to prove to the market that
consistent supplies of all products can be provided.
At present constant supplies of fat throughout the year are prevented by the weight loss that
is associated with the commencement of the breeding season, this in turn limits the
availability of meat and leather (Blake, 1996). In breeding animals the loss of fat is normal
and acceptable. For animals destined for slaughter the loss of fat during the breeding
season is undesirable, particularly when fat prices are high and fat is a significant
component of the economic return obtained from a carcass.
It has been estimated that a 50 week old emu will yield 4kg of fat (Smetana, 1992). Long-
term ex-farm prices have been estimated for the major emu products. Taking into account
the costs of production, a long-term profit of $38 per bird has been estimated (Smetana,
1992). At present these profits are not being realised despite producers receiving, on
average, higher prices for most products than the long-term predictions. The average
prices received for 1999 in Australia were $26.38/L for oil, $62.50 per skin, $11.00/kg for
meat, $4.75 per egg and $28.00 per live bird (Michael, 2000). The potential profits from
emu farming have been eroded by the high cost associated with transport to abattoirs ($10-
$40 per bird) and slaughter ($90-$ 100 per bird), leading to some producers opting to
slaughter on farm and only sell the fat and leather (Michael, 2000). In addition to this
producers have to transport birds on average more than 200kms to the nearest abattoir, as
such they run a serious risk of damage to the birds' skin during transport and a further
reduction in profits (Michael, 2000).
Chapter 1 - Literature Review °
3.3 - Industry potential
The long-term market trends are considered promising based on the public's initial
response and the international interest that has been shown in emu products. The similarity
of the leather produced to that of ostriches and rheas, and the ability to produce it in
commercial quantities, makes targeting the markets for these other leathers a logical action.
Other products such as carved eggs and jewellery crafted from feathers and nails are aimed
at the tourist market, making their future returns difficult to estimate.
Emu meat makes up 30% of the carcass and is sold domestically and internationally
(Dingle, 1997). It is a game meat derived from the thigh and pelvic area and has many
healthy attributes (Berge et al, 1997). These include low levels of fat, cholesterol and
calories (Dingle, 1997). In recent years emu meat has been awarded the Australian Heart
Foundation tick of approval, a valuable and marketable endorsement. In addition, the fat
that is present in emus is predominantly oleic acid, a mono unsaturated fatty acid, which is
beneficial to human health (Dingle, 1997).
About 50% of the profits received from an emu come from fat, making it an important
component of the carcass, especially as it makes up only 17.5% of the live weight (Dingle,
1997). The major consumers of fat are cosmetics companies, which use it as a base for
cosmetics and therapeutic agents. Furthermore, the reputed therapeutic properties of emu
oil have seen it accepted as an alternative, natural treatment for muscle and joint pain. The
demand for emu oil for this purpose is likely to continue, particularly now that scientific
support for its therapeutic properties has been obtained (Snowden & Whitehouse, 1997;
Whitehouse et al, 1998; Lopez et al, 1999). The scientific support for emu oils therapeutic
properties has also allowed an application to be made for therapeutic goods approval (now
pending) that will help to ensure the future of this product and the emu industry.
The problem of seasonal cycles of adiposity still remains a constraint to producers because
it narrows the window of opportunity for slaughtering the birds. If this can be overcome
emu farmers will have a better chance to establish markets for all their products and
improve their profit margins. To do this it is essential that w e increase our understanding
of the control of appetite and fat deposition in the emu so that strategies to manipulate
appetite and adiposity can be developed. To date no information exists regarding the
control of appetite and adiposity in the emu. However, the literature contains a wealth of
Chapter 1 - Literature Review
information on the control of appetite and adiposity in other species and this can be used to
identify a starting point for research in the emu.
4. Appetite and the regulation of adiposity
4.1 - The lipostatic theory
It has been proposed that an indirect calorimetry mechanism exists that regulates adipose
reserves via sensitivity of the hypothalamus to the concentration of circulating metabolites
(Kennedy, 1953). The lipostatic theory was developed on the basis of observations with
rats that demonstrated they adjusted their food intake to very accurately maintain a constant
fat mass and calorie intake (Adolph, 1947; Kennedy, 1950).
This theory was further supported by force-feeding experiments. Intragastrically
cannulated dogs, fed diets corresponding to below, at and above their own determined
requirements, adjusted their food intake such that the calorie intake was constant, and
where possible at the original level (Janowitz & Hollander, 1955). Force-feeding rats and
guinea pigs for prolonged periods above their requirements resulted in the development of
obesity, whereas starved animals lost weight (Harris et al, 1986; Conn & Joseph, 1962;
Harris & Martin, 1984a & 1984b). In addition, when animals returned to ad libitum
feeding, their food intake and body weight returned to the original level. This indicates
that the regulation of food intake and appetite occurs via recognition of the fat store size
and modification of food intake to maintain it at a "set point".
4.2 - Control by the hypothalamus
The lipostatic theory, assumes that there are sites in the brain that receive signals pertaining
to energy reserves and co-ordinate a response in terms of appetite, energy expenditure and
metabolism. The hypothalamus is thought to be this site. Research has shown that damage
to the hypothalamus of mammalian and avian species results in hyperphagia and
consequently obesity (Brobeck, 1946; Lundbaek & Stevenson, 1947; Hervey, 1959; Anand,
1961; Lepovsky & Yasuda, 1965; Smith, 1968). In addition, decreased energy expenditure
often contributes to the development of obesity in these animals as evidenced by a decline
in the level of activity (Hetherington & Ranson, 1942; Brobeck, 1946).
The ventromedial region of the hypothalamus has been proposed as the site of action for
appetite and adiposity control in the hypothalamus. This is based on the observations of
Hetherington & Ranson (1940) that of discrete, localised lesions placed in almost all parts

Chapter 1 - Literature Review 1 U
of the hypothalamus, only those in the tuberal or posterior regions, and most effectively in
the region of the ventromedial nuclei, induced obesity. Other research where obesity has
been induced by creating bilateral lesions in the ventromedial region of the hypothalamus
have supported Hetherington and Ranson's findings (1940), showing that such lesions
cause the highest levels of obesity, primarily via increased food intake (Hetherington &
Ranson, 1942; Brobeck, 1946; Kennedy, 1950; Hervey, 1959).
The findings of Brobeck (1946), Kennedy (1950) and Hervey (1959) indicated that
initially, animals with lesions had an insatiable appetite that diminished with time but still
remained above that of their intake prior to the operation. In the lesioning experiments of
Hetherington & Ranson (1942) obesity occurred without increases in food intake. Instead,
some animals returned to their previous level of food intake but displayed lower levels of
activity than recorded prior to the procedure. This would indicate that the hypothalamus,
as well as controlling appetite, might have some role in determining the energy expenditure
of an animal based on its energy stores. There is also evidence that damage to the
hypothalamus induces obesity via a shift in metabolism to favour fat deposition. For
example, Van Putten et al (1955) pair fed rats with hypothalamic lesions to the level of
unlesioned controls, which resulted in the pairs having identical body weights. However,
carcass composition analysis revealed significantly higher proportions of fat in the lesioned
animals.
4.3 - Fat deposition and mobilisation
The preceding sections have demonstrated that the size of the fat depot is regulated by the
hypothalamus to maintain energy reserves at an appropriate level or "set point". W h e n the
energy reserve is too low, appetite is increased and adipose sparing mechanisms are
initiated, and when the energy reserve exceeds requirements the animal feels sated and
mechanisms to increase energy expenditure may be initiated. Research since the
proposition of the lipostatic theory has demonstrated that these mechanisms rely on the
interaction of hormones, metabolites and signals from the digestive tract (Fig. 1.2).
In the gastrointestinal tract enzymes convert carbohydrates to monosaccharides, fats to fatty
acids and glycerol and proteins into amino acids (Duke, 1986). These enzymes are released
in response to food consumption and digestion. Cholecystokinin, a hormone originating
from the upper small intestine, is released in response to duodenal distension, vagal
stimulation and the presence of nutrients from food (Duke, 1986). Elevation of

Chapter 1 - Literature Review 11
cholecystokinin concentrations decreases food intake via central actions (Savory & Gentle,
1980; Denbow & Myers, 1982; Denbow, 1986).
Nutrients absorbed from the gastrointestinal tract enter the hepatic portal blood system and
are transported to the liver. Elevations of glucose, amino acid or fatty acid concentrations
decrease food intake (Denbow, 1999). Glucose decreases food intake via chemoreceptors
in the liver that act on the central nervous system (Forbes, 1988). The lipid component of
the absorbed nutrients is converted to very low-density lipoproteins (VLDL's) in the liver,
and transported to peripheral tissues (Stevens, 1996). Lipoprotein lipase hydrolyses the
VLDL, releasing fatty acids that are taken up by tissues to meet their energy requirements
or stored in adipose tissue (Stevens, 1996).
\_ Parasympathetic (Vagus) J
CCK
Food Intake
Digestive tract
nutrients
Adrenal gland
Liver
~r lipogenesis
Catecholamines
Glucocorticoids
Insulin
T Pancreas
gluconeo genesis
tissue
Glucose
• - lipolysis -| FFA
ucagon
Leptin
Figure 1.2: A model for the control of food intake and adipose tissue deposition. T h e blue lines indicate
stimulation (solid) or inhibition (dashed) of hormone release or production. T h e black and red lines indicate
negative (dashed) or positive (solid) effects. C C K = cholecystokinin, C R H = corticotrophin-releasing
hormone, F F A = free fatty acid, N P Y = neuropeptide Y .
The storage or mobilisation of energy reserves is controlled by the interactions of
hormones. The most important hormones in the storage and mobilisation of energy
reserves are insulin, glucagon, glucocorticoids, catecholamines and leptin. In mammals,
11
Chapter 1 - Literature Review t ̂
insulin is the primary regulator of metabolism. Insulin stimulates the uptake and storage of
lipids. In avian species, it does this by acting on the liver to increase glucose uptake, inhibit
gluconeogenesis, and increase lipogenesis and the release of V L D L from hepatocytes
(Stevens, 1996). In avian adipose tissue, insulin increases glucose uptake, inhibits free
fatty acid release, stimulates the conversion of glucose to fat and stimulates lipoprotein
lipase concentrations (Griminger, 1986; Hazelwood, 1986). These actions of insulin spare
the triglyceride stores and increase adipose deposition. In mammals, insulin acts centrally
to decrease appetite via suppression of neuropeptide Y (NPY) gene expression (Schwartz
et al, 1991 & 1992). It is likely that this also occurs in avian species, and provides a
negative feedback loop to maintain energy reserves at the correct level.
In contrast to mammals, glucagon is the primary regulator of metabolism in avian species.
Glucagon mobilises energy reserves by inhibiting lipogenesis and stimulating
gluconeogenesis in the liver and stimulating lipolysis in adipose tissue (Stevens, 1996).
The increased lipolytic activity of adipose tissue releases free fatty acids into the peripheral
circulation (Braganza et al, 1973). Glucagon release from the pancreas is stimulated by
insulin, free fatty acids and cholecystokinin and profoundly inhibited by glucose, providing
positive and negative feedback loops (Hazelwood, 1986).
Catecholamines are released from the adrenal gland in response to signals from the
sympathetic nervous system (Stevens, 1996). The catecholamines mobilise stored energy
reserves primarily from the liver, and to a lesser extent from adipose tissue, by stimulating
lipolysis and inhibiting fatty acid synthesis (Stevens, 1996). Glucocorticoids are released
from the adrenal gland in response to increasing adrenocorticotropin ( A C T H )
concentrations in the anterior pituitary (Stevens, 1996). The increase in the concentration
of A C T H is in turn controlled by corticotrophin-releasing hormone (CRH) at the
hypothalamic level (Laycock & Wise, 1996; Kacsoh, 2000). The glucocorticoids have
opposing actions in liver and adipose tissue, stimulating lipogenesis and gluconeogenesis
in the liver, and lipolysis in adipose tissue (Griminger, 1986; Stevens, 1996).
Glucocorticoids also have a negative feedback function, suppressing hypothalamic C R H
production (Kacsoh, 2000). Elevations in C R H , as well as increasing glucocorticoid
release, also suppress the actions of N P Y to increase appetite (McCarthy et al, 1993;
Menzaghi et al, 1993). This action of C R H on N P Y is proposed as one of ways that
depressed appetite is maintained in humans suffering from anorexia nervosa (St0ving et al,
1999).

Chapter 1 - Literature Review 13
C R H is regulated by leptin, a hormone secreted by adipocytes (section 5.1). Leptin
increases the hypothalamic C R H content and expression in vivo, and C R H secretion in
vitro (Schwartz et al, 1996a; Costa et al, 1997; Uehara et al, 1998). In rats, pre-treatment
with antibodies against C R H attenuates the ability of leptin to decrease appetite (Okamoto
et al, 2001). As such, C R H may be involved in the suppression of N P Y expression and
appetite following central leptin administration (Jang et al, 2000). The role of leptin in
avian metabolism has not been extensively studied and is complicated by doubts over the
veracity of published sequences for the chicken leptin gene (see section 5.1 for further
discussion). The evidence to date indicates that leptin expression in the liver, but not
adipose tissue, increases in response to insulin administration (Ashwell et al, 1999a;
Richards et al, 1999). In mammals, the expression of the leptin gene, and leptin secretion,
are stimulated by insulin (Saladin et al, 1995; Barr et al, 1997). Insulin and leptin both act
centrally to decrease appetite (Mistry et al, 1997; Tang-Christensen et al, 1999).
There is evidence that leptin increases the sensitivity of animals to the satiety effects of
cholecystokinin (Emond et al, 1999; Matson & Ritter, 1999). Furthermore, leptin increases
the metabolic rate and energy expenditure (Pelleymounter et al, 1995; Collins et al, 1996;
H w a et al, 1996; H w a et al, 1997; Mistry et al, 1997). Both metabolic rate and energy
expenditure are disrupted, along with appetite, following hypothalamic lesions
(Hetherington & Ranson, 1942; Brobeck, 1946; Van Putten et al, 1955). As such, leptin is
a powerful regulator of adipose reserves at the hypothalamic level, via its ability to alter
appetite, energy expenditure and metabolism, in response to changes in energy balance.
The action of leptin to alter appetite, energy expenditure and metabolism at the
hypothalamic level is mediated by the interaction of a large number of neuropeptides.
N P Y is one of these neuropeptides, it has been mentioned above and has been investigated
in the course of this thesis. N P Y is discussed further in section 5.2. Other hypothalamic
neuropeptides that have a role in the control of appetite, energy expenditure and
metabolism include agouti-related protein, cocaine and amphetamine-regulated transcript,
orexin/hypocretin, proopiomelanocortin and C R H (McCarthy et al, 1993; Menzaghi et al,
1993; Mizuno et al, 1997; Ollmann et al, 1997; Sakurai et al, 1998; Heinrichs & Richard,
1999; Vrang et al, 1999). However, these neuropeptides were not investigated in the
course of this thesis. Instead, m y investigations have focused on N P Y as it has been

Chapter 1 - Literature Review lH
extensively studied in avian species and is considered to be a major central pathway
involved in the control of appetite, energy expenditure and metabolism.
5. Understanding the control of appetite and adiposity in the emu
Hormones, metabolites and genes interact to control appetite via their response to food
intake, absorption of nutrients and changes in the size of the adipose depot (Fig. 1.2). In
the following sections those hormones, metabolites and genes that were investigated in the
course of this thesis are discussed further.
5.1 - Leptin
In the last decade the leptin gene has been cloned and sequenced for a number of species
(Zhang et al, 1994; Masuzaki et al, 1995; Murakami & Shima, 1995; Ramsay et al, 1998).
The gene encodes a 4.5 kilobase adipose tissue specific messenger R N A ( m R N A ) in both
mice and humans (Zhang et al, 1994; Masuzaki et al, 1995). There is 8 4 % homology
between the human and mouse leptin genes. The product of this gene, leptin, is a satiety
signal involved in the regulation of appetite and adiposity (Friedman, 1996; Sinha, 1997;
Auwerx & Staels, 1998; Buchanan et al, 1998; Inui, 1999b). The concentration of leptin
corresponds closely to body mass index (BMI), a correlate of adiposity (Maffei et al, 1995;
Considine et al, 1996; McGregor et al, 1996; Rosenbaum et al, 1996; Schwartz et al,
1996b; Niskanen et al, 1997; Tataranni et al, 1997; Parry et al, 1998; Jensen et al, 1999).
In non-human species leptin concentrations and leptin m R N A expression are directly
correlated with adiposity (Frederich et al, 1995; Maffei et al, 1995; D e Schepper et al,
1998; Hissa et al, 1998; Robert et al, 1998).
Zhang et al (1994) hybridised the leptin gene to Southern blots of genomic DNA from the
mouse, rat, rabbit, vole, cat, cow, sheep, pig, human, chicken, eel and fruit fly. For all the
vertebrate species, detectable signals were present, indicating that they contained D N A
homologous to the mouse leptin gene. The presence of a signal in the chicken indicates
that the leptin gene is likely to be present in other avian species, including emus.
The controversy surrounding the cloning of the avian leptin gene.
Support for the presence of the leptin gene in avian species has been obtained from the
sequencing of the chicken leptin receptor (Horev et al, 2000). T w o groups also claim to
have cloned the chicken leptin gene (Taouis et al, 1998; Ashwell et al, 1999a & 1999b).
Subsequently, a recombinant chicken leptin has been produced (Raver et al, 1998). It is

Chapter 1 - Literature Review I-5
claimed that the chicken sequence shares a high degree of homology (95-97%) with the
mouse leptin gene (Taouis et al, 1998; Ashwell et al, 1999a). However, the chicken leptin
receptor shares only a low degree of homology with mammalian sequences (on average
60%), and this casts doubt on the claims to have sequenced the chicken leptin gene as
receptor sequences are normally more highly conserved than the gene (Horev et al, 2000).
Further doubt is cast by the maintenance of appetite in chickens receiving central injections
of the highly homologous (95-97%) murine recombinant leptin (Bungo et al, 1999). This
is an unexpected finding given that human recombinant leptin, despite being less
homologous to the murine sequence (84%), can decrease appetite when administered to the
mouse (Hwa et al, 1996). Southern hybridisation has demonstrated that the homology
between mouse and chicken leptin genes cannot be more than 72-77% (Varma, 2000).
This degree of homology is much lower than the 95-97% homology at the nucleotide level
claimed by Ashwell et al (1999a) and Taouis et al (1998). Northern hybridisation with a
mouse leptin probe to chicken adipose R N A failed to produce a signal, and P C R and RT-
P C R using primers designed for the mouse and the published chicken leptin sequences also
failed to generate P C R products (Friedman-Einat et al, 1999). Subsequently, claims to
have successfully cloned the chicken leptin gene have been openly challenged by avian
researchers (Dunn et al, 2001; Varma, 2000; Horev et al, 2000; Friedman-Einat et al,
1999).
Mechanism of action of leptin
Daily administration of recombinant leptin to mice lacking functional leptin (ob/ob
genotype) causes time and dose dependent reductions in body weight and food intake
(Weigle et al, 1995; Tartaglia et al, 1995; Pelleymounter et al, 1995; Halaas et al, 1995;
Campfield et al, 1995; Stephens et al, 1995; H w a et al, 1996). In normal mice,
recombinant leptin reduces food intake, even after 24 hours of fasting (Pelleymounter et al,
1995; Rentsch et al, 1995; Mistry et al, 1997). The action of leptin to decrease body
weight does not occur purely via appetite suppression, as the food intake of normal mice
treated with leptin returned to its original level without their body weight returning to pre-
injection levels. Other changes attributed to leptin administration include alterations in
metabolism, level of activity, oxygen consumption, and the normalisation of body
temperature, serum insulin and glucose levels in the ob/ob mouse (Pelleymounter et al,
1995; H w a et al, 1996; H w a et al, 1997; Mistry et al, 1997).
Collins et al (1996) proposed that leptin regulates the extent of adipose tissue reserves by a

Chapter 1 - Literature Review 16
mechanism that involves both appetite suppression and sympathetic nervous system
signaling to increase thermogenesis and energy expenditure in brown adipose tissue as fat
mass increases. To test this hypothesis leptin was administered to ob/ob mice and their
noradrenaline turnover was measured after blocking catecholamine synthesis, which is
indicative of the sympathetic outflow. The administration of leptin caused a selective
increase in noradrenaline turnover in brown adipose tissue, with no effect upon turnover in
white adipose tissue. Taken together these findings demonstrate that leptin regulates body
weight via effects on both food intake and the level of energy expenditure.
5.2 - Neuropeptide Y
Leptin's role in the regulation of energy reserves is as a signal of the adipose depot size,
that initiates appropriate responses in terms of appetite, energy expenditure and metabolic
rate in response to deviations from the "set point". One way in which leptin achieves this is
via its effects on neuropeptide Y (NPY), a potent appetite stimulant. There is an inverse
relationship between the expression of leptin and N P Y .
Tatemoto et al (1982) isolated NPY, a 36 amino acid peptide, from porcine brain extracts.
In both birds and mammals, N P Y is widely distributed in the central nervous system
(Tatemoto et al, 1982; Allen et al, 1983; Chronwall et al, 1985; Boswell et al, 1998;
Gehlert, 1999; Inui, 1999a; W a n g et al, 2001). The highest levels of expression occur in
the hypothalamus (Adrian et al, 1983; Allen et al, 1983; Chronwall et al, 1985; Kameda et
al, 2001). N P Y is a potent central appetite stimulant in avian and mammalian species
(Levine & Morley, 1984; Stanley & Leibowitz, 1984 & 1985; Stanley et al, 1985a & 1986;
Kuenzel et al, 1987; Paez & Myers, 1991; Richardson et al, 1995; Choi et al, 1997; Woods
et al, 1998; Inui, 1999a). N P Y has a pivotal role in the control of appetite and it has been
proposed that increased appetite occurs via NPY's actions at the level of the hypothalamus
in both avian and mammalian species (Stanley et al, 1993; Stanley et al, 1985a; Strader &
Buntin, 2001).
The food intake of animals is higher once food is returned after a period of fasting. This
mirrors the increase in feed intake following central N P Y administration, and research
indicates that endogenous N P Y mediates the feeding responses provoked by food
deprivation (Stanley et al, 1992; Bivens et al, 1998). In addition, it has been found that
passive immunisation against N P Y markedly suppresses feed intake in non-fasted rats
(Dube et al, 1994). It is apparent from these results that N P Y is an important signal

Chapter 1 - Literature Review 17
stimulating ingestive behaviour.
In addition to its effects on appetite, NPY promotes adipose deposition by decreasing
energy expenditure and thermogenesis, and increasing the efficiency of energy storage
(Roscoe & Myers, 1991; Billington et al, 1994; Currie & Coscina, 1995; Stephens et al,
1995; Woods et al, 1998). These actions of N P Y decrease the metabolic rate but do not
appear to involve modulation of the thyroid, as N P Y injection has no effect on thyroid
gland weight, or the serum concentrations of thyroid stimulating hormone, triiodothyronine
and thyroxine (Malendowicz & MiSkowiak, 1990). N P Y does however increase the
consumption of carbohydrate preferentially to fats or protein (Stanley et al, 1985b; Morley
et al, 1987). N P Y also increases the respiratory quotient, indicating that carbohydrate
catabolism is increased (Menendez et al, 1990). As a consequence of this, fat synthesis is
increased.
NPY also interacts with metabolic hormones to promote adipose deposition and energy
sparing mechanisms. Elevations in N P Y expression increase the level of circulating
insulin (Walker & Romsos, 1993; Billington et al, 1994; Tomaszuk et al, 1996; Parikh &
Marks, 1997). This favours fat deposition via increased triglyceride synthesis and
deposition in white adipose tissue (Stevens, 1996). As such, prolonged elevation of N P Y
induces obesity, via increased appetite and metabolic changes that favour fat synthesis and
deposition (Stanley et al, 1986). The effect of N P Y to increase the concentration of insulin
may also function as a negative feedback loop reducing N P Y expression and preventing
excessive adipose deposition. This idea is supported by research demonstrating that the
central administration of insulin decreases N P Y m R N A expression in rats (Schwartz et al,
1991 & 1992). In rats, without access to food, the central administration of N P Y increases
the concentration of glucagon and causes a transient increase in plasma glucose without
effecting the concentration of corticosterone (Marks & Waite, 1996). Central N P Y
administration also decreases insulin sensitivity (Marks & Waite, 1997). During fasting,
the effects of N P Y to increase the concentration of glucagon and decrease insulin
sensitivity interfere with the control of glucose metabolism by insulin. Hypothalamic N P Y
content is rapidly increased in avian and mammalian species by food deprivation or
restriction (Chua et al, 1991; Sahu et al, 1992; Marks et al, 1992; McShane et al, 1993;
Davies & Marks, 1994; Stricker-Krongrad et al, 1997; Jang & Romsos, 1998; Boswell et
al, 1999; Mizuno etal, 1999; Boswell, 2001; Kameda et al, 2001). This elevation in N P Y
is associated with decreased insulin and glucose and increased corticosterone

Chapter 1 - Literature Review 1 0
concentrations (Marks et al, 1992; Mercer et al, 1996; Jang & Romsos, 1998; Dallman et
al, 1999; Mizuno etal, 1999).
Role of NPY in the seasonal cycle of food intake
In some species seasonal cycles of food intake and fat metabolism are observed. These are
proposed to occur via a "sliding set point" for homeostasis (Mrosovsky, 1976; Mrosovsky
& Sherry, 1980; Mercer, 1998). The mechanisms that control this are not well understood,
and the role of N P Y is not clear. In sheep, lower levels of N P Y expression are associated
with periods of low appetite (Clarke et al, 2000). Siberian hamsters, a hibernating species,
also have lower levels of N P Y m R N A expression during short photoperiods, when appetite
is low (Reddy et al, 1999). In addition, this experiment demonstrated that 48 hours of food
deprivation, during both short and long photoperiods, increased N P Y m R N A expression
(Reddy et al, 1999). Furthermore, the Siberian hamster increases its food intake in
response to the central administration of N P Y , on both long and short photoperiods (Boss-
Williams & Bartness, 1996). Another hibernating species, the golden mantled ground
squirrel, also increases its food intake in response to central N P Y infusion (Boswell et al,
1993). It can be inferred from these findings that N P Y expression is correlated with
appetite, and that the responsiveness of central pathways to NPY's actions are not impaired
by changes in photoperiod.
It is likely that the "sliding set point" for homeostasis applies to avian species as well, via
similar mechanisms. In the white-crowned sparrow, as with the Siberian hamster, central
administration of N P Y increases food intake on both short and long days (Richardson et al,
1995). This experiment also demonstrated that during long days, when food intake is
increased, the animals were more sensitive to the effects of N P Y on appetite (Richardson et
al, 1995). As such, a plausible mechanism for photoperiod induced changes in the "sliding
set point" for homeostasis is altered sensitivity to central appetite mediators.
5.3 - VIP, prolactin and reproduction in birds
Changing photoperiod increases the expression of vasoactive intestinal polypeptide (VIP)
and prolactin secretion that are involved in the induction and maintenance of incubation
behaviour in birds. VIP was isolated from porcine small intestine (Said & Mutt, 1970). It
has since been isolated and characterised for a range of species including chickens, cattle,
humans and rats (Nilsson, 1974 & 1975; Carlquist et al, 1979 & 1982; Dimaline et al,
1984). VIP acts as a vasodilator in the periphery, stimulates respiratory chemoreceptors,

Chapter 1 - Literature Review l y
increases cardiac output and induces hypotension and hyperglycemia (Said & Mutt, 1970).
VIP is widely distributed throughout the central nervous system, and is found at highest
levels in the hypothalamus (Bryant et al, 1976; Said & Rosenberg, 1976; Yamada et al,
1982; Kuenzal et al, 1997; Chaiseha & El-Halawani, 1999). Elevations of VIP stimulate
prolactin release in birds and mammals (Kato et al, 197'8; Fuxe et al, 1979; Macnamee et
al, 1986; Opel & Proudman, 1988; Sharp et al, 1989; Pitts et al, 1994; Maney et al, 1999;
Vleck & Patrick, 1999). In avian species the rise in VIP, and subsequently prolactin, is
involved in the induction and maintenance of broody behaviour (El Halawani et al, 1995;
Crisostomo et al, 1997; Bedecarrats et al, 1999; Sockman et al, 2000). In birds immunised
against VIP, photo-stimulation fails to induce a rise in prolactin or induce incubation
behaviour, demonstrating that VIP is an essential intermediary in prolactin response to
photoperiod and for the induction of incubation (El Halawani et al, 1996; Crisostomo et al,
1997).
5.4 - Metabolic and hormonal consequences of incubation
The incubation period in birds can be divided into three phases (Le Maho et al, 1981;
Castellini & Rea, 1992). In the goose, phase I occurs in the first few days of incubation (Le
Maho et al, 1981). Phase I involves a shift from metabolism of ingested nutrients to meet
energy requirements to utilisation of the adipose stores, with minimal weight loss. Phase II
from day 3 to 30 of incubation is associated with a reduced resting metabolic rate and
complete reliance on adipose stores for energy requirements. The third phase from day 30
until the completion of incubation involves protein breakdown to supply the animals
energy requirements as the lipid stores are depleted. The hormonal changes associated
with incubation decrease the metabolic rate and spare the animals energy reserves. These
changes include decreased thyroxine and insulin, decreased or unchanged triiodothyronine
concentrations and increased corticosterone and glucagon concentrations (Chieri et al,
1972; Cherel et al, 1988; Groscolas & Leloup, 1989; Van Cleeff, 2001). The incubation
period is also associated with depressed appetite in many avian species (Mrosovsky, 1976;
Savory, 1979; Mrosovsky & Sherry, 1980; Zadworny et al, 1985; Cherel et al, 1988).
Prolactin is elevated during incubation and has been shown to have variable effects on
appetite. In mammalian species, food intake can be increased, decreased or remain
unchanged when prolactin is suppressed (Shani et al, 1975; Brien, 1986; Bartness et al,
1987; Curlewis etal, 1988 & 1991; Salah et al, 1995). In both mammalian and avian

Chapter 1 - Literature Review ^
species, appetite increases, decreases or does not change in response to prolactin
administration (Shani et al, 1975; Ryg & Jacobsen, 1982; Denbow, 1986; Moore et al,
1986; Bartness et al, 1987; Curlewis et al, 1988; Buntin & Figge, 1988; Gerardo-Gettens et
al, 1989a &1989b; Heil, 1999; Ebenezer & Parrott, 1991; Byatt et al, 1993; Hnasko &
Buntin, 1993; Noel & Woodside, 1993; Salah et al, 1995; Buntin et al, 1999). In ring
doves the increase in appetite in response to prolactin administration occurs via an increase
in the number of cell bodies that are immunoreactive to N P Y (Strader & Buntin, 2001).
However, despite elevated prolactin concentrations, appetite is not increased during
incubation. It is possible that differential regulation of appetite occurs in the central
nervous system and is dependent on reproductive status, factors such as the egg or nest
stimuli, and the permissive action of other hormones (Buntin & Tesch, 1985; Janik &
Buntin, 1985; Horseman & Buntin, 1995). This differential regulation could take the form
of an inhibition of NPY's response to elevated prolactin levels, or inhibition of NPY's
actions to increase appetite during the reproductive period.
6. Manipulation of appetite and adiposity
The decreased appetite and adiposity observed during incubation is an adaptation to enable
a more important process, namely reproduction, to succeed. It occurs via endogenous
disruption of the mechanisms controlling energy balance. The control of appetite and
adiposity can also be manipulated exogenously, to prevent the animal from maintaining
energy reserves at the correct "set point". Manipulating the "set point" can be achieved
either by physical means (i.e. starvation or force-feeding) or by interfering with the
animal's mechanisms of assessment and response to changes in the extent of the energy
reserves (i.e. hypothalamic lesions, high fat feeding, glucocorticoid treatment). The
manipulations employed during the course of this experiment are discussed below.
6.1 - High fat diets
High fat diets increase adiposity in mammals (Edozien & Switzer, 1978; Faust et al, 1978;
Ausman et al, 1981; Oscai et al, 1984; Diersen-Schade et al, 1985; Storlien et al, 1986;
West et al, 1992; Hill et al, 1992; Boozer et al, 1995; Van Heek et al, 1997; Smith et al,
1998; Kim et al, 2000). This is also observed in chickens (Deaton et al, 1981; Vila &
Esteve-Garcia, 1996). High fat diets induce hyperphagia, although this effect is variable
across species and strains and may be transient (Oscai et al, 1984; West et al, 1992; Hill et
al, 1992; French et al, 1995; Smith et al, 1998).

Chapter 1 - Literature Review ^1
The degree of adiposity induced by a high fat diet is proportional to the diet's fat content
(Edozien & Switzer, 1978; Deaton et al, 1981; Boozer et al, 1995; Vila & Esteve-Garcia,
1996). High fat diets can increase adiposity without increasing energy consumption or
body weight (Oscai et al, 1984; Storlien et al, 1986; West et al, 1992; Boozer et al, 1995;
Smith et al, 1998). They are able to do this because more calories are obtained from fat,
and provided the oxidation of carbohydrates and proteins is sufficient to meet energetic
requirements, fats are stored.
High fat diets increase fat consumption and storage via the following mechanisms:
1. Lower satiety of diets high in fat (French et al, 1995; Covasa & Ritter 1998 &
1999; R o m o n et al, 1999; Havel et al, 1999),
2. Greater absorbance of fat from the diet than protein or carbohydrate (Singh et
al, 1972; Reed et al, 1991; French etal, 1995),
3. Slower induction of fat oxidation from the diet than protein or carbohydrate
(Flattera/, 1985; Hill etal, 1992; Prentice, 1998; Friedman, 1998), and
4. Decreased energy expenditure and heat production in response to high fat diets
(Black et al, 1949, Storlien et al, 1986).
Because of these mechanisms, particularly the lower satiating effect, consumption of high
fat diets can lead to passive over consumption of energy and increased adiposity (Bray &
Popkin, 1998).
In mice, high fat diets induce peripheral, but not central, leptin resistance, and the onset of
resistance is faster the higher the diets fat content (Van Heek et al, 1997). It has been
proposed that leptin is a modulator of weight gain that is overridden by the continuous
presence of high levels of fat in the diet (Ahren, 1999). Such a mechanism allows animals
to take full advantage of high fat food sources when they are available and thereby increase
their chances of surviving subsequent famines. The ability of mice to override the control
of appetite and adiposity by leptin suggests that they have a "thrifty" genotype. The
"thrifty" genotype was proposed by Neel (1955) as an explanation of the greater efficiency
of food utilisation associated with inherited metabolic disorders. These genotypes have
evolved because greater efficiency of food utilisation is an advantage in famine situations
and allows for greater storage of ingested nutrients. However progress has eliminated feast
and famine situations in the Western world and along with the high fat content of today's
diet has rendered this "thrifty" genotype detrimental to health. It seems logical that other

Chapter 1 - Literature Review z z
species have developed similar strategies for coping with feast and famine situations. The
emu is subjected to extremes of food availability in the wild and it is probable that it has
evolved mechanisms to take full advantage of abundant food sources and increase adipose
deposition.
It is likely that these mechanisms may involve metabolic adaptations, however these can
vary widely between species and strains. Rats fed high fat/protein diets had increased
fasting plasma glucose concentrations, glucose intolerance and insulin resistance (Ramirez
et al, 1990). In other experiments, rats fed diets that contained from 12 to 4 8 % of energy
as fat, did not show differences in their insulin or glucose concentrations (Boozer et al,
1995). In mice, glucose and insulin concentrations are unchanged by high fat diets
although insulin sensitivity is reduced (Lemonnier et al, 1975). However, other researchers
have found that high fat diets (58%) increase insulin concentrations, and create a state of
insulin resistance and glucose intolerance (Ahren & Scheurink, 1998).
6.2 - Glucocorticoids
As with high fat diets, the actions of glucocorticoids to increase adiposity result from
hormonal changes that alter metabolism (Fig. 1.3). Glucocorticoid treatment increases
circulating insulin concentrations in avian and mammalian species (Campbell et al, 1966;
Simon, 1984; McKibbin et al, 1992; Corah et al, 1995; Dallman et al, 1995; Berneis et al,
1996; Miell et al, 1996; Makino et al, 1998; Zakrzewska et al, 1999). In birds, increased
concentrations Of insulin favour adipose deposition (Griminger, 1986). A feature of
chronic glucocorticoid treatment is increased adiposity in both avian and mammalian
species (Hausberger & Ramsay, 1953; Dulin, 1956; Nagra & Meyer, 1963; Nagra, 1965;
Simon, 1984; Kafri et al, 1988; Corah et al, 1995). This arises from the induction of insulin
resistance and the action of concomitant elevations of insulin and glucocorticoids to
increase adipose deposition (McKibbin et al, 1992; Dallman et al, 1993; Taouis et al,
1993; Dallman et al, 1995). The increased adiposity observed with glucocorticoid
treatment is not necessarily associated with increased appetite or live weight.
In both birds and mammals, glucocorticoid treatment may be accompanied by decreases in
both appetite and weight gain (Greenman & Zarrow, 1961; Simon, 1984; Kafri et al, 1988;
McKibbin et al, 1992; D e Vos et al, 1995; Makino et al, 1998; Zakrzewska et al, 1999).
As central insulin administration decreases neuropeptide Y (NPY) m R N A expression, the
increase in insulin concentration associated with chronic dexamethasone treatment may

Chapter 1 - Literature Review Z J
contribute to appetite depression (Schwartz et al, 1991; Schwartz et al, 1992). Indeed, in
rats, N P Y was increased in the lateral hypothalamic area following acute but not chronic
dexamethasone treatment (McKibbin et al, 1992). In this experiment insulin was not
altered 4 hours after an injection of dexamethasone, but was increased after 7 days of
treatment and associated with decreased appetite (McKibbin et al, 1992). In dogs, chronic
dexamethasone treatment impairs insulin transport into the central nervous system (Baura
et al, 1996). As such, it would seem unlikely that insulin could suppress hypothalamic
N P Y expression in these animals. In Syrian hamsters, chronic dexamethasone treatment
increased N P Y expression and depressed weight gain without changing the insulin
concentration (Mercer et al, 1996). These conflicting results represent species-specific
differences in response to dexamethasone, and highlight the need for further research in
this area.
The trend for decreased weight gain indicates that glucocorticoids have catabolic effects.
These catabolic effects are particularly pronounced at high doses and result from the
bitonic response of live weight and feed efficiency to glucocorticoids (Devenport et al,
1989; Dallman et al, 1993). This response is due to the presence of two corticosterone
receptors, type I and type II. With increasing glucocorticoid concentrations the type II
receptor is stimulated to a greater extent, promoting tissue catabolism (Devenport et al,
1989). The synthetic glucocorticoid dexamethasone, in contrast to other glucocorticoids,
only stimulates the type II receptor. Despite this dexamethasone treatment can increase
appetite and adiposity (Adams & Sanders, 1992; Corah et al, 1995). This is because the
increase in insulin observed with dexamethasone treatment promotes adipose deposition,
and contributes to increases in the fat to lean mass (Devenport et al, 1989; Corah et al,
1995; Miell etal, 1996; Kolaczynski etal, 1997).
Glucocorticoids have variable effects on glucose concentrations in both avian and
mammalian species (Greenman & Zarrow, 1961; Campbell etal, 1966; Simon, 1984;
Joseph & Ramachandran, 1992; McKibbin et al, 1992; Papaspyrou-Rao et al, 1997;
Makino et al, 1998). In birds, increased concentrations of glucose have a sparing effect on
adipose stores, via decreases in the concentration of glucagon and adipose utilisation
(Hazelwood, 1986). Another feature of glucocorticoid treatment, in both birds and
mammals, is increased liver weight and liver fat contents (Dulin, 1956; Campbell et al,
1966; Adams, 1968; Simon, 1984, Kafri et al, 1988). The increased liver weight is due to
an accumulation of fat in the liver because of the action of glucocorticoids to promote

Chapter 1 - Literature Review
gluconeogenesis and lipogenesis in this tissue (Dallman et al, 1993). These actions
increase the extent of the energy reserves.
Figure 1.3: The hypothalamic-pituitary-adrenal axis: effects of endogenous (upper diagram) and exogenous (lower diagram) glucocorticoids (solid lines indicate stimulation/increase, dashed lines indicate inhibition/decrease). Grey lines and labels indicate that effects are diminished or unknown. C R H = corticotrophin-releasing hormone, P O M C = proopiomelanocortin (precursor for A C T H ) , A C T H =
adrenocorticotropic hormone. Adapted from Kacsoh (2000).

Chapter 1 - Literature Review
In the chicken, acute dexamethasone has variable effects on plasma triiodothyronine and
decreases plasma thyroxine concentrations (Mitchell et al, 1986; Darras et al, 1997).
These effects on thyroid hormone concentration are due to inhibition of thyroid stimulating
hormone release, decreases in the release of thyroid releasing hormone (TRH) and a
diminished expression of proTRH m R N A (van Haasteren et al, 1996; Darras et al, 1997).
These changes in thyroid hormones could be expected to decrease the metabolic rate and
have a sparing effect on adipose stores. Indeed acute dexamethasone treatment decreases
heat production in chickens, indicating a decreased metabolic rate (Mitchell et al, 1986).
Glucocorticoids also impact on reproductive function in birds. In chickens, corticosterone
administration induced ovarian regression and decreased the concentration of luteinising
hormone, progesterone and oestradiol (Etches et al, 1984). Acute dexamethasone
treatment decreased luteinising hormone secretion and prevented ovulation when given 13-
14 hours before the expected time of ovulation (Soliman & Huston, 1974; Wilson &
Lacassagne, 1978). This effect is due to the action of dexamethasone to inhibit A C T H
release and suppress corticosterone secretion (Arimura et al, 1969; Sirett & Gibbs, 1969;
Buckland et al, 191 A; Etches, 1976; Arvat et al, 1998). The suppression of corticosterone
secretion prevents the positive feedback of corticosterone on luteinising hormone secretion
(Wilson & Lacassagne, 1978).
Clearly, manipulations of the hypothalamic-pituitary-adrenal axis (HPA) by glucocorticoid
administration can alter the metabolic rate and hormone concentrations to favour increases
in adiposity. As such, treating emus with glucocorticoids provides an opportunity to
improve our understanding of the control of appetite and metabolism, while determining
the potential of glucocorticoids as a means of increasing adiposity in the emu.
6.3 - Starvation
In contrast to treatment with high fat diets or glucocorticoids, the effects of starvation on
appetite and adiposity are clear. Starvation increases appetite, decreases adiposity and
initiates mechanisms to conserve energy reserves. These mechanisms include decreased
energy expenditure and reductions of the metabolic rate, and are paralleled by changes in
metabolic hormones. In mammals, starvation induces rapid changes in the concentration of
metabolic hormones, including;
1. Decreased insulin (Lyle et al, 1984; Nair et al, 1987; Webber & Macdonald,
1994; Mercer et al, 1998; Dallman et al, 1999),

Oft Chapter 1 - Literature Review
2. Increased glucagon (Stout et al, 1976; Goschke & Tholen, 1977; Nair et al,
1987),
3. Increased corticosterone (Dallman et al, 1999),
4. Decreased glucose (Stout et al, 1976; Lyle et al, 1984; Nair et al, 1987; Webber
& Macdonald, 1994; Dallman et al, 1999),
5. Decreased triiodothyronine (Harris et al, 1978; Nair et al, 1987; Ikeda et al,
1991; Webber & Macdonald, 1994; Van der Wal et al, 1998),
6. Decreased thyroxine (Harris et al, 1978; Ikeda et al, 1991; Van der Wal et al,
1998),
7. Decreased thyroid stimulating hormone (Harris et al, 1978; Ikeda et al, 1991)
and,
8. Increased growth hormone (Goschke & Tholen, 1977).
Avian species respond to starvation in a similar manner to mammalian species. However,
they differ from mammalian species in that glucagon rather than insulin is the primary
regulator of metabolism, especially during food deprivation (Hazelwood, 1986). In birds
voluntary or imposed starvation induces the following changes in the concentration of
metabolic hormones:
1. Insulin unchanged, or increased (Johnson & Hazelwood, 1982; Rosebrough et
al, 1984; Cherel et al, 1988),
2. Increased glucagon (Cieslak & Hazelwood, 1983; Hazelwood, 1986; Cherel et
al, 1988),
3. Increased corticosterone during phase III of incubation fast, and during imposed
short-term starvation (Cherel et al, 1988; Lea et al, 1992; Geris et al, 1999),
4. Plasma glucose unchanged during incubation or decreased during imposed
starvation (Hazelwood & Lorenz, 1959; Harvey et al, 1978; Le Maho et al,
1981; Rosebrough etal, 1984),
5. Decreased triiodothyronine (Cherel et al, 1988; Groscolas & Leloup, 1989; Lea
et al, 1992; Kiihn et al, 1993; Schew et al, 1996; Darras et al, 1997; Prem et al,
1998; Geris et al, 1999; Van der Geyten et al, 1999),
6. Thyroxine decreased during incubation and either decreased, increased or
unchanged during imposed starvation (Cherel et al, 1988; Groscolas & Leloup,
1989; Kiihn et al, 1993; Schew et al, 1996; Darras et al, 1997; Prem et al, 1998;
Geris et al, 1999; Van der Geyten et al, 1999),
7. Decreased thyroid stimulating hormone (Geris et al, 1999; Van der Geyten et al,

Chapter 1 - Literature Review z'
1999), and
8. Increased or decreased growth hormone (Harvey et al, 1978; Hazelwood, 1986;
Kiihn et al, 1993; Schew et al, 1996; Darras et al, 1997; Geris et al, 1999).
In both avian and mammalian species these changes in metabolic hormones act to maintain
a constant internal environment. In mammals, decreased insulin concentrations decrease
glucose use and promote the use of endogenous substrates for gluconeogenesis (Chilliard et
al, 1998). Hypothyroidism decreases basal metabolism and reduces the rate of protein and
fat turnover (Chilliard et al, 1998). The increased growth hormone concentration has a
sparing effect on protein reserves (Norrelund et al, 2001). These hormonal changes
minimize the loss of energy reserves.
A feature of starvation is the utilisation of adipose, and especially in birds, hepatic reserves
(Kleiber, 1961; Hazelwood, 1986). The catabolism of these reserves releases substrates
into the circulation that also alter metabolism. In mammalian species, acute starvation is
associated with an increase in the circulating concentration of free fatty acids (Stout et al,
1976; Goschke & Tholen, 1977; Lyle et al, 1984; Romijn et al, 1991). In avian species a
similar situation is observed during the first few days of fasting or incubation anorexia (Le
M a h o et al, 1981; Hazelwood, 1986). However, with prolonged incubation anorexia the
concentration of free fatty acids decreases (Le M a h o et al, 1981; Groscolas & Leloup,
1989). In humans, there is evidence that the elevation in free fatty acids in response to
starvation suppresses gluconeogenesis and minimises protein degradation (Fery et al,
1996). As such, the response of animals to starvation provides insights into the control of
appetite and the range of energy sparing mechanisms that are employed, when the animal's
response are not influenced by the reproductive state.
Metabolite concentrations also alter in response to imposed or naturally occurring
starvation. The changes in metabolite concentrations can reveal the energy source that the
animal is using to meet its energetic requirements. In avian species, B-hydroxybutyrate
rises rapidly in response to fasting, but at a slower rate in response to naturally occurring
anorexia during incubation (Le M a h o et al, 1981; Cherel et al, 1988). Increases in the
concentration of B-hydroxybutyrate indicate catabolism of adipose stores. The later stages
of incubation anorexia are associated with increased uric acid and decreased B-
hydroxybutyrate plasma concentrations (Le M a h o et al, 1981; Cherel et al, 1988; Groscolas
& Leloup, 1989). This indicates that the birds are catabolising protein and obtaining less

Chapter 1 - Literature Review z o
energy from adipose reserves (Groscolas & Leloup, 1989). It is likely that the emu
undergoes similar changes in metabolites, hormones and energy sparing mechanisms in
response to starvation. As such, investigation of the emu's response to starvation could
provide insights into the control of appetite and the nature of energy sparing mechanisms
employed by the emu.
7.0 - Conclusions
The decreased appetite and diminished adipose reserves that are associated with the
breeding season limit the commercial productivity of the emu. To overcome production
constraints associated with reproduction in the emu it is essential that the physiology and
biochemistry underpinning appetite in the emu be better understood. The information
given in the preceding sections relates to a general integrated model for the control of
energy balance that is based mainly on data from mammalian species. However, the emu
may not adhere to this model given the strong evolutionary pressure applied to it for
efficient use of available energy sources by the harshness of its environment.
The general aim of this study has been to improve the understanding of the control of
appetite and adiposity in the emu. To address this aim, the general hypothesis of this thesis
was that seasonal variation in appetite and adiposity in the emu operates under the general
model developed in other species.
The general hypothesis was tested using experimental models associated with altered
appetite, adiposity and metabolic hormone concentrations. The experimental models used
were high fat diets and dexamethasone treatment (increased appetite and adiposity),
incubation (decreased appetite and adiposity) and starvation (increased appetite and
decreased adiposity). Three approaches were taken to test the general hypothesis. First, to
determine the role of leptin in the control of appetite and adiposity attempts were made to
clone and sequence the e m u leptin gene. Once sequenced it was intended that the gene
would be used to develop an emu specific leptin radioimmunoassay, and investigate
changes in leptin gene expression during the annual cycle of the emu. Second, the
concentration of metabolic hormones was measured in all of the experiments. Finally, to
determine the role of N P Y in the control of appetite and adiposity the m R N A expression of
N P Y from the mediobasal hypothalamus and preoptic area was quantified in the
glucocorticoid treatment, incubation and starvation experiments.

Chapter 2
General Materials and Methods
Page
1. Experimental location 30
2. Animals 30
3. Nutrition 30
4. Measurements 30
5. Blood sampling 33
6. Euthanasia 34
7. Tissue collection techniques 34
8. Metabolic substrate and hormone assays 36
9. Hormone data analysis 49
10. Molecular techniques 52

Chapter 2 - General Materials and Methods 30
A general overview of the materials and methods employed during the course of the
study is presented here. Details of the techniques, treatments and analyses will be given
fully in the experimental chapters. All experiments were approved by the University of
Western Australia animal ethics committee and were carried out in accordance with
welfare guidelines. Appendix 2 contains a list of all suppliers mentioned in this and
subsequent chapters.
1. Experimental Location
Experiments were performed at the Shenton Park research station (31°56'S), part of the
University of Western Australia, situated in Perth, Western Australia. Perth has a
mediterranean climate, with wet winters (average rainfall 150.9 m m ; daily temperature
range 8.1 -28.3°C) and hot, dry summers (average rainfall 12 m m ; daily temperature
range 14.8-46.7°C) (Bureau of Meterology website). All animals used in the
experiments were maintained outdoors in individual pens (pen size: experiments 1, 3
and 4 were greater than 15 m2, experiment 2 were approximately 4 m ) .
2. Animals
All emus used during the course of this research were either bred at the Shenton Park
facility ( U W A ) , Medina (Agriculture Western Australia) or obtained from a commercial
breeder in the vicinity of Perth (P & T Amrein, Wungong). The animals were
acclimatised at the Shenton Park facility in individual pens for at least two weeks before
the commencement of any experiments. The animals used were sexually mature adults,
ranging in age from 14 months to five years old, unless otherwise stated. Due to a
downturn in the emu market birds were not readily available and therefore the choice of
sex for each experiment was determined by availability.
3. Nutrition
Animals were fed an emu breeder pellet obtained from Glen Forrest Stockfeeders (for
specifications see Appendix 2). Feed and water were provided ad libitum for all
experiments, unless otherwise stated.
4. Measurements
Live weight

Chapter 2 - General Materials and Methods 31
Animals were weighed periodically during the course of all the experiments. The birds
were caught, manoeuvred onto livestock scales (Ruddweigh K M - 2 electronic weighing
system), and held while recordings were made (Fig. 2.1).
Figure 2.1: Live weight measurement of the emu.
Fat score
A n assessment of the size of the subcutaneous fat depot, as developed by Mincham et al
(1998), was conducted periodically for experiment 2. This entailed restraining the bird
while the region between the preacetabular ilium and postacetabular ilium was palpated.
The body condition of the animal in terms of build up of muscle and fat around the
backbone was scored between 1 and 5. The values correspond to the following
descriptions:
1 - bones prominent and sharp;
2 - bones prominent but smooth;
3 - bones can be felt but are smooth and rounded;
4 - bones are detectable with pressure on the thumb;

Chapter 2 - General Materials and Methods 32
Feed Intake
Throughout the experiments individual feed intakes were recorded. Buckets were filled
with feed such that the combined weight was in the range of 6 to 8 kilograms. The
exact weight was recorded and the buckets returned to the pens. After periods of either
48 or 72 hours the buckets were collected and the combined weight of the bucket and
the remaining feed was recorded. The buckets were then refilled, weighed, recorded
and returned to the bird. Weighing and refilling of buckets was done in the morning.
Blood glucose
Blood glucose was measured during experiments' 2 and 3, using a hand-held blood
glucose meter (Precision Q.I.D, Medisense) by applying a droplet of blood to an
electrode (Precision plus, Medisense) immediately following each bleed. The blood
glucose levels recorded for emus ranged from 5.1 to 16.5 mmol/L. The between
electrode variation determined by the manufacturer is 2.1-3.7% over the range of
concentrations observed for emus. Parallelism had been previously determined for
emus (Van Cleeff, 2001).
Carcass composition
Following the removal of tissue samples (further details are given in the tissue
collection techniques below), the carcass was stripped of subcutaneous adipose tissue.
Following this the internal organs were removed and the visceral fat dissected out. The
tissues of interest were then weighed with the whole procedure taking approximately 45
minutes per bird (Table 2.1). The digestive tract length (proventriculus to cloaca) was
also measured for experiment 1 (Chapter 4).
Table 2.1: Tissues weighed for each experiment
Tissue
Subcutaneous adipose
Visceral adipose
Liver
Gastrocnemius lateralis (hamstring)
Ovary
Testis
Heart
Digestive tract (proventriculus to cloaca)
1
/
•/
Experiment
2 3
V
s
s s s V
4
Experiments 1, 2, 3 and 4 are described in Chapters 4,5, 6 and 7 respectively

Chapter 2 - General Materials and Methods 33
Tissue fat content determination
Following slaughter the fat content of liver and muscle was determined for experiment 1
using the method developed within the Animal Science group and described by Pluske
(1993). Approximately 2 g (wet weight) samples of each tissue were collected in
triplicate. Samples were frozen at -20°C, freeze-dried and re-weighed. The tissues were
then ground to a powder and mixed with 40 ml of solvent (hexanedsopropanol = 3:2),
and tumbled at a slow speed for two hours before being left to stand overnight. The
samples were filtered under vacuum through Whatman no. 1 filter paper over a ceramic
filter with 3 micron pores. The filtrate was dried for two hours at 70°C to evaporate
excess solvent and weighed. The fat content was determined as the amount removed by
the solvent:
fat content = freeze-dried weight - weight of tissue after solvent extraction.
Figure 2.2: Jugular bleeding of the emu.
5. Blood sampling
The animals were caught and restrained by holding their wings while standing behind
them. This was necessary to control the animal while being bled. Blood samples were
taken at regular intervals from the jugular using an 18-gauge needle and either a 10 or
20 ml syringe (Fig. 2.2). Between 10-20 ml samples were collected and immediately
transferred into plastic tubes for plasma or serum collection. Plasma collection tubes
contained 40 IU/ml of heparin with a small amount of polystyrene granules (Kwikspin
granules: Disposable Products Pty Ltd, Australia) added. Plasma tubes were centrifuged

Chapter 2 - General Materials and Methods 34
(Sarstedt Australia Pty Ltd) and were stored at 4°C for 1-3 days before being
centrifuged. All centrifugation of blood samples was performed at 3000 rpm and 4°C
for 25 minutes. Plasma and serum samples were decanted into plastic tubes (Sarstedt
Australia Pty Ltd) and stored at -20°C. All blood samples were collected in the
morning.
6. Euthanasia:
All birds were euthanased at the completion of experiments by the injection of 25 ml of
Lethabarb (sodium pentabarbitone 325 mg/ml, Virbac) into the jugular.
7. Tissue collection techniques for:
RNA extraction
Samples were collected for R N A extraction from the following tissues: adipose, liver,
mediobasal hypothalamus and preoptic area. To obtain the mediobasal hypothalamus
and preoptic area the head was removed following euthanasia and the skull opened
using secateurs to cut through the skull in a hexagonal pattern (Fig. 2.3). The piece of
skull bounded by the cuts was then pried up along the incision at the back of the skull,
and the dura mere carefully cut away to remove it without disturbing the brain.
Incisions were made through the cerebellum and the optic chiasma, and the brain gently
lifted free by cutting through any constraining connective tissue and nerves. The region
of the brain containing the mediobasal hypothalamus and the preoptic area were
collected and snap frozen in liquid nitrogen for R N A extraction (Fig. 2.4). All tissues
required were excised within 15 minutes of the animal being euthanased and cut into
appropriately sized pieces (not greater than one gram). To prevent R N A degradation by
RNases prior to tissue collection all instruments used were wrapped in alfoil and baked
at greater than 200°C for 24 hours, and any manipulation of tissues was carried out
either on baked alfoil or in baked glass petri dishes. Where instruments were re-used
they were rinsed in a 2 % S D S solution between animals. Sterile 5 ml tubes (Sarstedt
Australia Pty Ltd) were used to store tissues and samples were snap frozen in liquid
nitrogen as rapidly as possible after collection (less than one minute). Samples were
stored at -80°C until R N A extractions were performed (section 10.).

Chapter 2 - General Materials and Methods 35
Figure 2.3: An emu skull showing the placement of incisions through the skull for brain removal.
Figure 2.4: Schematic saggital view of the avian brain showing the microdissection sites for collection of the mediobasal hypothalamus ( M B H ) and preoptic area (POA) for R N A extraction and R P A (CER=cerebellum, PS=pituitary stalk, OC=optic chiasma). Adapted from Pearson (1972).

Chapter 2 - General Materials and Methods 36
8. Metabolic substrate and hormone assays
General buffers and reagents
0.5 M phosphate buffer To -800 ml of nanopure water add 61.3 g disodium
hydrogen orthophosphate (Na2HP04) and 10 g
sodium dihydrogen orthophosphate
(NaH2PO4.2H20), adjust the p H to 7.5 and bring the
volume to 1 L with nanopure water,.
0.3 Mphosphate buffer 3:2 dilution of 0.5 M phosphate buffer in nanopure
water, p H 7.5.
0.1 Mphosphate buffer 1:4 dilution of 0.5 M phosphate buffer in nanopure
water, p H 7.5.
Phosphate buffered saline (PBS) 100 ml 0.1 M phosphate buffer, 8.9 g sodium
chloride (NaCL), 1 g sodium azide (NaN3) make to 1
L with nanopure water, p H 7.5.
Sample preparation
E m u serum and plasma often exhibit high lipid contents. The lipid interferes with the
detection of luteinising hormone (LH), glucagon and insulin via radioimmunoassay. To
remove the lipid two approaches were employed. Samples to be assayed for L H and
glucagon (1 ml) were treated with 4 5 % polyethylene glycol (PEG) (200 /il), incubated
for 30 minutes and centrifuged at 1600 g for 10 minutes (Blache et al, 2001a). The
clear plasma or serum was transferred to a fresh tube. P E G extraction recovers 75%,
8 9 % and 4 0 % respectively of LH, glucagon and insulin (Van Cleeff, 2001). As the
recovery of insulin by P E G extraction is low, lipid removal from samples to be assayed
for insulin was achieved by centrifugation at high speed for between 10 and 30 minutes.
The clear plasma or serum was removed from below the fat layer to a fresh tube.
Corticosterone
Corticosterone was measured using extraction methods developed by Smith et al (1972)
and Etches (1976).
Buffers/reagents
Gelatin phosphate buffer (GPB) PBS (pH 7.5) + 1 g gelatin/L
Dextran-coated charcoal 6.25 g charcoal + 0.625 g dextran T70/L in GPB.

Chapter 2 - General Materials and Methods 37
Standards
A stock solution of corticosterone (4-pregnene-llp, 21-diol-3, 20-dione, Sigma) was
prepared in ethanol to a concentration of 7.6 jtfg/ml. Standards were made by serial
dilution to the following concentrations: 20,10, 5, 2.5,1.25,0.6125, 0.306, 0.15 and
0.078 ng/jiil in ethanol.
Antiserum
The first antibody, corticosterone antiserum B3-163, was raised in rabbits and obtained
from Endocrine Sciences Products. To use in the assay it was reconstituted, and diluted
to 1:200 in gelatin phosphate buffer.
Tracer
[1,2,6,7-3H] corticosterone (Amersham Biosciences Pty Ltd).
Purification:
A 5 ml pipette stoppered with a glass bead was filled with 2.5 ml of LH-20 sephadex
(Pharmacia Biotech) swollen in a mixture of benzene:methanol (9:1). 10 /xCi of tracer
was dried down and redissolved in benzene:methanol (9:1) (100 (il). This was added to
the column and allowed to enter the gel bed. The column was eluted with
benzene:methanol (9:1). Fractions (500 ptl) were collected into glass tubes and an
aliquot of 5 (i\ of each fraction was counted with scintillint (Starscint, Packard) using a
liquid scintillation counter (Packard 1500 Tri-Carb Liquid Scintillation Analyzer). The
appropriate fractions were pooled, dried down under compressed air and dissolved in
absolute ethanol (5 ml). O n Day 1 of the assay the tracer was diluted to 10000 cpm per
20 ul
Assay procedure
The standard curve was placed at the beginning of the assay. Each standard curve
included 3 tubes for total counts (TC), 3 tubes for non-specific binding (NSB), 9
replicates of zero binding (B0), 3 replicates of each standard and 4 replicates each of two
pool samples.
On Day 1, the tubes to be used for the assay were coated with 10000 cpm of the tracer
prior to commencement of the assay. 12 x 75 m m glass tubes were coated for samples
and pools and 10 x 75 m m glass tubes were coated for standards, TC, N S B and Bo.
Tracer (20 /i\, 10000 cpm) was added to all tubes, standards (100 /xl) were added in

Chapter 2 - General Materials and Methods 38
triplicate to the appropriate tubes. All tubes were evaporated to dryness under
compressed air at 37°C using a heated block.
Extraction:
Samples of unknown serum and pools (100 p\) were added to the coated tubes, vortexed
individually and incubated for 30 minutes at room temperature. The samples and pools
were extracted by adding 2 ml of 2,2,4-trimethyl pentane (iso-octane) or hexane to each
tube and vortexing twice for 30 seconds. The tubes were then centrifuged at 1500 rpm
for 5 minutes (Beckman J-6M/E centrifuge). The aqueous layer was frozen by partially
immersing the tubes in an acetone-dry ice bath, the solvent layer was then discarded.
Dichloromethane (2 ml) was added to each tube and the tubes were vortexed twice for
30 seconds. The tubes were centrifuged at 1500 rpm for 5 minutes (Beckman J-6M/E
centrifuge). The tubes were returned to the acetone-dry ice bath to freeze the upper
aqueous layer, the organic layer was then poured off into clean 10 x 75 m m glass tubes.
The dichloromethane was evaporated to dryness under compressed air at 37°C. First
antibody (250 /xl) was added to all tubes except the T C and N S B (GPB (250 fil) was
added to T C and N S B in place of the first antibody). The tubes were then shaken and
incubated for 24 hrs at 4°C.
On Day 2, dextran-coated charcoal (200 ^tl) was added to all tubes except TC the tubes
were incubated for 20 minutes at 4°C before being centrifuged at 1500 rpm for 10
minutes (Beckman J-6M/E centrifuge). A volume of 400 fx\ of the supernatant was then
removed and added to a counting vial along with 2 ml of scintillant (Starscint, Packard)
and counted for 3 minutes each in a liquid scintillation counter (Packard 1500 Tri-Carb
Liquid Scintillation Analyzer).
Glucagon
Glucagon was measured using Linco kit tracer, standards and first antibody (Linco
Research, Inc.). The assay was validated for emus by Van Cleeff (2001).
Buffers/reagents
Glycine buffer 15 g glycine, 10 g bovine serum albumin (BSA), 9
g ethylenediaminetetra acetic acid (EDTA) (non-
salt), 1 g NaN3. Dissolve in 800 ml of nanopure

Chapter 2 - General Materials and Methods 39
water, adjust p H to 8.8 and bring volume to 1 L
with nanopure water.
Tracer buffer 0.375 g glycine, 2.5 g BSA, 2.25 g E D T A (non-
salt), 0.2 g NaN3. Dissolve in 150 ml of nanopure
water, adjust p H to 8.8 and bring volume to 250 ml
with nanopure water.
Standards
Purified recombinant human glucagon (800 pg/ml) was used to make the standards by
serial dilution to the following concentrations: 400, 200, 100, 50, 25 and 12.5 pg/ml in
glycine buffer.
Antiserum
First antibody:
Guinea pig anti-glucagon, specific for pancreatic glucagon. Reconstituted on arrival
with 100 ml of glycine buffer and 100 fxg of aprotinin.
Second antibody:
Sheep anti-guinea pig raised in the laboratory and diluted 1:20 in glycine buffer with
normal guinea pig serum (NGPS) added at a dilution of 1:400.
Tracer
125I-glucagon obtained from Linco. Reconstituted by adding 27 ml of tracer buffer per
vial, and occasional gentle mixing for 30 minutes. This was further diluted to >12,000
counts per 100 id.
Assay procedure
The standard curve was placed at the beginning of the assay. Each standard curve
included 3 tubes for TC, 3 tubes for NSB, 9 replicates of Bo, 3 replicates of each
standard and 4 replicates each of three pool samples.
On Day 1, unknown plasma samples (50 fi\), and pools and standards (100 /*1 each)
were diluted to a final volume of 200 y\ with glycine buffer in 12 x 75 m m plastic tubes
(Sarstedt Australia). Glycine buffer was added to N S B (300 id) and B 0 (200 /d) tubes.
The first antibody preparation (100 id) was added to all tubes except the N S B and TC.
Tubes were then incubated overnight at 4°C.

Chapter 2 - General Materials and Methods 40
O n Day 2, tracer (100 ul) was added to all tubes and mixed. The tubes were incubated
overnight at 4°C.
On Day 3, second antibody (100 /d) was added to all tubes except the TC, mixed and
incubated overnight at 4°C.
On Day 4, 3% PEG in PBS (pH 8.8) (1 ml) was added to all tubes except the TC, before
centrifugation at 3000 rpm for 25 minutes at 4°C (Beckman J-6M/E centrifuge) after
which the supernatant was poured off. The T C were not centrifuged or poured off. The
activity of the precipitate was counted for 90 seconds each in a gamma counter (Packard
Cobra II Auto-Gamma).
Insulin
Insulin was measured in plasma or serum using the method for chickens developed by
McMurtry et al (1983). This method was validated for emu plasma and serum by Van
Cleeff (2001). The chicken insulin used for the standards and tracer, and the first
antibody were obtained from Professor McMurtry, U S D A.
Buffers/reagents
Insulin buffer 1.095 g NaH2P04.2H20, 5.906 g Na2HP0 4,
18.6125 g E D T A (disodium salt). Dissolve in 800
ml of nanopure water, adjust p H to 7.5, and bring
volume to 1 L.
Chloramine-T0.3 Mphosphate 5 m g chloramine-T in 10 ml 0.3 M phosphate
buffer, prepared 10 minutes before the iodination.
Sodium metabisuphite 5 m g sodium metabisulphite (Na2S205) in 10 ml
0.3 M phosphate buffer.
Potassium iodide 200 m g potassium iodide (KI) in 10 ml 0.1 M
phosphate buffer.
Standards
Standards were made by serial dilution of a 10 ng/ml stock of chicken insulin to the
following concentrations: 7.5, 5, 3.75, 2.5, 1.875, 1.25, 0.9375, 0.625,0.46875, 0.3125,
0.234 and 0.15625 ng/ml in insulin buffer + 0.1% gelatine.
Chapter 2 - General Materials and Methods 41
Antiserum
First antibody:
The first antibody was raised in guinea pigs against chicken insulin. It was used at
1:15,000 with 1:600 of normal guinea pig serum diluted in insulin buffer + 0.1%
gelatine.
Second antibody:
Sheep anti-guinea pig, raised in the laboratory and diluted 1:10 with insulin buffer.
Tracer
Columns:
G100 (Pharmacia) equilibrated with 1 % BSA, 0.1 M phosphate buffer
Iodination:
Chicken insulin was stored as 5 iig aliquots at -80°C. To a 5 fig aliquot, 0.5 mCi of I
and chloramine-T buffer (10 id) was added, mixed and allowed to incubate at room
temperature for 90 seconds. Potassium iodide (100 pA) and sodium metabisulphite (100
/d) solutions were added to stop the reaction. The reaction was added to the column,
and the reaction vessel rinsed with 1 % BSA, 0.1 M phosphate buffer (100 itl). The
rinse solution was also added to the column and 1 ml fractions were eluted with 1 %
BSA, 0.1 M phosphate buffer. A n aliquot of 10 /d of each fraction was counted for 10
seconds in a gamma counter (Packard Cobra II Auto-Gamma) to identify the appropriate
fractions. The tracer was immediately diluted to >15,000 counts/100 itl with insulin
buffer + 1 % B S A and added to the assay. Excess tracer was stored at 4°C.
Assay procedure
The standard curve was placed at the beginning of the assay. Each standard curve
included 3 tubes for TC, 4 tubes for NSB, 9 replicates of Bo, 3 replicates of each
standard and 4 replicates each of two pool samples.
On Day 1, unknown plasma samples and pools (100 itl) were diluted to 200 /d with
insulin buffer + 0.1% B S A (100 p\) in 12 x 75 m m plastic tubes (Sarstedt Australia).
Standards (200 fi\) were added to appropriate tubes. Insulin buffer + 0.1% B S A was
added to N S B (300 /d) and B 0 (200 iil). The first antibody preparation (100 itl) was
added to all tubes except the N S B and TC. Tubes were then incubated overnight at 4°C.

Chapter 2 - General Materials and Methods 42
O n Day 2, tracer (100 itl) was added to all tubes and mixed. The tubes were incubated
for 24 hours at 4°C.
On Day 3, second antibody (100 fi\) was added to all tubes except the TC, mixed and
incubated overnight at 4°C.
On Day 4, 6% PEG in PBS (1 ml) was added to all tubes except the TC, before
centrifugation at 3000 rpm for 25 minutes at 4°C (Beckman J-6M/E centrifuge) after
which the supernatant was poured off. The T C were not centrifuged or poured off. The
activity of the precipitate was counted for 1 minute each in a gamma counter (Packard
Cobra II Auto-Gamma).
Luteinising hormone (LH)
L H was measured in plasma using the method described by Talbot et al (1988), based
on the original L H assay developed by Follet et al (1972). The validation of this method
for emu plasma is described by Malecki et al (1998) and Blache et al (2001a). The
chicken L H fraction (PRC-AEI-s-1) used for the assay standards and iodination was
kindly donated by Professor Sharp, Roslin Institute, Midlothian, Scotland. This was
prepared using the method described by Talbot et al (1988). The fraction was purified
by passage through a G100 column (Pharmacia Biotech) and had a potency of 0.43
(0.375-0.499) NIH-0-LH-S19 in the chicken granulosa cell assay (Hammond et al,
1980).
Buffers/reagents
LH buffer 80 ml 0.5 M phosphate buffer, 8.75 g NaCl, 10
m M EDTA, 1 g NaN3, 1 g BSA, bring to 900 ml
with nanopure water, adjust p H to 7 with 1 N
sodium hydroxide (NaOH), and bring to 1 L with
nanopure water.
0.1 Mphosphate-gelatine 0.1 M phosphate buffer, 0.25% gelatine in
nanopure water, p H 7.5.
0.1 Mphosphate-BSA 0.1 M phosphate buffer, 1 % BSA.
Chloramine-T 0.1 Mphosphate 5mg chloramine-T in 10 ml 0.1 M phosphate
buffer, prepared 10 minutes before the iodination.
Sodium metabisuphite 10 m g Na2S20s in 100 ml 0.1 M phosphate buffer.

Chapter 2 - General Materials and Methods 43
Potassium iodide 1 g KI in 10 ml 0.1 M phosphate buffer.
Standards
Aliquots of 1.25 (xg of L H in nanopure water were stored at -20°C. The L H solution
was diluted with L H buffer to give a 250 ng/ml working stock solution. Standards were
made by serial dilution to the following concentrations: 10, 5, 2.5, 1.25, 0.625, 0.312,
0.156, 0.078, 0.039 and 0.019 ng/ml in L H buffer.
Antiserum
First antibody:
Raised in a rabbit immunised against the chicken L H preparation supplied by Professor
Sharp. The stock (1:200 dilution) was diluted further with L H buffer to give a working
dilution of 1:20,000.
Second antibody:
Donkey anti-rabbit raised in the laboratory. The stock was diluted with L H buffer (1:6)
to give the working solution.
Tracer
Columns:
G25 column (Pharmacia) equilibrated with 0.1 M phosphate-gelatine buffer + 2 % BSA.
Iodination:
To 1.25 [ig L H in 10 ill nanopure water, 0.5 mCi Na-125I and chloramine-T buffer (20
itl) were added and incubated for 60 seconds. The reaction was stopped by adding
sodium metabisulphite (100 p.1) and potassium iodide (200 id). The column was
drained down to the gel surface. The contents of the reaction vessel were then placed on
the column. The reaction vessel was rinsed with potassium iodide buffer (250 /d) that
was then added to the column. Fractions (500 /d) were eluted with 0.1 M phosphate-
gelatine buffer into tubes containing 500 ill 0.1 M phosphate-BSA buffer. O n Day 2 of
the assay the appropriate fraction was diluted to 10,000 counts per 50 ill with L H buffer.
Assay procedure
The standard curve was placed at the beginning of the assay. Each standard curve
included 3 tubes for TC, 3 tubes for N S B , 9 replicates of Bo, 3 replicates of each
standard and 4 replicates each of two pool samples.

Chapter 2 - General Materials and Methods 44
O n Day 1, unknown plasma samples and pools (50 ul) were diluted to 200 ill with L H
buffer in 12 x 75 m m plastic tubes (Sarstedt Australia). Standards (200 til) were added
to the appropriate tubes. L H buffer was added to N S B (250 ul) and B 0 (200 ul) tubes.
The first antibody (50 ul) was added to all tubes except the N S B and TC. Tubes were
then incubated overnight at 4°C.
On Day 2, tracer (50 /d) was added to all tubes and vortexed briefly. The tubes were
incubated for 48 hours at 4°C.
On Day 4, NRS (1:400 dilution with LH buffer) (50 ul) and second antibody (50 ul)
were added to all tubes except the TC, vortexed briefly and incubated overnight at 4°C.
On Day 5,6% PEG in LH buffer (1 ml) was added to all tubes except the TC, before
centrifugation at 1500 g for 30 minutes at 4°C (Beckman J-6M/E centrifuge) after which
the supernatant was poured off. The T C were not centrifuged or poured off. The
activity of the precipitate was then counted for 1 minute each in a gamma counter
(Packard Cobra II Auto-Gamma).
Prolactin
Prolactin was measured in plasma using the method developed by Talbot and Sharp
(1994). Validation of this method for emu prolactin is described by Malecki et al
(1998). Recombinant derived chicken prolactin used for the assay standards, raising the
first antibody and iodination was kindly donated by Professor Sharp, Roslin Institute,
Midlothian, Scotland. Recombinant chicken prolactin was prepared using the method
described by Hanks et al (1989).
Buffers/reagents
Chloramine-T0.3 Mphosphate 5 m g chloramine-T in 10 ml 0.3 M phosphate
buffer.
2 % BSA 0.2 g B S A in 10 ml 0.3 M phosphate buffer.
Tris/Tween 20 (make fresh) 1.8 g NaCl, 3.14 g tris/HCl, 0.1 g NaN3,200 id
Tween 20, bring to 200 m L in nanopure water,
adjust p H to 8.
Prolactin buffer 900 ml 0.1 M phosphate buffer (pH7.5), 9 g NaCl,
3.72 g E D T A (disodium salt), 1 g NaN3,1 g BSA.

Chapter 2 - General Materials and Methods 45
Adjust p H to 7 with 1 N N a O H and bring to 1 L
with nanopure water.
Standards
The prolactin stock was diluted with prolactin buffer to give a 1250 ng/ml working
stock solution. Standards were made by serial dilution to the following concentrations:
125, 62.5, 31.25, 15.625, 7.8125, 3.9, 1.95, 0.977, 0.4883 and 0.24 ng/ml in prolactin
buffer.
Antiserum
First antibody:
Raised in a rabbit immunised against recombinant chicken prolactin by Professor Sharp.
The stock (1:100 dilution) was diluted further with prolactin buffer to give a 1:6000
working solution.
Second antibody:
Donkey anti-rabbit raised in the laboratory. The stock solution (1:2 dilution) was
further diluted with prolactin buffer (1:1) to give the working solution.
Tracer
Columns:
PD10 (Pharmacia Biotech) and G100 (Pharmacia Biotech) equilibrated with Tris/Tween
20 buffer.
Iodination:
Prolactin stock (14 ul, 5 fig) was aliquoted into an eppendorf tube and 0.3 M phosphate
buffer (16 ul), 125I-Na (5 ul) and chloramine-T buffer (10 til) were added. The reaction
vessel was vortexed and incubated at room temperature for 60 seconds. The reaction
was stopped by the addition of 0.3 M phosphate buffer (200 id). The reaction solution
was applied to a P D 10 column and the reaction tube rinsed with 0.3 M phosphate
buffer (250 ill) the rinse product was also applied to the column. Fresh Tris/Tween 20
buffer was used to elute 11-drop fractions. The appropriate fractions were identified by
counting 10 id aliquots using a gamma counter (Packard Cobra II Auto-Gamma), and
then combined. The G 100 column was allowed to drain down to the gel surface and the
iodinated fraction applied. Fractions (1 ml) were eluted with Tris/Tween 20 buffer. The
appropriate fraction was identified by counting 10 id aliquots using a gamma counter
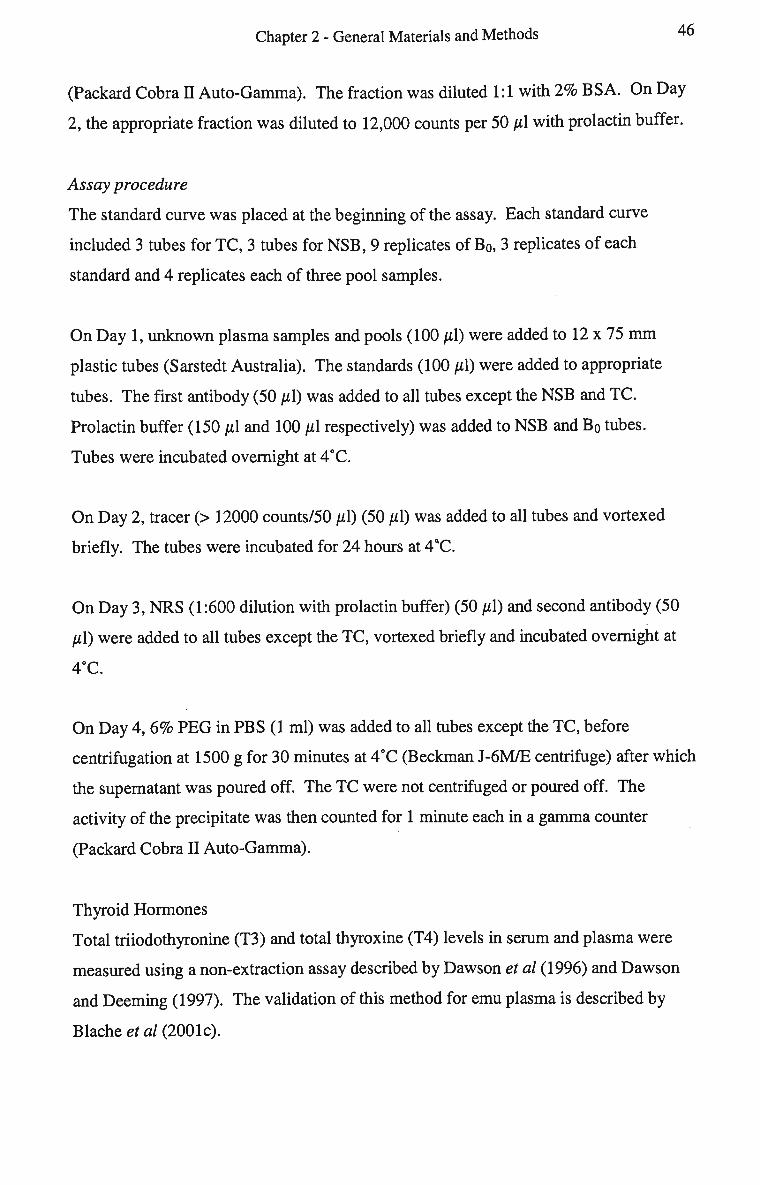
Chapter 2 - General Materials and Methods 46
(Packard Cobra II Auto-Gamma). The fraction was diluted 1:1 with 2 % BSA. O n Day
2, the appropriate fraction was diluted to 12,000 counts per 50 /d with prolactin buffer.
Assay procedure
The standard curve was placed at the beginning of the assay. Each standard curve
included 3 tubes for TC, 3 tubes for NSB, 9 replicates of B0, 3 replicates of each
standard and 4 replicates each of three pool samples.
On Day 1, unknown plasma samples and pools (100 id) were added to 12 x 75 mm
plastic tubes (Sarstedt Australia). The standards (100 ul) were added to appropriate
tubes. The first antibody (50 ul) was added to all tubes except the N S B and TC.
Prolactin buffer (150 id and 100 id respectively) was added to N S B and B 0 tubes.
Tubes were incubated overnight at 4°C.
On Day 2, tracer (> 12000 counts/50 ul) (50 ul) was added to all tubes and vortexed
briefly. The tubes were incubated for 24 hours at 4*C.
On Day 3, NRS (1:600 dilution with prolactin buffer) (50 ul) and second antibody (50
ul) were added to all tubes except the TC, vortexed briefly and incubated overnight at
4°C.
On Day 4, 6% PEG in PBS (1 ml) was added to all tubes except the TC, before
centrifugation at 1500 g for 30 minutes at 4°C (Beckman J-6M/E centrifuge) after which
the supernatant was poured off. The T C were not centrifuged or poured off. The
activity of the precipitate was then counted for 1 minute each in a gamma counter
(Packard Cobra II Auto-Gamma).
Thyroid Hormones
Total triiodothyronine (T3) and total thyroxine (T4) levels in serum and plasma were
measured using a non-extraction assay described by Dawson et al (1996) and Dawson
and Deeming (1997). The validation of this method for emu plasma is described by
Blache et al (2001c).

Chapter 2 - General Materials and Methods 47
Buffers/reagents
Barbitol buffer 12 A g barbital sodium (C8HiiN2Na03) make up to
1 L in nanopure water, p H 8.6.
ANSA buffer 0.8 g 8-anilino-l-naphthalene sulphonic acid
(ANSA) to 100 ml of barbitol buffer.
T3 standards
A stock solution of T3 was prepared by dissolving 10 m g of T3 powder in 100 ml of
barbitol buffer. It was further diluted 1:1000 to give a final concentration of 100 ng/ml.
Standards were made by serial dilution to the following concentrations: 50, 25,12.5,
6.25, 3.125, 1.56, 0.78, 0.39, 0.195, 0.0975, 0.049, 0.0245, 0.012 and 0.006 ng/ml in
barbitol buffer.
T3 antiserum
First antibody:
Rabbit polyclonal antibody anti-T3 was purchased from Biogenesis Immuno
Diagnostics, and diluted 1:10 on arrival in barbitol buffer. For the assay it was diluted
1:40 to give a 1:400 stock. The first antibody was added to the assay at a working
dilution of 1:12,000.
Second antibody:
Donkey anti-rabbit raised in the laboratory and diluted 1:5 with barbitol buffer.
T3 tracer
L-3,5,3'-[125I]- triiodothyronine (NEN Life Science Products, Inc.) diluted in A N S A
buffer to give 10,000 cpm/20 ul
T3 assay procedure
The standard curve was placed at the beginning of the assay. Each standard curve
included 3 tubes for TC, 3 tubes for N S B , 9 replicates of Bo, 3 replicates of each
standard and 3 replicates each of three pool samples.
O n Day 1, standards (20 id) were diluted to a total volume of 60 ul, with charcoal
stripped plasma (20 ul) and barbitol buffer (20 ul). The unknown serum samples and
pools (20 ul) were diluted to a total volume of 60 ul with barbitol buffer (40 ul). 10 x
75 m m glass tubes were used (Sarstedt Australia). The first antibody (20 id) was added

Chapter 2 - General Materials and Methods 48
to all tubes except the N S B and TC. Tracer (20 ul) was added to all tubes and vortexed
briefly. The tubes were incubated for 48 hours at 4°C.
On Day 3, second antibody and normal rabbit serum (NRS) (1:500 dilution) (20 ul each)
were added to all tubes except the TC, and vortexed briefly. The tubes were then
incubated for 24 hours at 4°C.
On Day 4, 6% PEG in barbitol buffer (1 ml) was added to all tubes except the TC,
before centrifugation at 1500 g for 25 minutes at 4°C (Beckman J-6M/E centrifuge)
after which the supernatant was aspirated. The T C were not centrifuged or aspirated.
The activity of the precipitate was then counted for 1.5 minutes each in a gamma
counter (Packard Cobra II Auto-Gamma).
T4 standards
A working stock solution of T4 was made by adding 100 ul of a 12.8 umol/L
concentrated stock solution to 10 ml of barbitol buffer. Standards were made by serial
dilution to the following concentrations: 64, 32, 16, 8,4, 2,1,0.5, 0.25 and 0.125 nM/L
in barbitol buffer.
T4 antiserum
First antibody:
Rabbit polyclonal antibody anti-T4 was purchased from Biogenesis Immuno
Diagnostics, and diluted 1:10 on arrival in barbitol buffer. For the assay it was diluted
1:40 to give a 1:400 stock. The first antibody was added to the assay at a working
dilution of 1 in 6,400.
Second antibody:
Donkey anti rabbit raised in the laboratory and diluted 1:5 with barbitol buffer.
T4 tracer
L-[125I]-thyroxine (NEN Life Science Products, Inc.) diluted in A N S A buffer to give
10,000 cpm/20 id.
T4 assay procedure
The standard curve was placed at the beginning of the assay. Each standard curve
included 3 tubes for TC, 3 tubes for NSB, 9 replicates of B0, 3 replicates of each
standard and 3 replicates each of three pool samples.

Chapter 2 - General Materials and Methods 49
O n Day 1, standards (20 ul) were diluted to a total volume of 60 ul, with charcoal
stripped plasma and barbitol buffer (20 ul each). The unknown serum samples and
pools (20 ul) were diluted to a total volume of 60 ul with barbitol buffer (40 ul). 10 x
75 m m glass tubes were used (Sarstedt Australia). The first antibody (20 ul) was added
to all tubes except the N S B and TC. Tracer (20 ul) was added to all tubes and vortexed
briefly. The tubes were incubated for 24 hours at 4°C.
On Day 2, second antibody and NRS (1:500 dilution) (20 ul each) were added to all
tubes except the TC, and vortexed briefly. The tubes were then incubated for 24 hours
at 4°C.
On Day 3, 6% PEG in barbitol buffer (1 ml) was added to all tubes except the TC,
before centrifugation at 1500 g for 25 minutes at 4°C (Beckman J-6M/E centrifuge)
after which the supernatant was aspirated. The T C were not centrifuged or aspirated.
The activity of the precipitate was then counted for 1.5 minutes each in a gamma
counter (Packard Cobra II Auto-Gamma).
9. Hormone data analysis
Calculation of hormone assay results
The final counts obtained for each assay were saved onto M S - D O S disks and converted
into Macintosh format. Concentrations of the hormones were then calculated using the
AssayZap Universal Assay Calculator.
Sensitivity and precision
The N S B , Bo, and assay sensitivity for each hormone assay are summarised in Table 2.2.
The sensitivity of the assay is defined as the limit of detection of the standard curve.
The precision of the assay expressed as intra-assay and inter-assay coefficients of
variation are given in Table 2.3. For each hormone assayed, the intra-assay coefficient
of variation was calculated from the standard deviation among replicates of each quality
control sample. In Tables 2.2 and 2.3, the assay statistics and intra-assay coefficients of
variation for glucagon, T3, T4 and corticosterone are presented separately for the assays
performed, because the hormone concentrations from the samples were measured within
one assay for each experiment.

Chapter 2 - General Materials and Methods
Pools for assessing intra-assay coefficients of variation
Whenever possible, plasma pools were prepared for high, medium and low
concentrations of each hormone.

Chapter 2 - General Materials and Methods 51
Table 2.2: Assay statistics.
Assay
PRL ng/ml (1) 1 (exp 3) T3 ng/ml (3) * 1 (exp 1) 2(exp 2) 3 (exp 3 & 4) T4 nM/L (3) * 1 (exp 1) 2(exp 2) 3 (exp 3 & 4) C O R T ng/jtl (4) * 1 (exp 2A) 2 (exp 2B) 3 (exp 3 & 4) 4 (exp 3 & 4, repeats) INS ng/ml (3) * 1 (exp 1) 2 (exp 2) 3 (exp 3 & 4) G L U C pg/ml (2) * 1 (exp 1) 2 (exp 3 & 4) LH ng/ml (1) 1 (exp 2)
NSB%
3.1
5.2 3.7 6.1
4.1 2.6 4.1
3.6 1.7 3.0 1.3
3.6 1.0 0.8
3.2 3.7
1.5
B0%
42.3
22.1 28.3 24.8
19.9 40.5 40.0
40.9 26.4 37.6 33.5
25.8 35.2 32.3
39.4 66.3
18.7
Detection limit
0.24
0.11 0.05 0.03
0.60 0.30 0.16
0.18 0.16 0.23 0.20
0.44 0.48 0.33
22.8 91.4
0.03
High pool
5.29±0.39
1.10+0.189 1.38±0.137 0.60+0.029
3.03±0.052 5.23±0.426 4.27±0.033
9.43±0.329 5.06±.535
-5.84±0.324
5.14±0.661 0.81±0.024 0.66±0.031
142+4.4 962±17.5
0.80±0.012
Medium pool
1.40±0.05
-0.65±0.054 0.40±0.040
2.18+0.211 3.45+0.058
-
--
3.40±0.132 -
-268±9.0
0.29±0.007
L o w pool
1.02±0.08
O.O6±O.0O3 0.44±0.081 0.16±0.030
0.36+0.045 2.76±0.159 1.10+0.173
1.98±0.184 0.24±0.023 0.89±0.300 1.14±0.071
1.21+0.661 0.65±0.028 0.44±0.036
39+2.4 130±7.8
0.053±0.003
PRL = prolactin, T3 = triiodothyronine, T4 = thyroxine, C O R T = corticosterone, INS = insulin, G L U C = glucagon, L H = luteinising hormone. The number of assays performed for each hormone is given in brackets. An * indicates that different pools were used for all the assays performed.
Table 2.3: The intra-assay coefficients of variation for the hormone assays performed.
Assay
PRL ng/ml (1) 1 (exp 3) T3 ng/ml (3) * 1 (exp 1) 2(exp 2) 3 (exp 3 & 4) T4 nM/L (3) * 1 (exp 1) 2 (exp 2) 3 (exp 3 & 4) C O R T ng//il (4) * 1 (exp 2A) 2 (exp 2B) 3 (exp 3 & 4) 4 (exp 3 & 4, repeats) INS ng/ml (3) * 1 (exp 1) 2 (exp 2) 3 (exp 3 & 4) G L U C pg/ml (2) * 1 (exp 1) 2 (exp 3 & 4) L H ng/ml (1) 1 (exp 2)
High Pool (%)
14.6
29.8 16.9 8.4
3.0 14.0 1.3
6.9 21.1 -
11.0
22.3 5.9 9.3
6.16 3.62
2.61
Medium Pool (%)
7.16
-14.3 17.0
16.6 2.9 -
--7.6 -
-6.69
4.03
Low Pool (%)
14.9
13.6 30.9 31.3
17.7 10 27.2
18.4 18.6 66.8 12.4
5.82 7.9 16.9
12.1 11.9
10.8
PRL = prolactin, T3 = triiodothyronine, T4 = thyroxine, C O R T = corticosterone, INS = insulin, G L U C = glucagon, LH = luteinising hormone. The number of assays performed for each hormone is given in brackets. An * indicates that different quality controls were used for all the assays performed.

Chapter 2 - General Materials and Methods 52
10. Molecular techniques
Reagents
0.1% DEPC water
Luria Bertani (LB) media
LB selective media
LB selective plates
WxTAE
WxTBE
5 % acrylamide gel
1 ml of diethylpyrocarbonate (DEPC) in 1 L of nanopure
water, mixed thoroughly and incubated at room
temperature overnight. Autoclaved for 20 minutes at 15
lb/sq inch on liquid cycle to inactivate DEPC.
To 950 ml nanopure add 10 g tryptone, 5 g yeast extract
and 10 g NaCl, adjust volume to 1 L. Sterilise by
autoclaving 20 minutes at 15 lb/sq inch on liquid cycle.
Make LB as described. Following autoclaving cool with
agitation in a water bath to 60°C and add 100 ug/ml of
ampicillin.
To 950 ml nanopure add 10 g tryptone, 5 g yeast extract,
10 g NaCl and 15 g agar, adjust volume to 1 L. Sterilise
by autoclaving 20 minutes at 15 lb/sq inch on liquid cycle.
Cool with agitation in a water bath to 60°C and add 100
figlnA of ampicillin. Pour into sterile plastic petri dishes,
allow to set and expose to U V light overnight.
Refrigerate.
48.4 g tris base, 11.42 ml glacial acetic acid and 20 ml of
0.5 M E D T A p H 8. Adjust volume to 1 L with nanopure
water.
109 g tris base, 55 g boric acid and 40 ml of 0.5 M E D T A
p H 8. Adjust volume to 1 L with nanopure water and
sterilise by autoclaving.
14.4 g urea, 3 ml 10 x TBE, 3.8 ml 4 0 % acrylamide
(acryhbis-acryl = 19:1), add 8 ml of dH20, stir at room
temperature until dissolved, adjust volume to 30 ml and
degas. While stirring add 240 ul of 1 0 % ammonium
persulfate in d H 2 0 and 32 ul of T E M E D (Bio Rad). Pour
gel immediately.
R N A extraction
R N A was isolated from emu liver, adipose, mediobasal hypothalamus and preoptic area
using a method based on that developed by Chomczynski and Sacchi (1987), and a

Chapter 2 - General Materials and Methods 53
commercial extraction buffer, RNAzol B (Tel-Test Inc.). Samples were ground in
liquid nitrogen using a mortar and pestle resting on dry ice, to prevent RNase activity.
The powder was then transferred to an appropriate volume of extraction buffer and
processed according to the directions supplied. The methodology was modified to
maximise the extraction of R N A from emu adipose, brain and liver tissues. The
complete methodology is given below.
RNAzol B RNA extraction protocol
Approximately 1 g of the sample tissue was ground to a powder in liquid nitrogen with
a mortar and pestle resting on dry ice (for brain tissues the volume of RNAzol was
reduced to 5ml). The powder was transferred to a glass grinder containing 10 ml of
RNAzol B and homogenised. The homogenate was transferred to a baked 15 ml Corex
tube and rested on ice for 5 minutes. A volume of 2 ml of chloroform was added, and
the tube vortexed to ensure thorough mixing, the tube was placed on ice for a further 5
minutes. Samples were centrifuged at 12,000 x g and 4°C for 1 hour. The upper
aqueous phase was pipetted into a sterile 15 ml glass Corex tube, with care taken not to
disturb the interphase, an equal volume of isopropanol was added and mixed by
vortexing. Samples were stored at -20°C for more than 45 minutes (for adipose and
brain tissues that do not have abundant mRNA's, samples were stored between 24 and
48 hours to maximise the precipitation of R N A ) . Tubes were centrifuged at 6,000 x g
and 4°C for 45 minutes. The supernatant was removed and the pellet rinsed once with 5
ml of 7 5 % ethanol, followed by centrifugation at 6,000 x g and 4°C for 45 minutes. The
supernatant was removed and the pellet air dried for 10-15 minutes. The pellet was
dissolved in 1 ml (liver), 0.1 ml (adipose) or 20 ul (mediobasal hypothalamus/preoptic
area) of D E P C treated distilled water, with the addition of 1 ul of RNasin RNase
inhibitor (Promega) to each sample, and stored at -70°C.
Ribonuclease Protection Assay (RPA)
RPA's for neuropeptide Y (NPY) and vasoactive intestinal peptide (VIP) expression in
the mediobasal hypothalamus and preoptic area were performed at the Roslin Institute,
Scotland, with the assistance of Dr Boswell (Chapters 5 and 6). The technique was then
established in our laboratory with the generous gift of emu specific N P Y , VIP and p-
actin clones. The R P A technique was subsequently used to determine the expression of
N P Y and VIP in the final experiment (Chapter 7).

Chapter 2 - General Materials and Methods 54
Total R N A was extracted from tissues using the methodology given above, and stored
under 7 0 % ethanol before being sent to the Roslin Institute (Chapters 5 and 6) or used in
our laboratory (Chapter 7). At Roslin, emu specific VIP, N P Y and p-actin inserts were
ligated into the bluescript plasmid (Stratagene) and transformed into the XLl-blue
Escherichia coli strain (Stratagene), to be used as probes. The Ambion R P A III kit
was used to determine N P Y and VIP expression using the methodology below:
Probe and control preparation:
Cultures of clones containing VIP, N P Y and p-actin were grown up overnight in 5 or 10
ml of L B selective media. The vector D N A was extracted using Q I A G E N mini-preps
(Roslin) or midipreps ( U W A ) following the manufacturers directions.
Table 2.4: RNA polymerase and restriction enzyme required for each probe to obtain sense and antisense strands.
Probe Antisense strand Sense strand
E m u VIP T7; Eco RI T3; Hind HI
E m u N P Y T7; Eco RI T3; Hind III
E m u (3-actin T3; Hind III T7; Eco RI
Restriction Digestion:
The plasmid D N A obtained was digested by adding 20 ul buffer and 10 ul enzyme
(Boehringer Mannheim see Table 2.4) tol80 ul plasmid D N A (-40 ug). This was then
vortexed and microfuged briefly. The tubes were then incubated at 37°C for 60-90
minutes after which a further 5 ul of enzyme was added and the tubes incubated for a
further 2 hours. At this point the samples were either frozen at -20°C or phenol-
chloroform extraction performed.
Phenol-chloroform extraction:
To each 200 ul digest 100 ul phenol and 100 ul of the chloroform mix (24:1,
chloroform:isoamyl alcohol) was added. The tubes were vortexed for 1 minute and
microfuged for 2 minutes at maximum rpm. The upper aqueous layer was transferred to
a new tube. A volume of 200 ul of d H 2 0 was added to the original tube and the
contents were back extracted by vortexing for 1 minute and microfuging for 2 minutes
at maximum rpm. The upper aqueous layer was transferred to the tube containing the
first upper layer removed. To this was added 400 ul of the chloroform mix and the tubes

Chapter 2 - General Materials and Methods 55
were vortexed for 1 minute and microfuged for 2 minutes at maximum rpm. The upper
aqueous layer was transferred to a new tube and the chloroform extraction repeated. To
precipitate the digested plasmid D N A 40 ul of 3 M sodium acetate p H 5.2 and 1100 ul
of cold 100% ethanol were added. The tubes were vortexed and incubated at -20°C for
at least 30 minutes. To pellet the D N A the tubes were microfuged for 20 minutes at 4°C
and maximum rpm, and rinsed with 7 0 % ethanol (1 ml added and tubes microfuged for
10 minutes at maximum rpm). The supernatant was removed completely and the pellet
air dried for approximately 5 minutes. The sense and antisense plasmid D N A templates
were then reconstituted in 32 ul of dH20 and the concentration determined
spectrophotometrically.
Preparation of positive control from the sense strand for each probe:
A total of 1 ug of sense template D N A was denatured for 3 minutes and placed on ice.
A nucleotide mix was prepared by combining 2 fi\ of each supplied nucleotide with 2 ul
of dt^O. To each of the templates 1 fi\ of the nucleotide mix, 2 ul of buffer and 2 ul of
the appropriate R N A polymerase (Table 2.4) were added and the final volume was
adjusted to 20 ul with dH^O. The reactions were incubated for 2 hours at 37°C and 2 ul
of DNase was added and the tubes incubated for a further 20 minutes at 37°C. To stop
the reaction and precipitate the sense strand 2 ul of E D T A (0.2 M ) , 2.5 ul of 4 M
lithium chloride (LiCl) and 75 ul of 100% ethanol were added to the tubes. These were
vortexed and incubated at -70°C for greater then 30 minutes or overnight at -20°C. The
tubes were microfuged for 20 minutes at 4°C and as much supernatant as possible
removed before rinsing with 7 0 % ethanol. The sense strands were reconstituted in 40 fi\
of deionized formamide and incubated at 70°C for 1 hour. To use as a control 1 ul of
sense strand was diluted 1:5000 with dt^O immediately prior to performing the
reaction.
Labeling of probes:
To 0.5 fil of the antisense template D N A , obtained as described above, 0.5 fi\ nucleotide
mix (1 ul each of ATP, CTP, G T P and a 1:200 dilution of U T P + 6 ul of dH 20), 1 ul
buffer, a trace amount of polymerase (T7 N P Y and VIP; T3 p-actin) and 6.75 ul dlfcO
was added. The tubes were microfuged briefly and 1.25 ul [oc-32P]UTP (800 Ci/mmol)
was added. The tube contents were mixed by gentle pipetting and incubated for 30
minutes at 37°C. A volume of 1 ul of DNase was added and the tubes incubated for 20
minutes at 37°C. The reaction was stopped and the antisense R N A precipitated by

Chapter 2 - General Materials and Methods 56
adding 1 ul of 0.2 M E D T A , 1.25 ul of 4 M LiCl and 37.5 ul of cold 1 0 0 % ethanol.
The tubes were then incubated at -20°C for more than 15 minutes. To pellet the R N A
the tubes were microfuged for 15 minutes at 4°C and maximum rpm and the supernatant
completely removed. The pellet was rinsed with 1 ml of 7 0 % ethanol and microfuged
for 10 minutes, the supernatant was then completely removed and the R N A
reconstituted in 100 ul of sterile dH 2 0. A volume of 2 ul of this solution was added to
scintillant and counted using a beta counter.
Hybridisation:
The hybridisation reagents listed in Table 2.5 were added to a fresh eppendorf tube. The
tube contents were mixed thoroughly and incubated at -20°C for more than 15 minutes.
The tubes were microfuged at maximum rpm for 15 minutes at 4°C and the supernatant
was completely removed. The pellet was resuspended in 10 ul of hybridisation buffer,
vortexed and briefly microfuged. Samples were denatured at 90-95°C for 3-4 minutes
and then incubated overnight at 42°C.
Table 2.5: Reagents for RPA hybridisation.
Reagent
Sample R N A (itg)
Yeast R N A (itl)
1:5000 dilution sense
strand (pi)
d H 2 0 (pi)
N P Y Probe
VIP probe
[3-actin probe
5 M N H 4 0 A c (itl)
100% ethanol (pi)
Blank
-
2
-
28
>50,000 cpm
>50,000 cpm
>50,000 cpm
1/10 volume
2.5 volumes
+ve control
-
2
1
27
>50,000 cpm of
the appropriate
probe
1/10 volume
2.5 volumes
sample
10-20
-
-
to 30 itl
>50,000 cpm
>50,000 cpm
>50,000 cpm
1/10 volume
2.5 volumes
RNase digestion of hybridized probe and sample RNA:
The RNaseA/RNaseTl was diluted 1:100 with RNase digestion buffer, vortexed and
briefly microfuged to ensure even dispersal of components. The hybridisation reactions
were briefly microfuged to collect all liquid at the bottom of the tube. A volume of 150
ul of the 1:100 RNaseA/RNaseTl dilution was added, vortexed and the tubes
microfuged briefly. The reactions were incubated for 30 minutes at 37°C. A volume of
225 fi\ of RNase inactivation/precipitation III solution was added, the tubes vortexed
Chapter 2 - General Materials and Methods 57
and microfuged briefly. The reactions were incubated at -20°C for more than 15
minutes. Following incubation the reactions were microfuged at maximum rpm for 15
minutes at 4°C and the supernatant carefully removed. The pellets were resuspended in
8 ul of gel loading buffer n, vortexed vigorously and briefly microfuged. Reactions
were incubated at 90-95°C for 3 minutes, briefly vortexed and microfuged and rested on
ice. The samples were loaded onto a 1 x T B E , 5 % acrylamide gel (0.75 m m thick, 12
cm long x 15 c m wide) and run at a constant 250 volts for approximately 1 hour or until
the leading dye band neared the bottom of the gel. Once finished running the gel was
transferred to filter paper, the origins and orientation marked, covered with plastic wrap,
and dried. Once dry the gel was exposed to a phosphoimaging plate overnight at -80°C.
The bands corresponding to B-actin, N P Y and VIP were visualised and analysis of their
intensity was performed on a Macintosh (iMac) computer using the public domain NIH
Image program version 1.61 (developed at the U.S. National Institutes of Health, an
available on the Internet at http://rsb.info.nih.gov/nih-image/).

58
Chapter 3
The emu leptin gene.
1. Introduction
2. Materials and Methods
3. Results
4. Discussion
Page
59
61
75
77
Chapter 3 - The emu leptin gene 59
1. Introduction
In emus, reproduction is associated with decreased appetite and adiposity. This could be
expected to result in parallel decreases in the circulating concentration of leptin. In
humans and rodents decreases in the concentration of leptin would stimulate appetite. This
clearly does not occur in the emu, since anorexia and diminished appetite are features of
incubating and non-incubating animals respectively during the breeding season (Mawson,
1992; Blake, 1996; Blache & Martin, 1999; Blache et al, 2001b). So h o w is appetite
suppressed in emus despite diminishing adipose reserves and what role, if any, does leptin
play?
In species that initiate reproduction in response to decreasing day length, seasonal changes
in body weight and adiposity, are paralleled by changes in the concentration of leptin
(Bocquier et al, 1998; Atcha et al, 2000; Horton et al, 2000; Mercer et al, 2000a;
Concannon et al, 2001; Marie et al, 2001). It has been proposed that higher sensitivity to
leptin during short days increases the responsiveness to food deprivation and enhance the
ability to mobilise adipose reserves in sheep (Bocquier et al, 1998). In the Siberian
hamster, leptin administration decreased fat reserves in animals exposed to short but not
long photoperiods and had no effect on food intake under either photoperiod (Atcha et al,
2000). The decrease in fat reserves during short photoperiod indicates enhanced sensitivity
to the actions of leptin. In this species, food deprivation during short but not long
photoperiods decreased the leptin concentration and leptin receptor (Ob-Rb) expression
indicating a greater sensitivity to food deprivation (Mercer et al, 2000a).
The involvement of leptin in appetite and adiposity control during the reproductive period
could take several forms. From the information available on leptin in other species and our
knowledge of the appetite and adiposity changes that occur there are four scenarios that
seem likely. First, as adiposity decreases, elevated leptin concentrations are maintained
and act to depress appetite. Second, that the leptin concentrations may decrease in parallel
with adiposity, and this fails to stimulate appetite as a result of the actions of other factors,
possibly related to photoperiod, influencing appetite. Third, that changes in the expression
of the leptin receptor at the hypothalamic level alter the responsiveness to leptin. Finally,
it is possible that emus do not have the leptin gene or its product. However, this final
scenario is unlikely based on evidence for the existence of the leptin gene in chickens.
First, southern hybridisations of the mouse leptin gene to chicken D N A indicated

Chapter 3 - The emu leptin gene 60
homology between the two species (Zhang et al, 1994). Second, sequences for the
chicken leptin gene and chicken leptin receptor have been published (Taouis et al, 1998;
Ashwell et al, 1999a; Horev et al, 2000). As leptin is highly conserved in mammalian
species it is likely that it is also highly conserved in avian species. As such, the existence
of the leptin gene in chickens argues strongly for the existence of a homologous sequence
in the emu.
A bioassay for chicken leptin was recently developed by Dr Friedman-Einat based on a
human leptin bioassay produced by the Merck Company (Rosenblum et al, 1998). It
utilises a firefly luciferase reporter construct and the chicken leptin receptor transfected
into the HEK-293 embryonic kidney cell line (Rosenblum et al, 1998). Activation of the
leptin receptor by leptin in plasma or serum in turn activates STAT3, a transcription factor,
causing the reporter construct to emit light. The amount of light emitted can be quantified
and the activity of leptin in the sample deduced. It could be expected that if emu and
chicken leptin sequences have been highly conserved that leptin in emu serum will activate
the chicken leptin receptor in this assay.
To demonstrate the existence of leptin in emus and in particular its presence in serum,
which is the first step in the study of the possible role of leptin in the emu, w e tested the
following hypotheses;
1. Emus have a leptin gene and its sequence is homologous to the published chicken and
mammalian sequences, and
2. E m u serum will activate the chicken leptin receptor in the chicken leptin bioassay.

Chapter 3 - The emu leptin gene 61
2. Materials and Methods
Experimental design
The samples used for this experiment were obtained from male and female emus that had
been used in observational studies. Several molecular techniques were employed to test
the hypotheses outlined in the introduction. First, R N A was extracted from liver and
adipose tissue and used or reverse transcription polymerase chain reaction (RT-PCR) with
the primers for the chicken leptin gene sequence. Rapid amplification of c D N A ends
(RACE) was performed to obtain the complete emu leptin gene sequence. Second, chicken
and mammalian leptin probes, were used to screen an emu cosmid library for homologous
sequences. Finally, emu serum was added to a cell line containing the chicken leptin
receptor to determine if components within the serum could activate the chicken leptin
receptor.
Animals and samples
The tissue samples used for this work were obtained from emus of different sexes, at
various times of the year. All of the animals were in good health when they were
euthanased. The serum samples used in the chicken leptin bioassay were obtained from six
male emus used in observational studies by another researcher. These samples were
obtained over the course of a year and all of the animals were in good health.
Poly A+ RNA extraction
Poly A + R N A was obtained using the protocol described by Sambrook et al (1989).
Reverse Transcription Polymerase Chain Reaction (RT-PCR)
The cloning of the chicken leptin gene was published after the commencement of m y Ph.D.
(Taouis et al, 1998; Ashwell et al, 1999a). Primers derived for chicken leptin and a
chicken leptin probe (supplied by Dr Ashwell) were subsequently used in attempts to clone
the emu leptin gene (Ashwell et al, 1999a).
Reverse Transcription (RT)
c D N A was obtained from R N A using M - M u L V reverse transcriptase and 10 x reverse
transcription (RT) buffer (New England BioLabs) following the method supplied by the
manufacturer. For the initial isolation of a fragment of the leptin gene, a specific reverse
primer designed by Nakavisut (1998) (OBR1 - 5 V - T A C T C C A C A G A G G T G G T G G C - 3 V )

Chapter 3 - The emu leptin gene 62
was used in the R T reaction. This primer was designed from a region of high homology
between all published D N A sequences for the mammalian leptin gene, and also high
homology to the published chicken sequence. The reagents listed in Table 3.1 were added
to a fresh 200 ul eppendorf tube and incubated at 37°C for 1 hour. The reaction was
heated to 90°C for 5 minutes and then placed on ice. These steps were performed using a
Hybaid OmniGene thermal cycler. The dNTP's were obtained from Pharmacia Biotech
and the RNasin from Promega.
Table 3.1: Volumes of reagents used in the reverse transcription reactions.
Reagent Volume (pi)
10 x RT buffer 5.0
R N A volume to give 2 p%
dNTP's (25 m M ) 2.0
OBRl(100pmol//tl) 0.5
RNasin (40 units//d) 1.0
M - M u L V (25 units/jtl) 4.0
dH20 to a final volume of 50 pi
Polymerase Chain Reaction (PCR)
The P C R was performed using the external sense primer sCLepl (5V-
C A C C A G G A T C A A T G A C A T T T C A C - 3 V ) (Ashwell et al, 1999a) and the O B R 1 primer
(Nakavisut, 1998). The reagents listed in Table 3.2 were added to a fresh 200 ul eppendorf
tube, adding the Taq D N A polymerase (Promega) last. The 10 x PCR buffer (MgCl2 free)
was supplied with the Taq D N A polymerase.

Chapter 3 - The emu leptin gene 63
Table 3.2: Volumes of reagents used in the polymerase chain reactions.
Reagent Volume (pi)
R T product 10.0
OBR1 (100 pmoVpl) 0.1
sCLepl(10pmol//d) 0.5
10 x PCR buffer 5.0
Taq D N A polymerase (5 units/jtl) 0.5
dH 20 33.9
Total 50.0
Thermal cycling was performed using a Hybaid OmniGene thermal cycler under the
conditions given in Table 3.3.
Table 3.3: Thermal cycling conditions used for the polymerase chain reaction.
Step Denature Anneal Extend Number of cycles
1 94°C, 1 min 50°C, 1 min 72°C, 2 mins 5
2 94°C, 30 sec 50°C, 30 sec 72°C, 1 min 30
3 . - 72°C,5mins 1
The products were cooled to 15°C in the thermal cycler before being run on a 1% agarose
gel or used directly in nested PCR.
Nested PCR was performed using the primers:
sCLep2 (5V-CGTCGGTATCCGCCAAGCAGAGGG-3V) and
aCLep2 (5V-CCAGGACGCCATCCAGGCTCTCTGGC-3V) (Ashwell et al, 1999a).
The volumes of the nested PCR reagents used, dNTP's (Pharmacia Biotech), 10 x PCR
buffer, MgCl2, Taq D N A polymerase (Promega), and Triton x 100 (Sigma), are given in
Table 3.4.

Chapter 3 - The emu leptin gene 64
Table 3.4: Volumes of reagents used in nested PCR.
Reagent Volume (pi)
PCR product
dNTP's (25 m M )
sCLep2(10pmol//d)
aCLep2(10pmol//tl)
10 x PCR buffer
MgCl2 (25 m M )
Taq D N A polymerase (5 units//tl)
Triton x 100 (diluted 1:100)
dH20
Total
1.0
0.1
0.1
0.1
1.0
0.7
0.1
0.5
6.4
10.0
Thermal cycling was performed as described in Table 3.3 with an annealing temperature of
55°C in steps 1 and 2.
Purification of PCR products
O n the basis of the published leptin gene sequences a 260 base pair (bp) P C R product was
expected using these primers. The P C R products were visualised using 1 % agarose gels,
excised from the gel using a sterile razor blade and extracted with the Qiaex II gel
extraction kit (QIAGEN) according to the manufacturers directions.
Cloning
Reagents
Luria-Bertani (LB) media and plates (with or without ampicillin)
The media and plates were made according to the directions of Sambrook et al
(1989).
Competent cells
Competent cells were prepared according to the methodology of Sambrook et al (1989).
Briefly, Escherichia coli (E. coli) of the X L 1-blue strain were streaked onto L B media
plates (no ampicillin) and incubated overnight at 37°C. A single colony was selected from
the plate and used to inoculate 5 ml of L B medium. The culture was grown overnight at
37°C with gentle agitation. This culture was diluted 1:100 with 500 ml of L B media pre-

Chapter 3 - The emu leptin gene 65
warmed to 37°C and was incubated at 37°C with vigorous shaking to an OD650 of 0.8. The
cells were chilled quickly by swirling gently in an ice water bath for approximately 5
minutes. The cells were centrifuged at 8000 rpm for 8 minutes at 4°C. The supernatant
was poured off and the pellet resuspended in 125 ml of ice-cold 0.1M M g C l 2 and
immediately centrifuged as described above. After pouring off the supernatant the cells
were resuspended in 125 ml of ice-cold 0.1M CaCl2 and incubated on ice for 20 minutes,
before being centrifuged as described above. After pouring off the supernatant the cells
were resuspended gently in 25 ml of ice-cold 0.1M CaCl2 containing 1 4 % v/v glycerol, and
the suspension was incubated on ice for less than 30 minutes. The competent cells were
aliquoted in 0.2 ml volumes into pre-chilled eppendorf tubes and snap frozen in liquid
nitrogen. The cells were then stored at -80°C.
Ligation of the purified PCR product into the pGEM-T easy vector.
The purified nested P C R product was run on a 1 % agarose gel and a visual assessment
with Kodak ID20 software was used to estimate the concentration. Ligation of the purified
product into a vector was performed using the p G E M - T easy kit (Promega) (Table 3.5).
A n insert to vector ratio of 3:1 was used where possible.
Table 3.5: Volumes of reagents used in the ligation reaction.
Reagent Volume (pi)
10 x ligase buffer 1
Ligase (3 units/pl) 1
pGEM-T (50 ng/pl) 1
insert -150 ng
(1H20 to a final volume of 10 pi
The ligation was prepared on ice and allowed to proceed either overnight at 4°C, or at
15°C for a minimum of 2 hours.
The ligated product was transformed into the E. coli strain XL-1 blue using the heat shock
method (Sambrook et al, 1989). Briefly, competent cells were thawed on ice and 2 ul of
the ligation reaction was added. The reaction was incubated on ice for 30 minutes. The
reaction tube was transferred to a waterbath at 42°C for 90 seconds and returned to ice for

Chapter 3 - The emu leptin gene 66
1-2 minutes. A volume of 800 ul of L B media was added to the reaction tube and
incubated at 37°C for 90 minutes in a shaking incubator. The reaction was microfuged at
5000 rpm for 5 minutes and 800 ul of L B media was removed with a pipette. The pellet
was resuspended in the remaining L B media and diluted to 1:10 and 9:10, and spread onto
L B plates containing ampicillin. The dilutions used allowed individual colonies to be
selected after the incubation period. The presence of ampicillin in the media allowed E.
coli colonies containing the p G E M - T vector to be identified as it confers ampicillin
resistance. The inoculated plates were incubated at 37°C overnight.
Colony PCR.
Colony P C R was used to determine colonies that harboured inserts of the desired size.
Briefly, individual colonies that had grown on the selective plates were touched with a
sterile sealed glass pasteur pipette (Chase Instruments), which was then touched to a fresh
selective plate with an identifying grid drawn on the petri dish. After this the tip of the
glass rod was placed in an eppendorf tube with 10 ul of sterile distilled water and agitated
gently to produce a bacterial suspension. The tube was numbered to correspond with the
colony's grid location on the new plate. The SP6 and T7 primers were used to identify
colonies with inserts of the correct size, as they anneal either side of the multiple cloning
region of the p G E M - T vector. The volumes of P C R reagents, dNTP's (Pharmacia
Biotech), 10 x P C R buffer, M g C l 2 and Taq D N A polymerase (Promega), used in the
colony P C R are given in Table 3.6.
Table 3.6: Volumes of reagents used for colony PCR.
Reagent Volume (pi)
Bacterial suspension 1.0
dNTP's (25 m M ) 0.1
SP6(10pmol//d) 0.1
T7(10pmol/ftl) 0.1
10 x PCR buffer 10
MgCl2 (25 m M ) 0.7
Taq D N A polymerase (5 units/pl) 0.1
dH20 6.9
Total 10.0

Chapter 3 - The emu leptin gene 67
The thermal cycling conditions for the colony P C R are as given in Table 3.3, with the
exception that the annealing temperature used at step 2 was 55°C. The colony P C R
products were run on a 1 % agarose gel and those ascertained to have inserts of the desired
size were grown up in 5 ml of LB + ampicillin media (mini culture) for about 8 hours.
This was diluted 1:100 into 25 ml of LB + ampicillin media (maxi culture) and grown up
overnight. The remainder of the mini culture was used to make glycerol stocks by adding
500 ul of the culture and 500 ul of 8 0 % glycerol (Sigma) to a sterile eppendorf tube that
was then stored at -80°C. The plasmid midifilter kit (QIAGEN) was used to obtain
plasmid D N A according to the manufacturer's directions from the maxi culture. After
assessing the resulting plasmid D N A concentration and quality spectrophotometrically, it
was sequenced at the Immunology Department of Royal Perth Hospital. The GeneJockey
II program was utilised to find regions of the sequence corresponding to SP6, T7 and the
primers used in the nested PCR. Once the regions amplified by these were found they
were compared to other known leptin gene sequences with the GeneJockey II program and
also utilising the B L A S T service offered by the National Institute of Health, USA,
accessed via the internet (http://www.ncbi.nlm.nih.gov/).
Cosmid library screening
A n emu cosmid library (Stratagene) (Hammond, 2000) was screened with a 260 bp
mammalian leptin fragment and Ashwell's chicken leptin fragment labelled with [a" P]
dCTP(NEN).
Restriction digestion of plasmid DNA
The plasmid D N A of both leptin fragments were digested with restriction enzymes to
remove the vector D N A as this shares homology with cosmid D N A used in the emu c D N A
library. The volumes of EcoRl, 1 x N E buffer for EcoRl (New England Biolabs), BSA,
Ncol, Sail and 10 x buffer D (Promega) used in the restriction digest are given in Table
3.7. Ashwell's chicken leptin fragment was digested with £coRI and the mammalian
fragment with Ncol and Sail by adding the reagents as indicated in Table 3.7, mixing them
well by pipetting and incubating overnight at 37°C.
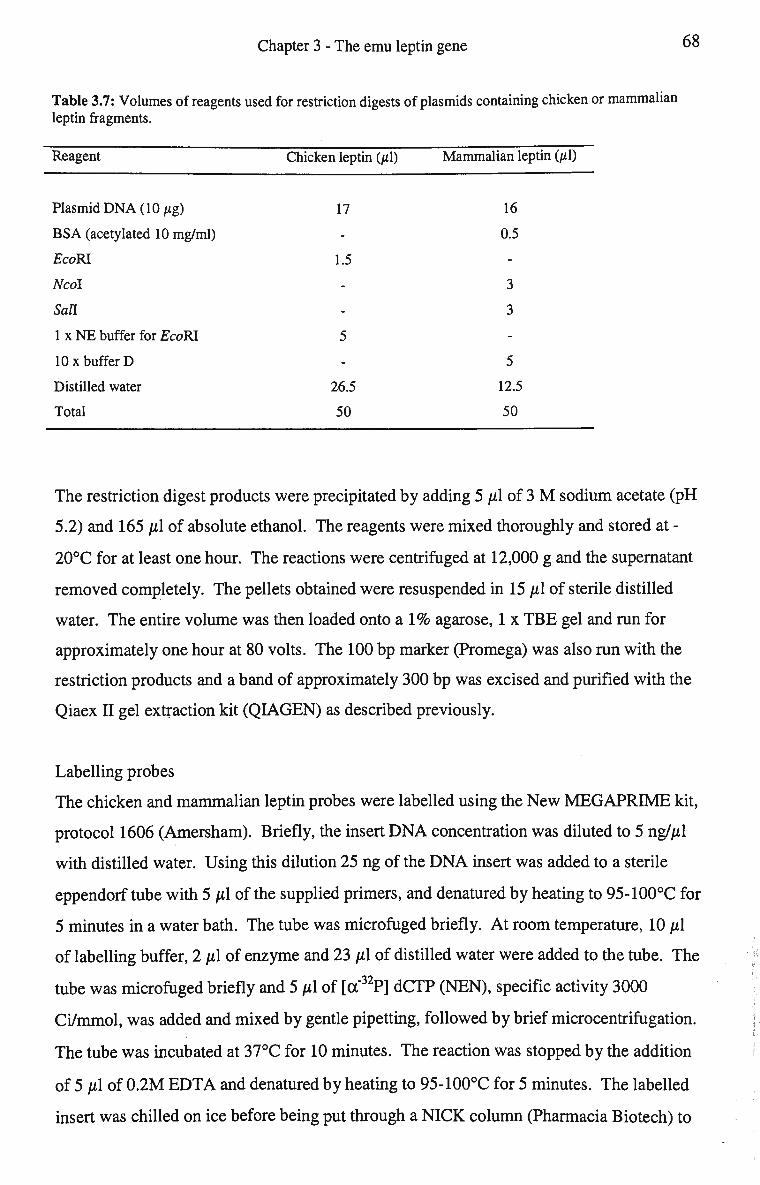
Chapter 3 - The emu leptin gene 68
Table 3.7: Volumes of reagents used for restriction digests of plasmids containing chicken or mammalian leptin fragments.
Reagent Chicken leptin (pi) Mammalian leptin (pi)
Plasmid D N A (10 pg) 17 16
BSA (acetylated 10 mg/ml) - 0.5
EcoRl 1.5
Ncol - 3
Sail - 3
1 x N E buffer for EcoBl 5
10 x buffer D - 5
Distilled water 26.5 12.5
Total 50 50
The restriction digest products were precipitated by adding 5 ul of 3 M sodium acetate (pH
5.2) and 165 ul of absolute ethanol. The reagents were mixed thoroughly and stored at -
20°C for at least one hour. The reactions were centrifuged at 12,000 g and the supernatant
removed completely. The pellets obtained were resuspended in 15 ul of sterile distilled
water. The entire volume was then loaded onto a 1 % agarose, 1 x T B E gel and run for
approximately one hour at 80 volts. The 100 bp marker (Promega) was also run with the
restriction products and a band of approximately 300 bp was excised and purified with the
Qiaex II gel extraction kit (QIAGEN) as described previously.
Labelling probes
The chicken and mammalian leptin probes were labelled using the N e w M E G A P R I M E kit,
protocol 1606 (Amersham). Briefly, the insert D N A concentration was diluted to 5 ng/ul
with distilled water. Using this dilution 25 ng of the D N A insert was added to a sterile
eppendorf tube with 5 ul of the supplied primers, and denatured by heating to 95-100°C for
5 minutes in a water bath. The tube was microfuged briefly. At room temperature, 10 ul
of labelling buffer, 2 ul of enzyme and 23 ul of distilled water were added to the tube. The
tube was microfuged briefly and 5 ul of [a"32P] d C T P (NEN), specific activity 3000
Ci/mmol, was added and mixed by gentle pipetting, followed by brief microcentrifugation.
The tube was incubated at 37°C for 10 minutes. The reaction was stopped by the addition
of 5 ul of 0.2M E D T A and denatured by heating to 95-100°C for 5 minutes. The labelled
insert was chilled on ice before being put through a N I C K column (Pharmacia Biotech) to
Chapter 3 - The emu leptin gene 69
remove unincorporated nucleotide, according to the manufacturers directions.
Approximately 100 ul fractions were collected and those with the highest levels of
radioactivity were identified with a geiger counter (Morgan series 900 mini monitor) and
pooled.
Southern Hybridisation
Reagents
Salmon sperm (SS) DNA
The SS D N A was prepared according to the directions of Sambrook et al (1989).
10 x PIPES (piperazine-N,N'-bis[2-ethane sulfonic acid])
To 700 ml of sterile distilled water 30.24 g of PIPES was added, and the pH was
adjusted to 6.5 with 0.1 N HC1 if required. To this was added 233.76 g of NaCl.
Sterile distilled water was added to give a final volume of 1 L and a final
concentration of 4 M NaCl and 0.1 M PIPES (pH 6.5).
20xSSC
To 800 ml of distilled water 175.3 g of NaCl and 88.2 g of sodium citrate were
added. The pH was adjusted to 7 with 10 N N a O H and distilled water added to
give a final volume of 1 L with. The solution was sterilised by autoclaving on a
liquid cycle (15 lb/sq inch) for 20 minutes.
10% SDS
To 900 ml of distilled water 100 g of electrophoresis grade SDS was added. The
solution was heated to 68°C to assist dissolution. The pH was adjusted to 7.2 with
concentrated HC1 and distilled water added to give a final volume of 1 L.
1M Tris-Cl (pH 7.6)
To 800 ml of distilled water 121.1 g of Tris base was added, the pH was adjusted to
7.6 with concentrated HC1 and distilled water added to give a final volume of 1 L.
The solution was sterilised by autoclaving on a liquid cycle (15 lb/sq inch) for 20
minutes.

Chapter 3 - The emu leptin gene 70
1M Tris-Cl (pH 7.6) + 1.5MNaCl
Made as for 1 M Tris-Cl (pH 7.6) with the addition of NaCl to a final concentration
of 1.5 M.
O.SMNaOH
To 800 ml of distilled water 20 g of N a O H was added. This was allowed to
dissolve and the final volume was adjusted to 1 L with sterile distilled water.
Cosmid prehybridisation solution (2 x PIPES, 50% deionizedformamide, 0.5%
SDS(wA))
A volume of 200 ml of 10 x PIPES, was added with 500 ml of deionized
formamide and 50 ml of 10% SDS to a sterile 1 L Schott bottle. The final volume
was adjusted the to 1 L with sterile distilled water.
2xSSC + 0.1%SDS
This solution was prepared by diluting 20 x SSC 1 in 10, and 10% SDS 1 in 100
with sterile distilled water to give a final volume of 1 L in a sterile Schott bottle.
Ix SSC + 0.1% SDS
This solution was prepared by diluting 20 x SSC 1 in 20, and 10% SDS 1 in 100
with sterile distilled water to give a final volume of 1 L in a sterile Schott bottle.
Southern hybridisation to the emu cosmid library
The emu cosmid library was spread on to LB 4- ampicillin media plates in 200 fi\ volumes
at 1 x 10⁶ and 1 x 10⁷ dilutions, and grown up overnight at 37°C. Replica membranes were
made by placing a Hybond-N+ (Amersham) membrane on each plate and allowing them to
wet through. The membranes were then removed and placed colony side up onto fresh LB
+ ampicillin media plates and grown for a further four hours at 37°C.
Positive control membranes were prepared by denaturing plasmid DNA containing the
mammalian and chicken leptin gene sequences at 95°C for 5 minutes before dotting onto
Hybond-N+ membrane (Amersham). The membrane was allowed to air dry and then
baked at 80°C for one hour to fix the DNA.

Chapter 3 - The emu leptin gene 71
The replica membranes were prepared for hybridisation by placing them colony side up for
30 seconds onto a series of number 3 Whatman papers (Whatman International Ltd)
prewetted with the following solutions:
1. 0.5 M NaOH,
2. 1 M Tris-HCl (pH 7.6), and
3. 1 M Tris-HCl (pH 7.6)+1.5 M NaCl.
The membranes were placed in a solution of 1 M Tris-HCl (pH 7.6) + 1.5 M NaCl and any
colony debris was gently removed by rubbing a gloved hand over the surface of the
membrane. The membrane was rinsed in fresh 1 M Tris-HCl (pH 7.6) + 1.5 M NaCl and
allowed to air dry on paper towel before being baked at 80°C for one hour.
The replica and positive control membranes were placed on fine nylon gauze prewetted
with the cosmid prehybridisation solution, this was gently rolled up and placed in Hybaid
H B - O V - B M hybridisation bottles. A volume of 20 ml of the cosmid prehybridisation
solution pre-warmed to 50°C was added to the bottle with 200 ul of salmon sperm D N A
that had been boiled for 10 minutes immediately prior to its addition. The hybridisation
bottle was sealed and the membranes were prehybridised at 46°C for a minimum of two
hours in a Hybaid mini oven. The probes were prepared as described previously and at the
completion of prehybridisation boiled at 95-100°C for 5 minutes and added to the
prehybridisation solution. Hybridisation was carried out overnight at 46°C in a Hybaid
mini oven. At the completion of hybridisation the solution was poured off and 20 ml of 2
x SSC + 0.1% SDS, pre-warmed to 60°C, was added to the bottles. The membranes were
washed for 5 minutes in a Hybaid mini oven, and then the solution was poured off and the
wash repeated twice. A final wash was performed for 30 minutes with 20 ml of 1 x SSC +
0.1% SDS pre-warmed to 60°C. A geiger counter (Morgan series 900 mini monitor) was
used to measure the background radiation on the membrane and the wash steps repeated if
this was deemed too high. The membranes were blotted on paper towel and wrapped in
cling film before being exposed to x-ray film (Kodak scientific imaging film) overnight at -
80°C. The film was developed using Kodak chemicals according to the manufacturers
directions.
Rapid amplification ofcDNA ends (RACE)
Following the amplification of an appropriately sized band from emu liver R N A with
leptin gene primers that were specific for the chicken (Ashwell et al, 1999a) Clontech's

Chapter 3 - The emu leptin gene 72
Marathon R A C E c D N A amplification kit was employed to obtain the remainder of the 3'
and 5' ends of the sequence from poly A + emu liver R N A .
The protocols outlined for the Marathon kit were followed, with the exception of the
thermal cycling conditions, which were optimised for the Hybaid OmniGene thermal
cycler and are given in Table 3.8.
Table 3.8: The thermal cycling conditions for the Marathon RACE reactions.
Step Denature Anneal Extend Number of cycles
1 94°C, 30 sec - - 1
2 94°C, 30 sec 65°C, 1 min 68°C, 3 mins 5
3 94°C, 30 sec 60°C, 1 min 68°C, 3 mins 5
4 94°C, 30 sec 57°C, 1 min 68°C, 3 mins 30
5 - - 72°C, 5 mins 1
The four largest bands resulting from the R A C E reaction were excised from the gel and
purified using the Qiaex II kit (QIAGEN). P C R was performed on the products using the
nested primers reported by Ashwell et al (1999a) and the thermal cycling conditions
described in Table 3.3, with the exception that annealing at steps 1 and 2 were performed
at 55°C. Any fragments that were approximately 260 bp in length were ligated into
p G E M - T and transformed into the E. coli strain X L 1-blue, using the methodology
described previously. The resulting colonies were screened using the SP6 and T7 primers
to determine which clones contained inserts of the same size as the R A C E product. These
were screened further via the nested P C R reaction as above. Those colonies that contained
plasmids with inserts of the correct size were grown up to make glycerol stocks as
described previously and for plasmid D N A preparations using the midifilter kit (QIAGEN)
according to the manufacturer's directions. The quality and concentration of the plasmid
D N A were determined spectrophotometrically. Plasmids were sequenced at the
Immunology Department of Royal Perth Hospital.
Chicken leptin bioassay
This work was performed with Dr Friedman-Einat at the Institute of Agriculture, Volcani
Center, Israel. The bioassay utilises a firefly luciferase reporter construct and the chicken
leptin receptor transfected into the HEK-293 embryonic kidney cell line using methods

Chapter 3 - The emu leptin gene 73
reported by Rosenblum et al (1998). The colonies transfected with the leptin receptor were
screened by Dr Friedman-Einat to detect the clone with the highest level of leptin-induced
luciferase activity. This clone (clepr210) was used to determine the biological activity of
leptin in serum samples from emus and chickens. The methodology is given briefly below:
Reagents
DMEM medium
1 0 % fetal calf serum, 50 ug/ml streptomycin and 50 U/ml penicillin
Growth medium
D M E M + 2 ug/ml puromycin
Culture plate preparation
Growth medium was gently aspirated from a culture stock of clepr210, leaving a layer of
cells. An aliquot of 300 fi\ of trypsin was added and allowed to spread across the plate.
Clumps of cells that formed were detached by gentle tapping. The cells were removed
from the bottom of the plate by adding 9 ml of D M E M medium and gently pipetting the
solution. An aliquot of 1 ml of the resulting solution was added to a new petri dish, and an
additional 8 ml of growth medium was added, mixed gently and incubated at 37°C in a
9 5 % air, 5 % carbon dioxide atmosphere. A volume of 18 ml of D M E M medium was
added to the remaining 8 ml of cell culture. While gently mixing this solution, aliquots of
500 ul (24 well Sarstedt) or 900 ul (6 well culture plate) were distributed into each well of
the culture plates (-50,000 cells/well). The plates were then incubated at 37°C in a 9 5 %
air, 5 % carbon dioxide atmosphere overnight.
Assessment of leptin activity in serum or plasma
The medium was aspirated gently and replaced with Optimem serum free medium
(GIBCO) pre-heated to 37°C (300 ul for 24 well or 600 ul for 6 well culture plates). The
serum samples (20-30 ul emu serum for 24 well or 100 ul for 6 well culture plates) were
tested in duplicate. A blank reaction was prepared in duplicate by adding only Optimem
serum free medium (GIBCO). The culture plates were incubated for 8-16 hours at 37°C in
a 9 5 % air, 5 % carbon dioxide atmosphere. The medium was poured off and allowed to
drain. Once dry, the cells were lysed by the addition of 100 ul of lysis buffer (Promega)
and vortexing (24 well culture plates). For the six well culture plates the same volume of

Chapter 3 - The emu leptin gene 74
lysis buffer was used and after vortexing the bottom of the wells were scraped to ensure
that all cells were lysed. The lysed product was transferred to an eppendorf tube and
stored at -80°C. A n aliquot of 40 ul was removed for luminometric determination. Protein
determination was performed in triplicate with lul of the lysed product.
Luminometric determination
A volume of 40 ul of luciferase was added to the 40 ul aliquot of lysed cells immediately
prior to reading each sample. Tubes were tapped gently and quickly to mix and remove air
bubbles. The samples were then aliquoted into a sample tube and the light emitted was
quantified with a TD20e luminometer (Turner Design Inc.).
Protein determination
The protein concentration of each well was determined by Bradford assays using a 150-
fold dilution of each cell lysate. The assays were performed in duplicate. A standard
curve was set up using 0, 1, 2, 3, 4 and 5 ul of B S A (1 mg/ml) in duplicate.
Leptin receptor (LepR) induction
The luciferase activity and protein content measurements were used to calculate the
luciferase activity per fig of protein in each sample. These values indicate how much the
leptin receptors in the cell line were activated by leptin in the samples. To make
comparisons between individual bioassays the LepR induction of the samples were
expressed as proportions of their blank (Optimem serum free medium only) reaction
values. The calculations are as follows:
Sample LepR induction = (luciferase activity / ug of protein) / blank LepR induction
Blank LepR induction = luciferase activity / ug of protein
Data and statistical analysis
The significance of differences over the course of a year, were determined using the
Friedman two-way analysis of variance by ranks described by Siegel (1956). Non-
parametric statistical analysis was judged the most appropriate, as related samples were
used and the sample size was small (n = 6). The results are indicated as the mean ± s.e.m.

Chapter 3 - The emu leptin gene 75
3. Results
RT-PCR
A leptin-like product was amplified from emu R N A . The homology of the emu derived
product was highly homologous with the ovine leptin gene sequence (98%).
Cosmid library screening
The chicken leptin fragment provided by Dr Ashwell failed to hybridise to the emu c D N A
cosmid library. A mammalian leptin gene fragment was used as a positive control in the
southern hybridisations. This showed a high degree of homology with Ashwell's chicken
fragment, even after high stringency washing.
RACE
Using either total or poly A + R N A from emu liver the sCLepl and aCLepl primers failed
to amplify any D N A fragments that resembled the leptin gene (Ashwell et al, 1999a). The
highly conserved mammalian O B R 1 primer and the chicken specific sCLepl primer also
failed to amplify the emu leptin gene sequence (Nakavusit, 1998; Ashwell et al, 1999a).
Chicken leptin bioassay
The emu serum samples used in the chicken leptin bioassay produced quantifiable amounts
of light, which indicates that components in the samples activated the chicken leptin
receptor (Table 3.9 and 3.10). Lower values for the leptin receptor induction were
obtained with emu samples than are obtained for the chicken. Samples collected from
emus during the course of a year indicated that the biological activity of leptin did not
differ in the emu over this period (Table 3.10).
Table 3.9: Leptin receptor induction of the chicken leptin bioassay by emu and chicken serum samples.
— ^ m u Chicken
Ratio of sample to blank 2.72 ±0.64 14.18 ±0.66 LepR induction Values are means ± s.e.m.

Chapter 3 - The e m u leptin gene
Table 3.10: Leptin receptor induction of the chicken leptin receptor bioassay by emu serum samples collected over the course of a year.
Summer Autumn Winter Spring Summer
Ratio of sample to blank 2.59 ±0.78 1.93 ±0.70 2.31 ±0.94 2.14 ±0.79 2.86 ±1.09 LepR induction
Values are means ± s.e.m.

Chapter 3 - The emu leptin gene 77
4. Discussion
The first hypothesis, that emus have a leptin gene sequence, is supported by the results.
However, the results do not support a high degree of homology between the published
chicken and mammalian sequences. The second hypothesis is supported by the activation
of the chicken leptin receptor by components in emu serum. In addition activation of the
chicken receptor by emu serum provides the evidence that the leptin gene is present in the
emu. The ability of emu serum to activate the chicken leptin receptor also suggests that
emu and chicken leptins share a high degree of homology. A leptin-like product was
amplified using RT-PCR from both chicken and emu R N A that shared high homology with
the ovine leptin gene sequence (98%). However, ovine R N A and D N A are regularly used
in our laboratory, and other approaches such as R A C E and screening of the emu cosmid
library failed to identify emu leptin. As such, the product amplified by RT-PCR was
deemed to be the result of contamination from aerosols within the laboratory. The failure
of RT-PCR, R A C E and screening of the emu cosmid library to identify the emu leptin gene
would indicate that the emu sequence does not share a high degree of homology with
Ashwell et al's (1999a) chicken or the published mammalian leptin gene sequences.
Controls used while screening the emu cosmid library revealed a high degree of homology
between the mammalian sequence and Ashwell et al's (1999a) chicken leptin gene
sequence. This is unexpected, as generally genes are more highly conserved between
avian species than between avian and mammalian species. These results could be taken to
indicate that the published chicken leptin gene sequence is not correct. Other researchers
have also concluded that the published sequence for the chicken leptin gene is not correct,
and is instead a contamination artefact (Friedman-Einat et al, 1999; Varma, 2000; Dunn et
al, 2001). The problem of contamination artefacts being produced using the P C R
technique is well documented (Sarkar & Sommer, 1990; Erlich et al, 1991; Neumaier et al,
1998; Burkardt, 2000; Urban et al, 2000).
There are several approaches that can be taken to determine if the published chicken leptin
gene sequence is correct. First, sequencing of the chicken and emu leptin gene sequences
using alternative methods to those employed by Ashwell et al (1999a) and Taouis et al
(1998). A group led by Dr Friedman-Einat at the Volcani Centre is currently attempting
this using their chicken leptin receptor sequence to capture the protein ligand and obtain its
N-terminal amino acid sequence (Horev et al, 2000). Once the N-terminal amino acid

Chapter 3 - The emu leptin gene 78
sequence is known degenerate oligo primers can be designed. PCRs can then be
performed using these primers to obtain the complete chicken leptin gene sequence.
Second, testing of the protein product of the published chicken leptin gene sequence in the
chicken leptin bioassay. The failure of this product to activate the receptor could indicate
that the published chicken leptin gene sequence is incorrect. Third, the sequence of the
emu leptin receptor gene could be determined. If a high degree of homology between the
leptin receptor genes from e m u and chicken is found, it will argue strongly for sequence
conservation of the leptin gene.
The activation of the chicken leptin receptor by components within emu serum was much
lower than observed for the chicken. This could be due to lower specificity of the assay for
emu leptin or to lower biological activity of emu leptin. The bioassay also indicated that
the concentration of leptin did not differ over the course of a year, again this may be the
result of lower specificity of the assay for emu leptin. If in the emu, leptin concentrations
increase when adiposity increases and suppress appetite, it would be impossible for the
emu to deposit large amounts of fat over the summer months as part of its annual cycle.
So, m y results suggest that leptin is not involved in appetite regulation in emus in the same
manner as it is in other species. The role of leptin in the control of appetite and adiposity
in the e m u will only be determined once effective methods for measuring leptin
concentrations in emu serum are developed. In the following chapters I will present
experiments aimed at improving the understanding of h o w appetite and adiposity are
controlled in the emu.
79
Chapter 4
The influence of dietary fat on food intake and adiposity
1. Introduction
2. Materials and Methods
3. Results
4. Discussion
Page
80
81
84
94

Chapter 4 - The influence of dietary fat on food intake and adiposity 80
1. Introduction
Seasonal fluctuations in feed intake and body weight are observed in emus and correlate
directly with their degree of adiposity (Mincham et al, 1998; Blache & Martin, 1999;
Blache et al, 2001b). Adiposity and appetite are decreased during the breeding season
and increased during the summer months. Decrease in appetite and adiposity during the
breeding season could be prevented by dietary interventions that disrupt energy balance.
For example, in chickens, feeding diets that are high in fat increases adiposity in
proportion to the diet's fat content (Edozien & Switzer, 1978; Deaton et al, 1981;
Boozer et al, 1995; Vila & Esteve-Garcia, 1996). In mammals, high fat diets also
induce hyperphagia, although this effect is variable between species and strains and
may be transient (Oscai et al, 1984; West et al, 1992; Hill et al, 1992; French et al,
1995; Smith et al, 1998). The variability of hyperphagia in response to high fat diets
may be due to the action of high fat diets to decrease the rate of stomach emptying
(Mateos et al, 1982). A decreased rate of stomach emptying would make the animal
feel sated for longer.
Diets high in fat disrupt energy balance by decreasing the metabolic rate and lowering
energy expenditure (Black et al, 1949; Storlien et al, 1986). The mechanism enabling
this could involve metabolic changes that can be assessed by measuring hormone
concentrations (Ramirez et al, 1990; Ahren & Scheurink, 1998). W h e n energy intake
exceeds the organism's requirements insulin rises, glucagon falls, and metabolism shifts
from catabolism of stored energy reserves to anabolism and storage of ingested energy
(Norman & Litwack, 1987). Depression of the thyroid hormones reduces the metabolic
rate and energy expenditure via depressed body temperature (Norman & Litwack,
1987).
This experiment was performed to determine if feeding diets that are high in fat to emus
during the summer months, when appetite is high, can further increase appetite and
adiposity. The following hypotheses were formulated:
1. Feeding emus a high fat diet for an extended period will increase adipose tissue
deposition and induce hyperphagia, and
2. Feeding emus a high fat diet will alter the concentration of metabolic hormones
to favour adipose deposition. This should result in higher concentrations of
insulin and lower concentrations of glucagon, triiodothyronine and thyroxine.
Chapter 4 - The influence of dietary fat on food intake and adiposity 81
2. Materials and Methods
Experimental design
To test the hypotheses male emus were allocated into two groups to be fed either a high
(23.6%) or a low (4.5%) fat diet. Changes in appetite and adiposity were assessed by
measuring feed intake over the course of the experiment and performing carcass
composition analysis on the birds at the completion of the experiment. The
concentration of the insulin, glucagon, triiodothyronine and thyroxine were measured
over the course of the experiment by radioimmunoassay in order to determine if
metabolism had changed to favour adipose deposition.
Animals
Ten male emus (nine 3 year olds and one 4 year old) were penned individually, as
described in Chapter 2. They were allocated into two groups of similar average weights
(means ± s.e.m. - low fat diet group 41.5 ± 1.5 kg, high fat diet group 42.8 ±3.1 kg).
Treatments
The birds were offered diets differing in fat, but not protein content (Table 4.2). All
birds received a 4.5% fat diet (low fat) for a period of two weeks (Weeks -2 to 0). At
the end of the two weeks one group was given a 23.6% fat diet (high fat) for a period of
54 days. Due to difficulties with emus accepting changes in their feed, the switch to the
high fat diet was achieved by adding the high fat diet in increasing proportions to the
low fat diet, over the first two weeks (Weeks 1 and 2) of the treatment period.
Feeds were made up weekly or as required, with the addition of between 3 and 5%
water to the mix to aid in mixing and pelleting (Table 4.1). Flaked barley was reduced
to a powder using a grinding mill (Horwood Bagshaw Ltd) and the feed was
mechanically mixed in a Barrow Linton (Perth) mixer. Pellets were made with a 5 m m
diameter dye using a Lister pellet press. The size of the pellets approximates the size of
the commercial breeder pellet that the birds had previously been fed.
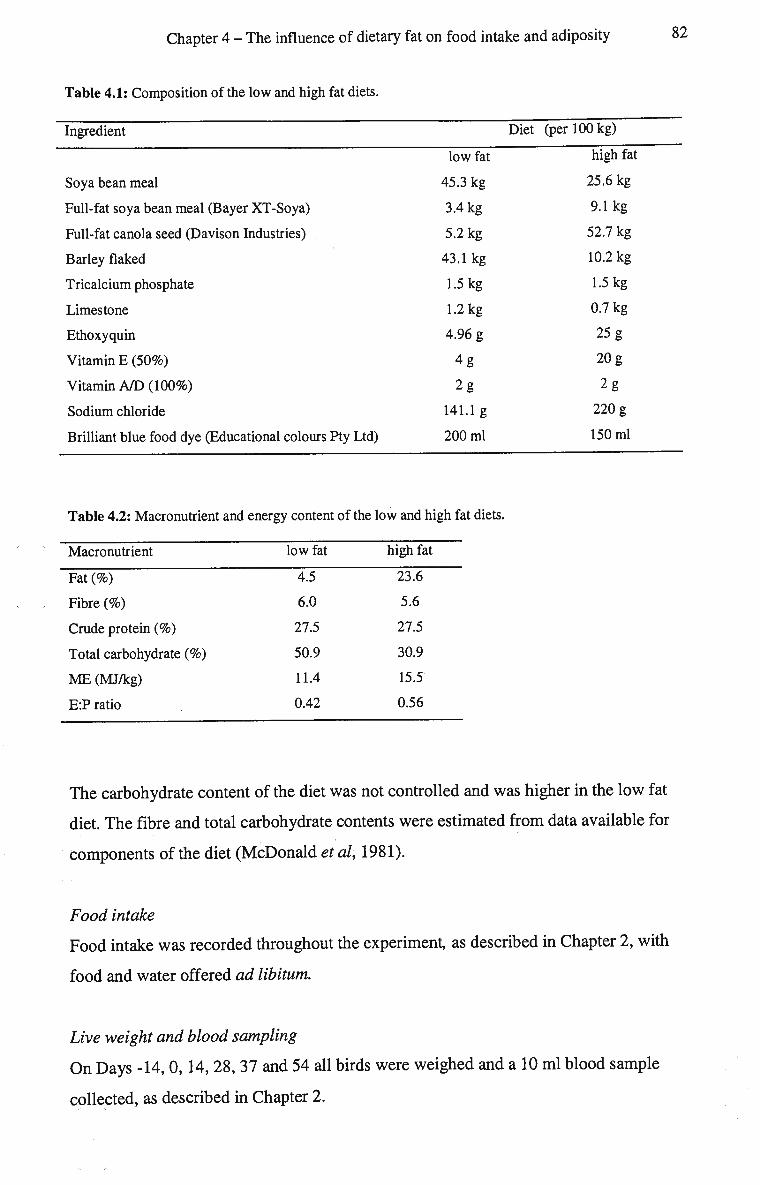
Chapter 4 - The influence of dietary fat on food intake and adiposity 82
Table 4.1: Composition of the low and high fat diets.
Ingredient
Soya bean meal
Full-fat soya bean meal (Baye:
Full-fat canola seed (Davison
Barley flaked
Tricalcium phosphate
Limestone
Ethoxyquin
Vitamin E (50%)
Vitamin A/D (100%)
Sodium chloride
r XT-Soya)
Industries)
Brilliant blue food dye (Educational colours Pty Ltd)
low fat
45.3 kg
3.4 kg
5.2 kg
43.1 kg
1.5 kg
1.2 kg
4.96 g
4g
2g
141.1 g
200 ml
Diet (per 100 kg)
high fat
25.6 kg
9.1kg
52.7 kg
10.2 kg
1.5 kg
0.7 kg
25 g
20 g
2g
220 g
150 ml
Table 4.2: Macronutrient and energy content of the low and high fat diets.
Macronutrient
Fat(%)
Fibre (%)
Crude protein (%)
Total carbohydrate (%)
M E (MJ/kg)
E:P ratio
low fat
4.5
6.0
27.5
50.9
11.4
0.42
high fat
23.6
5.6
27.5
30.9
15.5
0.56
The carbohydrate content of the diet was not controlled and was higher in the low fat
diet. The fibre and total carbohydrate contents were estimated from data available for
components of the diet (McDonald et al, 1981).
Food intake
Food intake was recorded throughout the experiment, as described in Chapter 2, with
food and water offered ad libitum.
Live weight and blood sampling
O n Days -14, 0, 14, 28, 37 and 54 all birds were weighed and a 10 ml blood sample
collected, as described in Chapter 2.

Chapter 4 - The influence of dietary fat on food intake and adiposity 83
Tissue collection and carcass composition
At the completion of the experiment (Day 56), birds were weighed and bled, prior to
being euthanased. Samples of liver and muscle were collected for analysis of fat
content. The empty carcass, subcutaneous and visceral fat depots, and the liver were
weighed to determine differences in adiposity. The methodology for these procedures
is given in Chapter 2.
Hormones and metabolites
Radioimmunoassays were performed for insulin, triiodothyronine, thyroxine and
glucagon for all samples as described in Chapter 2.
Data and statistical analysis
The carcass composition data for each tissue is expressed as a percentage of the live
weight of the animal. The significance of any differences between treatment groups,
were determined using Mann-Whitney U tests as described by Siegel (1956) using the
Statview™ 512+ program (1986). This statistical analysis was judged to be the most
appropriate method to analyse the data, as two independent groups were sampled from
and the sample size was small (n < 5). The significance of any differences within diets
over time, was determined using the Friedman two-way analysis of variance by ranks as
described by Siegel (1956). This statistical analysis was judged to be the most
appropriate as the samples were related and there were more than two time-points
involved. The results are indicated as the mean ± s.e.m.

Chapter 4 - The influence of dietary fat on food intake and adiposity 84
3. Results
Feed Intake
There was a tendency for total feed and protein intakes to be lower on the high fat diet
(p = 0.075). The total amount of fat consumed was higher, and the total amount of fibre
consumed was lower in birds fed the high fat diet than in birds fed the low fat diet (p =
0.004, p = 0.048 respectively). Total energy consumption did not differ between the
two groups (Table 4.3), despite the higher energy content of the high fat diet (Table
4.2).
Table 4.3: Total feed, protein, fibre, fat and energy intakes over 68 days of male emus fed low and high
fat diets.
low fat diet high fat diet
Total feed intake (kg) 55.3 ±8.0 39.9 + 3.0
Total protein intake (kg) 15.2 + 2.2 11.0 + 0.8
Total fibre intake (kg) 3.34 ± 0.48* 2.30 ± 0.17*
Total fat intake (kg) 2.51 + 0.36* 6.50 ± 0.46*
Total energy consumption (MJ) 631 + 92 449 ± 40
Values are means ± s.e.m. A n * indicates significant difference (p < 0.05) between treatment groups.

Chapter 4 - The influence of dietary fat on food intake and adiposity 85
For the majority of the experiment mean daily feed intake did not differ between the
groups. There were two exceptions with mean daily feed intake for Week 1 and Week 2
being lower for the high fat diet group (p = 0.008 and p = 0.028 respectively) (Fig. 4.1).
This period is also the transition period between the low fat and high fat diets and may
represent an initial rejection of the high fat diet. Within both the low and high fat diet
groups feed intake differed over time (p < 0.05 and p < 0.001 respectively).
Daily feed intake (kg)
1.6 |
1.4 I
1.2 I
1.0 I
0.8 I
0.6 '
0.4 I
0.2 I
0.0 ^ -2 -1 0 1 2. 3 4 5 4 7 8
Week
Figure 4.1: Average daily feed intake for each week of the experiment for male emus receiving either the low (open circle) or high fat diet (solid circle) for 8 weeks. The shaded area represents the transition
period of the high fat diet group from the low to the high fat diet. Values are means ± s.e.m. A n * indicates significant difference between treatment groups (p < 0.05).

Chapter 4 - The influence of dietary fat on food intake and adiposity 86
Live weight
There was no difference in live weight between the high and low fat diet groups at any
time point and no effect of time on live weight within either group (Fig. 4.2).
Live weight (kg)
48'
46
44
42
40
38" r~ -14 14 28
- 1 —
42 56
Day
Figure 4.2: Mean live weight of male emus offered low (open circle) and high fat (solid circle) diets over a 54 day treatment period. The shaded area represents the transition period of the high fat diet group from the low to the high fat diet. Values are means ± s.e.m.

Chapter 4 - The influence of dietary fat on food intake and adiposity 87
Carcass composition
There was no difference in the fat content of either muscle or liver between male emus
receiving either diet (Table 4.4).
Table 4.4: The fat content of muscle and liver tissue from male emus fed either low or high fat diets for 54 days.
Tissue low fat high fat
Muscle (g/kg of wet tissue) 4.93 ± 0.41 3.52 ± 0.90
Liver (g/kg of wet tissue) 28.3 ± 2.6 30.7 ± 1.6
Values are means ± s.e.m.
The live weight at slaughter did not differ between treatment groups (Table 4.5). As
percentages of live weight, subcutaneous adipose, visceral adipose and total adipose
tissues, liver, empty carcass and testis weights did not differ between treatment groups
(Table 4.5). The percentage of digestive tract weight to live weight and digestive tract
length were greater in birds fed the high fat diet than in birds fed the low fat diet (p =
0.048 and p = 0.028 respectively) (Table 4.5).
Table 4.5: The body composition of male emus receiving either low or high fat diets for 54 days.
Parameter low fat high fat
Live weight at slaughter (kg) 42.6 ± 3.33 41.1+2.02
Subcutaneous adipose (%) 19.2 ± 1.33 17.5 ± 1.26
Visceral adipose (%) 7.4 ± 0.43 7.0 ± 0.34
Total adipose (%) 26.6 ± 1.42 24.5 ± 1.52
Liver (%) 1.4 ±0.1 1.2 ±0.05
Digestive tract weight (%) 1.5 ± 0.06 * 1.7 ± 0.11 *
Digestive tract length (%) 9.2 ± 0.28 * 11.2 ± 0.72 *
Testis (%) 0.014 ± 0.002 0.019 ± 0.003
Empty carcass (%) 52.3 ±1.12 54.4 ± 1.53
Values are means ± s.e.m. A n * indicates significant difference between treatment groups (p < 0.05). Parameters with a (%) next to them are given as the percentage tissue weight of live weight.

Chapter 4 - The influence of dietary fat on food intake and adiposity 88
Hormones and metabolites
Serum glucagon did not differ between the high and low fat diet groups at any time
point (Fig. 4.3). Within each group there was no difference in glucagon concentration
over time.
Serum glucagon (pg/ml)
-14 0 14 28 42 56
Day
Figure 4.3: Serum glucagon concentrations of male emus offered low (open circle) and high (solid circle) fat diets for 54 days. The shaded area represents the transition period of the high fat diet group from the
low to the high fat diet. Values are means ± s.e.m.

Chapter 4 - The influence of dietary fat on food intake and adiposity 89
There was a trend for insulin to decrease over time in both groups. However, this was
only significant for the high fat diet group (p < 0.05). The serum insulin concentrations
were lower in the birds receiving the high fat than the low fat diet at Day 14, Day 28
and Day 42 (p = 0.048, p = 0.016 and p = 0.048 respectively) (Fig. 4.4).
Serum insulin (ng/ml)
i 1 1 1 1 1
-14 0 14 28 42 56
Day
Figure 4.4: Serum insulin concentration of male emus offered low (open circle) and high (solid circle) fat diets foe 54 days. The shaded area represents the transition period of the high fat diet group from the low
to the high fat diet. Values are means ± s.e.m. A n * indicates significant difference between treatment
groups (p < 0.05).
2.0
1.8"
1.6"
1.4'
1.2"
1.0"
0.8"

Chapter 4 - The influence of dietary fat on food intake and adiposity 90
In both groups it was observed that the insulin/glucagon ratio tended to decrease over
time. However, this trend only achieved significance for the high fat diet group (p <
0.05) (Fig. 4.5). The insulin/glucagon ratio tended to be lower in the high fat diet
group, however this was only significant on Day 28 (p = 0.032).
Plasma insulin/glucagon ratio
Day
Figure 4.5: Serum insulin/glucagon ratio of male emus offered low (open circle) and high (solid circle) fat diets for 54 days. The shaded area represents the transition period of the high fat diet group from the
low to the high fat diet. Values are means ± s.e.m. A n * indicates significant difference between
treatment groups (p < 0.05).

Chapter 4 - The influence of dietary fat on food intake and adiposity S
The serum triiodothyronine concentrations did not differ between the groups receiving
the high and low fat diets at any time point (Fig. 4.6). In both groups the
triiodothyronine concentration tended initially to decrease, however this trend was not
significant within either group over time.
Serum triiodothyronine (ng/ml)
1.6
1.4
1.2
1.0
0.8
0.6
0.4
0.2
0.0 - ' -14 0 14 28 42 56
Day
Figure 4.6: Serum triiodothyronine concentration in male emus offered low (open circle) and high (solid circle) fat diets for 54 days. The shaded area represents the transition period of the high fat diet group
from the low to the high fat diet. Values are means ± s.e.m.

Chapter 4 - The influence of dietary fat on food intake and adiposity 92
The serum thyroxine concentration was higher in the high fat diet group at Day 14 and
lower at Day 42 (p = 0.048 and p = 0.028 respectively) (Fig. 4.7). Over time the
thyroxine concentration decreased in both the low fat and the high fat diet groups (p <
0.05 and p < 0.01 respectively).
Serum thyroxine (ng/ml)
25000 ]
20000 l
15000 j
10000
5000
0' -14 0 14 28 42 56
Day
Figure 4.7: Serum thyroxine concentration in male emus offered low (open circle) and high (solid circle) fat diets for 54 days. The shaded area represents the transition period of the high fat diet group from the low to the high fat diet. Values are means ± s.e.m. A n * indicates significant difference between treatment groups (p < 0.05).

Chapter 4 - The influence of dietary fat on food intake and adiposity 9'.
The triiodothyronine/thyroxine (T3/T4) ratio did not differ between the groups at any
time point (Fig. 4.8). There was no difference over time within the group receiving the
low fat diet. A difference in the T3/T4 ratio over time was observed within the group
receiving the high fat diet (p < 0.05).
T3/T4 ratio (1 x 10'4) 7.0
6.0
5.0
4.0
3.0
2.0
1.0
n J ' ' ' *—^- ~^ ' -14 0 14 28 42 56
Day
Figure 4.8: Serum T3/T4 ratio in male emus offered low (open circle) and high (solid circle) fat diets for 54 days. The shaded area represents the transition period of the high fat diet group from the low to the
high fat diet. Values are means ± s.e.m.
•;- . ;
; • •

Chapter 4 - The influence of dietary fat on food intake and adiposity 94
4. Discussion
The results presented here do not support either of the hypotheses. Prolonged feeding
of a high fat diet did not increase adiposity or appetite, or alter hormone concentrations
to favour adipose storage (i.e. increased insulin, decreased glucagon, triiodothyronine
and thyroxine). The absence of increases in adiposity and appetite, and of changes in
hormone concentrations occurred despite more fat being consumed by the high fat diet
group. A s such, the absence of hormonal changes in these animals implies that in the
e m u this level of fat inclusion in the diet does not alter metabolism to favour energy
storage. The failure of the high fat diet to increase appetite and adiposity m a y be due to
the composition of the diet, taste aversions for components of the diet, or alterations in
digestive physiology in response to the high fat diet restricting feed intake.
Alternatively, the higher energy content of the high fat diet m a y have caused a
compensatory decrease in feed intake to maintain energy intake at a level appropriate to
the animal's requirements.
A factor that may have contributed to the failure of the high fat diet to increase
adiposity is its composition. First, the lower carbohydrate content of the high fat diet
m a y have resulted in a greater proportion of the ingested fat being oxidised to meet the
animal's energy requirements, particularly given the tendency for a lower level of
energy intake in the high fat diet group. Second, there is evidence that the type of fat
ingested can also affect the degree of adiposity. In rats it has been observed that
feeding isoenergetic diets containing either saturated or unsaturated fat results in greater
carcass adiposity in the saturated fat group (Shimomura et al, 1990). Broiler chickens
receiving isoenergetic diets of either saturated or unsaturated fat exhibited greater
abdominal adipose deposition in the group receiving saturated fat (Vila & Esteve-
Garcia, 1996; Sanz et al, 1999 & 2000). The difference between saturated fats and
unsaturated fats in their ability to induce adiposity is most likely related to differences
in their oxidation rates (Sanz et al, 2000). The greater the chain length of saturated fatty
acids the slower their rate of oxidation, a situation favouring storage (Leyton et al,
1987). The diets formulated for this experiment used full-fat canola and soyabean
meals as the primary sources of fat. As these fats are unsaturated, this m a y explain the
lack of difference in adiposity between the two groups. In chickens, at high levels of
inclusion, unsaturated fats, as fed in this experiment, increase adiposity (Vila & Esteve-

Chapter 4 - The influence of dietary fat on food intake and adiposity 95
Garcia, 1996). As such, the high fat diet may not have contained enough unsaturated fat
to augment adipose deposition in emus.
An alteration in digestive function could also have been responsible for the lack of
effect of the high fat diet. Diets that are high in fat slow the rate of stomach emptying
(Mateos et al, 1982). It is therefore of interest that the weights and lengths of the
gastrointestinal tract, as proportions of live weight, were higher in the group receiving
the high fat diet. It is possible that this represents an adaptation to enable greater
absorption of dietary components. A slower rate of stomach emptying may also explain
the tendency for lower feed intake in the group receiving the high fat diet, as the animal
would feel sated for longer due to stomach distension. A slower rate of stomach
emptying in animals fed the high fat diet, and its satiating effects, may also explain the
failure of the diet to increase adiposity. A satiated animal eats less and a tendency for
lower energy intake was observed in the high fat diet group. As such, these animals
would expend more energy absorbing components from the diet, and the energy
obtained from this process is then more likely to be oxidised to meet the energetic
requirements of the animal. This situation would not favour adipose deposition.
The concentrations of insulin (lower), glucagon, triiodothyronine and thyroxine
(unchanged) also indicated that the metabolism of the birds fed the high fat diet did not
favour adipose deposition. As such, the hypothesis that metabolic changes that favour
adipose deposition will occur in response to a high fat diet can be rejected. However,
the hormonal data provides other insights into the metabolism of the e m u that m a y help
to explain the failure of the high fat diet to increase adiposity. One of these
explanations is that the e m u staunchly resists manipulations that alter metabolism. The
finding that significantly lower feed intake over a two week period was not associated
with significant changes in hormone concentrations supports this explanation. The
lower concentrations of insulin in the group receiving the high fat diet could mean that
they were in negative energy balance. The birds receiving the high fat diet also
consumed less food and had a lower energy intake, though neither was significant, that
would have made a state of negative energy balance possible. In addition, at the final
time-point the insulin concentration did not differ between the groups, following a two
week period of rising feed intake in the high fat diet group, indicating that the energy
balance had been restored in the high fat diet group. In contrast to insulin, glucagon did

Chapter 4 - The influence of dietary fat on food intake and adiposity 96
not differ over the course of the experiment, implying that energy intake was sufficient.
The elevated concentration of glucagon at Day 14 was most probably due to the
decreased feed intake that occurred in response to the change in diet in the group
receiving the high fat diet. The decrease in feed intake observed represents voluntary
feed intake reduction in response to the presentation of an unfamiliar feed, a response
also observed by other researchers working with emus (Van Cleeff, 2000 personal
communication). Once accustomed to the new diet, feed intake was restored and the
concentration of glucagon in serum became comparable to that of birds receiving the
low fat diet. The insulin/glucagon ratio shows a strong tendency to be lower at all time
points following exposure to the high fat diet. This indicates that metabolism has been
altered to favour the utilisation of adipose stores rather than their deposition. The trends
observed in both groups for increasing glucagon and decreasing insulin over the course
of the experiment may reflect the onset of appetite suppression. This would suggest
that high fat diets do not sustain appetite in emus, in contrast to observations in mice
(Van Heek et al, 1997).
The rising feed intake of the group receiving the high fat diet during the final two weeks
of the experiment may explain the lack of difference in insulin between the two groups
at the final time point. The rising feed intake might also represent the induction of a
mechanism to sustain appetite when energy intake preceding the reproductive period is
insufficient. W h e n the feed intake of emus is restricted over summer (maximal
appetite) they respond by increasing their food intake and rate of weight gain in the
following months (O'Malley, 1999). The increased food intake and weight gain occurs
during a period when appetite would usually be declining. The ability to maintain their
appetite when the preceding period has not satisfied their energetic requirements is a
compensatory mechanism to ensure that the animals have sufficient reserves to survive
the breeding period. The initial voluntary reduction in feed intake observed in response
to the high fat diet and the lower feed intake while receiving the diet may have triggered
such a mechanism. Normally after periods of voluntary feed intake reduction, such as
occurs following stress in some birds (e.g. after handling), or after the completion of
incubation, appetite returns rapidly and lost weight is quickly restored (Van Cleeff,
2001; Zadworny et al, 1985). I did not observe a rapid compensatory appetite following
voluntary feed intake reduction in response to the high fat diet. This supports the idea

Chapter 4 - The influence of dietary fat on food intake and adiposity 97
that the higher fat content decreased feed intake due to slower emptying of the stomach,
or as a result of a taste aversion to the feed.
The circulating concentration of triiodothyronine was not different at any time-point. In
both groups triiodothyronine concentrations initially decreased, and then increased from
Day 14, with this tendency strongest in the group receiving the low fat diet. The slower
rate of increase in the group receiving the high fat diet might reflect an effect of the
high fat diet to decrease the metabolic rate. It m a y also result from a compensatory
mechanism triggered by the voluntary starvation and lower energy intake of the group
receiving the high fat diet. The thyroxine concentration was higher in the group
receiving the high fat diet at Day 14 and lower at Day 42. The higher concentration of
thyroxine at Day 14 in the group receiving the high fat diet may be due to the voluntary
starvation observed in this group, as thyroxine is elevated in chickens in response to a
24 hour fast (Rosebrough & McMurtry, 2000). The lower concentration of thyroxine at
the end of the experiment in the group receiving the high fat diet may reflect an effect
of the high fat diet to decrease the metabolic rate. Thyroid hormone concentrations in
emus and ostriches are highly variable (Dawson, 1996; Dawson et al, 1996; Blache et
al, 2001c). In ostriches this variability is largely due to stress (Dawson & Deeming,
1997). The trends observed in triiodothyronine and thyroxine concentrations over the
course of the experiment may, therefore, be artefacts of the handling procedures
employed and the variability in thyroid hormone concentrations inherent in ratites. The
absence of any differences between groups in the ratio of T3/T4 supports this idea.
In conclusion, dietary fat, at the degree of inclusion used in this experiment, does not
increase adiposity, induce hyperphagia or cause a metabolic shift to favour adipose
deposition. There is evidence that unsaturated fats, as used in this experiment, do not
induce increases in adiposity as readily as saturated fats. If a higher level of fat
inclusion, or saturated fats had been used, adiposity m a y have increased. The greater
content of fat in the diet did cause changes in the digestive tract. These changes may
have compensated for a slower rate of stomach emptying, as observed in other species
receiving diets with a high fat content (Mateos et al, 1982). This slower rate of
emptying and possibly a taste aversion to the high fat diet m a y be responsible for the
lower feed intake and the lack of effect on adiposity in the group receiving this diet.
Additionally, the difficulty encountered in changing emus from one diet to another m a y

Chapter 4 - The influence of dietary fat on food intake and adiposity 98
have confounded the experimental results. Ideally the experiment should have been
performed over a longer period. To overcome the limitations of dietary manipulations
in emus more direct mechanisms of stimulating appetite and altering metabolism could
be used. One such mechanism is treatment with glucocorticoids. In the following
chapter I have investigated the effect of dexamethasone, a synthetic glucocorticoid, on
appetite, adiposity and metabolism.
99
Chapter 5
The effect of dexamethasone on appetite, adiposity and the
hypothalamic expression of NPY in female emus.
Page
1. Introduction 100
Section A - Preliminary experiment
2A. Materials and Methods 103
3A. Results 105
4A. Discussion 106
Section B - Long-term dexamethasone treatment experiment
2B. Materials and Methods 107
3B. Results 110
4B. Discussion 122

Chapter 5 - The effect of dexamethasone on appetite, adiposity and 100 the hypothalamic expression of N P Y in female emus.
1. Introduction
The decrease in appetite observed in emus during the breeding season leads to
mobilisation of the adipose depot to meet energy demands (Blake, 1996; Blache &
Martin, 1999; Blache et al, 2001b). It is probable that changes in appetite are centrally
mediated, with the hypothalamus a logical site for investigation given its role in both
satiety and appetite.
There are a number of pathways that could be involved in the control of appetite and
adiposity in the emu. For example, pathways involving cocaine and amphetamine-
regulated transcript (CART), proopiomelanocortin ( P O M C ) , corticotrophin-releasing
hormone (CRH), orexin/hypocretin and agouti-related protein (AGRP), are involved in
the control of appetite and adiposity in other species (Mizuno et al, 1997; Ollmann et al,
1997; Sakurai et al, 1998; Heinrichs & Richard, 1999; Vrang et al, 1999). In this
experiment I have focused on the principal pathway involving N P Y as it is well
characterised for a range of species including several avian species.
Neuropeptide Y (NPY) is a potent, centrally acting, appetite stimulant (Levine &
Morley, 1984; Stanley & Leibowitz, 1984 & 1985; Stanley et al, 1985a & 1986;
Kuenzel et al, 1987; White, 1993; Woods et al, 1998; Inui, 1999a). It is possible that
mechanisms that disrupt appetite in the emu involve inhibition of N P Y . The regulation
of N P Y synthesis and secretion occurs at the level of the hypothalamic-pituitary-adrenal
(HPA) axis. This regulation occurs via changes in the concentration of insulin and
glucocorticoids, which act antagonistically (Strack et al, 1995). The regulation of N P Y
by insulin and glucocorticoids is a potential mechanism for the long-term regulation of
energy balance. As such, manipulating the hormonal balance could influence appetite
indirectly and overcome N P Y inhibition. The H P A axis is a logical target for
modification. Manipulation of the H P A axis to alter the regulation of N P Y could
maintain appetite and adiposity when appetite is normally diminishing. This
manipulation can be achieved with exogenous glucocorticoids, which diminish the
ability of leptin to depress appetite, increase the expression of N P Y m R N A and increase
the concentration of insulin (Campbell et al, 1966; Simon, 1984; Mercer et al, 1996;
Solano & Jacobson, 1999; Arvaniti et al, 1998; Zakrewska et al, 1997).

Chapter 5 - The effect of dexamethasone on appetite, adiposity and 101 the hypothalamic expression of N P Y in female emus.
The action of glucocorticoids to first increase the expression of NPY mRNA, and
second diminish leptin's ability to increase appetite, promotes appetite. The elevated
concentration of insulin in response to glucocorticoid treatment increases lipogenesis,
gluconeogenesis and triglyceride deposition in adipose tissues. Increased appetite is not
consistently observed in animals receiving exogenous glucocorticoids. The absence of
increases in appetite m a y be due to the elevation of insulin inhibiting N P Y m R N A
expression, thereby removing the appetite stimulus (Schwartz et al, 1991; Dallman et
al, 1993). However, increased adiposity occurs with glucocorticoid treatment even
when appetite is not increased (Simon, 1984). As such, the elevated insulin
concentrations, and their promotion of adipogenesis, are primarily responsible for the
increased adiposity when appetite does not change in response to glucocorticoid
administration.
A synthetic glucocorticoid, dexamethasone, induces many of the changes mentioned
above in a wide range of species. In Syrian hamsters, chronic dexamethasone treatment
increases N P Y gene expression (Mercer et al, 1996). In rats, dexamethasone increases
both synthesis and release of N P Y (Corder et al, 1988). In sheep, injections of
dexamethasone increase appetite and reduce weight loss in animals exported live to the
Middle East (Adams & Sanders, 1992). Dexamethasone rapidly increases the
concentration of insulin and leptin in humans, and increases the concentration of insulin
in cattle (Corah et al, 1995; Kolaczynski et al, 1997; Miell et al, 1996; Papaspyrou-Rao
et al, 1997). This leads to insulin resistance and favours adipose deposition. The
elevation of leptin concentrations may also represent the induction of leptin resistance.
Glucocorticoid administration alters the metabolic rate. The administration of
glucocorticoids decreases the circulating concentration of thyroxine, while having
variable effects on the concentration of triiodothyronine (Darras et al, 1997).
Depression of the thyroid hormones, and subsequently metabolic rate, may contribute to
the increased adiposity observed in many species following dexamethasone treatment
(Walker & Romsos, 1993).
Glucocorticoids also influence reproductive function. In chickens, acute
dexamethasone treatment inhibits luteinising hormone secretion, rapidly reducing the
circulating luteinising hormone concentration (Wilson & Lacassagne, 1978). If the
Chapter 5 - The effect of dexamethasone on appetite, adiposity and 102 the hypothalamic expression of N P Y in female emus.
reduction in luteinising hormone concentration is sustained by chronic treatment it
could act to maintain adiposity and appetite by removing the influence of reproductive
hormones on metabolism and appetite.
An experiment was performed to determine if dexamethasone treatment, during a period
when appetite is normally declining, enables appetite and adipose reserves to be
sustained. The following hypotheses were formulated:
1. Dexamethasone administration will increase the m R N A expression of N P Y ,
2. Long-term dexamethasone administration will decrease the concentrations of
triiodothyronine, thyroxine, and luteinising hormone, and increase the
concentrations of blood glucose and insulin, and finally
3. Increased expression of N P Y and metabolic changes induced by dexamethasone
will be associated with increased appetite and adiposity.
To enable these hypotheses to be tested it was necessary to determine the correct dosage
to use for emus. Therefore, a preliminary experiment was performed to determine the
correct dosage of dexamethasone to use in the chronic trial. Dexamethasone treatment
decreases the concentration of corticosterone to barely detectable levels (Buckland et al,
191 A; Etches, 1976; Corder et al, 1988; Corah et al, 1995; Zakrzewska et al, 1999). As
such, this can be used as an indicator of the onset and duration of the drug's effects.
The preliminary experiment is described in Section A. The long-term dexamethasone
experiment is described in Section B.

Chapter 5 - The effect of dexamethasone on appetite, adiposity and 103 the hypothalamic expression of N P Y in female emus.
Section A - Preliminary experiment
2A. Materials and Methods
Experimental design
To determine the correct dosage of dexamethasone to use in the long-term experiment
male and female emus were treated with either a 6 m g or a 12 m g dose of
dexamethasone. Blood samples were collected at regular intervals and the
concentration of corticosterone was measured by radioimmunoassay to determine if the
doses used were capable of suppressing corticosterone production and the duration of
this effect.
Animals
Four male and four female emus that were approximately 12 months of age and hatched
in the same season were used for this experiment. The experiment was performed
during the non-breeding season. All the animals used for this experiment were in good
health.
Treatment
Half of the birds of each sex were implanted with 6 m g of dexamethasone. The
remaining birds were implanted with 12 m g of dexamethasone. The implants were
placed subcutaneously in the area behind the wing. To do this a small incision was
made in the skin and a purpose built tool was used to place the implant subcutaneously.
The implants were not removed after completion of the experiment.
Blood sampling
As described in Chapter 2, 10 ml blood samples were collected. Blood samples were
taken immediately before the implantation procedure, and again 7, 24, 72, 144, 240, 385
and 552 hours after implantation.
Hormones and metabolites
A radioimmunoassay was performed for corticosterone, as described in Chapter 2.
Data and statistical analysis
The significance of any differences between the 6 m g and 12 m g treated groups were
determined at each time-point by Mann-Whitney U tests as described by Siegel (1956)

Chapter 5 - The effect of dexamethasone on appetite, adiposity and 104 the hypothalamic expression of N P Y in female emus.
using the Statview™ 512+ program (1986). This test was judged to be the most
appropriate as samples were taken from two independent groups and the sample size
was small (n = 4, n = 4). The significance of differences over time was determined
within groups by Friedman two-way analysis of variance by ranks as described by
Siegel (1956). This test was judged to be the most appropriate as the samples were
related and several time-points were under comparison. The results are indicated as the
mean ± s.e.m.

Chapter 5 - The effect of dexamethasone on appetite, adiposity and the hypothalamic expression of N P Y in female emus.
105
3A. Results
Hormones and metabolites
The serum corticosterone concentration did not differ between the dosages tested at any
time point. Over time both the 6 m g and 12 m g treated groups exhibited depression of
their corticosterone concentration in response to the dexamethasone implant (p < 0.01
and p < 0.05 respectively). The corticosterone concentration began increasing again
after 144 hours indicating the treatment duration was less than a week using implants of
dexamethasone (Fig. 5.1).
Serum corticosterone (ng/ul)
6 -i
4 -
3 -
0 100 200 300
Time (hours)
400 500 600
Figure 5.1: The serum corticosterone concentration of emus treated with a single subcutaneous dexamethasone implants of either 6 mg (solid circle) or 12 mg (open circle). Values are means ± s.e.m.

Chapter 5 - The effect of dexamethasone on appetite, adiposity and 106 the hypothalamic expression of N P Y in female emus.
4A. Discussion
The preliminary experiment indicated that a single dose of dexamethasone between 6
and 12 m g decreased the corticosterone concentration, although the levels remained
detectable by the assay method employed. The results also indicate that using
subcutaneous implants the treatment was effective for approximately one week.
Trimedexil (dexamethasone trimethylacetate 5 mg/ml, Ilium Veterinary Products), was
chosen for use in the long-term dexamethasone treatment experiment. Trimedexil has
several advantages 1) it involves less handling stress as it is administered as a weekly
injection rather than weekly subcutaneous implants, and 2) it is a long-lasting liquid
preparation. This avoids problems relating to rapid clearance of the tablet form from
the circulation and also differences in the rate of release of the implants between birds
and over time. Both doses used in the preliminary experiment were equally capable of
depressing corticosterone and it was therefore decided to use a dose that fell between
those tested. As such, a dose of 10 mg/week was employed in the subsequent
experiment. There was no apparent difference in response to corticosterone between
males and females. Therefore, it was initially intended to include both males and
females in the long-term trial. However, once the experiment had commenced, three
birds in the male group were found to be females and another two died before the
experiment was completed. As a result there were not enough males to give meaningful
statistics and the male study group was abandoned. Prolonged treatment of catabolic
doses of dexamethasone can cause muscle wasting. To be certain that dexamethasone is
not catabolic when administered chronically at a dose of 10 mg/week, it is necessary to
determine if muscle wasting occurs. In the long-term trial this was assessed by
measuring the relative proportions of muscle and bone from a discrete region of the
carcass.

Chapter 5 - The effect of dexamethasone on appetite, adiposity and 107 the hypothalamic expression of N P Y in female emus.
Section B - Long-term dexamethasone treatment experiment
2B. Materials and methods
Experimental design
To test the hypotheses outlined in the introduction adult female emus were allocated
into a control group receiving saline injections weekly or a treatment group receiving
dexamethasone injections weekly. The m R N A expression of N P Y was quantified in the
mediobasal hypothalamus/preoptic area at the completion of the treatment period by
ribonuclease protection assay. The concentration of triiodothyronine, thyroxine,
luteinising hormone and insulin were measured at regular intervals over the course of
the experiment by radioimmunoassay. Blood glucose was measured using a hand held
glucometer. The association between changes in N P Y , hormone and appetite and
adiposity, were assessed by measuring food intake over the course of the experiment,
weighing and fat scoring the animals at several time-points and performing carcass
composition analysis at the completion of the experiment.
Animals
Twelve female emus, aged between one and two years were used. The birds were
allocated into two groups of similar average weight. All birds were penned
individually, with commercial emu feed available ad libitum (Glen Forrest
Stockfeeders), see Chapter 2. The experiment commenced at the beginning of March,
coinciding with the start of the breeding season.
Treatments
The groups comprised dexamethasone treated (n = 7) and saline treated (n = 5) animals.
Treatments consisted of weekly injections of 10 m g of Trimedexil (dexamethasone
trimethylacetate 5 mg/ml, Ilium Veterinary Products) for six weeks, given as a single 2
ml intramuscular injection. Saline treated birds experienced the same handling and
received a 2 ml intramuscular injection of saline. The experiment was performed over a
nine week period consisting of pretreatment (Day -14 through to Day 0) and treatment
(Day 0 through to Day 49) periods.
Feed intake
Feed intake was recorded over the course of the experiment from Day -14. Recordings
were carried out on three days per week to give a weekly feed intake value, as described

Chapter 5 - The effect of dexamethasone on appetite, adiposity and 108 the hypothalamic expression of N P Y in female emus.
in Chapter 2.
Live weight and fat scoring
Birds were weighed at three time-points over the course of the experiment (Day -14,
Day 14 and Day 49), immediately prior to bleeding and treatment. Fat scoring was
performed twice, at the commencement and completion of the experiment as described
in Chapter 2.
Blood sampling
As described in Chapter 2, 20 ml blood samples were collected weekly, immediately
prior to treatment. A n additional blood sample was collected from all birds on Day 2.
After the blood glucose measurement, the remaining blood was dispensed into separate
tubes for serum and plasma collection.
Tissue collection
At the completion of the experiment (Day 49), birds were bled and the blood glucose
concentration was recorded prior to the animals being euthanased with Lethabarb as
described in Chapter 2. The brain was removed and the hypothalamus and preoptic area
collected for R N A extraction as described in Chapter 2.
Carcass composition
Carcass composition analysis was performed as described in Chapter 2. The weights of
the subcutaneous adipose, visceral adipose and total adipose depots, and the liver, heart
and ovary were recorded for all birds. To assess the degree of muscle catabolism after
skinning and subcutaneous adipose tissue removal the total weight of the area between
the hip and knee was measured for the left leg. The individual contributions of muscle
and bone to this weight were then determined.
Ribonuclease Protection Assay (RPA)
R N A was extracted as described in Chapter 2. The ribonuclease protection assay was
performed on total R N A extracted from the region containing the mediobasal
hypothalamus and the preoptic area, using the R P A III kit (Ambion) as described in
Chapter 2. The m R N A expression of N P Y and p-actin were determined using the N I H
Image program version 1.61. The sample number is one less for each group (ie
Chapter 5 - The effect of dexamethasone on appetite, adiposity and 109 the hypothalamic expression of N P Y in female emus.
dexamethasone n=6, saline n=4), as a sample from each group was lost after collection.
Hormones and metabolites
Radioimmunoassay's were performed for corticosterone, insulin, triiodothyronine,
thyroxine, and luteinising hormone, as described in Chapter 2. immediately after each
bleed, measurements were made of blood glucose using a hand held blood glucose
meter as described in Chapter 2.
Data and statistical analysis
The expression of N P Y was determined as a value relative to the expression of P-actin
for each sample. The carcass composition data for each tissue was expressed as a
percentage of the live weight of the animal. For the ovary, the value was expressed as a
proportion of the ovary weight in grams, of the live weight in kilograms. Any effects of
dexamethasone to promote muscle catabolism were assessed by determining the
percentages of muscle and bone of the weight of the region between the hip and knee.
The significance of differences at each time-point was determined by Mann-Whitney U
tests as described by Siegel (1956) using the Statview™ 512+ program (1986). This test
was judged to be the most appropriate as two independent groups were sampled from,
the sample size was small (nl < 7, n2 < 5) and the number of birds in each group was
not equal. The significance of differences over time within groups was determined
using Friedman two-way analysis of variance by ranks as described by Siegel (1956).
This test was judged to be the most appropriate as the samples were related and more
than two time-points were involved. The Chi-Square test of independence (McGrath,
1997) was used to determine the significance of any differences in fat score observed
between groups at each time-point. This test was judged to be the most appropriate as
the data consisted of frequencies in discrete categories, and two independent groups
were under comparison. The Wilcoxon matched-pairs signed-ranks test (Siegel, 1956)
was used to determine the significance of any differences in fat score over time within
each group. This test was judged to be the most appropriate as the samples were related
and sample size was small (dexamethasone n = 4, saline n = 3). The results are
indicated as the mean ± s.e.m.

Chapter 5 - The effect of dexamethasone on appetite, adiposity and 110 the hypothalamic expression of N P Y in female emus.
3B. Results
Ribonuclease Protection Assay (RPA)
The expression of NPY mRNA did not differ between the dexamethasone treated (n =
6) and saline treated (n = 4) groups after 49 days of treatment (Fig. 5.2 and Table 5.1).
Table 5.1: The intensity of the mRNA expression of NPY relative to P-actin of female emus treated with either dexamethasone or saline for 49 days.
mRNA Dexamethasone Saline
(n = 6) (n = 4)
NPY/p-actin 0.51 ± 0.054 0.54 ± 0.054
Values are means ± s.e.m
Figure 5.2: The N P Y m R N A expression of female emus treated with either dexamethasone (lanes 1-6) or saline (lane 7-10) for 49 days. Lane 11 and 12 contain the P-actin and N P Y sense strand controls, respectively. Double-ended arrows indicate the position of the N P Y (a) and P-actin (b) bands in the samples. Single-headed arrows indicate the position of the N P Y (c) and P-actin (d) bands in the sense
strand controls.

Chapter 5 - The effect of dexamethasone on appetite, adiposity and 111 the hypothalamic expression of N P Y in female emus.
Carcass composition
There was no difference in the weight of the subcutaneous or visceral adipose depots,
total adiposity, the heart or the hip to knee region as a percentage of live weight. The
weight of muscle and bone as a percentage of the hip to knee weight did not differ
between the groups (Table 5.2). The weight of liver as a percentage of live weight was
greater in the dexamethasone treated birds (p = 0.009). The proportion of ovary to live
weight was lower in the dexamethasone treated birds (p = 0.009) (Table 5.2).
Table 5.2: The carcass composition of female emus treated with either dexamethasone or saline for 49 days.
Parameter
Subcutaneous adipose (%)
Visceral adipose (%)
Total adipose (%)
Liver (%)
Ovary (g/kg lwt)
Heart (%)
Hip to knee (%)
Muscle (% of hip to knee wt)
Bone (% of hip to knee wt)
Values are means ± s.e.m. An :
Dexamethasone
(n = 7)
9.3 ± 1.47
5.7 ±0.73
15.0 ±1.98
2.18 ±0.124*
0.28 ±0.081*
1.09 ±0.059
15.9 ±0.74
76.2 ± 2.62
20.7 ± 0.88
Saline
(n = 5)
13.1 ±1.98
5.5 ± 0.43
18.6 ±2.35
1.35 ±0.085*
3.70 ±1.328*
1.00 ±0.043
15.4 ± 0.76
80.5 ±1.04
19.4 ±1.05
* indicates significant difference between groups (p = 0.009).

Chapter 5 - The effect of dexamethasone on appetite, adiposity and 112 the hypothalamic expression of N P Y in female emus.
Feed intake
Feed intake was lower in the group treated with dexamethasone during W e e k 5 and
W e e k 6 (p = 0.024 and p = 0.024 respectively) (Fig. 5.3). Within groups feed intake
differed over time (a decreasing trend in the final three weeks) in the dexamethasone
treated group (p < 0.01). Over time feed intake did not differ in the saline treated group.
Average daily feed intake (kg)
1.0 1
0.9 j
0.8 ] -r
0.7 j -r
0.6 j f T i n "f W~}1 0.5 j I L I j IT
04 I I '' ' 1 I -' ; i i [
0.3 j j | ;
02 1 ! . I ^ i : i' • j! :
0.1 j
°-° TTTTTT Week
Figure 5.3: Average daily feed intake per week of female emus treated with either saline (black bar) or dexamethasone (grey bar) for 49 days. Values are means ± s.e.m. A n * indicates significant difference between groups (p = 0.024).

Chapter 5 - The effect of dexamethasone on appetite, adiposity and 113 the hypothalamic expression of N P Y in female emus.
Live weight and fat scores
Live weight did not differ between groups at Day -14 or Day 14. At Day 49 live
weight was higher in the saline treated group (p = 0.024) (Fig. 5.4). Within groups the
live weight increased over time in the saline treated group (p = 0.039). Over time live
weight did not differ within the dexamethasone treated group.
Live weight (kg)
50
45
40
35
30
25
20
15
10
5
0 -14 14 49
Day
Figure 5.4: Live weight of female emus treated with either saline (black bar) or dexamethasone (grey bar) for 49 days, on Day -14, Day 14 and Day 49. Values are means ± s.e.m. An * indicates significant difference between groups (p = 0.024).
I_ JkX X

Chapter 5 - The effect of dexamethasone on appetite, adiposity and 114 the hypothalamic expression of N P Y in female emus.
The fat score decreased in the group treated with dexamethasone after 49 days of
treatment (p = 0.023). The fat score showed a trend to increase in the group treated
with saline after 49 days of treatment (p = 0.05). However, the fat scores did not differ
on Day 0 or Day 49 between the treatment groups (Table 5.3).
Table 5.3: The fat scores of female emus on Day 0 and Day 49 of treatment with either dexamethasone or saline.
Day Dexamethasone Saline
(n = 7) (n = 5)
0 3.29 ±0.474 2.80 ±0.583
49 2.14 ±0.634 4.00 ±0.548
Values are means ± s.e.m.

Chapter 5 - The effect of dexamethasone on appetite, adiposity and the hypothalamic expression of N P Y in female emus.
Hormones and metabolites
The serum insulin concentration did not differ between or within treatment groups at
any time point (Fig. 5.5).
2.8
2.6
2.4
2.2
2.0
1.8
1.6
1.4
1.2
1.0
0.8
Serum insulin (ng/ml)
•14 14 —r-
21
— i —
28 35 —r-42
— i
49
Day
Figure 5.5: Serum insulin concentration of female emus treated with either saline (open circle) or dexamethasone (solid circle) for 49 days. Values are means ± s.e.m.

Chapter 5 - The effect of dexamethasone on appetite, adiposity and 116 the hypothalamic expression of N P Y in female emus.
The blood glucose concentration did not differ between the groups before treatment
commenced (Day -14, Day -7 and Day 0). Following the commencement of
dexamethasone treatment (Day 0), the blood glucose concentration was higher in the
group treated with dexamethasone (p < 0.003) (Fig. 5.6). Over time the blood glucose
concentration increased in the group treated with dexamethasone (p < 0.001). Over time
the blood glucose concentration decreased in the group treated with saline (p < 0.01).
Blood glucose (mmol/L)
15
14
13
12
11
10
9
8
7
6
5 -14 -7 0 7 14 21 28 35 42 49
Day
Figure 5.6: Blood glucose concentration of female emus treated with either saline (open circle) or dexamethasone (solid circle) for 49 days. Values are means ± s.e.m. A n * indicates significant difference
between groups (p < 0.01).

Chapter 5 - The effect of dexamethasone on appetite, adiposity and 117 the hypothalamic expression of N P Y in female emus.
The serum thyroxine concentration was lower in the group treated with dexamethasone
than the group treated with saline from Day 7 until the completion of the experiment (p
= 0.001) (Fig 5.7). Within groups thyroxine decreased over time in the dexamethasone,
but not the saline treated group (p < 0.001).
Serum thyroxine (nmol/L)
i 1 1 1 1 1 1 1 1 i
-14 -7 0 7 14 21 28 35 42 49
Day
Figure 5.7: Serum thyroxine concentration of female emus treated with either saline (open circle) or dexamethasone (solid circle) for 49 days. Values are means ± s.e.m. A n * indicates significant difference between groups (p = 0.001).

Chapter 5 - The effect of dexamethasone on appetite, adiposity and 118 the hypothalamic expression of N P Y in female emus.
The serum triiodothyronine concentration was higher in the dexamethasone than the
saline treated group on Day 7 and Day 14 (p = 0.009 and p = 0.015 respectively) (Fig.
5.8). Within the dexamethasone treated group triiodothyronine differed over time (p <
0.02). Over time there was no difference within the saline treated group.
Serum triiodothyronine (ng/ml)
2.0 '
1.8 '
1.6
1.4
1.2
1.0
0.8 '
0.6 '
0.4 '
0.2 '
0.0 -14 -7 0 7 14 21 28 35 42 49
Day
Figure 5.8: Serum triiodothyronine concentration of female emus treated with either saline (open circle) or dexamethasone (solid circle) for 49 days. Values are means ± s.e.m. An * indicates significant difference between groups (p < 0.05).

Chapter 5 - The effect of dexamethasone on appetite, adiposity and 119 the hypothalamic expression of N P Y in female emus.
The triiodothyronine/thyroxine (T3/T4) ratio increased over time in the group treated
with dexamethasone, but did not change within the group treated with saline (p <
0.001). The T3/T4 ratio was higher in the group treated with dexamethasone than the
group treated with saline from Day 2 until the completion of the experiment (p < 0.05)
(Fig. 5.9).
T3/T4 ratio (1 x 10"3)
10.0 '
9-0 • *
8.0 '
7.0 '
-14 -7 0 7 14 21 28 35 42 49
Day
Figure 5.9: T3/T4 ratio of female emus treated with either saline (open circle) or dexamethasone (solid circle) for 49 days. Values are means ± s.e.m. An * indicates significant difference between groups (p <
0.05).

Chapter 5 - The effect of dexamethasone on appetite, adiposity and the hypothalamic expression of N P Y in female emus.
120
The serum luteinising hormone concentration was higher in the group treated with
dexamethasone than the group treated with saline at D a y 14 and D a y 21 (p = 0.037 and
p = O.OOlrespectively) (Fig. 5.10). There was no difference in the luteinising hormone
concentration over time within either group.
Serum luteinising hormone (ng/ml)
4.0
3.5
3.0
2.5
2.0
1.5
1.0
0.5
0.0 -14 14 21 28 35 42 49
Day
Figure 5.10: Serum luteinising hormone concentration of female emus treated with either saline (open circle) or dexamethasone (solid circle) for 49 days. Values are means ± s.e.m. An * indicates significant difference between groups (p < 0.05).

Chapter 5 - The effect of dexamethasone on appetite, adiposity and 121 the hypothalamic expression of N P Y in female emus.
The serum corticosterone concentration of the group treated with dexamethasone was
higher at Day -14, and lower from Day 2 until the completion of the experiment (p =
0.04 and p < 0.02 respectively) (Fig. 5.11). Within groups the corticosterone
concentration decreased over time in the group treated with dexamethasone, but did not
change in the group treated with saline (p < 0.001).
Serum corticosterone (ng/ul)
14
12
10
8
6
4
2
0 -14 -7 0 7 14 21 28 35 42 49
Day
Figure 5.11: Serum corticosterone concentration of female emus treated with either saline (open circle) or dexamethasone (solid circle) for 49 days. Values are means ± s.e.m. A n * indicates significant
difference between groups (p < 0.05).

Chapter 5 - The effect of dexamethasone on appetite, adiposity and 122 the hypothalamic expression of N P Y in female emus.
4B. Discussion
The results presented here do not support the hypotheses that prolonged treatment with
dexamethasone increases N P Y gene expression, or is associated with increased appetite
and adiposity. The hypothesis that dexamethasone treatment would change the
concentration of metabolic hormones is partially supported by the results, with
thyroxine decreased and blood glucose increased as predicted. The remaining
hormones measured did not change in the manner hypothesised. As N P Y is a potent
appetite stimulant the failure of dexamethasone to increase N P Y gene expression is
most likely responsible for the lack of increase in appetite. The failure to increase
adiposity m a y be due to the absence of both increased appetite and increased insulin
concentrations, and therefore adipogenesis. This implies that in the emu
dexamethasone treatment does not induce changes that facilitate increases in appetite or
adiposity. As such, long-term dexamethasone treatment is not a viable option for
maintaining or increasing adiposity in emus during periods when adipose stores are
mobilised.
Dexamethasone treatment also failed to depress triiodothyronine or luteinising
hormone. This could indicate that the dose used was too low. Muscle catabolism was
not observed following dexamethasone treatment, indicating that the dose of
dexamethasone given did not induce a catabolic state as is observed when administered
at high doses. The lower concentrations of corticosterone in the dexamethasone treated
birds from Day 2, indicates that the dosage did suppress the adrenocortical axis. It must
be noted that the significantly higher concentration of corticosterone prior to the
commencement of treatment (Day -14 and Day -7) in the dexamethasone treated group
resulted from the allocation process to obtain similar starting live-weights in both
groups. Three of the birds allocated to the dexamethasone treatment group were
extremely stressed by handling resulting in their corticosterone concentrations being
very high, and raising the group average. The thyroxine concentration was decreased
and the blood glucose concentration increased by dexamethasone treatment, as
hypothesized. However, as the thyroxine concentration decreased without increasing
adiposity it can be argued that decreased thyroxine was not associated with depression
of metabolic rate. The absence of any differences between the groups in their
triiodothyronine concentrations and adiposity despite significantly decreased thyroxine
and an increased T3/T4 ratio in the dexamethasone treated group indicates that

Chapter 5 - The effect of dexamethasone on appetite, adiposity and 123 the hypothalamic expression of N P Y in female emus.
triiodothyronine may be more important than thyroxine in controlling metabolism in the
emu.
There was a tendency for the total and subcutaneous adiposity to be lower in the
dexamethasone treated group possibly due to the decreased feed intake observed in this
group over the final two weeks of the experiment. Dexamethasone treatment resulted in
an increased liver percentage of live-weight, most likely due to lipid infiltration.
Finally dexamethasone treatment was associated with suppression of ovarian
development. The depression of ovarian development may not have been a direct
effect, but rather a consequence of the suppressed appetite, weight loss and decreasing
adiposity during the final stage of the experiment in the dexamethasone treated group.
This is supported by the lack of any sustained differences in luteinising hormone
concentrations between the dexamethasone and saline treated groups over the course of
the experiment.
These results have two implications. First, that under these conditions NPY does not
play a major role in the control of appetite in the emu, as diminished appetite in the
dexamethasone treated birds at the completion of the experiment was not associated
with decreased N P Y gene expression. Indeed, it has been illustrated in mice that
multiple redundant pathways exist that control appetite in the absence of N P Y (Erickson
et al, 1996). Therefore, it is possible that genes other than N P Y could be of greater
importance to the control of appetite in emus under these conditions. Genes that could
be of greater importance than N P Y to the control of appetite in the emu include
orexin/hypocretin, proopiomelanocortin ( P O M C ) , agouti-related protein (AGRP),
cocaine and amphetamine-regulated transcript ( C A R T ) and corticotrophin-releasing
hormone (CRH). Second, as this experiment was performed during the period where
appetite is decreasing at the commencement of the breeding season, it is possible that
some breeding season or photoperiod-related factor was inhibiting the response of N P Y
to dexamethasone and also possibly its action to stimulate appetite.
There is evidence that the responsiveness of appetite to stimulating factors changes
seasonally in birds. One such factor that increases appetite via N P Y is prolactin. In
non-breeding ring doves prolactin increases appetite (Buntin & Figge, 1988; Hnasko &
Buntin, 1993; Buntin et al, 1999). In the ring dove prolactin increases appetite by

Chapter 5 - The effect of dexamethasone on appetite, adiposity and 124 the hypothalamic expression of N P Y in female emus.
increasing NPY-immunoreactive cell bodies in the infundibular region of the
hypothalamus (Strader & Buntin, 2001). In contrast, prolactin administration to turkeys
during the reproductive period either decreases or has no effect on appetite (Denbow,
1986). As such, the diminished appetite that is observed during the breeding season in
the e m u could indicate inhibition of either NPY's response to prolactin, or of NPY's
ability to increase appetite. The inability of dexamethasone to increase N P Y m R N A
gene expression during this experiment could also be due to inhibition of NPY's
response to appetite stimulants via the action of photoperiod-related factors. The
potential for factors to inhibit NPY's response to appetite stimulants during the breeding
season will be investigated in the following chapter. I will investigate N P Y expression
during incubation in the male emu, a model that is characterized by elevated prolactin
concentrations.

125
Chapter 6
Changes in food intake, adiposity and the hypothalamic
expression of N P Y and VIP in response to incubation.
1. Introduction
2. Materials and Methods
3. Results
4. Discussion
Page
126
129
132
143

Chapter 6 - Changes in food intake, adiposity and the hypothalamic expression of N P Y and VIP in response to incubation
126
1. Introduction
Incubating male emus exhibit a much greater reduction in appetite and adiposity than their
non-incubating counterparts or females during the breeding season (Blake, 1996). The
decreased appetite of the incubating male is a form of anorexia. Naturally occurring
anorexia is observed in many species during activities such as, hibernation, incubation and
migration. This state of voluntary fasting occurs via a "sliding set point" for energy
reserves that allows the animal to maintain a depressed appetite, despite decreasing energy
reserves, during periods when appetite would hinder more important activities (Mrosovsky
& Sherry, 1980).
In almost all species studied, food restriction or starvation increases NPY gene expression
and corticosterone concentrations (Boswell et al, 1999; McShane et al, 1993; Chua et al,
1991; Dallman et al, 1999). In humans, increased N P Y gene expression is also observed
during anorexia nervosa (St0ving et al, 1999). There are a number of pathways that could
be involved in the control of appetite during incubation in the emu. For example,
pathways involving cocaine and amphetamine-regulated transcript (CART),
proopiomelanocortin ( P O M C ) , corticotrophin-releasing hormone (CRH),
orexin/hypocretin and agouti-related protein (AGRP), are involved in the control of
appetite and adiposity in other species (Mizuno et al, 1997; Ollmann et al, 1997; Sakurai et
al, 1998; Heinrichs & Richard, 1999; Vrang et al, 1999). In this experiment it was decided
to focus on the principal pathway involving N P Y as it is well characterised for a range of
species including several avian species. However, the expression of N P Y m R N A during
the period of voluntary starvation, which accompanies incubation in many avian species,
has not been investigated.
The onset of incubation behaviour in avian species is triggered by a rise in vasoactive
intestinal polypeptide (VIP) (Sharp et al, 1989). VIP stimulates prolactin release, inducing
and maintaining incubation behaviour (Chaiseha & El Halawani, 1999; El Halawani et al,
1996; Sharp et al, 1989). Prolactin has been shown to affect appetite, but its effects may
be dependent upon reproductive status. Prolactin increases appetite in ring doves (non-
breeding), and decreases appetite in laying turkeys (Denbow, 1986; Buntin & Figge, 1988;
Hnasko & Buntin, 1993; Buntin et al, 1999). In non-breeding ring doves, the central
administration of prolactin increases the number of NPY-immunoreactive cell bodies

Chapter 6 - Changes in food intake, adiposity and the hypothalamic 127 expression of N P Y and VIP in response to incubation
indicating that the stimulation of appetite by prolactin is mediated at least partially by NPY
(Strader & Buntin, 2001). During the breeding season, prolactin may be prevented from
affecting appetite by photoperiod-related factors. These photoperiod-related factors could
act to prevent prolactin's actions in several ways. First, in contrast to the non-breeding
birds, N P Y gene expression may not increase during the breeding period in response to
elevated prolactin concentrations (Strader & Buntin, 2001). Second, N P Y gene expression
might increase in response to elevated prolactin concentrations, but its ability to increase
appetite inhibited by other factors generated by the metabolic changes that promote energy
sparing mechanisms during incubation. One such factor could be corticotrophin-releasing
hormone (CRH). C R H acts centrally to inhibit the effects of N P Y on appetite (McCarthy
et al, 1993; Menzaghi et al, 1993). C R H also stimulates adrenocorticotrophin ( A C T H )
secretion, and this stimulates the release of glucocorticoids from the adrenal gland
(Kacsoh, 2000). Experimental treatments that increase C R H immunoreactivity or gene
expression in the hypothalamus, and the administration of C R H receptor agonists or C R H ,
are associated with increased concentrations of corticosterone (Gupta & Brush, 1998; Grill
et al, 2000; Bruijnzeel et al, 2001; Helmreich et al, 2001).
Metabolic changes may also be directly involved in the control of appetite during
incubation. In incubating birds increased glucagon and decreased insulin concentrations
promote lipolysis (Chieri et al, 1972; Cherel et al, 1988). The lipid fuels supplied by the
catabolism of adipose reserves decrease the utilisation of glucose and maintain a constant
blood glucose concentration (Groscolas & Rodriguez, 1981; Le M a h o et al, 1981).
Incubation is also associated with lower triiodothyronine and thyroxine concentrations,
which decrease metabolic rate and thereby spare energy reserves (Cherel et al, 1988;
Groscolas & Leloup, 1989). In emus, incubation is associated with increased glucagon and
decreased insulin and thyroxine concentrations (Van Cleeff, 2001). As such, the hormonal
balance of the incubating emu is consistent with a catabolic state. However, comparisons
of hormone concentrations between non-incubating and incubating male emus during the
breeding season have not been made. Also, differences in hormone concentrations
between non-incubating and incubating male emus may partially explain the greater degree
of appetite suppression in the incubating emu.
An experiment was designed to identify associations between metabolic hormone

Chapter 6 - Changes in food intake, adiposity and the hypothalamic 128 expression of N P Y and VIP in response to incubation
concentrations and neuropeptides at the hypothalamic level, and the decrease in appetite
during incubation. The following hypotheses were formulated:
1. N P Y gene expression in the hypothalamus will be higher in incubating than in non-
incubating male emus,
2. Hypothalamic VIP gene expression and prolactin concentration will be higher in
incubating than in non-incubating male emus,
3. Hormonal changes consistent with a catabolic state (increased glucagon and decreased
insulin concentrations), and reduced resting metabolic rate (decreased thyroxine and
decreased or unchanged triiodothyronine concentrations) will be observed in
incubating emus, with blood glucose levels maintained at a constant level, and finally,
4. The concentration of corticosterone will be higher in the incubating than the non-
incubating male emus.

Chapter 6 - Changes in food intake, adiposity and the hypothalamic 129 expression of N P Y and VIP in response to incubation
2. Materials and Methods
Experimental design
To test the hypotheses outlined above male emus were allocated into two groups, one
group was given eggs and allowed to incubate for 6 weeks. The second group received no
visual or tactile contact with eggs and constituted the control group. At the completion of
the experiment the region containing the mediobasal hypothalamus/preoptic area was
collected and R N A was extracted. The expression of m R N A for N P Y and VIP in the
mediobasal hypothalamus/preoptic area were quantified by ribonuclease protection assay.
In addition food intake was measured over the course of the experiment to determine if any
associations existed with the expression of N P Y m R N A . The concentration of prolactin,
insulin, glucagon, thyroxine, triiodothyronine and corticosterone were measured over the
course of the experiment by radioimmunoassay. The blood glucose concentration was
measured using a glucometer. In addition, carcass composition analysis was performed to
determine the extent of catabolism of adipose and selected muscle tissue.
Animals
Eleven sexually mature male emus were penned individually and given ad libitum access
to commercial breeder pellets (Glen Forrest Stockfeeds) as described in Chapter 2.
Treatments
From June, five birds from the incubating group were given an egg every two to three days
until they had nine eggs or commenced incubation. The eggs given to the birds were from
the previous breeding season and had been blown and refilled with sand to their original
weight to ensure that enough eggs were available for the experiment and prevent problems
with them going rotten. The eggs were then painted with a non-odorous paint
approximating the original shell colour to account for any leaching of colour that had
occurred. The birds were allowed to incubate for six weeks. A group of six birds were
used as the controls.
Feed intake
Feed intake was determined during W e e k 6 of incubation. A control bird was matched to
each incubator for feed intake measurement. The birds were slaughtered together at the
end of W e e k 6 of incubation so that effects of changing photoperiod on feed intake

Chapter 6 - Changes in food intake, adiposity and the hypothalamic " 130 expression of N P Y and VIP in response to incubation
between paired individuals were accounted for and differences in appetite observed could
be attributed to reproductive status.
Blood sampling
Once a week from W e e k 3 of incubation a 20 ml blood sample was collected, as described
in Chapter 2, from the incubator and its matched control.
Tissue collection
Following euthanasia the mediobasal hypothalamus and the preoptic area were excised as
described in Chapter 2 for R N A extraction and R P A analysis.
Carcass composition
The carcass composition was carried out as described in Chapter 2. The gastrocnemius
lateralis from the left leg of each bird was also dissected out and weighed to determine if
protein catabolism contributed to the loss of live weight observed in incubating birds.
RPA analysis
R N A was extracted as described in Chapter 2. The R P A was performed on total R N A
extracted from the region containing the mediobasal hypothalamus and the preoptic area,
using the R P A III kit (Ambion) as described in Chapter 2. The m R N A expression of N P Y ,
VIP and P-actin were determined by measuring the intensity of the bands for each gene
visualised on a 1 x T B E , 5 % acrylamide gel. The band intensity was determined using the
N I H Image program version 1.61.
Hormones and metabolites
Radioimmunoassays were performed for insulin, triiodothyronine, thyroxine, prolactin,
corticosterone and glucagon for all samples as described in Chapter 2. Immediately after
each bleed measurements were made of blood glucose using a hand held blood glucose
meter (Precision Q.I.D, Medisense) as described in Chapter 2.
Data and statistical analysis
The expression of VIP and N P Y were determined as values relative to the expression of (3-
actin for each sample. For the carcass composition analyses each tissue weight was

Chapter 6 - Changes in food intake, adiposity and the hypothalamic 131 expression of N P Y and VIP in response to incubation
converted to a percentage of the live weight of the animal. The significance of any
differences observed between incubating and non-incubating male emus was determined at
each time-point using Mann-Whitney U tests as described by Siegel (1956) using the
Statview™ 512+ program (1986). The significance of trends over time within each group
was determined using the Friedman two-way analysis of variance by ranks as described by
Siegel (1956). Non-parametric statistical analysis was judged to be the most appropriate as
two independent groups were sampled from, the sample size was small, and the number of
birds in each group was not equal. The results are indicated as the mean ± s.e.m.

Chapter 6 - Changes in food intake, adiposity and the hypothalamic
expression of N P Y and VIP in response to incubation
132
3. Results
RPA
The level of VIP m R N A expression was higher in the incubating males and they also
displayed a trend for elevated N P Y m R N A expression (p = 0.026 and p = 0.165
respectively) (Fig. 6.1 and Table 6.1).
Table 6.1: The m R N A expression of N P Y and VIP relative to P-actin of incubating (n=5) and non-
incubating (n=6) male emus.
mRNA Incubators Non-incubators
NPY/|3-actin
VEP/p-actin
0.69 ± 0.046
0.62 ± 0.046*
0.53 ± 0.083
0.47 ± 0.055*
Values are means ± s.e.m. A n * indicates significant difference between groups (p = 0.026).
Figure 6 1- The N P Y and VIP m R N A expression of incubating (lanes 1-5) and non-incubating (lanes 6-11) male emus determined using the R P A technique. Lanesl2, 13 and 14 contain respectively, the sense strand
positive controls for emu p-actin, N P Y and VIP. Arrows indicate the position of the bands for VIP (a, d),
N P Y (b, e) and P-actin (c, f) from samples and sense strand controls respectively.

Chapter 6 - Changes in food intake, adiposity and the hypothalamic 133 expression of N P Y and VIP in response to incubation
Food intake, carcass composition and live weight
Food intake, live weight and percentage total fat, subcutaneous fat and visceral fat weights
of live weight and the percentage liver weight of live weight were all lower in the
incubating group (p = 0.002, p = 0.015, p = 0.009, p = 0.015, p = 0.041 and p = 0.041
respectively) (Table 6.2). The percentage of the gastrocnemius lateralis muscle of live
weight was higher in the incubating group (p = 0.026) (Table 6.2).
Table 6.2: The total feed intake over Week 6 of incubation and the body composition of incubating and non-
incubating male emus at the end of Week 6 of incubation.
Parameter Incubators Non-incubators
Total feed intake (kg) 0.20 ± 0.148* 6.93 ± 1.581*
Live weight (kg) 35.9 ± 1.95* 41.8 ± 1.03*
Subcutaneous adipose (%) 11.7 ±2.14* 17.6 ±1.11*
Visceral adipose (%) 4.09 ±0.889* 5.93 ±0.518*
Total adipose (%) 15.8 ± 2.91* 23.5 ± 1.24*
Liver (%) 1.17 ±0.152* 1.74 ±0.152*
Gastrocnemius lateralis muscle (%) 1.53 ± 0.065* 1.37 ± 0.042*
Values are means ± s.e.m. An * indicates significant difference between groups (p < 0.05).

Chapter 6 - Changes in food intake, adiposity and the hypothalamic 134 expression of N P Y and VIP in response to incubation
Hormones and metabolites
The serum prolactin concentration was higher in the incubating males during Week 3,
Week 4, Week 5 and Week 6 (p = 0.004, p = 0.048, p = 0.002 and p = 0.002 respectively).
Within groups there were no difference in prolactin concentration over time (Fig. 6.2).
Serum prolactin (ng/ml)
14
12
10
8
6
4
2
2 3 4 5 6 7
Week
Figure 6.2: The serum prolactin concentration from Week 3 to Week 6 of incubation of incubating (solid circle) and non-incubating (open circle) male emus. Values are means ± s.e.m. An * indicates significant difference between groups (p < 0.05).
T 1 1 r

Chapter 6 - Changes in food intake, adiposity and the hypothalamic 135 expression of N P Y and VIP in response to incubation
The blood glucose concentration did not differ between or within either group at any time
point (Fig. 6.3).
Blood glucose (mmol/L)
8.5
8.0
7.5
7.0
6.5
6.0 2 3 4 5 6 7
Week
Figure 6.3: Mean blood glucose concentrations from Week 3 to Week 6 of incubation of incubating (solid circle) and non-incubating (open circle) male emus. Values are means ± s.e.m.

Chapter 6 - Changes in food intake, adiposity and the hypothalamic 136 expression of N P Y and VIP in response to incubation
There was a tendency for the serum glucagon concentration to be higher at all time points
in the incubating group. Serum glucagon concentrations were higher in the incubating
group, at W e e k 4 and W e e k 5 of incubation (p = 0.028 and p = 0.032 respectively). Within
groups glucagon concentrations did not differ over time (Fig. 6.4).
Plasma glucagon (pg/ml)
250
200
150
100
50
2 3 4 5 6 7
Week
Figure 6.4: Mean serum glucagon concentrations from Week 3 to Week 6 of incubation of incubating (solid circle) and non-incubating (open circle) male emus. Values are means ± s.e.m. A n * indicates significant
difference between groups (p < 0.05).
T 1 1 1 1

Chapter 6 - Changes in food intake, adiposity and the hypothalamic expression of N P Y and VIP in response to incubation
137
The serum insulin concentration did not differ between or within groups at any time point
(Fig. 6.5).
Serum insulin (ng/ml)
1.4
1.3
1.2
1.1
1.0
0.9
0.8
0.7
0.6
Week
Figure 6.5: Mean serum insulin concentrations from Week 3 to Week 6 of incubation of incubating (solid circle) and non-incubating (open circle) male emus. Values are means ± s.e.m.

Chapter 6 - Changes in food intake, adiposity and the hypothalamic expression of N P Y and VIP in response to incubation
138
The insulin/glucagon ratio was higher in the non-incubating males at W e e k 4 and W e e k 5
of incubation (p = 0.028 and p = 0.032 respectively). There was also a tendency for the
ratio to be higher in the non-incubating males at W e e k 3 (p = 0.057). Within groups the
ratio did not differ over time for either group (Fig. 6.6).
Insulin/Glucagon ratio
45
40
35
30
25
20
15
10
5
4 5
Week
Figure 6.6: Mean serum insulin/glucagon ratio from Week 3 to Week 6 of incubation of incubating (solid circle) and non-incubating (open circle) male emus. Values are means ± s.e.m. An * indicates significant difference between groups (p < 0.05).

Chapter 6 - Changes in food intake, adiposity and the hypothalamic 139 expression of N P Y and VIP in response to incubation
The serum triiodothyronine concentration did not differ between or within groups at any
time point (Fig 6.7).
Serum triiodothyronine (ng/ml)
0.6
0.5
0.4
0.3
0.2
0.1
°-° 2 3 4
Week
Figure 6.7: Mean serum triiodothyronine concentrations from Week 3 to Week 6 of incubation of incubating (solid circle) and non-incubating (open circle) male emus. Values are means ± s.e.m.

Chapter 6 - Changes in food intake, adiposity and the hypothalamic 140 expression of N P Y and VIP in response to incubation
The serum thyroxine concentration was higher in the non-incubating males at each
sampling point (p = 0.004) (Fig. 6.8). Within groups there was an effect of time in the
incubating group (p < 0.05). Over time the thyroxine concentration did not change in the
non-incubating group.
Serum thyroxine (nM/L)
5000 -
4000
3000
2000
1000
0' 2 3 4 5 6 7
Week
Figure 6.8: Mean serum thyroxine concentrations from Week 3 to Week 6 of incubation of incubating (solid circle) and non-incubating (open circle) male emus. Values are means ± s.e.m. An * indicates significant
difference between groups (p < 0.05).
f

Chapter 6 - Changes in food intake, adiposity and the hypothalamic 141 expression of NPY and VIP in response to incubation
The triiodothyronine/thyroxine (T3/T4) ratio did not differ between or within groups at any
time point (Fig. 6.9).
T3/T4 ratio (1 x 10"4)
14.0 "
12.0 "
10.0 "
8.0 '
6.0 "
4.0 "
2.0 '
0 ' 2 3 4 5 6 7
Week
Figure 6.9: The T3/T4 ratio from Week 3 to Week 6 of incubation of incubating (solid circle) and non-incubating (open circle) male emus. Values are means ± s.e.m.

Chapter 6 - Changes in food intake, adiposity and the hypothalamic 142 expression of N P Y and VIP in response to incubation
The serum corticosterone concentration tended to be higher at all time points in the
incubating emus (Fig. 6.10). This trend was significant at Week 3 and Week 6 (p = 0.028
and p = 0.048 respectively). Within groups the concentration of corticosterone did not
differ over time for either group.
Serum corticosterone (ng/ul)
2.5 "
2.0 "
1.5
1.0 '
0.5
2 3 4 5 6 7
Week
Figure 6.10: Mean serum corticosterone concentrations from Week 3 to Week 6 of incubation of incubating (solid circle) and non-incubating (open circle) male emus. Values are means ± s.e.m. A n * indicates
significant difference between groups (p < 0.05).

Chapter 6 - Changes in food intake, adiposity and the hypothalamic 143 expression of N P Y and VIP in response to incubation
4. Discussion
The hypothesis that hypothalamic N P Y gene expression is higher in incubating than non-
incubating emus is not supported by the results, although there was a tendency for higher
levels of expression in the incubating group. The results support the hypothesis that
hypothalamic VIP expression and circulating prolactin levels are increased in incubating
emus. This suggests that as with other avian species, in emus, VIP and prolactin are
involved in the maintenance of incubation behaviour (Mauro et al, 1989; Sharp et al,
1989). The hypothesis that emus enter a catabolic state during incubation, with increased
glucagon and thyroxine concentrations and a tendency for decreased insulin concentrations
is supported by the results. The hypothesis that corticosterone concentration is higher in
incubating emus is also supported, with a tendency for higher concentrations in the
incubators throughout the study period and significantly higher concentrations at two of
these time points.
The absence of a significant difference in NPY expression between incubating and non-
incubating emus during the breeding season raises some interesting possibilities. First,
N P Y expression may be at high levels in both incubators and non-incubators during the
breeding period due to diminishing adipose reserves. If N P Y expression is high, the
diminished appetite during the breeding period is probably the result of inhibition of
appetite promotion by N P Y . A candidate for the role of N P Y inhibitor is corticotrophin-
releasing hormone (CRH) a centrally acting hormone that prevents N P Y increasing
appetite (McCarthy et al, 1993; Menzaghi et al, 1993). The higher concentration of
corticosterone in the incubating birds lends support to a role for C R H , as C R H
administration, increased C R H expression or immunoreactivity, and C R H receptor
stimulation are associated with increased corticosterone concentration (Gupta & Brush,
1998; Grill et al, 2000; Bruijnzeel et al, 2001; Helmreich et al, 2001). Alternatively, the
higher concentration of corticosterone in the incubating emus in this experiment may
reflect greater stress due to the animals being in negative energy balance. Second, the
ability of N P Y to respond to decreasing adipose reserves may be inhibited during the
breeding season. Higher concentrations of prolactin in the incubating birds were not
associated with elevations in the level of N P Y m R N A expression. This result is in contrast
to the finding that N P Y was elevated in ring doves administered prolactin during the non-
breeding period (Strader & Buntin, 2001). The absence of significant differences in N P Y

Chapter 6 - Changes in food intake, adiposity and the hypothalamic 144 expression of N P Y and VIP in response to incubation
mRNA expression supports the idea that NPY's ability to respond to factors, such as
prolactin, that would normally stimulate N P Y expression and thereby appetite, could be
inhibited during the breeding season. A final possibility is that N P Y may not have a
pivotal role in the regulation of body reserves in the emu. Appetite in emus might be
controlled at the hypothalamic level by other appetite mediators, such as, orexin,
proopiomelanocortin ( P O M C ) , agouti-related protein (AGRP), C R H or cocaine and
amphetamine-regulated transcript (CART).
As expected the anorexia and subsequent negative energy balance during incubation led to
catabolism of adipose and liver energy reserves to meet the animals energetic
requirements, resulting in lower proportions of adipose and liver tissue to live weight. The
catabolic state did not include depletion of muscle glycogen or protein as evidenced by the
higher proportion of the gastrocnemius muscle to live weight in the incubating birds. This
does not mean that muscle was increased during incubation, rather that muscle mass was
unchanged and subsequently increased as a proportion of live weight as the adipose stores
and live weight decreased.
The hormonal data also supports a catabolic state in the incubators whose glucagon
concentrations were higher, insulin concentrations tended to be lower and ratio of insulin
to glucagon was lower. As expected these changes in insulin and glucagon maintained a
constant level of blood glucose that did not differ from that of the non-incubating birds.
The expectation that the decreased activity and feed intake during incubation would lower
the metabolic rate is supported by the lower concentration of thyroxine in the incubators.
However, triiodothyronine and the T3/T4 ratio were not different between the two groups.
Overall these results suggest that incubation in the emu is associated with a decrease in the
metabolic rate and catabolism of adipose reserves. Other researchers have also observed a
decreased metabolic rate in the emu during incubation (Buttemer & Dawson, 1989a &
1989b).
As ad libitum food was available, the low level of intake of the non-incubating, and the
anorexia of the incubating birds, resulted from depressed appetite. In the following chapter
I examined the response of N P Y and VIP m R N A expression and the concentration of
metabolic hormones to short-term starvation in order to obtain a better understanding of

Chapter 6 - Changes in food intake, adiposity and the hypothalamic 145 expression of N P Y and VIP in response to incubation
the control of appetite and adiposity in the emu. Imposed starvation induces many of the
alterations in metabolic hormones that are observed during anorexia. However, imposed
starvation is more stressful than naturally occurring anorexia and differs significantly in
that it is associated with increased appetite. The increase in appetite is mediated by
increased N P Y expression and changes in metabolic hormones. As such, investigating
appetite and adiposity using the model of short-term starvation will provide further insights
into the control of appetite and adiposity in the emu.

146
Chapter 7
The effect of short-term starvation on the hypothalamic
expression of NPYand VIP during a period of elevated
appetite.
1. Introduction
2. Materials and Methods
3. Results
4. Discussion
Page
147
149
152
159

Chapter 7 - The effect of short-term starvation on the hypothalamic, 147 expression of N P Y and VIP during a period of elevated appetite
1. Introduction
Throughout the course of the year emus undergo large shifts in their food intake, body
weight and metabolism. These changes include anorexia in incubating males coupled with
extensive utilisation of the adipose stores. Following the cessation of the breeding period
appetite is up-regulated and fat is deposited.
In Chapter 6, incubation was associated with increased expression of VIP mRNA in the
mediobasal hypothalamus/preoptic area, and a tendency towards elevated N P Y m R N A
expression. In Chapter 5, N P Y m R N A expression was unchanged in the same region by
dexamethasone treatment despite decreased appetite and a tendency for lower levels of
adiposity in the treated birds. As Chapters 5 and 6 investigated birds during the breeding
season, the actions and responses of N P Y to decreasing adiposity may have been
suppressed by factors associated with reproduction and photoperiod.
There are a number of pathways that could be involved in the control of appetite and
adiposity in the emu. For example, pathways involving cocaine and amphetamine-
regulated transcript (CART), proopiomelanocortin ( P O M C ) , corticotrophin-releasing
hormone (CRH), orexin/hypocretin and agouti-related protein (AGRP), are involved in the
control of appetite and adiposity in other species (Mizuno et al, 1997; Ollmann et al, 1997;
Sakurai et al, 1998; Heinrichs & Richard, 1999; Vrang et al, 1999). In this experiment it
was decided to focus on the principal pathway involving N P Y as it is well characterised for
a range of species including several avian species. To clarify the role of N P Y , and
investigate if VIP has a role in the control of appetite in emus, it is necessary to determine
how they respond to imposed starvation when appetite is maximal. In chickens, N P Y
m R N A expression is increased by starvation or feed restriction (Boswell et al, 1999). The
effects of starvation on VIP at the brain level have not been widely studied. However, in
rats the concentration of VIP in the brain is not altered by starvation (Shulkes et al, 1983).
Starvation, in addition to its central effects, alters the metabolic status of the animal. When
energy intake is insufficient animals enter a catabolic state that, in birds, is characterised
by decreased insulin and increased glucagon (Sitbon & Mialhe, 1978; Rosebrough et al,
1984). Insufficient energy intake leads to the catabolism of adipose and protein reserves to
meet the animals continuing energy requirements. Catabolism of adipose tissue increases
the concentration of P-hydroxybutyrate, while protein breakdown increases the

Chapter 7 - The effect of short-term starvation on the hypothalamic, 148 expression of N P Y and VIP during a period of elevated appetite
concentration of urea (Le M a h o et al, 1981; Garcia-Rodriguez et al, 1987). In chickens, a
two day fast decreases serum triiodothyronine and increases serum thyroxine
concentrations (Van der Geyten et al, 1999). Corticosterone concentrations are also
elevated by starvation and are associated with increases in N P Y expression (Dallman et al,
1999; Geris et al, 1999). In addition, adrenalectomy of rats decreases N P Y elicited food
intake by 60-71% and this is returned to unoperated levels by corticosterone replacement
(Stanley et al, 1989). It can be inferred from this that corticosterone is required for
exogenous N P Y to affect appetite. The rise in N P Y expression in response to starvation
follows the increase in corticosterone (Dallman et al, 1999). As such, increased
corticosterone may be a requirement for increases in N P Y expression or for potentiation of
its effects on appetite.
This experiment was performed to determine how short-term starvation during a period of
elevated appetite affects metabolism and the m R N A expression of N P Y and VIP. The
following hypotheses were tested:
1. Starvation, when appetite is high, will increase the expression of N P Y m R N A without
affecting VIP m R N A expression in the mediobasal hypothalamus/preoptic area,
2. That starvation would alter the concentration of hormones and metabolites to favour
catabolism of adipose tissue in the starved birds (concentrations of glucagon, (3-
hydroxybutyrate and thyroxine will increase and insulin and triiodothyronine will
decrease). As the starvation period is short, catabolism of protein is not expected to be
initiated, therefore the concentration of urea will not change, and finally
3. Elevated corticosterone concentrations will be observed in response to starvation.

Chapter 7 - The effect of short-term starvation on the hypothalamic, expression of N P Y and VIP during a period of elevated appetite
149
2. Materials and Methods
Experimental design
To test the hypotheses outlined above male and female emus were allocated into two
groups. The first group was used as a control, while the second group was subjected to a
one week period of starvation. At the completion of the starvation period the region
containing the mediobasal hypothalamus/preoptic area was collected and R N A was
extracted. The expression of N P Y and VIP m R N A in the mediobasal
hypothalamus/preoptic area was quantified by ribonuclease protection assay. The
concentrations of insulin, glucagon, thyroxine, triiodothyronine and corticosterone were
measured before and at the completion of the treatment period by radioimmunoassay. The
concentration of urea and (3-hydroxybutyrate were measured before and at the completion
of the treatment period by enzymatic and spectrophotometric assays respectively. In
addition, the birds were weighed before, and at the completion of the treatment period, and
carcass composition analysis was performed on a subset of birds to determine the extent to
which the adipose reserves were catabolized (Fig. 7.1).
Day
Bleed and
T i 1
-14
weigh
Pre-treatment
Feed intake both groups
I I I I -7 0
Treatment I I Control feed intake
Bleed and weigh
I
7
Figure 7.1: The sampling and measurement schedule for the pre-treatment and treatment periods.
Animals
A group of sixteen emus (seven males and nine females) were divided into two groups
comprising eight birds starved (five female and three male) and eight control birds (four
female and four male). All animals were kept in individual pens.
Treatment
The experiment commenced mid-November, a period when appetite is maximal. All the
birds were given ad libitum access to a commercial pellet feed (Glen Forrest Stockfeeders)

Chapter 7 - The effect of short-term starvation on the hypothalamic, 150 expression of N P Y and VIP during a period of elevated appetite
for one week. The feed was then removed from the eight animals in the starved group for
a period of seven days.
Measurement of feed intake
Feed intake was determined for individual birds for one week during the pre-treatment
period in both groups and for the control group over the course of the treatment period
(Fig. 7.1).
Sample collection
The birds were weighed and 20 ml samples of blood were collected at the start of the pre-
treatment period. At the completion of the treatment period, 20 ml blood samples were
collected and the birds were euthanased with Lethabarb as described in Chapter 2 (Fig.
7.1). The brains were removed from a subset of the animals (four control males, three
starved males and one starved female), and the mediobasal hypothalamus and preoptic area
tissues obtained and stored for R N A extraction and R P A analysis as described in Chapter
2.
Carcass composition
The carcass was weighed. The subcutaneous and visceral fat depots and the liver were
removed and weighed to determine differences between the groups in adiposity for a
subset of the animals used (same subset used for R P A analysis).
RPA analysis
R P A analysis was performed on the subset of samples collected. R N A was extracted as
described in Chapter 2. The R P A was performed on total R N A extracted from the region
containing the mediobasal hypothalamus and the preoptic area, using the R P A III kit
(Ambion) as described in Chapter 2.
Hormones and metabolites
Radioimmunoassays were performed for corticosterone, insulin, triiodothyronine,
thyroxine and glucagon for all samples as described in Chapter 2. 6-hydroxybutyrate and
urea assays were performed by the Agriculture Western Australia Animal Health
Laboratory. P-hydroxybutyrate was measured using a spectrophotometric assay
(McMurray et al, 1984). Urea was measured using the enzymatic U V test,

Chapter 7 - The effect of short-term starvation on the hypothalamic, 151 expression of N P Y and VIP during a period of elevated appetite
urease/glutamate dehydrogenase ( G L D H ) method. The urease/GLDH method incorporated
assays for urea, using the Trace Urea (Urea Nitrogen) Reagent Kit (Roche), and G L D H ,
using the G L D H M P R 1 Reagent Kit (Roche). Both assays were performed on a Roche
Cobas Mira S Automated Chemistry Unit. All samples for each metabolite were run in a
single assay.
Data and statistical analysis
Before the starvation period commenced (pre-treatment) the birds were weighed and blood
samples were collected and feed intake monitored, to enable within group comparisons to
be made over time (Fig. 7.1). The expression of VIP and N P Y were determined as values
relative to the expression of B-actin for each sample. The carcass composition data for
each tissue is expressed as a percentage of the live weight of the animal. The nature of
differences between the starved and control groups was determined using Mann-Whitney
U tests as described by Siegel (1956). The Wilcoxon matched-pairs signed-ranks test
(Siegel, 1956) was used to determine differences within groups over time using the
Statview™ 512+ program (1986). Non-parametric statistical analysis was judged to be the
most appropriate as two independent groups were sampled from, the sample size was
small, and the number of birds in each group was not equal. The results are indicated as
the mean ± s.e.m.

Chapter 7 - The effect of short-term starvation on the hypothalamic, 152 expression of N P Y and VIP during a period of elevated appetite
3. Results
RPA
There was no difference between control and starved male emus in the level of expression
of either VIP or N P Y after one week of starvation (p = 0.343 and p = 0.100 respectively)
(Table 7.1).
Table 7.1: The mRNA expression of NPY and VIP relative to 8-actin of starved and control male emus.
~~ m R N A ~ Control Starved
NPY/8-actin 1.07 ±0.107 0.77 ±0.168
VIP/6-actin 1.25 ±0.284 1.82 ±0.321
Values are means ± s.e.m.
Feed intake
Feed intake did not differ between the groups for either sex in the pre-treatment period.
There was no change in feed intake of the control males over time, however the feed intake
of the females was higher during the treatment period (p = 0.0336) (Table 7.2).
Table 7.2: The average daily feed intake of male and female emus in control and starved groups one week before, and during a subsequent one-week treatment period.
pre-treatment
treatment
Control female
(kg/day)
(N=4)
0.45±0.07*
1.00±0.04*
Starved female
(kg/day)
(N=5)
0.55±0.20
-
Control male
(kg/day)
(N=4)
0.60±0.17
0.85±0.22
Starved male
(kg/day)
(N=3)
0.73±0.13
-
Values are means ± s.e.m. An * indicates significant difference within groups over time (p = 0.0336).

Chapter 7 - The effect of short-term starvation on the hypothalamic, 153 expression of N P Y and VIP during a period of elevated appetite
Live weight
Live weight did not differ between the groups at the start of the pre-treatment period or at
the completion of the treatment period. There was no change in live weight of the control
or starved males over time. However, live weight increased in the control and decreased in
the starved females over time (p = 0.0336 and p = 0.0217 respectively) (Table 7.3).
Table 7.3: The live weight of male and female emus in the control and starved group before and after a 7 day treatment period.
pre-treatment
treatment
Control female (kg)
(N=4)
51.0 + 2.1*
53.6 ±2.7*
Starved female (kg)
(N=5)
52.4 ± 2.5"
50.9 ± 2.5"
Control male (kg)
(N=4)
49.5 ±1.4
49.3 ±1.6
Starved male (kg)
(N=3)
47.2 ±3.1
46.0 ± 3.3
Values are means ± s.e.m. The * and a indicate significant difference within groups over time (p < 0.05).
Carcass composition
The visceral, subcutaneous and total fat as a percentage of live weight did not differ
between the groups. Liver weight as a percentage of live weight was higher in the control
group at the completion of the treatment period (p = 0.029) (Table 7.4).
Table 7.4: The body composition of control and one week starved male emus.
Parameter Control Starved
Subcutaneous adipose (%) 22.6 ±1.09 22.8 ±1.00
Visceral adipose (%) 9.90 ± 0.850 8.93 ± 0.869
Total adipose (%) 32.6 ± 0.33 31.8 ± 1.56
Liver (%) 1.59 ± 0.092* 1.08 ± 0.150*
Values are means ± s.e.m. A n * indicates significant difference between groups (p = 0.029)

Chapter 7 - The effect of short-term starvation on the hypothalamic, 154 expression of N P Y and VIP during a period of elevated appetite
Hormones and metabolites
The insulin concentration was lower in the female starved group at the completion of the
treatment period (p = 0.008), but not pre-treatment. The insulin concentration did not
differ between the male groups at either time point. Within groups the insulin
concentration decreased over time in the starved females (p = 0.022), but not the starved
males or the control groups. There was a tendency for the insulin concentration to increase
over time in the control female group (p = 0.072) (Table 7.5).
Table 7.5: Serum insulin concentrations of male and female emus in each group before and after a 7 day
treatment period.
Control female Starved female Control male Starved male
(ng/ml) (ng/ml) (ng/ml) (ng/ml)
(N=4) (N=5) (N=4) (N=3)
pre-treatment 0.80 ± 0.04 0.82 ± 0.06" 1.06 ±0.22 0.93 ± 0.07
treatment 1.45 ±0.36* 0.70±0.02*a 1.18 ±0.31 0.73 ±0.02
Values are means ± s.e.m. A n * indicates significant difference between groups (p = 0.008). The " indicates
significant difference over time (p = 0.0217).
The serum glucagon concentration was higher in the starved female group at the
completion of the treatment period (p = 0.036). The serum glucagon concentration did not
differ between the groups for the females pre-treatment, or the males pre-treatment or at
the completion of treatment. Over time there was no difference in glucagon within either
group for both sexes (Table 7.6).
Table 7.6: Serum glucagon concentrations of male and female emus in each group before and after a 7 day
treatment period.
pre-treatment
treatment
Control female
(pg/ml)
(N=3)
60.4 ±18.8
48.1 ±26.8*
Starved female
(pg/ml)
(N=5)
75.2 ±16.1
112.5 ±15.9*
Control male
(pg/ml)
(N=3)
46.1 ± 18.6
53.7 ± 29.8
Starved male
(pg/ml)
(N=3)
118.8 ±53.4
139.1 ±23.6
Values are means ± s.e.m. A n * indicates significant difference between groups (p = 0.008).
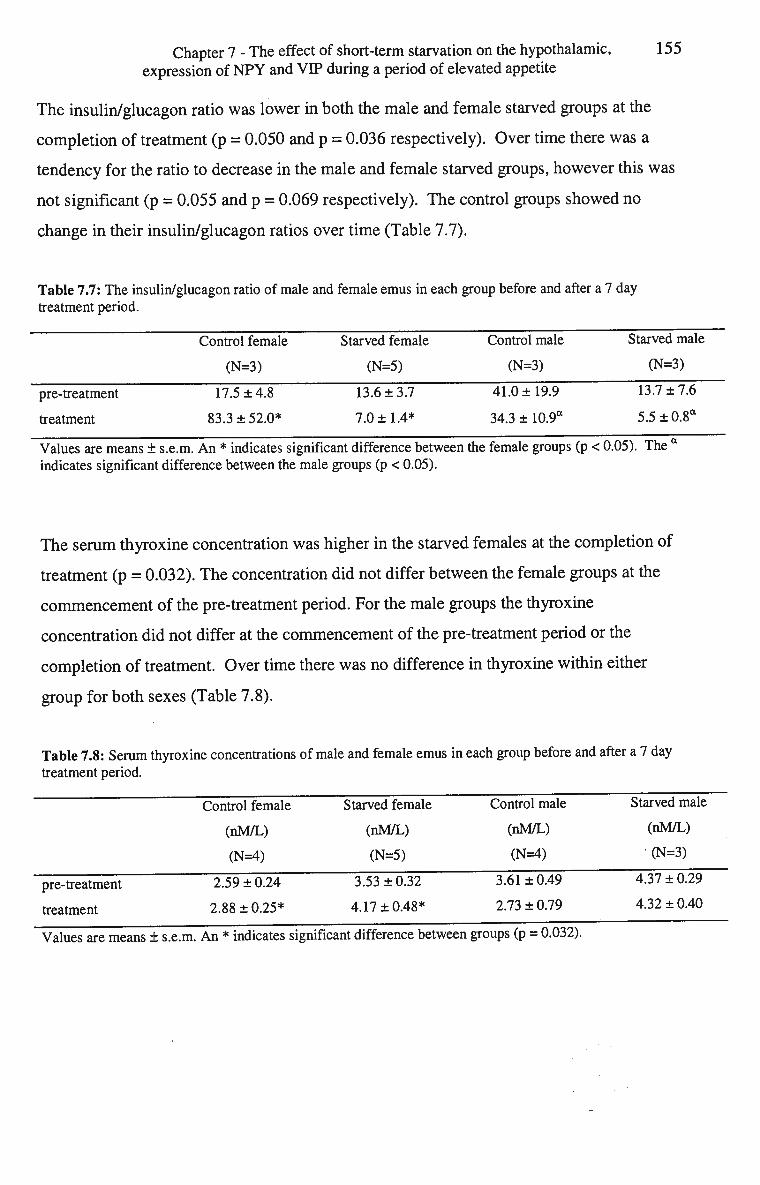
Chapter 7 - The effect of short-term starvation on the hypothalamic, 155 expression of N P Y and VIP during a period of elevated appetite
The insulin/glucagon ratio was lower in both the male and female starved groups at the
completion of treatment (p = 0.050 and p = 0.036 respectively). Over time there was a
tendency for the ratio to decrease in the male and female starved groups, however this was
not significant (p = 0.055 and p = 0.069 respectively). The control groups showed no
change in their insulin/glucagon ratios over time (Table 7.7).
Table 7.7: The insulin/glucagon ratio of male and female emus in each group before and after a 7 day
treatment period.
Control female Starved female Control male Starved male
(N=3) (N=5) (N=3) (N=3)
pre-treatment 17.5 ±4.8 13.6 ±3.7 41.0 ±19.9 13.7 ±7.6
treatment 83.3 ±52.0* 7.0 ±1.4* 34.3 ± 10.9° 5.5±0.8a
Values are means ± s.e.m. A n * indicates significant difference between the female groups (p < 0.05). The a
indicates significant difference between the male groups (p < 0.05).
The serum thyroxine concentration was higher in the starved females at the completion of
treatment (p = 0.032). The concentration did not differ between the female groups at the
commencement of the pre-treatment period. For the male groups the thyroxine
concentration did not differ at the commencement of the pre-treatment period or the
completion of treatment. Over time there was no difference in thyroxine within either
group for both sexes (Table 7.8).
Table 7.8: Serum thyroxine concentrations of male and female emus in each group before and after a 7 day
treatment period.
pre-treatment
treatment
Control female
(nM/L)
(N=4)
2.59 ± 0.24
2.88 ±0.25*
Starved female
(nM/L)
(N=5)
3.53 ± 0.32
4.17 ±0.48*
Control male
(nM/L)
(N=4)
3.61 ±0.49
2.73 ± 0.79
Starved male
(nM/L)
(N=3)
4.37 ±0.29
4.32 ± 0.40
Values are means ± s.e.m. A n * indicates significant difference between groups (p = 0.032).

Chapter 7 - The effect of short-term starvation on the hypothalamic, 156 expression of N P Y and VIP during a period of elevated appetite
The serum triiodothyronine concentration was lower in the starved males than in the
control males at the completion of treatment (p = 0.028). The triiodothyronine
concentration did not differ between the female groups at either time-point or the male
groups pre-treatment. Over time the triiodothyronine concentration increased in the male
control group (p = 0.034). Over time the triiodothyronine concentration did not change for
the starved males or either female group (Table. 7.9).
Table 7.9: Serum triiodothyronine concentrations of male and female emus in each group before and after a 7 day treatment period.
Control female Starved female Control male Starved male
(ng/mL) (ng/mL) (ng/mL) (ng/mL)
(N=4) (N=5) (N=4) (N=3)
pre-treatment 0.075 ±0.018 0.136 ±0.053 0.183 ±0.036" 0.120 ±0.061
treatment 0.090 ±0.033 0.092 ±0.019 0.223 ± 0.029*" 0.067 ±0.015*
Values are means ± s.e.m. A n * indicates significant difference between groups (p = 0.028). The " indicates significant difference over time (p = 0.034).
The triiodothyronine/thyroxine (T3/T4) ratio was lower in the starved than in the control
males at the completion of the treatment (p = 0.028). The T3/T4 ratio did not differ
between the female groups at either time-point, or the male groups pre-treatment. Within
groups there was no difference in the T3/T4 ratio for either sex over time (Table 7.10).
Table 7.10: Serum T3/T4 ratio (1 x 10"5) of male and female emus in each group before and after a 7 day
treatment period.
pre-treatment
treatment
Control female
(N=4)
7.26 ± 2.22
15.53 ±6.01
Starved female
(N=5)
3.59 ±1.79
2.09 ± 0.59
Control male
(N=4)
3.76 ±0.81
4.37 ±1.77*
Starved male
(N=3)
5.52 ± 2.39
2.96 ± 0.62*
Values are means ± s.e.m. A n * indicates significant difference between groups (p = 0.028).

Chapter 7 - The effect of short-term starvation on the hypothalamic, 157 expression of N P Y and VIP during a period of elevated appetite
The serum corticosterone concentration did not differ between the groups for either sex at
the commencement of the pre-treatment period or at the completion of treatment. Over
time there was no change in the concentration of corticosterone within any group (Table
7.11).
Table 7.11: Serum corticosterone concentrations of male and female emus in each group in each group before and after a 7 day treatment period.
pre-treatment
treatment
Control female
(ng/mL)
(N=4)
1.26 ±0.14
2.60 ±0.86
Starved female
(ng/mL)
(N=5)
1.84 ±0.88
1.41 ±0.15
Control male
(ng/mL)
(N=4)
0.82 ±0.12
1.47 ±0.19
Starved male
(ng/mL)
(N=3)
0.78 ±0.19
1.46 ±0.46
Values are means ± s.e.m.
The serum B-hydroxybutyrate concentration did not differ between the groups for either
sex at the commencement of the pre-treatment period. At the completion of treatment the
B-hydroxybutyrate concentration was higher in the starved males than the control males,
but did not differ between groups for the females. Over time there was no change in the B-
hydroxybutyrate concentration within any group, however there was a trend for increased
B-hydroxybutyrate in the starved males (p = 0.055) (Table 7.12).
Table 7.12: Serum P-hydroxybutyrate concentrations of male and female emus in each group in each group
before and after a 7 day treatment period.
Control female Starved female Control male Starved male
(mmol/L) (mmol/L) (mmol/L) (mmol/L)
(N=4) (N=5) (N=4) (N=3)
pre-treatment 0.62 ±0.26 0.34 ±0.17 0.05 ±0.03 0.03 ±0.02
treatment 0.32 ±0.31 0.83 ±0.40 0.29 ±0.23* 1.41 ±0.15*
Values are means ± s.e.m. A n * indicates significant difference between groups (p = 0.055)

Chapter 7 - The effect of short-term starvation on the hypothalamic, 158 expression of N P Y and VIP during a period of elevated appetite
The serum urea concentration did not differ between the groups for either sex pre-
treatment or for the females at the completion of treatment. At the completion of treatment
the urea concentration was lower in the starved males than the control males (p = 0.022).
Over time the urea concentration decreased within the starved female group and exhibited
a decreasing trend in the starved males (p = 0.022 and p = 0.055 respectively). Within the
control male and females groups there was no change over time in the concentration of
urea (Table 7.13).
Table 7.13: Serum urea concentrations of male and female emus in each group in each group before and
after a 7 day treatment period.
Control female Starved female Control male Starved male
(mmol/L) (mmol/L) (mmol/L) (mmol/L)
(N=4) (N=5) (N=4) (N=3)
pre-treatment 1.70 ±0.30 1.38 ±0.27" 1.63 ±0.34 2.03 ±0.19
treatment 1.75 ±0.22 0.70 ±0.13" 1.78 ±0.26* 0.87 ±0.19*
Values are means ± s.e.m. A n * indicates significant difference between groups (p = 0.028). The " indicates
significant difference over time (p = 0.022).

Chapter 7 - The effect of short-term starvation on the hypothalamic, 159 expression of N P Y and VIP during a period of elevated appetite
4. Discussion
The hypothesis that N P Y m R N A expression would be elevated by short-term starvation in
male emus was not supported by the results. However, the hypothesis that VIP m R N A
expression would be unchanged was supported by the results. The hypothesis that short-
term starvation induces metabolic changes was partially supported by the results with one
week of starvation decreasing insulin concentrations in the female starved group below
that of both their pre-treatment concentration and the completion of treatment
concentration of the controls. In the females the glucagon concentration was also higher at
the completion of treatment in the starved group. This indicates that females may be more
sensitive to the effects of starvation than males. Effects on the thyroid hormones varied
between the sexes. The thyroxine concentration was higher in starved females at the
completion of treatment, while the triiodothyronine concentration and the T3/T4 ratio were
lower in starved males at the completion of treatment. This m a y again indicate a greater
sensitivity to starvation in the female e m u as the differences in the male values can largely
be explained by an increase in the triiodothyronine concentration of the controls at the
completion of the treatment period. Given the anorexia male emus exhibit when
incubating eggs, and the fact that females during the breeding season only exhibit a
reduced appetite, a greater resistance to starvation in male emus is a reasonable finding.
The corticosterone concentration did not increase in response to starvation in either sex,
indicating that seven days of starvation does not impose a large stress, as measured by
corticosterone concentration, on the emu.
The concentrations of metabolites were changed by starvation, and as with the hormone
concentrations these changes differed between the sexes. The concentration of (3-
hydroxybutyrate was higher in the starved male group at the completion of treatment.
Rather than indicating greater sensitivity to starvation, this may indicate an adaptation in
males that enables them to switch more quickly to the utilisation of adipose stores in
response to starvation than females. The starved female group showed a non-significant
increase in the concentration of p-hydroxybutyrate, and along with the initiation of
metabolic changes to conserve energy this m a y indicate that they employ a different
strategy to males in response to starvation. The concentration of urea decreased over time
in the female starved group and was lower at the completion of treatment in the male
starved group. This result was unexpected but can be explained in terms of the diet and
age of these animals. The animals used in this experiment were mature and received a

Chapter 7 - The effect of short-term starvation on the hypothalamic, 160 expression of N P Y and VIP during a period of elevated appetite
commercial diet containing 1 6 % protein. The reduction in urea concentration indicates
that the protein content of this diet exceeds the mature emus requirements. In the control
group the higher urea concentration is due to the need to breakdown and excrete excess
dietary protein.
The absence of changes in NPY mRNA expression in the mediobasal
hypothalamus/preoptic area or corticosterone concentration in response to starvation, and
the variable effects of starvation on metabolism implies two things. First, that the e m u is
more resistant to starvation than other species, and any effects of starvation on N P Y
expression or the concentration of corticosterone may only be observed after prolonged
periods. One week of starvation did not decrease either the subcutaneous or visceral
adipose reserves, although it did significantly decrease the liver weight as a proportion of
live-weight. The decreasing liver weight (more than 3 0 % lower) represents the utilisation
of stored glycogen reserves. A suitable period to examine the role of N P Y in the control of
appetite in the emu would have been such that the circulating concentration of
corticosterone was increased, the stored glycogen reserves were depleted by more than
3 0 % and catabolism of stored triglycerides from adipose tissue was initiated. Second, that
N P Y does not contribute significantly to the control of appetite in emus. Research in mice
has shown that multiple pathways are involved in the regulation of appetite and body
weight, and in the absence of N P Y , compensate to maintain adipose reserves in the correct
range (Erickson et al, 1996). It is therefore plausible that in the e m u one of these other
pathways is of greater importance to the control of appetite and bodyweight than N P Y .
Central pathways that could be of importance to the control of appetite in the e m u include
those involving cocaine and amphetamine-regulated transcript (CART), orexin/hypocretin,
corticotrophin-releasing hormone (CRH), proopiomelanocortin ( P O M C ) and agouti-related
protein (AGRP).
In conclusion, subjecting emus to one week of starvation does not increase NPY gene
expression or induce the range of hormonal changes that are associated with starvation in
other species. This m a y be due to a greater tolerance to starvation in emus. Given that
male emus exhibit anorexia for a period of eight weeks during incubation, it is not
surprising that a single week of starvation failed to induce the classical starvation
responses. The absence of any change in N P Y m R N A expression in response to short-
term starvation could also be due to a more limited role of N P Y in appetite control than is

Chapter 7 - The effect of short-term starvation on the hypothalamic, 161 expression of N P Y and VIP during a period of elevated appetite
observed in other species. This experiment did not clarify the roles of N P Y and VIP in
appetite control or the possibility of mediation of NPY's effects on appetite by
corticosterone. Performing this experiment over a longer time period may have yielded
more information on the control of appetite in the emu, as would comparisons between the
expression of N P Y during the breeding season (minimal appetite) and the summer months
(maximal appetite).

162
General Discussion

General Discussion 163
The e m u has great potential as a commercial livestock species. The major drawback to
achieving this potential is the seasonal decrease in appetite and adiposity that they exhibit
in response to decreasing photoperiod. Decreased appetite, and particularly the ensuing
decreased adiposity, are a problem because fat is the most profitable component of the
carcass. In a commercial production scenario the decreased appetite and adiposity,
restricts the viable window for slaughter to a brief period during the summer months. As a
consequence of this restriction the availability of e m u products (i.e. meat, leather and fat)
are limited and market development is hampered. The aim of this thesis has been to
improve the understanding of h o w appetite and adiposity are controlled in the emu.
Improving our understanding of these controls is essential for identifying mechanisms to
manipulate appetite and adiposity, and for developing techniques to assess the
susceptibility of the e m u to these manipulations.
Emus might have different mechanisms to control appetite and adiposity than those
decribed in other species. During the course of this thesis emus have demonstrated a
striking resistance to the manipulation of both appetite and adiposity (see Chapters 4 and
5) and tolerance to short-term starvation (see Chapter 7). E m u s are also well adapted to
survive prolonged negative energy balance during the anorexia of incubation (see Chapter
6). E m u s have evolved in a harsh environment in which is food is often scarce (Davies,
1978). As such, the unique features of the emu demonstrated during the course of this
thesis m a y result from adaptations to this harsh environment. To cope with food scarcity
and the demands of reproduction the emu has evolved efficient mechanisms to maintain
energy reserves at an appropriate level. These mechanisms include strategies for coping
with starvation that diminish the stress response and appetite stimulation, and thereby
minimise discomfort and the negative effects of continuously elevated stress hormones on
the animal (see Chapter 7). The efficient and rigid control of appetite and adiposity allows
the e m u to resist treatments that are known to alter appetite and adiposity in other species,
such as, dexamethasone treatment (see Chapter 5) and the consumption of high fat diets
(see Chapter 4). As such, it may not be possible to maintain high appetite and adiposity in
the e m u during the breeding season.
My work has focused on how to prevent appetite and adiposity decreasing. It is possible
that this is the wrong approach for tackling the problem of a limited slaughter window for
producers. I assumed that appetite was decreasing during the reproductive period and that

General Discussion 164
the emus could not meet their requirements during this period when compared to the large
amount of food ingested over summer. In fact, the increase in appetite during summer may
be part of a strategy of over feeding to increase energy reserves and support the demands
of reproduction during winter. Premigratory fattening is an analogous situation where
appetite is increased to increase adipose reserves and enable migrating species to cover
large distances when a food supply is unreliable or unavailable (Stevens, 1996). For a
species to survive it must reproduce (Jones, 1999). Therefore factors that influence the
success of reproduction, such as the control of energy reserves, come under intense
selection pressure. Adaptations that have evolved under such intense selection are unlikely
to be overcome with ease. Therefore, it may be better to investigate the mechanism
controlling the stimulation of appetite at the completion of incubation. Studies into the
rapid and large increase in food intake of the male emu observed at the cessation of
incubation would be valuable and could provide feasible mechanisms for increasing
appetite earlier and thereby extending the slaughter window.
Natural selection has encouraged the evolution of photoperiod-related controls of appetite
and adiposity in the emu that strongly resist interference (Blache & Martin, 1999; Blache
et al, 2001b). The photoperiodic control of appetite most likely involves a complicated
network involving interactions between hypothalamic neuropeptides, peripheral metabolic
and reproductive hormones, and photoperiod-related factors. The photoperiodic control of
appetite during the reproductive period will be difficult to characterise fully and m a y be
impossible to override. A promising approach to manipulate appetite and adiposity during
the reproductive period would be to alter the perception of photoperiodic changes by the
emu. In mammals, melatonin is a key component of photoperiodicity and its
administration can inhibit reproduction (Edmonds & Stetson, 1994; Lincoln, 1994; Horton
& Yellon, 2001). However, in birds, it appears that melatonin may not be involved in the
control of reproduction by photoperiod, although, the role of melatonin in emus has never
been investigated (Meyer, 1998). Other factors that could provide insights into the
photoperiodic control of appetite and potential mechanisms for disrupting it include;
norepinephrine, gonadotrophin-releasing hormone, and proopiomelanocortin ( P O M C ) and
agouti-related protein (AGRP) (Kriegsfeld et al, 2000; Mercer et al, 2000a & 2000b;
Imundo et al, 2001), further investigations of these pathways could lead to ways to
manipulate the effect of photoperiod on appetite in emus.

General Discussion 165
In conclusion, I have explored several avenues to prevent the loss of appetite and adiposity
during the breeding season. Methods that are known to increase appetite and adiposity in
other species have little or no effect in emus. It is possible that investigations into the
mechanisms that trigger the rapid and large increase in appetite and adiposity after the
breeding season could yield new approaches for manipulating appetite and adiposity in the
e m u to extend the slaughter window. Another area for investigation that could provide
methods for manipulating appetite and adiposity is the neural basis for the control of
appetite by photoperiod.

Bibliography
166
1.
2.
3.
Websites
Computer programs
Articles and books
Page
167
167
167
Bibliography 167
1. Websites
Bureau of Meterology
http://www.bom.gov.au/climate/averages/tables/cw_009021.shtml
National Centre for Biotechnology Information
http://www.ncbi.nlm.nih.gov/
Rural Industries Research and Development Corporation
http://www.rirdc.gov.au/
NIH Image program, U.S. National Institutes of Health
http://rsb.info.nih.gov/nih-image/
2. Computer programs
Assayzap Universal Assay Calculator, Biosoft. Taylor P L (1992) Cambridge, U.K.
GeneJockey II Sequence Processor, Biosoft. Taylor P L (1996) Cambridge, U.K.
NIH Image Program, U.S. National Institutes of Health.
StatView™512+, Abacus Concepts, Inc. Brainpower, Inc. (1986) California, U.S.A.
3. Articles and books
Adams B M (1968) Effect of Cortisol on growth and uric acid excretion in the chick,
Journal of Endocrinology. 40:145-151.
Adams N R & Sanders M R (1992) Improved feed intake and body weight change in sheep
treated with dexamethasone at entry into pens or feedlots, Australian Veterinary
Journal. 69:209-213.
Adolph EF (1947) Urges to eat and drink in rats, American Journal of Physiology.
151:110-125.
Adrian TE, Allen JM, Bloom SR, Ghatei M A , Rossor M N , Roberts G W , Crow TJ,
Tatemoto K & Polak J M (1983) Neuropeptide Y distribution in human brain,
Nature. 306(8):584-586.
Ahren B & Scheurink A J W (1998) Marked hyperleptinemia after high-fat diet associated
with severe glucose intolerance in mice, European Journal of Endocrinology.
139:461-467.
Ahren B (1999) Plasma leptin and insulin in C57BI/6J mice on a high-fat diet: relation to
subsequent changes in body weight, Acta Physiologica Scandinavica. 165:233-
240.
Bibliography 168
Allen YS, Adrain TE, Allen JM, Tatemoto K, Crow TJ, Bloom SR & Polak J M (1983)
Neuropeptide Y distribution in the rat brain, Science. 221:877-879.
Anand B K (1961) Nervous regulation of food intake, Physiological Reviews. 41:677-706.
Arimura A, Bowers CY, Schally A V , Saito M & Miller M C (1969) Effect of corticotropin-
releasing factor, dexamethasone and actinomycin D on the release of A C T H from
rat pituitaries in vivo and in vitro, Endocrinology. 85:300-311.
Arvaniti K, Deshaies Y & Richard D (1998) Effect of leptin on energy balance does not
require the presence of intact adrenals, American Journal of Physiology.
275:R105-R111.
Arvat E, Maccagno B, Ramunni J, Di Vito L, Gianotti L, Broglio F, Benso A, Deghenghi
R, Camanni F & Ghigo E (1998) Effects of dexamethasone and alprazolam, a
benzodiazepine, on the stimulatory efffect of hexarelin, a synthetic G H R P on
A C T H , Cortisol and G H secretion in humans, Neuroendocrinology. 67(5):310-316.
Ashwell C M , Czerwinski SM, Brocht D M & McMurtry JP (1999a) Hormonal regulation
of leptin expression in broiler chickens, American Journal of Physiology. 45:R226-
R232.
Ashwell C M , McMurtry JP, Wang X-H, Zhou Y & Vasilatos-Younken R (1999b) Effects
of growth hormone and pair-feeding on leptin m R N A expression in liver and
adipose tissue, Domestic Animal Endocrinology. 17:77-84.
Atcha Z, Cagampang FRA, Stirland JA, Morris ID, Brooks A N , Ebling FJP, Klingenspor
M & Loudon ASI (2000) Leptin acts on metabolism in a photoperiod-dependent
manner, but has no effect on reproductive function in the seasonally breeding
Siberian hamster (Phodopus sungorus), Endocrinology. 141(11):4128-4135.
Ausman L M , Rasmussen K M & Gallina D L (1981) Spontaneous obesity in maturing
squirrel monkeys fed semi purified diets, American Journal of Physiology.
241:R316-R321.
Auwerx J & Staels B (1998) Review Article: Leptin, The Lancet. 351:131-142.

Bibliography 169
Barr V A , Malide D, Zarnowski MJ, Taylor SI & Cushman S W (1997) Insulin stimulates
both leptin secretion and production by rat white adipose tissue, Endocrinology.
138:4463-4472.
Bartness TJ, Wade G N & Goldman B D (1987) Are the short-photoperiod-induced
decreases in serum prolactin responsible for the seasonal changes in energy balance
in Syrian and Siberian hamsters, Journal of Experimental Zoology. 244(3):437-454.
Baura G D , Foster D M , Kaiyala K, Porte D Jr., Kahn SE & Schwartz M W (1996) Insulin
transport from plasma into the central nervous system is inhibited by
dexamethasone in dogs, Diabetes. 45:86-90.
Bedecarrats G, Guemene D, Kuhnlein U & Zadworny D (1999) Changes in levels of
immunoreactive prolactin isoforms during a reproductive cycle in turkey hens,
General and Comparative Endocrinology. 113:96-104.
Bentley PJ (1998) Hormones and nutrition in: Comparative Vertebrate Endocrinology. 3r
edition. 223-268pp. Cambridge University Press, Cambridge, U K .
Berge P, Lepetit J, Renerre M & Touraille C (1997) Meat quality traits in the emu
(Dromaius novaehollandiae) as affected by muscle type and animal age, Meat
Science. 45(2):209-211.
Berneis K, Vosmeer S & Keller U (1996) Effects of glucocorticoids and of growth
hormone on serum leptin concentrations in man, European Journal of
Endocrinology. 135:663-665.
Billington CJ, Briggs JE, Harker S, Grace M & Levine A S (1994) Neuropeptide Y in
hypothalamic paraventricular nucleus: a center coordinating energy metabolism,
American Journal of Physiology. 266:R1765-R1770.
Bivens C L M , Thomas W J & Stanley B G (1998) Similar feeding patterns are induced by
perifornical neuropeptide Y injection and by food deprivation, Brain Research.
782:271-280.
Blache D & Martin G B (1999) Day length affects feeding behaviour and food intake in
adult male (Dromaius novaehollandiae), British Poultry Science. 40:573-578.
Bibliography 170
Blache D, Talbot RT, Blackberry M A , Williams K M , Martin G B & Sharp PJ (2001a)
Photoperiodic control of the secretion of luteinizing hormone, prolactin and
testosterone in the male emu (Dromaius novaehollandiae), a bird that breeds on
short days, Journal of Neuroendocrinology. 13(11):998-1006.
Blache D, Van Cleeff J, Blackberry M , Sharp PJ & Martin G B (2001b) Seasonality in
emus (Dromaius novaehollandiae) in: Avian Endocrinology. 129-139pp. Eds; A
Dawson & C M Chaturvedi. Narosa Publishing House, N e w Delhi, India.
Blache D, Blackberry M A , Van Cleeff J & Martin G B (2001c) Plasma thyroid hormones
and growth hormone in embryonic and growing emus (Dromaius novaehollandiae),
Reproduction, Fertility and Development. 13:125-132.
Black A, French CE, Cowan R L & Swift R W (1949) V. Further experiments on the
relation of fat to economy of feed utilization, Journal of Nutrition. 37:289-301.
Blake JP (1996) Nutritional recommendations for emu, Improving our understanding of
ratites in a farming environment, Ratite Conference, pp 109-110.
Bocquier F, Bonnet M , Faulconnier Y, Guerre-Millo M , Martin P & Chilliard Y, (1998)
Effects of photoperiod and feeding level on perirenal adipose tissue metabolic
activity and leptin synthesis in the ovariectomized ewe, Reproduction, Nutrition,
Development. 38(5):489-498.
Boozer CN, Schoenbach G & Atkinson R L (1995) Dietary fat and adiposity: a dose-
response relationship in adult male rats fed isocalorically, American Journal of
Physiology. 268:E546-E550.
Boss-Williams K A & Bartness TJ (1996) N P Y stimulation of food intake in Siberian
hamsters is not photoperiod dependent, Physiology & Behavior. 59:157-164.
Boswell T, Richardson RD, Schwartz M W , DAlessio D A , Woods SC, Sipols AJ, Baskin
D G & Kenagy GJ (1993) N P Y and galanin in a hibernator: hypothalamic gene
expression and effects on feeding, Brain Research Bulletin. 32:379-384.
Boswell T, Millam JR, Li Q & Dunn IC (1998) Cellular localization of neuropeptide Y
m R N A and peptide in the brain of the Japanese quail and domestic chicken, Cell
and Tissue Research. 293:31-38.
Boswell T, Dunn IC & Corr S A (1999) Neuropeptide Y gene expression in the brain is
stimulated by fasting and food restriction in chickens, British Poultry Science.
40:S42-S43.
Boswell T, Dunn IC & Corr S A (1999b) Hypothalamic neuropeptide Y m R N A is increased
after feed restriction in growing broilers, Poultry Science. 78:1203-1207.

Bibliography 171
Boswell T (2001) Regulation of feeding by neuropeptide Y in: Avian Endocrinology.
129-139pp. Eds; A Dawson & C M Chaturvedi. Narosa Publishing House, N e w
Delhi.
Boswell T, Li Q & Takeuchi S (2002) Neurons expressing neuropeptide Y m R N A in the
infundibular hypothalamus of Japanese quail are activated by fasting and co-express
agouti-related protein m R N A , Molecular Brain Research. 100:31-42.
Braganza AF, Peterson R A & Cenedella RJ (1973) The effects of heat and glucagon on the
plasma glucose and free fatty acids of the domestic fowl, Poultry Science. 52:58-
63.
Bray G A & Popkin B M (1998) Dietary fat intake does affect obesity!, American Journal of
Clinical Nutrition. 68(6): 1157-1173.
Brien F D (1986) Effect of suppressing prolactin in the mouse on liveweight, food intake
and ovulation rate, Australian Journal of Biological Science. 39:311-318.
Brobeck JR (1946) Mechanism of the development of obesity in animals with
hypothalamic lesions, Physiological Reviews. 26:541-559.
Bruijnzeel A W , Stam R, Compaan JC & Wiegant V W (2001) Stress-induced sensitization
of CRH-ir but not P-CREB-ir responsivity in the rat central nervous system, Brain
Research. 928(2): 187-196.
Bryant M G , Polak M M , Modlin I, Bloom SR, Albuquerque R H & Pearse A G (1976)
Possible dual role for vasoactive intestinal peptide as gastrointestinal hormone and
neurotransmitter substance, Lancet. 1:991-993.
Buchanan C, Mahesh V, Zamorano P & Brann D (1998) Central nervous system effects of
leptin, Trends in Endocrinology & Metabolism. 9(4): 146-150.
Buckland RB, Blagrave K & Lague P C (1974) Competitive protein-binding assay for
corticoids in the peripheral plasma of the immature chicken, Poultry Science.
53:241-245.
Bungo T, Shimojo M , Masuda Y, Tachibanab T, Tanaka S, Sugahara K & Furuse M
(1999) Intracerebroventricular administration of mouse leptin does not reduce food
intake in the chicken, Brain Research. 817:196-198.
Bibliography 172
Buntin JD & Tesch D (1985) Effects of intracranial prolactin administration on
maintenance of incubation readiness, ingestive behavior, and gonadal condition in
ring doves, Hormones & Behavior. 19:188-203.
Buntin JD & Figge G R (1988) Prolactin and growth hormone stimulate food intake in ring
doves, Pharmacology Biochemistry and Behavior. 31:533-540.
Buntin JD, Hnasko R M & Zuzick P H (1999) Role of the ventromedial hypothalamus in
prolactin-induced hyperphagia in ring doves, Physiology & Behavior. 66(2):255-
261.
Burkardt HJ (2000) Standardization and quality control of P C R analyses, Clinical
Chemistry and Laboratory Medicine. 38(2): 87-91.
Buttemer W & Dawson T (1989a) Body temperature, water flux and estimated energy
expenditure of incubating emus (Dromaius novaehollandiae), Comparative
Biochemistry & Physiology. 94:21-24.
Buttemer W A & Dawson TJ (1989b) E m u winter incubation: thermal, water and energy
relations in: Physiology of cold adaptation in birds. N A T O ASI series, Series A.
315-324pp. Eds; C Bech & R Reinertsen. Plenum Press, N e w York.
Byatt JC, Staten NR, Salsgiver WJ, Kostelc JG & Collier RJ (1993) Stimulation of food
intake and weight gain in mature female rats by bovine prolactin and bovine growth
hormone, American Journal of Physiology. 264(6I):E986-E992.
Campbell J, Rastogi K S & Hausler H R (1966) Hyperinsulinemia with diabetes induced by
corticosterone, and the influence of growth hormone in the Chinese hamster,
Endocrinology. 79:749-756.
Campfield LA, Smith FJ, Guisez Y, Devos R & Burn P (1995) Recombinant mouse O B
protein: evidence for a peripheral signal linking adiposity and central neural
networks, Science. 269:546-549.
Campfield LA, Smith FJ & Burn P (1996) The ob protein (leptin) pathway - a link between
adipose tissue mass and central neural networks, Hormone and Metabolic
Research. 28:619-632.
Carlquist M , Mutt V & Jornvall H (1979) Isolation and characterization of bovine
vasoactive intestinal peptide (VIP), FEBS Letters. 108:457-460.
Carlquist M , McDonald TJ, G o VL, Bataille D, Johansson C & Mutt V (1982) Isolation
and amino acid composition of human vasoactive intestinal polypeptide, Hormone
and Metabolic Research. 14:28-29.

Bibliography 173
Castellini M A & Rea L D (1992) The biochemistry of natural fasting at its limits,
Experientia. 48:575-582.
Chaiseha Y & El-Halawani M E (1999) Expression of vasoactive intestinal peptide/peptide
histidine isoleucine in several hypothalamic areas during the turkey reproductive
cycle: relationship to prolactin secretion, Neuroendocrinology. 70:402-412.
Chapman DP, Bacon W L , Long D W , Kurima K & Burke W H (1994) Photostimulation
changes the pattern of luteinizing hormone secretion in turkey hens, General and
Comparative Endocrinology. 96:63-1 A.
Cherel Y, Robin JP, Walch O, Karmann H, Netchitailo P & Le Maho Y (1988) Fasting in
king penguin. I. Hormonal and metabolic changes during breeding, American
Journal of Physiology. 254:R170-R177.
Chieri RA, Basabe JC, Farina J M S & Foglia V G (1972) Studies on the carbohydrate
metabolism in penguins (Pygocellis papua), General and Comparative
Endocrinology. 18:1-4.
Chilliard Y, Bocquier F & Doreau M (1998) Digestive and metabolic adaptations of
ruminants to undernutrition, and consequences on reproduction, Reproduction,
Nutrition and Development. 38:131-152.
Choi Y H , Ohno N, Okumura J, Denbow D M & Furuse M (1997) Effects of
intracerebroventricular injection of clonidine and neuropeptide Y on food intake in
the chicken, Japanese Poultry Science. 34:58-62.
Chomczynski P & Sacchi N (1987) Single-step method of R N A isolation by acid
guanidinium thiocyanate-phenol-chloroform extraction, Analytical Biochemistry.
162:156-159.
Chronwall B M , DiMaggio D A , Massari VJ, Pickel V M , Ruggiero D A & O'Donohue T L
(1985) The anatomy of neuropeptide-Y-containing neurons in the rat brain,
Neuroscience. 15:1159-1181.
Chua SC Jr., Leibel R L & Hirsch J (1991) Food deprivation and age modulate
neuropeptide gene expression in the murine hypothalamus and adrenal gland,
Molecular Brain Research. 9:95-101.

Bibliography 174
Cieslak SR & Hazelwood R L (1983) Does somatostatin (SRIF) stimulate glucagon release
in aves?, Endocrinology. 112 (Supplement; Abstract 1271).
Clarke IJ, Scott CJ, Rao A, Pompolo S & Barker-Gibb M L (2000) Seasonal changes in the
expression of neuropeptide Y and pro-opiomelanocortin m R N A in the arcuate
nucleus of the ovariectomized ewe: relationship to the seasonal appetite and
breeding cycles, Journal of Neuroendocrinology. 12(11): 1105-1111.
Conn C & Joseph D (1962) Influence of body weight and body fat on appetite of "normal"
lean and obese rats, The Yale Journal of Biology and Medicine. 34:598-607.
Collins S, Kiihn C M , Petro AE, Swick A G , Chrunyk B A & Surwit RS (1996) Role of
leptin in fat regulation, Nature. 380:677.
Concannon P, Levac K, Rawson R, Tennant B & Bensadoun A (2001) Seasonal changes in
serum leptin, food intake, and body weight in photoentrained woodchucks,
American Journal of Physiology. 281(3):R951-R959.
Considine RV, Sinha M K , Heiman M L , Kriauciunas A, Stephens T W , Nyce M R ,
Ohannesian JP, Marco CC, McKee LJ, Bauer T L & Caro JF (1996) Serum
immunoreactive-leptin concentrations in normal-weight and obese humans, The
New England Journal of Medicine. 334(No. 5):292-295.
Corah TJ, Tatum JD, Morgan JB, Mortimer R G & Smith G C (1995) Effects of
dexamethasone implant on deposition of intramuscular fat in genetically identical
cattle, Journal of Animal Science. 73:3310-3316.
Corder R, Pralong F, Turnhill D, Saudan P, Muller A F & Gaillard R C (1988)
Dexamethasone treatment increases neuropeptide Y levels in rat hypothalamic
neurones, Life Sciences. 43:1879-1886.
Costa A, Poma A, Martignoni E, Nappi G, Ur E & Grossman A (1997) Stimulation of
corticotrophin-releasing hormone release by the obese (ob) gene product, leptin,
from hypothalamic explants, Neuroreport. 8(5): 1131-1134.
Covasa M & Ritter R C (1998) Rats maintained on high-fat diets exhibit reduced satiety in
response to C C K and bombesin, Peptides. 19:1407-1415.
Covasa M & Ritter R C (1999) Reduced sensitivity to the satiation effect of intestinal oleate
in rats adapted to high-fat diet, American Journal of Physiology. 277:R279-R285.
Crespo N & Esteve-Garcia E (2002) Dietary linseed oil produces lower abdominal fat
deposition but higher de novo fatty acid synthesis in broiler chickens, Poultry
Science. 81(10): 1555-62.

Bibliography 175
Crisostomo S, Guemene D, Garreau-Mills M & Zadworny D (1997) Prevention of the
expression of incubation behaviour using passive immunisation against prolactin in
turkey hens (Meleagris gallopavo), Reproduction, Nutrition, Development. 37:253-
266.
Curlewis JD, Loudon ASI, Milne JA & McNeilly A S (1988) Effects of chronic long-acting
bromocriptine treatment on liveweight, voluntary food intake coat growth and
breeding season in non-pregnant red deer hinds, Journal of Endocrinology.
119(3):413-420.
Curlewis JD, Sibbald A M , Milne JA & McNeilly A S (1991) Chronic treatment with long-
acting bromocriptine does not affect duration of the breeding season, voluntary food
intake, body weight, or wool growth in the Scottish Blackface ewe, Reproduction,
Fertility, & Development. 3(l):25-33.
Currie PJ & Coscina D V (1995) Dissociated feeding and hypothermic effects of
neuropeptide Y in the paraventricular and perifornical hypothalamus, Peptides.
16(4):599-604.
Dallman M F , Strack A M , Akana SF, Bradbury MJ, Hanson ES, Scribner K A & Smith M
(1993) Feast and famine: critical role of glucocorticoids with insulin in daily energy
flow, Frontiers in Neuroendocrinology. 14:303-347.
Dallman M F , Akana SF, Strack A M , Hanson ES & Sebastian RJ (1995) The neural
network that regulates energy balance is responsive to glucocorticoids and insulin
and also regulates H P A axis responsivity at a site proximal to C R F neurons,
Annals of the New York Academy of Sciences. 771:730-7'42.
Dallman M F , Akana SF, Bhatnagar S, Bell M E , Choi S, Chu A, Horsley C, Levin N,
Meijer O, Soriano LR, Strack A M & Viau V (1999) Starvation: early signals,
sensors, and sequelae, Endocrinology. 140(9):4105-4023.
Darras V M , Geris KL, Buyse J, Berghman LR, Decuypere E & Kiihn E R (1997) Thyroid
hormone secretion and peripheral deiodination in the chicken: hormonal and
nutritional influences in: Perspectives in Avian Endocrinology, pp 317-328. Eds; S
Harvey & RJ Etches. Journal of Endocrinology Ltd, Bristol.
Davies L & Marks JL (1994) Role of hypothalamic neuropeptide Y gene expression in
body weight regulation, American Journal of Physiology. 266:R1687-R1691.

Bibliography 176
Davies SJJF (1978) The food of emus, Australian Journal of Ecology. 3:411-422.
Dawson A (1996) Neoteny and the thyroid in ratites, Reviews of Reproduction. 1:78-81.
Dawson A & Deeming D C (1997) Thyroid function in ostriches compared to that in non-
ratite species, Proceedings of the Xllf International Congress of Comparative
Endocrinology, Eds; S Kawashima & S Kikuyama. Monduzzi Editore, Bologna, pg
439-444.
Dawson A, Deeming D C , Dick A C K & Sharp PJ (1996) Plasma thyroxine concentrations
in farmed ostriches in relation to age, body weight and growth hormone, General
and Comparative Endocrinology. 103(3):308-315.
Deaton JW, McNaughton JL, Reece F N & Lott B D (1981) Abdominal fat of broilers as
influenced by dietary level of animal fat, Poultry Science. 60:1250-1253.
Deeming D C & Angel C R (1996) Introduction to the ratites and farming operations around
the world, Improving our understanding of ratites in a farming environment, Ratite
Conference, pp 1-4.
Denbow D M (1986) The influence of prolactin on food intake of turkey hens, Poultry
Science. 65(6): 1197-1200.
Denbow D M (1999) Food intake regulation in birds, Journal of Experimental Zoology.
283:333-338.
Denbow D M & Meyers R D (1982) Inhibition of food intake of chickens following
injections of cholecystokinin into the lateral ventricle of the brain, Poultry Science.
61:1449.
De Schepper J, Zhou X, De Bock S, Smitz J, Louis O, Hooghe-Peters E & Vandenplas Y
(1998) Study of serum leptin in cafeteria-diet-overfed rats, Hormone Research.
50:271-275.
Devenport L, Knehans A, Sundstrom A & Thomas T (1989) Corticosterone's dual
metabolic actions, Life Sciences. 45:1389-1396.
De Vos P, Saladin R, Auwerx J & Staels B (1995) Induction of ob gene expression by
corticosteroids is accompanied by body weight loss and reduced food intake, The
Journal of Biological Chemistry. 270 (No. 27):15958-15961.
Diersen-Schade D A , Richard MJ, Beitz D C & Jacobson N L (1985) Effects of beef, soy
and conventional diets on body composition and plasma lipids of young pigs fed
restricted Or liberal amounts of diet, Journal of Nutrition. 115:1016-1024.
Dimaline R, Reeve JR Jr., Shively JE & Hawke D (1984) Isolation and characterization of
rat vasoactive intestinal peptide, Peptides. 5:183-187.

Bibliography 177
Dingle JG (1997) E m u and ostrich production and its consequences for human nutrition,
Proceedings of the Nutrition Society of Australia. 21:31-A3.
Dube M G , X u B, Crowley W R , Kalra PS & Kalra SP (1994) Evidence that neuropeptide Y
is a physiological signal for normal food intake, Brain Research. 646:341-344.
Duke G E (1986) Alimentary canal: secretion and digestion, special digestive functions,
and absorption in: Avian Physiology 4th edition. 289-302pp. Ed; P D Sturkie.
Springer-Verlag, N e w York.
Dulin W E (1956) Effects of corticosterone, cortisone and hydrocortisone on fat
metabolism in the chick, Proceedings of the Society for Experimental Biology and
Medicine. 92:253-255.
Dunn IC, Girishvarma G, Talbot RT, Waddington D, Boswell T & Sharp PJ (2001)
Evidence for low homology between the chicken and mammalian leptin genes, in:
Avian Endocrinology. 327-336pp. Eds; A Dawson & C M Chaturvedi. Narosa
Publishing House, N e w Delhi.
Ebenezer IS & Parrott R F (1991) Operant food intake in pigs following
intracerebroventricular (i.c.v.) administration of prolactin, General Pharmacology.
22(5):811-813.
Edmonds K E & Stetson M H (1994) Photoperiod and melatonin affect testicular growth in
the marsh rice rat (Oryzomys palustris), Journal of Pineal Research. 17:86-93.
Edozien JC & Switzer B R (1978) Influence of diet on growth in the rat, Journal of
Nutrition. 108:282-290.
El Halawani M E , Silsby JL, Rozenboim I & Pitts JR (1995) increased egg production by
active immunization against vasoactive intestinal peptide in the turkey (Meleagris
galloparvo), Biology of Reproduction. 52:179-183.
El Halawani M E , Pitts JR, Sun S, Silsby JL & Sivanandan V (1996) Active immunization
against vasoactive intestinal peptide prevents photo-induced prolactin secretion in
turkeys, General and Comparative Endocrinology. 104:76-83.
Emond M , Schwartz GJ, Ladenheim E E & Moran T H (1999) Central leptin modulates
behavioral and neural responsivity to C C K , American Journal of Physiology.
276:R1545-R1549.
Erickson JC, Clegg K E & Palmiter R D (1996) Sensitivity to leptin and susceptibility to
seizures of mice lacking neuropeptide Y, Nature. 381:415-418.
Erlich H A , Gelfand D & Sninsky J J (1991) Recent advances in the polymerase chain
reaction, Science. 252:1643-1651.

Bibliography 178
Etches RJ (1976) A radioimmunoassay for corticosterone and its application to the
measurement of stress in poultry, Steroids. 28(6):763-773.
Etches RJ, Williams JB & Rzasa J (1984) Effects of corticosterone and dietary changes in
the hen on ovarian function, plasma L H and steroids and the response to exogenous
LH-RH, Journal of Reproduction and Fertility. 70:121-130.
Faust M , Johnson PR, Stern JS & Hirsch J (1978) Diet-induced adipocyte number
increase in adult rats: a new model of obesity, American Journal of Physiology.
235:E279-E286.
Fery F, Plat L, Melto C & Balasse E O (1996) Role of fat-derived substrates in the
regulation of gluconeogenesis during fasting, American Journal of Physiology.
270:E822-E830.
Flatt JP, Ravussin E, Acheson K & Jequier E (1985) Effects of dietary fat on postprandial
substrate oxidation and carbohydrate and fat balances, Journal of Clinical
Investigation. 76:1019-1024.
Follet BK, Scanes C G & Cunningham FJ (1972) A radioimmunoassay for avian luteinizing
hormone, Journal of Endocrinology. 52:359-378.
Forbes J M (1988) Relationships between feed intake, energy balance and adiposity in:
Leanness in Domestic Birds. 97-123pp. Eds; B Leclerq & C C Whitehead.
Butterworth & Co. Ltd - INRA, Sydney.
Frederich R C , Hamann A, Anderson S, Lollmann B, Lowell B B & Flier JS (1995) Leptin
levels reflect body lipid content in mice: evidence for diet-induced resistance to
leptin action, Nature Medicine. 1(12): 1311-1314.
French SJ, Murray B, Rumsey R D E , Fadzlin R & Read N W (1995) Adaptation to high-fat
diets: effects of eating behaviour and plasma cholecystokinin, British Journal of
Nutrition. 73:179-189.
Friedman J M (1996) Leptin and control of body weight, Proceedings of the Nutrition
Society of Australia. 20:1-2.
Friedman M I (1998) Fuel partitioning and food intake, American Journal of Clinical
Nutrition. 67(supp.):513S-518S.
Friedman-Einat M , Boswell T, Horev G, Girishvarma G, Dunn IC, Talbot R T & Sharp PJ
(1999) The chicken leptin gene: has it been cloned?, General and Comparative
Endocrinology. 115:354-363.

Bibliography 179
Fuxe K, Andersson K, Hokfelt T, Mutt V, Ferland L, Agnati LF, Ganten D, Said S,
Eneroth P & Gustafsson J-A (1979) Localization and possible function of
peptidergic neurons and their interactions with central catecholamine neurons, and
the central actions of gut hormones, Federation Proceedings. 38:2333-2340.
Garcia-Rodrfguez T, Ferrer M , Carrillo JC & Castroviejo J (1987) Metabolic responses of
Buteo Buteo to long-term fasting and refeeding, Comparative Biochemistry and
Physiology. 87A:381-386.
Gehlert D R (1999) Role of hypothalamic neuropeptide Y in feeding and obesity,
Neuropeptides. 33(5):329-338.
Gerardo-Gettens T, Moore BJ, Stern JS & Horwitz B A (1989a) Prolactin stimulates food
intake in the absence of ovarian progesterone, American Journal of Physiology.
256:R701-R706.
Gerardo-Gettens T, Moore BJ, Stern JS & Horwitz B A (1989b) Prolactin stimulates food
intake in a dose-dependent manner, American Journal of Physiology. 256:R276-
R280.
Geris KL, Berghman LR, Kuhn E R & Darras V M (1999) The drop in plasma thyrotropin
concentrations in fasted chickens is caused by an action at the level of the
hypothalamus: a role of corticosterone, Domestic Animal Endocrinology.
16(4):231-237.
Goschke H & Tholen H (1977) Carbohydrate intolerance during complete fasting,
Schweizerische Medizinische Wochenschrift. Journal Suisse de Medecine.
107:1847-1850.
Greenman D L & Zarrow M X (1961) Steroids and carbohydrate metabolism in the
domestic bird, Proceedings of the Society for Experimental Biology and Medicine.
106:459-462.
Grill HJ, Markison S, Ginsberg A & Kaplan J M (2000) Long-term effects of feeding and
body weight after stimulation of forebrain or hindbrain C R H receptors with
urocortin, Brain Research. 867(1-2): 19-28.
Griminger P (1986) Lipid metabolism in: Avian Physiology. 4th edition. 345-358pp. Ed;
P D Sturkie. Springer-Verlag, N e w York, America.
Groscolas R & Leloup J (1989) The effect of severe starvation and captivity stress on
plasma thyroxine and triiodothyronine concentrations in an antartic bird (Emporer
penguin), General and Comparative Endocrinology. 73:108-117.

Bibliography 180
Groscolas R & Rodriguez A (1981) Glucose metabolism in fed and fasted emporer
penguins (Aptenodytes forsteri), Comparative Biochemistry and Physiology.
70:191-198.
Gupta P & Brush FR (1998) Differential behavioral and endocrinological effects of
corticotropin-releasing hormone (CRH) in the Syracuse high- and low-avoidance
rats, Hormones & Behavior. 34(3):262-267.
Halaas JL, Gajiwala KS, Maffei M , Cohen SL, Chait BT, Rabinowitz D, Lallone RL,
Burley A K & Friedman J M (1995) Weight-reducing effects of the plasma protein
encoded by the obese gene, Science. 269:543-546.
Hammond E L (2000) A molecular genetic study of the emu, Dromaius novaehollandiae,
PhD. thesis, School of Biomedical Sciences, Curtin University of Technology.
Hammond R W , Todd H & Hertelendy F (1980) Effects of mammalian gonadotrophins on
progesterone release and cyclic nucleotide production by isolated avian granulosa
cells, General and Comparative Endocrinology. 41:467-476.
Hanks M C , Talbot R T & Sang H M (1989) Expression of biologically active recombinant-
derived chicken prolactin in E. coli, Journal of Molecular Endocrinology. 3:15-21.
Harris AR, Fang SL, Azizi F, Lipworth L, Vagenakis A G & Barverman L E (1978) Effect
of starvation on hypothalamic-pituitary-thyroid function in the rat, Metabolism:
Clinical and Experimental. 27:1074-1083.
Harris RBS, Kasser T R & Martin RJ (1986) Dynamics of recovery of body composition
after overfeeding, food restriction or starvation of mature female rats, Journal of
Nutrition. 116:2526-2546.
Harris R B S & Martin RJ (1984a) Recovery of body weight from below "set point" in
mature female rats, Journal of Nutrition. 114:1143-1150.
Harris R B S & Martin RJ (1984b) Specific depletion of body fat in parabiotic partners of
tube-fed obese rats, American Journal of Physiology. 16:R380-R386.
Harvey S, Scanes C G , Chadwick A & Bolton NJ (1978) Influence of fasting, glucose and
insulin on the levels of growth hormone and prolcatin in the plasma of the domestic
fowl (Gallus domesticus), Journal of Endocrinology. 76:501-506.
Hausberger F X & Ramsay AJ (1953) Steroid diabetes in guinea pigs: effects of cortisone
administration on blood- and urinary glucose, nitrogen excretion, fat deposition,
and the islets of Langerhans, Endocrinology. 53:423-435.
Havel PJ, Townsend R, Chaump L & Teff K (1999) High-fat meals reduce 24-h circulating
leptin concentrations in women, Diabetes. 48:334-341.

Bibliography 181
Hazelwood R L (1986) Carbohydrate metabolism in: Avian Physiology. 4th edition. 303-
325pp. Ed; P D Sturkie. Springer-Verlag, N e w York, USA.
Hazelwood R L & Lorenz F W (1959) Effects of fasting and insulin on carbohydrate
metabolism of the domestic fowl, American Journal of Physiology. 197:47-51.
Heil S H (1999) Sex-specific effects of prolactin on food intake by rats, Hormones &
Behavior. 35:47-54.
Heinrichs S C & Richard D (1999) The role of corticotropin-releasing factor and urocortin
in the modulation of ingestive behavior, Neuropeptides. 33(5):350-359.
Helmreich DL, Itoi K, Lopez-Figueroa M O , Akil H & Watson SJ (2001) Norepinephrine-
induced C R H and A V P gene transcription within the hypothalamus: differential
regulation by corticosterone, Brain Research. Molecular Brain Research. 88(1-
2):62-73.
Hervey G R (1959) The effects of lesions in the hypothalamus in parabiotic rats, Journal of
Physiology. 145:336-352.
Hetherington A W & Ranson S W (1940) Hypothalamic lesions and adiposity in the rat,
Anatomical Record. 78:149-172.
Hetherington A W & Ranson S W (1942) The spontaneous activity and food intake of rats
with hypothalamic lesions, American Journal of Physiology. 136:609-617.
Hill JO, Lin D, Yakuba F & Peters JC (1992) Development of dietary obesity in rats:
influence of amount and composition of dietary fat, International Journal of
Obesity. 16:321-333.
Hissa R, Hohtola E, Tuomala-Saramaki T, Laine T & Kallio H (1998) Seasonal changes in
fatty acids and leptin contents in the plasma of the European brown bear (Ursus
arctos arctos), Annales Zoolgici Fennici. 35:215-224.
Hnasko R M & Buntin JD (1993) Functional mapping of neural sites mediating prolactin-
induced hyperphagia in doves, Brain Research. 623:257-266.
Horev G, Einat P, Aharoni T, Eshdat Y & Friedman-Einat M (2000) Molecular cloning
and properties of the chicken leptin-receptor (CLEPR) gene, Molecular and
Cellular Endocrinology. 162:95-106.
Horseman N D & Buntin JD (1995) Regulation of cropmilk secretion and parental
behaviours by prolactin, Annual Reviews of Nutrition. 15:213-238.
Horton TH, Buxton O M , Losee-Olson S & Turek F W (2000) Twenty-four-hour profiles of
serum leptin in Siberian and golden hamsters: photoperiodic and diurnal variations,
Hormones & Behavior. 37(4):388-98.

Bibliography 182
Horton T H & Yellon S M (2001) Aging, reproduction, and the melatonin rhythm in the
Siberian hamster, Journal of Biological Rhythms. 16(3):243-253.
H w a JJ, Ghibaudi L, Compton D, Fawzi A B & Strader C D (1996) Intracerebroventricular
injection of leptin increases thermogenesis and mobilizes fat metabolism in ob/ob
mice, Hormone and Metabolic Research. 28:659-663.
H w a JJ, Fawzi A B , Graziano M P , Ghibaudi L, Williams P, Van Heek M , Davis H,
Rudinski M , Sybertz E & Strader C D (1997) Leptin increases energy expenditure
and selectively promotes fat metabolism in ob/ob mice, American Journal of
Physiology. 272:R1204-R 1209.
Ikeda T, Ohtani I, Hoshino T, Tanaka Y, Takeuchi T & Mashiba H (1991) Possible role of
adrenergic mechanism in starvation-induced reduction in circulating thyroxine and
triiodothyronine in rats, Journal of Endocrinological Investigation. 14:181 -185.
Imundo J, Bielefeld E, Dodge J & Badura L L (2001) Relationship between norepinephrine
release in the hypothalamic paraventricular nucleus and circulating prolactin levels
in the Siberian hamster: role of photoperiod and the pineal gland, Journal of
Biological Rhythms. 16(2): 173-182.
Inui A (1999a) Neuropeptide Y: a key molecule in anorexia and cachexia in wasting
disorders?, Molecular Medicine Today. 5(2):79-85.
Inui A (1999b) Feeding and body-weight regulation by hypothalamic neuropeptides -
mediation of the actions of leptin, Trends in Neurosciences. 22:62-67.
Jang M , Mistry A, Swick A G & Romsos D R (2000) Leptin rapidly inhibits hypothalamic
neuropeptide Y secretion and stimulates corticotropin-releasing hormone secretion
in adrenalectomized rats, Journal of Nutrition. 130(11):2813-2820.
Jang M & Romsos D R (1998) Neuropeptide Y and corticotropin-releasing hormone
concentrations within specific hypothalamic regions of lean but not ob/ob mice
respond to food-deprivation and refeeding, Journal of Nutrition. 128:2520-2525.
Janik D S & Buntin JD (1985) Behavioral and physiological effects of prolactin in
incubating ring doves, Journal of Endocrinology. 105:201-209.
Janowitz H D & Hollander F (1955) The time factor in the adjustment of food intake to
varied caloric requirement in the dog: a study of the precision of appetite regulation,
Annals New York Academy of Sciences. 63:5 8-67.
Jensen M D , Hensrud D, O'Brien P C & Nielsen S (1999) Collection and interpretation of
plasma leptin concentration data in humans, Obesity Research. 7(3):241-245.

Bibliography 183
Johnson E M & Hazelwood R L (1982) Avian pancreatic polypeptide (APP) levels in
fasted-refed chickens: locus of postprandial trigger?, Proceedings of the Society of
Experimental Biology and Medicine. 169:175-182.
Jones S (1999) Almost like a whale - the origin of species updated. Trans world Publishers
Ltd, London.
Joseph J & Ramachandran A V (1992) Alterations in carbohydrate metabolism by
exogenous dexamethasone and corticosterone in post-hatched white leghorn chicks,
British Poultry Science. 33(5): 1085-1096.
Kacsoh B (2000) Endocrine Physiology, Ed; J Dolan. McGraw-Hill Companies, Inc.,
Sydney.
Kafri I, Rosebrough R W , McMurtry JP & Steele N C (1988) Research note: corticosterone
implants and supplemental dietary ascorbic acid effects on lipid metabolism in
broiler chicks, Poultry Science. 67:1356-1359.
Kameda Y, Miura M & Nishimaki T (2001) Localization of neuropeptide Y m R N A and
peptide in the chicken hypothalamus and their alterations after food deprivation,
dehydration, and castration, Journal of Comparative Neurology. 436(3):378-388.
Kato Y, Iwasaki Y, Iwasaki J, Abe H, Yanaihara N & Imura H (1978) Prolactin release by
vasoactive intestinal polypeptide in rats, Endocrinology. 103:554-558.
Kennedy G C (1950) The hypothalamic control of food intake in rats, Proceedings of the
Royal Society of London series B Biological Science. 137:535-549.
Kennedy G C (1953) The role of depot fat in the hypothalamic control of food intake in the
rat, Proceedings of the Royal Society of London series B Biological Science.
140:578-592.
Kim J-Y, Nolte LA, Hansen PA, Han D-H, Ferguson K, Thompson P A & Holloszy JO
(2000) High-fat diet-induced muscle insulin resistance: relationship to visceral fat
mass, American Journal of Physiology. 279:R2057-R2065.
Kleiber M (1961) The fire of life: an introduction to animal energetics. John Wiley and
Sons, Inc., N e w York.
Kolaczynski JW, Goldstein BJ & Considine R V (1997) Dexamethasone, O B gene, and
leptin in humans; effect of exogenous hyperinsulinemia, Journal of Clinical
Endocrinology and Metabolism. 82(11):3895-3897.

Bibliography 184
Kriegsfeld LJ, Ranalli NJ, Bober M A & Nelson RJ (2000) Photoperiod and temperature
interact to affect the G n R H neuronal system of male prairie voles (Microtus
ochrogaster), Journal of Biological Rhythms. 15(4):306-316.
Kuenzel WJ, Douglass L W & Davison B A (1987) Robust feeding following central
administration of neuropeptide Y or peptide Y Y in chicks, Gallus domesticus,
Peptides. 8(5):823-828.
Kuenzal WJ, McCune SK, Talbot RT, Sharp PJ & Hill J M (1997) Sites of gene expression
for vasoactive intestinal polypeptide throughout the brain of the chick (Gallus
domesticus), The Journal of Comparative Neurology. 381:101-118.
Kiihn ER, Berghman LB, Moons L, Vandescande F, Decuypere E & Darras V M (1993)
Hypothalamic and peripheral control of thyroid function during the life cycle of the
chicken in: Avian Endocrinology, pp 29-46. Ed; PJ Sharp. Journal of
Endocrinology Ltd, Bristol.
Laycock J & Wise P (1996) Essential Endocrinology, 3rd edition. Oxford University Press
Inc., N e w York.
Lea R W , Klandorf H, Harvey S & Hall T R (1992) Thyroid and adrenal function in the ring
dove (Streptopelia risoria) during food deprivation and a breeding cycle, General
and Comparative Endocrinology. 86:13 8-146.
Le Maho Y, Kha H V V , Koubi H, Dewasmes G, Girard J, Ferre P & Cagnard M (1981)
Body composition, energy expenditure, and plasma metabolites in long-term fasting
geese, American Journal of Physiology. 241:E342-E354.
Lemonnier D, Suquet JP, Aubert R, De Gasqyuet P & Pequigbot E (1975) Metabolism of
the mouse made obese by a high-fat diet, Diabete et Metabolisme. 1:77-85.
Lepkovsky S & Yasuda M (1965) Hypothalamic lesions, growth and body composition of
male chickens, Poultry Science. 45:582-588.
Levine A S & Morley JE (1984) Neuropeptide Y: a potent inducer of consummatory
behavior in rats, Peptides. 5(6): 1025-1029.
Leyton J, Drury PJ & Crawford M A (1987) Differential oxidation of saturated and
unsaturated fatty acids in vivo in the rat, British Journal of Nutrition. 57:383-393.
Lincoln G A (1994) Effects of placing micro-implants of melatonin in the pars tuberalis,
pars distalis and the lateral septum of the forebrain on the secretion of F S H and
prolactin, and testicular size in rams, Journal of Endocrinology. 142:267-276.

Bibliography 185
Lopez A, Sims DE, Ablett RF, Skinner RE, Leger L W , Lariviere C M , Jamieson LA,
Martfnez-Burns J & Zawadzka G G (1999) Effect of emu oil on auricular
inflammation induced with croton oil in mice, American Journal of Veterinary
Research. 60(12): 1558-1561.
Lu X-Y, Shieh K-R, Kabbaj M , Barsh GS, Akil H & Watson SJ (2002) Diurnal rhythm of
agouti-related protein and its relation to corticosterone and food intake,
Endocrinology. 143(10):3905-3915.
Lundbaek K & Stevenson A F (1947) Reduced carbohydrate intake after fat feeding in
normal rats and rats with hypothalamic hyperphagia, American Journal of
Physiology. 151:530-537.
Lyle RR, de Boer G, Harrison R O & Young J W (1984) Plasma and liver metabolites and
glucose kinetics as affected by prolonged ketonemia-glucosuria and fasting in
steers, Journal of Dairy Science. 67:2274-2282.
Macnamee M C , Sharp PJ, Lea R W , Sterling RJ & Harvey S (1986) Evidence that
vasoactive intestinal polypeptide is a physiological prolactin-releasing factor in the
bantam hen, General and Comparative Endocrinology. 62:470-478.
Maffei M , Halaas J, Ravussin E, Pratley RE, Lee G H , Zhang Y, Fei H, Kim S, Lallone R,
Ranganathan S, Kern P A & Friedman J M (1995) Leptin levels in human and
rodent: measurement of plasma leptin and ob R N A in obese and weight-reduced
subjects, Nature Medicine. 1(11): 1155-1161.
Makino S, Nishiyama M , Asaba K, Gold P W & Hashimoto K (1998) Altered expression of
type 2 C R H receptor m R N A in the V M H by glucocorticoids and starvation,
American Journal of Physiology. 275:R1138-R1145.
Malecki JA, Martin GB, O'Malley PJ, Meyer GT, Talbot R T & Sharp PJ (1998) Endocrine
and testicular changes in a short-day seasonally breeding bird, the emu (Dromaius
novaehollandiae), in southwestern Australia, Animal Reproduction Science.
53:143-155.
Malendowicz L K & MiSkowiak B (1990) Effects of prolonged administration of
neurotensin, arginine-vasopressin, NPY, and bombesin on blood TSH, T3 and T4
levels in the rat, In Vivo. 4(4):259-261.

Bibliography 186
Maney DL, Schoech SJ, Sharp PJ & Wingfield JC (1999) Effects of vasoactive intestinal
peptide on plasma prolactin in passerines, General and Comparative
Endocrinology. 113:323-330.
Marie M , Findlay PA, Thomas L & A d a m C L (2001) Daily patterns of plasma leptin in
sheep: effects of photoperiod and food intake, Journal of Endocrinology.
170(l):277-286.
Marks JL, Li M , Schwartz M , Porte D Jr. & Baskin D G (1992) Effect of fasting on
regional levels of neuropeptide Y m R N A and insulin receptors in the rat
hypothalamus: an autoradiographic study, Molecular and Cellular Neurosciences.
3:199-205.
Marks JL & Waite K (1996) Some acute effects of intracerebroventricular neuropeptide Y
on insulin secretion and glucose metabolism in the rat, Journal of
Neuroendocrinology. 8:507-513.
Marks JL & Waite K (1997) Intracerebro ventricular neuropeptide Y acutely influences
glucose metabolism and insulin sensitivity in the rat, Journal of
Neuroendocrinology. 9:99-103.
Masuzaki H, Ogawa Y, Isse N, Satoh N, Okazaki T, Shigemoto M , Mori K, Tamura N,
Hosoda K, Yoshimasa Y, Jingami H, Kawada T & Nakao K (1995) Human obese
gene expression - Adipocyte-specific expression and regional differences in the
adipose tissue, Diabetes. 44:855-858.
Mateos G G , Sell JL & Eastwood JA (1982) Rate of food passage (transit time) as
influenced by level of supplemental fat, Poultry Science. 61:94-100.
Matson C A & Ritter R C (1999) Long-term CCK-leptin synergy suggests a role for C C K in
the regulation of body weight, American Journal of Physiology. 276:R1038-
R1045.
Mauro U , Elde RP, Youngren O M , Phillips R E & El Halawani M E (1989) Alterations in
hypothalmic vasoactive intestinal peptide-like immunoreactivity are associated with
reproduction and prolactin release in the female turkey, Endocrinology. 125:1795-
1804.
Mawson P (1992) The emu, A P B Infonote 21/92. in: Emu farming, Department of
Agriculture Western Australia miscellaneous publication.
McCarthy H D , McKibbin PE, Perkins A V , Linton E A & Williams G (1993) Alterations in
hypothalamic N P Y and C R F in anorexic tumor-bearing rats, American Journal of
Physiology. 264:E638-E643.

Bibliography 187
McCormick C C & Cunningham D L (1987) Performance and physiological profiles of high
dietary zinc and fasting as methods of inducing a forced rest: a direct comparison,
Poultry Science. 66:1007-1013.
McDonald P, Edwards RA, Greenhalgh JFD (1981) Animal Nutrition. 3rd edition.
Longman Inc., N e w York.
McGrath R E (1997) Understanding statistics, a research perspective. Ed; C Woods.
Addison Wesley Longman, Inc. Sydney.
McGregor GP, Desaga JF, Ehlenz K, Fischer A, Heese F, Hegele A, Lammer C, Peiser C
& Lang R E (1996) Radioimmunological measurement of leptin in plasma of obese
and diabetic human subjects, Endocrinology. 137:1501-1504.
McKibbin PE, Cotton SJ, McCarthy H D & Williams G (1992) The effect of
dexamethasone on neuropeptide Y concentrations in specific hypothalamic regions,
Life Sciences. 51:1301-1307.
McKinna D (1999) 'Marketing of New Animal Products', RIRDC publication no. 99/53
pp8.
McMurray CH, Blanchflower W J & Rice D A (1984) Automated kinetic method for
D-3-hydroxybutyrate in plasma or serum, Clinical Chemistry. 30(3):421-5.
McMurtry JP, Rosebrough R W & Steele N C (1983) A homologous radioimmunoassay for
chicken insulin, Poultry Science. 62(4):697-701.
McShane T M , Petersen SL, McCrone S & Keisler D H (1993) Influence of food restriction
on neurppeptide-Y, proopiomelanocortin, and luteinizing hormone-releasing
hormone gene expression in sheep hypothalami, Biology of Reproduction. 49:831-
839.
Menendez JA, McGregor IS, Healey PA, Atrens D M & Leibowitz SF (1990) Metabolic
effects of neuropeptide Y injections into the paraventricular nucleus of the
hypothalamus, Brain Research. 516:8-14.
Menzaghi F, Heinrichs SC, Pich E M , Tilders FJ & Koob G F (1993) Functional impairment
of hypothalamic corticotropin-releasing factor neurons with immunotargeted toxins
enhances food intake induced by neuropeptide Y, Brain Research. 618:76-82.
Mercer JG (1998) Regulation of appetite and body weight in seasonal mammals,
Comparative Biochemistry and Physiology, Part C. 119:295-303.
Mercer JG, Lawrence C B & Atkinson T (1996) Hypothalamic N P Y and C R F gene
expression in the food-deprived Syrian hamster, Physiology & Behavior. 60(1): 121-
127.

Bibliography 188
Mercer JG, Beck B, Burlet A, Moar K M , Hoggard N, Atkinson T & Barrett P (1998)
Leptin (ob) m R N A and hypothalamic N P Y in food-deprived/refed Syrian hamsters,
Physiology & Behavior. 64(2): 191-195.
Mercer JG, Moar K M , Ross A W & Morgan PJ (2000a) Regulation of leptin receptor,
P O M C and A G R P gene expression by photoperiod and food deprivation in the
hypothalamic arcuate nucleus of the male Siberian hamster (Phodopus sungorus),
Appetite. 34(1): 109-111.
Mercer JG, Moar K M , Ross A W , Hoggard N & Morgan PJ (2000b) Photoperiod regulates
arcuate nucleus P O M C , A G R P , and leptin receptor m R N A in Siberian hamster
hypothalamus, American Journal of Physiology. 278(1 ):R271-R281.
Meyer W (1998) Melatonin supplementation does not prevent photostimulatory effects of
night interruption lighting in Japanese quail, Journal of Pineal Research.
24(2): 102-107.
Michael D (2000) Benchmarks for New Animal Products - Emu & Ostrich Production,
RIRDC publication no. 00/136 pgs 15 & 17.
Miell JP, Englaro P & Blum W F (1996) Dexamethasone induces an acute and sustained
rise in circulating leptin levels in normal human subjects, Hormone and Metabolic
Research. 28:704-707.
Mincham R, Malecki JA, Williams K M , Blache D, Williams IH & Martin G B (1998)
Assessment of fat content and body composition in the emu (Dromaius
novaehollandiae), Proceedings of the Australian Society of Animal Production
Conference 'Animal Production in Australia". 22:197-200.
Mistry A M , Swick A G & Romsos D R (1997) Leptin rapidly lowers food intake and
elevates metabolic rates in lean and ob/ob mice, Journal of Nutrition. 127:2065-
2072.
Mitchell M A , MacLeod M G & Raza A (1986) The effects of A C T H and dexamethasone
upon plasma thyroid hormone levels and heat production in the domestic fowl,
Comparative Biochemistry and Physiology. 85:207-215.
Mizuno T M , Kleopoulos SP, Bergen HT, Roberts JL, Priest C A & Mobbs C V (1997)
Hypothalamic pro-opiomelanocortin m R N A is reduced by fasting in ob/ob and
db/db mice, but is stimulated by leptin, Diabetes. 47:294-297.

Bibliography 189
Mizuno T M , Makimura H, Silverstein J, Roberts JL, Lopingco T & Mobbs C V (1999)
Fasting regulates hypothalamic neuropeptide Y, agouti-related peptide, and
proopiomelanocortin in diabetic mice independent of changes in leptin or insulin,
Endocrinology. 140(10):4551-4557.
Moore BJ, Gerardo-Gettens T, Horwitz B A & Stern JS (1986) Hyperprolactinemia
stimulates food intake in the female rat, Brain Research Bulletin. 17:563-569.
Morley JE, Levine AS, Gosnell BA, Kneip J & Grace M (1987) Effect of neuropeptide Y
on ingestive behaviors in the rat, American Journal of Physiology. 252:R599-
R609.
Mrosovsky N (1976) Lipid programmes and life strategies in hibernators, American
Zoologist. 16:685-697.
Mrosovsky N & Sherry D F (1980) Animal anorexias, Science. 207:837-842.
Murakami T & Shima K (1995) Cloning of rat obese c D N A and its expression in obese
rats, Biochemical & Biophysical Research Communications. 209(3):944-952.
Muroya S, Yada T, Shioda S & Takigawa M (1999) Glucose-sensitive neurons in the rat
arcuate nucleus contain neuropeptide Y, Neuroscience Letters. 264:113-116.
Nagra C L (1965) Effect of corticosterone on lipids in hypophysectomized male chickens,
Endocrinology. 77:221-222.
Nagra C L & Meyer R K (1963) Influence of corticosterone on the metabolism of palmitate
and glucose in cockerals, General and Comparative Endocrinology. 3:131-138.
Nair KS, Woolf PD, Welle SL & Matthews D E (1987) Leucine, glucose, and energy
metabolism after 3 days of fasting in healthy human subjects, American Journal of
Clinical Nutrition. 46:557-562.
Nakavisut S (1998) The obese gene and voluntary feed intake in pigs, M.Sc.(Agric) thesis,
Animal Science, University of Western Australia.
Neel JV (1955) Diabetes mellitus: a "thrifty" genotype rendered detrimental by
"progress"?, American Journal of Human Genetics. 14:353-362.
Neumaier M , Braun A & Wagener C (1998) Fundamentals of quality assessment of
molecular amplification methods in clinical diagnostics, Clinical Chemistry.
44:12-26.
Newman RE, Bryden W L , Fleck E, Ashes JR, Buttemer W A , Storlien L H & Downing JA
(2002) Dietary n-3 and n-6 fatty acids alter avian metabolism: metabolism and
abdominal fat deposition, British Journal of Nutrition. 88(1): 11-18.

Bibliography 190
Nilsson A (1974) Isolation, amino acid composition and terminal amino acid residues of
the vasoactive actacosapeptide from chicken intestine. Partial purification of
chicken secretin, FEBS Letters. 47:284-289.
Nilsson A (1975) Structure of the vasoactive intestinal octacosapeptide from chicken
intestine. The amino acid sequence, FEBS Letters. 60:322-326.
Nishizawa Y & Bray G A (1980) Evidence for a circulating ergostatic factor: studies on
parabiotic rats, American Journal of Physiology. 239:R344-R351.
Niskanen LK, Haffner S, Karhunen LJ, Turpeinen A K , Miettinen H & Uusitupa MIJ
(1997) Serum leptin in obesity is related to gender and body fat topography but
does not predict successful weight loss, European Journal of Endocrinology.
137:61-67.
Noel M B & Woodside B, (1993) Effects of systemic and central prolactin injections on
food intake, weight gain, and estrous cyclicity in female rats, Physiology &
Behavior. 54(1):151-154.
Norman A W & Litwack G ( 1987) Hormones. Academic Press, Inc. San Diego.
Norrelund H, Nair KS, Jorgensen JO, Christiansen JS & Moller N (2001) The protein-
retaining effects of growth hormone during fasting involve inhibition of muscle-
protein breakdown, Diabetes. 50:96-104.
Okamoto S, Kimura K & Saito M (2001) Anoretic effect of leptin is mediated by
hypothalamic corticotropin-releasing hormone, but not urocortin, in rats,
Neuroscience Letters. 307(3): 179-182.
Ollmann M M , Wilson B D , Yang Y-K, Kerns JA, Chen Y, Grantz I & Barsh G S (1997)
Antagonism of central melanocortin receptors in vitro and in vivo by agouti-
related protein, Science. 278:135-138.
O'Malley P (1991) Artificial hatching and rearing, in: Emu farming. Department of
Agriculture Western Australia miscellaneous publication.
O'Malley P (1993) Farming emus, in: Emu farming. Department of Agriculture Western
Australia miscellaneous publication.
O'Malley P (1996) A n estimate of the nutritional requirements of emus, Improving our
understanding of ratites in a farming environment, Ratite Conference, pp 92-108.
O'Malley P (1999) Emu products - increasing production and profitability, R I R D C
Publication N o 99/143. Part A pp 1-50.

Bibliography 191
Opel H & Proudman JA (1988) Stimulation of prolactin release in turkeys by vasoactive
intestinal peptide (42688), Proceedings of the Society for Experimental Biology and
Medicine. 187:455-460.
Oscai LB, Brown M M & Miller W C (1984) Effect of dietary fat on food intake, growth
and body composition in rats, Growth. 48:415-424.
Paez X & Myers R D (1991) Insatiable feeding evoked in rats by recurrent perfusion of
neuropeptide Y in the hypothalamus, Peptides. 12:609-616.
Papaspyrou-Rao S, Schneider SH, Petersen R N & Fried S K (1997) Dexamethasone
increases leptin expression in human in vivo, Journal of Clinical Endocrinology
and Metabolism. 82:1635-1637.
Parikh R & Marks JL (1997) Metabolic and orexigenic effects of intracerebroventricular
neuropeptide Y are attenuated by food deprivation, Journal of Neuroendocrinology.
9:789-795.
Parry R G , Johnson D W , Carey D G , Hibbins M , Chang W , Purdie D & Rigby RJ (1998)
Serum leptin correlates with fat mass but not dietary energy intake in continuous
ambulatory peritoneal dialysis patients, Peritoneal Dialysis International. 18:569-
575.
Pearson R (1972) The Avian Brain. Academic Press Inc., N e w York.
Pelleymounter M A , Cullen MJ, Baker M B , Hecht R, Winters D, Boone T & Collins F
(1995) Effects of the obese gene product on body weight regulation in ob/ob mice,
Science.. 269:540-543.
Penicaud L & Le Magnen J (1980) Recovery of body weight following starvation or food
restriction in rats, Neuroscience and Behavioral Reviews. 4:47-52.
Pitts GR, Youngren O M , Silsby JL, Rozenboim I, Chaiseha Y, Phillips RE, Foster D N &
El Halawani M E (1994) Role of vasoactive intestinal peptide in the control of
prolactin-induced turkey incubation behaviour. II. Chronic infusion of vasoactive
intestinal peptide, Biology of Reproduction. 50:1350-1356.
Pluske JR (1993) Psychological and nutritional stress in pigs at weaning: production
parameters, the stress response, and histology and biochemistry of the small
intestine, Ph.D. thesis, Animal Science, University of Western Australia.
Prem P, Parihar M S , Malini L & Pradeep K G (1998) Starvation induced hypothyroidism
involves perturbations in thyroid superoxide-SOD system in pigeons, Biochemistry
and Molecular Biology. 45:78-83.

Bibliography 192
Prentice A M (1998) Manipulation of dietary fat and energy density and subsequent effects
on substrate flux and food intake, American Journal of Clinical Nutrition.
67(supp.):535S-541S.
Ramirez R, Lopez JM, Bedoya FJ & Goberna R (1990) Effects of high-carbohydrate or
high-fat diet on metabolism and insulin secretion in the normal rat, Diabetes
Research. 15:179-183.
Ramsay TG, Yan X & Morrison C (1998) The obesity gene in swine: sequence and
expression of porcine leptin, Journal of Animal Science. 76:484-490.
Raver N, Taouis M , Dridi S, Derouet M , Simon J, Robinzon B, Djiane J & Gertler A
(1998) Large-scale preparation of biologically active recombinant chicken obese
protein (leptin), Protein Expression and Purification. 14:402-408.
Reddy A B , Cronin AS, Ford H & Ebling FJP (1999) Seasonal regulation of food intake
and body weight in the male Siberian hamster: studies of hypothalamic orexin
(hypocretin), neuropeptide Y (NPY) and pro-opiomelanocortin (POMC), European
Journal ofNeuroscience. 11:3255-3264.
Reed DR, Tordoff M G & Friedman M I (1991) Enhanced acceptance and metabolism of
fats by rats fed a high-fat diet, American Journal of Physiology. 26LR1084-
R1088.
Rentsch J, Levens N & Chiesi M (1995) Recombinant o^-gene product reduces food intake
in fasted mice, Biochemical & Biophysical Research Communications. 214 (No.
1):131-136.
Richards M P , Ashwell C M & McMurtry JP (1999) Analysis of leptin gene expression in
chickens using reverse transcription polymerase chain reaction and capillary
electrophoresis with laser-induced fluorescence detection, Journal of
Chromatograohy A. 853:3 21 -3 3 5.
Richardson R D , Boswell T, Raffety BD, Seeley RJ, Wingfield JC & Woods SC (1995)
N P Y increases food intake in white-crowned sparrows: effect in short and long
photoperiods, American Journal of Physiology. 268:R1418-R1422.
Robert C, Palin M-F, Coulombe N, Roberge C, Silversides FG, Benkel BF, McKay R M &
Pelletier G (1998) Backfat thickness in pigs is positively associated with leptin
m R N A levels, Canadian Journal of Animal Science. 78(4):473-482.
Rohner-Jeanrenaud F, Cusin I, Sainsbury A, Zakrzewska K E & Jeanrenaud B (1996) The
loop system between neuropeptide Y and leptin in normal and obese rodents,
Hormone and Metabolic Research. 28:642-648.

Bibliography 193
Romijn JA, Endert E & Sauerwein H P (1991) Glucose and fat metabolism during short-
term starvation in cirrhosis, Gastroenterology. 100:731-737.
Romon M , Lebel P, Velly C, Marecaux N, Fruchart JC & Dallongeville J (1999) Leptin
response to carbohydrate or fat meal and association with subsequent satiety and
energy intake, American Journal of Physiology. 40:E855-E861.
Roscoe A K & Myers R D (1991) Hypothermia and feeding induced simultaneously in rats
by perfusion of neuropeptide Y in preoptic area, Pharmacology, Biochemistry and
Behavior. 39:1003-1009.
Rosebrough R W & McMurtry JP (2000) Supplemental triiodothyronine, feeding regimens,
and metabolic responses by the broiler chicken, Domestic Animal Endocrinology.
19:15-24.
Rosebrough R W , McMurtry JP, Richards M P & Steele N C (1984) Effect of starvation-
refeeding and an exogenous glucocorticoid on carbohydrate metabolism in chick
liver, Poultry Science. 63:2444-2449.
Rosenbaum M , Nicolson M , Hirsch J, Heymsfield SB, Gallangher D, Chu F & Leibel R L
(1996) Effects of gender, body composition, and menopause on plasma
concentrations of leptin, Journal of Clinical Endocrinology and Metabolism.
81(9):3424-3427.
Rosenblum CI, Vongs A, Tota M R , Varnerin JP, Frazier E, Cully DF, Morsy M A & Van
der Ploeg L H T (1998) A rapid, quantitative functional assay for measuring leptin,
Molecular and Cellular Endocrinology. 143:117-123.
Ryg M & Jacobsen E (1982) Effects of thyroid hormones and prolactin on food intake and
weight changes in young male reindeer (Rangifer tarandus tarandus). Canadian
Journal of Zoology. 60(7):1562-1567.
Sahu A, White JD, Kalra PS & Kalra SP (1992) Hypothalamic neuropeptide Y gene
expression in rats on scheduled feeding regimen, Molecular Brain Research.
15:15-18.
Said IS & Mutt V (1970) Polypeptide with broad biological activity: isolation from small
intestine, Science. 169:1217-1218.
Said IS & Rosenberg R N (1976) Vasoactive intestinal polypeptide: abundant
immunoreactivity in neural cell lines and normal nervous tissue, Science. 192:907-
908.

Bibliography 194
Sakurai T, Amemiya A, Ishii M , Matsuzaki I, Chemelli R M , Tanaka H, Williams SC,
Richardson J A, Kozlowski GP, Wilson S, Arch JRS, Buckingham RE, Haynes A C ,
Carr SA, Annan RS, McNulty D E , Liu W-S, Terrett JA, Elshourbagy N A , Bergsma
DJ & Yanagisawa M (1998) Orexins and orexin receptors: a family of
hypothalamic neuropeptides and G protein-coupled receptors that regulate feeding
behavior, Cell. 92:573-585.
Saladin R, D e Vos P, Guerre-Millo M . Leturque A, Girard J, Staels B & Auwerx J (1995)
Transient increase in obese gene expression after food intake or insulin
administration, Nature. 377:527-529.
Salah M S , Al-Shaikh M A , Al-Saiady M Y & Mogawer H H (1995) Effect of prolactin
inhibition on thermoregulation, water and food intakes in heat-stressed fat-tailed
male lambs, Animal Science. 60(1):87-91.
Sambrook J, Fritsch EF & Maniatis T (1989) Molecularcloning, a laboratory manual, T
edition. Cold Spring Harbor Laboratory Press, N e w York.
Sanz M , Flores A, Perez De Ayala P & Lopez-Bote CJ (1999) Higher lipid accumulation
in broilers fed on saturated fats than in those fed on unsaturated fats, British Poultry
Science. 40:95-101.
Sanz M , Flores A & Lopez-Bote CJ (2000) The metabolic use of energy from dietary fat
in broilers is affected by fatty acid saturation, British Poultry Science. 41:61-68.
Sarkar G & Sommer SS (1990) Shedding light on P C R contamination, Nature. 343:27.
Savory CJ (1979) Changes in food intake and body weight of bantam hens during
breeding, Applied Animal Ethology. 5:283-288.
Savory CJ & Gentle M J (1980) Intravenous injections of cholecystokinin and caerulein
suppress food intake in domestic fowls, Experientia. 36:1191-1192.
Schew W A , McNabb F M A & Scanes C G (1996) Comparison of the ontogenesis of thyroid
hormones, growth hormone, and insulin-like growth factor-I in ad libitum and food-
restricted (altricial) European starlings and (precocial) Japanese quail, General and
Comparative Endocrinology. 101:304-316.
Schwartz M W , Marks JL, Sipols AJ, Baskin D G , Woods SC, Kahn SE & Porte Jr. D
(1991) Central insulin administration reduces neuropeptide Y m R N A expression in
the arcuate nucleus of food-deprived lean (Fa/Fa) but not obese (fa/fa) Zucker rats,
Endocrinology. 128:2645-2647.

Bibliography 195
Schwartz M W , Sipols AJ, Marks JL, Sanacora G, White JD, Scheurink A, Kahn SE,
Baskin D G , Woods SC, Figlewicz D P & Porte D Jr. (1992) Inhibition of
hypothalamic neuropeptide Y gene expression by insulin, Endocrinology.
130:3608-3616.
Schwartz M W , Seeley RJ, Campfield LA, Burn P & Baskin D G (1996a) Identification of
targets of leptin action in rat hypothalamus, Journal of Clinical Investigation.
98(5):1101-1106.
Schwartz M W , Peskind E, Raskind M , Boyko EJ & Porte D Jr. (1996b) Cerebrospinal
fluid leptin levels: relationship to plasma levels and to adiposity in humans, Nature
Medicine. 2:589-593.
Shani J, Goldhaber G & Sulman F G (1975) Effect of antiserum to rat prolactin on milk
yield and food intake in the rat, Journal of Reproduction & Fertility. 43(3):571-
573.
Sharp PJ, Sterling RJ, Talbot R T & Huskisson N S (1989) The role of hypothalamic
vasoactive intestinal polypeptide in the maintenance of prolactin secretion in
incubating bantam hens: observations using passive immunization,
radioimmunoassay and immunohistochemistry, Journal of Endocrinology. 122:5-
13.
Shimomura Y, Tamura T & Suzuki M A (1990) Less body fat accumulation in rats fed a
safflower oil diet than in rats fed a beef tallow diet, Journal of Nutrition. 120:1291-
1296.
Shulkes A, Caussignac Y, Lamers CB, Solomon TE, Yamada T & Walsh JH (1983)
Starvation in the rat: effect on peptides of the gut and brain, Australian Journal of
Experimental Biology and Medical Science. 61(5):581-587.
Siegel S (1956) Nonparametric statistics for the behavioral sciences. Ed; H F Harlow.
McGraw-Hill Book Company, Inc. London.
Simon J (1984) Effects of daily corticosterone injections upon plasma glucose, insulin, uric
acid and electrolytes and food intake pattern in the chicken, Diabete &
Metabolisme. 10:211-217.
Singh A, Balint JA, Edmonds R H & Rodgers JB (1972) Adaptive changes of the rat small
intestine in response to a high fat diet, Biochimica et Biophysica ACTA. 260:708-
715.
Sinha M K (1997) Human leptin: the hormone of adipose tissue, European Journal of
Endocrinology. 136(5):461-464.

Bibliography 196
Sirett N E & Gibbs FP (1969) Dexamethasone suppression of A C T H release: effect of the
interval between steroid administration and the application of stimuli known to
release A C T H , Endocrinology. 85:355-359.
Sitbon G & Mialhe P (1978) Pancreatic hormones and plasma glucose: regulation
mechanisms in the goose under physiological conditions 1. Pancreatectomy and
replacement therapy. Hormone and Metabolic Research. 10:12-16.
Smetana P (1992) E m u farming estimated costs and returns, in: Emu farming, Department
of Agriculture Western Australia miscellaneous publication.
Smetana P (1994) Emu farming, Department of Agriculture Western Australia
miscellaneous publication.
Smith CJV (1968) Alterations in the food intake of chickens as a result of hypothalamic
lesions, Poultry Science. 48:475-477.
Smith V G , Convey E M & Edgerton L A (1972) Bovine serum corticoid response to
milking and exteroceptive stimuli, Journal of Dairy Science. 55(8): 1170-1173.
Smith BK, Kelly LA, Pina R, York D A & Bray G A (1998) Preferential fat intake increases
adiposity but not body weight in Sprague-Dawley rats, Appetite. 31:127-139.
Snowden J M & Whitehouse M W (1997) Anti-inflammatory activity of emu oils in rats,
Inflammopharmacology. 5:127-132.
Sockman K W , Schwabl H & Sharp PJ (2000) The role of prolactin in the regulation of
clutch size and onset of incubation behavior in the American kestrel, Hormones &
Behavior. 38:168-176.
Solano J M & Jacobson L (1999) Glucocorticoids reverse leptin effects on food intake and
body fat in mice without increasing N P Y m R N A , American Journal of Physiology.
277:E708-E716.
Soliman K F A & Huston T M (1974) Involvement of the adrenal gland in ovulation in the
fowl, Poultry Science. 53:1664-1667.
Stanley B G & Leibowitz SF (1984) Neuropeptide Y: stimulation of feeding and drinking
by injection into the paraventricular nucleus, Life Sciences. 35:2635-2642.
Stanley B G & Leibowitz SF (1985) Neuropeptide Y injected in the paraventricular
hypothalmus: a powerful stimulant of feeding behavior, Proceedings of the
National Academy of Sciences, USA. 82:3940-3943.
Stanley B G , Chin A S & Leibowitz SF (1985a) Feeding and drinking elicited by central
injection of neuropeptide Y: evidence for a hypothalamic site(s) of action, Brain
Research Bulletin. 14:521-524.

Bibliography 197
Stanley BG, Daniel DR, Chin A S & Leibowitz SF (1985b) Paraventricular nucleus
injections of peptide Y Y and neuropeptide Y preferentially enhance carbohydrate
ingestion, Peptides. 6:1205-1211.
Stanley BG, Kyrkouli SE, Lampert S & Leibowitz SF (1986) Neuropeptide Y chronically
injected into the hypothalamus: a powerful neurochemical inducer of hyperphagia
and obesity, Peptides. 7:1189-1192.
Stanley B G , Lanthier D, Chin A S & Leibowitz SF (1989) Suppression of neuropeptide
Y-elicited eating by adrenalectomy or hypophysectomy: reversal with
corticosterone, Brain Research. 501(l):32-36.
Stanley B G , Magdalin W , Seirafi A, Nguyen M M & Leibowitz SF (1992) Evidence for
neuropeptide Y mediation of eating produced by food deprivation and for a variant
of the Yi receptor mediating this peptide's effect, Peptides. 13:581-587.
Stanley BG, Magdalin W , Seirafi A, Thomas W J & Leibowitz SF (1993) The perifornical
area: the major focus of (a) patchily distributed hypothalamic neuropeptide Y-
sensitive feeding system(s), Brain Research. 604:304-317.
Stephens T W , Basinski M , Bristow PK, Bue-Valleskey JM, Burgett SG, Craft L, Hale J,
Hoffman J, Hsiung H M , Kriauciunas A, MacKellar W , Rosteck Jr PR, Schoner B,
Smith D, Tinsley FC, Zhang X & Heiman M (1995) The role of neuropeptide Y in
the antiobesity action of the obese gene product, Nature. 377:530-532.
Stevens L (1996) Avian Biochemistry and Molecular Biology. Cambridge University
Press. Cambridge.
Storlien LH, James D E , Burleigh K M , Chisholm DJ & Kraegen E W (1986) Fat feeding
causes widespread in vivo insulin resistance, decreased energy expenditure, and
obesity in rats, American Journal of Physiology. 251:E576-E583.
Stout R W , Henry R W & Buchanan K D (1976) Triglyceride metabolism in acute
starvation: the role of secretin and glucagon, European Journal of Clinical
Investigation. 6:179-185.
St0ving RK, Hangaard J, Hasen-Nord M & Hagen C (1999) A review of endocrine
changes in anorexia nervosa, Journal ofPsychiaric Research. 33:139-52.
Strack A M , Sebastian RJ, Schwartz M W & Dallman M F (1995) Glucocorticoids and
insulin: reciprocal signals for energy balance, American Journal of Physiology.
268:R142-R149.

Bibliography 198
Strader A D & Buntin JD (2001) Neuropeptide-Y: a possible mediator of prolactin- induced
feeding and regulator of energy balance in the ring dove (Streptopelia risoria),
Journal of Neuroendocrinology. 13:386-392.
Stricker-Krongrad A, Kozak R, Burlet C, Nicolas JP & Beck B (1997) Physiological
regulation of hypothalamic neuropeptide Y release in lean and obese rats, American
Journal of Physiology. 273:R2112-R2116.
Talbot R T & Sharp PJ (1994) A radioimmunoassay for recombinant-derived chicken
prolactin suitable for the measurement of prolactin in other avian species, General
and Comparative Endocrinology. 96(3):361-369.
Talbot RT, Sharp PJ, Harvey S, Williams JB, Dunn IC, Sterling RJ & Bahr J M (1988)
Comparison of the fractionisation and assay of domestic duck and fowl pituitary
gonadotrophins, British Poultry Science. 29:81-92.
Tang-Christensen M , Havel PJ, Jacobs RR, Larsen PJ & Cameron JL (1999) Central
administration of leptin inhibits food intake and activates the sympathetic nervous
system in rhesus macaques, Journal of Clinical Endocrinology and Metabolism.
84(2):711-717.
Taouis M , Derouet M , Chevalier B & Simon J (1993) Corticosterone effect on insulin
receptor number and kinase activity in chicken muscle and liver, General and
Comparative Endocrinology. 89(2): 167-175.
Taouis M , Chen J-W, Daviaud C, Dupont J, Derouet M & Simon J (1998) Cloning the
chicken leptin gene, Gene. 208:229-242.
Tartaglia LA, Dembski M , Weng X, Deng N, Culpepper J, Devos R, Richards GJ,
Campfield LA, Clark FT, Deeds J, Muir C, Sanker S, Moriarty A, Moore KJ,
Smutko JS, Mays G G , Woolf EA, Monroe C A & Tepper RI (1995) Identification
and expression cloning of a leptin receptor, OB-R, Cell. 83:1263-1271.
Tataranni PA, Monroe M B , Dueck CA, Traub SA, Nicolson M , Manore M M , Matt K S &
Ravussin E (1997) Adiposity, plasma leptin concentration and reproductive
function in active and sedentary females, International Journal of Obesity. 21:818-
821.
Tatemoto K, Carlquist M & Mutt V (1982) Neuropeptide Y - a novel brain peptide with
structural similarities to peptide Y Y and pancreatic polypeptide, Nature. 296:659-
662.
Tomaszuk A, Simpson C & Williams G (1996) Neuropeptide Y, the hypothalamus and the
regualtion of energy homeostasis, Hormone Research. 46:53-58.
Bibliography 199
Uehara Y, Shimizu H, Ohtani K, Sato N & Mori M (1998) Hypothalamic corticotropin-
releasing hormone is a mediator of the anorexigenic effect of leptin, Diabetes.
47(6):890-893.
Urban C, Gruber F, Kundi M , Falkner FG, Dorner F & Hammerle T (2000) A systematic
and quantitative analysis of P C R template contamination, Journal of Forensic
Sciences. 45(6):1307-1311.
Van Cleeff J (2000) Personal communication.
Van Cleeff J (2001) Annual cycles of reproductive and metabolic hormones in the emu
(Dromaius novaehollandiae): modulation by reproductive behaviour and castration,
Ph.D. thesis, Animal Science, The University of Western Australia.
Van der Geyten S, Van Rompaey E, Sanders JP, Visser TJ, Kiihn E R & Darras V M (1999)
Regulation of thyroid hormone metabolism during fasting and refeeding in chicken,
General and Comparative Endocrinology. 116:272-280.
Van der Wal A M , Bakker O & Wiersinga W M (1998) The decrease of liver L D L receptor
m R N A during fasting is related to the decrease in serum T3, International Journal
of Biochemistry and Cell Biology. 30:209-215.
Van Haasteren G A C , Linkels E, Van Toor H, Klootwijk W , Kaptein E, de Jong FH,
Reymond MJ, Visser TJ & de Greef W J (1996) Effects of long-term food
restriction on the hypothalamus-pituitary-thyroid axis in male and female rats,
Journal of Endocrinology. 150:169-178.
Van Heek M , Compton DS, France CF, Tedesco RP, Fawzi A B , Graziano M P , Sybertz EJ,
Strader C D & Davis H R Jr. (1997) Diet-induced obese mice develop peripheral, but
not central, resistance to leptin, Journal of Clinical Investigation. 99:385-390.
Van Putten L M , Van Bekkum D W & Querido A (1955) Influence of hypothalamic lesions
producing hyperphagia, and of feeding regimens on carcass composition in the rat,
Metabolism, Clinical and Experimental. 4:68-74.
Varma G G (2000) Evidence for low homology between mammalian leptin and chicken
leptin-like gene sequences. Ph.D. Thesis, University of Edinburgh.
Vila B & Esteve-Garcia E (1996) Studies on acid oils and fatty acids for chickens. I
Influence of age, rate of inclusion and degree of saturation on fat digestability and
metabolisable energy of acid oils, British Poultry Science. 37:105-117.
Vleck C M & Patrick DJ (1999) Effects of vasoactive intestinal peptide on prolactin
secretion in three species of passerine birds, General and Comparative
Endocrinology. 113:146-154.
Bibliography 200
Vrang N, Tang-Christensen M , Larsen PJ & Kristensen P (1999) Recombinant C A R T
peptide induces c-Fos expression in central areas involved in control of feeding
behaviour, Brain Research. 818:499-509.
Waddington D & Hocking P M (1993) Modification of intra-ovarian follicular distributions
In broiler breeder hens by ad libitum feeding or restricted feeding, British Poultry
Science. 34(4):777-784.
Walker H C & Romsos D R (1993) Similar effects on energy metabolism and on plasma
insulin in adrenalectomized ob/ob and lean mice, American Journal of Physiology.
264:E226-E230.
Wang X, Day JR & Vasilatos-Younken R (2001) The distribution of neuropeptide Y gene
expression in the chicken brain, Molecular and Cellular Endocrinology. 174(1-
2): 129-136.
Wang J, Dourmashkin JT, Yun R & Leibowitz SF (1999) Rapid changes in hypothalamic
neuropeptide Y produced by carbohydrate-rich meals that enhance corticosterone
and glucose levels, Brain Research. 848:124-136.
Webber J & Macdonald IA (1994) The cardiovascular, metabolic and hormonal changes
accompanying acute starvation in men and women, British Journal of Nutrition.
71:437-447.
Weigle DS, Bukowski TR, Foster D C , Holderman S, Kramer JM, Lasser G, Lofton-Day
CE, Prunkard DE, Raymond C & Kuijper JL (1995) Recombinant ob protein
reduces feeding and body weight in the ob/ob mouse, Journal of Clinical
Investigation. 96:2065-2070.
West D B , Boozer CN, Moody D L & Atkinson R L (1992) Dietary obesity in nine inbred
mouse strains, American Journal of Physiology. 262:R1025-R1032.
White JD (1993) Neuropeptide Y: a central regulator of energy homeostasis, Regulatory
Peptides. 49:93-107.
White B D & Martin RJ (1997) Evidence for a central mechanism of obesity in the Zucker
rat: role of neuropeptide Y and leptin, Proceedings of the Society for
Experimental Biology and Medicine. 214:222-232.
Whitehouse M W , Turner A G , Davis C K C & Roberts M S (1998) E m u oil(s): a source of
non-toxic transdermal anti-inflammatory agents in aboriginal medicine,
Inflammopharmacology. 6:1-8.
Williams JB & Sharp PJ (1975) Episodic release of luteinizing hormone in the domestic
fowl, Journal of Endocrinology. 64:77-86.

Bibliography 201
Williams JB, Etches RJ & Rzasa J (1985) Induction of a pause in laying by corticosterone
infusion or dietary alterations: effects on the reproductive system, food
consumption and body weight, British Poultry Science. 26:25-34.
Wilson S C & Lacassagne L (1978) The effects of dexamethasone on plasma luteinizing
hormone and oviposition in the hen (Gallus domesticus), General and Comparative
Endocrinology. 35:16-26.
Woods SC, Seeley RJ, Porte D Jr. & Schwartz M W (1998) Signals that regulate food
intake and energy homeostasis, Science. 280:1378-1383.
Yamada S, Mikami S & Yanaihara N (1982) Immunohistochemical localization of
vasoactive intestinal polypeptide(VIP)-containing neurons in the hypothalamus of
the Japanese quail, Coturnix coturnix, Cell Tissue Research. 226:13-26.
Zadworny D, Walton JS & Etches RJ (1985) The relationship between plasma
concentrations of prolactin and consumption of feed and water during the
reproductive cycle of the domestic turkey, Poultry Science. 64:401-410
Zakrzewska K E , Cusin I, Sainsbury A, Rohner-Jeanrenaud F & Jeanrenaud B (1997)
Glucocorticoids as counterregultory hormones of leptin, Diabetes. 46:717-719.
Zakrzewska KE, Cusin I, Stricker-Krongrad A, Boss O, Ricquier D, Jeanrenaud B &
Rohner-Jeanrenaud F (1999) Induction of obesity and hyperleptinemia by central
glucocorticoid infusion in the rat, Diabetes. 48:365-370.
Zhang Y, Proenca R, Maffei M , Barone M , Leopold L & Friedman J M (1994) Positional
cloning of the mouse obese gene and its human homologue, Nature. 372:425-432.

Appendix 1 - Abbreviations 202
Abbreviations used in the thesis
ACTH
AGRP
amp
ANSA
ATP
Bo
BMI
BSA
CART
cDNA
CER
CH3COONa
C8HiiN2Na03
CP
cpm
CRH
CSIRO
CTP
db/db
DNA
EDTA
GPB
GTP
IU
KI
LepR
LiCl
MBH
mRNA
NaCl
Adrenocorticotropin
Agouti-related protein
Ampicillin
8-anilino-l -naphthalene sulphonic acid
Adenosine triphosphate
Zero binding
Body mass index
Bovine serum albumin
Cocaine and amphetamine-related transcript
Complementary D N A
Cerebellum
Sodium acetate
Barbital sodium
Choroid plexus
Counts per minute
Corticotrophin-releasing hormone
Commonwealth Scientific and Industrial Research Organisation
Cytocine triphosphate
Diabetes genotype
Deoxyribonucleic acid
Ethylenediaminetetra acetic acid
Gelatin phosphate buffer
Guanidine triphosphate
International units
Potassium iodide
Leptin receptor
Lithium chloride
Mediobasal hypothalamus
Messenger ribonucleic acid
Sodium chloride

Appendix 1 - Abbreviations
NaN3
NaOH
Na2HP04
NaH2P04.2H20
Na2S205
NGPS
NH4OAC
NIH
NPY
NRS
NSB
ob/ob
PBS
PCR
PEG
PIPES
POA
POMC
PS
RACE
RIA
RERDC
RPA
rpm
RT-PCR
SDS
s.e.m.
SSC
Taq
TC
T E M E D
T R H
Sodium azide
Sodium hydroxide
Disodium hydrogen orthophosphate
Sodium dihydrogen orthophosphate
Sodium metabisulphite
Normal guinea pig serum
Ammonium acetate
National Institute of Health
Neuropeptide Y
Normal rabbit serum
Non-specific binding
Obese genotype
Phosphate buffered saline
Polymerase chain reaction
Polyethylene glycol
Piperazine-N,N'-bis[2-ethane sulfonic acid]
Preoptic area
Proopiomelanocortin
Pituitary stalk
Rapid amplification of c D N A ends
Radioimmunoassay
Rural Industries Research and Development Corporation
Ribonuclease protection assay
Revolutions per minute
Reverse transcription polymerase chain reaction
Sodium dodecyl sulfate
Standard error of the mean
Sodium chloride sodium citrate
Taq polymerase enzyme
Total counts
N,N,N' ,N' -tetra-methyl-ethylenediamine
Thyroid releasing hormone

Appendix 1 - Abbreviations
U T P Uracil triphosphate
U W A University of Western Australia
VIP Vasoactive intestinal peptide
V L D L Very low-density lipoprotein
V M H Ventromedial hypothalamic nucleus

Appendix 2 - List of suppliers and feed composition 205
Alphabetical list of suppliers
Consumables, chemicals and equipment
Ambion, Inc. 2130 Woodward Austin TX 787744-1832 USA http://www.ambion.com/ Distributed in Australia by Gene Works Pty Ltd
Amersham Biosciences Pty Ltd Unit 1, number 22 Hudson Avenue Castle Hill N S W 2154 AUSTRALIA
Beckman (now Beckman Coulter Australia Pty Ltd) Unit C, 24 College Street Gladesville NSW 2111 AUSTRALIA http ://w w w .beckman .com/
Biogenesis Immuno Diagnostics (now Biogenesis Ltd) Technology Road Poole BH17 7DA UK http://www.biogenesis.co.uk/
BioRad Laboratories Pty Ltd Unit 1, Block Y Regents Park Industrial Estate 391 Park Road Regents Park N S W 2143 AUSTRALIA http://www.bio-rad.com/
Boehringer Mannheim (acquired by Roche Products Pty Ltd) 4-10 Inman Road Dee Why N S W 2099 AUSTRALIA http://www.roche.com/
Clontech (now B D Biosciences Clontech) 4 Research Park Drive Macquarie University Research Park North Ryde N S W 2113 AUSTRALIA http://www.clontech.com/
Endocrine Sciences Products (now Endocrine Sciences RIA Reagents) 4301 Lost Hills Rd Calabasas C A 91301 USA
Genesearch Pty Ltd 14 Technology Drive Arundel Q L D 4214 AUSTRALIA
GeneWorks Pty Ltd 39 Winwood Street Thebarton S A 5031 AUSTRALIA
Appendix 2 - List of suppliers and feed composition 206
GIBCO (now Invitrogen Life Technologies) In Israel distributed by R H E N I U M Ltd PO Box 3580 91035 Jerusalem ISRAEL http://www2.lifetech.com/
Hybaid (now Thermo Hybaid) Thermo Biosciences G m b H Sedanstr. 18 D-89077 Ulm GERMANY http ://ww w.hybaid- gmbh.com/
Ilium Veterinary Products (supplied by Troy Laboratories Pty Ltd) http ://w w w .troylab .com, au/
Integrated Sciences PO Box 196 East Kew Melbourne VIC 3102 AUSTRALIA http ://www .integratedsci.com. au/
Linco Research, Inc. 14 Research Drive St Charles Missouri 63304 U S A
Medisense (produced by Abbott Laboratories) Abbott Diagnostics Division
PO Box 394 North Ryde N S W 2113 AUSTRALIA http://www.medisense.com/ http://www.abbottlabs.com.au/
N E N Life Science 549 Albany Street Boston M A 02118-2512 USA
New England Biolabs http ://w w w .neb .com/ Distributed in Australia by Genesearch Pty Ltd
Packard (now PerkinElmer Life Sciences) PerkinElmer Pty Ltd 16-18 Kingsley Close Rowville Melbourne VIC 3178 AUSTRALIA
Pharmacia Biotech (now Amersham Biosciences Pty Ltd)
Promega Corp. Australia 37 Nelson Street Annandale N S W 2038 AUSTRALIA http ://www.promega.com/
QIAGEN Pty Ltd PO Box 25 Clifton Hill VIC 3068 AUSTRALIA http://www.qiagen.com/
Sarstedt Australia Pty Ltd PO Box 90 Ingle Farm SA 5098 AUSTRALIA http://www.sarstedt.com/

Appendix 2 - List of suppliers and feed composition
Sigma (now Sigma-Aldrich Pty Ltd) Sydney AUSTRALIA http://www.sigma.aldrich.com/
Stratagene 11011 N. Torrey Pines Road La Jolla C A 92037 U S A http://www.stratagene.com/ Distributed in Australia by Integrated Sciences
Tel-test Inc. PO Box 1421 Friendswood T X 77546 U S A http://www.isotexdiagnostics.com/ Distributed in Australia by Gene Works Pty Ltd
Turner Design Inc 845 W. Maude Avenue Sunnyvale C A 94085 USA http://www.turnerdesigns.com/
Virbac 15 Pritchard Place Peakhurst N S W 2210 AUSTRALIA http://www.virbac.com.au/
Whatman International Ltd Whatman House St Leonards Road 20/20 Maidstone Kent ME16 0LS U K http://www.whatman.com/
Diet components and commercial feeds
Bayer PO Box 1045 3 De Laeter Way Bentley WA AUSTRALIA http://www.baver.com.au/
Davison Industries Pinjarra WA AUSTRALIA
Education Colours Pty Ltd PO Box 657 Croydon VIC 3136 AUSTRALIA
Glen Forrest Stockfeeders 3150 Great Eastern Highway Glen Forrest WA6076 AUSTRALIA

Appendix 2 - List of suppliers and feed composition 208
Feed composition
Glen Forrest Stockfeeders emu breeder pellet:
1 5 % protein
7.6% crude fibre
3.7% fat
providing 10.5MJ/kg of metabolisable energy.

209
Appendix 3
Response to comments made by thesis examiners
Page
Chapter 2 210
Chapter 4 212
Chapter 5 214
Chapter 6 218
Chapter 7 222
Appendix 3 - response to comments made by examiners 210
Chapter 2.
Question 1. Were feed refusals sub-sampled and analysed to determine actual intake i.e. was
there any scope for birds to select differently from diet specifications?
Refusal margins were not calculated as the amount fed to each bird was adjusted continuously
in response to changes in intake. Refusals were not sub-sampled as the diet was pelleted and
the components had been finely ground making differential selection less likely. The two
diets created for experiment 1 (Chapter 4) were also sifted at each weighing and refilling to
remove any powder that had accumulated, further reducing the opportunity for differential
selection of the diet components.
Question 2. Corticosterone assay - why were different sized tubes used for samples and
standards?
As the standards were not extracted they were set up in a tube appropriate to the volume used
for the assay. The extraction of corticosterone was performed in larger tubes that were
appropriate for the volume of iso-octane/hexane used the resulting organic layer was then
transferred to the smaller tubes for drying down and continuation of the assay.
Question 3. Glucagon assay - what is aprotinin? why was normal guinea pig serum (NGPS)
used?
Aprotinin is added to the assay to protect against protease activity. N G P S was added to the
assay to aid precipitation.
Question 4. Insulin assay - why was 0.1% gelatine added to the assay buffer?
Insulin may be present in B S A preparations, therefore gelatine was added in preference to
B S A to prevent confounding of the results by insulin contamination. Additionally the use of
gelatine in the assay buffer was recommended in the original assay method.
Question 5. LH assay - why were fractions eluted into buffer plus BSA?
The B S A stops the radioactively labelled L H from sticking to the tube.

Appendix 3 - response to comments made by examiners 211
Question 6. T3/T4 assays - why was stripped plasma added to the standards in both assays?
why were glass tubes used?
Stripped plasma was added to the tubes to provide a blank effect for plasma in the assay.
Glass tubes were used because the assay was performed in a small volume and with glass
tubes droplets don't stick to the sides and therefore give less error.
Question 7. Why wasn't glucagon assay 2 with 66% binding repeated?
The components used in the glucagon assay were mainly purchased from a commercial
supplier and the cost of repeating this assay was prohibitive.

Appendix 3 - response to comments made by examiners 212
Chapter 4.
Question 1. Figure 1.1 suggests through spring and summer that males gain significant live
weight, why then did neither group gain weight during the experiment?
The birds used in this experiment were caught fortnightly for weighing and bleeding. The
handling involved in this process, in particular the weighing procedure, can be stressful for the
bird. This stress may have had a negative effect on appetite in these birds. Indeed, a decrease
in food intake was observed in all birds after handling. Their food intake slowly recovered to
pre-handling levels over two weeks, at which time they were handled again. In subsequent
experiments weighing of birds was kept to a minimum to try and avoid this effect.
Question 2. As neither group gained weight changes in total fat would have to occur through
a decrease in the weight of another tissue, is this suggested anywhere in the literature? Or
were you never going to get a response because weight did not change?
The literature does not indicate that adipose tissue weight can increase when weight is
constant. However, there is evidence that the type of fat consumed can influence the oxidation
rate of fat in chickens and therefore the partitioning of energy into lean or fat tissue (Crespo &
Esteve-Garcia, 2002; N e w m a n et al, 2002). Saturated fats induce greater abdominal adipose
deposition than unsaturated fats in chickens (Vila & Esteve-Garcia, 1996; Sanz et al, 1999 &
2000). As such, a diet high in saturated fat could cause adiposity to increase despite only
moderate changes in weight. In combination though the absence of increases in weight gain in
this experiment and the use of unsaturated fat in the diet did make it unlikely that an increase
in adiposity would be observed.
Question 3. What are the hormonal impacts on synthesis, degradation and accretion rates in
fat and muscle?
The key hormones involved in the storage and mobilisation of energy reserves are insulin,
glucagon and glucocorticoids. They affect synthesis, degradation and accretion rates of fat
and muscle through various mechanisms.
1) Insulin:
- in the liver increases glucose uptake, inhibits gluconeogenesis, and increases
lipogenesis and the release of V L D L into the peripheral circulation (Stevens, 1996),
- in adipose tissue, increases glucose uptake, inhibits free fatty acid release, stimulates
Appendix 3 - response to comments made by examiners 213
the conversion of glucose to fat and stimulates lipoprotein lipase concentrations
(Griminger, 1986; Hazelwood, 1986), sparing the triglyceride stores and increasing
adipose deposition,
- in muscle increases the rate of glucose uptake, facilitates the formation of glycogen
from glucose, inhibits glycogen mobilisation and stimulates the uptake of amino acids
(Bentley, 1998).
2) Glucagon:
in the liver mobilises energy reserves by inhibiting lipogenesis and stimulating
gluconeogenesis (Stevens, 1996),
- in adipose tissue stimulates lipolysis (Stevens, 1996), releasing free fatty acids into the
peripheral circulation (Braganza et al, 1973),
- in muscle tissue mobilises glycogen and amino acids (Bentley, 1998).
3) Glucocorticoids:
- in the liver stimulate lipogenesis and gluconeogenesis (Griminger, 1986; Stevens,
1996),
- in adipose tissue stimulate lipolysis (Griminger, 1986; Stevens, 1996),
- in muscle mobilise protein and deaminate amino acids that are then used as a substrate
for gluconeogenesis in the liver (Bentley, 1998).
Question 4. Does glucagon have lipolytic potential in emus as in other avian species?
Glucagon was elevated in the high fat group, therefore was intake depressed because of the
high fat diet and glucagon increasing lipolysis and therefore the circulating energy levels
were very high and intake was suppressed?
It has not been assessed in the e m u but it is likely that glucagon does have the same lipolytic
potential observed in other avian species. The results for glucagon indicate a trend for
elevated glucagon in the high fat group at a single time point. This is at the end of the diet
changeover period when the birds showed the largest reductions in food intake. As such, the
raised glucagon levels are more likely to be a consequence of decreased food intake, rather
than a cause. It is possible that the decreased feed intake led to an increase in glucagon to
stimulate lipolysis and meet the energetic requirements of the animals.
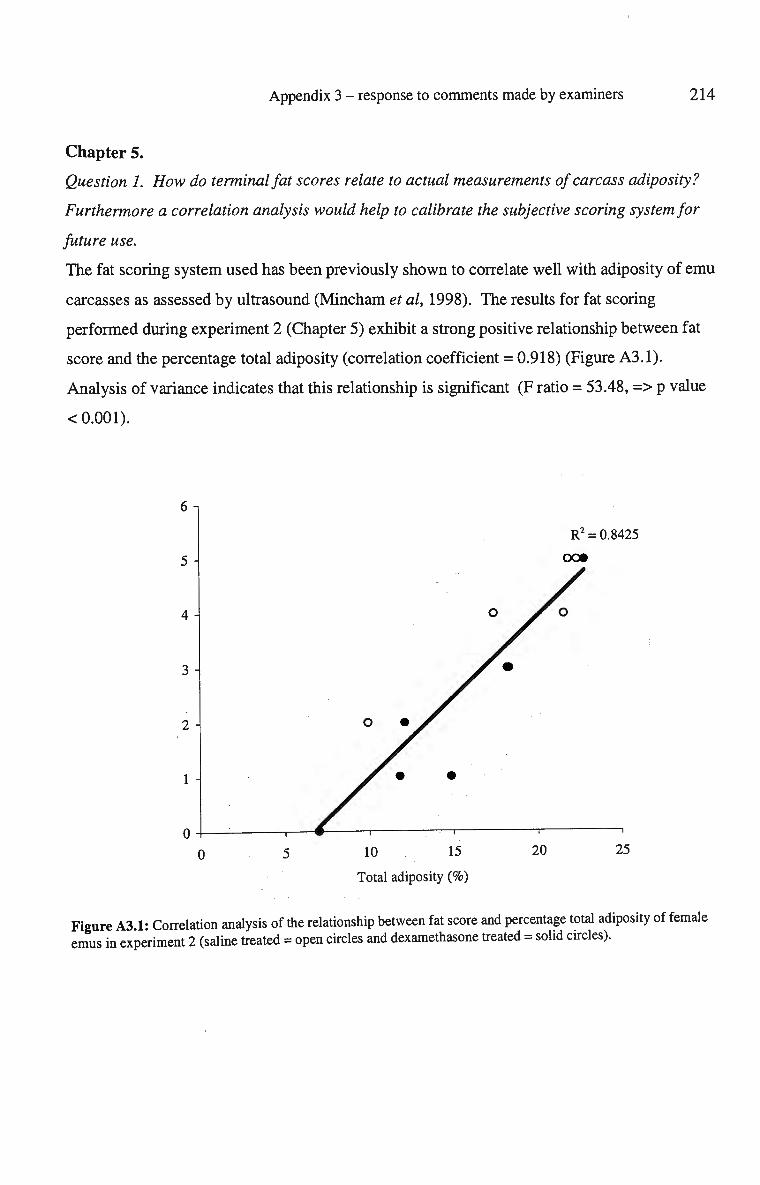
Appendix 3 - response to comments made by examiners 214
Chapter 5.
Question 1. How do terminal fat scores relate to actual measurements of carcass adiposity?
Furthermore a correlation analysis would help to calibrate the subjective scoring system for
future use.
The fat scoring system used has been previously shown to correlate well with adiposity of emu
carcasses as assessed by ultrasound (Mincham et al, 1998). The results for fat scoring
performed during experiment 2 (Chapter 5) exhibit a strong positive relationship between fat
score and the percentage total adiposity (correlation coefficient = 0.918) (Figure A3.1).
Analysis of variance indicates that this relationship is significant (F ratio = 53.48, => p value
< 0.001).
10 15
Total adiposity (%)
20
Figure A3.1: Correlation analysis of the relationship between fat score and percentage total adiposity of female in experiment 2 (saline treated = open circles and dexamethasone treated = solid circles).
emus

Appendix 3 - response to comments made by examiners 215
Question 2. How representative are single LH determinations? What are the LH secretory
dynamics in female emus? Why not measure ovarian steroids? And/or FSH?
In chickens, adult cockerels but not laying hens have been shown to have episodic L H release
(Wilson & Sharp, 1975). In turkeys L H secretion by females differs between photosensitive
and photostimulated birds. Photosensitive birds have L H pulses of low frequency and high
amplitude with low baseline L H concentrations and photostimulated birds have a high baseline
L H concentration with few pulses of low amplitude and short duration (Chapman et al, 1994).
In emus serial blood sampling did not show any evidence of L H pulsatility in the female emu
(Van Cleeff, 2001). As such, single determinations can be considered to accurately represent
L H concentration in the emu. Ovarian steroids and F S H were not measured due to the cost
and time that would have been required to develop and validate the assays for emus.
Question 3. Is there a reference for reduced feed intake leading to reduced ovarian weight in
emus/birds (over time course here of 3 weeks with appetite reduced by 30-70%)?
Feeding chickens a diet high in zinc or fasting them for 10 days decreases food intake and
ovary weight (McCormick & Cunningham, 1987). Restricted feeding of broilers to 4 5 % of ad
libitum also results in lower ovary weights (Waddington & Hocking, 1993). However,
glucocorticoid administration has been shown to decrease ovary weight in the hen in the
absence of changes in live weight or food intake (Williams et al, 1985). As such, the
suppression of ovary development observed in experiment 2 (Chapter 5) may be due initially
to treatment with dexamethasone and compounded by the reduction in food intake observed at
the end of the experiment.
Question 4. Lipid infiltration of the emu liver in response to dexamethasone treatment -
discuss/reference more fully.
Dexamethasone treatment can cause lipid infiltration of the liver (Franco-Colin et al, 2000;
Letteron et al, 1997). Dexamethasone causes lipid infiltration in several ways:
1) increasing the activity of phosphatidate phosphohydrolase and thereby the synthesis of
neutral lipids from glycerol phosphate (Pittner et al, 1995),
2) inhibiting medium- and short-chain acyl C o A dehydrogenation and hepatic lipid
secretion (Letteron et al, 1997)

Appendix 3 - response to comments made by examiners 216
1) inducing haptoglobin production, an acute phase protein associated with hepatic
lipodosis (Higuchi etal, 199A).
The increased liver weight observed following chronic treatment with dexamethasone during
experiment 2 (Table 5.2) and the associated difference in appearance of the liver between the
two groups (Figure A3.2) are consistent with lipid infiltration.
Figure A3.2: Liver tissue from female emus following chronic treatment with either saline (left) or dexamethasone (right).
Question 5. Increased blood glucose result is not discussed. Treatment reduced the
insulin:glucose ratio? Why did this not effect NPY?
The increased blood glucose resulted from the action of dexamethasone to inhibit peripheral
oxidation and utilisation of glucose. The elevation of blood glucose, in the absence of changes
in the concentration of insulin, did result in a decrease in the insulimglucose ratio. Elevated
insulin concentrations act to decrease N P Y gene expression (Schwartz et al, 1991 & 1992).
Therefore it is unlikely that insulin was influencing N P Y expression in this experiment. In the
arcuate nucleus glucose-sensitive neurons overlap with NPY-containing neurons (Muroya et
al, 1999). A decrease in central glucose concentration activates these neurons causing them to
release N P Y and thereby stimulate feeding and normalisation of peripheral and central glucose
concentrations. A s peripheral glucose concentrations were increased in experiment 2, it is
unlikely that they would have stimulated N P Y by this mechanism. Acute stimulation of blood
glucose concentration is associated with elevations of N P Y gene expression and corticosterone
concentration (Wang et al, 1999). As corticosterone was depressed by dexamethasone

Appendix 3 - response to comments made by examiners 217
treatment in experiment 2, it is possible that the absence of an effect of glucose on NPY
expression reflects a requirement for corticosterone to potentiate any effects of elevated
glucose on N P Y gene expression.
Question 6. Why did animals fed ad libitum not gain weight?
This experiment involved weekly handling of the animals for injections and bleeding, and as
for experiment 1 this regular handling was most likely a significant stressor for the birds that
may have reduced their food intake. The pattern of reduced feed intake after handling
observed in experiment 1 was not seen during this experiment. However, the greater
frequency of handling may have prevented appetite recovering in the interim period.

Appendix 3 - response to comments made by examiners 218
Chapter 6.
Question 1. Compare food intake of incubating and non-incubating birds to "control" birds
during the summer.
The food intake of non-incubating emus during autumn (short daylength) and summer (long
daylength) on-farm, and under equivalent photoperiod treatments, was higher in both
experiments in the summer/long day groups (Blache & Martin, 1999; O'Malley, 1996).
Question 2. Does blood sampling during incubation constitute a major disturbance? Do
emus abstain while sitting but get up at certain times to feed?
Blood sampling does not constitute a major disturbance during incubation. Birds remained on
the nest during the procedure and generally showed no response to the handling involved. The
birds abstain from eating while sitting and very rarely leave the nest. During the incubation
period they exhibit anorexia.
Question 3. Also the time of day of killing might be important? Could there be diurnal
changes in NPY expression controlling the moment-to moment drive to eat?
The birds were always killed in the morning. As such, diurnal changes in N P Y expression
should not have confounded the results of this experiment. Diurnal changes in N P Y
expression could control the moment-to-moment drive to eat in emus. Investigation of the
eating patterns of emus has revealed that they only eat during the light period and that the
difference in food intake observed between birds on L D and S D is due to differences in the
time spent eating rather than in the frequency of meals (Blache & Martin, 1999). O n LD, but
not SD, the final 4 hours of light was associated with a two-fold decrease in feeding
frequency. In rats, N P Y gene expression in the hypothalamus increases during the light phase,
decreases just prior to the onset of the dark phase and remains low throughout the dark phase
(Xu et al, 1999). Food intake in rats is highest during the dark phase and lowest during the
light phase (Lu et al, 2002). Therefore, increased N P Y expression during the light phase may
be a response to negative energy balance during this period that ensures appetite is high when
the dark phase begins. The decreased N P Y expression during the period of maximal appetite
can be explained by increases in peripheral signals such as insulin and glucose that result from
eating. If N P Y gene expression shows diurnal changes that regulate appetite in a similar

Appendix 3 - response to comments made by examiners 219
manner to rats it could be expected that N P Y gene expression would be highest during the
early hours of the morning and maintained at a lower constant level throughout the day.
Question 4. How was it possible to quantify lanes 1 and 2 ?
It is possible that these lanes are saturated, the data from the image analysis program did
however appear reasonable and the data was therefore retained to keep the birds in the
incubating group at a reasonable number. Leaving the data for these lanes out of the Mann-
Whitney U test does not change the interpretation of the results (Table A3.1).
Table A3.1: The m R N A expression of NPY and VIP relative to p-actin of incubating (n=3) and non-incubating (n=6) male emus.
m R N A Incubators Non-incubators
NPY/p-actin 0.68 ± 0.075 0.53 ±0.083
VIP/p-actin 0.66 ± 0.030* 0.47 ± 0.055*
Values are means ± s.e.m. An * indicates significant difference between groups (p = 0.019).
Question 5. The trend to increased NPY could relate to the increased corticosterone,
prolactin or reduced insulin:glucagon ratios?
Using correlation analysis to investigate relationships between N P Y gene expression and
either corticosterone, prolactin or the insulimglucagon ratio, it was determined that strong
relationships exist between N P Y and both corticosterone and prolactin, but not the
insulin:glucagon ratio. There is a strong positive relationship between corticosterone and
N P Y gene expression in the non-incubating group (Table A3.2). Analysis of variance
indicates that this relationship is significant. The data for the incubating group is confounded
by the small number of animals used, it appears though that four out of the five data points
correspond closely to the relationship observed in the non-incubating group (Figure A3.3).
For prolactin the results indicate a weak positive relationship with N P Y expression in the non-
incubating group (Table A3.2) and a strong negative relationship in the incubating group.
Analysis of variance indicates that this relationship is significant. This raises the interesting
possibility that prolactin could have a role in regulating NPY's effects on appetite that is
dependent upon the reproductive status of the animal. The insulin:glucagon ratio showed no
evidence of a relationship with N P Y gene expression for either group.

Appendix 3 - response to comments m a d e by examiners 220
Table A3.2: Correlation analysis comparing the expression of N P Y relative to p-actin in incubating and non-incubating male emus with corticosterone and prolactin concentrations and the insulin:glucagon ratio.
Group and hormone interaction
Non-incubators -corticosterone (ng/ml)
Incubators -corticosterone (ng/ml)
Non-incubators -prolactin (ng/ml)
Incubators -prolactin (ng/ml)
Non-incubators -insulin: glucagon ratio
Incubators -insulin: glucagon ratio
Correlation coefficient
0.994
-0.692
0.538
-0.899
-0.542
0.469
F ratio
256.6
2.759
1.63
12.7
0.53
0.85
p value
< 0.001
>0.05
>0.05
<0.05
>0.05
>0.05
0.90
0.80 c o 8 0.70 & X C u
0.60-
•fj 0.50 g a • g 0.40
£ 0.30
.2 0.20
0.10 -
0.00
0.5
R2 = 0.987
1 1.5 2 2.5
Corticosterone concentration (ng/ml)
— i
3.5
Figure A3.3: Correlation analysis of the relationship between N P Y gene expression relative to P-actin and corticosterone concentration (non-incubators = open circles and incubators = solid circles).

Appendix 3 - response to comments made by examiners 221
Question 6. Would differences have been more significant with greater n values?
If more animals had been available to use in the experiment the differences observed between
the groups would have been more likely to be significant. Greater n values in each group
would have reduced the confounding effects of the high variability observed between birds for
many of the parameters measured.

Appendix 3 - response to comments made by examiners 222
Chapter 7.
Question 1. One week of starvation seems severe. Can this be justified? Did this and all
experiments receive ethical approval beforehand?
The application of one week of starvation is justified given the much more extreme voluntary
starvation that emus undergo during incubation. All experiments received approval from the
U W A animal ethics committee and were performed in accordance with the animal ethics and
welfare guidelines given by U W A . Chapter 2 has been amended to reflect this.
Question 2. Was the carcass analysis performed on the same subset of birds used for the
hypothalamic NPY measurement?
Yes, the material and methods section of chapter 7 has been amended to more clearly reflect
this.
Question 3. Another possibility worthy of discussion is that the RPA method of measuring
mRNA in blocks of hypothalamic tissue fails to detect small but biologically significant
changes in expression within specific nuclei, or in subpopulations of neurons within nuclei.
This is a fair criticism of the technique, for detecting genes that are weakly expressed or subtle
changes in gene expression it is not an appropriate method unless the region where the gene is
expressed is very accurately dissected. In Japanese quail fasted for 24 hours and chickens
fasted for 48 hours or chronically feed restricted R P A detected for quail 1.5 and for chicken 2
fold increases in N P Y gene expression (Boswell et al, 2002; Boswell et al, 1999; Boswell et
al, 1999b). As such, R P A is a suitable technique for studying N P Y expression in the emu
hypothalamus.