appendix r kemper county igcc project … library/library/environmental policy... · kemper county...
TRANSCRIPT
APPENDIX R
KEMPER COUNTY IGCC PROJECT HAZARDOUS AIR POLLUTANT RISK SCREENING ANALYSES

This page intentionally left blank.

Prepared for: S outhern C ompany S ervic es , Inc.
Risk Screening Analysis of Hazardous Air Pollutant Emissions from the Proposed Kemper County IGCC Facility, 50% CO2
Capture Case Kemper County, Mississippi
AECOM, Inc. May 2009 Document No.: 06204-041-0001a

Prepared for: S outhern C ompany S ervic es , Inc.
Risk Screening Analysis of Hazardous Air Pollutant Emissions from the Proposed Kemper County IGCC Facility, 50% CO2 Capture Case Kemper County, Mississippi
_________________________________ Prepared By: Dave Heinold
_________________________________ Reviewed By: Brian Stormwind
AECOM, Inc. May 2009 Document No.: 06204-041-0001a

AECOM Environment
i May 2009 Risk Screening Analysis of HAP Emissions from the Proposed Kemper County IGCC Facility, 50% CO2 Capture Case – 06204-041-0001a
C ontents
1.0 Introduction ................................................................................................................................................ 1
2.0 HAP S election ............................................................................................................................................. 1
3.0 E valuation Methods ................................................................................................................................... 1
4.0 Modeling Approach ................................................................................................................................... 2
5.0 F indings ...................................................................................................................................................... 4
6.0 S ummary ..................................................................................................................................................... 4
7.0 R eferences .................................................................................................................................................. 5
L is t of Tables
Table 1: Estimates of HAP Emissions for Each of Two IGCC Stacks for Siemens Turbines and Ranking in Terms of Inhalation Risk ........................................................................................................... 6
Table 2: Estimate of Mercury Emissions for Each of Two IGCC Stacks for Siemens Turbines .............. 7
Table 3: IGCC Source Parameters ............................................................................................................ 7
Table 4: Modeled Project-Related Chronic Inhalation Risk Estimates for Arsenic, Cadmium, and Mercury ....................................................................................................................................................... 8
Table 5: Modeled Project-Related Acute Inhalation Risk Estimates for Arsenic, Cadmium, and Mercury ............. 9
Table 6: Maximum Modeled Long-Term Mercury Air Concentrations (µg/m3 ) ......................................... 9
Table 7: Comparison of Modeled Mercury Deposition from the Facility with Measured Deposition (g/m2/year) .................................................................................................................................... 9
L is t of F igures
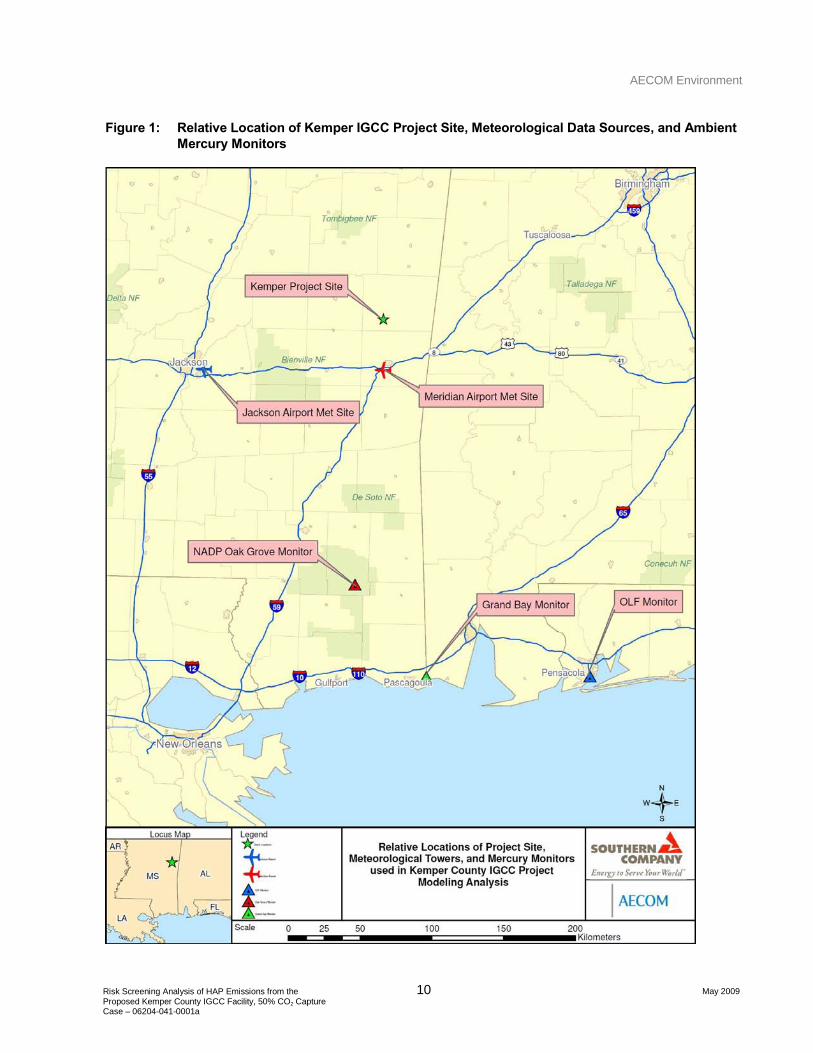
Figure 1: Relative Location of Kemper IGCC Project Site, Meteorological Data Sources, and Ambient Mercury Monitors ........................................................................................................................ 10
Figure 2: Meridian Key Field 5-year (1991-1995) Wind Rose .................................................................. 11
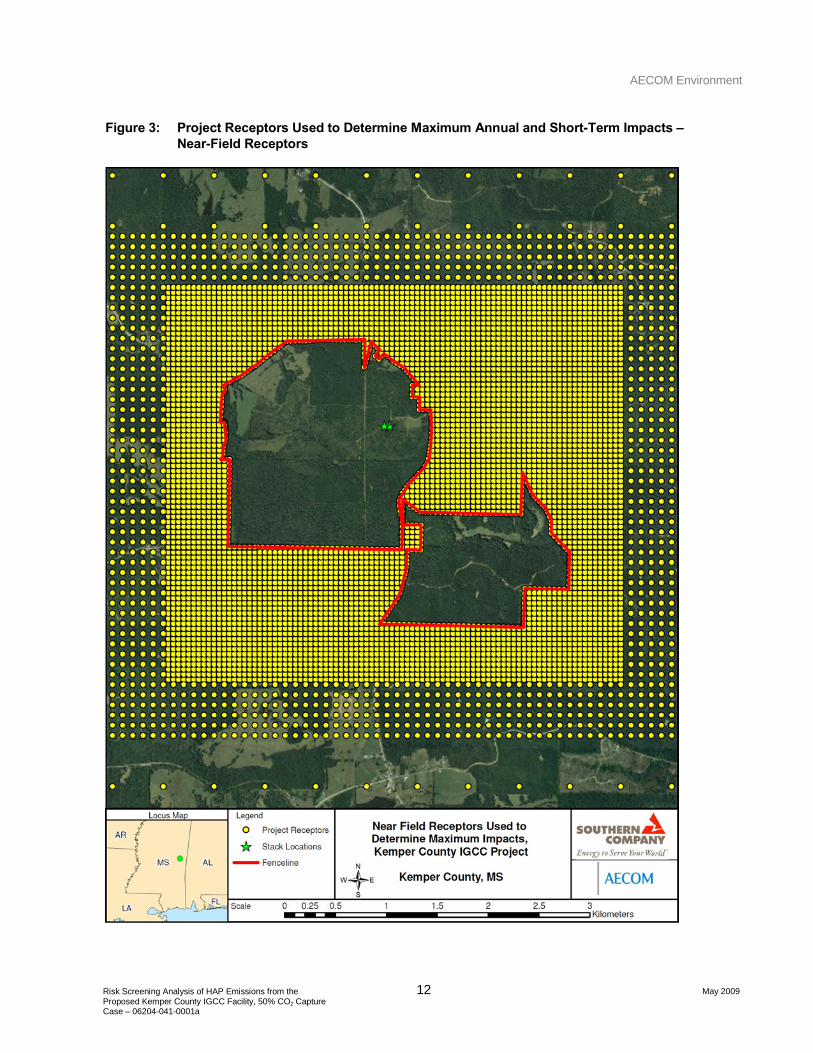
Figure 3: Project Receptors Used to Determine Maximum Annual and Short-Term Impacts – Near-Field Receptors .................................................................................................................................... 12
Figure 4: Project Receptors Used to Determine Maximum Annual and Short-Term Impacts – Far-Field Receptors .................................................................................................................................... 13
Figure 5: Kemper County Receptor Grid ................................................................................................... 14
Figure 6: Location of Maximum Air Concentration Impacts and Mercury Deposition ............................. 15

AECOM Environment
1 May 2009 Risk Screening Analysis of HAP Emissions from the Proposed Kemper County IGCC Facility, 50% CO2 Capture Case – 06204-041-0001a
1.0 Introduction
AECOM Environment has conducted a screening level evaluation of the potential effects of hazardous air pollutant (HAP) emissions from the proposed Kemper County Integrated Gasification Combined Cycle (IGCC) stacks.
2.0 HAP S election
The evaluation considers the HAP emissions associated with continuous firing of syngas in the combustion turbines and natural gas in the associated duct burners. Although the combustion turbines are also capable of combusting natural gas, the fraction of time that natural gas alone would be fired is expected to be small. Two combustion turbine vendors are under consideration, Siemens and GE. HAP emissions were quantified for both turbines and the emission rates were found to comparable, with the Siemens turbines resulting in slightly higher potential emissions. Therefore, the Siemens turbines were addressed in this assessment. The HAPs emissions for a Siemens turbine are provided in Table 1 for all HAPs with the exception of mercury. Mercury emissions are provided in Table 2.
This assessment addressed two classes of health risk: carcinogenic risk and non-carcinogenic risk for long- and short-term (acute and chronic) inhalation of airborne concentrations. For inhalation pathway risk, this screening-level assessment identifies two HAPs, which were selected based on relative emissions and long-term inhalation toxicity. To identify the HAPs to include in the assessment, the HAP emissions were ranked according to relative cancer and chronic non-cancer risk associated with their emissions. The U.S. EPA’s Office of Air Quality Planning and Standards (OAQPS) has tabulated dose-response assessments that OAQPS uses for risk assessments of hazardous air pollutants and has made these available on the Technology Transfer Network at http://www.epa.gov/ttn/atw/toxsource/summary.html. For this ranking the Dose-Response Values compiled by U.S. EPA OAQPS (Ref: Prioritized Chronic Dose-Response Values, provided at http://www.epa.gov/ttn/atw/toxsource/table1.pdf) were applied. To estimate the relative contribution of HAP to inhalation cancer risk, each HAP emission rate listed in Table 1 was multiplied the by U.S. EPA’s Unit Risk Estimates (URE). In a similar way, the relative percent contribution among HAPs was estimated by dividing the HAP emission rates by their respective chronic inhalation concentration levels (referred to here as Reference Air Concentrations or RACs). The result of this ranking, shown in Table 1, indicates that the two HAPs that contribute most to both cancer and non-cancer inhalation risks are arsenic and cadmium. Together these two HAPs contribute nearly 75% of the inhalation cancer risk associated with the IGCCs and nearly 50% of the chronic non-cancer inhalation risk. The implication is that if the modeled risk for these two HAPs is well below significance levels, it is assured that the combined risk associated with all of the HAPs will also be insignificant.
In addition to risks due to direct inhalation of HAPs, it is well-recognized that the routine ingestion of fish that contain elevated concentrations of mercury can pose non-carcinogenic chronic health risk. Some of the mercury in fish may result from deposition of airborne concentrations onto watersheds and subsequent bioaccumulation through the aquatic food chain. Although the presence of mercury in the ambient environment is a global issue, because mercury is among the HAPs that are known to be emitted from coal combustion, the local dispersion and deposition of this HAP from the IGCCs were also evaluated.
3.0 E valuation Methods
To assess inhalation risk, AERMOD was applied to estimate the facility’s contribution to ambient concentrations at the point of maximum off-site impact, as well as the average concentrations throughout Kemper County. Modeled long-term concentrations of arsenic, cadmium and mercury were then added to

AECOM Environment
2 May 2009 Risk Screening Analysis of HAP Emissions from the Proposed Kemper County IGCC Facility, 50% CO2 Capture Case – 06204-041-0001a
U.S. EPA’s model estimates of the pre-existing concentrations in Kemper County associated with other local and regional emission sources for these three HAPs as computed by the 1999 National-Scale Air Toxics Assessment (NATA, http://www.epa.gov/ttn/atw/nata1999/tables.html). In modeling long-term concentrations, as described in more detail below, an average concentration over a 5-year period was computed assuming that the IGCCs ran on syngas continuously at peak load. The level of incremental inhalation cancer and non-cancer risk, and combined risk (facility plus NATA), for each HAP were then evaluated. To evaluate the maximum individual lifetime cancer risk the estimated long-term average air concentration was multiplied by the URE (see Table 1). The result of this calculation is the increase in probability of a person contracting cancer after 70 years of exposure. A cancer risk value of less than 1x10⁻⁶ is generally recognized to be insignificant (U.S. EPA, 1991). For chronic non-cancer effects, the long-term average concentration was divided by the respective RAC to form what is referred to as a Hazard Quotient (HQ). A HQ value of less than 1.0 indicates that adverse non-cancer health effects are highly unlikely to occur (U.S. EPA, 2008). To assess potential acute health effects, the maximum modeled 1-hour average concentrations for the IGCCs were divided by minimum acute RAC found in EPA guidance (Acute Dose-Response Values for Screening Risk Assessments (6/12/2007) in http://www.epa.gov/ttn/atw/toxsource/table2.pdf.
In addition to the evaluation of inhalation health risks, the long-term deposition of mercury was also evaluated. Mercury is emitted in three forms, elemental mercury vapor, reactive gaseous mercury (RGM), and particulate-bound mercury (PBM). As indicated in Table 2, it is estimated that 90% of the total mercury emitted from the IGCCs is in the form of elemental mercury, 10% RGM and un-quantified trace amounts of PBM. In terms of the contribution to wet or dry deposition, elemental mercury is essentially inert because it has an extremely low solubility and is non-reactive. Therefore, most of the elemental mercury remains airborne and is transported over long distances (U.S. EPA, 1997). PBM is deposited with the particles with which it is incorporated, but in this case the rate of emission is so low that the rate of PBM deposition cannot be quantified. In contrast, RGM is soluble and reactive such that it is subject to both dry and wet deposition. Dry deposition occurs when airborne RGM comes into contact with elements on the earth’s surface such as vegetation and water bodies. Wet deposition occurs when precipitation falling through the plume captures soluble RGM vapor. As discussed further below, these deposition processes are simulated by U. S. EPA’s AERMOD air quality model. The ambient concentration and deposition of mercury from the IGCC units at the point of maximum impact, and the average over Kemper County, are evaluated by comparing modeled results to measurements taken at two locations along the Gulf coast, and a third located in Oak Grove, MS, where there are long-term mercury monitoring networks (see Figure 1).
4.0 Modeling Approach
U.S. EPA’s AERMOD model was applied to estimate air concentrations of arsenic, cadmium and mercury, and deposition of mercury emitted from the IGCC units. Five years of representative meteorological data (1991-1995) were applied, including National Weather Service (NWS) surface and precipitation data from Meridian Key Field in Meridian, MS and upper air data from Jackson International Airport in Jackson, MS. The relative location of the meteorological measurement sites with respect to the project site are provided in Figure 1. Processed, AERMOD-ready meteorological data was provided by the Mississippi Department of Environmental Quality (MDEQ) on their website (http://www.mississippi.gov/frameset.jsp?URL=http%3A%2F%2F %2Fwww.deq.state.ms.us%2FMDEQ.nsf%2Fpage%2FMain_Home%3FOpenDocument). The 5-year wind rose shown in Figure 2 indicates prevailing winds are primarily southerly, but northerly winds are also frequent. In accordance with U. S. EPA guidance, a sensitivity analysis was conducted using both the surface site characteristics (roughness, albedo and Bowen ratio) from the project site and the NWS station site, and the site characteristics that resulted in the greater modeled concentrations were applied. On this basis, the surface characteristics of the NWS site at Meridian were used. Two sets of receptors were used in the analysis. The first set, which was developed for the air quality modeling in support of the project permitting effort, was applied to model the concentration and deposition at the maximum point of impact. This receptor grid consisted of “tight” receptors spaced 50 meters apart along the fence line and extending out 500 meters

AECOM Environment
3 May 2009 Risk Screening Analysis of HAP Emissions from the Proposed Kemper County IGCC Facility, 50% CO2 Capture Case – 06204-041-0001a
from the fence-line. Beyond 500 meters, a spacing of 100 meters was used up to one-kilometer from the facility. Between one- and five-kilometers, a spacing of 500 meters was used. Between five- and ten-kilometers, a spacing of 1,000 meters was used. Between ten- and twenty-kilometers, a spacing of 2,000 meters was used. For this grid, the near field receptors are shown in Figure 3 and the far field receptors are shown in Figure 4. A second set of receptors comprised of a uniform, 1 km spaced receptor grid across Kemper County, was used to model the Kemper County-wide average for comparison to NATA county-level results. Receptor elevations were developed using Digital Elevation Model (DEM) data from USGS. The Kemper County grid is shown in Figure 5.
Table 3 provides the source parameters used to apply AERMOD. For the IGCC dispersion modeling and RGM deposition analysis, the general modeling procedures and options specified in the current versions of in the AERMOD User’s Guide (U.S. EPA 2004), AERMOD Implementation Guide (U.S. EPA 2009), and the Guideline on Air Quality Models (GAQM; U.S. EPA 2005) were followed. To model ambient concentrations of arsenic, cadmium and elemental mercury, it was conservatively assumed that no deposition occurred. Deposition was accounted for in modeling the concentration of RGM. Modeling was conducted in a manner consistent with U.S. EPA guidance and standard practices, including the use of regulatory default options, as appropriate. The building downwash analysis was performed using the most recent version of EPA’s Building Profile Input Program (BPIP) (Version 04274) with the plume rise model enhancements (PRIME) building downwash algorithms, consistent with the air quality modeling.
Aerial imagery (2004) was examined to determine the land-use characteristics around the project site for use as input into the model for mercury deposition calculations. The area in the vicinity of the project was found to be heavily forested. As a result, category 4 (forest) was used for the gas dry deposition land-use category for all 36 10o radials in the mercury deposition modeling as described in the Addendum to the AERMOD User’s Guide (U.S EPA, 2006).
The transport and mobility of a pollutant are determined by the physical properties of the specific
pollutant. For deposition modeling, AERMOD requires several pollutant-specific parameters:
(1) diffusivity in air; (2) diffusivity in water; (3) leaf cuticular resistance to lipid uptake; and (4) the Henry’s Law constant. The following values of these parameters recommended by U.S. EPA were applied:
• diffusivity in air: 6.0E-2 cm2/sec
• diffusivity in water: 5.25E-6 cm
(1) 2/sec
• Cuticular resistance: 1.0E7 sec/m
(2)
• Henry’s Law constant: 6.0E-6 pa-m
(1) 3/mol
• Reactivity factor: 1.0
(1)
(1) Source is Wesley, M.L., Doskey, P.V., and Shannon, J.D. Deposition Parameterizations for the Industrial Source Complex (ISC3) Model, Argonne National Laboratory, June, 2002, Table 7 (p.27).
(1)
(2) Source is U.S. EPA’s Human Health Risk Assessment Protocol for Hazardous Waste Combustion Facilities – [Publication No. EPA 530-R-05-006], September 2005. Information from companion HHRAP Database – Value for mercuric chloride. http://www.epa.gov/osw/hazard/tsd/td/combust/riskvol.htm#volume2 - scroll down to “Download HHRAP Companion Database (ACCESS)”

AECOM Environment
4 May 2009 Risk Screening Analysis of HAP Emissions from the Proposed Kemper County IGCC Facility, 50% CO2 Capture Case – 06204-041-0001a
5.0 F indings
Figure 6 provides the location of the maximum modeled air concentrations for the modeled HAPs and the location of the highest RGM deposition relative to the facility. The maximum air concentration impacts, along with the maximum dry deposition, were found to be along the southeast fence-line of the power block portion of the facility. The maximum wet and total RGM deposition was found to occur along, and just past, the northeast fence-line of the power block, directly to the north of the IGCC stacks.
Table 4 provides inhalation risk estimates associated with arsenic, cadmium and mercury emitted from the facility and the combined county-wide risk of these HAPs, incorporating the 1999 NATA Kemper County modeling results. The maximum cancer risk, which is associated with arsenic, is less than 2 x 10⁻⁷ at the point of maximum, and the county-wide-average risk, including the proposed IGCC units is only about 1 x 10⁻⁸. These levels are below the EPA’s recommended significance levels of 1x10⁻⁶. The hazard quotients for each of the three HAPs are also insignificant with the highest incremental HQ, which occurs for cadmium, of less than 3 x 10⁻³ compared to a significance level of 1.0. The corresponding Kemper County HQ for cadmium is about 2 x 10⁻⁴. The results of acute inhalation assessment, provided in Table 5, indicate that arsenic is the HAP with the largest acute hazard quotient with a value of about 5 x 10⁻³. This analysis demonstrates that the proposed IGCC units will not cause or contribute significantly to acute or chronic health effects and cancer risk.
The analyses for mercury are provided in Tables 6 and 7. Table 6 compares maximum modeled long-term air concentrations of elemental mercury and RGM with available measurements from two measurement sites located to the south near the Gulf Coast. The long-term concentration of elemental mercury is two orders of magnitude less than the measured ambient concentrations, and the maximum modeled RGM concentration is about a third of the ambient concentrations. Thus, the combined maximum long-term modeled concentration of elemental mercury and RGM is only one hundredth of the measured ambient concentrations. This finding is consistent with NATA which specifies a U.S. background mercury concentration associated with global transport of 1.5 x 10⁻³ μg/m3
6.0 S ummary
. Table 7 provides a comparison of the maximum modeled RGM deposition from the facility with values developed from measurements from the OLF study and the NADP Mercury Deposition Network. The maximum long-term wet deposition is one to two orders of magnitude less than measurements. The modeled dry deposition at the location of maximum deposition is comparable to the dry deposition estimates from the OLF study. The result is that the total modeled mercury deposition is only about one eighth of total ambient deposition. The deposition analysis therefore demonstrates that the project will not contribute substantially to the ambient concentration or deposition of mercury in the vicinity.
An assessment of the HAP emissions from the proposed IGCC units was conducted using the conservative assumption that the IGCC units will operate continuously at 100% load on syngas for five years. Modeling of concentrations and RGM deposition was conducted with AERMOD, a U.S. EPA designed model that provides conservative estimates of air quality impacts. The results of the assessment indicate that no HAP emitted from the project will result in, or contribute to, human health risk due to inhalation. In addition, the ambient concentrations of mercury resulting from the IGCC units were modeled to be orders of magnitude less than ambient concentrations, and the modeled deposition of mercury was less than has been measured at nearby study areas.

AECOM Environment
5 May 2009 Risk Screening Analysis of HAP Emissions from the Proposed Kemper County IGCC Facility, 50% CO2 Capture Case – 06204-041-0001a
7.0 R eferences
U.S. Environmental Protection Agency (EPA), 1997. Mercury Stud report to Congress, Volume III: Fate and Transport of Mercury in the Environment, EPA-452/R-97-005, December.
U.S. EPA, 2009. AERMOD Implementation Guide – Revised,March 19,2009
U.S. EPA, 2006. Addendum: Users Guide for the AMS/EPA Regulatory Model – AERMOD
EPA-454/B-03-001, September 2004)
U.S. EPA, 2005. Guideline on Air Quality Models (as incorporated in Appendix W of 40 CFR Part 51; EPA, 2005).
U.S. EPA, 2004. Users Guide for the AMS/EPA Regulatory Model – AERMOD.
EPA-454/B-03-001. September.
U.S. EPA, 2005. Human Health Risk Assessment Protocol for Hazardous Waste Combustion Facilities – [Publication No. EPA 530-R-05-006], September 2005.
U.S.EPA, 2008. 1996 National-Scale Air Toxics Assessment: Summary of Results [http://www.epa.gov/nata/risksum.html].
U.S.EPA, 1991. Role of the Baseline Risk Assessment in Superfund Remedy Selection Decisions. OSWER Directive #9355.0-30. April. [http://www.epa.gov/oswer/riskassessment/pdf/baseline.pdf].
Wesley, M.L., Doskey, P.V., and Shannon, J.D. Deposition Parameterizations for the Industrial Source Complex (ISC3) Model, Argonne National Laboratory, June, 2002.

AECOM Environment
6 May 2009 Risk Screening Analysis of HAP Emissions from the Proposed Kemper County IGCC Facility, 50% CO2 Capture Case – 06204-041-0001a
Table 1: Estimates of HAP Emissions for Each of Two IGCC Stacks for Siemens Turbines and Ranking in Terms of Inhalation Risk
Maximum Short-Term
Emissions (1,3)
Cancer Unit Risk Estimate
(lb/hour)
(4) (1/µg/m3
Percent of Cancer
Risk )
Reference Air Concentration
Percent of Chronic
Hazard Index (4)
(μg/m3)
Volatile Organic Compounds Acetaldehyde 2.29E-02 2.20E-06 0.1% 9.00 0.1% Acrolein 2.22E-03 NA -- 0.02 5.4% Benzene 2.16E-02 7.80E-06 0.2% 30.00 0.0% Ethylbenzene 9.03E-03 NA -- 1000.00 0.0% Formaldehyde 1.01E-01 5.50E-09 0.0% 9.80 0.5% Toluene 2.69E-02 NA -- 5000.00 0.0% Xylene 2.58E-02 NA -- 100.00 0.0% Polycyclic Organic Matter (POM) Polycyclic Aromatic Hydrocarbons (PAH) 1.90E-04 1.10E-03 0.2% 200.00 0.0% 2-Methylnapthalene 1.20E-03 NA -- NA -- Acenapthylene 8.50E-05 NA -- NA --
Benzo(a)anthracene 7.50E-06 1.10E-04 0.0% NA --
Benzo(e)pyrene 1.80E-05 NA -- NA --
Benzo(g,h,i)perylene 3.10E-05 NA -- NA --
Napthalene 1.60E-03 3.40E-05 0.1% 3.00 0.0% Metals
Antimony 1.27E-02 NA -- NA --
Arsenic 9.79E-03 4.30E-03 45.7% 0.03 15.8%
Beryllium 3.00E-03 2.40E-03 7.8% 0.02 7.3%
Cadmium 1.37E-02 1.80E-03 26.8% 0.02 33.1%
Chromium VI 1.49E-03 (2) 1.20E-02 19.4% 0.10 0.7%
Cobalt 2.64E-03 NA -- 0.10 1.3%
Lead 1.30E-02 NA -- 0.15 4.2%
Manganese 1.40E-02 NA -- 0.05 13.6% Mercury (total) 3.61E-03 NA -- 0.30 0.6%
Elemental Mercury 3.25E-03 NA -- NA --
Reactive Gaseous Mercury 3.61E-04 NA -- NA --
Particulate-bound Mercury Trace NA -- NA --
Nickel 1.83E-02 NA -- 0.09 9.8%
Phosphorous 1.11E-02 NA -- 0.07 7.7% Selenium 1.40E-02 NA -- NA -- Inorganic Compounds
Carbon Disulfide 1.47E-01 NA -- 700.00 0.0% (1) Emission rates based on emission factors from "A Study of Toxic Emissions from a Coal-Fired Gasification Plant", Radian Corporation,
December 1995. (2) 12% of total chromium emissions characterized as hexavalent for coal combustion per U.S. EPA 2005 National Emissions Inventory Data &
Documentation (http://www.epa.gov/ttn/chief/net/2005inventory.html). (3) Estimates are based on full load operating scenarios with Duct Burner firing. (4) Source: Prioritized Chronic Dose-Response Values: http://www.epa.gov/ttn/atw/toxsource/table1.pdf.

AECOM Environment
7 May 2009 Risk Screening Analysis of HAP Emissions from the Proposed Kemper County IGCC Facility, 50% CO2 Capture Case – 06204-041-0001a
Table 2: Estimate of Mercury Emissions for Each of Two IGCC Stacks for Siemens Turbines
Average Short-Term Syngas
(lb/hour)
Average Annual (lb/year)
Total Mercury 0.0036 31.64
Elemental (90% of Total) 0.0033 28.47
RGM (10% of Total) 0.00036 3.16
Particle-Bound (Only trace amounts) Trace Trace
Table 3: IGCC Source Parameters
Parameter Value CC1A CC2A UTM Coordinate East (m) 335223.3 (1) 335177.6 UTM Coordinate North (m) 3614049.2 (1) 3614050.0 Stack Base Elevation (ft) 474 474 Stack Height (ft) 325 325 Stack Diameter (ft) 24 24 Exit Temperature (o 270.6 F) 270.6 Exit Velocity (ft/s) 51.4 51.4
(1)
Coordinates for UTM Zone 16 referenced to Datum NAD27.

AECOM Environment
8 May 2009 Risk Screening Analysis of HAP Emissions from the Proposed Kemper County IGCC Facility, 50% CO2 Capture Case – 06204-041-0001a
Table 4: Modeled Project-Related Chronic Inhalation Risk Estimates for Arsenic, Cadmium, and Mercury
(1) Values are the average of all receptors (total 2085) in an evenly spaced grid covering all of Kemper County in 1000m
increments.
(2) 1999 National Air Toxics Assessment (http://www.epa.gov/ttn/atw/nata1999/tables.html) NATA’s National Ambient Background for mercury is 1.50E-03 µg/m3
.
Maximum Project Related Risk Estimates Kemper County-Wide Average Risk Estimates
Hazardous Air Pollutant
Maximum Modeled
Long-Term Concentration
(µg/m3
Chronic Hazard
Quotient )
Individual Inhalation
Cancer Risk
Long-Term Modeled
Concentration from Project
(1) (μg/m3
NATA Modeled Kemper
County Long-Term
Concentration (μg/m
) 3) (2)
Total Modeled Long-Term
Kemper County
Concentration (μg/m
3
Chronic Hazard
Quotient
)
Individual Inhalation
Cancer Risk
Arsenic 3.7E-05 1.2E-03 1.6E-07 2.3E-06 7.8E-07 3.1E-06 1.0E-04 1.3E-08
Cadmium 5.1E-05 2.6E-03 9.3E-08 3.2E-06 7.2E-07 3.9E-06 1.9E-04 7.0E-09
Mercury - Total 1.4E-05 4.5E-05 not applicable 8.3E-07 8.9E-07 1.7E-06 5.7E-06 not applicable

AECOM Environment
9 May 2009 Risk Screening Analysis of HAP Emissions from the Proposed Kemper County IGCC Facility, 50% CO2 Capture Case – 06204-041-0001a
Table 5: Modeled Project-Related Acute Inhalation Risk Estimates for Arsenic, Cadmium, and
Mercury
Pollutant
Maximum Modeled
Concentration (μg/m3
Acute Dose Response
Value)
(1) (µg/m3
Acute Hazard
Quotient )
Arsenic 0.00093 0.19 4.90E-03 Cadmium 0.00130 900 1.45E-06 Mercury - Total 0.00034 1.8 1.90E-04
(1) Minimum value provided in Table 2: Acute Dose-Response Values for Screening Risk Assessments (http://www.epa.gov/ttn/atw/toxsource/summary.html).
Table 6: Maximum Modeled Long-Term Mercury Air Concentrations (µg/m3
Hazardous Air Pollutant
)
Maximum Modeled Long-
Term Concentration
Grand Bay Lab Ambient
Conc. (1)
OLF Mercury Study Average Concentration (2005-2008) (2)
Mercury - Elemental
1.22E-05 1.40E-03 1.35E-03
Mercury – RGM 1.35E-06 4.02E-06 3.68E-06
Elemental + RGM 1.36E-05 1.41E-03 1.35E-03 (1) http://www.arl.noaa.gov/documents/reports/Luke_NADP_v2.pdf. (2) Data provided by Southern Company.
Table 7: Comparison of Modeled Mercury Deposition from the Facility with Measured Deposition
(g/m2
Pollutant
/year)
Max. Annual Modeled Impact
NADP Mercury Deposition Network(1)
OLF 2005-08 Average Low/High
Estimates
Mercury - Wet Deposition
(2)
3.21E-07 1.68E-05 1.47E-05
Mercury - Dry Deposition 1.71E-06 not available 1.22E-06/2.45E-06
Mercury - Total Deposition 1.90E-06 not available 15.9E-06/17.2E-06
(1) Average concentration at MS22 monitor (Oak Grove, MS) from 2001-2007. (2) Data for OLF provided by Southern Company. Wet deposition is directly measured and dry deposition has been estimated based on measured concentrations and estimated range of deposition velocity applicable to the surface type in the OLF study area.
AECOM Environment
10 May 2009 Risk Screening Analysis of HAP Emissions from the Proposed Kemper County IGCC Facility, 50% CO2 Capture Case – 06204-041-0001a
Figure 1: Relative Location of Kemper IGCC Project Site, Meteorological Data Sources, and Ambient Mercury Monitors

AECOM Environment
11 May 2009 Risk Screening Analysis of HAP Emissions from the Proposed Kemper County IGCC Facility, 50% CO2 Capture Case – 06204-041-0001a
Figure 2: Meridian Key Field 5-year (1991-1995) Wind Rose
AECOM Environment
12 May 2009 Risk Screening Analysis of HAP Emissions from the Proposed Kemper County IGCC Facility, 50% CO2 Capture Case – 06204-041-0001a
Figure 3: Project Receptors Used to Determine Maximum Annual and Short-Term Impacts – Near-Field Receptors

AECOM Environment
13 May 2009 Risk Screening Analysis of HAP Emissions from the Proposed Kemper County IGCC Facility, 50% CO2 Capture Case – 06204-041-0001a
Figure 4: Project Receptors Used to Determine Maximum Annual and Short-Term Impacts – Far-Field Receptors

AECOM Environment
14 May 2009 Risk Screening Analysis of HAP Emissions from the Proposed Kemper County IGCC Facility, 50% CO2 Capture Case – 06204-041-0001a
Figure 5: Kemper County Receptor Grid

AECOM Environment
15 May 2009 Risk Screening Analysis of HAP Emissions from the Proposed Kemper County IGCC Facility, 50% CO2 Capture Case – 06204-041-0001a
Figure 6: Location of Maximum Air Concentration Impacts and Mercury Deposition

Prepared for: S outhern C ompany S ervic es , Inc.
Risk Screening Analysis of Hazardous Air Pollutant Emissions from the Proposed Kemper County IGCC Facility, 67% CO2
Capture Case Kemper County, Mississippi
AECOM, Inc. August 2009 Document No.: 06204-041-0001b

Prepared for: S outhern C ompany S ervic es , Inc.
Risk Screening Analysis of Hazardous Air Pollutant Emissions from the Proposed Kemper County IGCC Facility, 67% CO2 Capture Case Kemper County, Mississippi
_________________________________ Prepared By: Dave Heinold
_________________________________ Reviewed By: Brian Stormwind
AECOM, Inc. August 2009 Document No.: 06204-041-0001b

AECOM Environment
i May 2009 Risk Screening Analysis of HAP Emissions from the Proposed Kemper County IGCC Facility, 67% CO2 Capture Case – 06204-041-0001b
C ontents
1.0 Introduction ................................................................................................................................................ 1
2.0 HAP S election ............................................................................................................................................. 1
3.0 E valuation Methods ................................................................................................................................... 1
4.0 Modeling Approach ................................................................................................................................... 2
5.0 F indings ...................................................................................................................................................... 4
6.0 S ummary ..................................................................................................................................................... 4
7.0 R eferences .................................................................................................................................................. 5
L is t of Tables
Table 1: Estimates of HAP Emissions for Each of Two IGCC Stacks for Siemens Turbines and Ranking in Terms of Inhalation Risk ........................................................................................................... 6
Table 2: Estimate of Mercury Emissions for Each of Two IGCC Stacks for Siemens Turbines .............. 7
Table 3: IGCC Source Parameters ............................................................................................................ 7
Table 4: Modeled Project-Related Chronic Inhalation Risk Estimates for Arsenic, Cadmium, and Mercury ....................................................................................................................................................... 8
Table 5: Modeled Project-Related Acute Inhalation Risk Estimates for Arsenic, Cadmium, and Mercury ............. 9
Table 6: Maximum Modeled Long-Term Mercury Air Concentrations (µg/m3 ) ......................................... 9
Table 7: Comparison of Modeled Mercury Deposition from the Facility with Measured Deposition (g/m2/year) .................................................................................................................................... 9
L is t of F igures
Figure 1: Relative Location of Kemper IGCC Project Site, Meteorological Data Sources, and Ambient Mercury Monitors ........................................................................................................................ 10
Figure 2: Meridian Key Field 5-year (1991-1995) Wind Rose .................................................................. 11
Figure 3: Project Receptors Used to Determine Maximum Annual and Short-Term Impacts – Near-Field Receptors .................................................................................................................................... 12
Figure 4: Project Receptors Used to Determine Maximum Annual and Short-Term Impacts – Far-Field Receptors .................................................................................................................................... 13
Figure 5: Kemper County Receptor Grid ................................................................................................... 14
Figure 6: Location of Maximum Air Concentration Impacts and Mercury Deposition ............................. 15

AECOM Environment
1 August 2009 Risk Screening Analysis of HAP Emissions from the Proposed Kemper County IGCC Facility, 67% CO2 Capture Case – 06204-041-0001b
1.0 Introduction
AECOM Environment has conducted a screening level evaluation of the potential effects of hazardous air pollutant (HAP) emissions from the proposed Kemper County Integrated Gasification Combined Cycle (IGCC) stacks.
2.0 HAP S election
The evaluation considers the HAP emissions associated with continuous firing of syngas in the combustion turbines and natural gas in the associated duct burners. Although the combustion turbines are also capable of combusting natural gas, the fraction of time that natural gas alone would be fired is expected to be small. Siemens turbines were addressed in this assessment. The HAPs emissions for a Siemens turbine are provided in Table 1 for all HAPs with the exception of mercury. Mercury emissions are provided in Table 2.
This assessment addressed two classes of health risk: carcinogenic risk and non-carcinogenic risk for long- and short-term (acute and chronic) inhalation of airborne concentrations. For inhalation pathway risk, this screening-level assessment identifies two HAPs, which were selected based on relative emissions and long-term inhalation toxicity. To identify the HAPs to include in the assessment, the HAP emissions were ranked according to relative cancer and chronic non-cancer risk associated with their emissions. The U.S. EPA’s Office of Air Quality Planning and Standards (OAQPS) has tabulated dose-response assessments that OAQPS uses for risk assessments of hazardous air pollutants and has made these available on the Technology Transfer Network at http://www.epa.gov/ttn/atw/toxsource/summary.html. For this ranking the Dose-Response Values compiled by U.S. EPA OAQPS (Ref: Prioritized Chronic Dose-Response Values, provided at http://www.epa.gov/ttn/atw/toxsource/table1.pdf) were applied. To estimate the relative contribution of HAP to inhalation cancer risk, each HAP emission rate listed in Table 1 was multiplied the by U.S. EPA’s Unit Risk Estimates (URE). In a similar way, the relative percent contribution among HAPs was estimated by dividing the HAP emission rates by their respective chronic inhalation concentration levels (referred to here as Reference Air Concentrations or RACs). The result of this ranking, shown in Table 1, indicates that the two HAPs that contribute most to both cancer and non-cancer inhalation risks are arsenic and cadmium. Together these two HAPs contribute nearly 75% of the inhalation cancer risk associated with the IGCCs and nearly 50% of the chronic non-cancer inhalation risk. The implication is that if the modeled risk for these two HAPs is well below significance levels, it is assured that the combined risk associated with all of the HAPs will also be insignificant.
In addition to risks due to direct inhalation of HAPs, it is well-recognized that the routine ingestion of fish that contain elevated concentrations of mercury can pose non-carcinogenic chronic health risk. Some of the mercury in fish may result from deposition of airborne concentrations onto watersheds and subsequent bioaccumulation through the aquatic food chain. Although the presence of mercury in the ambient environment is a global issue, because mercury is among the HAPs that are known to be emitted from coal combustion, the local dispersion and deposition of this HAP from the IGCCs were also evaluated.
3.0 E valuation Methods
To assess inhalation risk, AERMOD was applied to estimate the facility’s contribution to ambient concentrations at the point of maximum off-site impact, as well as the average concentrations throughout Kemper County. Modeled long-term concentrations of arsenic, cadmium and mercury were then added to U.S. EPA’s model estimates of the pre-existing concentrations in Kemper County associated with other local and regional emission sources for these three HAPs as computed by the 1999 National-Scale Air Toxics Assessment (NATA, http://www.epa.gov/ttn/atw/nata1999/tables.html). In modeling long-term concentrations, as

AECOM Environment
2 August 2009 Risk Screening Analysis of HAP Emissions from the Proposed Kemper County IGCC Facility, 67% CO2 Capture Case – 06204-041-0001b
described in more detail below, an average concentration over a 5-year period was computed assuming that the IGCCs ran on syngas continuously at peak load. The level of incremental inhalation cancer and non-cancer risk, and combined risk (facility plus NATA), for each HAP were then evaluated. To evaluate the maximum individual lifetime cancer risk the estimated long-term average air concentration was multiplied by the URE (see Table 1). The result of this calculation is the increase in probability of a person contracting cancer after 70 years of exposure. A cancer risk value of less than 1x10⁻⁶ is generally recognized to be insignificant (U.S. EPA, 1991). For chronic non-cancer effects, the long-term average concentration was divided by the respective RAC to form what is referred to as a Hazard Quotient (HQ). A HQ value of less than 1.0 indicates that adverse non-cancer health effects are highly unlikely to occur (U.S. EPA, 2008). To assess potential acute health effects, the maximum modeled 1-hour average concentrations for the IGCCs were divided by minimum acute RAC found in EPA guidance (Acute Dose-Response Values for Screening Risk Assessments (6/12/2007) in http://www.epa.gov/ttn/atw/toxsource/table2.pdf.
In addition to the evaluation of inhalation health risks, the long-term deposition of mercury was also evaluated. Mercury is emitted in three forms, elemental mercury vapor, reactive gaseous mercury (RGM), and particulate-bound mercury (PBM). As indicated in Table 2, it is estimated that 90% of the total mercury emitted from the IGCCs is in the form of elemental mercury, 10% RGM and un-quantified trace amounts of PBM. In terms of the contribution to wet or dry deposition, elemental mercury is essentially inert because it has an extremely low solubility and is non-reactive. Therefore, most of the elemental mercury remains airborne and is transported over long distances (U.S. EPA, 1997). PBM is deposited with the particles with which it is incorporated, but in this case the rate of emission is so low that the rate of PBM deposition cannot be quantified. In contrast, RGM is soluble and reactive such that it is subject to both dry and wet deposition. Dry deposition occurs when airborne RGM comes into contact with elements on the earth’s surface such as vegetation and water bodies. Wet deposition occurs when precipitation falling through the plume captures soluble RGM vapor. As discussed further below, these deposition processes are simulated by U. S. EPA’s AERMOD air quality model. The ambient concentration and deposition of mercury from the IGCC units at the point of maximum impact, and the average over Kemper County, are evaluated by comparing modeled results to measurements taken at two locations along the Gulf coast, and a third located in Oak Grove, MS, where there are long-term mercury monitoring networks (see Figure 1).
4.0 Modeling Approach
U.S. EPA’s AERMOD model was applied to estimate air concentrations of arsenic, cadmium and mercury, and deposition of mercury emitted from the IGCC units. Five years of representative meteorological data (1991-1995) were applied, including National Weather Service (NWS) surface and precipitation data from Meridian Key Field in Meridian, MS and upper air data from Jackson International Airport in Jackson, MS. The relative location of the meteorological measurement sites with respect to the project site are provided in Figure 1. Processed, AERMOD-ready meteorological data was provided by the Mississippi Department of Environmental Quality (MDEQ) on their website (http://www.mississippi.gov/frameset.jsp?URL=http%3A%2F%2F %2Fwww.deq.state.ms.us%2FMDEQ.nsf%2Fpage%2FMain_Home%3FOpenDocument). The 5-year wind rose shown in Figure 2 indicates prevailing winds are primarily southerly, but northerly winds are also frequent. In accordance with U. S. EPA guidance, a sensitivity analysis was conducted using both the surface site characteristics (roughness, albedo and Bowen ratio) from the project site and the NWS station site, and the site characteristics that resulted in the greater modeled concentrations were applied. On this basis, the surface characteristics of the NWS site at Meridian were used. Two sets of receptors were used in the analysis. The first set, which was developed for the air quality modeling in support of the project permitting effort, was applied to model the concentration and deposition at the maximum point of impact. This receptor grid consisted of “tight” receptors spaced 50 meters apart along the fence line and extending out 500 meters from the fence-line. Beyond 500 meters, a spacing of 100 meters was used up to one-kilometer from the facility. Between one- and five-kilometers, a spacing of 500 meters was used. Between five- and ten-kilometers, a spacing of 1,000 meters was used. Between ten- and twenty-kilometers, a spacing of 2,000

AECOM Environment
3 August 2009 Risk Screening Analysis of HAP Emissions from the Proposed Kemper County IGCC Facility, 67% CO2 Capture Case – 06204-041-0001b
meters was used. For this grid, the near field receptors are shown in Figure 3 and the far field receptors are shown in Figure 4. A second set of receptors comprised of a uniform, 1 km spaced receptor grid across Kemper County, was used to model the Kemper County-wide average for comparison to NATA county-level results. Receptor elevations were developed using Digital Elevation Model (DEM) data from USGS. The Kemper County grid is shown in Figure 5.
Table 3 provides the source parameters used to apply AERMOD. For the IGCC dispersion modeling and RGM deposition analysis, the general modeling procedures and options specified in the current versions of in the AERMOD User’s Guide (U.S. EPA 2004), AERMOD Implementation Guide (U.S. EPA 2009), and the Guideline on Air Quality Models (GAQM; U.S. EPA 2005) were followed. To model ambient concentrations of arsenic, cadmium and elemental mercury, it was conservatively assumed that no deposition occurred. Deposition was accounted for in modeling the concentration of RGM. Modeling was conducted in a manner consistent with U.S. EPA guidance and standard practices, including the use of regulatory default options, as appropriate. The building downwash analysis was performed using the most recent version of EPA’s Building Profile Input Program (BPIP) (Version 04274) with the plume rise model enhancements (PRIME) building downwash algorithms, consistent with the air quality modeling.
Aerial imagery (2004) was examined to determine the land-use characteristics around the project site for use as input into the model for mercury deposition calculations. The area in the vicinity of the project was found to be heavily forested. As a result, category 4 (forest) was used for the gas dry deposition land-use category for all 36 10o
• diffusivity in air: 6.0E-2 cm
radials in the mercury deposition modeling as described in the Addendum to the AERMOD User’s Guide (U.S EPA, 2006).
The transport and mobility of a pollutant are determined by the physical properties of the specific pollutant. For deposition modeling, AERMOD requires several pollutant-specific parameters: (1) diffusivity in air; (2) diffusivity in water; (3) leaf cuticular resistance to lipid uptake; and (4) the Henry’s Law constant. The following values of these parameters recommended by U.S. EPA were applied:
2/sec (1
• diffusivity in water: 5.25E-6 cm
) 2/sec (2
• Cuticular resistance: 1.0E7 sec/m
)
• Henry’s Law constant: 6.0E-6 pa-m
(1) 3/mol
• Reactivity factor: 1.0
(1)
1Source is Wesley, M.L., Doskey, P.V., and Shannon, J.D. Deposition Parameterizations for the Industrial Source Complex (ISC3) Model, Argonne National Laboratory, June, 2002, Table 7 (p.27).
(1)
2 Source is U.S. EPA’s Human Health Risk Assessment Protocol for Hazardous Waste Combustion Facilities – [Publication No. EPA 530-R-05-006], September 2005. Information from companion HHRAP Database – Value for mercuric chloride. http://www.epa.gov/osw/hazard/tsd/td/combust/riskvol.htm#volume2 - scroll down to “Download HHRAP Companion Database (ACCESS)”

AECOM Environment
4 August 2009 Risk Screening Analysis of HAP Emissions from the Proposed Kemper County IGCC Facility, 67% CO2 Capture Case – 06204-041-0001b
5.0 F indings
Figure 6 provides the location of the maximum modeled air concentrations for the modeled HAPs and the location of the highest RGM deposition relative to the facility. The maximum air concentration impacts, along with the maximum dry deposition, were found to be along the southeast fence-line of the power block portion of the facility. The maximum wet and total RGM deposition was found to occur along, and just past, the northeast fence-line of the power block, directly to the north of the IGCC stacks.
Table 4 provides inhalation risk estimates associated with arsenic, cadmium and mercury emitted from the facility and the combined county-wide risk of these HAPs, incorporating the 1999 NATA Kemper County modeling results. The maximum cancer risk, which is associated with arsenic, is 2.0 x 10⁻⁷ at the point of maximum, and the county-wide-average risk, including the proposed IGCC units is only about 1.7 x 10⁻⁸. These levels are below the EPA’s recommended significance level of 1x10⁻⁶. The hazard quotients for each of the three HAPs are also insignificant with the highest incremental HQ, which occurs for cadmium, of 3.2 x 10⁻³ compared to a significance level of 1.0. The corresponding Kemper County HQ for cadmium is about 2.6 x 10⁻⁴. The results of acute inhalation assessment, provided in Table 5, indicate that arsenic is the HAP with the largest acute hazard quotient with a value of about 5.6 x 10⁻³. This analysis demonstrates that the proposed IGCC units will not cause or contribute significantly to acute or chronic health effects and cancer risk.
The analyses for mercury are provided in Tables 6 and 7. Table 6 compares maximum modeled long-term air concentrations of elemental mercury and RGM with available measurements from two measurement sites located to the south near the Gulf Coast. The long-term concentration of elemental mercury is two orders of magnitude less than the measured ambient concentrations, and the maximum modeled RGM concentration is less than half of the ambient concentrations. Thus, the combined maximum long-term modeled concentration of elemental mercury and RGM is only about one hundredth of the measured ambient concentrations. This finding is consistent with NATA which specifies a U.S. background mercury concentration associated with global transport of 1.5 x 10⁻³ μg/m3
6.0 S ummary
. Table 7 provides a comparison of the maximum modeled RGM deposition from the facility with values developed from measurements from the OLF study and the NADP Mercury Deposition Network. The maximum long-term wet deposition is one to two orders of magnitude less than measurements. The modeled dry deposition at the location of maximum deposition is comparable to the dry deposition estimates from the OLF study. The result is that the total modeled mercury deposition is only about one seventh of total ambient deposition. The deposition analysis therefore demonstrates that the project will not contribute substantially to the ambient concentration or deposition of mercury in the vicinity.
An assessment of the HAP emissions from the proposed IGCC units was conducted using the conservative assumption that the IGCC units will operate continuously at 100% load on syngas for five years. Modeling of concentrations and RGM deposition was conducted with AERMOD, a U.S. EPA designed model that provides conservative estimates of air quality impacts. The results of the assessment indicate that no HAP emitted from the project will result in, or contribute to, human health risk due to inhalation. In addition, the ambient concentrations of mercury resulting from the IGCC units were modeled to be orders of magnitude less than ambient concentrations, and the modeled deposition of mercury was less than has been measured at nearby study areas.

AECOM Environment
5 August 2009 Risk Screening Analysis of HAP Emissions from the Proposed Kemper County IGCC Facility, 67% CO2 Capture Case – 06204-041-0001b
7.0 R eferences
U.S. Environmental Protection Agency (EPA), 1997. Mercury Stud report to Congress, Volume III: Fate and Transport of Mercury in the Environment, EPA-452/R-97-005, December.
U.S. EPA, 2009. AERMOD Implementation Guide – Revised,March 19,2009
U.S. EPA, 2006. Addendum: Users Guide for the AMS/EPA Regulatory Model – AERMOD
EPA-454/B-03-001, September 2004)
U.S. EPA, 2005. Guideline on Air Quality Models (as incorporated in Appendix W of 40 CFR Part 51; EPA, 2005).
U.S. EPA, 2004. Users Guide for the AMS/EPA Regulatory Model – AERMOD.
EPA-454/B-03-001. September.
U.S. EPA, 2005. Human Health Risk Assessment Protocol for Hazardous Waste Combustion Facilities – [Publication No. EPA 530-R-05-006], September 2005.
U.S.EPA, 2008. 1996 National-Scale Air Toxics Assessment: Summary of Results [http://www.epa.gov/nata/risksum.html].
U.S.EPA, 1991. Role of the Baseline Risk Assessment in Superfund Remedy Selection Decisions. OSWER Directive #9355.0-30. April. [http://www.epa.gov/oswer/riskassessment/pdf/baseline.pdf].
Wesley, M.L., Doskey, P.V., and Shannon, J.D. Deposition Parameterizations for the Industrial Source Complex (ISC3) Model, Argonne National Laboratory, June, 2002.

AECOM Environment
6 August 2009 Risk Screening Analysis of HAP Emissions from the Proposed Kemper County IGCC Facility, 67% CO2 Capture Case – 06204-041-0001b
Table 1: Estimates of HAP Emissions for Each of Two IGCC Stacks for Siemens Turbines and Ranking in Terms of Inhalation Risk
Maximum Short-Term
Emissions (1,3)
Cancer Unit Risk
Estimate (lb/hour)
(4) (1/µg/m3
Percent of Cancer
Risk )
Reference Air Concentration
Percent of Chronic Hazard Index
(4)
(μg/m3)
Volatile Organic Compounds Acetaldehyde 1.79E-02 2.20E-06 0.0% 9.00 0.1% Acrolein 1.58E-03 NA -- 0.02 4.0% Benzene 1.91E-02 7.80E-06 0.2% 30.00 0.0% Ethylbenzene 6.43E-03 NA -- 1000.00 0.0% Formaldehyde 8.61E-02 5.50E-09 0.0% 9.80 0.4% Toluene 1.92E-02 NA -- 5000.00 0.0% Xylene 1.83E-02 NA -- 100.00 0.0% Polycyclic Organic Matter (POM) Polycyclic Aromatic Hydrocarbons (PAH) 1.33E-04 1.10E-03 0.2% 200.00 0.0% 2-Methylnapthalene 1.14E-03 NA -- NA -- Acenapthylene 8.25E-05 NA -- NA -- Benzo(a)anthracene 7.30E-06 1.10E-04 0.0% NA -- Benzo(e)pyrene 1.75E-05 NA -- NA --
Benzo(g,h,i)perylene 3.02E-05 NA -- NA -- Napthalene 1.45E-03 3.40E-05 0.1% 3.00 0.0% Metals
Antimony 1.24E-02 NA -- NA -- Arsenic 9.52E-03 4.30E-03 45.7% 0.03 16.0% Beryllium 2.92E-03 2.40E-03 7.8% 0.02 7.4% Cadmium 1.33E-02 1.80E-03 26.8% 0.02 33.6% Chromium VI 1.45E-03 (2) 1.20E-02 19.4% 0.10 0.7% Cobalt 2.57E-03 NA -- 0.10 1.3%
Lead 1.27E-02 NA -- 0.15 4.3% Manganese 1.36E-02 NA -- 0.05 13.8% Mercury (total) 3.67E-03 NA -- 0.30 0.6% Elemental Mercury 3.31E-03 NA -- NA --
Reactive Gaseous Mercury 3.67E-04 NA -- NA -- Particulate-bound Mercury Trace NA -- NA -- Nickel 1.78E-02 NA -- 0.09 10.0% Phosphorous 1.08E-02 NA -- 0.07 7.8% Selenium 1.36E-02 NA -- NA -- Inorganic Compounds Carbon Disulfide 1.43E-01 NA -- 700.00 0.0%
(1) Emission rates based on emission factors from "A Study of Toxic Emissions from a Coal-Fired Gasification Plant", Radian Corporation, December 1995.
(2) 12% of total chromium emissions characterized as hexavalent for coal combustion per U.S. EPA 2005 National Emissions Inventory Data & Documentation (http://www.epa.gov/ttn/chief/net/2005inventory.html).
(3) Estimates are based on full load operating scenarios with Duct Burner firing. (4) Source: Prioritized Chronic Dose-Response Values: http://www.epa.gov/ttn/atw/toxsource/table1.pdf.
AECOM Environment
7 August 2009 Risk Screening Analysis of HAP Emissions from the Proposed Kemper County IGCC Facility, 67% CO2 Capture Case – 06204-041-0001b
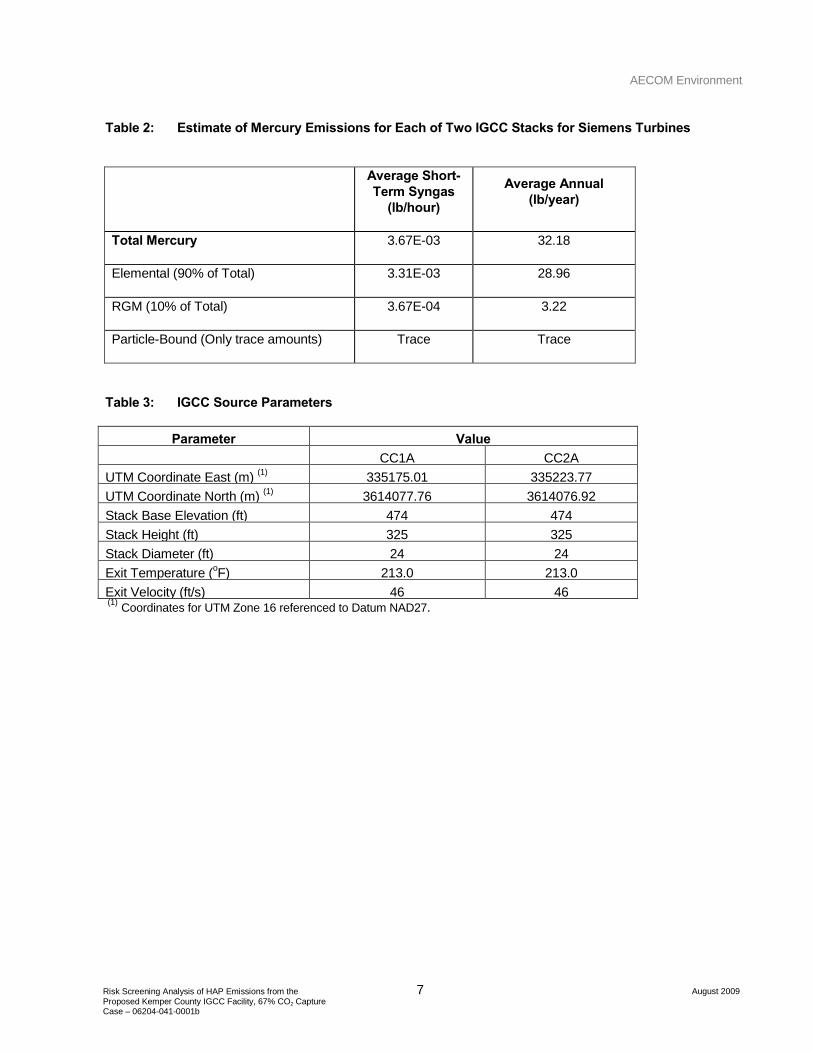
Table 2: Estimate of Mercury Emissions for Each of Two IGCC Stacks for Siemens Turbines
Average Short-Term Syngas
(lb/hour)
Average Annual (lb/year)
Total Mercury 3.67E-03 32.18
Elemental (90% of Total) 3.31E-03 28.96
RGM (10% of Total) 3.67E-04 3.22
Particle-Bound (Only trace amounts) Trace Trace
Table 3: IGCC Source Parameters
Parameter Value CC1A CC2A UTM Coordinate East (m) 335175.01 (1) 335223.77 UTM Coordinate North (m) 3614077.76 (1) 3614076.92 Stack Base Elevation (ft) 474 474 Stack Height (ft) 325 325 Stack Diameter (ft) 24 24 Exit Temperature (o 213.0 F) 213.0 Exit Velocity (ft/s) 46 46 (1)
Coordinates for UTM Zone 16 referenced to Datum NAD27.

AECOM Environment
8 August 2009 Risk Screening Analysis of HAP Emissions from the Proposed Kemper County IGCC Facility, 67% CO2 Capture Case – 06204-041-0001b
Table 4: Modeled Project-Related Chronic Inhalation Risk Estimates for Arsenic, Cadmium, and Mercury
(1) Values are the average of all receptors (total 2085) in an evenly spaced grid covering all of Kemper County in 1000m increments.
(2) 1999 National Air Toxics Assessment (http://www.epa.gov/ttn/atw/nata1999/tables.html) NATA’s National Ambient Background for mercury is 1.50E-03 µg/m3
.
Maximum Project Related Risk Estimates Kemper County-Wide Average Risk Estimates
Hazardous Air Pollutant
Maximum Modeled
Long-Term Concentration
(µg/m3
Chronic Hazard
Quotient )
Individual Inhalation
Cancer Risk
Average (1) Long-Term
Modeled Concentration from Project
(μg/m3
NATA
)
(2)
Modeled Kemper
County Long-Term
Concentration (μg/m3
Total Modeled Long-Term
Kemper County
Concentration (μg/m)
3
Chronic Hazard
Quotient
)
Individual Inhalation
Cancer Risk
Arsenic 4.62E-05 1.54E-03 1.99E-07 3.24E-06 7.83E-07 4.02E-06 1.34E-04 1.73E-08
Cadmium 6.46E-05 3.23E-03 1.16E-07 4.53E-06 7.22E-07 5.25E-06 2.63E-04 9.45E-09
Mercury - Total 1.78E-05 5.93E-05 not applicable 1.24E-06 8.91E-07 2.13E-06 7.10E-06 not applicable

AECOM Environment
9 August 2009 Risk Screening Analysis of HAP Emissions from the Proposed Kemper County IGCC Facility, 67% CO2 Capture Case – 06204-041-0001b
Table 5: Modeled Project-Related Acute Inhalation Risk Estimates for Arsenic, Cadmium, and Mercury
Pollutant
Maximum Modeled
Concentration (μg/m3
Acute Dose Response
Value)
(1) (µg/m3
Acute Hazard
Quotient )
Arsenic 0.00106 0.19 5.58E-03
Cadmium 0.00148 900.0 1.65E-06
Mercury - Elemental 0.00041 1.8 2.27E-04
(1) Minimum value provided in Table 2: Acute Dose-Response Values for Screening Risk Assessments (http://www.epa.gov/ttn/atw/toxsource/summary.html).
Table 6: Maximum Modeled Long-Term Mercury Air Concentrations (µg/m3
Hazardous Air Pollutant
)
Maximum Modeled Long-
Term Concentration
Grand Bay Lab Ambient
Conc. (1)
OLF Mercury Study Average Concentration (2005-2008) (2)
Mercury - Elemental
1.60E-05 1.40E-03 1.35E-03
Mercury – RGM 1.78E-06 4.02E-06 3.68E-06
Elemental + RGM 1.78E-05 1.41E-03 1.35E-03 (1) http://www.arl.noaa.gov/documents/reports/Luke_NADP_v2.pdf. (2) Data provided by Southern Company.
Table 7: Comparison of Modeled Mercury Deposition from the Facility with Measured Deposition
(g/m2
Pollutant
/year)
Max. Annual Modeled Impact
NADP Mercury Deposition Network(1)
OLF 2005-08 Average Low/High
Estimates
Mercury - Wet Deposition
(2)
3.44E-07 1.68E-05 1.47E-05
Mercury - Dry Deposition 2.24E-06 not available 1.22E-06/2.45E-06
Mercury - Total Deposition 2.46E-06 not available 15.9E-06/17.2E-06
(1) Average concentration at MS22 monitor (Oak Grove, MS) from 2001-2007. (2) Data for OLF provided by Southern Company. Wet deposition is directly measured and dry deposition has been estimated based on measured concentrations and estimated range of deposition velocity applicable to the surface type in the OLF study area.

AECOM Environment
10 August 2009 Risk Screening Analysis of HAP Emissions from the Proposed Kemper County IGCC Facility, 67% CO2 Capture Case – 06204-041-0001b
Figure 1: Relative Location of Kemper IGCC Project Site, Meteorological Data Sources, and Ambient Mercury Monitors

AECOM Environment
11 August 2009 Risk Screening Analysis of HAP Emissions from the Proposed Kemper County IGCC Facility, 67% CO2 Capture Case – 06204-041-0001b
Figure 2: Meridian Key Field 5-year (1991-1995) Wind Rose

AECOM Environment
12 August 2009 Risk Screening Analysis of HAP Emissions from the Proposed Kemper County IGCC Facility, 67% CO2 Capture Case – 06204-041-0001b
Figure 3: Project Receptors Used to Determine Maximum Annual and Short-Term Impacts – Near-Field Receptors

AECOM Environment
13 August 2009 Risk Screening Analysis of HAP Emissions from the Proposed Kemper County IGCC Facility, 67% CO2 Capture Case – 06204-041-0001b
Figure 4: Project Receptors Used to Determine Maximum Annual and Short-Term Impacts – Far-Field Receptors

AECOM Environment
14 August 2009 Risk Screening Analysis of HAP Emissions from the Proposed Kemper County IGCC Facility, 67% CO2 Capture Case – 06204-041-0001b
Figure 5: Kemper County Receptor Grid

AECOM Environment
15 August 2009 Risk Screening Analysis of HAP Emissions from the Proposed Kemper County IGCC Facility, 67% CO2 Capture Case – 06204-041-0001b
Figure 6: Location of Maximum Air Concentration Impacts and Mercury Deposition