appendix k network rail procurement and supply chain strategy · appendix k network rail...
TRANSCRIPT

MSBC Master (for NO use only)_First Issue.docx
Appendix K Network Rail Procurement and Supply Chain Strategy

Infrastructure Projects
1
CP5 Procurement and Supply
Chain Strategy
Supplier Briefing
Central Region
10th July 2013

2
Most inefficiencies can be tracked back to the lack of a committed work
bank - fixing this is key to driving better value for money in CP5
Current issues
• Uncertain “flow” of work leads to significant inefficiency in supply base• under-utilisation of resources
• reluctance to invest in innovation and “game-changing” solutions
• Lack of strategic alignment with NR agenda
• “Tender engine” vs “strategic supply chain management”• Tactical and transactional, “arms length” tender process rather than strategy & insight
• Hundreds of single tender events – often compressed & rushed – resource intensive
• Too much admin and reporting vs pro-active cost and supplier management
• Fragmented supply base – inefficient and hard to build strong relationships• Leverage “atomised” (e.g. 300 + suppliers used in last 3 years)
• Supply chain too long with weak links
• Poor understanding of extended supply chain (1st, 2nd, 3rd tiers)
• Too many suppliers to develop genuine strategic relationships
• Innovation frustrated by process and cultural issues• Over prescribed technical solutions constrains innovation and value engineering
• Lack of commitment drives under investment in innovation and continuous improvement
• Too much lump-sum – with tender award often rising by + 20% at out-turn cost • 70% of tenders under £1M value
• Poor understanding of actual cost-base or “should cost”
• Cultivates opportunistic approach and “Claims culture” behaviour
Lack of committed work bank
Transactional focus
Fragmented leverage
Poor out-turn cost value
Innovation Frustrated
Root causes of inefficiency

Improve safety for passengers and workers -
approved £67m of funding to upgrade and close
level crossings in England and Wales
Complete projects to increase capacity and
improve service as fast as possible
Give more say to rail users on how the railway is
improved, putting passengers "at the heart of decisions"
Provide better and more up-to-date data on the condition of assets, so problems can be fixed
before they occur
On average of 92.5% of trains on all routes across
the UK must arrive on time, compared with its
target of just over 90% now
Give greater value for money - the ORR requires
Network Rail and the supply chain to make £2 Bn
further savings
Punctuality
Infrastructure
Value formoney
Passengers
Asset data
“
”
Network Rail could do what it is promising to do for less money and more efficiently
Anna Walker Chairwoman ORR Board
Safety “
”
….Network Rail and the supply chain must make further savings and give greater value for money, through… improved management and more efficient ways of working but not at the expense of safety
ORR Draft Determination (12th June)
3
The regulator has set significant efficiency challenges – we must improve
all our key performance areas whilst finding over £2bn efficiencies in CP5
Objectives set for Network Rail by ORR

Network Rail have identified 12 strategic themes which will be crucial to delivering our CP5 commitments
4
• 12 strategic themes
• Workforce and system
safety
• Capacity and performance
management
• Asset Management
Excellence
• Project Development and
Delivery
• Sustainability
• Systems and Technology
Innovation
• Sustainable Funding and
Financing
• People Capability
• Partnership with Customers
• Supply Chain Management
• Corporate Development
• Public Engagement”
Our Supply Chain is our main strategic lever to achieve these outcomes. Supply
Chain Management must become a core competence and is a strategic
imperative.
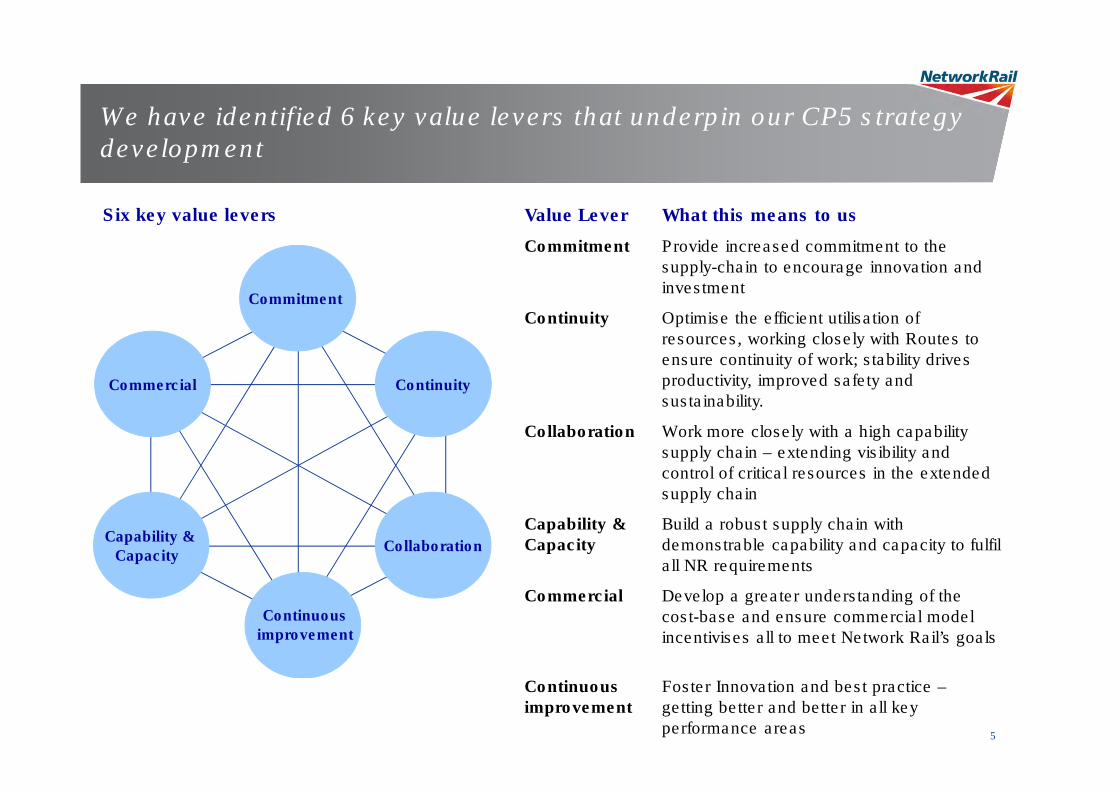
Value Lever What this means to us
Commitment Provide increased commitment to the
supply-chain to encourage innovation and
investment
Continuity Optimise the efficient utilisation of
resources, working closely with Routes to
ensure continuity of work; stability drives
productivity, improved safety and
sustainability.
Collaboration Work more closely with a high capability
supply chain – extending visibility and
control of critical resources in the extended
supply chain
Capability & Capacity
Build a robust supply chain with
demonstrable capability and capacity to fulfil
all NR requirements
Commercial Develop a greater understanding of the
cost-base and ensure commercial model
incentivises all to meet Network Rail’s goals
Continuousimprovement
Foster Innovation and best practice –
getting better and better in all key
performance areas
We have identified 6 key value levers that underpin our CP5 strategy development
Six key value levers
5
Capability & Capacity
Commercial
Commitment
Continuity
Collaboration
Continuous improvement

6
We have placed our Customers, Safety and Value for Money at the heart of our CP5 Vision
IP Value ChainFocus on collaborative
working with our customers
Focus on “downstream” Supply Chain Management
excellence
� Understand Customer needs
� Demand Planning and Aggregation
� Programme Integration and Planning
� Consent Management
� Access Optimisation and Integration
� Stakeholder Management
� Converting Customer Output Specifications into Efficient Solutions
� Whole Life Cost Evaluation
� Build relationships with c. 10-12 key T1 contractors
� Continuous Improvement of key performance measures and root-cause analysis of issues
� “Leaning” of internal and external processes
� Supply chain HUB – coordinating the procurement and development of key Tier 2 suppliers
� Deeper understanding of the Cost-Base
� Whole-life cost – linking to Route Opex costs
Our strategy will mend broken processes and force issues to be addressed
“We will delight our customers and stakeholders by providing innovative and efficient solutions, ensuring safe delivery to plan and budget. We will work collaboratively with them to optimise their
demand, then manage efficient delivery through a highly capable, responsive, focussed and motivated supply chain.”

7
Our procurement and delivery strategy will also enable a significant improvement in Safety
Current issues
Commitment & Continuity
of work
Closer to fewer for
longer
Early Engagement in End-to-
End process
Increase focus on Safety in
tender and contract
• Enable directly employed stable and consistent workforce for effective
behavioral change
• Security to invest in staff, system, process and technological innovation
• Allows for longer-term planning and risk management - projects can be
planned in periods of better weather conditions and daylight.
• Shifts focus from tendering on to delivery and safety performance and
removes barriers to sharing of best practice and innovation.
• Easier to embed safety initiatives and share best practice across
contractors
• Higher capability and competent staff will gravitate to the consolidated
supply chain
• Effective and independent performance measurement and
benchmarking (linked to profitability) will drive up standards.
• End to end engagement supports Safe by Design principles and allows
safe buildability and safe operability to be considered earlier.
• Long-term programme and planning facilitates off-site modularized
production in a controlled environment.
• Long-term engagement with strategic Tier 1 allows the cascade of H&S
benefits of strategic Tier 2
• Major selection criteria for delivery partners – systems and behavioral
• PQQ and ITT process will require suppliers to describe how commitment
based contracts will be used to invest in improving safety performance
over contract period
• Safety KPI’s will be competitively tendered (height of bar) and initiatives
required to support year on year improvement.
Health & Safety
Our number 1 priority

8
In CP5 we will seek greater collaboration with our extended supply chain – to foster innovation in Tier 2 and assure quality and value for money
Co-ordinated National approach
Collaboration
Goals
� Innovation – encouraging and directing innovation
� Consistent and clear asset strategy
� Assuring Value for Money – co-ordinated procurement with full NR leverage
� Sustainability – ensure the extended supply chain is sustainable
� Commitment - Provide visibility and commitment to the extended market to enable
strategic investment and capacity is secured
� Manage strategic risks in the extended supply chain – first by understanding them
and then taking action to mitigate them
� Understanding how the end to end processes work and how these can be made more
efficient
We need more visibility and greater control of quality in the extended supply chain – risk & value
Traditional procurement
Network RailTier 1
Main contractors
Tier 2
Suppliers
Tier 3
OEM / Materials
suppliers

We have segmented our CP5 programme into 3 main delivery models, differentiated by scheme value and complexity
9
Key Value driver
� Schemes single projects - high value, multi-discipline and complex
� Main value driver is maximising engineering innovation and early contractor engagement, with a collaborative and integrated team approach
� Contractor will engineer solution to cost, working in Alliance with NR utilising the Stafford model and other learnings from across NR
� Early commitment to secure and develop constrained resource.
� Design to budget on an end to end solution, with shared risk on “best for project “ basis.
Alliance
� Single project schemes - medium value, 90% single-discipline and medium complexity
� Main value driver will come from engineering solutions and innovation
� Value will be optimised by providing continuity for project-teams across planned sequential schemes, using single discipline contractors, minimising demob/mob disruption
� Facility in contract to form mini-Alliances to deliver the few (c.10%) multidisciplinary schemes
� Co-opetition will be incentivised - sharing best practice and “peer-reviewing” solutions
PanelCivils
Buildings
Railway Specialist
� Lower complexity, lower value, repetitive schemes (typically renewals) aggregated into programmes – representing 79% of total to-be-let schemes, yet only 26% of to-be-let value
� Main value driver is Productivity, with efficiency coming from optimisation of resources across multiple schemes and continuous improvement from delivering repeatable work types
� Commitment and continuity of workbank with geographic exclusivity - enabling consistent resource utilisation, productivity improvement, investment in resource and delivery innovation
Programme
Delivery Model
Collaboration & Engineering Innovation
ProductionEfficiency
Value Drivers

IP Central Region’s CP5 total work bank is £4.4bn where £2.3bn (51%) is yet to be let
10
IP Central’s CP5 spend forecast (£m)
Not Let
27%
2,271
Total
40%
34%
36%
Let or in
process
2,172
23%
37%
4,443
East Midland
LNW (S)
LNW (N)
• IP Central region’s CP5 forecasted spend is £4.4bn where £2.2bn is yet to be let
• 49% of the total forecasted spend has already been let or is in process
• The remaining £2.2bn to be let is split:
• 40% East Midlands
• 34% LNW (South)
• 27% LNW (North)
Comments
Source: Network Rail IP (Central Region, Sean O’Brian, Drew Tranter, Duncan Golding), Efficio Analysis

11Source: Network Rail IP (Central Region, John Moore, Sean O’Brian, Duncan Golding, and Drew Tranter), Efficio Analysis
We have segmented our Procurement and delivery route by scheme value and complexity
Programme
Panel
Alliance
Panel
Total spend: £1.1bnVolume: ~50 schemes
Programme
Total spend: £0.5bnVolume: >600 schemes
Alliance
Total spend: ~£0.5bnVolume: 2 schemes
Value (£k)
Complexity
IP Central CP5 spend by category
50.000
HighLow
100.000

12
Programmes - Lower complexity, lower value, repetitive schemes (typically renewals) aggregated into committed programmes with geographic exclusivity
Value levers
� Main value driver is Productivity, with efficiency coming from optimisation of resources across multiple schemes and continuous improvement from delivering repeatable work types
� Commitment and continuity of work bank with geographic exclusivity – enabling:
� consistent resource utilisation
� productivity improvement
� investment in resource and delivery innovation
� Tier 2: Post-award we will work collaboratively with the delivery partners to identify opportunities for NR to directly procure key goods and services to the benefit of all parties.
Lotting
• Lotting : 11 lots in 2 Geographies (LNW North Northern Area, LNW North Southern Area &
LNW South) covering Property; Earthworks; Structures; and E&P renewals

13
Programmes - Lower complexity, lower value, repetitive schemes (typically renewals) aggregated into committed programmes with geographic exclusivity
Contract Form:
• Geographically exclusive 5 +5 year Programmes with volume commitment
• Opportunity for additional 5 year CP6 extension, subject to performance over CP5
• Contract will use the recent NR13C Programme contract developed for the National LX
Replacement (Footbridge) project (with amendments to specific commercial models and
pricing templates)
• NR12 call-off contract (simplified work instruction)
• Committed 5 year programme let on a representative work “basket” priced using “building
block” composite rates supported by 1st principle detailed costs
• Out-performance incentivised with gain-share linked to KPIs
• Year on Year efficiency committments to reflect continuous improvement
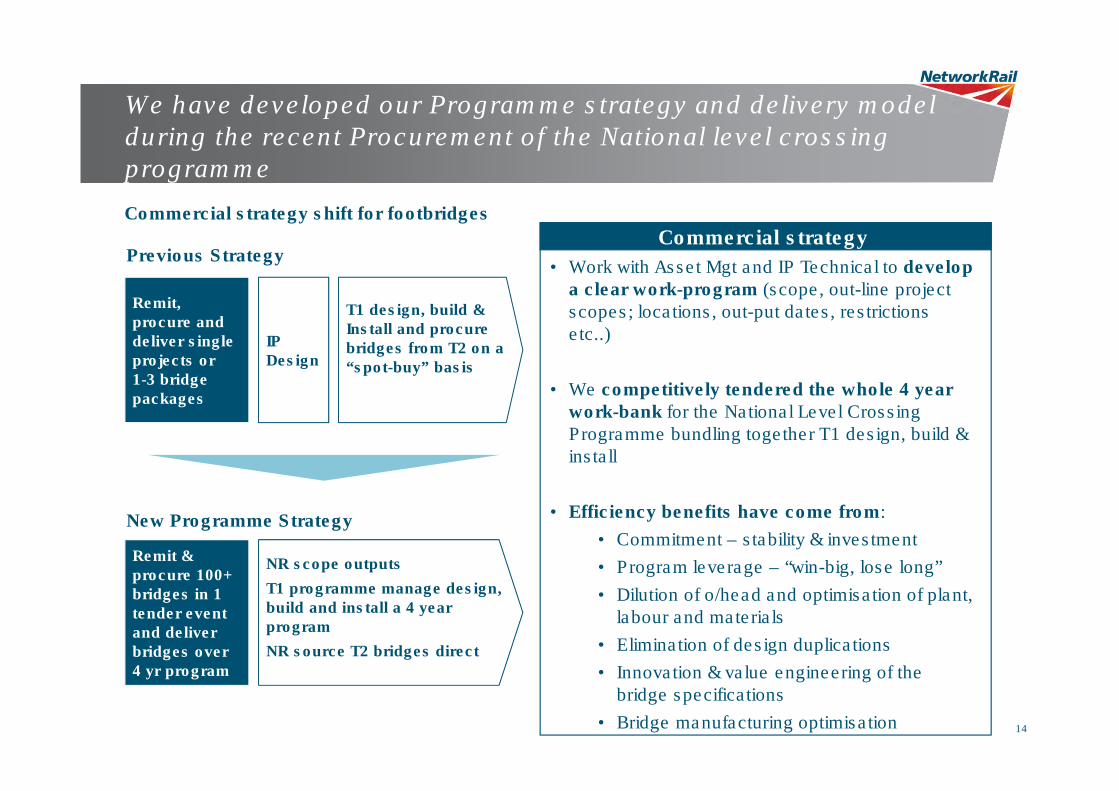
We have developed our Programme strategy and delivery model during the recent Procurement of the National level crossing programme
14
Commercial strategy shift for footbridges
Commercial strategy
• Work with Asset Mgt and IP Technical to develop a clear work-program (scope, out-line project scopes; locations, out-put dates, restrictions etc..)
• We competitively tendered the whole 4 year work-bank for the National Level Crossing Programme bundling together T1 design, build & install
• Efficiency benefits have come from:
• Commitment – stability & investment
• Program leverage – “win-big, lose long”
• Dilution of o/head and optimisation of plant, labour and materials
• Elimination of design duplications
• Innovation & value engineering of the bridge specifications
• Bridge manufacturing optimisation
IP Design
Remit, procure and deliver single projects or 1-3 bridge packages
T1 design, build & Install and procure bridges from T2 on a “spot-buy” basis
Remit & procure 100+ bridges in 1 tender event and deliver bridges over 4 yr program
NR scope outputs
T1 programme manage design, build and install a 4 year program
NR source T2 bridges direct
Previous Strategy
New Programme Strategy

The programme based approach realised significant benefits compared with the traditional procurement approach, and delivery in 35% less time
• Reduced public harm risk as programme delivery
greatly accelerated (e.g. from 4 to 2.5 years)
• T1 and T2 combined cost reduction in excess of 30%
compared to a representative set of recent schemes.
This is equivalent to installing a further 60 two track
stepped bridges
• New Programme contract developed with cost certainty
for the entire Control Period driven by the Total
Programme Cost
• Innovation - best technical innovations adopted a
through rigorous value engineering process
• Major workload reduction for tender resources (i.e. # of
tenders reduced from 40 to 2)
• Improvements in contract terms and risk reduction (e.g.
Ground risk transferred)
• Post contract process improved
• Risk of claims & variations mitigated
• Programme staff now free to focus on delivery, quality,
safety and continuous improvement of performance
-30%
NLX Programme BudgetBudget required to buy same volume at today’s average cost
42.0m
59.7m
Notes: 1 10% efficiency included in steel bridge price (after Yr 1) for innovation to be incorporated in NR StandardsSource:NR and Efficio analysis
Benefits achievedEfficiency achieved (£m)
15

Programme categories include property, structures, earthworks, and E&P renewals works with 27 sub-categories
Property Structures Earthworks E&P
Canopies
(replace and renew)
Overbridges
replace and renew)Cuttings Signalling power
Canopies (repair)Overbridges
repair and preventative)Embankments OLE
Platforms
(replace and renew)Underbridge Drainage Distribution
Platforms (repair)Bridge over water
(repair / strengthen)Rock-face netting Protection relays
Footbridge stations
(replace and repair)
Bridge over water
(preventative)De-vegetation Cables
Depots and stations
(replace and repair)Tunnels Access Steps Point heating
Grit blast and painting SCADA
Hidden critical elements
Category
Sub-category

17
Panels – framework of contracts to design and deliver multiple mid-value (£5-£50 M) schemes leveraging engineering excellence and innovation Value levers
� Innovation - with early engagement (GRIP2/3) of an integrated team to develop design
and scope.
� Closer collaboration & integration with IP/Supplier teams, concentration of quality
resources, with incentivisation and sharing of innovation value
� Commitment and geographic exclusivity enabling continuity of engagement across
schemes to:
� minimise demob/mob disruption and build on teamwork and collaboration
� retain & build capability, resources & expertise.
� Incentivise Co-opetition – e.g. sharing best practice and “peer-reviewing” solutions,
supply chain HUB
• Appointed Panel partners will also work collaboratively to secure and deliver externally funded schemes
Lotting
• Geographically exclusive 5 + 5 yr contracts let in 9 Lots by Primary Discipline (Buildings;
Civils, Rail Eng x 3 Areas )
• Option for forming multi-discipline Alliances by Area as directed by NR for specific
schemes.

18
Panels – framework of contracts to design and deliver multiple mid-value (£5-£50 M) schemes leveraging engineering excellence and innovation
Contract Form:
• NR 13 – Programme Framework contract with commitment to geographic exclusivity for
defined discipline
• NR12 – Award individual schemes or packages of schemes as design & TC approved if
under SBP & efficiency challenge
• Supplementary Collaboration agreement for multi-disciplined schemes where required
(10%)
• Profitability & potential CP6 extension to be linked to performance through KPIs.
2 stage approach to Target cost setting
• 1) Setting the TC. Design to Cost with suppliers issued at Grip 2/3 stage with a sense
checked SBP, to maximise innovation and efficiency (in key design phase). Formal
incentivised peer review process for final TC. Share savings below SBP with supplier.
• 2) Out-performing the TC. Incentivise supplier to out-perform TC as per normal gain share
mechanism

The ca. £2.2bn of IP Central Region’s remaining CP5 spend will be addressed by 3 sourcing routes: Alliance, Panel, and Programme
19
Programme
583
(27%)
350
(16%)
232
(11%)
Panel
1,111
(51%)
171
(8%)
721
(33%)
219
(10%)
Alliance
493
(23%)
180
(8%)
313
(14%)
Total CP5 spend
2,186
• IP Central region’s CP5 spend is circa £2.2bn represented by 3 sourcing routes; Alliance, Panel, and Programme covering LNW (South), LNW (North), and East Midland
• Alliance schemes are major schemes with high-complexity and spend
• Panel represents mid-size schemes with individual contract value between £5m-£100m per schemes.
• Programme represents small schemes with individual contract values of less than £5m (79% scheme volume but only 27% of overall value)
Key Findings
IP Central CP5 spend by sourcing route (£m)
Source: Network Rail IP (Central Region, Sean O’Brian, Drew Tranter, Duncan Golding), Efficio Analysis
LNW (N)
East Midland
LNW (S)

East Midland represent the main CP5 Panel spend with 65% of the total and almost half of it is Railway Engineering spend
20
East Midland Panel spend by category (£m)
Source: IP Central CP5 work bank, 30 April 2013 workshop discussions
� East Midland route spend of £721m represent 65% of the CP5 Panel spend
� Almost half of the spend is represented by Railway Engineering schemes
� Railway Engineering includes track, signalling and E&P
� The sourcing route includes ca 30 mid-size schemes with individual contract value between £5m-£100m per scheme
� NB – these figures exclude 3rd Party funded schemes, which will be delivered with the successful delivery partner
Comment348
(48%)
246
(34%)
127
(18%)
Railway
Engineering
Civils
721
Total Panels Buildings
East Midlands

LNW (S) total Panel spend is £219m and represent 20% of the total CP5 Panel spend in the Central region. Multidisciplinary schemes stand for half of the route’s total
21
LNW (S) Panel spend by category (£m)
Source: IP Central CP5 work bank, 30 April 2013 workshop discussions
� LNW (S) spend is £219m and represent 20% of the total CP5 Panel spend in the Central region
� Multidisciplinary schemes represent half of the spend where railway engineering, civils and building schemes are included in each of the schemes
� The sourcing route includes 11 mid-size schemes with individual contract value between £5m-£100m per scheme
� NB – these figures exclude 3rd Party funded schemes, which will be delivered with the successful delivery partner
Comment
37
(17%)
Civils
49
(22%)
Railway
Engineering
15
(7%)
Total Panels
118
(54%)
Multidisciplinary
219
Buildings
LNW (South)
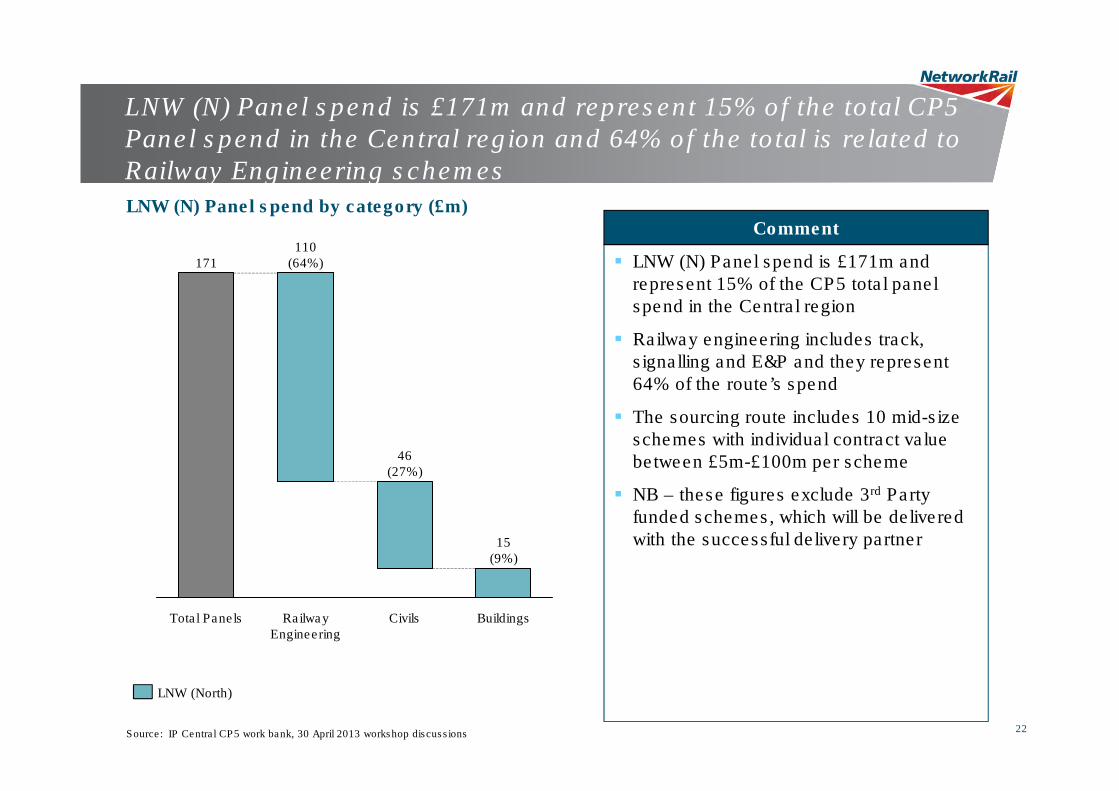
LNW (N) Panel spend is £171m and represent 15% of the total CP5 Panel spend in the Central region and 64% of the total is related to Railway Engineering schemes
22
LNW (N) Panel spend by category (£m)
Source: IP Central CP5 work bank, 30 April 2013 workshop discussions
� LNW (N) Panel spend is £171m and represent 15% of the CP5 total panel spend in the Central region
� Railway engineering includes track, signalling and E&P and they represent 64% of the route’s spend
� The sourcing route includes 10 mid-size schemes with individual contract value between £5m-£100m per scheme
� NB – these figures exclude 3rd Party funded schemes, which will be delivered with the successful delivery partner
Comment
15
(9%)
Total Panels
46
(27%)
110
(64%)171
BuildingsCivilsRailway
Engineering
LNW (North)
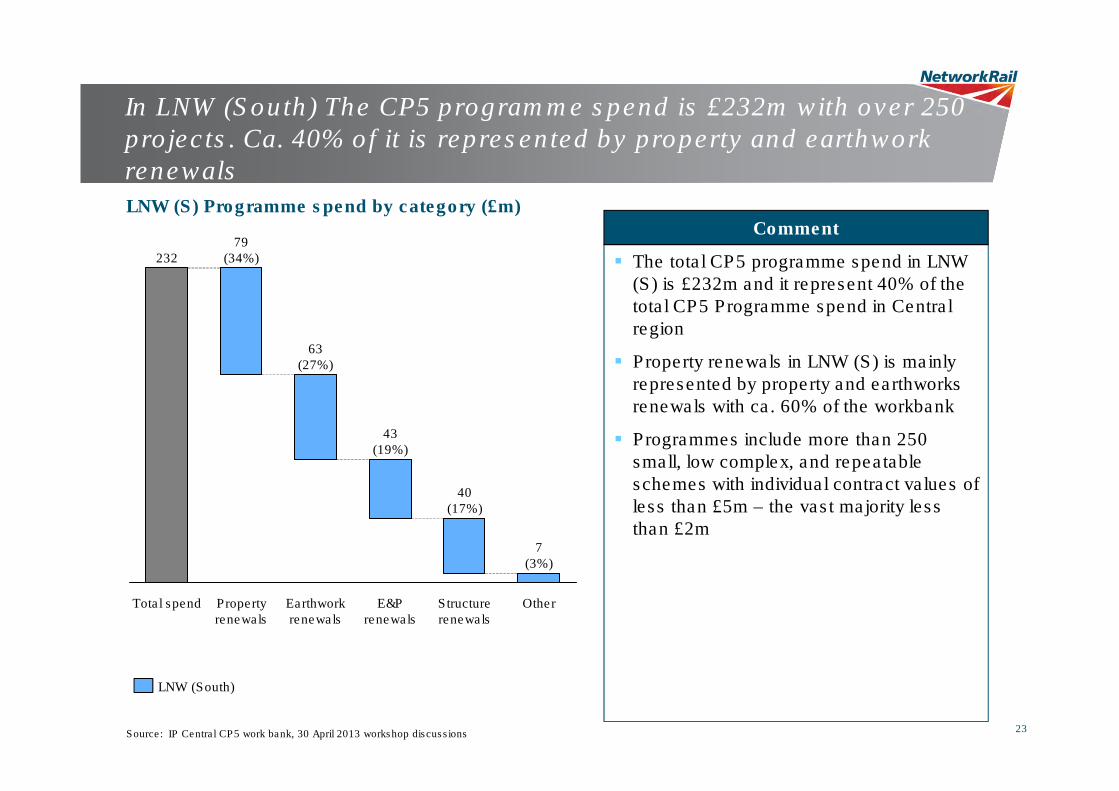
In LNW (South) The CP5 programme spend is £232m with over 250 projects. Ca. 40% of it is represented by property and earthwork renewals
23
LNW (S) Programme spend by category (£m)
Source: IP Central CP5 work bank, 30 April 2013 workshop discussions
� The total CP5 programme spend in LNW (S) is £232m and it represent 40% of the total CP5 Programme spend in Central region
� Property renewals in LNW (S) is mainly represented by property and earthworks renewals with ca. 60% of the workbank
� Programmes include more than 250 small, low complex, and repeatable schemes with individual contract values of less than £5m – the vast majority less than £2m
Comment
Earthwork
renewals
Property
renewals
Total spend
232
79
(34%)
63
(27%)
43
(19%)
40
(17%)
7
(3%)
OtherStructure
renewals
E&P
renewals
LNW (South)

In LNW (North) the CP5 programme spend is £350 M with over 400 projects and 60% of it is represented by structures and earthwork renewals
24
LNW (N) Programme spend by category (£m)
Source: IP Central CP5 work bank, 30 April 2013 workshop discussions
� The total programme spend in LNW (N) is £350m
� Programme renewals is mainly represented by structures and earthworks renewals with 60% of the workbank
� Programmes include more than 400 small, low complex, and repeatable schemes with individual contract values of less than £5m – the vast majority less than £2m
Comment118
(34%)350
E&P
renewals
Property
renewals
Earthwork
renewals
90
(26%)
Structure
renewals
72
(20%)
Total spend
70
(20%)
LNW (North)

Total Programme spend in CP5
Total spend per annum
LNW North
LNW South
In summary – The Programme lots comprise over 600 schemes with a total
value of £583 M
25
IP Central CP5 Programme spend (£m)
North
South
Property Renewals
20
50
60
26
130
Earthwork Renewals
56
34
63
31
153
Structure Renewals
25
80
67
37
185
E&P Renewals
72
43
23
115
Source: IP Central CP5 work bank, 30 April 2013 workshop discussions

We will be running a 3 stage evaluation process, with a behavioural assessment of the final 2 scorers in each lot
1st Stage
• PQQ responses assessed
• Down-selection according to evaluation according to defined criteria
• ITT documents issued to Qualified tenderers
2nd Stage
• Clarification of bids (all criteria)
• NR Evaluation of bid as per defined criteria
• A minimum of 2 tenderers taken through to Behavioural assessment
• Score out of 100, multiplied by factor of 0.7 to create a commercial & technical score out of 70
3rd stage
• Behavioural assessment workshops of top scorers
• Maximum score 30%
• Behavioural score added back to Technical & Commercial score to define highest evaluated total score
26
Down-selection
Award
PQQ
Down-selection
ITT

Evaluation criteria - Programmes
Criteria % weighting
Capability & Experience 35%
Health & Safety 20%
Collaboration 20%
Capacity 15%
Sustainability 10%
27
Programmes PQQ Criteria
Criteria % weighting
Commercial 45%
Technical and Delivery 25%
Health & Safety 10%
Collaboration 10%
Sustainability 10%
Programmes ITT Criteria

Evaluation criteria - Panels
Criteria % weighting
Company assurance / Financial stability Pass/Fail
Capability & Experience 35%
Health & Safety 20%
Collaboration 20%
Capacity 15%
Sustainability 10%
28
Panels PQQ Criteria
Criteria % weighting
Commercial 30%
Technical and Delivery 25%
Innovation 15%
Health & Safety 10%
Collaboration 10%
Sustainability 10%
Panels ITT Criteria

Lotting rules
29
Programmes Panels
Tenderers can bid for all Lots in all Areas Tenderers can bid for all Lots in all Areas
A Tenderer can win all disciplines in a single
geographic area
A Tenderer can win all disciplines in a single
geographic area
Network Rail will not appoint any single bidder
for any discipline across all three areas
Network Rail will not appoint any single bidder
for any discipline across all three areas
The maximum number of Lots a Tenderer can
win for any single work type is 2 Lots (except
E&P which will be 1 Lot)
The maximum number of Lots a Tenderer can
win for any single work type is 2 Lots
In any event a Tenderer cannot be awarded any
more than 4 individual Lots irrespective of what
discipline or area he has Tendered for
In any event a Tenderer cannot be awarded any
more than 3 individual Lots irrespective of what
discipline or area he has Tendered for

30
This image cannot currently be displayed.
30
Deadlines -Programmes
Deadlines -Panels
Activity
22 July 22 July PQQ issued
30 August 30August PQQ return date
30 Sept 7 Oct ITT documents issued to shortlisted bidder via e-Sourcing
23 Dec 31 Jan 2014 Tender submission deadline
Jan – Feb 2014 Network Rail tender evaluation
Feb – March 2014 Clarification of proposals
March Short listing - take top 2 per lot into Behavioural assessment
March – April 2014 Behavioural workshops (30% total potential score)
April 2014 Network Rail approvals
April 2014 Standstill letters issued
April/May 2014 Final contract drafting
May 2014 Contract signed by all parties (contract commencement)
May 2014 onwards Implementation
ITT process and key deadlines – Programmes & Panels
Timelines

Value Lever What this means to us
Commitment Provide increased commitment to the
supply-chain to encourage innovation and
investment
Continuity Optimise the efficient utilisation of
resources, working closely with Routes to
ensure continuity of work; stability drives
productivity, improved safety and
sustainability.
Collaboration Work more closely with a high capability
supply chain – extending visibility and
control of critical resources in the extended
supply chain
Capability & Capacity
Build a robust supply chain with
demonstrable capability and capacity to fulfil
all NR requirements
Commercial Develop a greater understanding of the
cost-base and ensure commercial model
incentivises all to meet Network Rail’s goals
Continuousimprovement
Foster Innovation and best practice –
getting better and better in all key
performance areas
Summary – we have consulted widely and incorporated your feedback into our CP5 strategy
Six key value levers
31
Capability & Capacity
Commercial
Commitment
Continuity
Collaboration
Continuous improvement

32
The successful bidders will be able to demonstrate they have the capability and commitment to deliver our vision
• Relentless focus on Health and Safety
• We will work with fewer, closer for longer to create a highly capable supply chain
• We will create sustainable supply chains – reflective and supportive of their local
communities
• We need to achieve “step-change” performance to meet our CP5 goals, and we
believe Innovation and investment will be crucial to deliver these
• We want to work with people who understand collaboration and who are committed to
work with us to achieve our goals
• We will run a fair, equal and transparent process to select our delivery partners
Please note the final ITT documents have precedence in all matters, and your bid should be solely based on the information contained in the issued ITT documents