appendix j 4/27/04 senate committee on intra-university
TRANSCRIPT

SENATE COMMITTEE ON INTRA-UNIVERSITY RELATIONS
Trends and Patterns in the Use of Full and Part-time Fixed-Term Faculty
(Infonnational)
INTRODUCTION
Appendix J 4/27/04
The Intra-University Relations Committee was charged with examining and reporting on the trends and patterns in the use of full-time fixed-tenn and part-time faculty. This informational report is a follow-up to a report presented by the Intra-University Relations Committee to the Faculty Senate in March of 2000 that examined the use of part-time and non-tenure-line faculty in the Penn State system from 1990 to 1998. Our committee believes that, similar to the statement in the March 2000 report, the use of non-tenure-line and part-time faculty has many implications for academic life at Penn State and that trends in their use merit the attention ofthe Senate as a whole.
Full-time fixed-tenn, part-time and adjunct faculty are a valuable part of the academy. They are often hired to bring their practical experiences to the classroom or as visiting scholars sharing their knowledge with others. In the creation of new programs at some Penn State locations, importing such experience has become important. Since the early 1990s, a growing body of academic literature has explored the effects of the increasing use of fixed-term and part-time faculty in U.S. colleges and universities on the professorial faculty (tenure-track/tenured faculty) and students. Concerns raised by the research range from academic freedomi to wages and benefitsii and student retention. iii One of the primary purposes of tenure is the generation and preservation of the integrity of knowledge based on the guarantee of intellectual freedom. To the extent that utilization of fixed-term and part-time faculty displaces tenure-track/tenured faculty positions, this vital institutional norm is jeopardized. i
Other concerns about the use of fixed-term faculty stem from the current trends within the private sector aimed at reducing labor costs by introducing greater employer flexibility in hiring and firing, imposing heavier work loads, and providing fewer benefits. Remaining standing faculty may end up with heavier workloads, for example, as the professorial faculty takes on a greater burden of advising and governance of the university in order to maintain continuity that part-time and fixed-term usually cannot provide. Job security, lack of benefits and lower pay are concerns for many part-time faculty. Since most part-time and adjunct academic appointments are transitory in nature, there is less motivation to master the knowledge of university policies and resources for proper student advising and counselingiv.
iTolbert, Pamela, S. "Two-Tiered Faculty Systems and Organizational Outcomes." New Directions/or Higher Education, 104 (1998):79. iiJacobs, Frederic. "Using Part-time Faculty More Effectively." New Directions/or Higher Education, 104 (1998): 9-15. iiiHaeger, John D. "Part-Time Faculty, Quality Programs, and Economic Realities." New Directions/or Higher Education, 104 (1998): 85ff iVSchuetz, Pam. "Instructional Practices of Part· time and Full-Time Faculty", New Directions/or Community College, 118 (Summer
2002): 39-45,

INFORMATION
I I
Appendix J 4/27/04
Th~s report is data driven and information on standing and fixed-term faculty is organjzed in the following way. First, therel,is a definition of types of faculty employment at Penn State. Next, data on the use of standing and fixed-term faculty are presented in the larger context. Data are aggregated at the nationalleve1 and then for the members of the Coknittee for Institutional Cooperation (CIC). Finally, the report turns to Penn State and plabes the data on the use of standing and fixed-term faculty in the context of the overall grokh at the University and then breaks down data by college and campus location.
Definitions
As pefined in the Penn State Policy Manual, full-time faculty employment is broadly div~ded into standing and fixed-term. Standing faculty are tenured or tenure-track faculty wh<1> have a contract that does not: specify an ending date. (In the past, there were also noJ-tenure track instructors who were hired with standing appointments. This category is not !mentioned by Human Resources because it no longer exists for new hires.) Fixedterrlt faculty have a contract with:a specified ending date. Full-time fixed-term (FTMY) con~ists of a multi-year contract with a contract length between one to five years and is renJwable. Fixed-term I (FTl) contracts run longer than six months but not more than onelyear. Part-time contracts are the fixed-term II (FT2) contracts that run 6 months or less!. Full-time faculty (standing, FTMY and FTl) are entitled to benefits whereas parttim~ faculty (FT2) are not entitled to benefits. According to the National Center for Edtication Statistics, few institutirims have policies to provide tenure to part-time faculty.
I I
(See Diagram 1 and Table 1.)
Diagram 1: Types of faculty : employment at The Pennsylvania State University
Full-Time Faculty ---- ~ Standing fixed-Term (Tenured or tenure-track)
Part-Time I
Fixed-Term II (Less than 6 months)
I I Contract has no specified Corttract has specified ending date
ending date /1 "-Fixed-Terin Multi-year Fixed-Term I
(1-5 year~, renewable) (6 months- 1 year)
Source: http://guru.psu.eduJpolicies/0HRlhr06.html. Penn State Policy Manual, HR06: Types of I Appointments Penn State Human'Resources
,
-2-
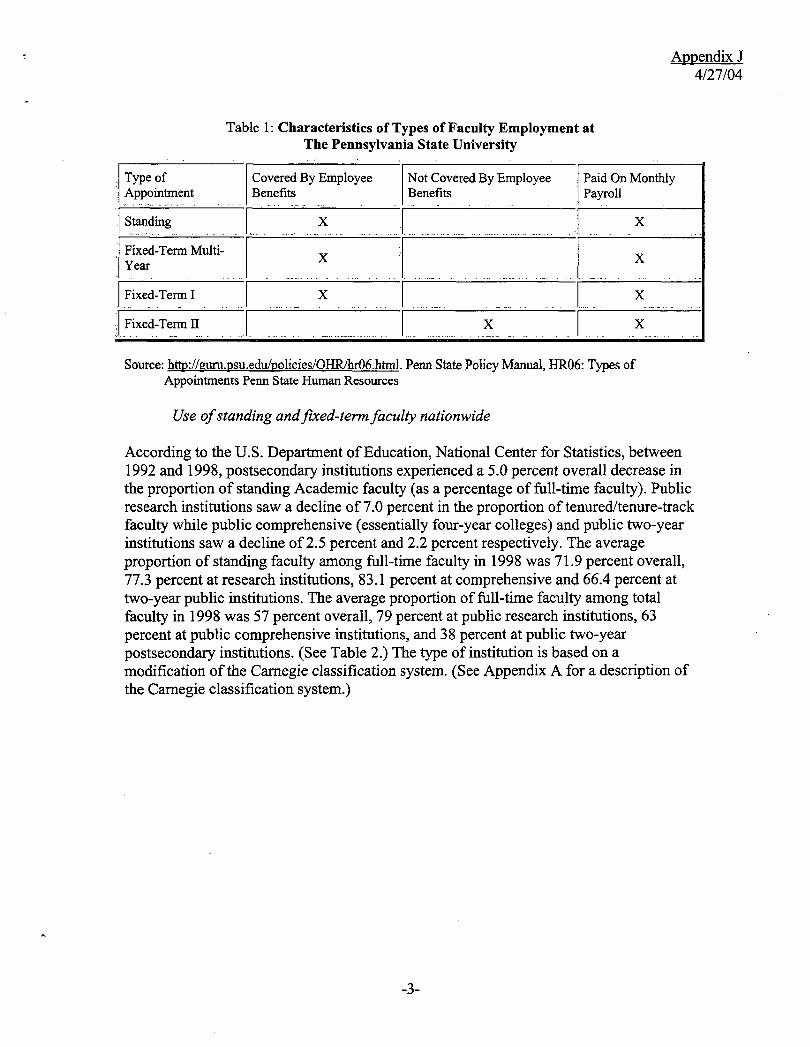
Table 1: Characteristics of Types of Faculty Employment at The Pennsylvania State University
Appendix] 4127/04
. Type of : Appointment
Covered By Employee Benefits
Not Covered By Employee Benefits
Paid On Monthly Payroll
x "r-I S"",-,~,-,-,din---,g,,-,-.. -'----'--0--'---'- FI .. --'--'--".~"__,_X"__,_,___~_,,,,,_I.. . ... ,. ... 0 ... ....d
··F~.:..::ie.::...X;-,d_-T,-e_rm_M--,-U_lti_' -.;",;.-..::.. rl--,----,=:..;,.,;",;",;;..X-"--,---,-,,,,--,,----,.:...:Ir-'-"-.::.:....:...--'--....:........;-"'-...:.;;:.;:;'--"-'---'='-"-.::.:.... r--..=:..,---,-_X""---,-,-,,,:,,,,,,,,;,,,
Id~iXe~~Te~ I I X I X
JFixed~ T~~II. . . .. r-I--'~=---'----'-'-'-'---"-'-'--r-I d-'-" ;":;.;.,,.;;.:....:...----'--'-.. ,-",X::....,.=-.. =,--'. -"--'---'-;.:........;, X
Source: http://guru.psu.edulpolicies/0HR!hr06.html. Penn State Policy Manual, HR06: Types of Appointments Penn State Human Resources
Use of standing and flXed-term faculty nationwide
According to the U.S. Department of Education, National Center for Statistics, between 1992 and 1998, postsecondary institutions experienced a 5.0 percent overall decrease in the proportion of standing Academic faculty (as a percentage of full-time faculty). Public research institutions saw a decline of 7.0 percent in the proportion of tenured/tenure-track faculty while public comprehensive (essentially four-year colleges) and public two-year institutions saw a decline of 2.5 percent and 2.2 percent respectively. The average proportion of standing faculty among full-time faculty in 1998 was 71.9 percent overall, 77.3 percent at research institutions, 83.1 percent at comprehensive and 66.4 percent at two-year public institutions. The average proportion of full-time faculty among total faculty in 1998 was 57 percent overall, 79 percent at public research institutions, 63 percent at public comprehensive institutions, and 38 percent at public two-year postsecondary institutions. (See Table 2.) The type of institution is based on a modification of the Carnegie classification system. (See Appendix A for a description of the Carnegie classification system.)
-3-

Appendix J 4127/04
Table 2: Percentage distribution of full-time Academic faculty by tenure status and \ by type and con~rol of institution: Fall 1992 and 1998
I I Ty~e and control of Tenured! institution I Tenure-track
1992
Tenured! Tenure-track
1998
Percentage Change
1992-1998
% Full-Time 1998
All institutions l 75.7% 71.9% -5.0 57% Publ!ic research 83.1 77.3 -7.0 79 Priv~te not-for-profit research 72.7 71.3 -1.9 73 Publ!ic doctoraf 80.3 74.5 -7.2 69 Priv~te not-for-profit doctoraf 72.7 67.2 -7.6 53
I Public comprehensive 85.2 83.1 -2.5 63 Priv~te not-for-profit 79.0 67.6 -14.4 51
I h . compre enSlve Private not-for-profit liberal arts 71.4
I 62.6 -12.3 59
Public 2-year 67.9 66.4 -2.2 38 Oth~~ 42.7 57.3 34.2 51
I IAll public and private not-for-profit Tit1~ N degree-granting institutions in the 50 states and the District of <:olornbia. I
2InclVdes institutions classified by the <:a:rnegie Foundation as specialized medical schools and medical centers. 3Public liberal arts, private not-for-profit Q year, and religious and other specialized institutions, except medital schools and medical centers. I
Note! Faculty includes all instructional faculty and staff. Sour~e: U.S. Department of Education, National <:enter for Statistics (2002) Tenure Status of Posts~condary Instructional Faculty and:StafJ: 1992-1998 (N<:ES 2002-210) by Basmat Parsad and Denise G1ov~r. Project Officer: Linda J. Zimbler~ Washington, D<::2002., and U.S. Department of Education, National <:enter for Statistics (2002). A Profile of Part-time Faculty: Fall 1998.1 N<:ES 2002-08, by Andrea Berger;; Rita Kirshstein, Yu Zhang, and Kevin <:arter, American Institutes for Research, Linda J. Zimbler, Project O,fficer. Washington, D<::2002.
-4-
Appendix J 4/27/04
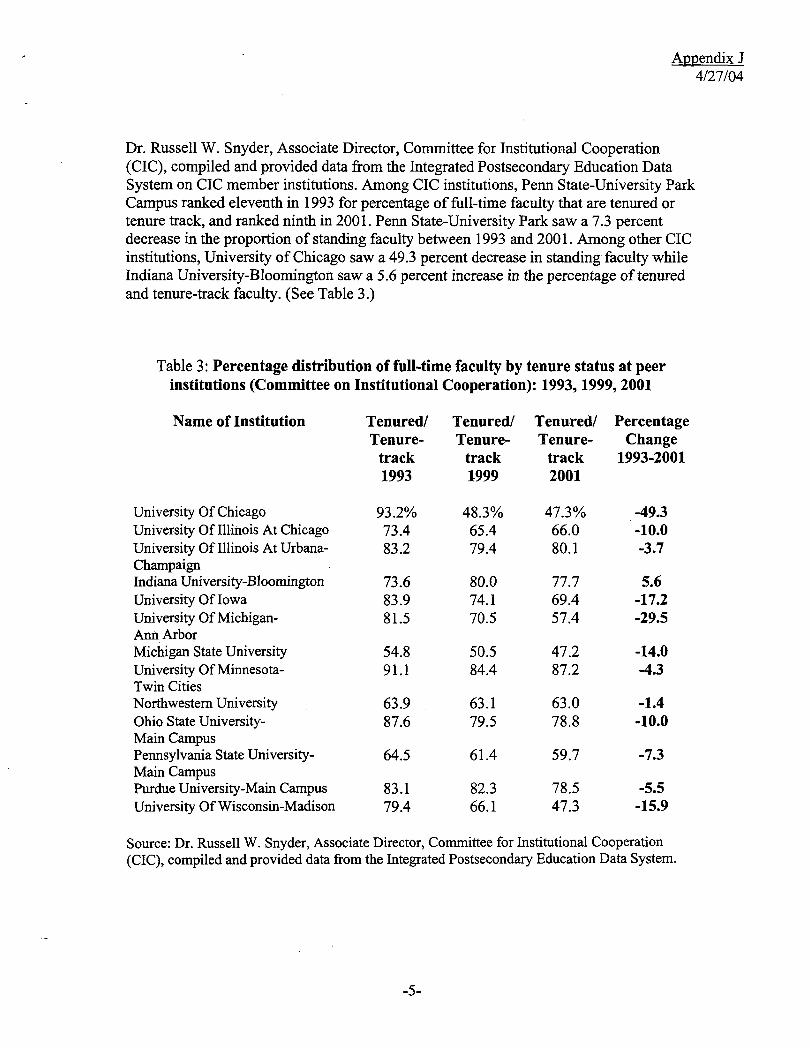
Dr. Russell W. Snyder, Associate Director, Committee for Institutional Cooperation (CIC), compiled and provided data from the Integrated Postsecondary Education Data System on CIC member institutions. Among CIC institutions, Penn State-University Park Campus ranked eleventh in 1993 for percentage of full-time faculty that are tenured or tenure track, and ranked ninth in 2001. Penn State-University Park saw a 7.3 percent decrease in the proportion of standing faculty between 1993 and 2001. Among other CI C institutions, University of Chicago saw a 49.3 percent decrease in standing faculty while Indiana University-Bloomington saw a 5.6 percent increase in the percentage of tenured and tenure-track faculty. (See Table 3.)
Table 3: Percentage distribution of full-time faculty by tenure status at peer institutions (Committee on Institutional Cooperation): 1993, 1999, 2001
Name of Institution Tenured! Tenured! Tenured! Percentage Tenure- Tenure- Tenure- Change
track track track 1993-2001 1993 1999 2001
University Of Chicago 93.2% 48.3% 47.3% -49.3 University Of Illinois At Chicago 73.4 65.4 66.0 -10.0 University Of Illinois At Urbana- 83.2 79.4 80.1 -3.7 Champaign Indiana University-Bloomington 73.6 80.0 77.7 5.6 University OfIowa 83.9 74.1 69.4 -17.2 University Of Michigan- 81.5 70.5 57.4 -29.5 Ann Arbor Michigan State University 54.8 50.5 47.2 -14.0 University Of Minnesota- 91.1 84.4 87.2 -4.3 Twin Cities Northwestern University 63.9 63.1 63.0 -1.4 Ohio State University- 87.6 79.5 78.8 -10.0 Main Campus Pennsylvania State University- 64.5 61.4 59.7 -7.3 Main Campus Purdue University-Main Campus 83.1 82.3 78.5 -5.5 University Of Wisconsin-Madison 79.4 66.1 47.3 -15.9
Source: Dr. Russell W. Snyder, Associate Director, Committee for Institutional Cooperation (ClC), compiled and provided data from the Integrated Postsecondary Education Data System.
-5-

Appendix J 4/27/04
Penn State-University Park ranked fifth among CIC institutions for the percentage of fulltime: faculty in both 1993 and 200~. Penn State-University Park saw a 1 percent decline in its percentage of full-time facul:ty compared to a 22.1 percent decrease at University of Chidago and a 33.7 percent increa~e at University of Illinois at Chicago. (See Table 4.)
,
Tal:)le 4: Percentage distribution of full-time faculty at peer institutions (Committee on Institutio~al Cooperation): 1993, 1999, 2001
Name of Institution
Uni:versity Of Chicago , Uni~ersity Of Illinois At Chicago Unirersity Of Illinois At UrbanaChampaign
I
Indiana University-Bloomington Un+ersity Of Iowa Unirersity Of MichiganAnriArbor
I
Michigan State University Unifersity Of MinnesotaTwin Cities Nodhwestem University Ohib State UniversityMaihCampus Penhsylvania State UniversityMaihCampus
I
I
-i
Full-Time 1993
98.8% 49.1 79.4
85.6 91.8 81.4
90.3 91.1
86.6 78.9
88.6
Full-Time Full-Time 1999 2001
77.6% 49.1 76.4
45.1 87.0 80.7
88.0 88.7
71.4 80.6
87.5
77.0% 65.6 75.5
89.0 86.9 78.6
88.2 88.0
68.7 91.9
87.7
Percentage Change
1993-2001 -22.1 33.7 -4.9
3.9 -5.4 -3.4
-2.3 -3.4
-20.6 16.4
-1.0
Purdue University-Main Campus 87.1 85.9 84.4 -3.1 Unitersity Of Wisconsin-Madison I 81.6 75.5 76.4 -6.4
s~e: Dr. Snyder, Associate Direct6r, Comnrittee for Institutional Cooperation (CIC), comp~led and provided data from the ~tegrated Postsecondary Education Data System. Authors' calculations. :
-6-
Use of standing and fzxed-term faculty at Penn State
Appendix J 4127/04
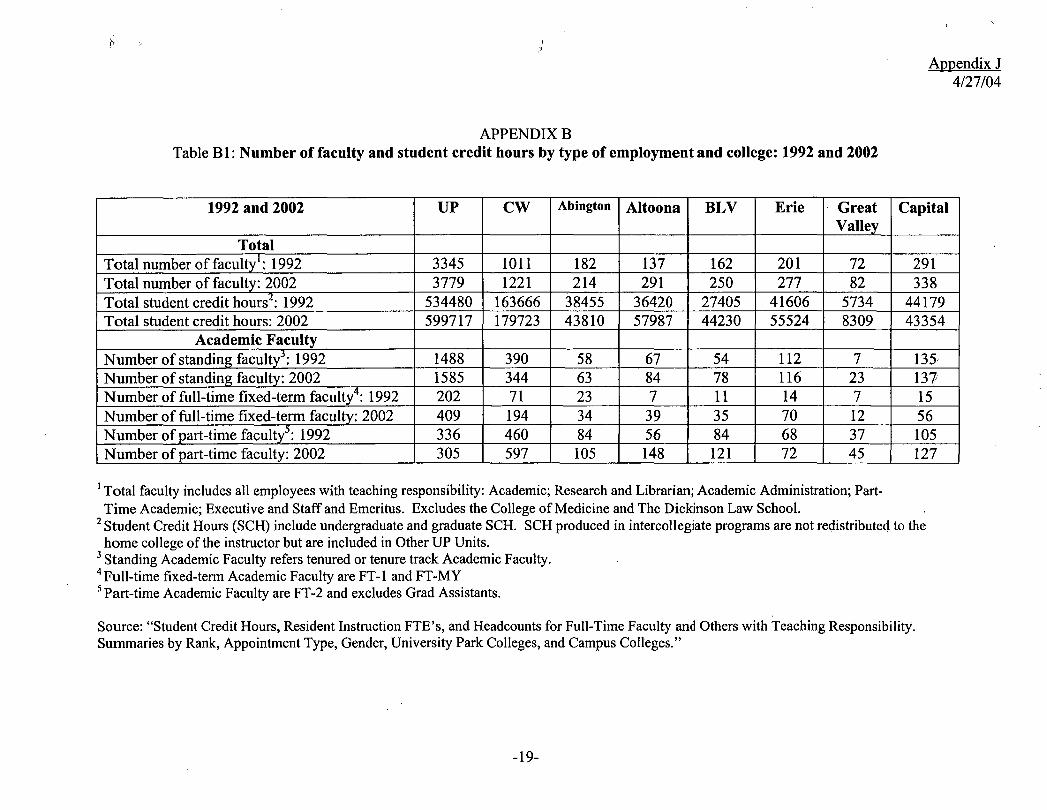
Data provided by Michael Dooris of the Office of Planning and Institutional Assessment at Penn State University enabled the reporting changes in faculty numbers by category and by student credit hours. Available data include Fall 1992, and Fall 1998 through Fall 2002. To set the changes in faculty employment in a context, Table 5 and Table 5a report the percentage change in the number of total facultyl and student credit hours2
, the percentage change in the number of tenured and tenure-track Academic faculty, and the percentage change in the number of full-time fixed-term Academic faculty3 and parttime4 Academic faculty across the Penn State system. Overall, there was an almost 20 percent growth in total faculty from 1992 to 2002 and a 15.8 percent increase in student credit hours. There was a 7.3 percent growth in standing Academic faculty, a 142.6 percent increase in full-time fixed-term Academic faculty, and a 23.6 percent increase in part-time Academic faculty from 1992 to 2002. The category "All" is not weighted by campus so it is strongly influenced by the large numbers of faculty at University Park.
Across colleges and campuses, there is' a wide range of growth rates of tenured and tenure-track Academic faculty from an increase of almost 229 percent over the 1992-2002 period for Great Valley and -11.8 percent for the Commonwealth campuses. University Park increased the number of standing Academic faculty by 6.5 percent. Education saw a 19 percent increase in standing faculty and Business saw a decrease of 13.3 percent. University Park increased the number of full-time fixed-term Academic faculty by a little over 102 percent, while at Altoona the number increased by a little over 457 percent and in Abington by almost 48 percent. Among the University Park colleges, Arts and Architecture increased the number of full-time fixed-term Academic faculty by almost 343 percent and Education decreased by almost 4 percent. Part-time Academic faculty decreased by 9.2 percent at University Park, increased by over 164 percent at Altoona and 1.6 percent at Great Valley. At University Park, Communications increased the number of part-time Academic faculty by 650 percent while Agriculture decreased part-time Academic faculty by 100 percent. Also calculated in Table 6 are the changes in the number of graduate assistants at each of the colleges. Communications increase the number of graduate assistants by 300 percent while Health and Human Development decreased their number by 51.2 percent. (See Appendix B for the actual numbers reported in the above section.)
1 Total faculty includes all employees with teaching responsibility: Academic; Research and Librarian; Academic Administration; Part- Time Academic; Executive and Staff and Emeritus. Excludes the College of Medicine and The Dickinson Law School.
2 Student Credit Hours (SCH) include undergraduate and graduate SCH. SCH produced in intercollegiate programs are not redistributed to the home college of the instructor but are included in Other UP Units.
3 Full-time fixed-term Academic Faculty are FT -1 and FT-MY 4 Part-time Academic Faculty are FT -2 and excludes Grad Assistants.
-7-

Appendix] 4/27/04
---,,--------------------:---l-'able-5:-T-he-Pennsylvania-State-tJniversity Percentage change in total numbers of f~culty and student credit hours by type of employment and college from 1992 to 2002
1 1992-2002 lfA"J~1 CW ,I Abington :1 Altoona 1 Berks 1 Erie
·1 Great 1 Capital Valley
Change in number of 1119,5% II. I3.0% I 20.8% 11 I 1 I I I t~talfacultyl . 17.6% 112.4% 54.3% 37.8% 13.9% 16.2%
;
,
Change in total ,I 11 1 1 1 student credit hours2 13.9% 59.2% 61.4% 33.5% 44.9% -1.9% i
. . ' . - .. - "-'."' ... il.;J~~1 ! 15.~%! 12~2%' 9~8~ .: .
i ; .
,
Cha}}ge jn _nu~ber of_ :17:3%11 6.50/'-1 ~1I.8o/~-I. 8~6%J25A% -t 44.4%1-3.6% 1228.60/, J 1.5%: standing Academic
facultl. ..... . Change in number of full-time fixed-term4
i\c(ldelll:i~ fa~ulty ,,", - iI142,6o/~:1102.5%L73.2% '/47.8% ,I 457.I% 'I 2I82% 1400.0%1 7I.4% ·1 273.3% :
Change in number of
. 11 23.6% ]1-92%129.8% 11 25.0%.1 I 64.3% '144.0% FF'I 2I.0%: part-timeS Academic fa~ulty. ..
.. ' .. I Total faculty includes all employees with teachmg responsIbIhty: AcademIC; Research and Librarian; AcademIc AdmIlllstratlOn; PartTime Academic; Executive and Staff and Emeritus. Excludes the College of Medicine and The Dickinson Law School.
2 Student Credit Houts (SCH) include undergraduate and graduate SCH. SCH produced in intercollegiate programs are not redistributed to the home college ofthe instructor but are included in Other UP Units.
3 Standing Academic Faculty refers tenured or tenure track Academic Faculty. 4 Full-time fixed-term Academic Faculty are FT -1 and FT -MY 5 Part-time Academic Faculty are FT -2 and excludes Grad Assistants.
Source: "Student Credit Hours, Resident Instruction FTE's, and Headcounts for Full-Time Faculty and Others with Teaching Responsibility. Summaries by Rank, Appointment Type, Gender, University Park Colleges, and Campus Colleges."

Table 5a: The Pennsylvania State University
Appendix J 4127/04
Percentage change in total numbers of faculty and student credit hours by type of employment and college from 1992 to 2002
IOther includes appointments in Intercollege Research Programs (including ARL), Continuing Education, Intercollegiate Athletics, etc.
-9-
Appendix J 4/27/04
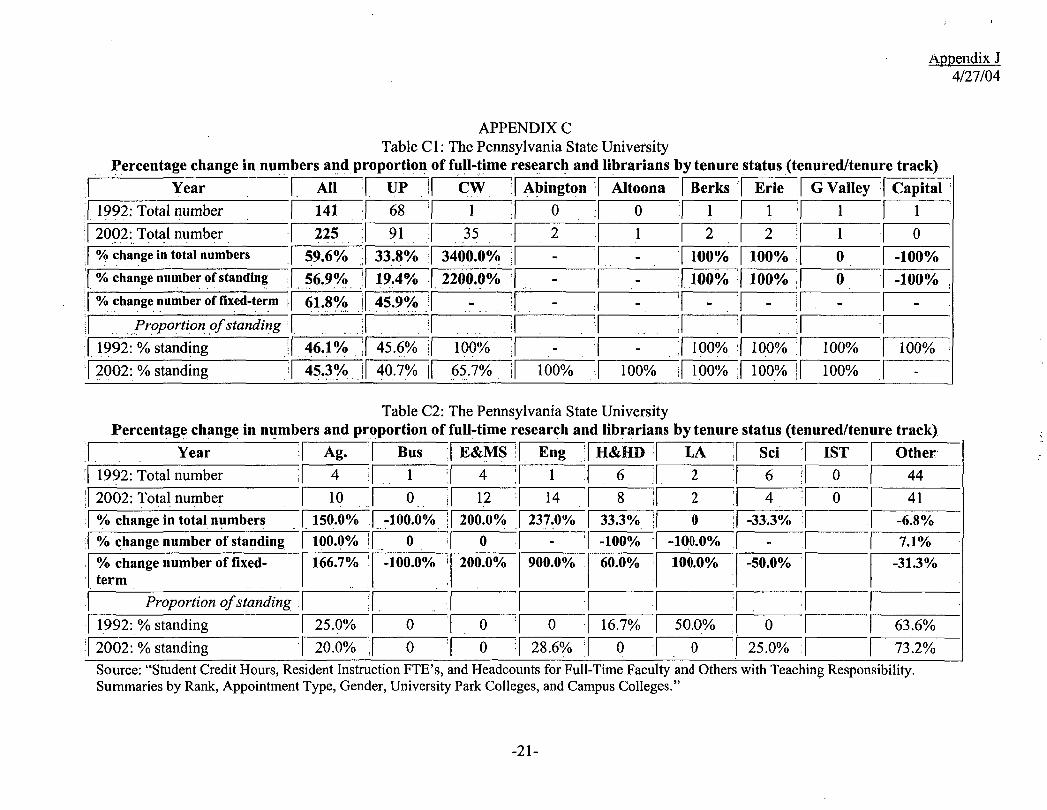
The statistics that follow are based on the Academic faculty, Professor through InstructorlLecturer. (Information on full-time faculty classified as Research and Librarian is rdported in Appendix C.) The data in Tables 6 and 6a look at the distribution of stan~iing faculty as a proportion of full-time Academic faculty and the percentage change in tJtat proportion from 1992 to 2002. The tables include the proportions for the year 1992, and the years 1998 to 2002 ~n order to track the changes over the more recent time peribd. Overall, in 1992, 86.8 pereent of full-time faculty was tenured or tenure-track I ,. compared to 75.6 percent in 2002; a decrease of almost 13 percent. Again, across colleges and 'across campuses there were ~ide variations. At University Park, there was a decline of 917 percent in the proportion of standing faculty while at Erie there was a decrease of 29.~ percent and Great Valley saw an increase in the proportion oftenuredltenure-track facullty of a little over 31 percent. :At University Park, the proportion of standing faculty
I
in Liberal Arts decreased by 18.8 'percent and increased by 5.2 percent in Education.
I ' Tables 7 and 7a report the percentage distribution of full-time faculty as a proportion of all Academic faculty (excluding graduate assistants). Overall, there was little change froni 1992 when 68.4 percent of faculty was full-time compared to 2002 where 68.3 percbnt were full-time. At University Park, the percentage of full-time faculty increased by 41 percent, Great Valley saw an~ increase of 59.4 percent and Altoona's proportion of full-time faculty decreased by a little over 20 percent. In 2002, 86.7 percent of faculty at Uni~ersity Park was full-time compared to 72.1 percent at Erie and 43.8 percent at Great Vallby. At University Park, COIIm).unications experienced a 17.9 percent decline in the prop:ortion of full-time faculty wh~le Arts and Architecture increased their proportion of full-time faculty by 9 percent. 100 percent of Agriculture's faculty was full-time in 2002 comhared to 78.6 percent ofComthunication's faculty.
-10-
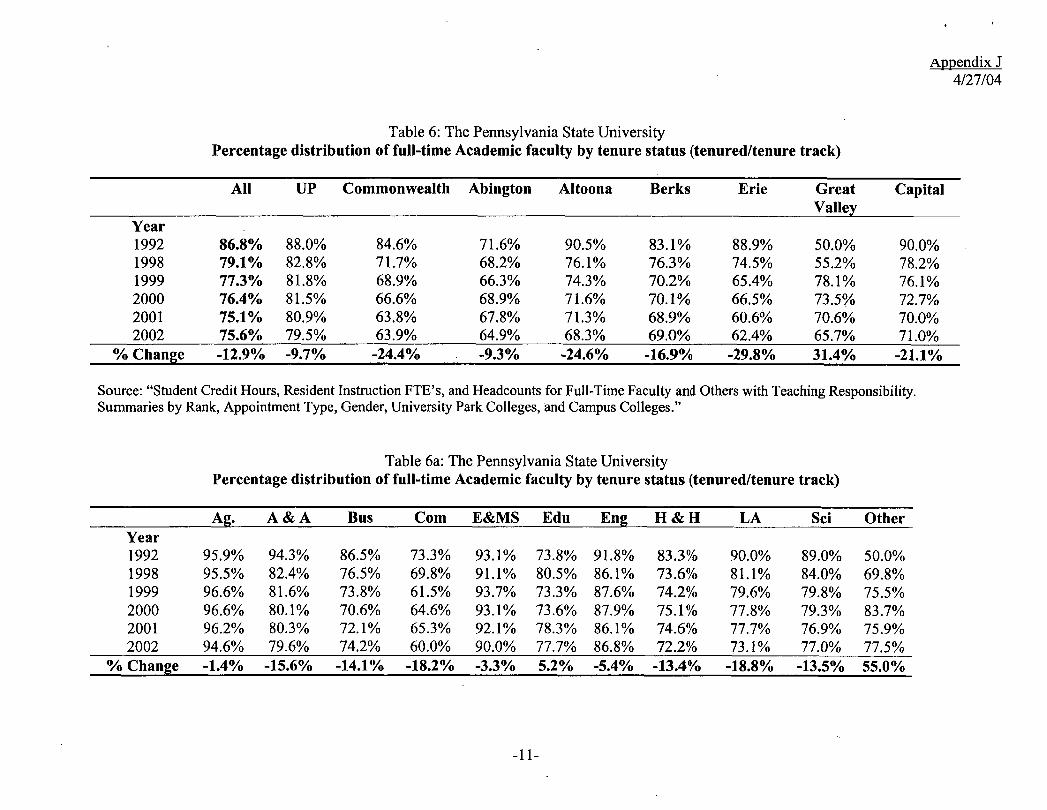
Table 6: The Pennsylvania State University Percentage distribution of full-time Academic faculty by tenure status (tenured/tenure track)
All UP Commonwealth Abington Altoona Berks Erie Great Valle!
Year 1992 86.8% 88.0% 84.6% 71.6% 90.5% 83.l% 88.9% 50.0% 1998 79.1% 82.8% 71.7% 68.2% 76.1% 76.3% 74.5% 55.2% 1999 77.3% 81.8% 68.9% 66.3% 74.3% 70.2% 65.4% 78.1% 2000 76.4% 81.5% 66.6% 68.9% 71.6% 70.1% 66.5% 73.5% 2001 75.1% 80.9% 63.8% 67.8% 71.3% 68.9% 60.6% 70.6% 2002 75.6% 79.5% 63.9% 64.9% 68.3% 69.0% 62.4% 65.7%
% Change -12.9% -9.7% -24.4% -9.3% -24.6% -16.9% -29.8% 31.4%
Appendix J 4127/04
Capital
90.0% 78.2% 76.1% 72.7% 70.0% 71.0%
-21.1%
Source: "Student Credit Hours, Resident Instruction FTE's, and Headcounts for Full-Time Faculty and Others with Teaching Responsibility. Summaries by Rank, Appointment Type, Gender, University Park Colleges, and Campus Colleges."
Table 6a: The Pennsylvania State University Percentage distribution of full-time Academic faculty by tenure status (tenured/tenure track)
Ag. A&A Bus Com E&MS Edu Eng H&H LA Sci Other Year 1992 95.9% 94.3% 86.5% 73.3% 93.1% 73.8% 91.8% 83.3% 90.0% 89.0% 50.0% 1998 95.5% 82.4% 76.5% 69.8% 91.1% 80.5% 86.1% 73.6% 81.1% 84.0% 69.8% 1999 96.6% 81.6% 73.8% 61.5% 93.7% 73.3% 87.6% 74.2% 79.6% 79.8% 75.5% 2000 96.6% 80.1% 70.6% 64.6% 93.1% 73.6% 87.9% 75.1% 77.8% 79.3% 83.7% 2001 96.2% 80.3% 72.1% 65.3% 92.1% 78.3% 86.1% 74.6% 77.7% 76.9% 75.9% 2002 94.6% 79.6% 74.2% 60.0% 90.0% 77.7% 86.8% 72.2% 73.1% 77.0% 77.5%
0/0 Change -1.4% -15.6% -14.1% -18.2% -3.3% 5.2% -5.4% -13.4% -18.8% -13.5% 55.0%
-11-

-- - -
All UP
Year 1992 68.4% 83.4% 1998 68.2% 86.5% 1999 68.5% 87.4% 2000 68.0% 86.2% 2001 68.3% 86.4%
--- - -2002- - --- 68.3 %- -86.7%--% Change -0.1% 4.0%
Table 7: The Pennsylvania State University Percentlrge-distril>ution ofIiill:time Acailemicfaculty
Commonwealth Abington Altoona Berks
50.1% 49.1% 56.9% 43.6% 493% 43.4% 47.4% 45.0% 49.2% 43.7% 45.2% 47.5% 48.6% 47.4% 47.2% 47.5% 48.1% 43.1% 47.5% 50.5%
- --47A%--- - - - 48;0%- ----- 45:4% -- --48.3% --5.3% -2.2% -20.3% 10.7%
Erie Great Valley
64.9% 27.5% 64.1% 35.8% 65.4% 39.0% 67.5% 40.0% 72.3% 38.6% 72:1% - -4J:8% 11.0% 59.4%
Appendix] 4/27/04
Capital
58.8% 59.2% 57.7% 58.7% 59.6%
- -60.3% 2.5%
Source: "Student Credit Hours, Resident Instruction FTE's, and Headcounts for Full-Time Faculty and Others with Teaching Responsibility. Summaries by Rank, Appointment Type, Gender, University Park Colleges, and Campus Colleges."
Table 7a: The Pennsylvania State University Percentage distribution of full-time Academic faculty
Ag. A&A Bus Com E&MS Edu Eng H&H LA Sci Other Year 1992 96.1% 86.6% 84.2% 95.7% 96.3% 82.9% 92.1% 82.7% 76.1% 89.0% 36.2% 1998 99.5% 91.0% 87.5% 84.1% 100.0% 88.3% 94.0% 86.8% 79.7% 88.7% 45.7% 1999 98.1% 91.9% 90.4% 85.2% 90.6% 86.6% 93.8% 83.5% 81.7% 95.0% 50.5% 2000 98.6% 88.0% 87.9% 77.4% 91.0% 81.8% 93.6% 83.8% 81.2% 95.9% 46.2% 2001 99.1% 90.7% 86.7% 75.4% 88.2% 83.3% 94.7% 85.9% 80.9% 94.7% 50.0% 2002 100.0% 94.4% 82.2% 78.6% 92.9% 84.0% 93.7% 84.5% 80.2% 94.8% 41.7%
010 Change 4.1% 9.0% -2.4% -17.9% -3.6% 1.3% 1.7% 2.2% 5.4% 6.6% 15.1% Does not take into account the use of graduate assistants.

Appendix J 4/27/04
The final four tables contain data on student credit hours. Tables 8 and 8a report the proportion of student credit hours taught by standing faculty calculated as a percentage of all full-time faculty. Overall, in 1992 83.6 percent of full-time student credit hours were taught by tenured and tenure-track faculty and that percentage dropped to 62.5 percent in 2002. At University Park, 84.2 percent of full-time student credit hours were taught by standing faculty in 1992 and 63.8 percent in 2002, a decrease of 24.2 percent. In 1992, 91.2 percent of Altoona's and 58.5 percent of Great Valley's student credit hours were taught by standing faculty. In 2002,65.6 percent of Great Valley's student credit hours 54.1 percent of Erie's student credit hours were taught by standing faculty. In 1992,96.7 percent of Arts and Architecture's student credit hours and 31.5 percent of Other were taught by standing faculty. In 2002,96.4 percent of Agriculture's student credit hours and 46.7 percent of Business student credit hours were taught by tenured and tenure-track faculty. Overall, there was a 25.2 percent decrease in the percentage of student credit hours taught by standing faculty with a decrease of 24.2 percent at University Park, a 35.5 percent decrease at Erie, a 44.9 percent decrease in the Business College and a 125.2 percent increase in Other.
Tables 9 and 9a report the proportion of student credit hours taught by full-time faculty calculated as a percentage of total full and part-time faculty (excludes student credit hours taught by graduate assistants). Overall, in 199278.3 percent of student credit hours were taught by full-time faculty and that percentage dropped slightly to 77.7 percent in 2002. At University Park, 84.9 percent of student credit hours were taught by full-time faculty in 1992 and 88.4 percent in 2002, an increase of 4.1 percent. In 1992, 77.9 percent of Erie's and 52.6 percent of Great Valley's student credit hours were taught by full-time faculty. In 2002,82.8 percent of Erie's student credit hours 52.8 percent of Altoona's student credit hours were taught by full-time faculty. Among University Park colleges, in 1992,98.9 percent of Agriculture's student credit hours and 44.3 percent of Other were taught by full-time faculty. In 2002, 100 percent of Agriculture's student credit hours and 28.8 percent of Other student credit hours were taught by full-time faculty. Overall, there was a 0.8 percent decrease in the percentage of student credit hours taught by full-time faculty with an increase of 4. 1 percent at University Park, a 28.4 percent decrease at Altoona, a 107 percent increase at Great Valley, a decrease of35 percent in Other and a 7.5 percent increase in Arts and Architecture.
-13-

1992 1998 1999 2000 2001 2002
--- -- - --
% Change
1992 1998 1999 2000 2001 2002 % Change
Table-8 :-The-P-ennsylvania-State-llniversity All Full-Time: Percentage of Student Credit Hours Taught by Standing Faculty: 1992-2002
All UP Commonwealth Abington Altoona Berks Erie Great Valley
83.6% 84.2% 81.5% 72.7% 91.2% 83.1% 83.9% 58.5% 73.0% 74.4% 70.3% 64.9% 76.3% 75.4% 69.9% 60.4% 69.9% 72.0% 67.9% 60.3% 70.9% 66.8% 60.5% 79.2% 66.5% 68.4% 63.6% 64.4% 69.5% 62.1% 58.4% 71.7% 64.4% 67.0% 61.2% 58.7% 65.2% 66.0% 52.1% 68.4% 62.5% 63.8% 60.9% .57.8% 66.5%_ _62.7.% 54.1%- - -65.6% --25.2% -24.2% -25.3% -20.4% -27.1% -24.6% -35.5% 12.0%
Table 8a: The Pennsylvania State University All Full-Time: Percentage of Student Credit Hours Taught by Standing Faculty: 1992-2002
University Park
Ag. A&A Bus Comm E&MS Edu Eng H&H LA Sci 95.1% 96.7% 84.6% 81.8% 93.0% 77.0% 88.4% 75.7% 80.3% 87.6% 97.0% 83.8%. 62.7% 74.2% 93.5% 73.6% 73.7% 72.4% 71.0% 72.4% 98.2% 86.6% 57.5% 64.8% 96.2% 64.8% 75.1% 71.7% 69.8% 65.6% 96.8% 77.8% 53.8% 66.3% 94.8% 67.9% 76.0% 69.8% 66.0% 56.5% 96.9% 76.4% 48.7% 68.8% 89.9% 73.3% 72.8% 70.5% 64.8% 56.1% 96.4% 71.1% 46.7% 55.2% 80.4% 71.7% 73.2% 69.4% 56.4% 59.7% 1.4% -26.4% -44.9% -32.6% -13.6% -6.9% -17.2% -8.4% -29.8% -31.8%
Appendix J 4127/04
Capital
89.6% 72.0% 69.4% 66.7% 62.8%
- --62.2-% -30.6%
Other 31.5% 66.3% 72.7% 79.1% 71.7% 70.9%
125.2%

-15-
Appendix J 4/27/04

DISCUSSION AND CONCLUSION
Appendix J 4/27/04
ThiJ informational report examin~d and reported on the trends and patterns in the use of full-~ime fixed-term and part-time faculty. The most striking change is the rapid growth in b9th absolute and relative terms of full-time fixed-term faculty and the slow growth, and fometimes loss, oftenurediteNure-track faculty. Summarizing the overall changes, there was an almost 20 percent growth in total faculty from 1992 to 2002. There was a 7.3 percent growth in standing faculty, a 142.6 percent increase in full-time fixed-term faculty, and a 23.6 percent increa~e in part-time faculty from 1992 to 2002 (see Table 5). Am~ng CIC institutions, Penn State's University Park campus ranked eleventh out of thirtben institutions in 1993 for the percentage of full-time faculty that were tenured or tenute- track and ranked ninth in 2001 (See Table 3.)
chaiges in the proportions of full-time faculty who were tenured or tenure-track varied draJ.atically across the Penn State system. In 1992, 86.8 percent of full-time faculty in the ~ystem were tenured and tenure-track, but in ten years this value dropped steadily to 75.61 percent in 2002. This is a decrease of almost 13 percent. Except for Great Valley, all locations showed a steady decreas¢ of tenured and tenure-track faculty relative to fixedterxn' Academic faculty during the ,ten year period (see Table 6). Furthermore, the decrfase in the system-wide proportion of standing faculty resulted in a 25 percent decrease in student credit hours taught by tenured and tenure-track faculty. In 1992,83.6 perc~nt of full time student credit ~ours were taught by tenuredltenure track faculty but by 2002, standing faculty only taught 62.5 percent of all student credit hours. Inspection of T~bles 8 and 8a shows the decreasing student credit hour trend in most locations and
I colleges.
I Acr~ss the system, the percentage. of full-time faculty as a proportion of all Academic facu~ty (excluding graduate assistants) essentially remained the same (68.3 percent in 1992 and 68.4 percent in 2002). The same can be said for the percentage of student credit hour~ taught by all full-time faculty (both tenured and fixed-term). So, while the perc~ntage of full-time faculty ha~ remained the same, the make-up of full-time faculty acro~s the system has significantl): changed and now contains more fixed-term faculty who not participating in the tenure process.
I Variability across campuses may be due in large part to the mergers, reorganization and , ,
the qevelopment of new four-year:majors. At many campuses the growth of students was mat~hed by increases in full time faculty, but they tended to be fixed-term and not standing faculty. There are concerns that new programs being built or expanded based on the clse of fixed-term full-time and part-time faculty and that it will be hard to maintain the ~uality of programs, contain curricular drift, and, in some cases, gain accreditation withlihe large number of fixed-tellll faculty. According to A Profile of Part-time Faculty: Fall 1998 published by the NCES, about 59 percent of part-time faculty indicated they wer~ in part-time positions due to the unavailability of full-time positions. Part-time faculty were less likely to have obtained a doctorate or equivalent degree and had fewer year~ of teaching experience than full-time faculty.
I
-16-

Appendix J 4/27/04
Among the responses to the increasing use of fixed-tenn faculty are those that take this trend as necessary, given existing political and economic climates. This is an administrative perspective that calls for "best-practices," meaning better orientation of part-time/adjunct faculty on university policies and practices, more involvement for them in university governance, and greater integration with the professorial faculty. Other responses include discussion of "desirable" ratios of standing and fixed-term faculty, how to avoid a 'two-tiered' faculty system, and how to make sure there is pay and benefit equity for fixed-term faculty.
Our committee recommends the continued and careful tracking of the number and the proportions of fixed-term faculty. Penn State needs to ask itself what the implications of a two-tiered faculty system are for the students, faculty, the larger academic community, and other stakeholders within the university. What's really driving the changes? What is the impact of different incentive structures on the quality of education and the quality of new knowledge generated? Is there an effect on academic rigor and standards? In the age of budget driven decisions, do the benefits of increased savings and flexibility in the use of fixed-term faculty outweigh the costs of decreased attachment, voice, and the generation and preservation of the integrity of knowledge production based on the guarantee of intellectual freedom?
SENATE COMMITTEE ON INTRA-UNIVERSITY RELATIONS Rosann Bazirjian Ronald V. Bettig Dawn G. Blasko, Vice Chair Timothy N. Gray E. Jay Holcomb Susan L. Hutchinson Eileen M. Kane William J. Mahar Kevin R. Maxwell Kidane Mengisteab
Craig M. Meyers Alfred Mueller Victor Nistor David R. Richards, Chair Winston A. Richards Ann M. Schmiedekamp Colleen R. Stimpson Robert C. Voigt Robert A. Walters Barbara A. Wiens-Tuers Stamatis M. Zervanos
FULL AND PART-TIME F ACUL TY SUBCOMMITTEE Ronald V. Bettig E. Jay Holcomb William J. Mahar Kevin R. Maxwell Ann M. Schmiedekamp Barbara A. Wiens-Tuers, Chair
-17-

APPENDIX A Institution~1 categories used in NCES report
Public research: Publicly controlled institutions among the leading universities in fedbral research funds. Each of tliese universities awards a substantial number of do~torates in many fields.
Appendix J 4/27/04
Pri~ate research: Privately con$llled not-for-profit institutions among the leading uniyersities in federal.research fup.ds. Each of these universities awards a substantial number of doctorates III many fields.
PU~liC doctoral: Publicly controlled institutions that offer a full range of baccalaureate prokrams and doctoral degrees inl at least three discipline, but tend to be less focused on res~arch and receive fewer research dollars that the research universities. In this report, thisl group also includes publicly controlled institutions classified by the Carnegie Foundation as specialized medical schools.
pri1ate doctoral: Privately controlled not-for-profit institutions that offer a full range of bacbalaureate programs and doctGral degrees in at least three disciplines, but tend to be less! focused on research and receive fewer research dollars that the research universities. In this report, this group also inclpdes privately controlled institutions classified by the Carhegie Foundation as specializ~d medical schools.
puJliC comprehensive: Publicly :controlled institutions that offer liberal arts and t ,
professional programs; a master's degree is the highest degree offered.
prJate comprehensive: Privatel~ controlled not-for-profit institutions that offer liberal arts and professional programs; a:master's degree is the highest degree offered.
Private liberal arts: Privately cOlltrolled not-for-profit institutions that are smaller than corrlprehensive colleges and universities; primarily offer bachelor's degrees, although sortie offer master's degrees.
puJliC 2-year: Publicly controll~d institutions that offer certificate or degree programs throhgh the Associate's degree le~el and offer no baccalaureate programs.
otJer: Public liberal arts, Private:2-year, and religious and other specialized institutions, exccipt medical. :
sourL u.s. Department of Education, ~ationai Center for Statistics, 1999 National Study of Post~econdary Faculty (NSOPF:99) inA frofile of Part-time Faculty: Fall 1998. Working Paper No. 2002-08. National Center for Education Statistics, US Department of Education, October 2002. .
For lore information, see A Classification of Institutions of Higher Education, The Carnegie Foundation for tlie Advancement of Teaching (princeton, New Jersey, 1994)
-18-
--",
, y
APPENDIXB Table B 1: Number of faculty and student credit hours by type of employment and college: 1992 and 2002
1992 and 2002 UP CW Abington Altoona BLV Erie Great Valley
Total Total number of faculty': 1992 3345 1011 182 137 162 201 72 Total number of faculty: 2002 3779 1221 214 291 250 277 82 Total student credit hours:.!: 1992 534480 163666 38455 36420 27405 41606 5734 Total student credit hours: 2002 599717 179723 43810 57987 44230 55524 8309
Academic Faculty Number of standing faculty~: 1992 1488 390 58 67 54 112 7 Number of standing faculty: 2002 1585 344 63 84 78 116 23 Number of full-time fixed-term faculty4: 1992 202 71 23 7 11 14 7 Number of full-time fixed-term faculty; 2002 409 194 34 39 35 70 12 Number of part-time faculty5: 1992 336 460 84 56 84 68 37 Number of part-time faculty: 2002 305 597 105 148 121 72 45
1 Total faculty includes all employees with teaching responsibility: Academic; Research and Librarian; Academic Administration; PartTime Academic; Executive and Staff and Emeritus. Excludes the College of Medicine and The Dickinson Law School.
Appendix J 4/27/04
Capital
291 338
44179 43354
135-137 15 56 105 127
2 Student Credit Hours (SCH) include undergraduate and graduate SCH. SCH produced in intercollegiate programs are not redistributed to the home college of the instructor but are included in Other UP Units.
3 Standing Academic Faculty refers tenured or tenure track Academic Faculty. 4 Full-time fixed-term Academic Faculty are FT-l and FT-MY 5 Part-time Academic Faculty are FT -2 and excludes Grad Assistants.
Source: "Student Credit Hours, Resident Instruction FTE's, and Headcounts for Full-Time Faculty and Others with Teaching Responsibility. Summaries by Rank, Appointment Type, Gender, University Park Colleges, and Campus Colleges."
-19-
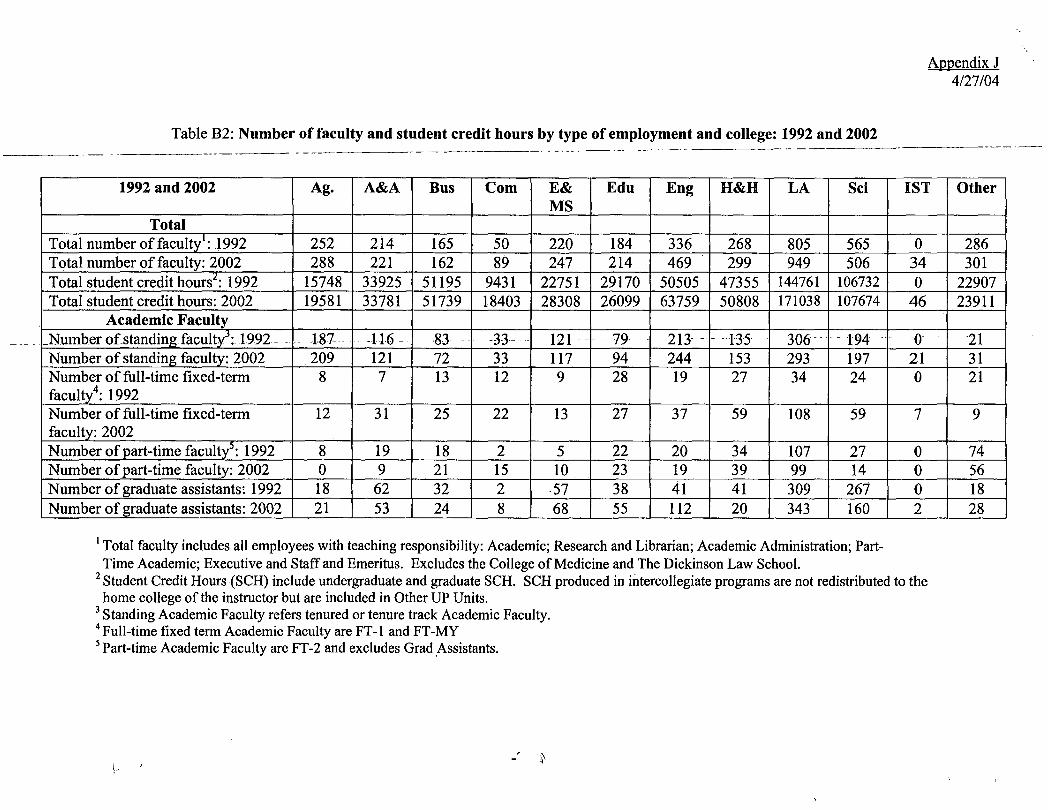
Table B2: Number of faculty and student credit hours by type of employment and college: 1992 and 2002
1992 and 2002 Ag. A&A Bus Com E& Edu Eng H&H LA Sci MS
Total Total number of facultyI: 1992 252 214 165 50 220 184 336 268 805 565 Total number of faculty: 2002 288 221 162 89 247 214 469 299 949 506 Total student credit hours2: 1992 15748 33925 51195 9431 22751 29170 50505 47355 144761 106732 Total student credit hours: 2002 19581 33781 51739 18403 28308 26099 63759 50808 171038 107674
Academic Faculty _Numberofstanding faculty]:. 1992 - - .- 187- -116 _ .. 83 - -33- 121 - '19- --- - 213- - - -135 -- 306-· - 194 .. -
Number of standing faculty: 2002 209 121 72 33 117 94 244 153 293 197 Number of full-time fixed-term 8 7 13 12 9 28 19 27 34 24 faculty4: 1992 Number of full-time fixed-term 12 31 25 22 13 27 37 59 108 59 faculty: 2002 Number of part-time faculty': 1992 8 19 18 2 5 22 20 34 107 27 Number of part-time faculty: 2002 0 9 21 15 10 23 19 39 99 14 Number of graduate assistants: 1992 18 62 32 2 ·57 38 41 41 309 267 Number of graduate assistants: 2002 21 53 24 8 68 55 112 20 343 160
1 Total faculty includes all employees with teaching responsibility: Academic; Research and Librarian; Academic Administration; PartTime Academic; Executive and Staff and Emeritus. Excludes the College of Medicine and The Dickinson Law School.
Appendix J 4/27/04
1ST Other
0 286 34 301 0 22907
46 23911
-0 21 21 31 0 21
7 9
0 74 0 56 0 18 2 28
2 Student Credit Hours (SCH) include undergraduate and graduate SCH. SCH produced in intercollegiate programs are not redistributed to the home college of the instructor but are included in Other UP Units.
3 Standing Academic Faculty refers tenured or tenure track Academic Faculty. 4 Full-time fixed term Academic Faculty are FT -1 and FT -MY 5 Part-time Academic Faculty are FT-2 and excludes Grad Assistants.
A.ppendix J 4127/04
APPENDIXC Table CI: The Pennsylvania State University
Percentage change in numbers alld proportion of full-time researc~ and librarians by tenure status (tenured/tenure track) ..
I Year I All I UP . :1 CW :1 A!>ington Altoona I Berks Erie :1 G Valley I Capital
J 1992: Total number I 141 ,I 68 'I 1 ;1 0 0 I 1 1 :1 1 I 1
:1 2092: T~t~1 number. I 225 J 91 I 35 ·1 2 1 .1 2 2 'I 1 I 0 . . .. '1 % change in total numbers .1 59.6% :I 33.8% I 3400.0% :1 - - I 100% 100% :1 0 I -100% 'I % change number ofstandin~ :1 56.9% .11 19.4% ·1220~·9% :1 .. - I - 1100% 100% :1 0 I -100%
"" .... :
:1 % change number of fixed-term :1 61.8% i 1.45.~o!.o .il - :1 - I - ;1 - - :1 - I -. . ., . . ~ . . .. ", .... ..
.1 .. ?r()portion of standing : I -,j :1 :1 :1 ,I 'I :I ·1 :I. 1992: % standing :1 46.1 % ~I 45.6% il 100% iI -
• ••.• ~ •• I .. 'I - ,I 100% :1 100% 1 100% I 100%
12002:. % standing ;1 4~.~CYo. !I 40.7% II 65.7% il 100% I 100% :1 100% ;1 100%. il 100% I -. ~ -, ...
Table C2: The Pennsylvania State University Percentage change in numbers and proportion of full-time research and librarians by tenure status (tenured/tenure track) .. -
:/. Year :/ Ag. I Bus I E&~S l Eng J H&HD:I LA :1 Sci I 1ST I Other
:11992: Total number iI 4 I 1 'I 4 :1 1 I 6 2 1 6 :I 0 1 44
'I 2002: Total number I 10 :I 0 ,I 12 :1 14 I 8 2 :1 4 :1 0 I 41 I % change in total n~mbers I 150.0% :1. :-100.0% :1 200.0% .1 23?~0% 1 33.3% 0 :1 -33.3% 1 1 -6.8% I % change number of standing I 100.0% i/, 0 :1 0 I - 'I -100% -100.0% 1 - I 1 7.1% . .
.1. % change number of fixed- 1166.7O~o!I-I00.0% 'I 200.0% I 900.0% I 60.0% .1 100.0% .1-50.0
% 'il -31.3% . term
I Proportion of standing I 1 I 1 1 ·1 :1 I 1 1 1992: % standing I 25.0% :1 0 I 0 'I 0 I 16.7% I 50.0% .1 0 I 1 63.6%
;1 2002: % standing :1 20.0% :1 0 'I 0 :1 28.6% '1 0 :1 0 :1 25.0% I I 73.2% Source: "Student Credit Hours, ResIdent InstructIOn FTE's, and Headcounts for Full-Time Faculty and Others with Teaching Responsibility. Summaries by Rank, Appointment Type, Gender, University Park Colleges, and Campus Colleges."
-21-