appendix j-1: noise assessment report · big sky acoustics, llc (bsa) has revised the noise...
TRANSCRIPT

Black Butte Copper Project Mine Operating Permit Application (Revision 3)
APPENDIX J-1: Noise Assessment Report
Tintina Montana, Inc. July 2017
July 7, 2017 Mr. Bob Jacko Tintina Resources, Inc. PO Box 431 White Sulphur Springs, MT 59645 Re: Black Butte Copper Project REVISED Noise Assessment BSA Project #15134 Dear Bob: Big Sky Acoustics, LLC (BSA) has revised the Noise Assessment for the Black Butte Copper Project near White Sulphur Springs, Montana to address DEQ’s comments and included updated information. This report documents the existing ambient noise levels and the predicted noise levels for the Construction and Operation Phases. This document is intended for use as Appendix J of the Tintina Mine Operating Permit. If you have any questions concerning this report, please do not hesitate to call me at (406) 457-0407 or email me at [email protected]. Sincerely,
Sean Connolly BIG SKY ACOUSTICS, LLC cc: Allan Kirk / Geomin Resources

BLACK BUTTE COPPER PROJECT REVISED NOISE ASSESSMENT
Prepared for: Tintina Resources, Inc.
PO Box 431 White Sulphur Springs, MT 59645
Completed by:
April 20, 2017
Black Butte Copper Project Big Sky Acoustics, LLC REVISED Noise Assessment
i
TABLE OF CONTENTS Section Page TABLE OF CONTENTS ................................................................................................................. i 1.0 INTRODUCTION ...............................................................................................................1 2.0 NOISE TERMINOLOGY ....................................................................................................1 3.0 NOISE GUIDELINES .........................................................................................................2 4.0 EXISTING NOISE ENVIRONMENT ................................................................................4 4.1 LOCATION 1 – BAR Z RANCH ....................................................................................5 4.2 LOCATION 2 – CASTLE MOUNTAIN RANCH/U.S. 89 ..................................................7 4.3 LOCATION 3 – BUTTE CREEK ROAD GATE ................................................................8 4.4 LOCATION 4 – LODGE AT SHEEP CREEK ....................................................................9 5.0 NOISE LEVEL PREDICTIONS .......................................................................................10 5.1 CONSTRUCTION PHASE ...........................................................................................11 5.2 OPERATION PHASE ..................................................................................................12 5.3 BACK-UP ALARMS ..................................................................................................13 5.4 BLASTING ...............................................................................................................13 5.5 TRAFFIC NOISE .......................................................................................................13 6.0 NOISE MITIGATION MEASURES .................................................................................15 7.0 CONCLUSION ..................................................................................................................16 8.0 REFERENCES ..................................................................................................................16 9.0 STANDARD OF CARE ....................................................................................................17 TABLES TABLE 3-1 PROJECT NOISE REGULATIONS AND GUIDELINES TABLE 3-2 FTA CONSTRUCTION NOISE GUIDELINES TABLE 3-3 AUDIBILITY GUIDELINES TABLE 4-2 AMBIENT NOISE LEVELS AT LOCATION 2, CASTLE MOUNTAIN RANCH/U.S. 89 TABLE 4-3 AMBIENT NOISE LEVELS AT LOCATION 3, BUTTE CREEK ROAD GATE TABLE 4-4 AMBIENT NOISE LEVELS AT LOCATION 4, LODGE AT SHEEP CREEK TABLE 5-1 SUMMARY OF ASSUMPTIONS USED FOR NOISE STUDY TABLE 5-2 SUMMARY OF PREDICTED CONSTRUCTION NOISE LEVELS TABLE 5-3 SUMMARY OF PREDICTED OPERATION NOISE LEVELS
Black Butte Copper Project Big Sky Acoustics, LLC REVISED Noise Assessment
ii
TABLE OF CONTENTS
(Continued) TABLES TABLE 5-4 PREDICTED NOISE LEVELS FOR BLASTING AT OR NEAR THE SURFACE TABLE 5-5 TRAFFIC NOISE LEVELS NEAR MINE SITE TABLE 5-6 PREDICTED US 89 TRAFFIC NOISE LEVELS GRAPH GRAPH 4-1 LOCATION 1 AMBIENT NOISE LEVELS, SEPTEMBER 10 – 11, 2013 FIGURES FIGURE 1 PROJECT FACILITIES AND NOISE MEASUREMENT LOCATIONS FIGURE 2 NOISE CONTOURS: CONSTRUCTION PHASE FIGURE 3 NOISE CONTOURS: OPERATION PHASE

Black Butte Copper Project Big Sky Acoustics, LLC REVISED Noise Assessment
Page 1 of 15
1.0 INTRODUCTION Big Sky Acoustics, LLC (BSA) completed a Noise Assessment for the Black Butte Copper Project near White Sulphur Springs, Montana. This report documents the existing ambient noise levels and the predicted noise levels for Construction and Operation Phases. A layout of the Project area and facilities is shown on Figure 1 (attached) and the four noise assessment locations, including nearby residences. These are the same four locations that BSA used to measure the baseline ambient noise levels in 2013. The Project will generally consist of two phases. The Construction Phase will include building the mill, portal pad and tailings facilities, and is estimated to last two to three years. The Operation Phase will include underground mining, and processing of ore at the mill with an outdoor crusher on the portal pad. Ore will be hauled off-site using haul trucks. 2.0 NOISE TERMINOLOGY Noise is generally defined as unwanted sound, and can be intermittent or continuous, steady or impulsive, stationary or transient. Noise levels heard by humans and animals are dependent on several variables, including distance and ground cover between the source and receiver and atmospheric conditions. Perception of noise is affected by intensity, frequency, pitch and duration. The primary noise effect on humans is annoyance. Indirect effects may include speech interference, stress reactions, sleep interference, lower morale, efficiency reduction, and fatigue (Harris 1998). Response to noise on wildlife is a function of many variables, including characteristics and duration of the noise; habitat, season, previous noise exposure, etc. Different species have different levels of noise tolerance, habituation, and displacement. Noise levels are quantified using units of decibels (dB). Humans typically have reduced hearing sensitivity at low frequencies compared with their response at high frequencies. The “A-weighting” of noise levels, or A-weighted decibels (dBA), closely correlates to the frequency response of normal human hearing (250 to 4,000 hertz [Hz]). Decibels are logarithmic values, and therefore, the combined noise level of two 50 dBA noise sources is 53 dBA, not 100 dBA. Noise levels typically decrease by approximately 6 dBA every time the distance between the source and receptor is doubled, depending on the characteristics of the source and the conditions over the path that the noise travels. The reduction in noise levels can be increased if a solid barrier or natural topography blocks the line of sight between the source and receptor. For environmental noise studies, noise levels are typically described using A-weighted equivalent noise levels, Leq, during a certain time period. The Leq metric is useful because it uses a single number, similar to an average, to describe the constantly fluctuating instantaneous noise levels at a receptor location during a period of time, and accounts for all of the noises and quiet periods that occur during that time period. The Lmax metric denotes the maximum instantaneous sound level recorded during a measurement period.
Black Butte Copper Project Big Sky Acoustics, LLC REVISED Noise Assessment
Page 2 of 15
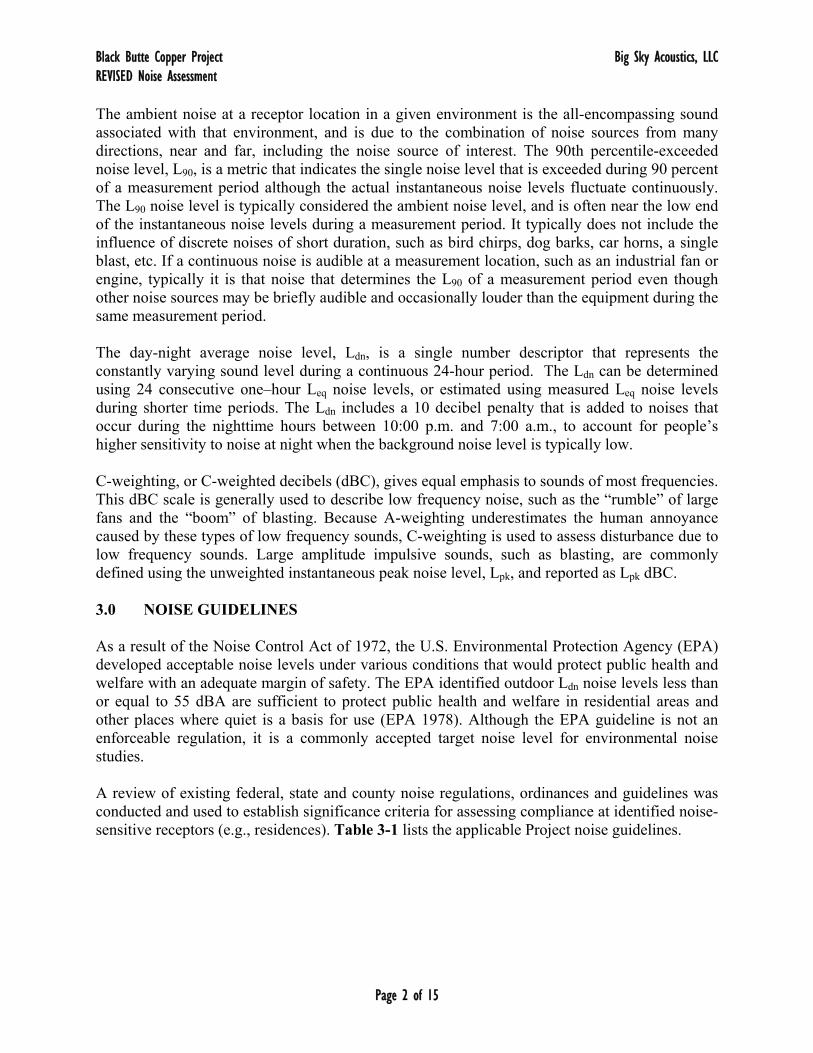
The ambient noise at a receptor location in a given environment is the all-encompassing sound associated with that environment, and is due to the combination of noise sources from many directions, near and far, including the noise source of interest. The 90th percentile-exceeded noise level, L90, is a metric that indicates the single noise level that is exceeded during 90 percent of a measurement period although the actual instantaneous noise levels fluctuate continuously. The L90 noise level is typically considered the ambient noise level, and is often near the low end of the instantaneous noise levels during a measurement period. It typically does not include the influence of discrete noises of short duration, such as bird chirps, dog barks, car horns, a single blast, etc. If a continuous noise is audible at a measurement location, such as an industrial fan or engine, typically it is that noise that determines the L90 of a measurement period even though other noise sources may be briefly audible and occasionally louder than the equipment during the same measurement period. The day-night average noise level, Ldn, is a single number descriptor that represents the constantly varying sound level during a continuous 24-hour period. The Ldn can be determined using 24 consecutive one–hour Leq noise levels, or estimated using measured Leq noise levels during shorter time periods. The Ldn includes a 10 decibel penalty that is added to noises that occur during the nighttime hours between 10:00 p.m. and 7:00 a.m., to account for people’s higher sensitivity to noise at night when the background noise level is typically low. C-weighting, or C-weighted decibels (dBC), gives equal emphasis to sounds of most frequencies. This dBC scale is generally used to describe low frequency noise, such as the “rumble” of large fans and the “boom” of blasting. Because A-weighting underestimates the human annoyance caused by these types of low frequency sounds, C-weighting is used to assess disturbance due to low frequency sounds. Large amplitude impulsive sounds, such as blasting, are commonly defined using the unweighted instantaneous peak noise level, Lpk, and reported as Lpk dBC. 3.0 NOISE GUIDELINES As a result of the Noise Control Act of 1972, the U.S. Environmental Protection Agency (EPA) developed acceptable noise levels under various conditions that would protect public health and welfare with an adequate margin of safety. The EPA identified outdoor Ldn noise levels less than or equal to 55 dBA are sufficient to protect public health and welfare in residential areas and other places where quiet is a basis for use (EPA 1978). Although the EPA guideline is not an enforceable regulation, it is a commonly accepted target noise level for environmental noise studies. A review of existing federal, state and county noise regulations, ordinances and guidelines was conducted and used to establish significance criteria for assessing compliance at identified noise-sensitive receptors (e.g., residences). Table 3-1 lists the applicable Project noise guidelines.

Black Butte Copper Project Big Sky Acoustics, LLC REVISED Noise Assessment
Page 3 of 15
TABLE 3-1 Project Noise Regulations and Guidelines
Regulatory Authority1 Regulations and Guidelines Statute/Regulation
Environmental Protection Agency
Outdoor day‐night average noise level (Ldn) less than or equal to 55 dBA are sufficient to protect public health and welfare in residential areas and other places where quiet is a basis for use.
Noise Control Act of 1972, 42 U.S.C. §4901 et seq.
State of Montana
Every motor vehicle shall at all times be equipped with a muffler in good working order and in constant operation to prevent excessive or unusual noise. A person may not operate a motor vehicle with an exhaust system that emits a noise in excess of 95 dB, as measured by the Society of Automotive Engineers' standard j1169 (May 1998).
Montana Code Annotated § 61‐9‐403, § 61‐9‐435
Montana Department of Environmental Quality (DEQ)
Airblast must be controlled so that it does not exceed the values specified below at any dwelling, or public, commercial, community or institutional building, unless the structure is owned by the operator and is not leased to any other person.
0.1 Hz or lower ‐ flat response = 134 Lpk 2 Hz or lower ‐ flat response = 133 Lpk 6 Hz or lower ‐ flat response = 129 Lpk C‐weighted, slow response = 105 Lpk dBC
Administrative Rules of Montana (ARM) 17.24.624, 17.24.159
Montana Department of Transportation (MDT)
Traffic noise impacts occur if predicted one‐hour Leq(h) traffic noise levels are 66 dBA or greater at a residential property during the peak traffic hour, or if the projected traffic noise levels exceed the existing peak hour Leq(h) by 13 dBA or more.
MDT Traffic Noise Analysis and Abatement Policy
Meagher County Protect hearing of all workers whose noiseexposures equal or exceed an action level of 85 decibels (dB) for an 8‐hour day.
Meagher CountyEmployee Safety Manual
Source: DEQ 2004, EPA 1978, MDT 2011, Meagher County 2014, Montana Code Annotated 2014
The Federal Transit Administration (FTA) has developed guidelines for assessing short (1-hour) and long-term (8-hour) construction activities. Assessment of construction noise includes evaluating the existing ambient noise environment, the absolute noise levels due to construction activities, the duration of construction, and the noise-sensitivity of the adjacent land use. Table 3-2 summarizes the FTA construction noise guidelines at adjacent land uses. If these guidelines are exceeded, adverse community reaction may result.

Black Butte Copper Project Big Sky Acoustics, LLC REVISED Noise Assessment
Page 4 of 15
TABLE 3-2 FTA Construction Noise Guidelines
Adjacent Land Use Daytime Leq Nighttime Leq
Short Duration Noise Guidelines (1 hour)
Residential 90 dBA 80 dBA
Commercial 100 dBA 100 dBA
Industrial 100 dBA 100 dBA
Moderate Duration Noise Guidelines (8 hours)
Residential 80 dBA 70 dBA
Commercial 85 dBA 85 dBA
Industrial 90 dBA 90 dBA
Source: FTA 2006
In addition to the absolute limits, changes in noise levels are used to determine audibility and gauge community response. Comparing the Leq noise levels of a noise source to L90 (ambient) noise levels at a listener location helps approximate whether a noise source will be audible, and how significantly the ambient environment will change due to a new noise source. A comparison is summarized in Table 3-3.
TABLE 3-3
Audibility Guidelines
Condition Description Expected Community
Reaction
Leq ≤ L90 Rarely heard Minimal
L90 < Leq ≤ L90 + 10 Sometimes audible Moderate
Leq > L90 + 10 Clearly audible High
Source: Menge 2005 and Cavanaugh 2002. 4.0 EXISTING NOISE ENVIRONMENT On September 10 and 11, 2013, BSA completed baseline noise level measurements for the Project. The ambient daytime and nighttime noise level measurements were completed at four locations indicated on Figure 1, and were intended to document the existing ambient noise levels, prior to mining operations. A 24-hour noise level measurement was completed at Location 1. A 1-hour “daytime” (7 a.m. to 7 p.m.) noise level measurement and a 15-minute “nighttime” (7 p.m. to 7 a.m.) noise level measurement were completed at Locations 2 through 4. Noise level measurements were conducted by BSA in general accordance with the American National Standards Institute (ANSI) S12.18-1994, Procedures for Outdoor Measurement of Sound Pressure Level (ANSI 1994). BSA conducted the noise level measurements using Larson Davis Model 831 and CEL 593 Type I Sound Level Meters with preamplifiers, and 0.5-inch
Black Butte Copper Project Big Sky Acoustics, LLC REVISED Noise Assessment
Page 5 of 15
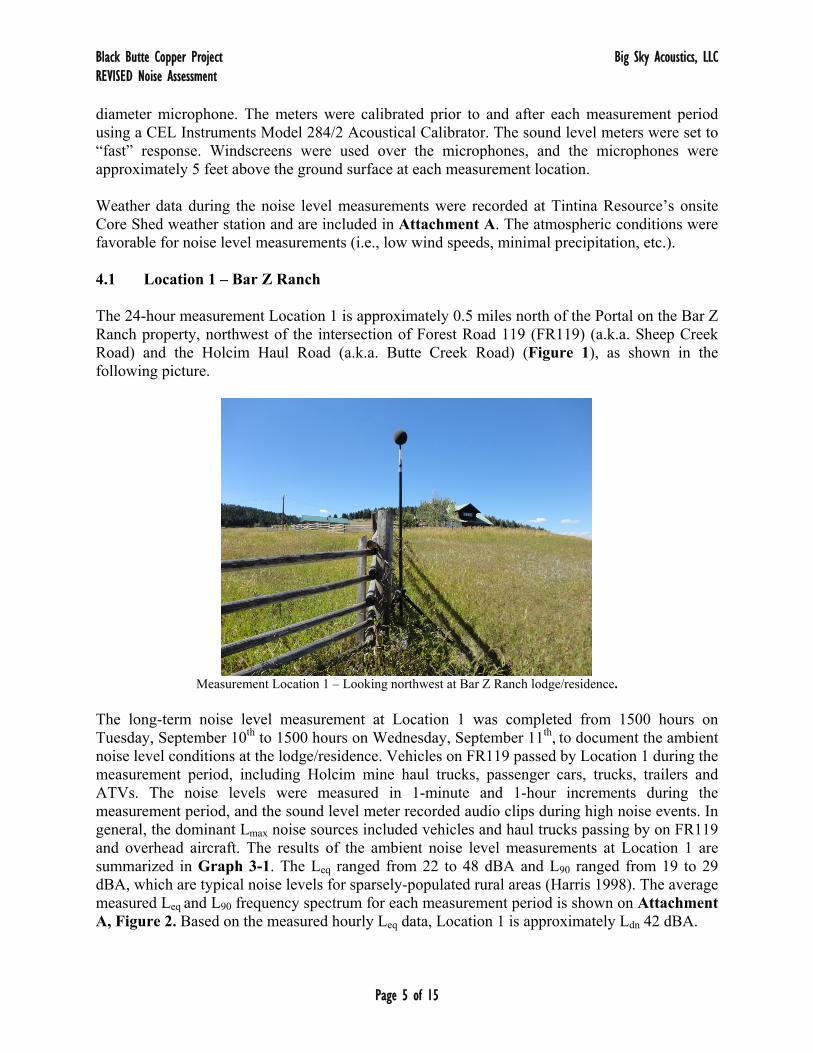
diameter microphone. The meters were calibrated prior to and after each measurement period using a CEL Instruments Model 284/2 Acoustical Calibrator. The sound level meters were set to “fast” response. Windscreens were used over the microphones, and the microphones were approximately 5 feet above the ground surface at each measurement location. Weather data during the noise level measurements were recorded at Tintina Resource’s onsite Core Shed weather station and are included in Attachment A. The atmospheric conditions were favorable for noise level measurements (i.e., low wind speeds, minimal precipitation, etc.). 4.1 Location 1 – Bar Z Ranch The 24-hour measurement Location 1 is approximately 0.5 miles north of the Portal on the Bar Z Ranch property, northwest of the intersection of Forest Road 119 (FR119) (a.k.a. Sheep Creek Road) and the Holcim Haul Road (a.k.a. Butte Creek Road) (Figure 1), as shown in the following picture.
Measurement Location 1 – Looking northwest at Bar Z Ranch lodge/residence.
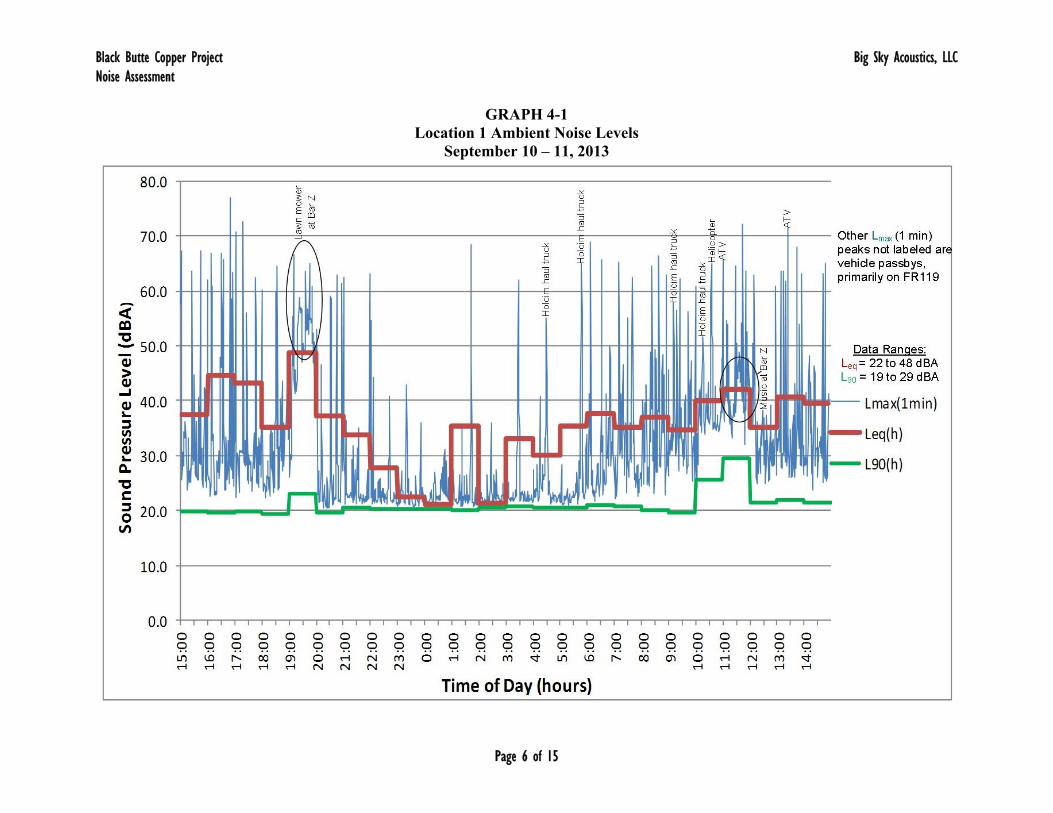
The long-term noise level measurement at Location 1 was completed from 1500 hours on Tuesday, September 10th to 1500 hours on Wednesday, September 11th, to document the ambient noise level conditions at the lodge/residence. Vehicles on FR119 passed by Location 1 during the measurement period, including Holcim mine haul trucks, passenger cars, trucks, trailers and ATVs. The noise levels were measured in 1-minute and 1-hour increments during the measurement period, and the sound level meter recorded audio clips during high noise events. In general, the dominant Lmax noise sources included vehicles and haul trucks passing by on FR119 and overhead aircraft. The results of the ambient noise level measurements at Location 1 are summarized in Graph 3-1. The Leq ranged from 22 to 48 dBA and L90 ranged from 19 to 29 dBA, which are typical noise levels for sparsely-populated rural areas (Harris 1998). The average measured Leq and L90 frequency spectrum for each measurement period is shown on Attachment A, Figure 2. Based on the measured hourly Leq data, Location 1 is approximately Ldn 42 dBA.
Black Butte Copper Project Big Sky Acoustics, LLC Noise Assessment
Page 6 of 15
GRAPH 4-1 Location 1 Ambient Noise Levels
September 10 – 11, 2013
Black Butte Copper Project Big Sky Acoustics, LLC Noise Assessment
Page 7 of 17
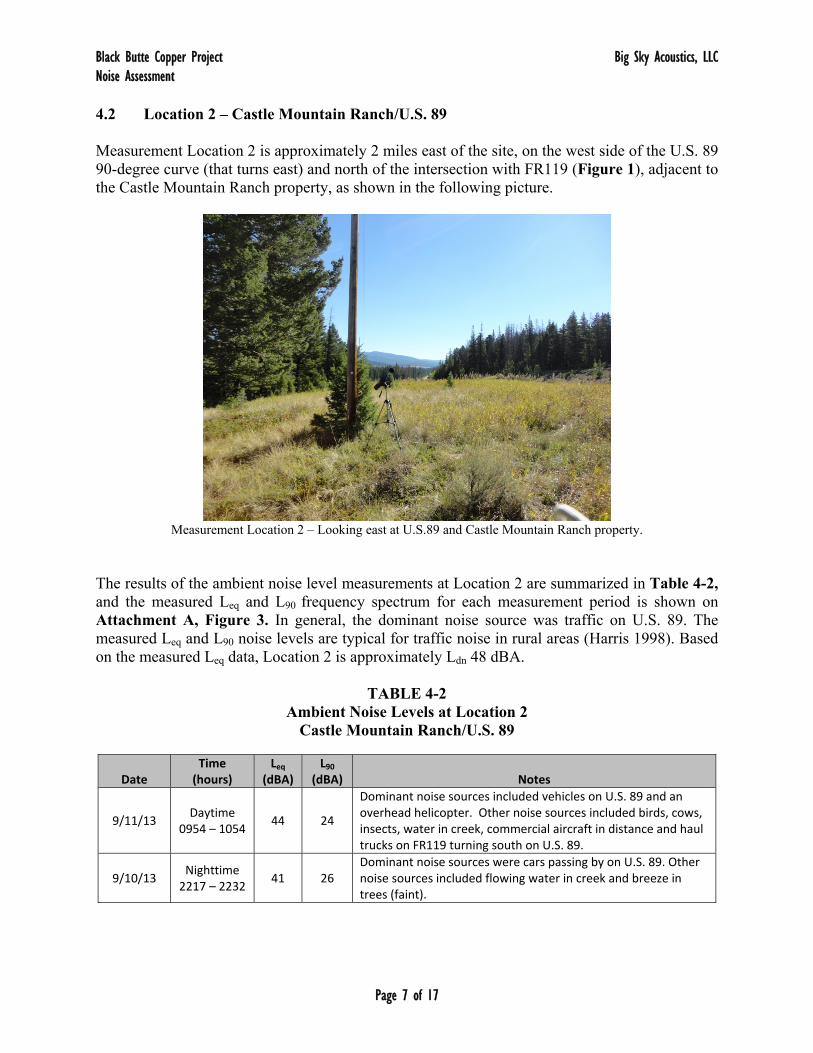
4.2 Location 2 – Castle Mountain Ranch/U.S. 89 Measurement Location 2 is approximately 2 miles east of the site, on the west side of the U.S. 89 90-degree curve (that turns east) and north of the intersection with FR119 (Figure 1), adjacent to the Castle Mountain Ranch property, as shown in the following picture.
Measurement Location 2 – Looking east at U.S.89 and Castle Mountain Ranch property.
The results of the ambient noise level measurements at Location 2 are summarized in Table 4-2, and the measured Leq and L90 frequency spectrum for each measurement period is shown on Attachment A, Figure 3. In general, the dominant noise source was traffic on U.S. 89. The measured Leq and L90 noise levels are typical for traffic noise in rural areas (Harris 1998). Based on the measured Leq data, Location 2 is approximately Ldn 48 dBA.
TABLE 4-2 Ambient Noise Levels at Location 2
Castle Mountain Ranch/U.S. 89
Date Time (hours)
Leq (dBA)
L90 (dBA) Notes
9/11/13 Daytime
0954 – 1054 44 24
Dominant noise sources included vehicles on U.S. 89 and an overhead helicopter. Other noise sources included birds, cows, insects, water in creek, commercial aircraft in distance and haul trucks on FR119 turning south on U.S. 89.
9/10/13 Nighttime 2217 – 2232
41 26 Dominant noise sources were cars passing by on U.S. 89. Other noise sources included flowing water in creek and breeze in trees (faint).
Black Butte Copper Project Big Sky Acoustics, LLC Noise Assessment
Page 8 of 17
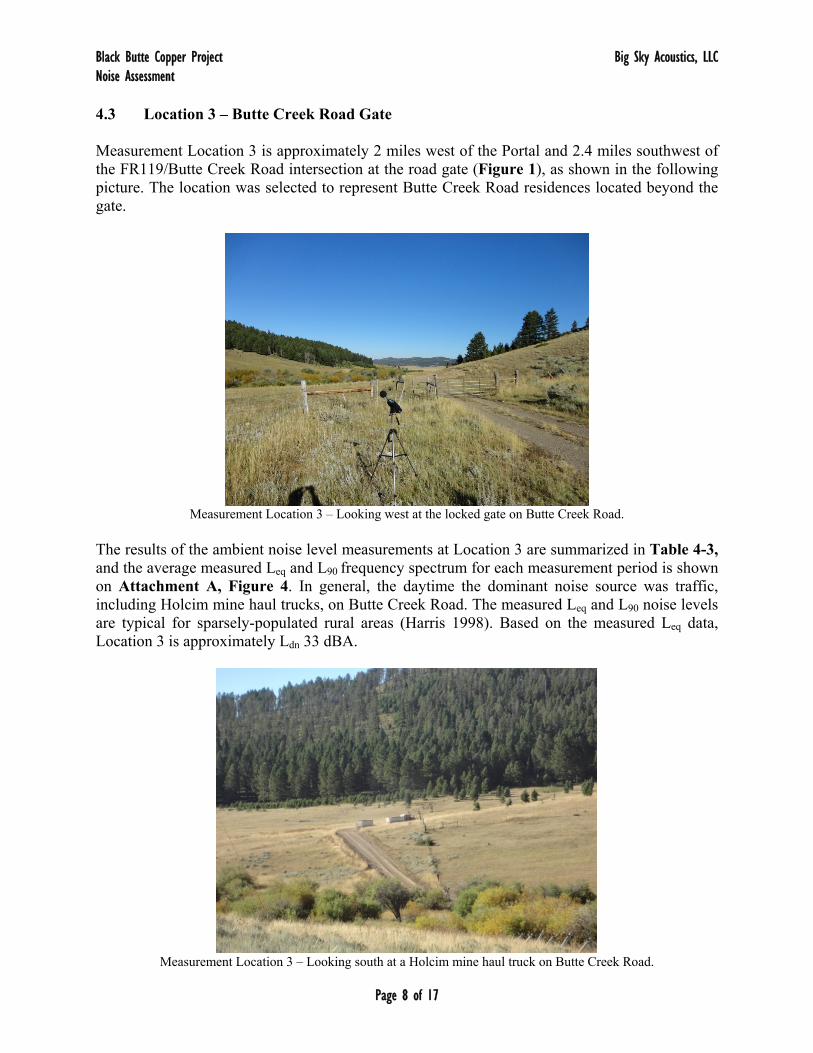
4.3 Location 3 – Butte Creek Road Gate Measurement Location 3 is approximately 2 miles west of the Portal and 2.4 miles southwest of the FR119/Butte Creek Road intersection at the road gate (Figure 1), as shown in the following picture. The location was selected to represent Butte Creek Road residences located beyond the gate.
Measurement Location 3 – Looking west at the locked gate on Butte Creek Road.
The results of the ambient noise level measurements at Location 3 are summarized in Table 4-3, and the average measured Leq and L90 frequency spectrum for each measurement period is shown on Attachment A, Figure 4. In general, the daytime the dominant noise source was traffic, including Holcim mine haul trucks, on Butte Creek Road. The measured Leq and L90 noise levels are typical for sparsely-populated rural areas (Harris 1998). Based on the measured Leq data, Location 3 is approximately Ldn 33 dBA.
Measurement Location 3 – Looking south at a Holcim mine haul truck on Butte Creek Road.
Black Butte Copper Project Big Sky Acoustics, LLC Noise Assessment
Page 9 of 17
TABLE 4-3 Ambient Noise Levels at Location 3
Butte Creek Road Gate
Date Time (hours)
Leq (dBA)
L90 (dBA) Notes
9/11/13 Daytime
0822 – 0923 33 22
Dominant noise sources included a haul truck, a pickup truck and ATV’s on Butte Creek Road. Other noise sources included birds, cows, faint breeze though grass and a propeller plane in distance.
9/10/13 Nighttime 2244 – 2310
24 21 Noise sources included breeze through grass and insects (faint).
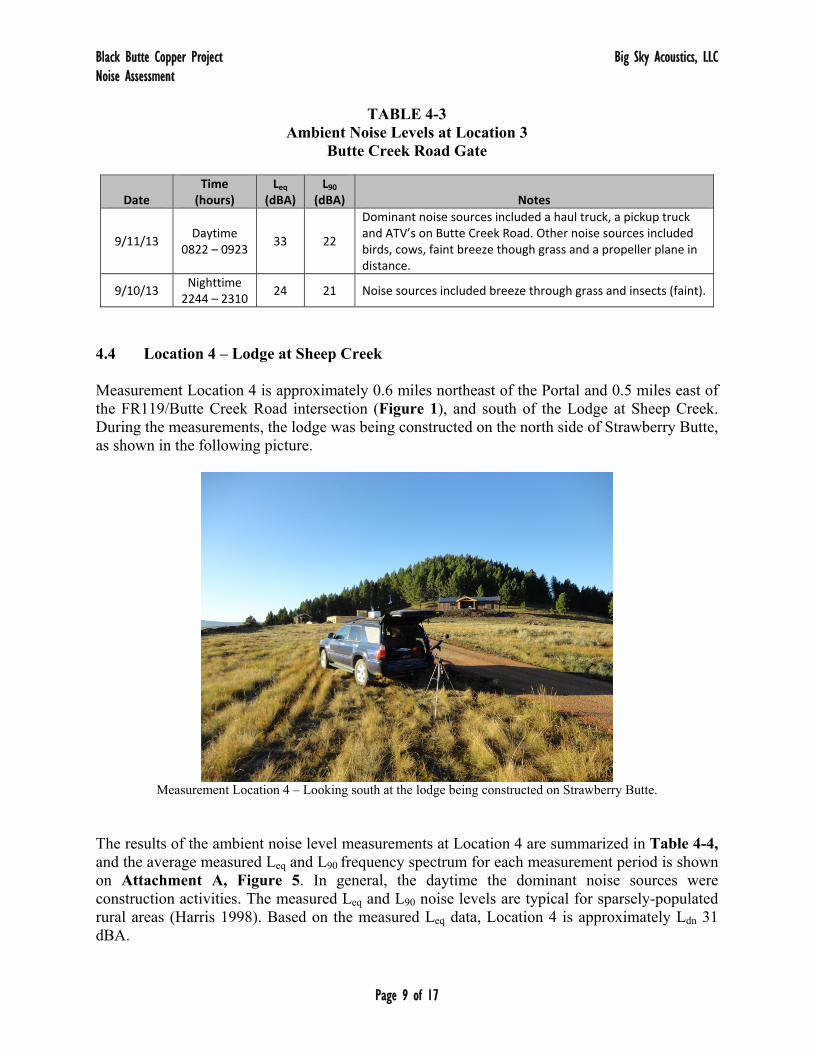
4.4 Location 4 – Lodge at Sheep Creek Measurement Location 4 is approximately 0.6 miles northeast of the Portal and 0.5 miles east of the FR119/Butte Creek Road intersection (Figure 1), and south of the Lodge at Sheep Creek. During the measurements, the lodge was being constructed on the north side of Strawberry Butte, as shown in the following picture.
Measurement Location 4 – Looking south at the lodge being constructed on Strawberry Butte.
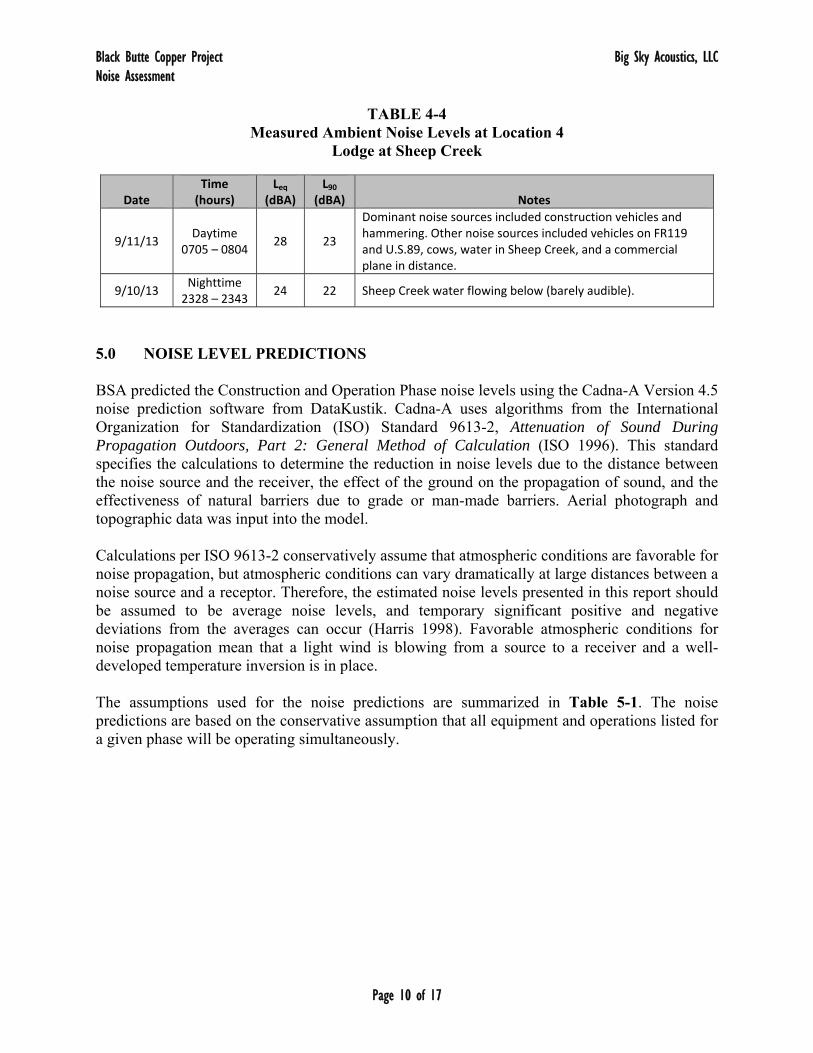
The results of the ambient noise level measurements at Location 4 are summarized in Table 4-4, and the average measured Leq and L90 frequency spectrum for each measurement period is shown on Attachment A, Figure 5. In general, the daytime the dominant noise sources were construction activities. The measured Leq and L90 noise levels are typical for sparsely-populated rural areas (Harris 1998). Based on the measured Leq data, Location 4 is approximately Ldn 31 dBA.
Black Butte Copper Project Big Sky Acoustics, LLC Noise Assessment
Page 10 of 17
TABLE 4-4 Measured Ambient Noise Levels at Location 4
Lodge at Sheep Creek
Date Time (hours)
Leq (dBA)
L90(dBA) Notes
9/11/13 Daytime
0705 – 0804 28 23
Dominant noise sources included construction vehicles and hammering. Other noise sources included vehicles on FR119 and U.S.89, cows, water in Sheep Creek, and a commercial plane in distance.
9/10/13 Nighttime 2328 – 2343
24 22 Sheep Creek water flowing below (barely audible).
5.0 NOISE LEVEL PREDICTIONS BSA predicted the Construction and Operation Phase noise levels using the Cadna-A Version 4.5 noise prediction software from DataKustik. Cadna-A uses algorithms from the International Organization for Standardization (ISO) Standard 9613-2, Attenuation of Sound During Propagation Outdoors, Part 2: General Method of Calculation (ISO 1996). This standard specifies the calculations to determine the reduction in noise levels due to the distance between the noise source and the receiver, the effect of the ground on the propagation of sound, and the effectiveness of natural barriers due to grade or man-made barriers. Aerial photograph and topographic data was input into the model. Calculations per ISO 9613-2 conservatively assume that atmospheric conditions are favorable for noise propagation, but atmospheric conditions can vary dramatically at large distances between a noise source and a receptor. Therefore, the estimated noise levels presented in this report should be assumed to be average noise levels, and temporary significant positive and negative deviations from the averages can occur (Harris 1998). Favorable atmospheric conditions for noise propagation mean that a light wind is blowing from a source to a receiver and a well-developed temperature inversion is in place. The assumptions used for the noise predictions are summarized in Table 5-1. The noise predictions are based on the conservative assumption that all equipment and operations listed for a given phase will be operating simultaneously.

Black Butte Copper Project Big Sky Acoustics, LLC Noise Assessment
Page 11 of 17
TABLE 5-1 Summary of Assumptions Used for Noise Study
Phase Assumptions
Construction
Two pieces of diesel‐powered earth‐moving equipment operating at the Cemented Tailings Facility (CTF) for 20 hours per day.
Two pieces of diesel‐powered earth‐moving equipment operating at the Process Water Pond (PWP) for 20 hours per day.
Two pieces of diesel‐powered earth‐moving equipment operating at the portal pad for 20 hours per day.
Two pieces of diesel‐powered earth‐moving equipment operating at the mill pad for 20 hours per day.
Crusher and screen plant operating with two pieces diesel‐powered earth‐moving equipment at the Temporary Construction Stockpile for 20 hours per day.
Haul or water trucks moving material from the portal pad area to the CTF or PWP. 80 round trips per day for 20 hours per day at 25 mph.
Air compressor and diesel generators operating 24 hours per day.
Operation
Indoor mill operates 24 hours per day.
Outdoor crusher at west end of portal pad operates 20 hours per day.
Underground haul truck bringing material from portal to crusher. 82 round trips per day for 24 hours per day at 15 mph.
Front‐end loader operating at crusher 20 hours per day.
Vent raises with ventilation fan at bottom of two 120 foot long, 7‐foot diameter shafts. Fan is attenuated to meet 85 dBA at 3 feet.
Blasting Charge is 632 pounds of explosive per delay.
Construction surface and decline blasting within 500 feet of surface.
Operation underground decline and orebody blasting.
5.1 Construction Phase Table 5-2 summarizes the predicted Construction Phase noise levels and a determination of the audibility of the Project noise at the four measurement locations shown on Figure 1. Figure 2 (attached) indicates the predicted Ldn noise level contours for the Construction Phase. As shown on the figure, the topography in the area affects how noise travels in the vicinity of the mine site. The predicted construction noise Ldn levels are less than the EPA guideline Ldn 55 dBA at each location. As shown in Table 5-2, the audibility of construction noise is predicted to be Leq 28 to 38 dBA at the noise measurement locations, which are typically considered “faint” noise levels due to the low ambient L90 noise levels in the area. The predicted construction Leq 28 to 38 dBA noise levels are much lower than the Leq 70 dBA FTA residential nighttime construction noise guidelines (Table 3-2). However, due to the low ambient L90 noise levels, the construction noise is predicted to be clearly audible at Location 1 (Bar Z Ranch), and occasionally audible at Location 2 (Butte Creek Road gate), Location 3 (Butte Creek Road Gate) and Location 4 (Lodge at Sheep Creek) (Table 3-3) (Figure 2).
Black Butte Copper Project Big Sky Acoustics, LLC Noise Assessment
Page 12 of 17
TABLE 5-2 Summary of Predicted Construction Noise Levels (dBA)
Noise Measurement
Location
Ldn Noise Level Audibility
Calculated Baseline Noise
Level (Ldn)
Predicted Construction Noise Level
(Ldn)
Average Measured Baseline Noise
Level (L90)
Predicted Construction Noise Level
(Leq) Difference (Leq – L90)
Perception of Construction Noise at
Locations
1 42 41 24 38 +14 Clearly audible
2 48 32 25 30 +5 Occasionally audible
3 33 33 21 29 +8 Occasionally audible
4 31 31 22 28 +6 Occasionally audible
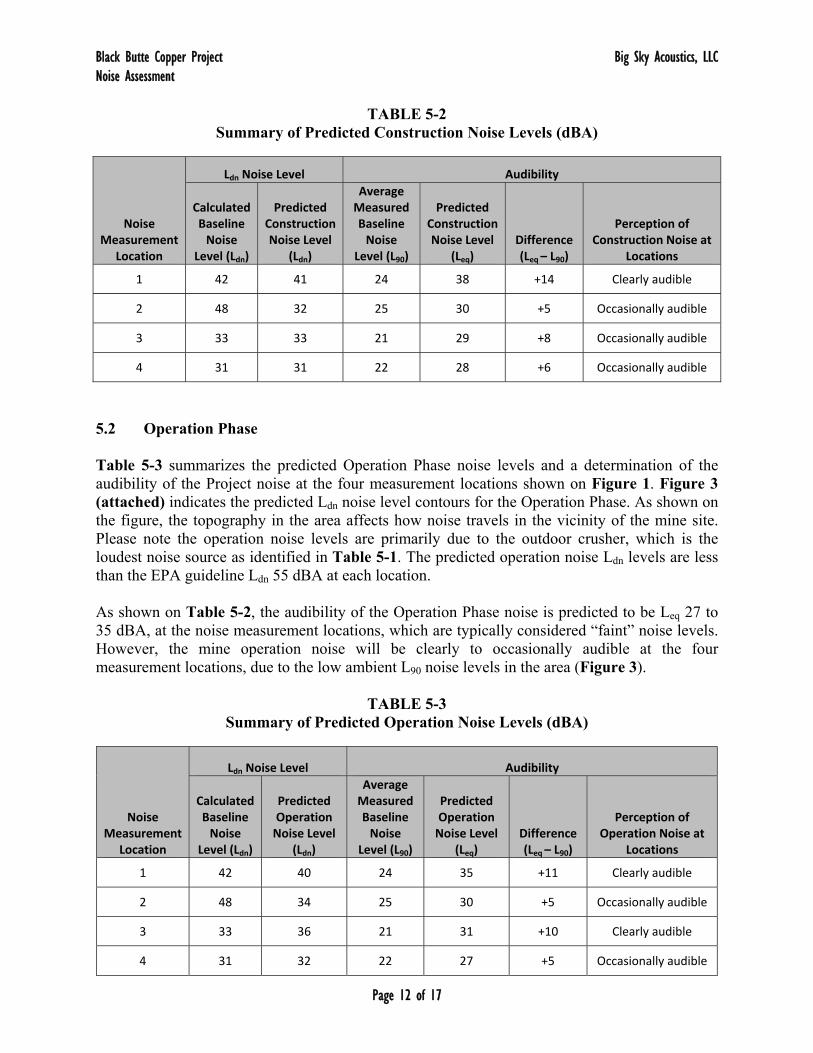
5.2 Operation Phase Table 5-3 summarizes the predicted Operation Phase noise levels and a determination of the audibility of the Project noise at the four measurement locations shown on Figure 1. Figure 3 (attached) indicates the predicted Ldn noise level contours for the Operation Phase. As shown on the figure, the topography in the area affects how noise travels in the vicinity of the mine site. Please note the operation noise levels are primarily due to the outdoor crusher, which is the loudest noise source as identified in Table 5-1. The predicted operation noise Ldn levels are less than the EPA guideline Ldn 55 dBA at each location. As shown on Table 5-2, the audibility of the Operation Phase noise is predicted to be Leq 27 to 35 dBA, at the noise measurement locations, which are typically considered “faint” noise levels. However, the mine operation noise will be clearly to occasionally audible at the four measurement locations, due to the low ambient L90 noise levels in the area (Figure 3).
TABLE 5-3 Summary of Predicted Operation Noise Levels (dBA)
Noise Measurement
Location
Ldn Noise Level Audibility
Calculated Baseline Noise
Level (Ldn)
Predicted Operation Noise Level
(Ldn)
Average Measured Baseline Noise
Level (L90)
Predicted Operation Noise Level
(Leq) Difference (Leq – L90)
Perception of Operation Noise at
Locations
1 42 40 24 35 +11 Clearly audible
2 48 34 25 30 +5 Occasionally audible
3 33 36 21 31 +10 Clearly audible
4 31 32 22 27 +5 Occasionally audible
Black Butte Copper Project Big Sky Acoustics, LLC Noise Assessment
Page 13 of 17
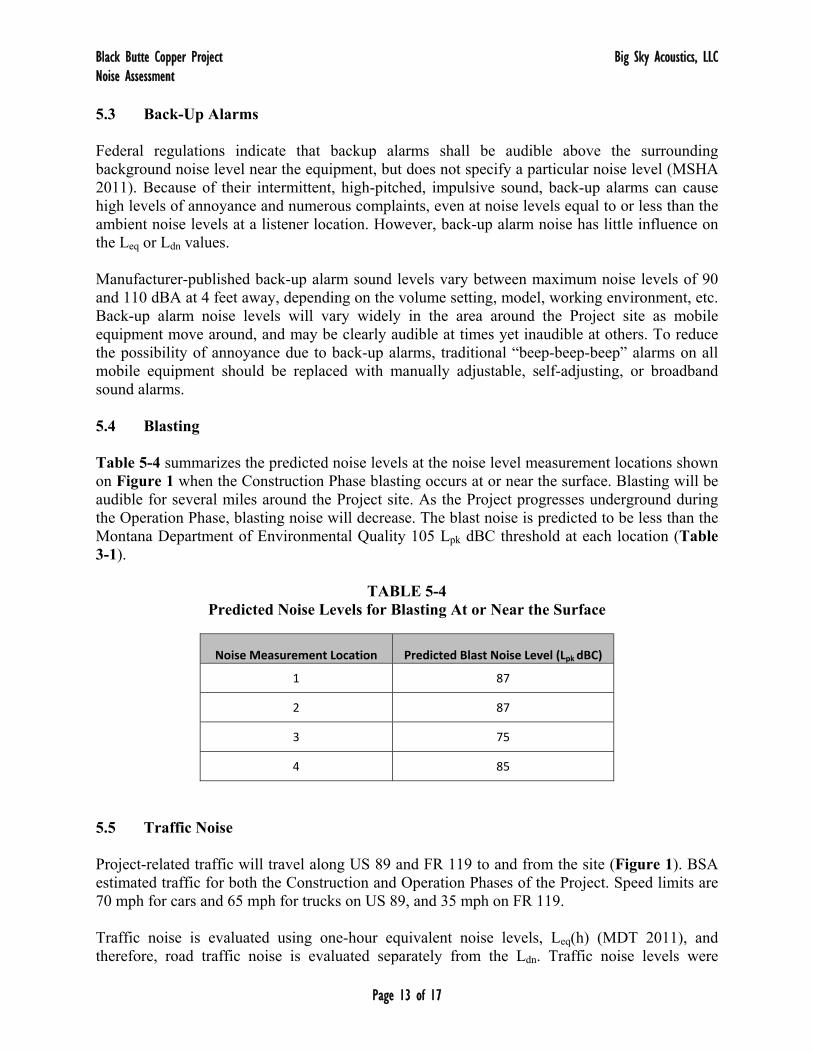
5.3 Back-Up Alarms Federal regulations indicate that backup alarms shall be audible above the surrounding background noise level near the equipment, but does not specify a particular noise level (MSHA 2011). Because of their intermittent, high-pitched, impulsive sound, back-up alarms can cause high levels of annoyance and numerous complaints, even at noise levels equal to or less than the ambient noise levels at a listener location. However, back-up alarm noise has little influence on the Leq or Ldn values. Manufacturer-published back-up alarm sound levels vary between maximum noise levels of 90 and 110 dBA at 4 feet away, depending on the volume setting, model, working environment, etc. Back-up alarm noise levels will vary widely in the area around the Project site as mobile equipment move around, and may be clearly audible at times yet inaudible at others. To reduce the possibility of annoyance due to back-up alarms, traditional “beep-beep-beep” alarms on all mobile equipment should be replaced with manually adjustable, self-adjusting, or broadband sound alarms. 5.4 Blasting Table 5-4 summarizes the predicted noise levels at the noise level measurement locations shown on Figure 1 when the Construction Phase blasting occurs at or near the surface. Blasting will be audible for several miles around the Project site. As the Project progresses underground during the Operation Phase, blasting noise will decrease. The blast noise is predicted to be less than the Montana Department of Environmental Quality 105 Lpk dBC threshold at each location (Table 3-1).
TABLE 5-4 Predicted Noise Levels for Blasting At or Near the Surface
Noise Measurement Location Predicted Blast Noise Level (Lpk dBC)
1 87
2 87
3 75
4 85
5.5 Traffic Noise Project-related traffic will travel along US 89 and FR 119 to and from the site (Figure 1). BSA estimated traffic for both the Construction and Operation Phases of the Project. Speed limits are 70 mph for cars and 65 mph for trucks on US 89, and 35 mph on FR 119. Traffic noise is evaluated using one-hour equivalent noise levels, Leq(h) (MDT 2011), and therefore, road traffic noise is evaluated separately from the Ldn. Traffic noise levels were
Black Butte Copper Project Big Sky Acoustics, LLC Noise Assessment
Page 14 of 17
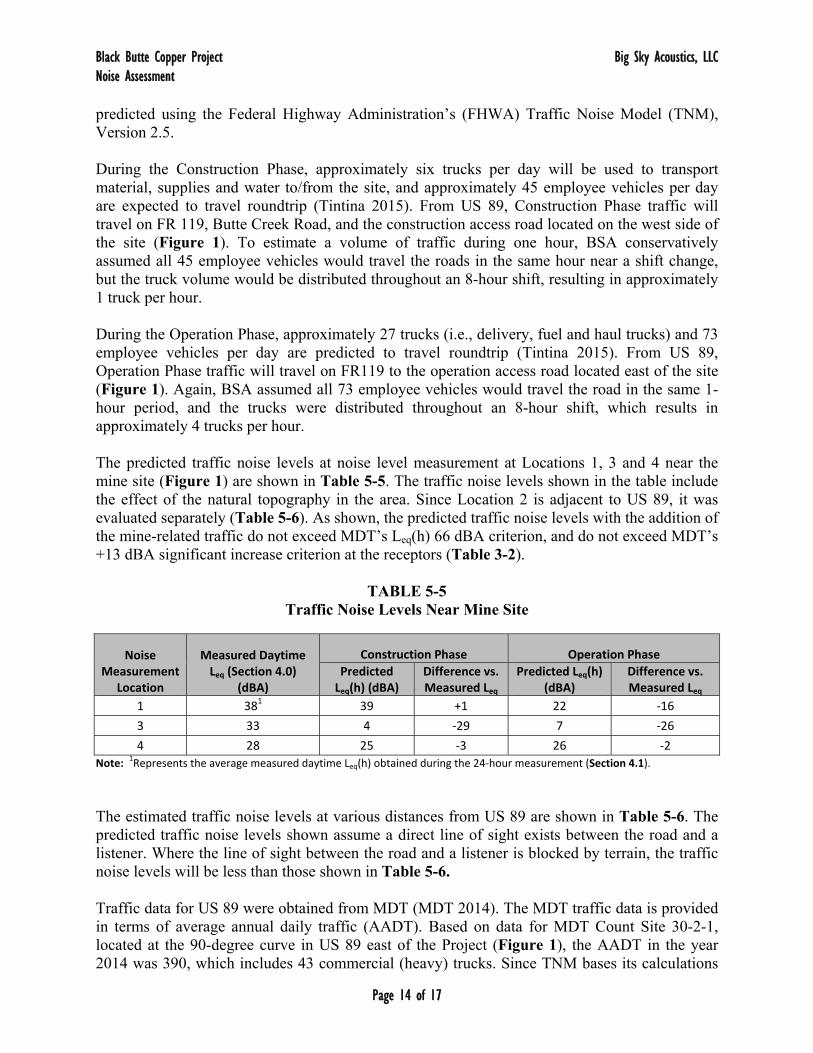
predicted using the Federal Highway Administration’s (FHWA) Traffic Noise Model (TNM), Version 2.5. During the Construction Phase, approximately six trucks per day will be used to transport material, supplies and water to/from the site, and approximately 45 employee vehicles per day are expected to travel roundtrip (Tintina 2015). From US 89, Construction Phase traffic will travel on FR 119, Butte Creek Road, and the construction access road located on the west side of the site (Figure 1). To estimate a volume of traffic during one hour, BSA conservatively assumed all 45 employee vehicles would travel the roads in the same hour near a shift change, but the truck volume would be distributed throughout an 8-hour shift, resulting in approximately 1 truck per hour. During the Operation Phase, approximately 27 trucks (i.e., delivery, fuel and haul trucks) and 73 employee vehicles per day are predicted to travel roundtrip (Tintina 2015). From US 89, Operation Phase traffic will travel on FR119 to the operation access road located east of the site (Figure 1). Again, BSA assumed all 73 employee vehicles would travel the road in the same 1-hour period, and the trucks were distributed throughout an 8-hour shift, which results in approximately 4 trucks per hour. The predicted traffic noise levels at noise level measurement at Locations 1, 3 and 4 near the mine site (Figure 1) are shown in Table 5-5. The traffic noise levels shown in the table include the effect of the natural topography in the area. Since Location 2 is adjacent to US 89, it was evaluated separately (Table 5-6). As shown, the predicted traffic noise levels with the addition of the mine-related traffic do not exceed MDT’s Leq(h) 66 dBA criterion, and do not exceed MDT’s +13 dBA significant increase criterion at the receptors (Table 3-2).
TABLE 5-5 Traffic Noise Levels Near Mine Site
Noise Measurement
Location
Measured Daytime Leq (Section 4.0)
(dBA)
Construction Phase Operation Phase
Predicted Leq(h) (dBA)
Difference vs. Measured Leq
Predicted Leq(h) (dBA)
Difference vs. Measured Leq
1 381 39 +1 22 ‐16
3 33 4 ‐29 7 ‐26
4 28 25 ‐3 26 ‐2
Note: 1Represents the average measured daytime Leq(h) obtained during the 24‐hour measurement (Section 4.1).
The estimated traffic noise levels at various distances from US 89 are shown in Table 5-6. The predicted traffic noise levels shown assume a direct line of sight exists between the road and a listener. Where the line of sight between the road and a listener is blocked by terrain, the traffic noise levels will be less than those shown in Table 5-6. Traffic data for US 89 were obtained from MDT (MDT 2014). The MDT traffic data is provided in terms of average annual daily traffic (AADT). Based on data for MDT Count Site 30-2-1, located at the 90-degree curve in US 89 east of the Project (Figure 1), the AADT in the year 2014 was 390, which includes 43 commercial (heavy) trucks. Since TNM bases its calculations

Black Butte Copper Project Big Sky Acoustics, LLC Noise Assessment
Page 15 of 17
on traffic volumes during a 1-hour period, BSA assumed that the 1-hour traffic volume was approximately 10% of the AADT. As shown, the traffic noise levels due to the addition of mine-related traffic to the US 89 traffic volume is not predicted to exceed MDT’s Leq(h) 66 dBA criterion, and do not exceed MDT’s +13 dBA significant increase criterion (Table 3-2).
TABLE 5-6 Predicted US 89 Traffic Noise Levels
Distance from Centerline of Road
Existing US 89 Traffic Noise
Level Leq(h) (dBA)
Construction Phase Operation Phase
Existing US 89 + Construction Traffic Noise
Level Leq(h) (dBA)
Difference vs. Existing US 89 Traffic
Noise
Existing US 89 + Operation
Traffic Noise Level
Leq(h) (dBA)
Difference vs. Existing US 89 Traffic
Noise
100 ft 56 59 +3 61 +5
200 ft 49 52 +3 54 +5
300 ft 45 47 +2 49 +4
400 ft 41 44 +3 45 +4
500 ft 39 41 +2 43 +4
750 ft (Location 2 Residence)
34 37 +3 38 +4
1,000 ft 32 34 +2 36 +4
5,000 ft 22 25 +3 26 +4
10,000 ft 18 21 +3 22 +4
6.0 NOISE MITIGATION MEASURES Reasonable noise mitigation measures could be implemented to reduce the project noise levels at nearby residences due to the Construction and Operation Phase operations. Noise control measures will also reduce the noise exposure of workers in the vicinity of the equipment. Although noise mitigation measures could provide a clearly noticeable reduction in noise, the construction and operation noise sources will still be audible at nearby residences (Tables 5-2 and 5-3), even if noise mitigation measures are implemented. The construction and operation noise could be reduced by implementing the following noise mitigation measures in order to minimize human annoyance and disruption of wildlife.
On all diesel-powered construction equipment, replace standard back-up alarms with approved broadband alarms that limit the alarm noise to 5 to 10 dBA above the background noise. Broadband alarms replace the traditional “beep-beep-beep” alarms with a “shhh-shhh-shhh.”
Install high-grade mufflers on all diesel-powered equipment.
Black Butte Copper Project Big Sky Acoustics, LLC Noise Assessment
Page 16 of 17
Reduce the noise of the underground haulage trucks by enclosing the engine.
Restrict the surface and outdoor construction and operation activities to daytime hours (7:00 am to 7:00pm).
Combine noisy operations to occur for short durations during the same time periods. Turn
idling equipment off. 7.0 CONCLUSION BSA completed a Noise Assessment of the Black Butte Copper Project. The results are presented in Section 5.0. The Construction and Operation Phase noise levels are not predicted to exceed the EPA Ldn 55 dBA guideline at the noise measurement locations (Sections 5.1 and 5.2). Construction and operation noise levels are predicted to be “faint” but audible at the measurement locations due to the low ambient noise levels in the area (Sections 5.1 and 5.2). Back-up alarms are discussed in Section 5.3. Blasting noise is not predicted to exceed the Montana DEQ threshold (Section 5.4). Project-related traffic noise is not predicted to exceed MDT’s Leq(h) 66 dBA criterion, or significantly exceed the existing traffic noise levels (Section 5.5). To reduce the Construction and operation noise of the mine sources and proposed mill equipment in the surrounding residential areas, several noise mitigation measures should be considered (Section 6.0).
8.0 REFERENCES American National Standard Institute (ANSI). 1994. Procedures for Outdoor Measurement of Sound Pressure Level. Designation: S12.18-1994. (Reaffirmed 1999). Cavanaugh, William and G.C. Tocci. 2002. “Criteria for Community Acceptance of Outdoor Concert Sound. . . A Progress Report on Continuing Research.” The 2002 International Congress and Exposition on Noise Control Engineering, Dearborn, MI, August 19-21, 2002. Egan, M., 1988. Architectural Acoustics. McGraw-Hill, Inc. Federal Transit Administration (FTA), 2006. Transit Noise and Vibration Impact Assessment. FTA-VA-90-1003-06. Harris, C., ed., 1998. Handbook of Acoustical Measurements and Noise Control. Acoustical Society of America. International Organization for Standardization (ISO). 1996. Attenuation of Sound During Propagation Outdoors, Part 2: General Method of Calculation. Designation: 9613-2. Meagher County. 2014. Meagher County Employee Safety Manual {A25250CA-50C1-11D3-8EA3-0090271BECDD}.
Black Butte Copper Project Big Sky Acoustics, LLC Noise Assessment
Page 17 of 17
Menge, Christopher. 2005. “Assessment of Community Reaction to Proposed Club Racetrack.” Proceedings of the Institute of Noise Control Engineering (INCE) NOISE-CON 2005 Conference, Minneapolis, Minnesota, October 17-19, 2005. Montana Code Annotated, 2014. Title 61. Motor Vehicles, Chapter 9. Vehicle Equipment Part 4. Miscellaneous Regulations. Montana Department of Environmental Quality (DEQ), 2004. Administrative Rules of Montana. Rules, 17.24.624 Surface Blasting Requirements, and 17.24.159 Blasting Operations: Orders of the Department. Montana Department of Transportation (MDT). 2014. Statewide Traffic Count Site Map. http://www.mdt.mt.gov/publications/datastats/traffic_maps.shtml. Traffic Count Site 30-2-1. Viewed on November 19. Montana Department of Transportation (MDT). 2011. Traffic Noise Analysis and Abatement Policy. Tintina Resources (Tintina). 2015. Spreadsheet: Traffic Estimates Rev B Oct 28 2015 (2)bj.xlsx. Project # 735-1591880100. Document # 735-159188010-EST-R0001-B. October 28. U.S. Environmental Protection Agency (EPA). 1978. Protective Noise Levels, Condensed Version of EPA Levels Document. EPA 550/9-79-100 (N-96-01 II-A-86). 9.0 STANDARD OF CARE To complete this report, BSA has endeavored to perform its services consistent with the professional skill and care ordinarily provided by acoustical consultants practicing in similar markets and under similar project conditions. BSA is fully experienced and properly qualified to perform acoustical consulting services. However, acoustical consulting services as offered and engaged in by BSA does not include “engineering” or “practice of engineering” or the “practice or offer to practice engineering” as these phrases are defined under Montana law. BSA makes no warranty, either expressed or implied, as to the professional services it has rendered to complete this report. For the completion of this report, BSA has used data provided by Geomin Resources, Inc. and Tintina Resources, Inc. in performing its services and is entitled to rely upon the accuracy and completeness thereof. Therefore, if the information and assumptions used to create this report change, then the noise analysis and the recommended noise control measures may need to be reevaluated.

FIGURES
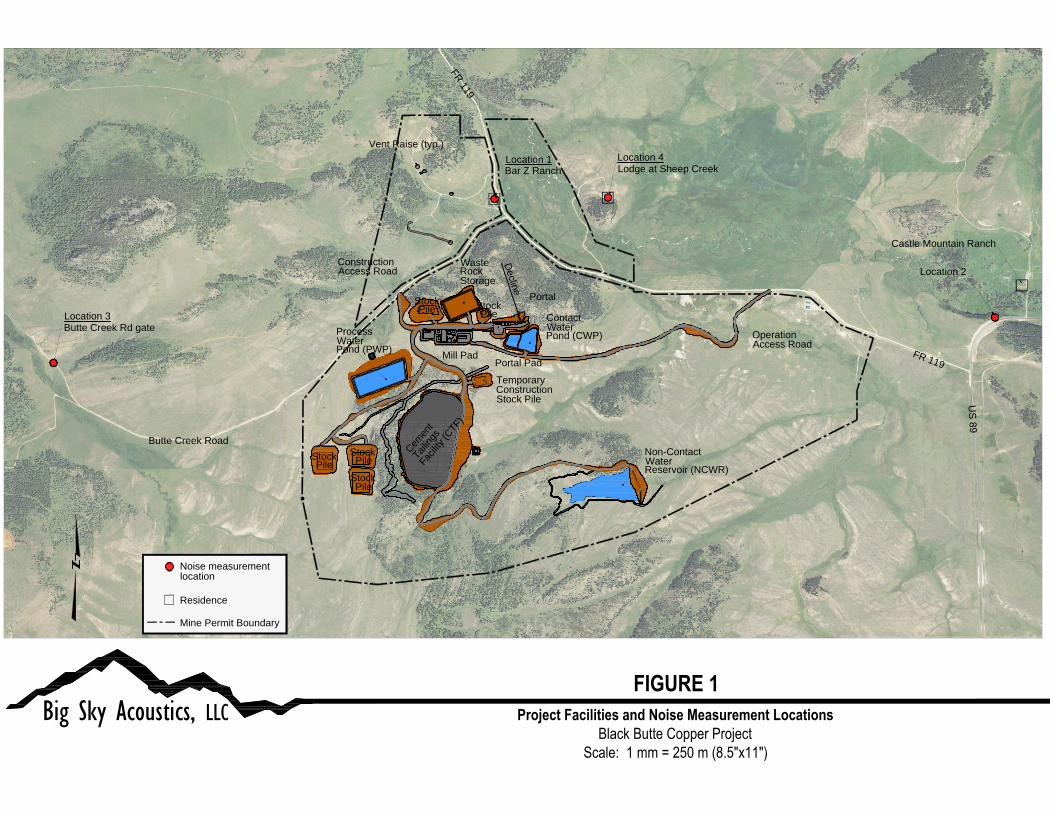
Project Facilities and Noise Measurement LocationsBlack Butte Copper Project
Scale: 1 mm = 250 m (8.5"x11")
Big Sky Acoustics, LLCFIGURE 1
D
e
c
lin
e
Location 4
Portal Pad
Mill Pad
Vent Raise (typ.)
US
89
F
R
1
1
9
Butte Creek Road
Stock
F
R
1
1
9
Water
Portal
Contact
Pond (CWP)
Storage
Rock
Water
Process
Pond (PWP)
T
a
i
l
i
n
g
s
C
e
m
e
n
t
F
a
c
i
l
i
t
y
(
C
T
F
)
Pile
Stock
PileWater
Non-Contact
Reservoir (NCWR)
Lodge at Sheep Creek
Location 1
Bar Z Ranch
Castle Mountain Ranch
Location 3
Butte Creek Rd gate
Access Road
Construction
Access Road
Operation
Location 2
Noise measurement
location
Residence
Mine Permit Boundary
Stock
Pile
Waste
Stock
Pile
Stock
Pile
Construction
Temporary
Stock Pile

Noise Contours (dBA): Construction PhaseBlack Butte Copper Project
Scale: 1 mm = 250 m (8.5"x11")
Big Sky Acoustics, LLCFIGURE 2
Location 4
US
89
F
R
1
1
9
Butte Creek Road
F
R
1
1
9
Lodge at Sheep Creek
Location 1
Bar Z Ranch
Location 3
Butte Creek Rd gate
L
dn
55
L
dn
50
Ld
n
4
5
Ld
n
4
0
Ld
n
3
5
L
d
n
4
5
Ld
n
5
0
L
d
n
4
0
L
d
n
3
5
L
d
n
3
5
L
d
n
3
5
Ld
n
3
0
Castle Mountain Ranch
Location 2
Noise measurement
location
Residence
Mine Permit Boundary
L
d
n
3
0
L
d
n
2
5
L
d
n
35
L
d
n
3
0
Ld
n
4
5
L
d
n
4
0
Ld
n
3
0
L
d
n
2
0
L
d
n
3
5
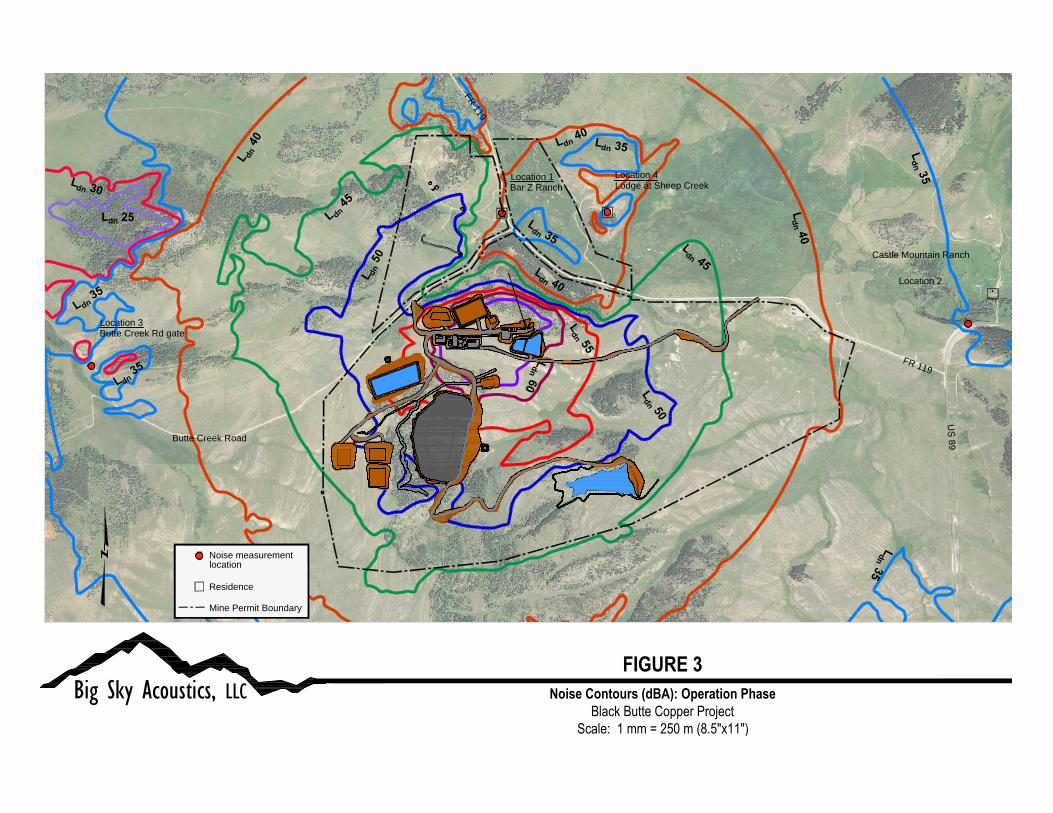
Noise Contours (dBA): Operation PhaseBlack Butte Copper Project
Scale: 1 mm = 250 m (8.5"x11")
Big Sky Acoustics, LLCFIGURE 3
Location 4
US
89
F
R
1
1
9
Butte Creek Road
F
R
1
1
9
Lodge at Sheep Creek
Location 1
Bar Z Ranch
Location 3
Butte Creek Rd gate
L
d
n
5
5
L
d
n
6
0
L
d
n
5
0
L
d
n
4
5
Ld
n
4
0
L
d
n
3
5
Ld
n
3
5
L
d
n
4
0
L
d
n
3
5
L
d
n
5
0
L
d
n
4
5
L
d
n
4
0
L
d
n
3
5
L
dn
25
L
d
n
3
0
L
d
n
3
5
Ld
n
4
0
L
d
n
3
5
Castle Mountain Ranch
Location 2
Noise measurement
location
Residence
Mine Permit Boundary
ATTACHMENT A
Weather Data and Measurement Results

HOUR WIND SPEED WIND DIRECTION WIND DIRECTION TEMPERATURE TEMPERATURE DELTA TEMP SOLAR RADIATION BAR PRESSURE RELATIVE HUMIDITYDATE ENDING 10 METERS 10 METERS STD DEV 10 METERS 9 METERS 2 METERS 9 METER ‐ 2 METER 3 METERS 2 METERS 2 METERS PRECIPITATION
(m/s) (deg) (deg) (deg C) (deg C) (deg C) (watts/m2) (inches) (%) (inches)9/10/2013 1:00:00 AM 1.7 107 22 4.9 4.0 0.90 0 24.56 78.8 No data9/10/2013 2:00:00 AM 1.2 82 41 4.2 3.3 0.87 0 24.56 79.2 No data9/10/2013 3:00:00 AM 1.5 64 29 4.1 3.1 1.08 0 24.56 79.4 No data9/10/2013 4:00:00 AM 1.4 66 40 4.2 3.3 0.90 0 24.56 79.0 No data9/10/2013 5:00:00 AM 1.4 101 31 3.4 2.1 1.32 0 24.56 79.3 No data9/10/2013 6:00:00 AM 1.2 102 59 2.5 1.2 1.25 1 24.57 79.5 No data9/10/2013 7:00:00 AM 0.5 42 59 2.6 1.6 1.03 71 24.58 79.3 No data9/10/2013 8:00:00 AM 1.5 137 19 5.2 5.2 0.00 244 24.60 75.7 No data9/10/2013 9:00:00 AM 0.9 207 68 10.4 10.6 ‐0.18 412 24.60 60.7 No data9/10/2013 10:00:00 AM 0.8 8 65 15.1 15.5 ‐0.45 563 24.60 45.6 No data9/10/2013 11:00:00 AM 2.1 258 68 17.4 17.9 ‐0.52 688 24.59 36.6 No data9/10/2013 12:00:00 PM 3.4 278 31 18.4 19.2 ‐0.81 758 24.59 30.0 No data9/10/2013 1:00:00 PM 3.0 283 43 19.0 19.8 ‐0.83 776 24.59 28.5 No data9/10/2013 2:00:00 PM 2.3 276 51 19.9 20.6 ‐0.72 740 24.58 26.5 No data9/10/2013 3:00:00 PM 2.1 258 54 20.6 21.2 ‐0.63 647 24.57 25.7 No data9/10/2013 4:00:00 PM 1.8 299 56 21.2 21.7 ‐0.55 518 24.56 23.4 No data9/10/2013 5:00:00 PM 1.6 272 37 21.5 21.9 ‐0.34 353 24.55 23.7 No data9/10/2013 6:00:00 PM 1.9 250 16 21.5 21.6 ‐0.09 178 24.56 25.6 No data9/10/2013 7:00:00 PM 2.3 314 74 18.0 17.2 0.79 26 24.57 40.1 No data9/10/2013 8:00:00 PM 3.1 59 29 14.2 13.7 0.46 0 24.59 51.3 No data9/10/2013 9:00:00 PM 1.8 16 31 12.9 11.6 1.35 0 24.61 58.8 No data9/10/2013 10:00:00 PM 2.0 52 42 11.2 10.5 0.76 0 24.62 62.5 No data9/10/2013 11:00:00 PM 1.7 11 33 10.0 8.8 1.17 0 24.63 68.1 No data9/11/2013 12:00:00 AM 2.0 55 26 9.5 8.6 0.89 0 24.64 67.4 No data9/11/2013 1:00:00 AM 1.4 23 36 8.4 7.3 1.03 0 24.65 70.3 No data9/11/2013 2:00:00 AM 1.9 61 31 7.9 6.7 1.16 0 24.65 70.5 No data9/11/2013 3:00:00 AM 1.4 42 69 6.5 5.1 1.31 0 24.66 74.6 No data9/11/2013 4:00:00 AM 1.1 83 68 5.3 4.2 1.08 0 24.67 75.7 No data9/11/2013 5:00:00 AM 1.0 71 48 4.5 3.3 1.19 0 24.67 76.8 No data9/11/2013 6:00:00 AM 1.0 38 49 4.5 3.3 1.21 1 24.68 77.5 No data9/11/2013 7:00:00 AM 1.0 49 40 4.1 3.0 1.11 69 24.70 75.5 No data9/11/2013 8:00:00 AM 0.5 332 96 5.8 6.1 ‐0.23 235 24.72 65.5 No data9/11/2013 9:00:00 AM 0.8 324 61 11.5 11.9 ‐0.40 405 24.72 53.6 No data9/11/2013 10:00:00 AM 1.1 287 49 17.5 17.9 ‐0.41 558 24.72 34.8 No data9/11/2013 11:00:00 AM 2.2 312 72 19.6 20.3 ‐0.64 680 24.72 30.2 No data9/11/2013 12:00:00 PM 3.2 127 37 21.0 21.6 ‐0.57 768 24.71 28.4 No data9/11/2013 1:00:00 PM 3.6 102 25 21.6 22.2 ‐0.62 779 24.71 27.2 No data9/11/2013 2:00:00 PM 3.4 120 33 22.0 22.6 ‐0.65 750 24.71 26.5 No data9/11/2013 3:00:00 PM 3.2 97 36 22.1 22.5 ‐0.43 549 24.71 26.5 No data9/11/2013 4:00:00 PM 3.7 99 24 22.2 22.7 ‐0.43 503 24.71 26.9 No data9/11/2013 5:00:00 PM 4.8 100 15 21.8 22.1 ‐0.28 346 24.71 26.6 No data9/11/2013 6:00:00 PM 4.6 81 14 20.8 20.9 ‐0.11 172 24.71 30.4 No data9/11/2013 7:00:00 PM 4.3 81 9 18.4 18.2 0.20 22 24.72 37.9 No data9/11/2013 8:00:00 PM 4.4 78 8 15.8 15.5 0.38 0 24.73 46.0 No data9/11/2013 9:00:00 PM 4.1 84 10 15.4 14.9 0.50 0 24.74 47.7 No data9/11/2013 10:00:00 PM 4.0 82 7 14.8 13.1 1.76 0 24.74 52.5 No data9/11/2013 11:00:00 PM 4.1 82 4 14.6 11.7 2.85 0 24.75 55.3 No data9/12/2013 12:00:00 AM 2.3 111 37 12.8 11.0 1.74 0 24.75 57.7 No data
METEOROLOGICAL DATA FOR TINTINA MONITORING SITE