appendix h—station garnw - usgs · mllw, mean lower low water; obs, optical backscatterance...
TRANSCRIPT

APPENDIX H—STATION GARNW
Appendix H 93

Station Name: GARNW (West side of Garnet Point) Position: Lat. 38°06'23"
Long. 122°02'53" Depth: 2.4 m (MLLW)
Manufacturer Serial Number Deployment Dates CTD: Ocean Sensors OS200 306 9/18/95(261) - 10/23/95(296)
V: InterOcean S408782105 9/18/95(261) - 10/23/95(296) OBS: D & A OBS3 681 9/18/95(261) - 10/23/95(296)
Serviced: 9/18/95(261), 10/23/95(296)
2.4 m
Surface buoy
Weight 0.58 m
0.69 m
CTDO
V
Figure H1. Configuration of instrument deployment, Station GARNW, September 18 through October 23, 1995, Suisun Bay, California. m, meters; MLLW, mean lower low water; OBS, optical backscatterance sensor; CTDO, conductivity-temperature-depth-optical (backscatterance sensor); V, velocity.
94 Hydrodynamic and Suspended-Solids Concentration Measurements in Suisun Bay, California, 1995

4 T
EM
PE
RA
TU
RE
, IN
DE
GR
ES
S C
EL
SIU
S
DE
PT
H, I
N M
ET
ER
SA
2
0
26
24
22
20
18
16
14
15
B
10
5
0 150 160 170 180 190 200 210 220 230 240 250 260 270 280 290 300
C
DAYS FROM JANUARY 1, 1995
Figure H2. Time-series plots of A, depth; B, temperature; and C, salinity, Station GARNW, September 18 through October 23, 1995, Suisun Bay, California. Salinities in this report are presented without units because salinity is a conductivity ratio; therefore, it has no physical units (Millero, 1993).
SA
LIN
ITY
Appendix H 95

4 T
EM
PE
RA
TU
RE
, IN
DE
GR
ES
S C
EL
SIU
S
DE
PT
H, I
N M
ET
ER
SA
2
0
26
24
22
20
18
16
14
15
B
10
5
0 150 160 170 180 190 200 210 220 230 240 250 260 270 280 290 300
C
DAYS FROM JANUARY 1, 1995
Figure H3. Time-series plots of low-pass-filtered A, depth; B, temperature; and C, salinity, Station GARNW, September 18 through October 23, 1995, Suisun Bay, California. Salinities in this report are presented without units because salinity is a conductivity ratio; therefore, it has no physical units (Millero, 1993).
SA
LIN
ITY
96 Hydrodynamic and Suspended-Solids Concentration Measurements in Suisun Bay, California, 1995
Appendix H 97
150� 160� 170� 180� 190� 200� 210� 220� 230� 240� 250� 260� 270� 280� 290� 300�
DAYS FROM JANUARY 1, 1995�
0�
100�
200�
300�
400�
500�
600�S
US
PE
ND
ED
-SO
LID
S C
ON
CE
NT
RA
TIO
N,
IN M
ILL
IGR
AM
S P
ER
LIT
ER
�
150 160 170 180 190 200 210 220 230 240 250 260 270 280 290 300
DAYS FROM JANUARY 1, 1995
0
10
20
30
40
50
SP
EE
D,
IN C
EN
TIM
ET
ER
S P
ER
SE
CO
ND
B
0
45
90
135
180
225
270
315
360
DIR
EC
TIO
N,
IN D
EG
RE
ES
TR
UE
A
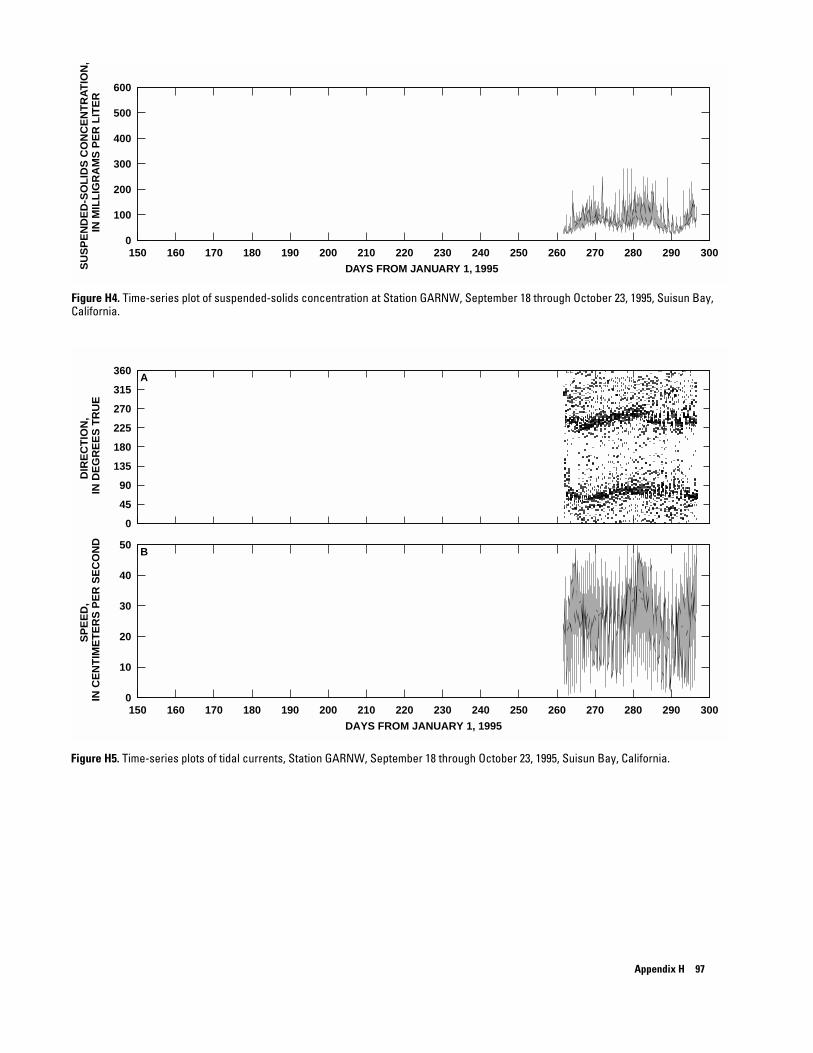
Figure H4. Time-series plot of suspended-solids concentration at Station GARNW, September 18 through October 23, 1995, Suisun Bay, California.
Figure H5. Time-series plots of tidal currents, Station GARNW, September 18 through October 23, 1995, Suisun Bay, California.

RE
SID
UA
L C
UR
RE
NT
VE
LO
CIT
Y,�
R
ES
IDU
AL
CU
RR
EN
T S
PE
ED
,�
IN C
EN
TIM
ET
ER
S P
ER
SE
CO
ND
�
IN C
EN
TIM
ET
ER
S P
ER
SE
CO
ND
�
-30�
-20�
-10�
0�
10�
20�
Transverse speed� Streamwise speed (Positive Upstream)
150� 160� 170� 180� 190� 200� 210� 220� 230� 240� 250� 260� 270� 280� 290� 300 DAYS FROM JANUARY 1, 1995�
Figure H6. Longitudinal and transverse residual currents, Station GARNW, September 18 through October 23, 1995, Suisun Bay, California. Principal direction is 68.7 degrees true.
-30�
-20�
-10�
0�
10�
20�
Sticks angled to the left imply positive transverse velocity
UP�
ESTUARY�
DOWN�
150� 160� 170� 180� 190� 200� 210� 220� 230� 240� 250� 260� 270� 280� 290� 300� DAYS FROM JANUARY 1, 1995�
Figure H7. Residual currents, Station GARNW, September 18 through October 23, 1995, Suisun Bay, California. Principal direction is 68.7 degrees true.
98 Hydrodynamic and Suspended-Solids Concentration Measurements in Suisun Bay, California, 1995

600
500S
US
PE
ND
ED
-SO
LID
S C
ON
CE
NT
RA
TIO
N, I
N M
ILLI
GR
AM
S P
ER
LIT
ER
Number of data points = 18 y = 0.118 *x +
Nonparametric prediction interval: + 24 to Percent prediction interval: + 34 percent to
Nonparametric prediction interval Percent prediction interval
4.8
7 7 percent
400
300
200
100
00 500 1000 1500 2000 2500 3000
SENSOR OUTPUT, IN MILLIVOLTS
Figure H8. Calibration curve for near-bottom optical backscatterance sensor at Station GARNW, September 18 through October 23, 1995, Suisun Bay, California.
Appendix H 99

Table H1. Harmonic analysis results from depth measurements, Station GARNW, September 18 through October 23, 1995, Suisun Bay, California
Station: GARNW Time series mean: 2.68836Standard deviation: 0.08075Harmonic constants: After tidal inference
Mean Local Modified Tidal Cycles amplitude epoch epoch symbol (per day) (meters) (degrees) (degrees) Q1 0.89324 0.04148 130.11626 144.97501 O1 0.92954 0.21381 127.80892 138.31268 M1 0.96645 0.01518 125.48297 131.55748 P1 0.99726 0.11514 123.50592 125.88251 K1 1.00274 0.34787 123.15703 124.87654
Mu2 1.86455 0.01389 335.30704 355.65750 N2 1.89598 0.18791 14.26883 30.84711 Nu2 1.90084 0.03645 14.62994 30.62540 M2 1.93227 0.57861 16.96368 29.18698 L2 1.96857 0.01620 19.65854 27.52682
S2 2.00000 0.17187 58.62034 62.71644 K2 2.00548 0.04675 61.99453 65.43355 M4 3.86455 0.02206 302.08545 326.53198 Mk3 2.93501 0.01815 47.42136 61.36414
Table H2. Harmonic analysis results for velocity, Station GARNW, September 18 through October 23, 1995, Suisun Bay, California [cm/s, centimeters per second; deg.T, degrees true; deg, degrees; E, equilibrium argument]
Station: GARNW Start time of the series (local): Year, 95; Month,10; Day, 24; Hour, 0: 5Record length: 34 M2 Cycle: 3351 data points
Tidal Major axis Minor axis Direction Phase E RotationSymbol (cm/s) (cm/s) (deg. T) (deg) (deg)O1 6.00 2.39 72.7 22.5 52.6 Clockwise
K1 8.70 2.24 70.7 226.9 293.1 ClockwiseN2 4.29 0.02 79.0 6.7 78.4 Counterclockwise
M2 30.11 12.14 68.8 102.4 345.7 ClockwiseS2 8.12 2.02 62.9 252.5 2.7 Clockwise
M4 4.29 0.26 116.0 228.9 331.5 Clockwise
Rootmeansquare speed, (cm/s): Standard deviation, U series (cm/s): Standard deviation, V series (cm/s): Tidal form number: Spring tidal current maximum (cm/s): Neap tidal current maximum (cm/s): Principal current direction (deg. T):
26.826.334.950.38
52.9319.2868.65
100 Hydrodynamic and Suspended-Solids Concentration Measurements in Suisun Bay, California, 1995
APPENDIX I—STATION GC
Appendix I 101

Station Name: GC (Grizzly Bay center)
Position: Lat. 38°07'12" Long. 122°01'34"
Depth: 1.4 m (MLLW)
Manufacturer Serial Number CTD: Ocean Sensors OS200 307
Ocean Sensors OS200 300 V: InterOcean S4 08782107
OBS: D & A OBS3 612
Deployment Dates 7/4/95(185) - 7/21/95(202) 8/1/95(213) - 8/18/95(230) 7/4/95(185) - 8/18/95(230) 7/4/95(185) - 8/18/95(230)
Serviced: 7/4/95(185), 7/14/95(195), 7/17/95(198), 7/21/95(202), 8/1/95(213), 8/9/95(221),8/18/95(230)
1.4 m
Surface buoy
Weight 0.58 m
0.69 m
CTDO
V
Figure I1. Configuration of instrument deployment, Station GC, July 4 through August 18, 1995, Suisun Bay, California. m, meters; MLLW, mean lower low water; OBS, optical backscatterance sensor; CTD, conductivity-temperature-depth; CTDO, conductivity-temperature-depth-optical (backscatterance sensor); V, velocity.
102 Hydrodynamic and Suspended-Solids Concentration Measurements in Suisun Bay, California, 1995

TE
MP
ER
AT
UR
E, �
IN
DE
GR
ES
S C
EL
SIU
S�
D
EP
TH
, IN
ME
TE
RS
�S
AL
INIT
Y�
0�
5�
10�
15� C
14�
16�
18�
20�
22�
24�
26� B
0�
2�
4� A
150� 160� 170� 180� 190� 200� 210� 220� 230� 240� 250� 260� 270� 280� 290� 300�
DAYS FROM JANUARY 1, 1995�
Figure I2. Time-series plots of A, depth; B, temperature; and C, salinity, Station GC, July 4 through August 18, 1995, Suisun Bay, California. Salinities in this report are presented without units because salinity is a conductivity ratio; therefore, it has no physical units (Millero, 1993).
Appendix I 103

TE
MP
ER
AT
UR
E, �
IN
DE
GR
ES
S C
EL
SIU
S�
D
EP
TH
, IN
ME
TE
RS
�S
AL
INIT
Y�
0�
5�
10�
15� C
14�
16�
18�
20�
22�
24�
26� B
0�
2�
4� A
150� 160� 170� 180� 190� 200� 210� 220� 230� 240� 250� 260� 270� 280� 290� 300�
DAYS FROM JANUARY 1, 1995�
Figure I3. Time-series plots of low-pass-filtered A, depth; B, temperature; and C, salinity, Station GC, July 4 through August 18, 1995, Suisun Bay, California. Salinities in this report are presented without units because salinity is a conductivity ratio; therefore, it has no physical units (Millero, 1993).
104 Hydrodynamic and Suspended-Solids Concentration Measurements in Suisun Bay, California, 1995

Appendix I 105
150� 160� 170� 180� 190� 200� 210� 220� 230� 240� 250� 260� 270� 280� 290� 300�
DAYS FROM JANUARY 1, 1995�
0�
100�
200�
300�
400�
500�
600�
SU
SP
EN
DE
D-S
OL
IDS
CO
NC
EN
TR
AT
ION
, IN
MIL
LIG
RA
MS
PE
R L
ITE
R�
150 160 170 180 190 200 210 220 230 240 250 260 270 280 290 300
DAYS FROM JANUARY 1, 1995
0
10
20
30
40
50
SP
EE
D,
IN C
EN
TIM
ET
ER
S P
ER
SE
CO
ND
B
0
45
90
135
180
225
270
315
360
DIR
EC
TIO
N,
IN D
EG
RE
ES
TR
UE
A
Figure I4. Time-series plot of suspended-solids concentration at Station GC, July 4 through August 18, 1995, Suisun Bay, California.
Figure I5. Time-series plots of tidal currents, Station GC, July 4 through August 18, 1995, Suisun Bay, California.
20
10
0
-10
-20
-30 150 160 170 180 190 200 210 220 230 240 250 260 270 280 290 300
DAYS FROM JANUARY 1, 1995
Transverse speed Streamwise speed (positive upstream)
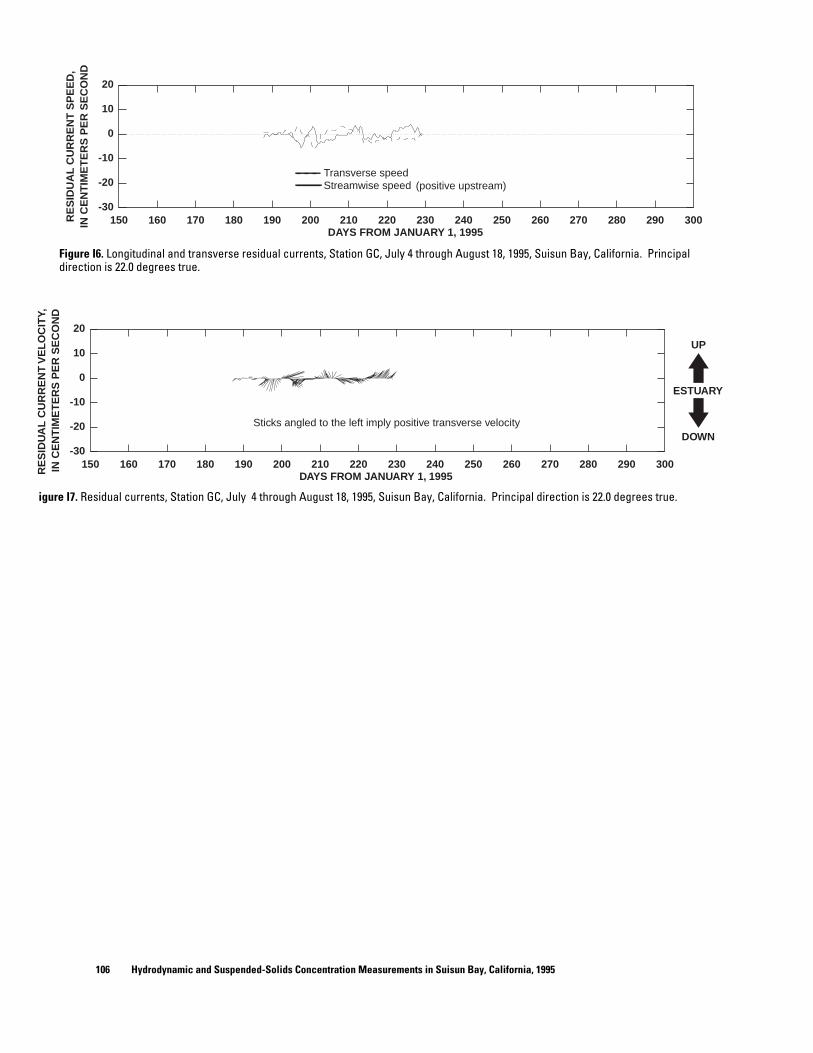
Figure I6. Longitudinal and transverse residual currents, Station GC, July 4 through August 18, 1995, Suisun Bay, California. Principal direction is 22.0 degrees true.
20
Sticks angled to the left imply positive transverse velocity
UP 10
0 ESTUARY
-10
-20 DOWN
-30 150 160 170 180 190 200 210 220 230 240 250 260 270 280 290 300
DAYS FROM JANUARY 1, 1995
igure I7. Residual currents, Station GC, July 4 through August 18, 1995, Suisun Bay, California. Principal direction is 22.0 degrees true.
RE
SID
UA
L C
UR
RE
NT
SP
EE
D,
IN C
EN
TIM
ET
ER
S P
ER
SE
CO
ND
RE
SID
UA
L C
UR
RE
NT
VE
LO
CIT
Y,
IN C
EN
TIM
ET
ER
S P
ER
SE
CO
ND
106 Hydrodynamic and Suspended-Solids Concentration Measurements in Suisun Bay, California, 1995

300
250S
US
PE
ND
ED
-SO
LID
S C
ON
CE
NT
RA
TIO
N, I
N M
ILLI
GR
AM
S P
ER
LIT
ER
Number of data points = 7 y = 0.164 *x
Nonparametric prediction interval: + 14 to 10 Percent prediction interval: + 15 percent to 15 percent
Nonparametric prediction interval Percent prediction interval
30.7
200
150
100
50
0400 600 800 1000 1200 1400 1600 1800
SENSOR OUTPUT, IN MILLIVOLTS
Figure I8. Calibration curve for near-bottom optical backscatterance sensor, Station GC, July 4 through August 18, 1995, Suisun Bay, California.
Appendix I 107

�
�
�
Table I1. Harmonic analysis results from depth measurements, Station GC, July 4 through August 18, 1995, Suisun Bay, California
Station: GC Time series mean: 1.74757Standard deviation: 0.14012Harmonic constants: After tidal inference
Mean Local Modified Tidal Cycles amplitude epoch epoch symbol (per day) (meters) (degrees) (degrees) Q1 0.89324 0.03844 124.40237 139.23920 O1 0.92954 0.19814 123.83319 134.31500 M1 0.96645 0.01407 123.25940 129.31195 P1 0.99726 0.09424 122.77170 125.12634 K1 1.00274 0.28471 122.68564 124.38321
Mu2 1.86455 0.01207 297.89734 318.20389 N2 1.89598 0.02384 55.55090 72.08527 Nu2 1.90084 0.00462 47.94794 63.89948 M2 1.93227 0.50293 358.81238 10.99176 L2 1.96857 0.01408 302.07385 309.89825
S2 2.00000 0.12362 59.72741 63.77961 K2 2.00548 0.03362 64.66152 68.05665 M4 3.86455 0.02986 282.91504 307.27377 Mk3 2.93501 0.03335 42.76810 56.64502
Table I2. Harmonic analysis results for velocity, Station GC, July 4 through August 18, 1995, Suisun Bay, California [cm/s, centimeters per second; deg.T, degrees true; deg, degrees; E, equilibrium argument]
Station: GC �y, �Start time of the series (local): Year, 95; Month, 8; Da� 1; Hour, 0: 5�
Record length: 42 M2 Cycle: 4175 dat�a points�
Tidal Major axis Minor axis Direction Phase E � Rotation�Symbol (cm/s) (cm/s) (deg. �T) (deg) (deg)�O1 2.06 0.48 25.7 234.4 23.5 ��Clockwise�
K1 3.68 0.60 29.2 232.4 210.4 ��Clockwise�N2 1.32 0.39 176.0 116.1 343.9 ��Counterclockwise�
M2 10.48 2.02 21.3 297.2 233.7 ��Clockwise�S2 2.42 0.10 11.2 255.7 2.7 ��Clockwise�
M4 1.52 0.38 25.2 195.6 107.4 ��Counterclockwise�
Rootmeansquare speed, (cm/s): � 9.92�Standard deviation, U series (cm/s): � 3.14�Standard deviation, V series (cm/s): � 3.51�Tidal form number: � 0.44�Spring tidal current maximum (cm/s): � 18.63�Neap tidal current maximum (cm/s): � 6.43�Principal current direction (deg. T): � 22.01�
108 Hydrodynamic and Suspended-Solids Concentration Measurements in Suisun Bay, California, 1995

APPENDIX J—STATION GDOL
Appendix J 109

Station Name: GDOL (Grizzly Bay at the dolphin)
Position: Lat. 38°07'01" Long. 122°02'26"
Depth: 1.7 m (MLLW)
Manufacturer Serial Number Deployment Dates CT: Seacat NA 7/17/95(198) - 9/18/95(261)
CTD: Ocean Sensors OS200 306 7/17/95(198) - 9/18/95(261) V: InterOcean S4 08782105 7/06/95(187) - 9/18/95(261)
OBS: D & A OBS3 681 7/17/95(198) - 9/18/95(261)
187), 7/11/95(192),7/17/95(198), 7/26/95(207), 8/3/95(215), 8/10/95(222), 9/18/95(261)
1.7 m
Surface buoy
Weight 0.58 m
0.69 m
CTDO
V
Dolphin
CT
Figure J1. Configuration of instrument deployment, Station GDOL, July 6 through September 18, 1995, Suisun Bay, California. m, meters; MLLW, mean lower low water; OBS, optical backscatterance sensors; CT, conductivity-temperature; CTD, conductivity-temperature-depth; CTDO, conductivity-temperature-depth-optical (backscatterance sensor); V, velocity.
110 Hydrodynamic and Suspended-Solids Concentration Measurements in Suisun Bay, California, 1995

TE
MP
ER
AT
UR
E, �
IN
DE
GR
ES
S C
EL
SIU
S�
D
EP
TH
, IN
ME
TE
RS
�S
AL
INIT
Y�
0�
5�
10�
15� C
14�
16�
18�
20�
22�
24�
26� B
0�
2�
4� A
150� 160� 170� 180� 190� 200� 210� 220� 230� 240� 250� 260� 270� 280� 290� 300�
DAYS FROM JANUARY 1, 1995�
Figure J2. Time-series plots of A, depth; B, temperature; and C, salinity, Station GDOL, July 17 through September 18, 1995, Suisun Bay, California. Salinities in this report are presented without units because salinity is a conductivity ratio; therefore, it has no physical units (Millero, 1993).
Appendix J 111

TE
MP
ER
AT
UR
E, �
IN
DE
GR
ES
S C
EL
SIU
S�
D
EP
TH
, IN
ME
TE
RS
�S
AL
INIT
Y�
0�
5�
10�
15� C
14�
16�
18�
20�
22�
24�
26� B
0�
2�
4� A
150� 160� 170� 180� 190� 200� 210� 220� 230� 240� 250� 260� 270� 280� 290� 300�
DAYS FROM JANUARY 1, 1995�
Figure J3. Time-series plots of low-pass-filtered A, depth; B, temperature; and C, salinity, Station GDOL, July 17 through September 18, 1995, Suisun Bay, California. Salinities in this report are presented without units because salinity is a conductivity ratio; therefore, it has no physical units (Millero, 1993).
112 Hydrodynamic and Suspended-Solids Concentration Measurements in Suisun Bay, California, 1995

150� 160� 170� 180� 190� 200� 210� 220� 230� 240� 250� 260� 270� 280� 290� 300�
DAYS FROM JANUARY 1, 1995�
Figure J4. Time-series plot of suspended-solids concentration at Station GDOL, July 17 through September 18, 1995, Suisun Bay, California.
14�
16�
18�
20�
22�
24�
26� A
0�
5�
10�
15� B
150� 160� 170� 180� 190� 200� 210� 220� 230� 240� 250� 260� 270� 280� 290� 300�
DAYS FROM JANUARY 1, 1995�
Figure J5. Time-series plots of A, temperature; and B, salinity, Station GDOL (collected by National Oceanic and Atmospheric Administration), April 30 through November 3, 1995, Suisun Bay, California. Salinities in this report are presented without units because salinity is a conductivity ratio; therefore, it has no physical units (Millero, 1993).
TE
MP
ER
AT
UR
E, �
S
US
PE
ND
ED
-SO
LID
S C
ON
CE
NT
RA
TIO
N,
IN M
ILL
IGR
AM
S P
ER
LIT
ER
�
0�
100�
200�
300�
400�
500�
600� IN
DE
GR
ES
S C
EL
SIU
S�
SA
LIN
ITY
�
Appendix J 113

TE
MP
ER
AT
UR
E, �
IN
DE
GR
ES
S C
EL
SIU
S�
0�
5�
10�
15� B
14�
16�
18�
20�
22�
24�
26� A
SA
LIN
ITY
�
150� 160� 170� 180� 190� 200� 210� 220� 230� 240� 250� 260� 270� 280� 290� 300�
DAYS FROM JANUARY 1, 1995�
Figure J6. Time-series plots of low-pass-fitered A, temperature; and B, salinity, Station GDOL (collected by National Oceanic and Atmospheric Administration), April 30 through November 3, 1995, Suisun Bay, California. Salinities in this report are presented without units because salinity is a conductivity ratio; therefore, it has no physical units (Millero, 1993).
114 Hydrodynamic and Suspended-Solids Concentration Measurements in Suisun Bay, California, 1995

Appendix J 115
150 160 170 180 190 200 210 220 230 240 250 260 270 280 290 300-30
-20
-10
0
10
20
DAYS FROM JANUARY 1, 1995
RE
SID
UA
L C
UR
RE
NT
SP
EE
D,
IN C
EN
TIM
ET
ER
S P
ER
SE
CO
ND
Transverse speedStreamwise speed (positive upstream)
Figure J7. Time-series plots of tidal currents, Station GDOL, July 6 through September 18, 1995, Suisun Bay, California.
150� 160� 170� 180� 190� 200� 210� 220� 230� 240� 250� 260� 270� 280� 290� 300�
DAYS FROM JANUARY 1, 1995�
0�
10�
20�
30�
40�
50�
SP
EE
D, �
IN C
EN
TIM
ET
ER
S P
ER
SE
CO
ND
�
B
0�
45�
90�
135�
180�
225�
270�
315�
360�D
IRE
CT
ION
, � IN
DE
GR
EE
S T
RU
E�
A
Figure J8. Longitudinal and transverse residual currents, Station GDOL, July 6 through September 18, 1995, Suisun Bay, California. Principal direction is 11.8 degrees true.

10
0
RE
SID
UA
L C
UR
RE
NT
VE
LO
CIT
Y,
IN C
EN
TIM
ET
ER
S P
ER
SE
CO
ND
20
Sticks angled to the left imply positive transverse velocity
UP
ESTUARY
DOWN
-10
-20
-30 150 160 170 180 190 200 210 220 230 240 250 260 270 280 290 300
DAYS FROM JANUARY 1, 1995
Figure J9. Residual currents, Station GDOL, July 6 through September 18, 1995, Suisun Bay, California. Principal direction is 11.8 degrees true.
SU
SP
EN
DE
DS
OLI
DS
CO
NC
EN
TR
ATIO
N, I
N M
ILLI
GR
AM
S P
ER
LIT
ER
�
0�
100�
200�
300�
400�
500�
600�
Number of data points = 18� y = 0.118 *x +
Nonparametric prediction interval: + 24 to Percent prediction interval: + 34 percent to
Nonparametric prediction interval� Percent prediction interval
4.8�
7� 7 percent�
�
0� 500� 1000� 1500� 2000� 2500� 3000� SENSOR OUTPUT, IN MILLIVOLTS�
Figure J10. Calibration curve for near-bottom optical backscatterance sensor, Station GDOL, July 17 through September 18, 1995, Suisun Bay, California.
116 Hydrodynamic and Suspended-Solids Concentration Measurements in Suisun Bay, California, 1995

�
�
�
Table J1. Harmonic analysis results from depth measurements, Station GDOL, July 17 through September 18, 1995, Suisun Bay, California
Station: GDOL Time series mean: 1.17272Standard deviation: 0.10201Harmonic constants: After tidal inference
Mean Local Modified Tidal Cycles amplitude epoch epoch symbol (per day) (meters) (degrees) (degrees) Q1 0.89324 0.03816 106.71735 121.56860 O1 0.92954 0.19671 110.32547 120.82175 M1 0.96645 0.01397 113.96271 120.02972 P1 0.99726 0.09306 117.05432 119.42340 K1 1.00274 0.28114 117.59991 119.31192
Mu2 1.86455 0.01351 316.84509 337.18054 N2 1.89598 0.12963 15.80200 32.36530 Nu2 1.90084 0.02515 12.19940 28.17987 M2 1.93227 0.56295 348.91711 1.12543 L2 1.96857 0.01576 322.03223 329.88550
S2 2.00000 0.18755 20.98914 25.07025 K2 2.00548 0.05101 23.58698 27.01099 M4 3.86455 0.01582 252.44177 276.85831 Mk3 2.93501 0.03680 49.45427 63.37456
Table J2. Harmonic analysis results for velocity, Station GDOL, July 6 through September 18, 1995, Suisun Bay, California [cm/s, centimeters per second; deg.T, degrees true; deg, degrees; E, equilibrium argument]
Station: GDOL �Start time of the series (local): Year, 95; Month, 8; Da�y, 3; Hour, 0: 3�Record length: 68 M2 Cycle: 6697 dat�a points�
Tidal Major axis Minor axis Direction Phase Symbol (cm/s) (cm/s) (deg. �T) (deg) O1 4.07 0.48 22.4 185.3
K1 7.56 0.84 15.6 218.2 N2 3.94 0.89 12.0 213.9
M2 19.67 2.91 9.3 215.3 S2 4.30 1.10 6.5 233.7
M4 1.29 0.46 176.2 188.5
Rootmeansquare speed, (cm/s): � 17.34�Standard deviation, U series (cm/s): � 3.38�Standard deviation, V series (cm/s): � 4.94�Tidal form number: � 0.48�Spring tidal current maximum (cm/s): � 35.60�Neap tidal current maximum (cm/s): � 11.87�Principal current direction (deg. T): � 11.77�
E � Rotation�(deg)�332.3 �Clockwise�
211.9 �Clockwise�268.1 �Clockwise�
184.1 �Clockwise�1.8 �Clockwise�
8.2 ��Counterclockwise�
Appendix J 117

THIS PAGE LEFT BLANK INTENTIONALLY

APPENDIX K—STATION GS
Appendix K 119

Station Name: GS (Grizzly Bay East side)
Position: Lat. 38°06'28" Long. 122°01'22"
Depth: 1.2 m (MLLW)
Manufacturer Serial Number Deployment Dates CTD: Ocean Sensors OS200 305 7/6/95(187) - 9/18/95(261)
V: InterOcean S408782106 7/6/95(187) - 9/18/95(261) OBS: D & A OBS3 683 7/6/95(187) - 9/18/95(261)
Serviced: 7/6/95(187), 7/14/95(195), 7/20/95(201), 7/26/95(207), 8/2/95(214), 8/9/95(221), 8/12/95(224), 8/22/95(234), 9/18/95(261)
1.2 m
Surface buoy
Weight 0.58 m
0.69 m
CTDO
V
Figure K1. Configuration of instrument deployment, Station GS, July 6 through September 18, 1995, Suisun Bay, California. m, meters; MLLW, mean lower low water; OBS, optical backscatterance sensor; CTD, conductivity-temperature-depth; CTDO,conductivity-temperature-depth-optical (backscatterance sensor); V, velocity.
120 Hydrodynamic and Suspended-Solids Concentration Measurements in Suisun Bay, California, 1995

TE
MP
ER
AT
UR
E, �
S
AL
INIT
Y�
IN
DE
GR
ES
S C
EL
SIU
S�
D
EP
TH
, IN
ME
TE
RS
�
0�
5�
10�
15� C
14�
16�
18�
20�
22�
24�
26� B
0�
2�
4� A
150� 160� 170� 180� 190� 200� 210� 220� 230� 240� 250� 260� 270� 280� 290� 300�
DAYS FROM JANUARY 1, 1995�
Figure K2. Time-series plots of A, depth; B, temperature; and C, salinity, Station GS, July 6 through September 18, 1995, Suisun Bay, California. Salinities in this report are presented without units because salinity is a conductivity ratio; therefore, it has no physical units (Millero, 1993).
Appendix K 121

TE
MP
ER
AT
UR
E, �
IN
DE
GR
ES
S C
EL
SIU
S�
D
EP
TH
, IN
ME
TE
RS
�S
AL
INIT
Y�
0�
5�
10�
15� C
14�
16�
18�
20�
22�
24�
26� B
0�
2�
4� A
150� 160� 170� 180� 190� 200� 210� 220� 230� 240� 250� 260� 270� 280� 290� 300�
DAYS FROM JANUARY 1, 1995�
Figure K3. Time-series plots of low-pass-filtered A, depth; B, temperature; and C, salinity, Station GS, July 6 through September 18, 1995, Suisun Bay, California. Salinities in this report are presented without units because salinity is a conductivity ratio; therefore, it has no physical units (Millero, 1993).
122 Hydrodynamic and Suspended-Solids Concentration Measurements in Suisun Bay, California, 1995

Appendix K 123
150� 160� 170� 180� 190� 200� 210� 220� 230� 240� 250� 260� 270� 280� 290� 300�
DAYS FROM JANUARY 1, 1995�
0�
100�
200�
300�
400�
500�
600�
SU
SP
EN
DE
D-S
OL
IDS
CO
NC
EN
TR
AT
ION
, IN
MIL
LIG
RA
MS
PE
R L
ITE
R�
150 160 170 180 190 200 210 220 230 240 250 260 270 280 290 300
DAYS FROM JANUARY 1, 1995
0
10
20
30
40
50
SP
EE
D,
IN C
EN
TIM
ET
ER
S P
ER
SE
CO
ND
B
0
45
90
135
180
225
270
315
360
DIR
EC
TIO
N,
IN D
EG
RE
ES
TR
UE
A
Figure K4. Time-series plot of suspended-solids concentration at Station GS, July 6 through September 18, 1995, Suisun Bay, California.
Figure K5. Time-series plots of tidal currents, Station GS, July 6 through September 18, 1995, Suisun Bay, California.

20
10
0
-10
-20
-30 150 160 170 180 190 200 210 220 230 240 250 260 270 280 290 300
DAYS FROM JANUARY 1, 1995
Transverse speed Streamwise speed (positive upstream)
Figure K6. Longitudinal and transverse residual currents, Station GS, July 6 through September 18, 1995, Suisun Bay, California. Principal direction is 58.9 degrees true.
20
Sticks angled to the left imply positive transverse velocity
UP 10
0 ESTUARY
-10
-20 DOWN
-30 150 160 170 180 190 200 210 220 230 240 250 260 270 280 290 300
DAYS FROM JANUARY 1, 1995
Figure K7. Residual currents, Station GS, July 6 through September 18, 1995, Suisun Bay, California. Principal direction is 58.9 degrees true.
RE
SID
UA
L C
UR
RE
NT
VE
LO
CIT
Y,
RE
SID
UA
L C
UR
RE
NT
SP
EE
D,
IN C
EN
TIM
ET
ER
S P
ER
SE
CO
ND
IN
CE
NT
IME
TE
RS
PE
R S
EC
ON
D
124 Hydrodynamic and Suspended-Solids Concentration Measurements in Suisun Bay, California, 1995

SU
SP
EN
DE
DS
OLI
DS
CO
NC
EN
TR
ATIO
N, I
N M
ILLI
GR
AM
S P
ER
LIT
ER
�
0�
20�
40�
60�
80�
100�
120�
140�
160�
180�
Number of data points = 21� y = 0.155 *x
Nonparametric prediction interval: + Percent prediction interval: +
Nonparametric prediction interval� Percent prediction interval
1.3�
7� 6 to 9 percent to 11 percent�
�
200� 300� 400� 500� 600� 700� 800� 900� SENSOR OUTPUT, IN MILLIVOLTS�
Figure K8. Calibration curve for near-bottom optical backscatterance sensor, Station GS, July 6 through September 18, 1995, Suisun Bay, California.
Appendix K 125

�
�
�
Table K1. Harmonic analysis results from depth measurements, Station GS, July 6 through September 18, 1995, Suisun Bay, California
Station: GS Time series mean: 1.19368Standard deviation: 0.10221Harmonic constants: After tidal inference
Mean Local Modified Tidal Cycles amplitude epoch epoch symbol (per day) (meters) (degrees) (degrees) Q1 0.89324 0.03647 129.36859 144.20209 O1 0.92954 0.18798 131.93564 142.41412 M1 0.96645 0.01335 134.52338 140.57260 P1 0.99726 0.09449 136.72299 139.07431 K1 1.00274 0.28548 137.11115 138.80539
Mu2 1.86455 0.01275 339.22406 359.52396 N2 1.89598 0.06253 56.15903 72.68675 Nu2 1.90084 0.01213 51.72733 67.67224 M2 1.93227 0.53117 23.08667 35.25940 L2 1.96857 0.01487 350.01431 357.83203
S2 2.00000 0.14941 66.94928 70.99481 K2 2.00548 0.04064 70.50214 73.89063 M4 3.86455 0.03203 331.49387 355.83929 Mk3 2.93501 0.03974 103.98887 117.85584
Table K2. Harmonic analysis results for velocity, Station GS, July 6 through September 18, 1995, Suisun Bay, California [cm/s, centimeters per second; deg.T, degrees true; deg, degrees; E, equilibrium argument]
Station: GS �Start time of the series (local): Year, 0; Month, 0; Da�y, 0; Hour, 0: 0�Record length: 73 M2 Cycle: 7196 dat�a points�
Tidal Major axis Minor axis Direction Phase Symbol (cm/s) (cm/s) (deg. �T) (deg) O1 2.88 0.92 73.1 229.6
K1 3.90 2.03 69.5 351.8 N2 3.06 1.20 48.8 312.6
M2 16.23 7.76 56.8 32.4 S2 4.27 2.14 47.8 184.2
M4 3.26 0.35 171.6 218.2
Rootmeansquare speed, (cm/s): � 17.17�Standard deviation, U series (cm/s): � 5.55�Standard deviation, V series (cm/s): � 5.95�Tidal form number: � 0.33�Spring tidal current maximum (cm/s): � 27.27�Neap tidal current maximum (cm/s): � 10.95�Principal current direction (deg. T): � 58.92�
E � Rotation�(deg)�25.4 �Clockwise�
359.0 �Clockwise�37.4 �Clockwise�
24.4 �Clockwise�0.0 �Clockwise�
48.8 ��Counterclockwise�
126 Hydrodynamic and Suspended-Solids Concentration Measurements in Suisun Bay, California, 1995

APPENDIX L—STATION HC
Appendix L 127

Station Name: HC (Honker Bay center)
° Position: Lat. 38 04'26" Long. 121°55'45"
Depth: 0.9 m (MLLW)
Manufacturer Serial Number Deployment Dates CTD: Ocean Sensors OS200 303 7 /28/95(209) - 10/24/95(297)
V: InterOcean S408782108 7/9/95(190) - 10/24/95(297) OBS: D & A OBS3 679 7/28/95(209) - 10/24/95(297)
Serviced: 7/9/95(190), 7/28/95(209), 8/2/95(214), 8/10/95(222), 8/23/95(235), 9/18/95(261), 10/24/95(297)
0.9 m
Surface buoy
Weight 0.58 m
0.69 m
CTDO
V
Figure L1. Configuration of instrument deployment, Station HC, July 9 through October 24, 1995, Suisun Bay, California. m, meters; MLLW, mean lower low water; OBS, optical backscatterance sensor; CTD, conductivity-temperature-depth; CTDO, conductivity-temperature-depth-optical (backscatterance sensor); V, velocity.
128 Hydrodynamic and Suspended-Solids Concentration Measurements in Suisun Bay, California, 1995

4 T
EM
PE
RA
TU
RE
, IN
DE
GR
ES
S C
EL
SIU
S
DE
PT
H, I
N M
ET
ER
SA
2
0
26
24
22
20
18
16
14
15
B
10
5
0 150 160 170 180 190 200 210 220 230 240 250 260 270 280 290 300
C
DAYS FROM JANUARY 1, 1995
Figure L2. Time-series plots of A, depth; B, temperature; and C, salinity, Station HC, July 28 through October 24, 1995, Suisun Bay, California. Salinities in this report are presented without units because salinity is a conductivity ratio; therefore, it has no physical units (Millero, 1993).
SA
LIN
ITY
Appendix L 129

4 T
EM
PE
RA
TU
RE
, IN
DE
GR
ES
S C
EL
SIU
S
DE
PT
H, I
N M
ET
ER
SA
2
0
26
24
22
20
18
16
14
15
B
10
5
0 150 160 170 180 190 200 210 220 230 240 250 260 270 280 290 300
C
DAYS FROM JANUARY 1, 1995
Figure L3. Time-series plots of low-pass-filtered A, depth; B, temperature; and C, salinity, Station HC, July 28 through October 24, 1995, Suisun Bay, California. Salinities in this report are presented without units because salinity is a conductivity ratio; therefore, it has no physical units (Millero, 1993).
SA
LIN
ITY
130 Hydrodynamic and Suspended-Solids Concentration Measurements in Suisun Bay, California, 1995

Appendix L 131
150� 160� 170� 180� 190� 200� 210� 220� 230� 240� 250� 260� 270� 280� 290� 300�
DAYS FROM JANUARY 1, 1995�
0�
100�
200�
300�
400�
500�
600�S
US
PE
ND
ED
-SO
LID
S C
ON
CE
NT
RA
TIO
N,
IN M
ILL
IGR
AM
S P
ER
LIT
ER
�
150� 160� 170� 180� 190� 200� 210� 220� 230� 240� 250� 260� 270� 280� 290� 300�
DAYS FROM JANUARY 1, 1995�
0�
10�
20�
30�
40�
50�
SP
EE
D, �
IN C
EN
TIM
ET
ER
S P
ER
SE
CO
ND
�
B
0�
45�
90�
135�
180�
225�
270�
315�
360�
DIR
EC
TIO
N, �
IN D
EG
RE
ES
TR
UE
�
A
Figure L4. Time-series plot of suspended-solids concentration at Station HC, July 28 through October 24, 1995, Suisun Bay, California.
Figure L5. Time-series plots of tidal currents, Station HC, July 9 through October 24, 1995, Suisun Bay, California.

RE
SID
UA
L C
UR
RE
NT
VE
LO
CIT
Y,
IN C
EN
TIM
ET
ER
S P
ER
SE
CO
ND
R
ES
IDU
AL
CU
RR
EN
T S
PE
ED
,20
10
0
-10
-20
-30 150 160 170 180 190 200 210 220 230 240 250 260 270 280 290 300
DAYS FROM JANUARY 1, 1995
Transverse speed Streamwise speed (positive upstream)
Figure L6. Longitudinal and transverse residual currents, Station HC, July 9 through October 24, 1995, Suisun Bay, California. Principal direction is 80.9 degrees true.
20
Sticks angled to the left imply positive transverse velocity
UP 10
0 ESTUARY
-10
-20 DOWN
-30 150 160 170 180 190 200 210 220 230 240 250 260 270 280 290 300
DAYS FROM JANUARY 1, 1995
Figure L7. Residual currents, Station HC, July 9 through October 24, 1995, Suisun Bay, California. Principal direction is 80.9 degrees true.
IN C
EN
TIM
ET
ER
S P
ER
SE
CO
ND
132 Hydrodynamic and Suspended-Solids Concentration Measurements in Suisun Bay, California, 1995

SU
SP
EN
DE
DS
OLI
DS
CO
NC
EN
TR
ATIO
N, I
N M
ILLI
GR
AM
S P
ER
LIT
ER
�
0�
20�
40�
60�
80�
100�
120�
140�
Number of data points = 16� y = 0.170 *x
Nonparametric prediction interval: + 12 to Percent prediction interval: + 31 percent to
Nonparametric prediction interval� Percent prediction interval
0.4�
4� 5 percent�
�
100� 200� 300� 400� 500� 600� 700� SENSOR OUTPUT, IN MILLIVOLTS�
Figure L8. Calibration curve for near-bottom optical backscatterance sensor, Station HC, July 28 through October 24, 1995, Suisun Bay, California.
Appendix L 133
�
�
�
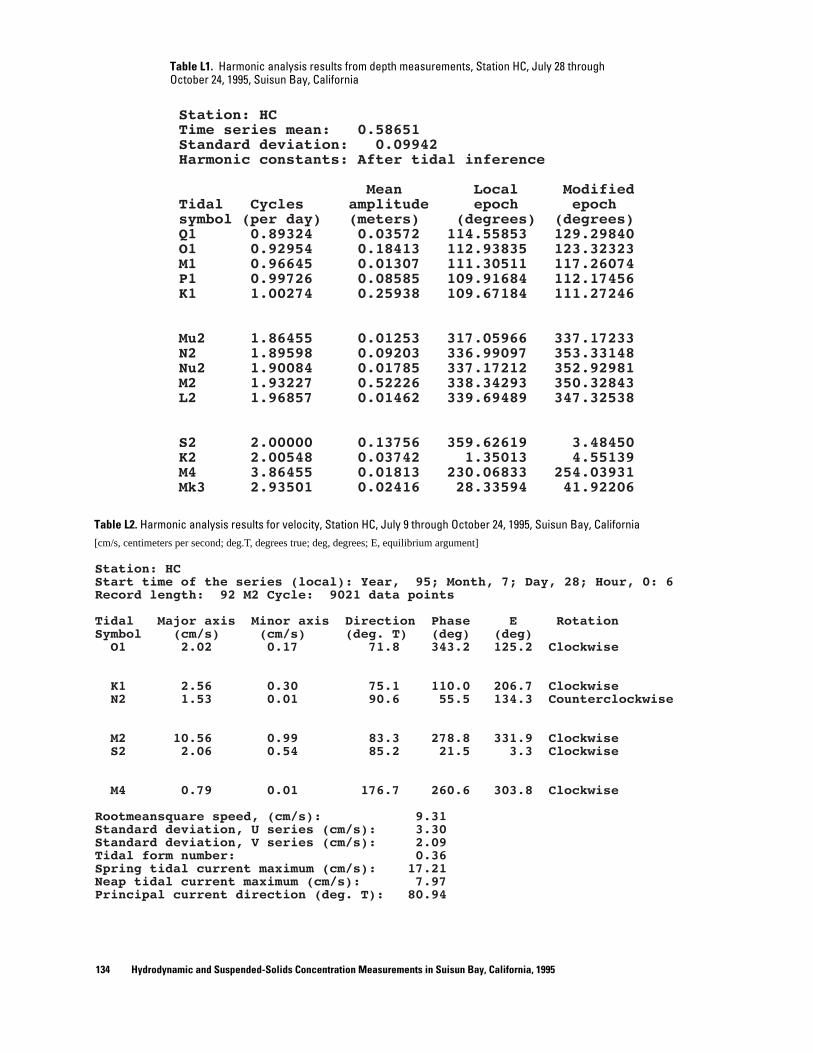
Table L1. Harmonic analysis results from depth measurements, Station HC, July 28 through October 24, 1995, Suisun Bay, California
Station: HC Time series mean: 0.58651Standard deviation: 0.09942Harmonic constants: After tidal inference
Mean Local Modified Tidal Cycles amplitude epoch epoch symbol (per day) (meters) (degrees) (degrees) Q1 0.89324 0.03572 114.55853 129.29840 O1 0.92954 0.18413 112.93835 123.32323 M1 0.96645 0.01307 111.30511 117.26074 P1 0.99726 0.08585 109.91684 112.17456 K1 1.00274 0.25938 109.67184 111.27246
Mu2 1.86455 0.01253 317.05966 337.17233 N2 1.89598 0.09203 336.99097 353.33148 Nu2 1.90084 0.01785 337.17212 352.92981 M2 1.93227 0.52226 338.34293 350.32843 L2 1.96857 0.01462 339.69489 347.32538
S2 2.00000 0.13756 359.62619 3.48450 K2 2.00548 0.03742 1.35013 4.55139 M4 3.86455 0.01813 230.06833 254.03931 Mk3 2.93501 0.02416 28.33594 41.92206
Table L2. Harmonic analysis results for velocity, Station HC, July 9 through October 24, 1995, Suisun Bay, California [cm/s, centimeters per second; deg.T, degrees true; deg, degrees; E, equilibrium argument]
Station: HC �Start time of the series (local): Year, 95; Month, 7; Da�y, 28; Hour, 0: 6�Record length: 92 M2 Cycle: 9021 dat�a points�
Tidal Major axis Minor axis Direction Phase E � Rotation�Symbol (cm/s) (cm/s) (deg. �T) (deg) (deg)�O1 2.02 0.17 71.8 343.2 125.2 �Clockwise�
K1 2.56 0.30 75.1 110.0 206.7 �Clockwise�N2 1.53 0.01 90.6 55.5 134.3 ��Counterclockwise�
M2 10.56 0.99 83.3 278.8 331.9 �Clockwise�S2 2.06 0.54 85.2 21.5 3.3 �Clockwise�
M4 0.79 0.01 176.7 260.6 303.8 �Clockwise�
Rootmeansquare speed, (cm/s): � 9.31�Standard deviation, U series (cm/s): � 3.30�Standard deviation, V series (cm/s): � 2.09�Tidal form number: � 0.36�Spring tidal current maximum (cm/s): � 17.21�Neap tidal current maximum (cm/s): � 7.97�Principal current direction (deg. T): � 80.94�
134 Hydrodynamic and Suspended-Solids Concentration Measurements in Suisun Bay, California, 1995

APPENDIX M—STATION HDOL
Appendix M 135

Station Name: HDOL (Honker Bay at the dolphin)
Position: Lat. 38°04'25" Long. 121°57'27"
Depth: 1.9 m (MLLW)
Manufacturer Serial Number Deployment Dates CT: Seabird SeacatNA 7/6/95(187) - 9/18/95(261)
VTD: E G & G ACM316356 7/6/95(187) - 9/18/95(261) OBS: D & A OBS3 309 7/6/95(187) - 9/18/95(261)
Serviced:7/6/95(187), 7/11/95(192), 7/25/95(206), 8/2/95(214), 8/9/95(221), 9/18/95(261)
1.9 m
Surface buoy
Weight 0.45 m
VTDO
Dolphin
CT
1.5 m
Figure M1. Configuration of instrument deployment, Station HDOL, July 6 through September 18, 1995, Suisun Bay, California. m, meters; MLLW, mean lower low water; OBS, optical backscatterance sensor; CT, conductivity-temperature; VTD, velocity-temperature-depth; VTDO, velocity-temperature-depth-optical (backscatterance sensor).
136 Hydrodynamic and Suspended-Solids Concentration Measurements in Suisun Bay, California, 1995

TE
MP
ER
AT
UR
E, �
IN
DE
GR
ES
S C
EL
SIU
S�
D
EP
TH
, IN
ME
TE
RS
�S
AL
INIT
Y�
0�
5�
10�
15� C
14�
16�
18�
20�
22�
24�
26� B
0�
2�
4� A
150� 160� 170� 180� 190� 200� 210� 220� 230� 240� 250� 260� 270� 280� 290� 300�
DAYS FROM JANUARY 1, 1995�
Figure M2. Time-series plots of A, depth; B, temperature; and C, salinity, Station HDOL, July 6 through September 18, 1995, Suisun Bay, California. Salinities in this report are presented without units because salinity is a conductivity ratio; therefore, it has no physical units (Millero, 1993).
Appendix M 137

TE
MP
ER
AT
UR
E, �
IN
DE
GR
ES
S C
EL
SIU
S�
D
EP
TH
, IN
ME
TE
RS
�S
AL
INIT
Y�
0�
5�
10�
15� C
14�
16�
18�
20�
22�
24�
26� B
0�
2�
4� A
150� 160� 170� 180� 190� 200� 210� 220� 230� 240� 250� 260� 270� 280� 290� 300�
DAYS FROM JANUARY 1, 1995�
Figure M3. Time-series plots of low-pass-filtered A, depth; B, temperature; and C, salinity, Station HDOL, July 6 through September 18, 1995, Suisun Bay, California. Salinities in this report are presented without units because salinity is a conductivity ratio; therefore, it has no physical units (Millero, 1993).
138 Hydrodynamic and Suspended-Solids Concentration Measurements in Suisun Bay, California, 1995

150� 160� 170� 180� 190� 200� 210� 220� 230� 240� 250� 260� 270� 280� 290� 300�
DAYS FROM JANUARY 1, 1995�
Figure M4. Time-series plot of suspended-solids concentration at Station HDOL, July 6 through September 18, 1995, Suisun Bay, California.
14�
16�
18�
20�
22�
24�
26� A
0�
5�
10�
15� B
150� 160� 170� 180� 190� 200� 210� 220� 230� 240� 250� 260� 270� 280� 290� 300�
DAYS FROM JANUARY 1, 1995�
Figure M5. Time-series plots of A, temperature; and B, salinity, Station HDOL (collected by National Oceanic and Atmospheric Administration), April 30 through November 3, 1995, Suisun Bay, California. Salinities in this report are presented without units because salinity is a conductivity ratio; therefore, it has no physical units (Millero, 1993).
TE
MP
ER
AT
UR
E, �
S
US
PE
ND
ED
-SO
LID
S C
ON
CE
NT
RA
TIO
N,
IN M
ILL
IGR
AM
S P
ER
LIT
ER
�
0�
100�
200�
300�
400�
500�
600� IN
DE
GR
ES
S C
EL
SIU
S�
SA
LIN
ITY
�
Appendix M 139

140 Hydrodynamic and Suspended-Solids Concentration Measurements in Suisun Bay, California, 1995
150� 160� 170� 180� 190� 200� 210� 220� 230� 240� 250� 260� 270� 280� 290� 300�
DAYS FROM JANUARY 1, 1995�
0�
5�
10�
15�
SA
LIN
ITY
�
B
14�
16�
18�
20�
22�
24�
26�
TE
MP
ER
AT
UR
E, �
IN D
EG
RE
SS
CE
LS
IUS
�
A
150� 160� 170� 180� 190� 200� 210� 220� 230� 240� 250� 260� 270� 280� 290� 300�
DAYS FROM JANUARY 1, 1995�
0�
10�
20�
30�
40�
50�
SP
EE
D, �
IN C
EN
TIM
ET
ER
S P
ER
SE
CO
ND
�
B
0�
45�
90�
135�
180�
225�
270�
315�
360�
DIR
EC
TIO
N, �
IN D
EG
RE
ES
TR
UE
�
A
Figure M6. Time-series plots of low-pass-filtered A, temperature; and B, salinity, Station HDOL (collected by National Oceanic and Atmospheric Administration), April 30 through November 3, 1995, Suisun Bay, California. d without units because salinity is a conductivity ratio; therefore, it has no physical units (Millero, 1993).
Figure M7. Time-series plots of tidal currents, Station HDOL, July 6 through September 18, 1995, Suisun Bay, California.
Salinities in this report are presente

20
10
0
-10
-20
-30
Transverse speed Streamwise speed (positive upstream)
150 160 170 180 190 200 210 220 230 240 250 260 270 280 290 300 DAYS FROM JANUARY 1, 1995
Figure M8. Longitudinal and transverse residual currents, Station HDOL, July 6 through September 18, 1995, Suisun Bay, California. Principal direction is 63.3 degrees true.
20
Sticks angled to the left imply positive transverse velocity
UP 10
0 ESTUARY
-10
-20 DOWN
-30 150 160 170 180 190 200 210 220 230 240 250 260 270 280 290 300
DAYS FROM JANUARY 1, 1995
Figure M9. Residual currents, Station HDOL, July 6 through September 18, 1995, Suisun Bay, California. Principal direction is 63.3 degrees true.
100
80
60
40
20
0 150 160 170 180 190 200 210 220 230 240 250 260 270 280 290 300
DAYS FROM JANUARY 1, 1995
Figure M10. Burst velocity variance, Station HDOL, July 6 through September 18, 1995, Suisun Bay, California. Every hour output from the velocity sensor was stored every 0.5 second over a 128-second period in order to measure the wind-wave properties. Periodic, short, and intensive data-collection strategies are called burst sampling and are used to measure high-frequency processes that cannot be continuously recorded because of data-storage limitations. The variance of velocity for each burst sample is an approximate measure of the wind-wave energy.
RE
SID
UA
L C
UR
RE
NT
VE
LO
CIT
Y,
RE
SID
UA
L C
UR
RE
NT
SP
EE
D,
IN C
EN
TIM
ET
ER
S P
ER
SE
CO
ND
IN
CE
NT
IME
TE
RS
PE
R S
EC
ON
D
BU
RS
T V
EL
OC
ITY
VA
RIA
NC
E�
IN
, CE
NT
IME
TE
RS
SQ
UA
RE
D P
ER
�
SE
CO
ND
SQ
UA
RE
D
Appendix M 141

SU
SP
EN
DE
DS
OLI
DS
CO
NC
EN
TR
ATIO
N, I
N M
ILLI
GR
AM
S P
ER
LIT
ER
�
10�
20�
30�
40�
50�
60�
70�
80�
90�
100�
110�
Number of data points = 18� y = 0.379 *x +
Nonparametric prediction interval: + 12 to 14� Percent prediction interval: + 19 percent to 25 percent�
Nonparametric prediction interval� Percent prediction interval
9.1�
�
60� 80� 100� 120� 140� 160� 180� 200� SENSOR OUTPUT, IN MILLIVOLTS�
Figure M11. Calibration curve for near-bottom optical backscatterance sensor, Station HDOL, July 6 through September 18, 1995, Suisun Bay, California.
142 Hydrodynamic and Suspended-Solids Concentration Measurements in Suisun Bay, California, 1995

�
�
�
Table M1. Harmonic analysis results from depth measurements, Station HDOL, July 6 through September 18, 1995, Suisun Bay, California
Station: HDOL Time series mean: 2.80257Standard deviation: 0.11356Harmonic constants: After tidal inference
Mean Local Modified Tidal Cycles amplitude epoch epoch symbol (per day) (meters) (degrees) (degrees) Q1 0.89324 0.03588 133.70499 148.47318 O1 0.92954 0.18493 166.27049 176.68370 M1 0.96645 0.01313 199.09863 205.08258 P1 0.99726 0.07305 227.00253 229.28857 K1 1.00274 0.22068 231.92676 233.55571
Mu2 1.86455 0.01297 253.82581 273.99512 N2 1.89598 0.02942 247.62512 264.02228 Nu2 1.90084 0.00571 230.51917 246.33350 M2 1.93227 0.54039 119.96887 132.01105 L2 1.96857 0.01513 352.31262 359.99979
S2 2.00000 0.08863 346.11197 350.02695 K2 2.00548 0.02411 335.26956 338.52747 M4 3.86455 0.01963 172.11658 196.20087 Mk3 2.93501 0.03465 282.46506 296.13617
Table M2. Harmonic analysis results for velocity, Station HDOL, July 6 through September 18, 1995, Suisun Bay, California [cm/s, centimeters per second; deg.T, degrees true; deg, degrees; E, equilibrium argument]
Station: HDOL �Start time of the series (local): Year, 95; Month, 5; Da�y, 1; Hour, 0: 0�Record length: 60 M2 Cycle: 8795 dat�a points�
Tidal Major axis Minor axis Direction Phase E � Rotation�Symbol (cm/s) (cm/s) (deg. �T) (deg) (deg)�O1 6.45 0.00 62.3 116.6 196.0 ��Counterclockwise�
K1 9.50 0.05 62.6 165.0 118.3 �Clockwise�N2 5.38 0.02 62.4 237.6 186.4 ��Counterclockwise�
M2 29.48 0.07 64.8 86.8 314.2 ��Counterclockwise�S2 5.58 0.30 66.5 300.6 0.0 �Clockwise�
M4 0.51 0.04 59.2 357.0 268.4 �Clockwise�
Rootmeansquare speed, (cm/s): � 25.20�Standard deviation, U series (cm/s): � 6.63�Standard deviation, V series (cm/s): � 3.53�Tidal form number: � 0.45�Spring tidal current maximum (cm/s): � 51.01�Neap tidal current maximum (cm/s): � 20.84�Principal current direction (deg. T): � 64.26�
Appendix M 143

THIS PAGE LEFT BLANK INTENTIONALLY

APPENDIX N—STATION HS
Appendix N 145

Station Name: HS (Honker Bay South East side)
Position: Lat. 38°03'28" Long. 121°55'59"
Depth: 1.1 m (MLLW)
Manufacturer Serial Number Deployment Dates CTD: Ocean Sensors OS200 304 8/1/95(213) - 9/18/95(261)
V: InterOcean S405451272 7/7/95(188) - 9/18/95(261) OBS: D & A OBS3 613 8/1/95(213) - 9/18/95(261)
Serviced: 7/7/95(188), 8/1/95(213), 8/10/95(222), 8/23/95(235), 9/18/95(261)
1.1 m
Surface buoy
Weight 0.58 m
0.69 m
CTDO
V
Figure N1. Configuration of instrument deployment, Station HS, July 7 through September 18, 1995, Suisun Bay, California. m, meters; MLLW, mean lower low water; OBS, optical backscatterance sensor; CTD, conductivity-temperature-depth; CTDO, conductivity-temperature-depth-optical (backscatterance sensor); V, velocity.
146 Hydrodynamic and Suspended-Solids Concentration Measurements in Suisun Bay, California, 1995

4
2
TE
MP
ER
AT
UR
E,
IN D
EG
RE
SS
CE
LS
IUS
D
EP
TH
, IN
ME
TE
RS
A
0
26
24
22
20
18
16
14
15
B
10
5
0 150 160 170 180 190 200 210 220 230 240 250 260 270 280 290 300
C
DAYS FROM JANUARY 1, 1995
Figure N2. Time-series plots of A, depth; B, temperature; and C, salinity, Station HS, August 1 through September 18, 1995, Suisun Bay, California. Salinities in this report are presented without units because salinity is a conductivity ratio; therefore, it has no physical units (Millero, 1993).
SA
LIN
ITY
Appendix N 147

DE
PT
H, I
N M
ET
ER
S�
0�
5�
10�
15� C
14�
16�
18�
20�
22�
24�
26� B
0�
2�
4� A
TE
MP
ER
AT
UR
E, �
SU
SP
EN
DE
D-S
OL
IDS
CO
NC
EN
TR
AT
ION
, S
AL
INIT
Y�
IN
DE
GR
ES
S C
EL
SIU
S�
150� 160� 170� 180� 190� 200� 210� 220� 230� 240� 250� 260� 270� 280� 290� 300�
DAYS FROM JANUARY 1, 1995�
Figure N3. Time-series plots of low-pass-filtered A, depth; B, temperature; and C, salinity, Station HS, August 1 through September 18, 1995, Suisun Bay, California. Salinities in this report are presented without units because salinity is a conductivity ratio; therefore, it has no physical units (Millero, 1993).
0�
100�
200�
300�
400�
500�
600�
150� 160� 170� 180� 190� 200� 210� 220� 230� 240� 250� 260� 270� 280� 290� 300�
DAYS FROM JANUARY 1, 1995�
IN M
ILL
IGR
AM
S P
ER
LIT
ER
�
Figure N4. Time-series plot of suspended-solids concentration, Station HS, August 1 through September 18, 1995, Suisun Bay, California.
148 Hydrodynamic and Suspended-Solids Concentration Measurements in Suisun Bay, California, 1995

Appendix N 149
150� 160� 170� 180� 190� 200� 210� 220� 230� 240� 250� 260� 270� 280� 290� 300�
DAYS FROM JANUARY 1, 1995�
0�
10�
20�
30�
40�
50�
SP
EE
D, �
IN C
EN
TIM
ET
ER
S P
ER
SE
CO
ND
�
B
0�
45�
90�
135�
180�
225�
270�
315�
360�D
IRE
CT
ION
, � IN
DE
GR
EE
S T
RU
E�
A
150 160 170 180 190 200 210 220 230 240 250 260 270 280 290 300-30
-20
-10
0
10
20
DAYS FROM JANUARY 1, 1995
RE
SID
UA
L C
UR
RE
NT
SP
EE
D,
IN C
EN
TIM
ET
ER
S P
ER
SE
CO
ND
Transverse speedStreamwise speed (positive upstream)
Figure N5. Time-series plots of tidal currents, Station HS, July 7 through September 18, 1995, Suisun Bay, California.
Figure N6. Longitudinal and transverse residual currents, Station HS, July 7 through September 18, 1995, Suisun Bay, California. Principal direction is 164.7 degrees true.

RE
SID
UA
L C
UR
RE
NT
VE
LO
CIT
Y,
20
Sticks angled to the left imply positive transverse velocity
UP 10
0 ESTUARY
-10
-20 DOWN
-30 150 160 170 180 190 200 210 220 230 240 250 260 270 280 290 300
DAYS FROM JANUARY 1, 1995
Figure N7. Residual currents, Station HS, July 7 through September 18, 1995, Suisun Bay, California. Principal direction is 164.7 degrees true.
150
100
50
0200 250 300 350 400 450 500 550 600 650 700
Number of data points = 13 y = 0.244 *x
Nonparametric prediction interval: + Percent prediction interval: +
Nonparametric prediction interval Percent prediction interval
23.2
9 8 to 8 percent 9 percent to
SENSOR OUTPUT, IN MILLIVOLTS
Figure N8. Calibration curve for near-bottom optical backscatterance sensor, Station HS, August 1 through September 18, 1995, Suisun Bay, California.
IN C
EN
TIM
ET
ER
S P
ER
SE
CO
ND
SU
SP
EN
DE
D-S
OLI
DS
CO
NC
EN
TR
AT
ION
, IN
MIL
LIG
RA
MS
PE
R L
ITE
R
150 Hydrodynamic and Suspended-Solids Concentration Measurements in Suisun Bay, California, 1995

�
�
�
Table N1. Harmonic analysis results from depth measurements, Station HS, August 1 through September 18, 1995, Suisun Bay, California
Station: HS Time series mean: 1.45560Standard deviation: 0.17919Harmonic constants: After tidal inference
Mean Local Modified Tidal Cycles amplitude epoch epoch symbol (per day) (meters) (degrees) (degrees) Q1 0.89324 0.03570 106.78165 121.52539 O1 0.92954 0.18403 109.30936 119.69812 M1 0.96645 0.01307 111.85742 117.81693 P1 0.99726 0.08244 114.02332 116.28491 K1 1.00274 0.24906 114.40552 116.01001
Mu2 1.86455 0.01174 312.67090 332.79132 N2 1.89598 0.04208 49.45496 65.80322 Nu2 1.90084 0.00816 40.18210 55.94754 M2 1.93227 0.48919 340.25446 352.24774 L2 1.96857 0.01370 271.05396 278.69223
S2 2.00000 0.16641 7.83801 11.70410 K2 2.00548 0.04526 10.07227 13.28128 M4 3.86455 0.02089 236.64197 260.62848 Mk3 2.93501 0.02316 38.60767 52.20544
Table N2. Harmonic analysis results for velocity, Station HS, July 7 through September 18, 1995, Suisun Bay, California [cm/s, centimeters per second; deg.T, degrees true; deg, degrees; E, equilibrium argument]
Station: HS �Start time of the series (local): Year, 95; Month, 7; Da�y, 30; Hour, 0: 7�Record length: 73 M2 Cycle: 7187 dat�a points�
Tidal Major axis Minor axis Direction Phase E � Rotation�Symbol (cm/s) (cm/s) (deg. �T) (deg) (deg)�O1 4.51 0.58 160.8 358.3 74.6 �Clockwise�
K1 5.85 0.64 169.0 297.2 208.8 �Clockwise�N2 3.96 0.22 171.1 88.4 59.7 �Clockwise�
M2 19.00 2.12 164.0 61.5 283.4 �Clockwise�S2 4.23 0.07 166.3 340.0 3.6 ��Counterclockwise�
M4 2.66 0.53 173.3 114.0 206.8 �Clockwise�
Rootmeansquare speed, (cm/s): � 23.69�Standard deviation, U series (cm/s): � 9.63�Standard deviation, V series (cm/s): � 10.90�Tidal form number: � 0.45�Spring tidal current maximum (cm/s): � 33.59�Neap tidal current maximum (cm/s): � 13.44�Principal current direction (deg. T): �164.72�
Appendix N 151

THIS PAGE LEFT BLANK INTENTIONALLY