appendix f tobacco river watershed upland sediment source...
TRANSCRIPT
Tobacco Planning Area Sediment TMDLs and Framework Water Quality Improvement Plan – Appendix F
9/16/11 FINAL F-1
APPENDIX F - TOBACCO RIVER WATERSHED UPLAND SEDIMENT SOURCE
ASSESSMENT
This upland sediment modeling appendix is derived from the Tobacco River Watershed Upland Sediment Modeling Final Report (Confluence Incorporated, 2009) prepared by Confluence Consulting for the Kootenai River Network and the Montana Department of Environmental Quality
F1.0 SEDIMENT CONTRIBUTION FROM HILLSLOPE EROSION
F1.1 INTRODUCTION
Upland sediment loading due to hillslope erosion was modeled using the Universal Soil Loss Equation (USLE) and sediment delivery to the stream was predicted using a sediment delivery ratio and a riparian health assessment sediment delivery reduction. This model provided an assessment of existing sediment loading from upland sources and an assessment of potential sediment loading through the application of Best Management Practices (BMPs). For this evaluation the primary BMP evaluated includes the modification in upland management practices and the secondary BMP evaluated includes the modification in riparian health management practices. When reviewing the results of the upland sediment load model, it is important to note that a significant portion of the sediment load is the “natural upland load” and not affected by the application of BMPs to the upland management practices. The assessment methodology did not differentiate between sediment loads with all reasonable BMPs and “natural” loads. The general form of the USLE has been widely used for erosion prediction in the U.S. and is presented in the National Engineering Handbook (1983) as:
(1) A = RK(LS)CP (in tons per acre per year) where soil loss (A) is a function of the rainfall erosivity index (R), soil erodibility factor (K), overland flow slope and length (LS), crop management factor (C), and conservation practice factor (P) (Wischmeier and Smith, 1978; Renard, et al., 1997). USLE was selected for the Tobacco River watershed due to its relative simplicity and ease in parameterization and the fact that it has been integrated into a number of other erosion prediction models. These include: (1) the Agricultural Nonpoint Source Model (AGNPS), (2) Areal Nonpoint Source Watershed Environment Response Simulation Model (ANSWERS), (3) Erosion Productivity Impact Calculator (EPIC), (4) Generalized Watershed Loading Functions (GWLF), and (5) the Soil Water Assessment Tool (SWAT) (Doe, et al., 1999). A detailed description of the general USLE model parameters is presented below. The R-factor is an index that characterizes the effect of raindrop impact and rate of runoff associated with a rainstorm. It is a summation of the individual storm products of the kinetic energy in rainfall (hundreds of ft-tons per acre per year) and the maximum 30-minute rainfall intensity (inches per hour). The total kinetic energy of a storm is obtained by multiplying the kinetic energy per inch of rainfall by the depth of rainfall during each intensity period. The K-factor or soil erodibility factor indicates the susceptibility of soil to resist erosion. It is a measure of the average soil loss (tons per acre per hundreds of ft-tons per acre of rainfall intensity) from a

Tobacco Planning Area Sediment TMDLs and Framework Water Quality Improvement Plan – Appendix F
9/16/11 FINAL F-2
particular soil in continuous fallow. The K-factor is based on experimental data from the standard SCS erosion plot that is 72.6 ft long with uniform slope of 9%. The LS-factor is a function of the slope and overland flow length of the eroding slope or cell. For the purpose of computing the LS-factor, slope is defined as the average land surface gradient. The flow length refers to the distance between where overland flow originates and runoff reaches a defined channel or depositional zone. According to McCuen (1998), flow lengths are seldom greater than 400 ft or shorter than 20 ft. The C-factor or crop management factor is the ratio of the soil eroded from a specific type of cover to that from a clean-tilled fallow under identical slope and rainfall. It integrates a number of factors that effect erosion including vegetative cover, plant litter, soil surface, and land management. The original C-factor of the USLE was experimentally determined for agricultural crops and has since been modified to include rangeland and forested cover. It is now referred to as the vegetation management factor (VM) for non-agricultural settings (Brooks, et al., 1997). Three different kinds of effects are considered in determination of the VM-factor. These include: (1) canopy cover effects, (2) effects of low-growing vegetal cover, mulch, and litter, and (3) rooting structure. A set of metrics has been published by the Soil Conservation Service (SCS) for estimation of the VM-factors for grazed and undisturbed woodlands, permanent pasture, rangeland, and idle land. Although these are quite helpful for the Tobacco River setting, Brooks (1997)cautions that more work has been carried out in determining the agriculturally based C-factors than rangeland/forest VM-factors. Because of this, the results of the interpretation should be used with discretion. The P-factor or conservation practice factor is a function of the interaction of the supporting land management practice and slope. It incorporates the use of erosion control practices such as strip-cropping, terracing and contouring, and is applicable only to agricultural lands. Values of the P-factor compare straight-row (up-slope down-slope) farming practices with that of certain agriculturally based conservation practices.
F1.2 MODELING APPROACH
Sediment delivery from hillslope erosion was estimated using a Universal Soil Loss Equation (USLE) based model to predict soil loss, along with a distance based sediment delivery ratio (SDR) and a riparian health assessment to predict sediment delivered to the stream. This USLE based model is implemented as a watershed scale, grid format, GIS model using ArcView v 9.2 GIS software. Desired results from the modeling effort include the following: (1) annual sediment load from each of the water quality limited segments on the state’s 303(d) list, (2) the mean annual source distribution from each land category type, and (3) annual potential sediment load from each of the water quality limited segments on the state’s 303(d) list after the application of upland management BMPs. Based on these considerations, a GIS- modeling approach (USLE) was formulated to facilitate database development and manipulation, provide spatially explicit output, and supply output display for the modeling effort.

Tobacco Planning Area Sediment TMDLs and Framework Water Quality Improvement Plan – Appendix F
9/16/11 FINAL F-3
F1.3 MODELING SCENARIOS
Three management scenarios were evaluated for the Tobacco River watershed. They include: (1) an existing condition scenario that considers the current land cover, management practices, and riparian health in the watershed; (2) an improved grazing and cover management scenario with existing riparian health; and (3) an improved grazing and cover management scenario with improved riparian health management. Erosion was differentiated into two source categories for each scenario: (1) natural erosion that occurs on the time scale of geologic processes and (2) human caused erosion that is accelerated by human-caused activity. A similar classification is presented as part of the National Engineering Handbook Chapter 3 – Sedimentation (United States Department of Agriculture, 1983). Differentiation is necessary for TMDL planning. Land cover categories considered to be affected by human-caused activity and therefore affected by BMPs within the Tobacco River watershed were pasture/hay, grasslands/herbaceous, cultivated crops, and transitional (logging). All other land cover categories were considered to have “natural erosion.” Well vegetated riparian buffers have been shown to act as filters that help to remove sediment from overland flow. In general, the effectiveness of vegetated riparian buffers is proportional to their width and overall health. MT DEQ completed a riparian health assessment in the Tobacco River watershed, encompassing the Tobacco River mainstem and its primary tributary streams. This information is used to estimate further reduction in the quantity of eroded sediment that is ultimately delivered to the streams. These riparian areas are also considered to be affected by human-caused activity and are therefore subject to improved riparian health management.
F1.4 DATA SOURCES
The USLE model was parameterized using a number of published data sources. These include information from: (1) U.S. Geological survey (USGS), (2) Spatial Climate Analysis Service (SCAS), and (3) Soil Conservation Service (SCS). Additionally, local information regarding specific land cover was acquired from the U.S. Forest Service (USFS) and the Natural Resource Conservation Service (NRCS). Specific GIS coverages used in the modeling effort included the following: Grid data of the R-factor was obtained from the NRCS, and is based on Parameter-elevation Regressions on Independent Slopes Model (PRISM) precipitation data. PRISM precipitation data is derived from weather station precipitation records, interpolated to a gridded landscape coverage by a method (developed by the Spatial Climate Analysis Service of Oregon State University) which accounts for the effects of elevation on precipitation patterns. Polygon data of the K-factor were obtained from the NRCS General Soil Map (STATSGO) database. The USLE K factor is a standard component of the STATSGO soil survey. Soils polygon data were summarized and interpolated to grid format. The LS-factor was derived from 30m USGS digital elevation model (DEM) grid data, interpolated to a 10m pixel. This factor is calculated with the model.

Tobacco Planning Area Sediment TMDLs and Framework Water Quality Improvement Plan – Appendix F
9/16/11 FINAL F-4
The C-factor was estimated using the National Land Cover (NLCD) dataset and using C-factor interpretations provided by the NRCS with input from MT DEQ and USFS. C-factors are intended to be conservatively representative of conditions in the Tobacco River watershed. The P-factor was set to one, as per previous communication with NRCS State Agronomist who suggested that this value is the most appropriate representation of current management practices in the Tobacco River watershed. The sediment delivery ratio was derived by the model for each grid cell based on the observed relationship between the distance from the delivery point to the stream and the percent of eroded sediment delivered to the stream. This relationship was established by Dube, Megahan & McCalmon in their development of the WARSEM road sediment model for the State of Washington. The riparian health factor was derived from a riparian health assessment completed by MT DEQ in the Tobacco River watershed, encompassing the Tobacco River mainstem and its primary tributary streams. Ratings of poor, fair, and good were assigned by the riparian health assessment to the left and right bank of multiple reaches on each surveyed stream.
F2.0MODELING METHODS
A grid was created for each data source, giving consideration to proper stream network delineation, grid cell resolution, etc. A computer model was built using ArcView Model Builder to derive the five factors from model inputs, multiply the five factors and arrive at a predicted sediment production for each grid cell. The model also derived a sediment delivery ratio for each cell, and reduced the predicted sediment production by that factor to estimate sediment delivered to the stream network. The estimated sediment delivered to the stream network was further reduced by using a riparian health factor. Additional details about each model factor are provided in the sections that follow.
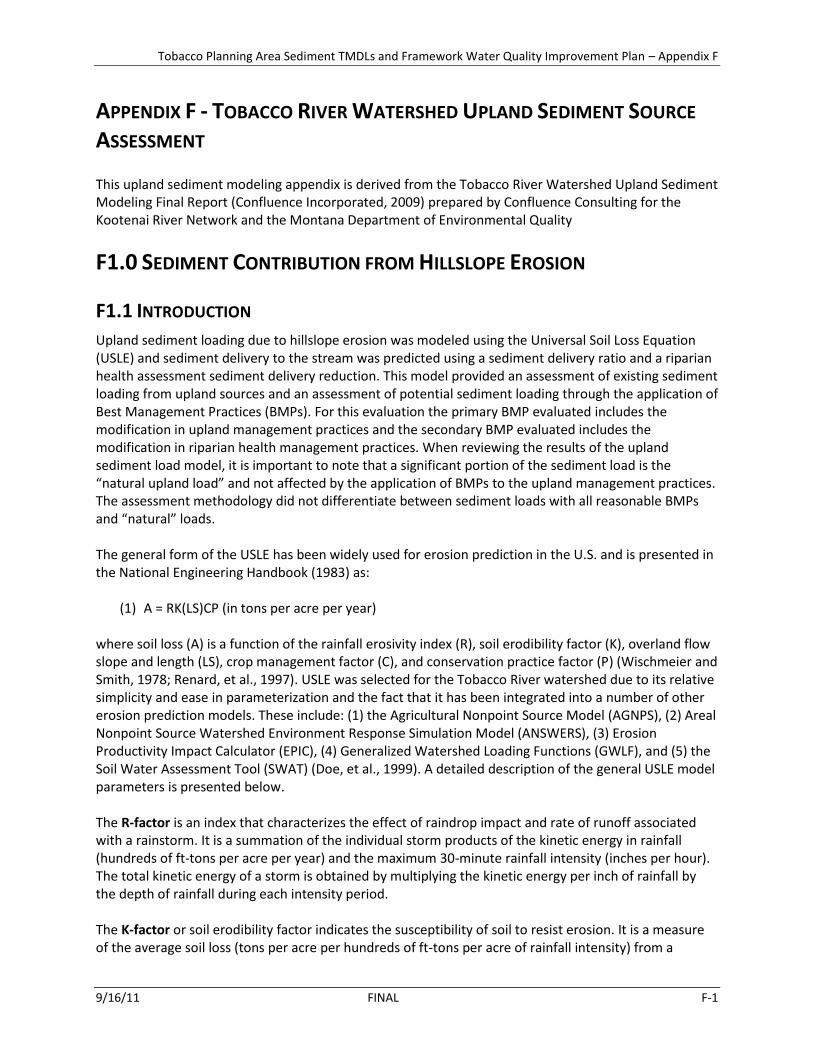
F2.1 Tobacco DEM The digital elevation model (DEM) for the Tobacco River watershed (Figure F2-1) is the foundation for developing the LS factor, for defining the extent of the bounds of the analysis area (the Tobacco River watershed and Grave Creek watershed), and for delineating the area within the outer bounds of the analysis for which the USLE model is not valid (i.e. the concentrated flow channels of the stream network). The USGS 30m DEM (level 2) for the Tobacco River was used for these analyses. The DEM was interpolated to a 10m analytic grid cell to render the delineated stream network more representative of the actual size of Tobacco River watershed streams and to minimize resolution dependent stream network anomalies. The resulting interpolated 10m DEM was then subjected to standard hydrologic preprocessing, including the filling of sinks to create a positive drainage condition for all areas of the watershed.
F2.2 R-Factor The rainfall and runoff factor (i.e. R-factor) grid was prepared by the Spatial Climate Analysis Service of Oregon State University, at 4 km grid cell resolution. For the purposes of this analysis, the R-factor grid was reprojected to Montana State Plane Coordinates (NAD83, meters), resampled to a 10m analytic cell size and clipped to the extent of the Tobacco River watershed, to match the project’s standard grid definition (Figure F2-1).
Tobacco Planning Area Sediment TMDLs and Framework Water Quality Improvement Plan – Appendix F
9/16/11 FINAL F-5
Figure F2-1 Digital Elevation Model (DEM) and R-factor of the Tobacco River Watershed
F2.3 K-Factor The soil erodibility factor grid was compiled from 1:250K STATSGO data, as published by the NRCS. STATSGO database tables were queried to calculate a component weighted K value for all surface layers, which was then summarized by individual map unit. The map unit K values were then joined to a GIS polygon coverage of the STATSGO map units, and the polygon coverage was converted to a 10m analytic grid for use in this analysis (Figure F2-2). SSURGO data were considered for use, due to the higher resolution and age of the SSURGO datasets but were not used because they did not contain the required K-factor.

Tobacco Planning Area Sediment TMDLs and Framework Water Quality Improvement Plan – Appendix F
9/16/11 FINAL F-6
Figure F2-2 ULSE K-factor for the Tobacco River Watershed
F2.4 LS-Factor The equation used for calculating the slope length and slope factor was that given in the updated definition of RUSLE, as published in USDA handbook #703:
LS = Si ( im+1 - i-1
m+1) / ( I - i-1) (72.6)m Where:
i = length in feet from top of slope to lower end of ith segment. This value was determined by applying GIS based surface analysis procedures to the Tobacco River watershed DEM, calculating total upslope length for each 10m grid cell, and converting the results to feet from meters. In accordance with research that indicates that, in practice, the slope length rarely exceeds 400 ft,
was limited to that maximum value. Si = slope steepness factor for the ith segment. = 10.8 sin θ + 0.03 for θ < 9% = 16.8 sin θ - 0.50 for θ > 9% m = a variable slope-length exponent.
= β / (1 + β) and Β = ratio of rill to interrill erosion.
= (sin θ / 0.0896) / *3.0 (sin θ)0.8 + 0.56]

Tobacco Planning Area Sediment TMDLs and Framework Water Quality Improvement Plan – Appendix F
9/16/11 FINAL F-7
θ = slope angle as calculated by GIS based surface analysis procedures from the Tobacco River watershed DEM.
The LS factor grid was calculated from individual grids computed for each of these sub factors, using a simple ArcView Model Builder script.
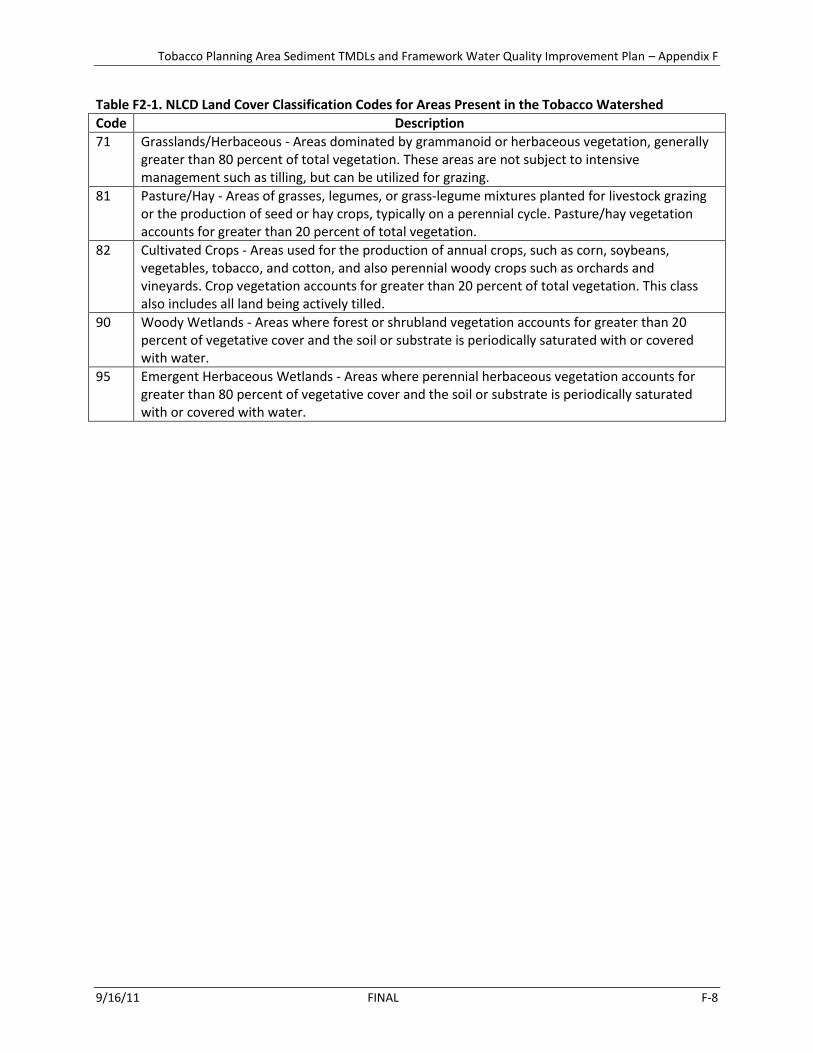
F2.5 NLCD The 2001 National Land Cover Dataset (NLCD) was obtained from USGS for use in establishing USLE C-factors for the Tobacco watershed. The 2001 NLCD is a categorized 30 meter Landsat Thematic Mapper image shot in 2001 (Figure F2-3). The NLCD image was reprojected to Montana State plane projection/coordinate system, and resampled to the project standard 10m grid. NLCD land cover classification codes for areas present in the Tobacco watershed are described in Table F2-1. Table F2-1. NLCD Land Cover Classification Codes for Areas Present in the Tobacco Watershed
Code Description
11 Open Water - areas of open water, generally with less than 25 percent cover of vegetation or soil.
21 Developed, Open Space - Includes areas with a mixture of constructed materials, but mostly vegetation in the form of lawn grasses. Impervious surfaces account for less than 20 percent of total cover. These areas most commonly include large-lot single-family housing units, parks, golf courses, and vegetation planted in developed settings for recreation, erosion control, or aesthetic purposes.
22 Developed, Low Intensity - Includes areas with a mixture of constructed materials and vegetation. Impervious surfaces account for 20-49 percent of total cover. These areas most commonly include single-family housing units.
23 Developed, Medium Intensity - Includes areas with a mixture of constructed materials and vegetation. Impervious surfaces account for 50-79 percent of the total cover. These areas most commonly include single-family housing units.
24 Developed, High Intensity - Includes highly developed areas where people reside or work in high numbers. Examples include apartment complexes, row houses and commercial/industrial. Impervious surfaces account for 80-100 percent of the total cover.
31 Barren Land (Rock/Sand/Clay) – Barren areas of bedrock, desert pavement, scarps, talus, slides, volcanic material, glacial debris, sand dunes, strip mines, gravel pits and other accumulations of earthen material. Generally, vegetation accounts for less than 15 percent of total cover.
41 Deciduous Forest - Areas dominated by trees generally greater than 5 meters tall, and greater than 20 percent of total vegetation cover. More than 75 percent of the tree species shed foliage simultaneously in response to seasonal change.
42 Evergreen Forest - Areas dominated by trees generally greater than 5 meters tall, and greater than 20 percent of total vegetation cover. More than 75 percent of the tree species maintain their leaves all year. Canopy is never without green foliage.
43 Mixed Forest - Areas dominated by trees generally greater than 5 meters tall, and greater than 20 percent of total vegetation cover. Neither deciduous nor evergreen species are greater than 75 percent of total tree cover.
52 Shrub/Scrub - Areas dominated by shrubs; less than 5 meters tall with shrub canopy typically greater than 20 percent of total vegetation. This class includes tree shrubs, young trees in an early successional stage or trees stunted from environmental conditions.
Tobacco Planning Area Sediment TMDLs and Framework Water Quality Improvement Plan – Appendix F
9/16/11 FINAL F-8
Table F2-1. NLCD Land Cover Classification Codes for Areas Present in the Tobacco Watershed
Code Description
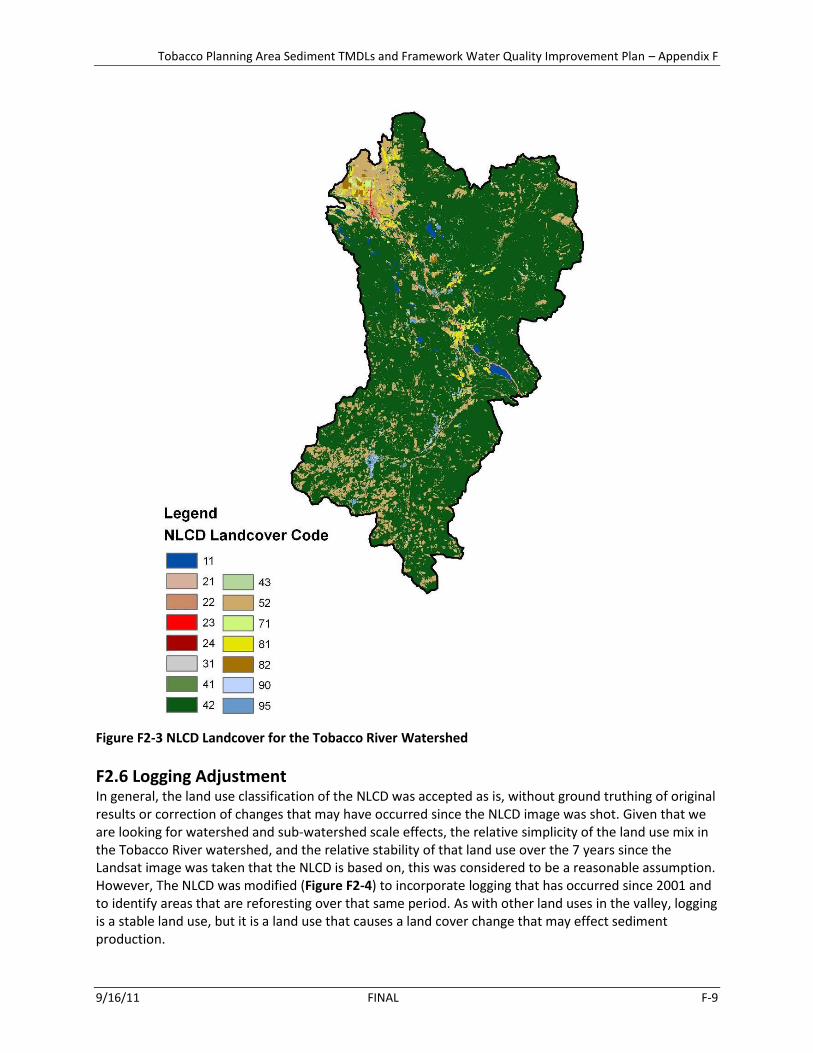
71 Grasslands/Herbaceous - Areas dominated by grammanoid or herbaceous vegetation, generally greater than 80 percent of total vegetation. These areas are not subject to intensive management such as tilling, but can be utilized for grazing.
81 Pasture/Hay - Areas of grasses, legumes, or grass-legume mixtures planted for livestock grazing or the production of seed or hay crops, typically on a perennial cycle. Pasture/hay vegetation accounts for greater than 20 percent of total vegetation.
82 Cultivated Crops - Areas used for the production of annual crops, such as corn, soybeans, vegetables, tobacco, and cotton, and also perennial woody crops such as orchards and vineyards. Crop vegetation accounts for greater than 20 percent of total vegetation. This class also includes all land being actively tilled.
90 Woody Wetlands - Areas where forest or shrubland vegetation accounts for greater than 20 percent of vegetative cover and the soil or substrate is periodically saturated with or covered with water.
95 Emergent Herbaceous Wetlands - Areas where perennial herbaceous vegetation accounts for greater than 80 percent of vegetative cover and the soil or substrate is periodically saturated with or covered with water.
Tobacco Planning Area Sediment TMDLs and Framework Water Quality Improvement Plan – Appendix F
9/16/11 FINAL F-9
Figure F2-3 NLCD Landcover for the Tobacco River Watershed
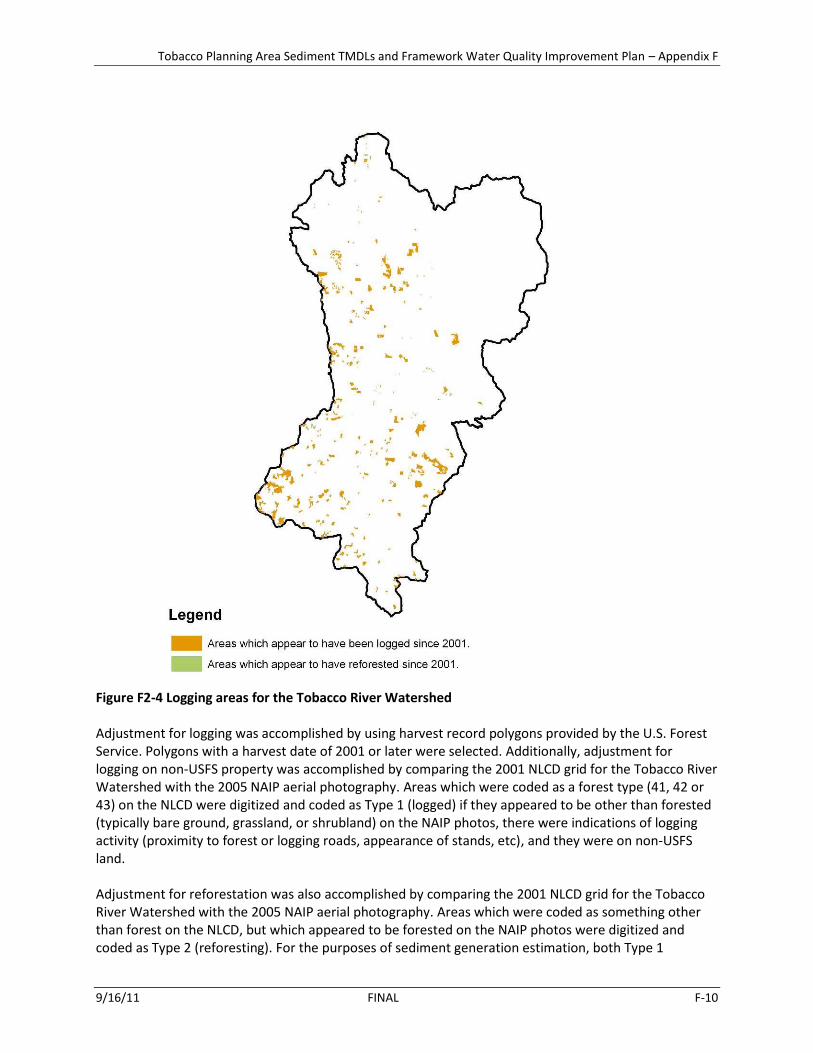
F2.6 Logging Adjustment In general, the land use classification of the NLCD was accepted as is, without ground truthing of original results or correction of changes that may have occurred since the NLCD image was shot. Given that we are looking for watershed and sub-watershed scale effects, the relative simplicity of the land use mix in the Tobacco River watershed, and the relative stability of that land use over the 7 years since the Landsat image was taken that the NLCD is based on, this was considered to be a reasonable assumption. However, The NLCD was modified (Figure F2-4) to incorporate logging that has occurred since 2001 and to identify areas that are reforesting over that same period. As with other land uses in the valley, logging is a stable land use, but it is a land use that causes a land cover change that may effect sediment production.
Tobacco Planning Area Sediment TMDLs and Framework Water Quality Improvement Plan – Appendix F
9/16/11 FINAL F-10
Figure F2-4 Logging areas for the Tobacco River Watershed Adjustment for logging was accomplished by using harvest record polygons provided by the U.S. Forest Service. Polygons with a harvest date of 2001 or later were selected. Additionally, adjustment for logging on non-USFS property was accomplished by comparing the 2001 NLCD grid for the Tobacco River Watershed with the 2005 NAIP aerial photography. Areas which were coded as a forest type (41, 42 or 43) on the NLCD were digitized and coded as Type 1 (logged) if they appeared to be other than forested (typically bare ground, grassland, or shrubland) on the NAIP photos, there were indications of logging activity (proximity to forest or logging roads, appearance of stands, etc), and they were on non-USFS land. Adjustment for reforestation was also accomplished by comparing the 2001 NLCD grid for the Tobacco River Watershed with the 2005 NAIP aerial photography. Areas which were coded as something other than forest on the NLCD, but which appeared to be forested on the NAIP photos were digitized and coded as Type 2 (reforesting). For the purposes of sediment generation estimation, both Type 1

Tobacco Planning Area Sediment TMDLs and Framework Water Quality Improvement Plan – Appendix F
9/16/11 FINAL F-11
(logging) and Type 2 (reforesting) adjustment areas were treated as ‘transitional’ and classified with the corresponding C-factor. A C-factor slightly higher than a deciduous/evergreen forest was used for logged areas (i.e. transitional) because logging intensity within the watershed is generally low and because practices, such as riparian clear-cutting, that tend to produce high sediment yields have not been used since at least 1991, when the MT Streamside Management Zone (SMZ) law was enacted. Additionally, the USLE model is intended to reflect long-term average sediment yield, and while a sediment pulse typically occurs in the first year after logging, sediment production after the first year rapidly declines (Elliot and Robichaud, 2001; Elliot, 2006; Rice, et al., 1972). The logging C-factor is the same for both management scenarios to indicate that logging will continue sporadically on public and private land within the watershed and will produce sediment at a rate slightly higher than an undisturbed forest. This is not intended to imply that additional best management practices beyond those in the SMZ law should not be used for logging activities.
F2.7 C-Factor Derivation For purposes of the base (existing conditions) scenario, the following scheme of reclassification was used to derive annualized USLE C-factors from the NLCD land cover classes present in the Tobacco River watershed. Per Table F2-2 a C-factor slightly higher than a deciduous/evergreen forest was used for logged areas (i.e. transitional) because logging intensity within the watershed is generally low and because practices, such as riparian clear-cutting, that tend to produce high sediment yields have not been used since at least 1991, when the MT Streamside Management Zone (SMZ) law was enacted. Additionally, the USLE model is intended to reflect long-term average sediment yield, and while a sediment pulse typically occurs in the first year after logging, sediment production after the first year rapidly declines. The logging C-factor is the same for both management scenarios to indicate that logging will continue sporadically on public and private land within the watershed and will produce sediment at a rate slightly higher than an undisturbed forest. This is not intended to imply that additional best management practices beyond those in the SMZ law should not be used for logging activities. The other land use categories were reclassified based on the NRCS table “C-Factors for Permanent Pasture, Rangeland, Idle Land, and Grazed Woodland”, which was developed with the assistance and input of local NRCS and USFS employees. A narrative description of the professional judgment involved in the selection of these factors and the NRCS table are provided in Appendix F, Attachment A. To estimate the potential reduction in sediment production that might be accomplished under a best management practices scenario, the model was re-run using a different C-factor reclassification scheme. Relative to the existing conditions C-factor scheme, the BMP C-factor for the ‘transitional’ land classification was changed to reflect the forest cover that most such areas are transitioning to in the Tobacco River watershed. The ‘grasslands/herbaceous’, and ‘pasture/hay’ BMP C-factors were conservatively changed to reflect a 10 percent increase in ground cover over existing conditions. The ‘cultivated crops’ BMP C-factor was changed to reflect a 20 percent increase in ground cover over existing conditions. These changes result in a C-factor matrix for BMP conditions shown in Table F2-3.
Tobacco Planning Area Sediment TMDLs and Framework Water Quality Improvement Plan – Appendix F
9/16/11 FINAL F-12
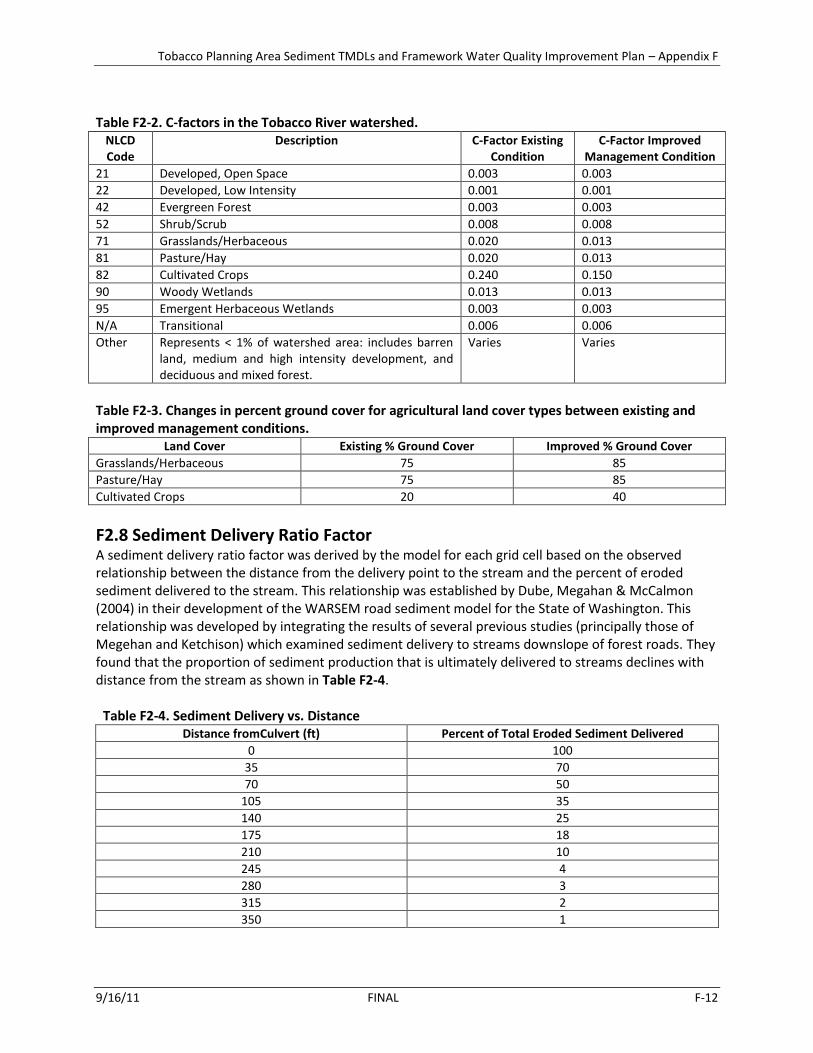
Table F2-2. C-factors in the Tobacco River watershed.
NLCD Code
Description C-Factor Existing Condition
C-Factor Improved Management Condition
21 Developed, Open Space 0.003 0.003
22 Developed, Low Intensity 0.001 0.001
42 Evergreen Forest 0.003 0.003
52 Shrub/Scrub 0.008 0.008
71 Grasslands/Herbaceous 0.020 0.013
81 Pasture/Hay 0.020 0.013
82 Cultivated Crops 0.240 0.150
90 Woody Wetlands 0.013 0.013
95 Emergent Herbaceous Wetlands 0.003 0.003
N/A Transitional 0.006 0.006
Other Represents < 1% of watershed area: includes barren land, medium and high intensity development, and deciduous and mixed forest.
Varies Varies
Table F2-3. Changes in percent ground cover for agricultural land cover types between existing and improved management conditions.
Land Cover Existing % Ground Cover Improved % Ground Cover
Grasslands/Herbaceous 75 85
Pasture/Hay 75 85
Cultivated Crops 20 40
F2.8 Sediment Delivery Ratio Factor A sediment delivery ratio factor was derived by the model for each grid cell based on the observed relationship between the distance from the delivery point to the stream and the percent of eroded sediment delivered to the stream. This relationship was established by Dube, Megahan & McCalmon (2004) in their development of the WARSEM road sediment model for the State of Washington. This relationship was developed by integrating the results of several previous studies (principally those of Megehan and Ketchison) which examined sediment delivery to streams downslope of forest roads. They found that the proportion of sediment production that is ultimately delivered to streams declines with distance from the stream as shown in Table F2-4.
Table F2-4. Sediment Delivery vs. Distance Distance fromCulvert (ft) Percent of Total Eroded Sediment Delivered
0 100
35 70
70 50
105 35
140 25
175 18
210 10
245 4
280 3
315 2
350 1

Tobacco Planning Area Sediment TMDLs and Framework Water Quality Improvement Plan – Appendix F
9/16/11 FINAL F-13
We believe the use of this relationship to develop a sediment delivery ratio for a USLE based model is a conservative (i.e. tending toward the high end of the range of reasonable values) estimate of sediment delivery from hillslope erosion, especially in light of the fact that the USLE methodology does not account for gully erosion. This factor was applied to the results of the USLE model to estimate sediment delivered from hillslope sources, by calculating the flow distance from each cell to the nearest stream channel, and multiplying the sediment production of that cell by the corresponding distance based percentage of delivery.
F2.9 Riparian Health Assessment Based Sediment Delivery Ratio Factor Well vegetated riparian buffers have been shown to act as filters that help to remove sediment from overland flow. Because of this ability, the influence of riparian corridors on water quality is proportionately much greater than the relatively small area in the landscape they occupy. In general, the effectiveness of vegetated riparian buffers is proportional to their width and overall health. DEQ completed a riparian health assessment in the Tobacco River watershed, encompassing the Tobacco River mainstem and its primary tributary streams. Ratings of poor, fair, and good were assigned by the riparian health assessment to the left and right bank of multiple reaches on each surveyed stream. The results of this assessment are shown in Figure 2-5. This information can be used to estimate further reduction in the quantity of eroded sediment that is ultimately delivered to the streams.

Tobacco Planning Area Sediment TMDLs and Framework Water Quality Improvement Plan – Appendix F
9/16/11 FINAL F-14
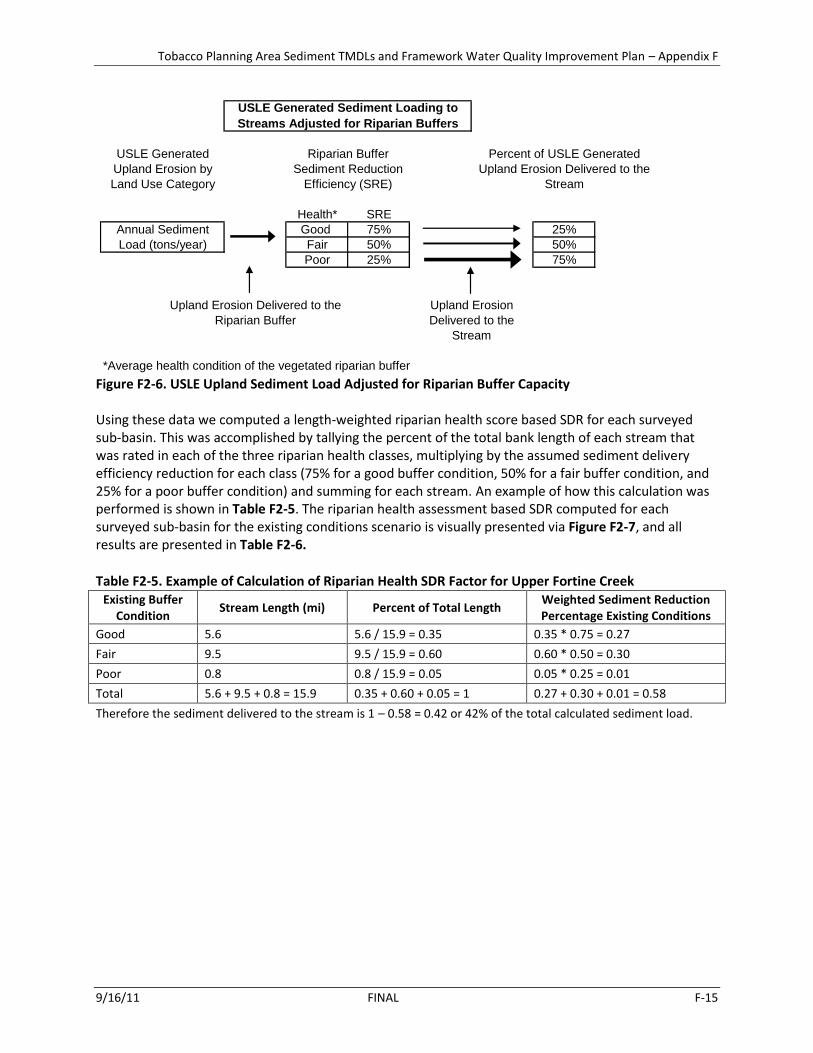
Figure F2-5. Riparian Health Assessment for the Tobacco River and its Primary Tributaries For this analysis, a sediment reduction efficiency of 75% was assumed to represent the loading condition for a healthy (good) vegetated riparian buffer. With 75% removal, 25% of the USLE generated upland hillslope load is delivered to the stream. As the condition of the riparian buffer declines or is degraded, sediment reduction efficiencies of 50% and 25% are assumed to represent the loading condition for moderately (fair) and heavily (poor) disturbed conditions. That is, as the overall health of the vegetated riparian buffer is degraded, hence reducing its buffering capacity, sediment loading delivered to the stream from upland sources increases (Figure F2-6).
Tobacco Planning Area Sediment TMDLs and Framework Water Quality Improvement Plan – Appendix F
9/16/11 FINAL F-15
Health* SRE
Good 75% 25%
Fair 50% 50%
Poor 25% 75%
*Average health condition of the vegetated riparian buffer
Annual Sediment
Load (tons/year)
Upland Erosion Delivered to the
Riparian Buffer
Upland Erosion
Delivered to the
Stream
USLE Generated Sediment Loading to
Streams Adjusted for Riparian Buffers
USLE Generated
Upland Erosion by
Land Use Category
Riparian Buffer
Sediment Reduction
Efficiency (SRE)
Percent of USLE Generated
Upland Erosion Delivered to the
Stream
Figure F2-6. USLE Upland Sediment Load Adjusted for Riparian Buffer Capacity Using these data we computed a length-weighted riparian health score based SDR for each surveyed sub-basin. This was accomplished by tallying the percent of the total bank length of each stream that was rated in each of the three riparian health classes, multiplying by the assumed sediment delivery efficiency reduction for each class (75% for a good buffer condition, 50% for a fair buffer condition, and 25% for a poor buffer condition) and summing for each stream. An example of how this calculation was performed is shown in Table F2-5. The riparian health assessment based SDR computed for each surveyed sub-basin for the existing conditions scenario is visually presented via Figure F2-7, and all results are presented in Table F2-6.
Table F2-5. Example of Calculation of Riparian Health SDR Factor for Upper Fortine Creek Existing Buffer
Condition Stream Length (mi) Percent of Total Length
Weighted Sediment Reduction Percentage Existing Conditions
Good 5.6 5.6 / 15.9 = 0.35 0.35 * 0.75 = 0.27
Fair 9.5 9.5 / 15.9 = 0.60 0.60 * 0.50 = 0.30
Poor 0.8 0.8 / 15.9 = 0.05 0.05 * 0.25 = 0.01
Total 5.6 + 9.5 + 0.8 = 15.9 0.35 + 0.60 + 0.05 = 1 0.27 + 0.30 + 0.01 = 0.58
Therefore the sediment delivered to the stream is 1 – 0.58 = 0.42 or 42% of the total calculated sediment load.

Tobacco Planning Area Sediment TMDLs and Framework Water Quality Improvement Plan – Appendix F
9/16/11 FINAL F-16
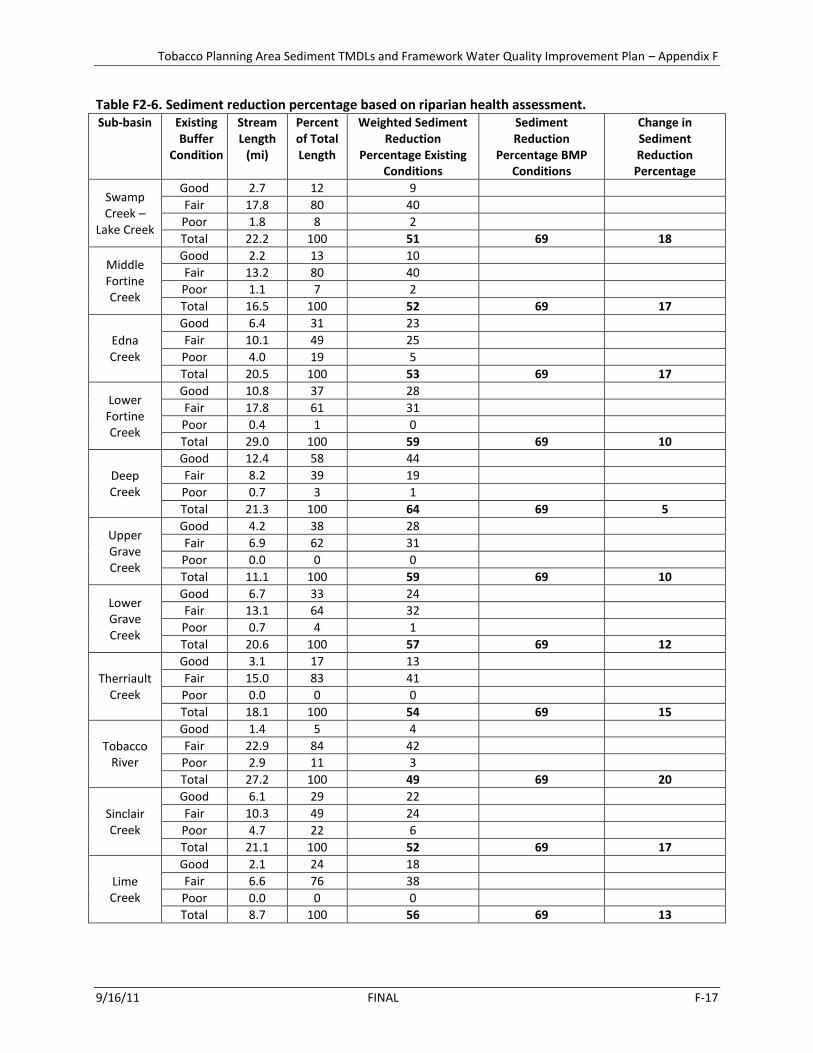
Figure F2-7. Riparian Health Sediment Delivery Reduction for the Tobacco River Watershed Table F2-6. Sediment reduction percentage based on riparian health assessment. Sub-basin Existing
Buffer Condition
Stream Length
(mi)
Percent of Total Length
Weighted Sediment Reduction
Percentage Existing Conditions
Sediment Reduction
Percentage BMP Conditions
Change in Sediment Reduction Percentage
Upper Fortine Creek
Good 5.6 35 27
Fair 9.5 60 30
Poor 0.8 5 1
Total 15.9 100 58 69 11
Tobacco Planning Area Sediment TMDLs and Framework Water Quality Improvement Plan – Appendix F
9/16/11 FINAL F-17
Table F2-6. Sediment reduction percentage based on riparian health assessment. Sub-basin Existing
Buffer Condition
Stream Length
(mi)
Percent of Total Length
Weighted Sediment Reduction
Percentage Existing Conditions
Sediment Reduction
Percentage BMP Conditions
Change in Sediment Reduction Percentage
Swamp Creek –
Lake Creek
Good 2.7 12 9
Fair 17.8 80 40
Poor 1.8 8 2
Total 22.2 100 51 69 18
Middle Fortine Creek
Good 2.2 13 10
Fair 13.2 80 40
Poor 1.1 7 2
Total 16.5 100 52 69 17
Edna Creek
Good 6.4 31 23
Fair 10.1 49 25
Poor 4.0 19 5
Total 20.5 100 53 69 17
Lower Fortine Creek
Good 10.8 37 28
Fair 17.8 61 31
Poor 0.4 1 0
Total 29.0 100 59 69 10
Deep Creek
Good 12.4 58 44
Fair 8.2 39 19
Poor 0.7 3 1
Total 21.3 100 64 69 5
Upper Grave Creek
Good 4.2 38 28
Fair 6.9 62 31
Poor 0.0 0 0
Total 11.1 100 59 69 10
Lower Grave Creek
Good 6.7 33 24
Fair 13.1 64 32
Poor 0.7 4 1
Total 20.6 100 57 69 12
Therriault Creek
Good 3.1 17 13
Fair 15.0 83 41
Poor 0.0 0 0
Total 18.1 100 54 69 15
Tobacco River
Good 1.4 5 4
Fair 22.9 84 42
Poor 2.9 11 3
Total 27.2 100 49 69 20
Sinclair Creek
Good 6.1 29 22
Fair 10.3 49 24
Poor 4.7 22 6
Total 21.1 100 52 69 17
Lime Creek
Good 2.1 24 18
Fair 6.6 76 38
Poor 0.0 0 0
Total 8.7 100 56 69 13

Tobacco Planning Area Sediment TMDLs and Framework Water Quality Improvement Plan – Appendix F
9/16/11 FINAL F-18
Additionally, a BMP condition of the riparian buffer was estimated. Under this condition, it is assumed that the implementation of BMPs on those activities that affect the overall health of the vegetated riparian buffer increases the watershed scale riparian health condition from its existing condition to 75% of the total stream length with a ‘good’ riparian health condition and 25% of the total stream length with a ‘fair’ condition. The concept is that through the application of BMPs, the general health of the vegetated riparian buffer will increase, hence increasing its sediment reduction efficiency. The BMP riparian health assessment based SDR computed for each sub-basin is also presented in Table F2-6 along with the difference from the existing to the improved condition. The riparian health assessment was not completed for the Meadow Creek and Indian Creek sub-watersheds. The Indian Creek sub-watershed was assumed to be similar to the Sinclair Creek sub-watershed and assigned a sediment delivery reduction of 52%. The Meadow Creek sub-watershed was assumed to be similar to the Middle Fortine Creek sub-watershed and therefore a sediment reduction of 52% was used.
F2.10 Sub-basins The Tobacco River watershed boundary and the sub-basin boundaries were defined using the USGS 6th code Hydrologic Unit Codes (HUC) (Figure F2-8). Lime Creek is the only 303(d) listed stream that was not represented in the 6th code HUCs. The Lime Creek sub-basin was cut from the Middle Fortine Creek sub-basin using USGS topography as a guide to drainage divides.

Tobacco Planning Area Sediment TMDLs and Framework Water Quality Improvement Plan – Appendix F
9/16/11 FINAL F-19
Figure F2-8. Sub-basin polygons for the Tobacco River Watershed
F3.0 RESULTS
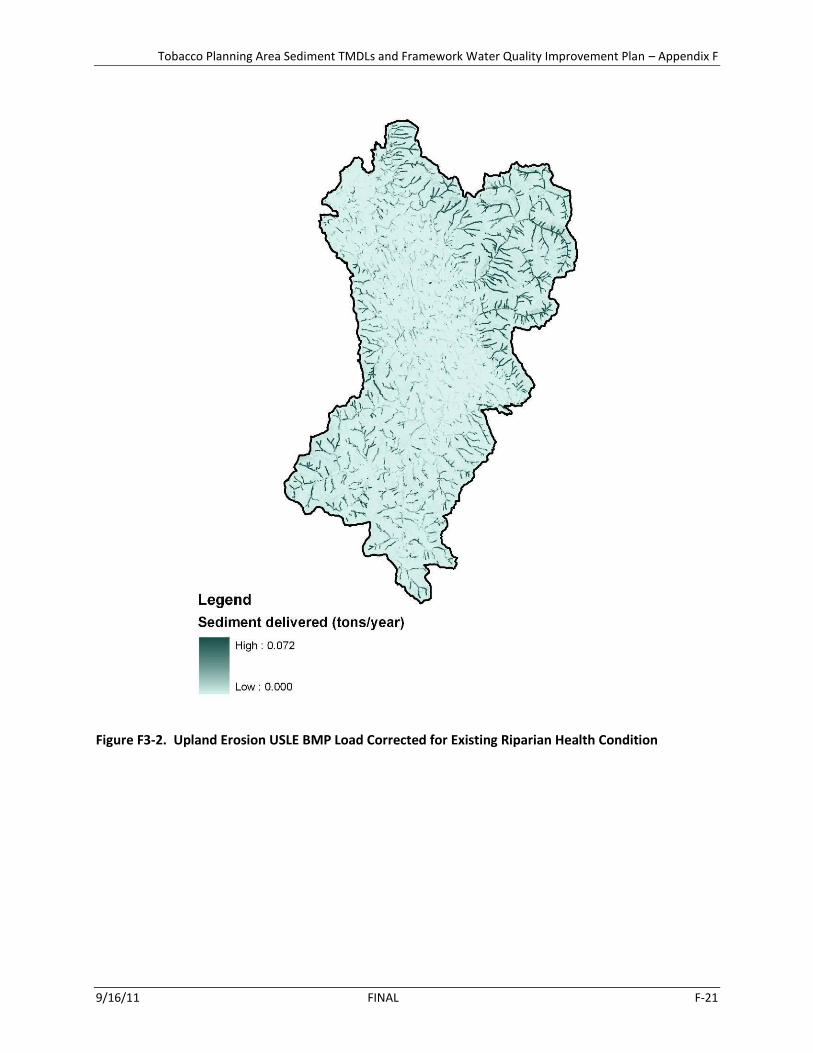
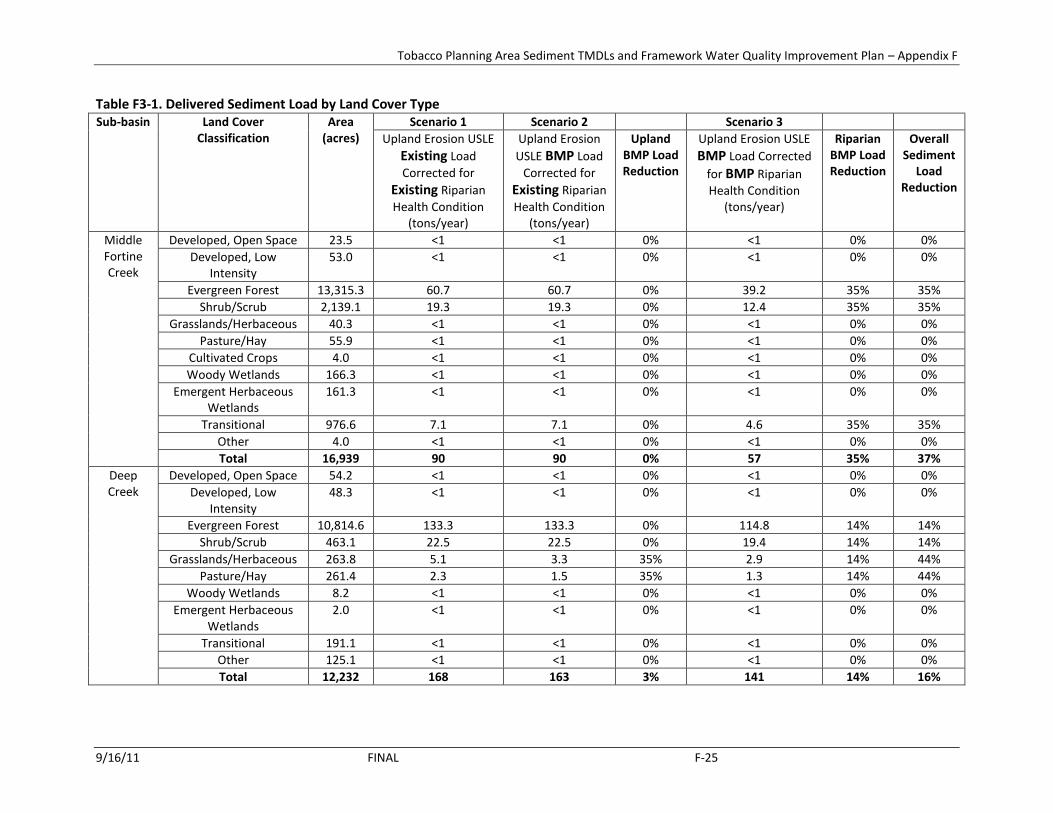
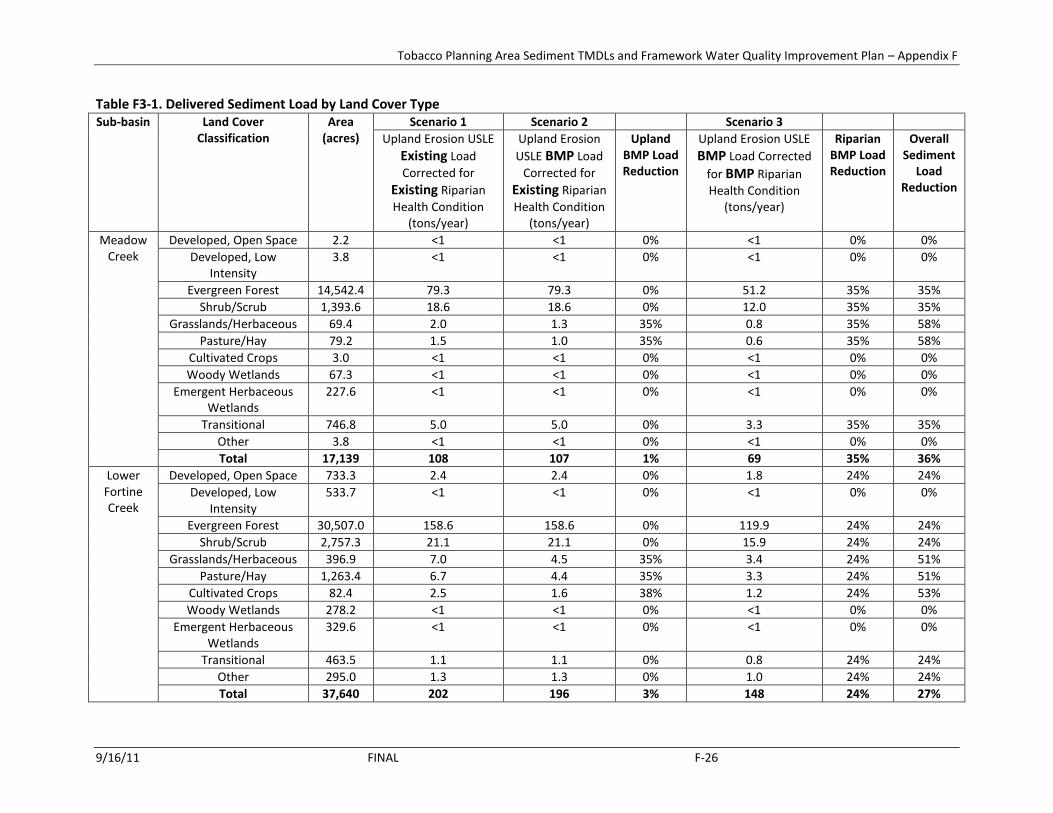
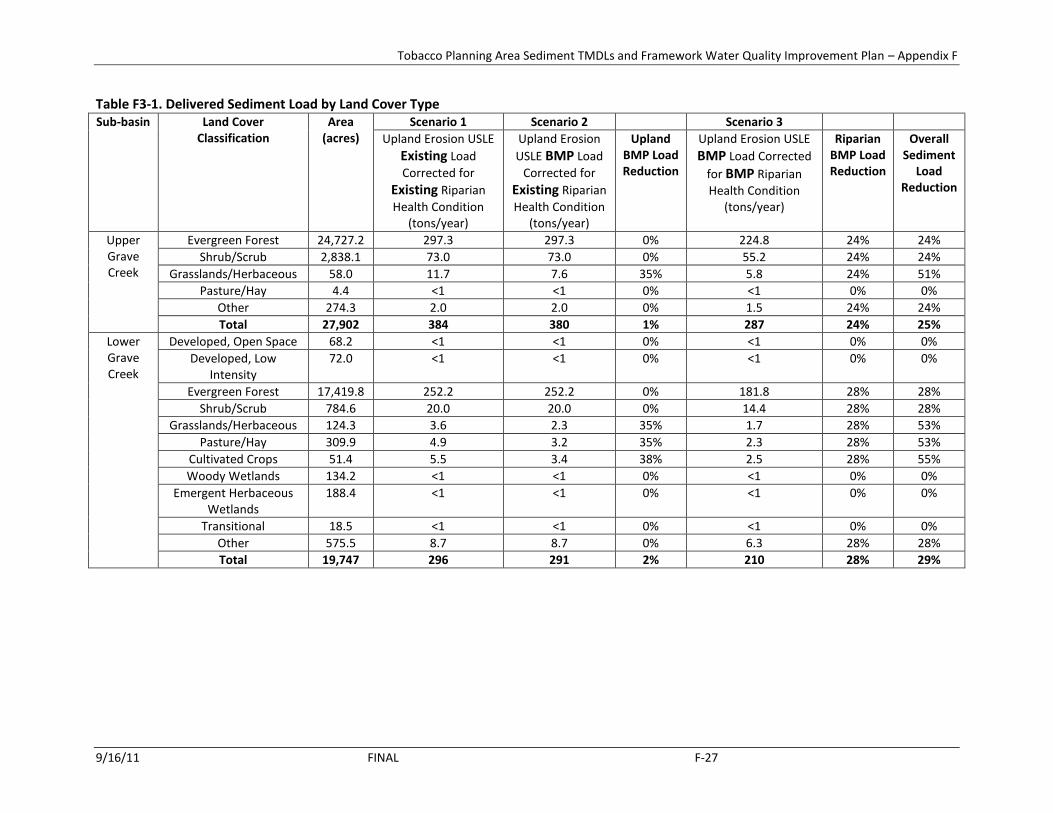
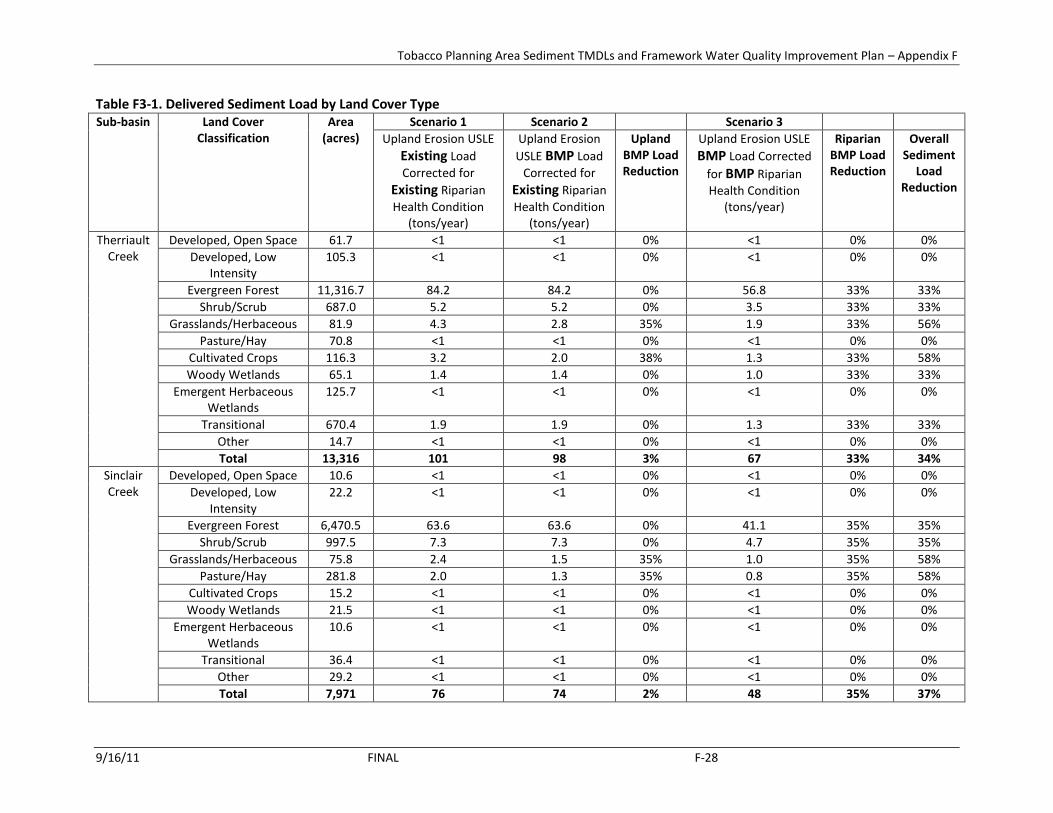
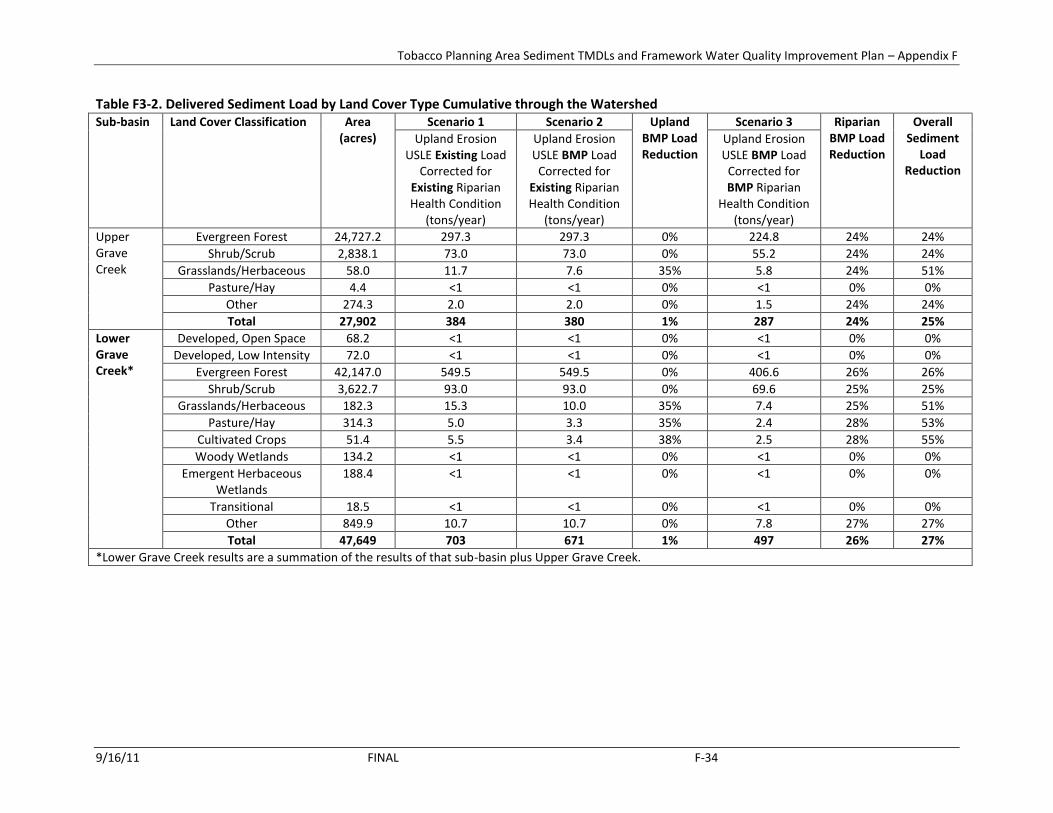
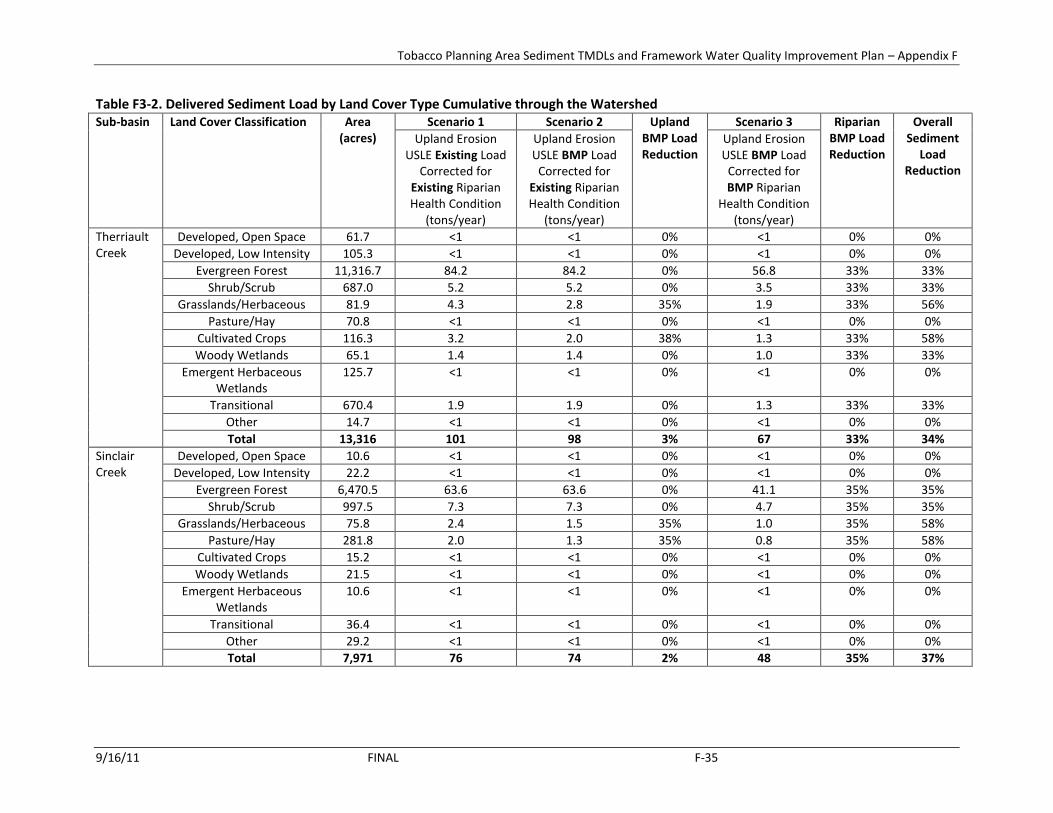
Figures F3-1, F3-2 and F3-3 present the USLE based hillslope model’s prediction of existing and potential conditions graphically. Table F3-1 presents the prediction of existing and potential conditions numerically, broken out by 6th code HUC (as modified to represent the 303d listed streams) and existing land cover type. Table F3-2 presents the delivered sediment load totals for the sub-basins and the cumulative totals within the watershed. In Table F3-1, the cumulative results for a sub-basin are a sum of the results for that sub-basin plus the sub-basins upstream of it. For example, Middle Fortine Creek is a sum of the results for that sub-basin plus the results for Edna Creek, Lime Creek, Upper Fortine Creek, and

Tobacco Planning Area Sediment TMDLs and Framework Water Quality Improvement Plan – Appendix F
9/16/11 FINAL F-20
SwampCreek/Lake Creek. The results for Tobacco River represent the total sediment load delivered from the entire watershed.
Figure F3-1. Upland Erosion USLE Existing Load Corrected for Existing Riparian Health Condition
Tobacco Planning Area Sediment TMDLs and Framework Water Quality Improvement Plan – Appendix F
9/16/11 FINAL F-21
Figure F3-2. Upland Erosion USLE BMP Load Corrected for Existing Riparian Health Condition

Tobacco Planning Area Sediment TMDLs and Framework Water Quality Improvement Plan – Appendix F
9/16/11 FINAL F-22
Figure F3-3. Upland Erosion USLE BMP Load Corrected for BMP Riparian Health Condition

Tobacco Planning Area Sediment TMDLs and Framework Water Quality Improvement Plan – Appendix F
9/16/11 FINAL F-23
Table F3-1. Delivered Sediment Load by Land Cover Type Sub-basin Land Cover
Classification Area
(acres) Scenario 1 Scenario 2 Scenario 3
Upland Erosion USLE
Existing Load
Corrected for
Existing Riparian
Health Condition (tons/year)
Upland Erosion
USLE BMP Load
Corrected for
Existing Riparian
Health Condition (tons/year)
Upland BMP Load Reduction
Upland Erosion USLE
BMP Load Corrected
for BMP Riparian
Health Condition (tons/year)
Riparian BMP Load Reduction
Overall Sediment
Load Reduction
Upper Fortine Creek
Developed, Open Space 15.6 <1 <1 0% <1 0% 0%
Developed, Low Intensity
32.9 <1 <1 0% <1 0% 0%
Evergreen Forest 18,697.5 92.4 92.4 0% 68.2 26% 26%
Shrub/Scrub 5,256.3 53.6 53.6 0% 39.5 26% 26%
Grasslands/Herbaceous 33.9 <1 <1 0% <1 0% 0%
Pasture/Hay 13.6 <1 <1 0% <1 0% 0%
Cultivated Crops 2.0 <1 <1 0% <1 0% 0%
Woody Wetlands 89.4 <1 <1 0% <1 0% 0%
Emergent Herbaceous Wetlands
72.9 <1 <1 0% <1 0% 0%
Transitional 602.5 1.6 1.6 0% 1.2 26% 26%
Other 17.6 <1 <1 0% <1 0% 0%
Total 24,834 150 150 0% 111 26% 26%
Swamp Creek –
Lake Creek
Developed, Open Space 2.9 <1 <1 0% <1 0% 0%
Evergreen Forest 17,900.7 131.4 131.4 0% 83.2 37% 37%
Shrub/Scrub 7,456.5 102.8 102.8 0% 65.0 37% 37%
Grasslands/Herbaceous 51.3 <1 <1 0% <1 0% 0%
Pasture/Hay 13.4 <1 <1 0% <1 0% 0%
Cultivated Crops 4.9 <1 <1 0% <1 0% 0%
Woody Wetlands 370.2 3.5 3.5 0% 2.2 37% 37%
Emergent Herbaceous Wetlands
562.4 <1 <1 0% <1 0% 0%
Transitional 2,258.1 14.5 14.5 0% 9.1 37% 37%
Total 28,620 252 252 0% 160 37% 37%

Tobacco Planning Area Sediment TMDLs and Framework Water Quality Improvement Plan – Appendix F
9/16/11 FINAL F-24
Table F3-1. Delivered Sediment Load by Land Cover Type Sub-basin Land Cover
Classification Area
(acres) Scenario 1 Scenario 2 Scenario 3
Upland Erosion USLE
Existing Load
Corrected for
Existing Riparian
Health Condition (tons/year)
Upland Erosion
USLE BMP Load
Corrected for
Existing Riparian
Health Condition (tons/year)
Upland BMP Load Reduction
Upland Erosion USLE
BMP Load Corrected
for BMP Riparian
Health Condition (tons/year)
Riparian BMP Load Reduction
Overall Sediment
Load Reduction
Lime Creek
Developed, Open Space 4.7 <1 <1 0% <1 0% 0%
Developed, Low Intensity
25.5 <1 <1 0% <1 0% 0%
Evergreen Forest 4,986.9 28.4 28.4 0% 20.0 30% 30%
Shrub/Scrub 515.5 2.1 2.1 0% 1.5 30% 30%
Grasslands/Herbaceous 8.6 <1 <1 0% <1 0% 0%
Pasture/Hay 47.4 <1 <1 0% <1 0% 0%
Cultivated Crops 3.4 <1 <1 0% <1 0% 0%
Woody Wetlands 22.2 <1 <1 0% <1 0% 0%
Emergent Herbaceous Wetlands
66.6 <1 <1 0% <1 0% 0%
Transitional 645.2 4.9 4.9 0% 3.4 30% 30%
Other 3.8 <1 <1 0% <1 0% 0%
Total 6,330 35 35 0% 25 29% 29%
Edna Creek
Evergreen Forest 12,040.4 66.3 66.3 0% 43.7 34% 34%
Shrub/Scrub 1,848.1 25.2 25.2 0% 16.6 34% 34%
Grasslands/Herbaceous 31.4 1.1 0.7 35% 0.5 34% 57%
Pasture/Hay 13.5 <1 <1 0% <1 0% 0%
Cultivated Crops 3.4 <1 <1 0% <1 0% 0%
Woody Wetlands 45.3 <1 <1 0% <1 0% 0%
Emergent Herbaceous Wetlands
149.1 <1 <1 0% <1 0% 0%
Transitional 582.5 4.3 4.3 0% 2.8 34% 34%
Total 14,714 99 98 1% 64 34% 35%
Tobacco Planning Area Sediment TMDLs and Framework Water Quality Improvement Plan – Appendix F
9/16/11 FINAL F-25
Table F3-1. Delivered Sediment Load by Land Cover Type Sub-basin Land Cover
Classification Area
(acres) Scenario 1 Scenario 2 Scenario 3
Upland Erosion USLE
Existing Load
Corrected for
Existing Riparian
Health Condition (tons/year)
Upland Erosion
USLE BMP Load
Corrected for
Existing Riparian
Health Condition (tons/year)
Upland BMP Load Reduction
Upland Erosion USLE
BMP Load Corrected
for BMP Riparian
Health Condition (tons/year)
Riparian BMP Load Reduction
Overall Sediment
Load Reduction
Middle Fortine Creek
Developed, Open Space 23.5 <1 <1 0% <1 0% 0%
Developed, Low Intensity
53.0 <1 <1 0% <1 0% 0%
Evergreen Forest 13,315.3 60.7 60.7 0% 39.2 35% 35%
Shrub/Scrub 2,139.1 19.3 19.3 0% 12.4 35% 35%
Grasslands/Herbaceous 40.3 <1 <1 0% <1 0% 0%
Pasture/Hay 55.9 <1 <1 0% <1 0% 0%
Cultivated Crops 4.0 <1 <1 0% <1 0% 0%
Woody Wetlands 166.3 <1 <1 0% <1 0% 0%
Emergent Herbaceous Wetlands
161.3 <1 <1 0% <1 0% 0%
Transitional 976.6 7.1 7.1 0% 4.6 35% 35%
Other 4.0 <1 <1 0% <1 0% 0%
Total 16,939 90 90 0% 57 35% 37%
Deep Creek
Developed, Open Space 54.2 <1 <1 0% <1 0% 0%
Developed, Low Intensity
48.3 <1 <1 0% <1 0% 0%
Evergreen Forest 10,814.6 133.3 133.3 0% 114.8 14% 14%
Shrub/Scrub 463.1 22.5 22.5 0% 19.4 14% 14%
Grasslands/Herbaceous 263.8 5.1 3.3 35% 2.9 14% 44%
Pasture/Hay 261.4 2.3 1.5 35% 1.3 14% 44%
Woody Wetlands 8.2 <1 <1 0% <1 0% 0%
Emergent Herbaceous Wetlands
2.0 <1 <1 0% <1 0% 0%
Transitional 191.1 <1 <1 0% <1 0% 0%
Other 125.1 <1 <1 0% <1 0% 0%
Total 12,232 168 163 3% 141 14% 16%
Tobacco Planning Area Sediment TMDLs and Framework Water Quality Improvement Plan – Appendix F
9/16/11 FINAL F-26
Table F3-1. Delivered Sediment Load by Land Cover Type Sub-basin Land Cover
Classification Area
(acres) Scenario 1 Scenario 2 Scenario 3
Upland Erosion USLE
Existing Load
Corrected for
Existing Riparian
Health Condition (tons/year)
Upland Erosion
USLE BMP Load
Corrected for
Existing Riparian
Health Condition (tons/year)
Upland BMP Load Reduction
Upland Erosion USLE
BMP Load Corrected
for BMP Riparian
Health Condition (tons/year)
Riparian BMP Load Reduction
Overall Sediment
Load Reduction
Meadow Creek
Developed, Open Space 2.2 <1 <1 0% <1 0% 0%
Developed, Low Intensity
3.8 <1 <1 0% <1 0% 0%
Evergreen Forest 14,542.4 79.3 79.3 0% 51.2 35% 35%
Shrub/Scrub 1,393.6 18.6 18.6 0% 12.0 35% 35%
Grasslands/Herbaceous 69.4 2.0 1.3 35% 0.8 35% 58%
Pasture/Hay 79.2 1.5 1.0 35% 0.6 35% 58%
Cultivated Crops 3.0 <1 <1 0% <1 0% 0%
Woody Wetlands 67.3 <1 <1 0% <1 0% 0%
Emergent Herbaceous Wetlands
227.6 <1 <1 0% <1 0% 0%
Transitional 746.8 5.0 5.0 0% 3.3 35% 35%
Other 3.8 <1 <1 0% <1 0% 0%
Total 17,139 108 107 1% 69 35% 36%
Lower Fortine Creek
Developed, Open Space 733.3 2.4 2.4 0% 1.8 24% 24%
Developed, Low Intensity
533.7 <1 <1 0% <1 0% 0%
Evergreen Forest 30,507.0 158.6 158.6 0% 119.9 24% 24%
Shrub/Scrub 2,757.3 21.1 21.1 0% 15.9 24% 24%
Grasslands/Herbaceous 396.9 7.0 4.5 35% 3.4 24% 51%
Pasture/Hay 1,263.4 6.7 4.4 35% 3.3 24% 51%
Cultivated Crops 82.4 2.5 1.6 38% 1.2 24% 53%
Woody Wetlands 278.2 <1 <1 0% <1 0% 0%
Emergent Herbaceous Wetlands
329.6 <1 <1 0% <1 0% 0%
Transitional 463.5 1.1 1.1 0% 0.8 24% 24%
Other 295.0 1.3 1.3 0% 1.0 24% 24%
Total 37,640 202 196 3% 148 24% 27%
Tobacco Planning Area Sediment TMDLs and Framework Water Quality Improvement Plan – Appendix F
9/16/11 FINAL F-27
Table F3-1. Delivered Sediment Load by Land Cover Type Sub-basin Land Cover
Classification Area
(acres) Scenario 1 Scenario 2 Scenario 3
Upland Erosion USLE
Existing Load
Corrected for
Existing Riparian
Health Condition (tons/year)
Upland Erosion
USLE BMP Load
Corrected for
Existing Riparian
Health Condition (tons/year)
Upland BMP Load Reduction
Upland Erosion USLE
BMP Load Corrected
for BMP Riparian
Health Condition (tons/year)
Riparian BMP Load Reduction
Overall Sediment
Load Reduction
Upper Grave Creek
Evergreen Forest 24,727.2 297.3 297.3 0% 224.8 24% 24%
Shrub/Scrub 2,838.1 73.0 73.0 0% 55.2 24% 24%
Grasslands/Herbaceous 58.0 11.7 7.6 35% 5.8 24% 51%
Pasture/Hay 4.4 <1 <1 0% <1 0% 0%
Other 274.3 2.0 2.0 0% 1.5 24% 24%
Total 27,902 384 380 1% 287 24% 25%
Lower Grave Creek
Developed, Open Space 68.2 <1 <1 0% <1 0% 0%
Developed, Low Intensity
72.0 <1 <1 0% <1 0% 0%
Evergreen Forest 17,419.8 252.2 252.2 0% 181.8 28% 28%
Shrub/Scrub 784.6 20.0 20.0 0% 14.4 28% 28%
Grasslands/Herbaceous 124.3 3.6 2.3 35% 1.7 28% 53%
Pasture/Hay 309.9 4.9 3.2 35% 2.3 28% 53%
Cultivated Crops 51.4 5.5 3.4 38% 2.5 28% 55%
Woody Wetlands 134.2 <1 <1 0% <1 0% 0%
Emergent Herbaceous Wetlands
188.4 <1 <1 0% <1 0% 0%
Transitional 18.5 <1 <1 0% <1 0% 0%
Other 575.5 8.7 8.7 0% 6.3 28% 28%
Total 19,747 296 291 2% 210 28% 29%
Tobacco Planning Area Sediment TMDLs and Framework Water Quality Improvement Plan – Appendix F
9/16/11 FINAL F-28
Table F3-1. Delivered Sediment Load by Land Cover Type Sub-basin Land Cover
Classification Area
(acres) Scenario 1 Scenario 2 Scenario 3
Upland Erosion USLE
Existing Load
Corrected for
Existing Riparian
Health Condition (tons/year)
Upland Erosion
USLE BMP Load
Corrected for
Existing Riparian
Health Condition (tons/year)
Upland BMP Load Reduction
Upland Erosion USLE
BMP Load Corrected
for BMP Riparian
Health Condition (tons/year)
Riparian BMP Load Reduction
Overall Sediment
Load Reduction
Therriault Creek
Developed, Open Space 61.7 <1 <1 0% <1 0% 0%
Developed, Low Intensity
105.3 <1 <1 0% <1 0% 0%
Evergreen Forest 11,316.7 84.2 84.2 0% 56.8 33% 33%
Shrub/Scrub 687.0 5.2 5.2 0% 3.5 33% 33%
Grasslands/Herbaceous 81.9 4.3 2.8 35% 1.9 33% 56%
Pasture/Hay 70.8 <1 <1 0% <1 0% 0%
Cultivated Crops 116.3 3.2 2.0 38% 1.3 33% 58%
Woody Wetlands 65.1 1.4 1.4 0% 1.0 33% 33%
Emergent Herbaceous Wetlands
125.7 <1 <1 0% <1 0% 0%
Transitional 670.4 1.9 1.9 0% 1.3 33% 33%
Other 14.7 <1 <1 0% <1 0% 0%
Total 13,316 101 98 3% 67 33% 34%
Sinclair Creek
Developed, Open Space 10.6 <1 <1 0% <1 0% 0%
Developed, Low Intensity
22.2 <1 <1 0% <1 0% 0%
Evergreen Forest 6,470.5 63.6 63.6 0% 41.1 35% 35%
Shrub/Scrub 997.5 7.3 7.3 0% 4.7 35% 35%
Grasslands/Herbaceous 75.8 2.4 1.5 35% 1.0 35% 58%
Pasture/Hay 281.8 2.0 1.3 35% 0.8 35% 58%
Cultivated Crops 15.2 <1 <1 0% <1 0% 0%
Woody Wetlands 21.5 <1 <1 0% <1 0% 0%
Emergent Herbaceous Wetlands
10.6 <1 <1 0% <1 0% 0%
Transitional 36.4 <1 <1 0% <1 0% 0%
Other 29.2 <1 <1 0% <1 0% 0%
Total 7,971 76 74 2% 48 35% 37%

Tobacco Planning Area Sediment TMDLs and Framework Water Quality Improvement Plan – Appendix F
9/16/11 FINAL F-29
Table F3-1. Delivered Sediment Load by Land Cover Type Sub-basin Land Cover
Classification Area
(acres) Scenario 1 Scenario 2 Scenario 3
Upland Erosion USLE
Existing Load
Corrected for
Existing Riparian
Health Condition (tons/year)
Upland Erosion
USLE BMP Load
Corrected for
Existing Riparian
Health Condition (tons/year)
Upland BMP Load Reduction
Upland Erosion USLE
BMP Load Corrected
for BMP Riparian
Health Condition (tons/year)
Riparian BMP Load Reduction
Overall Sediment
Load Reduction
Indian Creek
Developed, Open Space 73.9 <1 <1 0% <1 0% 0%
Developed, Low Intensity
38.7 <1 <1 0% <1 0% 0%
Evergreen Forest 6,606.4 89.0 89.0 0% 57.5 35% 35%
Shrub/Scrub 2,815.6 20.7 20.7 0% 13.3 35% 35%
Grasslands/Herbaceous 512.1 5.5 3.6 35% 2.3 35% 58%
Pasture/Hay 657.8 6.4 4.2 35% 2.7 35% 58%
Cultivated Crops 286.1 7.7 4.8 38% 3.1 35% 60%
Woody Wetlands 26.3 <1 <1 0% <1 0% 0%
Emergent Herbaceous Wetlands
12.7 <1 <1 0% <1 0% 0%
Transitional 100.5 2.4 2.4 0% 1.6 35% 35%
Other 42.1 <1 <1 0% <1 0% 0%
Total 11,172 132 125 5% 81 35% 39%
Tobacco River
Developed, Open Space 308.3 <1 <1 0% <1 0% 0%
Developed, Low Intensity
556.0 <1 <1 0% <1 0% 0%
Evergreen Forest 23,647.6 112.4 112.4 0% 68.3 39% 39%
Shrub/Scrub 9,155.9 47.7 47.7 0% 29.0 39% 39%
Grasslands/Herbaceous 1,265.4 9.2 6.0 35% 3.6 39% 60%
Pasture/Hay 1,222.7 10.7 7.0 35% 4.2 39% 60%
Cultivated Crops 465.0 13.7 8.6 38% 5.2 39% 62%
Woody Wetlands 247.4 2.3 2.3 0% 1.4 39% 39%
Emergent Herbaceous Wetlands
277.4 <1 <1 0% <1 0% 0%
Transitional 1,138.5 4.9 4.9 0% 3.0 39% 39%
Other 227.2 <1 <1 0% <1 0% 0%
Total 38,511 202 190 6% 116 39% 43%

Tobacco Planning Area Sediment TMDLs and Framework Water Quality Improvement Plan – Appendix F
9/16/11 FINAL F-30
Table F3-2. Delivered Sediment Load by Land Cover Type Cumulative through the Watershed Sub-basin Land Cover Classification Area
(acres) Scenario 1 Scenario 2 Upland
BMP Load Reduction
Scenario 3 Riparian BMP Load Reduction
Overall Sediment
Load Reduction
Upland Erosion USLE Existing Load
Corrected for Existing Riparian Health Condition
(tons/year)
Upland Erosion USLE BMP Load
Corrected for Existing Riparian Health Condition
(tons/year)
Upland Erosion USLE BMP Load
Corrected for BMP Riparian
Health Condition (tons/year)
Upper Fortine Creek
Developed, Open Space 15.6 <1 <1 0% <1 0% 0%
Developed, Low Intensity 32.9 <1 <1 0% <1 0% 0%
Evergreen Forest 18,697.5 92.4 92.4 0% 68.2 26% 26%
Shrub/Scrub 5,256.3 53.6 53.6 0% 39.5 26% 26%
Grasslands/Herbaceous 33.9 <1 <1 0% <1 0% 0%
Pasture/Hay 13.6 <1 <1 0% <1 0% 0%
Cultivated Crops 2.0 <1 <1 0% <1 0% 0%
Woody Wetlands 89.4 <1 <1 0% <1 0% 0%
Emergent Herbaceous Wetlands
72.9 <1 <1 0% <1 0% 0%
Transitional 602.5 1.6 1.6 0% 1.2 26% 26%
Other 17.6 <1 <1 0% <1 0% 0%
Total 24,834 150 150 0% 111 26% 26%
Swamp Creek –Lake Creek
Developed, Open Space 2.9 <1 <1 0% <1 0% 0%
Evergreen Forest 17,900.7 131.4 131.4 0% 83.2 37% 37%
Shrub/Scrub 7,456.5 102.8 102.8 0% 65.0 37% 37%
Grasslands/Herbaceous 51.3 <1 <1 0% <1 0% 0%
Pasture/Hay 13.4 <1 <1 0% <1 0% 0%
Cultivated Crops 4.9 <1 <1 0% <1 0% 0%
Woody Wetlands 370.2 3.5 3.5 0% 2.2 37% 37%
Emergent Herbaceous Wetlands
562.4 <1 <1 0% <1 0% 0%
Transitional 2,258.1 14.5 14.5 0% 9.1 37% 37%
Total 28,620 252 252 0% 160 37% 37%

Tobacco Planning Area Sediment TMDLs and Framework Water Quality Improvement Plan – Appendix F
9/16/11 FINAL F-31
Table F3-2. Delivered Sediment Load by Land Cover Type Cumulative through the Watershed Sub-basin Land Cover Classification Area
(acres) Scenario 1 Scenario 2 Upland
BMP Load Reduction
Scenario 3 Riparian BMP Load Reduction
Overall Sediment
Load Reduction
Upland Erosion USLE Existing Load
Corrected for Existing Riparian Health Condition
(tons/year)
Upland Erosion USLE BMP Load
Corrected for Existing Riparian Health Condition
(tons/year)
Upland Erosion USLE BMP Load
Corrected for BMP Riparian
Health Condition (tons/year)
Lime Creek Developed, Open Space 4.7 <1 <1 0% <1 0% 0%
Developed, Low Intensity 25.5 <1 <1 0% <1 0% 0%
Evergreen Forest 4,986.9 28.4 28.4 0% 20.0 30% 30%
Shrub/Scrub 515.5 2.1 2.1 0% 1.5 30% 30%
Grasslands/Herbaceous 8.6 <1 <1 0% <1 0% 0%
Pasture/Hay 47.4 <1 <1 0% <1 0% 0%
Cultivated Crops 3.4 <1 <1 0% <1 0% 0%
Woody Wetlands 22.2 <1 <1 0% <1 0% 0%
Emergent Herbaceous Wetlands
66.6 <1 <1 0% <1 0% 0%
Transitional 645.2 4.9 4.9 0% 3.4 30% 30%
Other 3.8 <1 <1 0% <1 0% 0%
Total 6,330 35 35 0% 25 29% 29%
Edna Creek
Evergreen Forest 12,040.4 66.3 66.3 0% 43.7 34% 34%
Shrub/Scrub 1,848.1 25.2 25.2 0% 16.6 34% 34%
Grasslands/Herbaceous 31.4 1.1 0.7 35% 0.5 34% 57%
Pasture/Hay 13.5 <1 <1 0% <1 0% 0%
Cultivated Crops 3.4 <1 <1 0% <1 0% 0%
Woody Wetlands 45.3 <1 <1 0% <1 0% 0%
Emergent Herbaceous Wetlands
149.1 <1 <1 0% <1 0% 0%
Transitional 582.5 4.3 4.3 0% 2.8 34% 34%
Total 14,714 99 98 1% 64 34% 35%

Tobacco Planning Area Sediment TMDLs and Framework Water Quality Improvement Plan – Appendix F
9/16/11 FINAL F-32
Table F3-2. Delivered Sediment Load by Land Cover Type Cumulative through the Watershed Sub-basin Land Cover Classification Area
(acres) Scenario 1 Scenario 2 Upland
BMP Load Reduction
Scenario 3 Riparian BMP Load Reduction
Overall Sediment
Load Reduction
Upland Erosion USLE Existing Load
Corrected for Existing Riparian Health Condition
(tons/year)
Upland Erosion USLE BMP Load
Corrected for Existing Riparian Health Condition
(tons/year)
Upland Erosion USLE BMP Load
Corrected for BMP Riparian
Health Condition (tons/year)
Middle Fortine Creek*
Developed, Open Space 46.6 <1 <1 0% <1 0% 0%
Developed, Low Intensity 111.4 <1 <1 0% <1 0% 0%
Evergreen Forest 66,940.7 379.3 379.3 0% 254.4 33% 33%
Shrub/Scrub 17,215.6 202.9 202.9 0% 135.1 33% 33%
Grasslands/Herbaceous 165.4 3.3 2.2 35% 1.4 33% 57%
Pasture/Hay 143.8 1.6 1.1 35% 0.7 34% 57%
Cultivated Crops 17.7 <1 <1 0% <1 0% 0%
Woody Wetlands 693.4 5.6 5.6 0% 3.7 35% 35%
Emergent Herbaceous Wetlands
1,012.3 1.6 1.6 0% 1.1 35% 35%
Transitional 5,064.9 32.4 32.4 0% 21.4 34% 34%
Other 25.3 <1 <1 0% <1 0% 0%
Total 91,437 629 628 0% 417 34% 34%
*Middle Fortine Creek results are a summation of the results of that sub-basin plus Edna Creek, Lime Creek, Upper Fortine Creek, and Swamp Creek/Lake Creek.
Deep Creek
Developed, Open Space 54.2 <1 <1 0% <1 0% 0%
Developed, Low Intensity 48.3 <1 <1 0% <1 0% 0%
Evergreen Forest 10,814.6 133.3 133.3 0% 114.8 14% 14%
Shrub/Scrub 463.1 22.5 22.5 0% 19.4 14% 14%
Grasslands/Herbaceous 263.8 5.1 3.3 35% 2.9 14% 44%
Pasture/Hay 261.4 2.3 1.5 35% 1.3 14% 44%
Woody Wetlands 8.2 <1 <1 0% <1 0% 0%
Emergent Herbaceous Wetlands
2.0 <1 <1 0% <1 0% 0%
Transitional 191.1 <1 <1 0% <1 0% 0%
Other 125.1 <1 <1 0% <1 0% 0%
Total 12,232 168 163 3% 141 14% 16%

Tobacco Planning Area Sediment TMDLs and Framework Water Quality Improvement Plan – Appendix F
9/16/11 FINAL F-33
Table F3-2. Delivered Sediment Load by Land Cover Type Cumulative through the Watershed Sub-basin Land Cover Classification Area
(acres) Scenario 1 Scenario 2 Upland
BMP Load Reduction
Scenario 3 Riparian BMP Load Reduction
Overall Sediment
Load Reduction
Upland Erosion USLE Existing Load
Corrected for Existing Riparian Health Condition
(tons/year)
Upland Erosion USLE BMP Load
Corrected for Existing Riparian Health Condition
(tons/year)
Upland Erosion USLE BMP Load
Corrected for BMP Riparian
Health Condition (tons/year)
Meadow Creek
Developed, Open Space 2.2 <1 <1 0% <1 0% 0%
Developed, Low Intensity 3.8 <1 <1 0% <1 0% 0%
Evergreen Forest 14,542.4 79.3 79.3 0% 51.2 35% 35%
Shrub/Scrub 1,393.6 18.6 18.6 0% 12.0 35% 35%
Grasslands/Herbaceous 69.4 2.0 1.3 35% 0.8 35% 58%
Pasture/Hay 79.2 1.5 1.0 35% 0.6 35% 58%
Cultivated Crops 3.0 <1 <1 0% <1 0% 0%
Woody Wetlands 67.3 <1 <1 0% <1 0% 0%
Emergent Herbaceous Wetlands
227.6 <1 <1 0% <1 0% 0%
Transitional 746.8 5.0 5.0 0% 3.3 35% 35%
Other 3.8 <1 <1 0% <1 0% 0%
Total 17,139 108 107 1% 69 35% 36%
Lower Fortine Creek*
Developed, Open Space 836.3 2.7 2.7 0% 2.0 25% 25%
Developed, Low Intensity 697.2 <1 <1 0% <1 0% 0%
Evergreen Forest 122,804.8 750.4 750.4 0% 540.2 28% 28%
Shrub/Scrub 21,829.6 265.1 265.1 0% 182.5 31% 31%
Grasslands/Herbaceous 895.6 17.4 11.3 35% 8.6 24% 51%
Pasture/Hay 1,747.8 12.1 7.9 35% 5.9 25% 51%
Cultivated Crops 103.1 3.3 2.0 38% 1.5 27% 54%
Woody Wetlands 1,047.1 7.0 7.0 0% 4.6 33% 33%
Emergent Herbaceous Wetlands
1,571.5 2.4 2.4 0% 1.6 33% 33%
Transitional 6,466.3 43.0 43.0 0% 29.2 32% 32%
Other 449.2 1.7 1.7 0% 1.3 22% 22%
Total 158,449 1,106 1,094 1% 778 30% 30%
*Lower Fortine Creek results are a summation of the results of that sub-basin plus Middle Fortine Creek, Meadow Creek, and Deep Creek.
Tobacco Planning Area Sediment TMDLs and Framework Water Quality Improvement Plan – Appendix F
9/16/11 FINAL F-34
Table F3-2. Delivered Sediment Load by Land Cover Type Cumulative through the Watershed Sub-basin Land Cover Classification Area
(acres) Scenario 1 Scenario 2 Upland
BMP Load Reduction
Scenario 3 Riparian BMP Load Reduction
Overall Sediment
Load Reduction
Upland Erosion USLE Existing Load
Corrected for Existing Riparian Health Condition
(tons/year)
Upland Erosion USLE BMP Load
Corrected for Existing Riparian Health Condition
(tons/year)
Upland Erosion USLE BMP Load
Corrected for BMP Riparian
Health Condition (tons/year)
Upper Grave Creek
Evergreen Forest 24,727.2 297.3 297.3 0% 224.8 24% 24%
Shrub/Scrub 2,838.1 73.0 73.0 0% 55.2 24% 24%
Grasslands/Herbaceous 58.0 11.7 7.6 35% 5.8 24% 51%
Pasture/Hay 4.4 <1 <1 0% <1 0% 0%
Other 274.3 2.0 2.0 0% 1.5 24% 24%
Total 27,902 384 380 1% 287 24% 25%
Lower Grave Creek*
Developed, Open Space 68.2 <1 <1 0% <1 0% 0%
Developed, Low Intensity 72.0 <1 <1 0% <1 0% 0%
Evergreen Forest 42,147.0 549.5 549.5 0% 406.6 26% 26%
Shrub/Scrub 3,622.7 93.0 93.0 0% 69.6 25% 25%
Grasslands/Herbaceous 182.3 15.3 10.0 35% 7.4 25% 51%
Pasture/Hay 314.3 5.0 3.3 35% 2.4 28% 53%
Cultivated Crops 51.4 5.5 3.4 38% 2.5 28% 55%
Woody Wetlands 134.2 <1 <1 0% <1 0% 0%
Emergent Herbaceous Wetlands
188.4 <1 <1 0% <1 0% 0%
Transitional 18.5 <1 <1 0% <1 0% 0%
Other 849.9 10.7 10.7 0% 7.8 27% 27%
Total 47,649 703 671 1% 497 26% 27%
*Lower Grave Creek results are a summation of the results of that sub-basin plus Upper Grave Creek.
Tobacco Planning Area Sediment TMDLs and Framework Water Quality Improvement Plan – Appendix F
9/16/11 FINAL F-35
Table F3-2. Delivered Sediment Load by Land Cover Type Cumulative through the Watershed Sub-basin Land Cover Classification Area
(acres) Scenario 1 Scenario 2 Upland
BMP Load Reduction
Scenario 3 Riparian BMP Load Reduction
Overall Sediment
Load Reduction
Upland Erosion USLE Existing Load
Corrected for Existing Riparian Health Condition
(tons/year)
Upland Erosion USLE BMP Load
Corrected for Existing Riparian Health Condition
(tons/year)
Upland Erosion USLE BMP Load
Corrected for BMP Riparian
Health Condition (tons/year)
Therriault Creek
Developed, Open Space 61.7 <1 <1 0% <1 0% 0%
Developed, Low Intensity 105.3 <1 <1 0% <1 0% 0%
Evergreen Forest 11,316.7 84.2 84.2 0% 56.8 33% 33%
Shrub/Scrub 687.0 5.2 5.2 0% 3.5 33% 33%
Grasslands/Herbaceous 81.9 4.3 2.8 35% 1.9 33% 56%
Pasture/Hay 70.8 <1 <1 0% <1 0% 0%
Cultivated Crops 116.3 3.2 2.0 38% 1.3 33% 58%
Woody Wetlands 65.1 1.4 1.4 0% 1.0 33% 33%
Emergent Herbaceous Wetlands
125.7 <1 <1 0% <1 0% 0%
Transitional 670.4 1.9 1.9 0% 1.3 33% 33%
Other 14.7 <1 <1 0% <1 0% 0%
Total 13,316 101 98 3% 67 33% 34%
Sinclair Creek
Developed, Open Space 10.6 <1 <1 0% <1 0% 0%
Developed, Low Intensity 22.2 <1 <1 0% <1 0% 0%
Evergreen Forest 6,470.5 63.6 63.6 0% 41.1 35% 35%
Shrub/Scrub 997.5 7.3 7.3 0% 4.7 35% 35%
Grasslands/Herbaceous 75.8 2.4 1.5 35% 1.0 35% 58%
Pasture/Hay 281.8 2.0 1.3 35% 0.8 35% 58%
Cultivated Crops 15.2 <1 <1 0% <1 0% 0%
Woody Wetlands 21.5 <1 <1 0% <1 0% 0%
Emergent Herbaceous Wetlands
10.6 <1 <1 0% <1 0% 0%
Transitional 36.4 <1 <1 0% <1 0% 0%
Other 29.2 <1 <1 0% <1 0% 0%
Total 7,971 76 74 2% 48 35% 37%

Tobacco Planning Area Sediment TMDLs and Framework Water Quality Improvement Plan – Appendix F
9/16/11 FINAL F-36
Table F3-2. Delivered Sediment Load by Land Cover Type Cumulative through the Watershed Sub-basin Land Cover Classification Area
(acres) Scenario 1 Scenario 2 Upland
BMP Load Reduction
Scenario 3 Riparian BMP Load Reduction
Overall Sediment
Load Reduction
Upland Erosion USLE Existing Load
Corrected for Existing Riparian Health Condition
(tons/year)
Upland Erosion USLE BMP Load
Corrected for Existing Riparian Health Condition
(tons/year)
Upland Erosion USLE BMP Load
Corrected for BMP Riparian
Health Condition (tons/year)
Indian Creek
Developed, Open Space 73.9 <1 <1 0% <1 0% 0%
Developed, Low Intensity 38.7 <1 <1 0% <1 0% 0%
Evergreen Forest 6,606.4 89.0 89.0 0% 57.5 35% 35%
Shrub/Scrub 2,815.6 20.7 20.7 0% 13.3 35% 35%
Grasslands/Herbaceous 512.1 5.5 3.6 35% 2.3 35% 58%
Pasture/Hay 657.8 6.4 4.2 35% 2.7 35% 58%
Cultivated Crops 286.1 7.7 4.8 38% 3.1 35% 60%
Woody Wetlands 26.3 <1 <1 0% <1 0% 0%
Emergent Herbaceous Wetlands
12.7 <1 <1 0% <1 0% 0%
Transitional 100.5 2.4 2.4 0% 1.6 35% 35%
Other 42.1 <1 <1 0% <1 0% 0%
Total 11,172 132 125 5% 81 35% 39%
Tobacco River*
Developed, Open Space 1,358.9 3.3 3.3 0% 2.4 27% 27%
Developed, Low Intensity 1,491.5 1.0 1.0 0% 0.7 29% 29%
Evergreen Forest 212,992.9 1,649.2 1,649.2 0% 1,170.5 29% 29%
Shrub/Scrub 39,108.3 439.0 439.0 0% 302.6 31% 31%
Grasslands/Herbaceous 3,013.0 54.2 35.2 35% 24.9 29% 54%
Pasture/Hay 4,295.1 36.5 23.7 35% 16.1 32% 56%
Cultivated Crops 1,037.1 33.5 20.9 38% 13.7 35% 59%
Woody Wetlands 1,541.7 11.8 11.8 0% 7.8 34% 34%
Emergent Herbaceous Wetlands
2,186.3 3.1 3.1 0% 2.0 34% 34%
Transitional 8,430.5 52.4 52.4 0% 35.1 33% 33%
Other 1,612.3 12.7 12.7 0% 9.3 27% 27%
Total 277,068 2,297 2,252 2% 1,585 30% 31%
*Tobacco River results are a summation of the results of that sub-basin plus Lower Fortine Creek, Lower Grave Creek, Indian Creek, Sinclair Creek, and Therriault Creek.

Tobacco Planning Area Sediment TMDLs and Framework Water Quality Improvement Plan – Appendix F
9/16/11 FINAL F-37
F4.0 REFERENCES
Brooks, K. N., P. F. Ffolliott, H. M. Gregersen, and L. F. DeBano. 1997. Hydrology and the Management of Watersheds - Second Edition, Ames, IA: Iowa State University Press.
Confluence Incorporated. 2009. Tobacco River Watershed Upland Sediment Model Final Report. Bozeman, MT: Confluence Incorporated.
Doe, W. W. III, D. S. Jones, and S. D. Warren. 1999. The Soil Erosion Model Guide for Military Land Mangers: Analysis of Erosion Models for Natural and Cultural Resources Applications. U.S. Army Engineer Waterways Experiment Station. Report Technical Report ITL 99-XX.
Dube, Kathy, Walt Megahan, and Marc McCalmon. 2004. Washington Road Surface Erosion Model. Olympia, WA: Washington State Department of Natural Resources.
Elliot, William J. 2006. "The Roles of Natural and Human Disturbances in Forest Soil Erosion," in Soil Erosion and Sediment Redistribution in River Catchments: Measurement, Modelling and Management, Owens, P. N. and Collins, A. J., (Wallingford, United Kingdom: CABI Publishing): 177-199.
Elliot, William J. and Peter R. Robichaud. 2001. Comparing Erosion Risks From Forest Operations to Wildfire. In: The International Mountain Logging and 11th Pacific Northwest Skyline Symposium. Seattle, WA.
McCuen, R. H. 1998. Hydrologic Analysis and Design, 2 ed., Upper Saddle River, NJ: Prentice Hall.
Renard, K. G., G. R. Foster, G. A. Weesies, D. K. McCool, and D. C. Yoder. 1997. Predicting Soil Erosion by Water: A Guide to Conservation Planning With the Revised Universal Soil Loss Equation (RUSLE). Report USDA Agriculture Handbook No. 703.
Rice, R. M., J. S. Rothacher, and W. F. Megahan. 1972. Erosional Consequences of Timber Harvesting: An Appraisal. In: National Symposium on Watersheds in Transition. Urbana, IL: American Water Resources Association; 321-329.
United States Department of Agriculture. 1983. National Engineering Handbook - Section 3, Sedimentation, 2 ed., Washington, DC: United States Department of Agriculture. Accessed 7/6/11 A.D.
USDA Soil Conservation Service. 1983. National Engineering Handbook, Section 3: Sedimentation. http://www.info.usda.gov/CED/ftp/CED/neh3-all.pdf .
Tobacco Planning Area Sediment TMDLs and Framework Water Quality Improvement Plan – Appendix F
9/16/11 FINAL F-38
Wischmeier, W. H. and D. Smith. 1978. Predicting Rainfall Erosion Losses: A Guide to Conservation Planning. Washington, D.C.: United States Department of Agriculture. Report Agriculture Handbook No. 537. http://topsoil.nserl.purdue.edu/usle/AH_537.pdf.

Tobacco Planning Area Sediment TMDLs and Framework Water Quality Improvement Plan – Appendix F
9/16/11 FINAL F-39
ATTACHMENT A – ASSIGNMENT OF USLE C-FACTORS TO NLCD
LANDCOVER VALUES
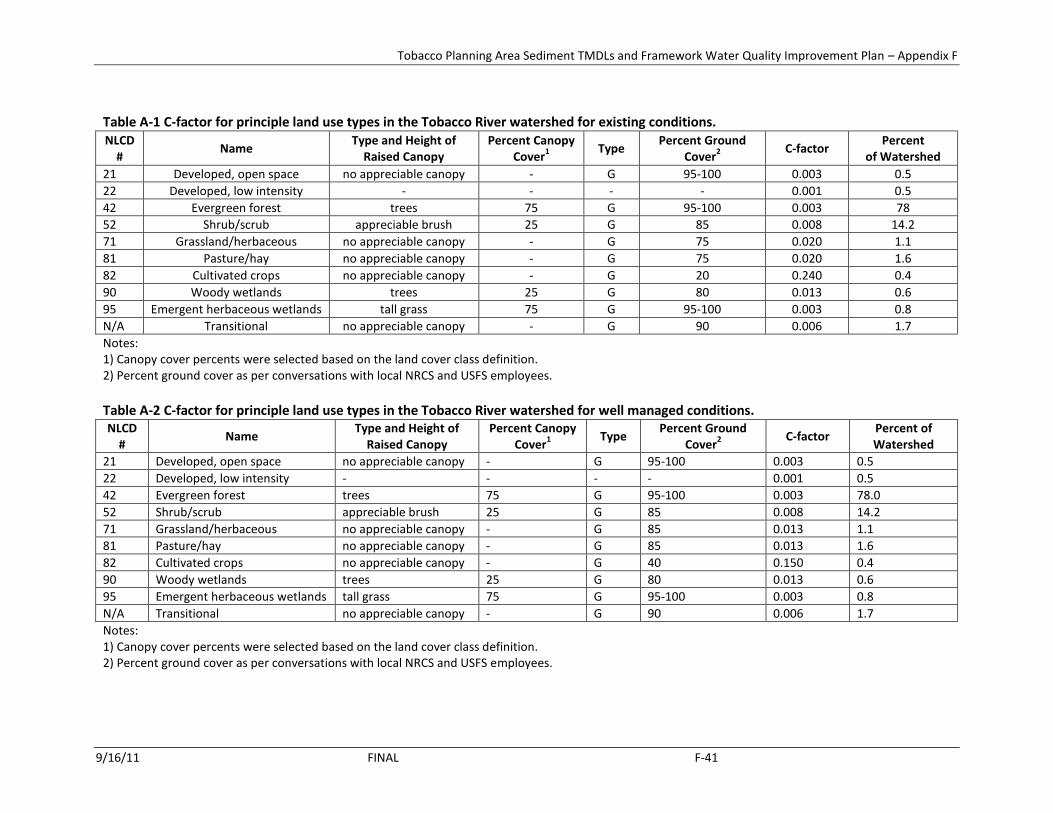
The NRCS table “C-Factors for Permanent Pasture, Rangeland, Idle Land, and Grazed Woodland” (Figure A-1) was used to develop C-factors for the various land use types as defined by the NLCD database within the Tobacco River watershed. This table uses four sub-factors: the vegetative canopy type and height, the vegetative canopy percent cover, the type of cover that contacts the soil surface, and the percent ground cover to derive a C-factor. The resulting C-factor is very sensitive to the type and percent of ground cover and less sensitive to the type and percent of canopy cover. The type and percent of canopy cover were determined based on the NLCD land use definition. In some cases the minimum percent canopy cover specified in the land use definition was used and resulted in a conservative C-factor. The type of ground cover was considered to be G (cover is grass, grasslike plants, decaying compacted duff, or litter at least 2 inches deep) for all of the land uses in the Tobacco River watershed. The percent ground cover not only includes the basal plant material, but also gravel and plant litter. The percent ground cover for each of the land uses within the Tobacco River watershed were determined for the existing conditions based on ground cover information from NRCS and USFS employees familiar with the Tobacco River watershed. (Table A-1) Per the best professional judgment of Kenny Kindel with the Kootenai National Forest in Eureka, the existing percent ground cover for the evergreen forest land use was estimated to be 95-100 percent. Per the best professional judgment of Kirk Sullivan with the NRCS in Eureka, the existing percent ground cover was estimated to be 80% for ‘shrub/scrub’, 60% for ‘grassland/herbaceous’, 60% for ‘pasture/hay’, 60% for ‘woody wetlands’, and 95-100% for ‘emergent herbaceous wetlands’. Per the best professional judgment of Walter Lujan with the NRCS in Missoula, the existing percent ground cover was estimated to be 90% for ‘shrub/scrub’, 90% for ‘grassland/herbaceous’, 90% for ‘pasture/hay’, 95-100% for ‘woody wetlands’, 95-100% for ‘emergent herbaceous wetlands’, and 90% for ‘transitional’. Where there were two estimates of the percent ground cover for the same land use, the average of the two estimates was used. For the well managed scenario, the percent ground cover was increased by 10% over the existing percentage for the ‘grassland/herbaceous’ and ‘pasture/hay’ land uses, and by 20% for the ‘cultivated crops’ land use. For the ‘transitional’ land use, the well managed scenario assumed a return to a forest land use in logged areas but logging in currently forested areas, resulting in no change to the C factor. The C-factors for the other land use types were not changed. (Table A-2). Table A-3 provides the C-factors for the remaining minor land use types that make up less than 1% of the watershed. The C-factors for these land uses are the same for both the existing and well managed scenarios. These are the same C-factors previously recommended by Richard Fasching, the NRCS Montana State Agronomist, for other hillslope USLE modeling efforts.

Tobacco Planning Area Sediment TMDLs and Framework Water Quality Improvement Plan – Appendix F
9/16/11 FINAL F-40
Figure A-1 NRCS C-factor table
Tobacco Planning Area Sediment TMDLs and Framework Water Quality Improvement Plan – Appendix F
9/16/11 FINAL F-41
Table A-1 C-factor for principle land use types in the Tobacco River watershed for existing conditions. NLCD
# Name
Type and Height of Raised Canopy
Percent Canopy Cover
1
Type Percent Ground
Cover2
C-factor Percent
of Watershed
21 Developed, open space no appreciable canopy - G 95-100 0.003 0.5
22 Developed, low intensity - - - - 0.001 0.5
42 Evergreen forest trees 75 G 95-100 0.003 78
52 Shrub/scrub appreciable brush 25 G 85 0.008 14.2
71 Grassland/herbaceous no appreciable canopy - G 75 0.020 1.1
81 Pasture/hay no appreciable canopy - G 75 0.020 1.6
82 Cultivated crops no appreciable canopy - G 20 0.240 0.4
90 Woody wetlands trees 25 G 80 0.013 0.6
95 Emergent herbaceous wetlands tall grass 75 G 95-100 0.003 0.8
N/A Transitional no appreciable canopy - G 90 0.006 1.7
Notes: 1) Canopy cover percents were selected based on the land cover class definition. 2) Percent ground cover as per conversations with local NRCS and USFS employees.
Table A-2 C-factor for principle land use types in the Tobacco River watershed for well managed conditions. NLCD
# Name
Type and Height of Raised Canopy
Percent Canopy Cover
1
Type Percent Ground
Cover2
C-factor Percent of Watershed
21 Developed, open space no appreciable canopy - G 95-100 0.003 0.5
22 Developed, low intensity - - - - 0.001 0.5
42 Evergreen forest trees 75 G 95-100 0.003 78.0
52 Shrub/scrub appreciable brush 25 G 85 0.008 14.2
71 Grassland/herbaceous no appreciable canopy - G 85 0.013 1.1
81 Pasture/hay no appreciable canopy - G 85 0.013 1.6
82 Cultivated crops no appreciable canopy - G 40 0.150 0.4
90 Woody wetlands trees 25 G 80 0.013 0.6
95 Emergent herbaceous wetlands tall grass 75 G 95-100 0.003 0.8
N/A Transitional no appreciable canopy - G 90 0.006 1.7
Notes: 1) Canopy cover percents were selected based on the land cover class definition. 2) Percent ground cover as per conversations with local NRCS and USFS employees.

Tobacco Planning Area Sediment TMDLs and Framework Water Quality Improvement Plan – Appendix F
9/16/11 FINAL F-42
Table A-3 C-factor for minor land use types in the Tobacco River watershed for all conditions.
NLCD # Name C-factor Percent of Watershed
23 Developed, medium intensity 0.001 0.1
24 Developed, high intensity 0.001 0.01
31 Barren land 0.001 0.1
41 Deciduous forest 0.003 0.3
43 Mixed forest 0.003 0.1
Notes: Medium and high intensity development land uses are assumed to be the same as barren land. Deciduous and mixed forest land uses are assumed to be the same as evergreen forest. Contacts: Neal Svendsen, Resource Soil Scientist, NRCS – Missoula Walter Lujan, Rangeland Management Specialist, NRCS – Missoula Kirk Sullivan, District Conservationist, NRCS – Eureka Richard Fasching, State Agronomist, NRCS – Bozeman John Gier, soil scientist, Kootenai NF – Missoula Kenny Kindel, hydrologist, Kootenai NF - Eureka