appendix f asset management plan - richmond valley … · this water business asset management plan...
TRANSCRIPT

Appendix F
Asset
Management
Plan 2015-2025
Water Supply Network

Page 2 of 48 Richmond Valley Council Water Supply Network 2015-2025

Page 3 of 48 Richmond Valley Council Water Supply Network 2015-2025
Table of Contents Executive Summary .................................................................................................................................................. 5
1. Introduction ............................................................................................................................................................. 7
1.1 Asset Management Plan .................................................................................................................................... 7
1.2 Background .......................................................................................................................................................... 8
Objectives of Asset Management ........................................................................................................................... 8
1.3 Integrated Water Cycle Management .............................................................................................................. 9
1.4 Water Supply - Casino ..................................................................................................................................... 10
Lower Richmond .................................................................................................................................................. 11
Future Scheme Development ............................................................................................................................ 12
1.5 Water Supply ..................................................................................................................................................... 12
1.7 Legislative Requirements ................................................................................................................................ 14
2. Service Levels ...................................................................................................................................................... 16
2.1 Developing Levels of Service .......................................................................................................................... 16
Community Levels of Service ............................................................................................................................ 17
Technical Levels of Service ............................................................................................................................... 17
Water Business Levels of Service .................................................................................................................... 19
2.2 Customer Research and Expectations .......................................................................................................... 20
2.3 Key Assumptions made in Financial Forecasts ........................................................................................... 21
Forecast Reliability and Confidence ................................................................................................................. 21
3. Future Demand .................................................................................................................................................... 23
Key Water Demand Definitions ......................................................................................................................... 23
3.1 Drivers of Future Demand ............................................................................................................................... 23
3.2 Future Water Demand ...................................................................................................................................... 25
3.3 Potential Demand Management Measures .................................................................................................. 26
Source Augmentation Strategies ...................................................................................................................... 27
3.4 NOROC Regional Water Study ...................................................................................................................... 27
3.5 Drought Management....................................................................................................................................... 28
3.6 Flood Management ........................................................................................................................................... 29
3.7 Demand Management Plan............................................................................................................................. 29
4. Lifecycle Management Plan ............................................................................................................................... 30
4.1 Background Data .............................................................................................................................................. 30
4.2 Physical Parameters ........................................................................................................................................ 31
Asset renewals ..................................................................................................................................................... 33
Asset Mix, Location and Current Issues .............................................................................................................. 36
Casino ................................................................................................................................................................... 36

Page 4 of 48 Richmond Valley Council Water Supply Network 2015-2025
MLRR .................................................................................................................................................................... 37
4.3 Asset Conditions ............................................................................................................................................... 37
4.4 Financial Summary ........................................................................................................................................... 39
4.5 Sustainability of Service Delivery ................................................................................................................... 41
Long term - Life Cycle Cost ............................................................................................................................... 41
Medium term – 10 year financial planning period ........................................................................................... 41
Medium Term – 5 year financial planning period ............................................................................................ 42
Long term Financial Plan Works Program ....................................................................................................... 42
Operating and Management Costs ................................................................................................................... 42
5. Risk Management ................................................................................................................................................... 42
6. Plan Improvement and Monitoring .................................................................................................................... 45
6.1 Accounting Standards and Regulations ........................................................................................................ 45
6.2 Asset management system ............................................................................................................................. 45
7. References ........................................................................................................................................................... 48
Page 5 of 48 Richmond Valley Council Water Supply Network 2015-2025
Executive Summary This Water Business Asset Management Plan addresses the responsible management of medium term operational and capital works necessary to comply with legal and regulatory frameworks and to achieve water program performance levels. The objective is to provide reliable networks that contribute towards the social, economic and environmental indicators of a regional hub. An asset plan is a crucial element of the strategic planning process providing outcomes that align with the Integrated Water Cycle Management (IWCM) and Strategic Business (SBP) water plans. It is a key element of Best Practice Management for Local Water Units under the NSW Governments Country Towns Water Supply and Sewerage program.
Council’s water business is predicted to perform favourably over the 20 year outlook. Water network assets on average have a remaining useful life of 68% of their expected lifecycles, however more critical infrastructure assets including Water Pump Stations, Water Treatment Plants and Reservoirs are all approaching 60% of their useful life. Larger issues including water security and the structural integrity of Jabour Weir in the township of Casino provide ongoing uncertainty which necessitates a large commitment to improved levels of service and scheme augmentation programs.
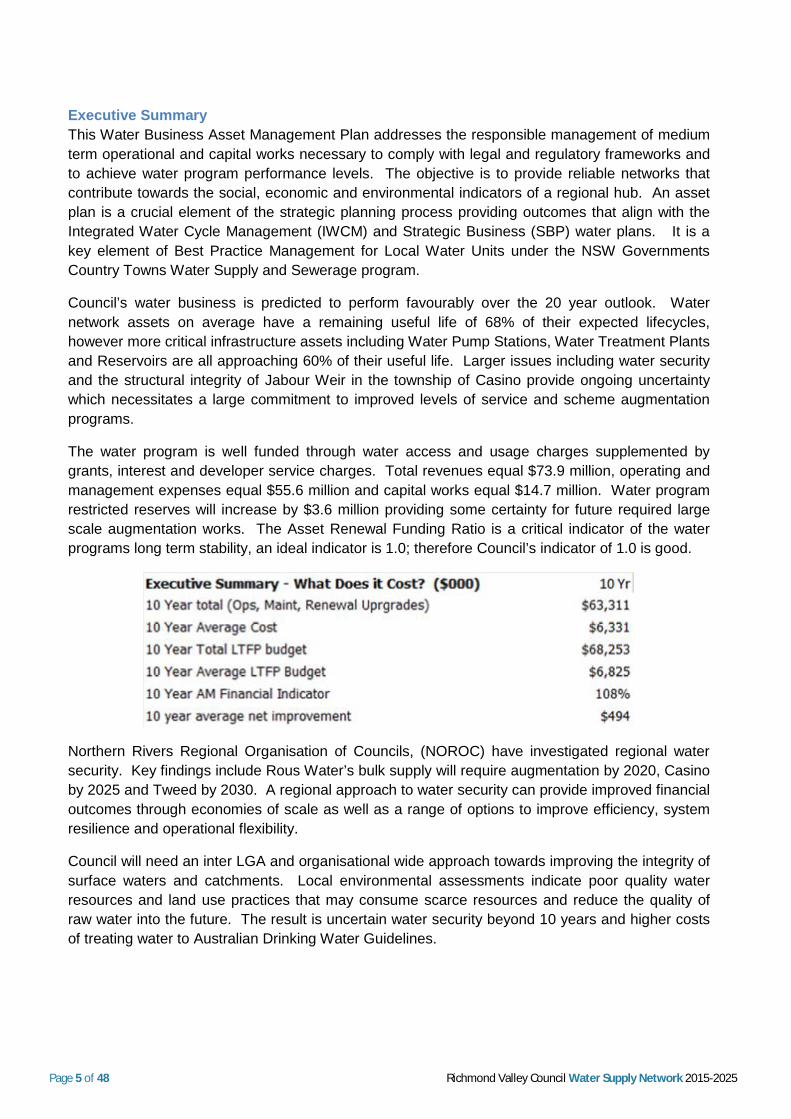
The water program is well funded through water access and usage charges supplemented by grants, interest and developer service charges. Total revenues equal $73.9 million, operating and management expenses equal $55.6 million and capital works equal $14.7 million. Water program restricted reserves will increase by $3.6 million providing some certainty for future required large scale augmentation works. The Asset Renewal Funding Ratio is a critical indicator of the water programs long term stability, an ideal indicator is 1.0; therefore Council’s indicator of 1.0 is good.
Northern Rivers Regional Organisation of Councils, (NOROC) have investigated regional water security. Key findings include Rous Water’s bulk supply will require augmentation by 2020, Casino by 2025 and Tweed by 2030. A regional approach to water security can provide improved financial outcomes through economies of scale as well as a range of options to improve efficiency, system resilience and operational flexibility.
Council will need an inter LGA and organisational wide approach towards improving the integrity of surface waters and catchments. Local environmental assessments indicate poor quality water resources and land use practices that may consume scarce resources and reduce the quality of raw water into the future. The result is uncertain water security beyond 10 years and higher costs of treating water to Australian Drinking Water Guidelines.

Page 6 of 48 Richmond Valley Council Water Supply Network 2015-2025
General observations for the local water unit include: Ø Number of Assets - 23,549. Ø Current Replacement Cost of asset base - $81.9 million. Ø Annual depreciation - $767,000. Ø Depreciated Replacement Cost - $68.8 million, 84.6% of the fair values, reflecting modified
depreciation schedules of long life assets. Ø Percentage of assets with condition rating of 1 or 2 is a very healthy 84.5%. Ø Percentage of network assets due for renewal in next 10 years is 6%.
The water business is currently performing favourably, however a regional collaborative approach to water security will require an external approach to value chain analysis and Council’s commitment to ensuring an affordable and quality long term water supply.

Page 7 of 48 Richmond Valley Council Water Supply Network 2015-2025
1. Introduction The Richmond Valley is located in the Northern Rivers region of North East NSW, 726 km north of Sydney and 228 km south of Brisbane. Located on the banks of the Richmond River the region supports a variety of agricultural industries, primarily beef, sugar cane and wheat. Richmond Valley Council was formed in February 2000 as the result of amalgamation between Casino Council and Richmond River Shire Council.
Council spreads across 3,050 square kilometres with six townships. Major urban areas are Casino and Evans Head and the villages are Woodburn, Coraki, Broadwater, Rileys Hill and Rappville. As at 2011, the resident population was 22,700 persons with a skew towards blue collar occupations. Richmond Valley is preparing to be one of the fastest growing areas in regional NSW with economic stimulus emerging from natural resource discoveries (uncertainty surrounds coal seam and natural gas developments).
The Region is expected to experience population growth (0.51% pa), decreasing occupancy rates and an ageing population. The number of dwellings in the Council LGA is expected to increase from 9,150 in 2011 to 10,750 in 2031, an increase of 1,600 dwellings at an average growth rate of 0.81% p.a.
Richmond Valley is in a sub-tropical area, characterised by hot humid summers and mild winters. Average rainfall ranges from 1,650 mm along the coast strip, to less than 1,025 mm over inland areas. The LGA is prone to natural disasters having had five Natural Disaster Declarations since 2009. Council is located on a flood plain and heavy rainfall can trigger flood events, while climate change and rising sea levels impact coastal areas and increase unpredictability.
The Richmond Valley is a region of balance where every individual, family and business has the opportunity to be successful.; It is an attractive place to live and play but as with most rural centres struggles to compete with the employment opportunities of the capital cities. This is reflected with a general decline of the working age cohort and professional occupations but does experience a large retiree and tree change population. This is consistent with the ALGA State of the Regions stylised fact number five that applies to the majority of LGA’s.
The major issues facing Council generally include prosperity and economic development for individuals and the region. The community is engaged in the longer term prospects for the region with a focus on financial management and the provision of quality infrastructure networks. Council and the local business chamber are aligned in their purpose to provide employment, opportunities and lifestyle for the people of the Richmond Valley.
Timber and forestry and the associated production and manufacturing industries are creating strong demand for industrial development. A 58 hectare industrial development at North Casino (Intermodal Freight Handling Facility) has been approved by Council. Other major developments include coal seam methane gas fields and reticulation as a “green” energy source and an electrical power plant in the Casino area.
1.1 Asset Management Plan An Asset Management Plan (AMP) provides understanding of the options, risks and consequences associated with managing large scale infrastructure, having an articulated basis for community engagement, expectations, priorities, funding levels and the related trade-offs and a strong understanding of the capital, operating and maintenance expenditures to be incorporated into the long term strategic planning process.

Page 8 of 48 Richmond Valley Council Water Supply Network 2015-2025
Planning assists Council to deliver services derived from a network of infrastructure assets including transport, recreation, stormwater drainage, community buildings, water supply and sewerage. The Local Government Act 1993 requires NSW Councils to prepare asset management plans and annual reports.
Many of Council’s water planning initiatives are driven by the Integrated Water Cycle Management (IWCM) strategy. IWCM is a 30 year strategic planning tool for local water authorities. IWCM enables utilities to manage their water services in a holistic manner, it deals with the complex linkages between the different elements of the water cycle. This is consistent with the NSW Best Practice Management of Water Supply and Sewerage Framework.
1.2 Background This plan demonstrates responsive management of water network assets and their services, compliance with regulatory requirements and to communicate the funding needed to provide the required levels of service over a 10 year planning period. Continued access to reliable water is one of the greatest challenges facing Council. Council is responsible for water reticulation services across the LGA however, Council only supplies bulk water for the Casino area, with all other bulk water requirements supplied by Rous Water.
This plan is to be read in conjunction with Council’s Strategic Business Plan for Water and Sewer, IWCM Strategy Plan, Business Continuity Plan, Drought Management Plan, Demand Management Plan, Risk Management Strategy Water Supply, Council’s Long Term Capital Plan and Council’s Community Strategic Plan. The document Water & Sewer Review synthesises 50 plus planning and investigative reports for the Local Water Utilities, capturing the major issues and opportunities for Council’s water and sewer business.
Objectives of Asset Management The organisation exists to provide long-term quality services to its community. Some of these services are provided by infrastructure assets. We have acquired infrastructure assets by ‘purchase’, contract, construction by our staff and by donation of assets constructed by developers and others to meet increased levels of service.
Our vision is: We will ensure the Richmond Valley is well positioned for the future – socially, environmentally and economically, with all the right ingredients to be a primary regional hub in NSW.
Our mission is: To develop and operate infrastructure networks that supports the fabric of a modern vibrant society. Our aim is to provide reliable networks that build trust and dependency not only within their network, but also between one network and another network.
Our goal is: In managing infrastructure assets is to meet the defined level of service (as amended from time to time) in the most cost effective manner for present and future consumers. The key elements of infrastructure asset management are:
Ø Providing a defined level of service and monitoring performance, Ø Managing the impact of growth through demand management and infrastructure investment,

Page 9 of 48 Richmond Valley Council Water Supply Network 2015-2025
Ø Taking a lifecycle approach to developing cost-effective management strategies for the long-term that meet the defined level of service,
Ø Identifying, assessing and appropriately controlling risks, and Ø Having a Long Term Financial Plan (LTFP) which identifies required, affordable expenditure
and how it will be financed.
Key elements of this plan are: Ø Levels of service – specifies the services and levels of service to be provided by Council, Ø Future demand – how this will impact on future service delivery and how this is to be met, Ø Life cycle management – how Council will manage its existing and future assets to provide
defined levels of service, Ø Financial summary – what funds are required to provide the defined services, Ø Asset management practices, Ø Monitoring – how the plan will be monitored to ensure it is meeting Council’s objectives, and Ø Asset management improvement plan.
1.3 Integrated Water Cycle Management IWCM is a 30 year strategic planning tool for Local Water Utilities (LWUs) enabling them to manage their urban water services in a holistic manner within a catchment context. LWUs have the goal of providing an appropriate, affordable, cost-effective and sustainable urban water services that meet the community needs, protects public health and the environment and makes best use of regional resources.
IWCM involves looking at the three components of the urban water services (water supply, sewerage and stormwater) in an integrated way when identifying all the IWCM issues and developing scenarios to address these issues. The scenarios are evaluated and compared on the basis of their social, environmental and economic impacts. Council completed its IWCM Strategy Plan in 2008.
The objectives of the Strategy are: Ø Improve land use management through education and demonstration, Ø Coordinated approach to sharing of surface and ground waters, Ø Maximise high value (priority to substitution of potable water) reuse, Ø Increase the number of alternative water sources, Ø Improved security of urban water supply, and Ø Provide the highest level of service relative to users’ willingness to pay.
The issues addressed by the Strategy are: Ø Town water supply security, Ø Ground and surface water sharing plans. Council must be involved in the water sharing
process to ensure town water supplies are adequate, Ø Council must implement sustainable effluent reuse with end user requirements considered, Ø Existing land use practices and urban impacts affecting surface water quality, Ø High operating and management costs for water and sewerage systems leading to relatively
high typical residential bills, Ø Compliance with current and future potable water standards,

Page 10 of 48 Richmond Valley Council Water Supply Network 2015-2025
Ø Hydrologic stress in catchments contributing to unsustainable extraction particularly during low flows,
Ø The need for sustainable stormwater/rainwater reuse, Ø Climate change altering the rainfall and temperature patterns of the study area, and Ø Poor demand management in terms of consumption and unaccounted for water.
The key components to be implemented by the water business are: Ø High level demand management, Ø Alternate water supply source and emergency drought management for Casino, Ø Agricultural and open space irrigation reuse of recycled effluent, Ø Dual reticulation for new developments, where feasible, Ø Investigation and participation in regional water management strategies, Ø Contribution to macro water sharing planning process, Ø Condition based asset renewal and inflow/infiltration reduction program, and Ø Management of risks associated with climate change.
The IWCM Strategy has set the future direction for Council water supply by addressing a number of priority issues identified by Council staff, government agencies and the local community. The implementation of the strategy is reliant on Council’s commitment to the capital works program developed, as well as its ability to maintain financial stability in the future. The capital works program associated with the adopted strategy has set the direction for Council’s Strategic Business Planning. Council will need to continuously develop, implement and review the components of the IWCM Strategy to ensure it is successful.
Performance monitoring is an essential part of the IWCM process to ensure that the implementation of strategies which have been identified through the process have been successful at addressing the water cycle issues. Annual reporting to the Office of Water should provide an indication of the success of Council’s IWCM Strategy and the other best-practice planning documents in achieving sustainability and progress in meeting Council’s business goals and social and environmental responsibilities.
1.4 Water Supply - Casino Richmond Valley water supply is comprised of two separate systems. The Casino system comprises one water filtration plant and raw water pumping station, four reservoirs and a network of pipes (total length 115 km) that distributes water to customers. Raw water from the Richmond River is fully treated and reticulated to the town of Casino. Historically rainfall tends to exceed evaporation for only two months (February and March) with a rainfall deficit from April to January (Figure 1.1, average monthly rainfalls).
The town of Casino is serviced by a water treatment plant and raw water pump station constructed in 1985 (which replaced the old water treatment plant located at South Casino). Raw water from the Richmond River flowing over Jabour Weir is extracted via a pumping station at the river. Casino’s water supply sourced from the Richmond River at Casino has an entitlement of 3,427ML/pa or 25% of the total entitlement in that water source. The water is treated and reticulated to the town of Casino through a network of pipes and four reservoirs, three at North Casino and one at South Casino.

Page 11 of 48 Richmond Valley Council Water Supply Network 2015-2025
Figure 1.1: Average Monthly Rainfall and Evaporation at Casino, Evans Head and Rocky Creek1
Lower Richmond The Lower Richmond River reticulation system distributes water purchased from Rous Water. The source of water is a combination of Rocky Creek Dam and bores. Historically, rainfall exceeds evaporation for eight months in the Rocky Creek Dam catchment (which is the source of water for lower river towns). The system supplies water to the towns of Evans Head, and the villages of Broadwater, Woodburn, Rileys Hill and Coraki (which also services nearby Box Ridge). Council owns eight reservoirs and a network of pipes (total length 77 km) from the Reservoirs. Rous Water leases Council’s Langs Hill Reservoir.
The water is treated by Rous Water while Council owns all pipes downstream of the Reservoirs, one of which (Langs Hill Reservoir) is leased to Rous Water. The town of Evans Head is provided with water by two reservoirs. North Evans Head is serviced by the Lower Reservoir whilst water supplied to South Evans Head is pumped from the Lower Reservoir to the Higher Reservoir.
The village of Woodburn is served by one Reservoir located at Langs Hill. Coraki village is comprised of a Lower Reservoir and two smaller tower Reservoirs that also serve the locality of Box Ridge via interconnecting pipes. An in-line booster system provides increased pressure to the Box Ridge community during nominated hours of the day.
Broadwater and Rileys Hill villages are serviced by two Reservoirs. Water from the Lower Reservoir is pumped to the Higher Reservoir, which feeds the town of Broadwater. Rileys Hill receives water from the Broadwater Reservoirs. There is a small Reservoir at Rileys Hill which acts as a backup when the Broadwater Sugar Mill is operating. The villages of Rappville and Fairy Hill are not supplied with a reticulated water supply, water is provided by individual rainwater tanks.
1 SILO, 2006

Page 12 of 48 Richmond Valley Council Water Supply Network 2015-2025
Figure 1.2: Richmond Valley Waterways
Future Scheme Development Council plans to augment the water supply and sewerage schemes to cater for growth, improve sustainability and achieve more integrated systems. Major projects will include:
Ø Augmentation of the Casino water source to increase yield and improve reliability of supply, Ø Implementation of an emergency water source for Casino to improve reliability in drought and
emergencies, and Ø Potential implementation of an irrigation reuse scheme to recycle water from Evans Head
Sewer Treatment Plant (STP).
1.5 Water Supply The Casino water supply is comprised of two separate water supply systems – Casino and the Mid to Lower Richmond River (MLRR) area. The Casino system comprises a Water Treatment Plant (WTP), four Reservoirs, one distribution pump station and a network of pipes (115 km) that distributes water to 9,600 people.

Page 13 of 48 Richmond Valley Council Water Supply Network 2015-2025
Figure 1.4: Casino Water Supply System Flow Chart
Rous Water supplies bulk water under a Water Supply Agreement (WSA) to four constituent Councils in the Northern Rivers (Lismore, Byron Bay, Ballina and Richmond Valley). Rous Water is responsible for the construction, extension, protection, maintenance, control and management of bulk water supply works. Council is responsible for assets used to distribute water services in the MLRR water supply system.
Council distributes water to Council customers in the Lower River area through four separate distribution systems and 77 km of pipes as follows:
Ø Evans Head - population served approximately 2,700 people, Ø Woodburn - population served approximately 630 people, Ø Broadwater and Rileys Hill - population served approximately 660 people, and Ø Coraki (including Box Ridge) - population served approximately 1,220 people.
Jabour Weir
Raw water pump station
WTP
North Reservoirs North Casino
reticulation system
South Casino reticulation system
Booster pump station
South Reservoir
Jabour Weir Catchment
Richmond River
Raw water transfer main
Northern Cooperative Meat Company

Page 14 of 48 Richmond Valley Council Water Supply Network 2015-2025
Figure 1.5: Lower River Water Supply System Flow Chart
1.7 Legislative Requirements As a local government owned business, LWUs are subject to a number of legislative obligations and requirements. The Local Government Act establishes the conformance criteria which enables sustainable performance achievements. Through the NSW Government’s Country Towns Water Supply and Sewerage Program, sections 283 to 322 of the Water Management Act 2000, and sections 56 to 66 of the Local Government Act 1993, the Minister for Water is responsible for overseeing the performance of LWUs.
Goal 22 under the NSW Governments 10 year plan is to protect our natural environment and improve the health of wetlands and catchments through actively managing water. Water reforms in NSW included the implementation of the Water Management Act 2000, the development of 63 water sharing plans (improving the management of water resources) and a National Water Initiative (NWI) that commits NSW to achieving sustainability in the use of its water resources2.
The NSW Best Practice Management (BPM) of Water Supply and Sewerage Framework encourages the effective and efficient delivery of LWUs water supply and sewerage services. This framework promotes continuing improvement in sustainable water conservation practices, water demand management and appropriate, affordable and cost-effective water supply.
National requirements include Australian Drinking Water Guidelines, 2011, National Water Initiative (reforms and pricing principles), National Urban Water Planning Principles and the COAG Strategic
2 EPA, 2012, NSW State of the Environment.
Langs Hill Reservoir
Coraki reticulation system
Woodburn reticulation system
Broadwater high pressure
Reservoir
High pressure pump station
Rileys Hill reticulation system
Broadwater reticulation system
Alternate Feed
Rileys Hill Reservoir (off-line)
Broadwater Reservoir
Coraki Reservoirs
Evans Head Bottom Reservoir
Evans Head Top Reservoir
Evans Head reticulation system
High pressure
pump station
South Evans Head reticulation system
Treated Bulk Water Supply from Rous Water

Page 15 of 48 Richmond Valley Council Water Supply Network 2015-2025
Framework for Water Reform. Table 1.1 provides an overview of relevant legislations and their guidance towards sustainable LWUs outcomes.
Legislation Requirement Local Government Act Sets out role, purpose, responsibilities and powers
of local governments including the preparation of a long term financial plan supported by asset management plans for sustainable service delivery.
Public Works and Procurement Act 1912 Sets out the role of the Department of Water and Energy (DWE) and Department of Commerce in the planning and construction of new assets.
Soil Conservation Act 1938 An Act to make provision for the conservation of soil resources and farm water resources and for the mitigation of erosion. It addresses preservation of watercourse environments.
Environmental Planning and Assessment Act 1979
An Act to institute a system of environmental planning and assessment for the State of New South Wales. Among other requirements the Act outlines the requirement for the preparation of Local Environmental Plans (LEP), Development Control Plans (DCP), Environmental Impact Assessments (EIA) and Environmental Impact Statements.
Work Health and Safety Act 2011 and Workers Compensation Act 1987
Sets out roles and responsibilities to secure the health, safety and welfare of persons at work and covering injury management, emphasising rehabilitation of workers particularly for return to work. Council is to provide a safe working environment and supply equipment to ensure safety.
Public Health Act 2010 An Act relating to the maintenance of proper standards of health for the public. Council operations need to be carried out in a manner that protects public health.
Independent Pricing and Regulatory Tribunal Act 1992
The Act empowers the Independent Pricing and Regulatory Tribunal (IPART) which sets principles and guidelines related to charging for water supply.
Competition Policy including Competition Policy Reform Act 1995
Council is subject to prohibition on anti-competitive behaviour, according to the Trade Practices Act.
Threatened Species Conservation Act 1995 An Act to conserve threatened species, populations and ecological communities of animals and plants.
Protection of the Environment Operations Act 1997
Council is required to exercise due diligence to avoid environmental impact and among others are required to develop operations emergency plans and due diligence plans to ensure that procedures are in place to prevent or minimise pollution.

Page 16 of 48 Richmond Valley Council Water Supply Network 2015-2025
Water Management Act 2000 An Act to provide for the protection, conservation and ecologically sustainable development of the water sources of the State, and for other purposes. Allows Council to levy developer charges and addresses water sharing and environmental flows.
Table 1.1: Legislative Requirements
2. Service Levels For Council, serving customers and the community is our principal objective. Our first priority is to understand their needs, wants, values, concerns and what aspects of services are important to them.
Understanding customer concepts of value is achieved by understanding their expectations and preferences. Typically customers perceive the value provided by a service as the benefits they receive less their contributions in the form of rates and service charges. That is, a customer’s utility or satisfaction level increases when their benefits exceed the costs they pay. Customers want to maximise their utility through saving time, reliability and consistency of service, safety and wellbeing.
Customers want services that are easy to use, that simplify their lives and provide lifestyle satisfaction. However customer value is a compromise between their perceived benefit and their willingness to contribute financially towards these benefits. Asset and service attributes like healthy, timeliness, ‘safe and reliable’, convenience and quality are intrinsic with best practice Asset Management (AM), but they are not always tangible to the consumer. Public organisations need to communicate these attributes and/or the consequences resulting from their removal if the community cannot afford them.
2.1 Developing Levels of Service Levels of service are key business drivers. They influence the range, quality and quantity of assets and services provided. Level of Service (LoS) indicators are usually based on the following:
Ø Customer expectations and willingness to pay, Ø Legislative and environmental compliance which impose standards of service, and Ø The business context including strategic objectives, available resources and financial
constraints.
LoS statements describe Council’s intention to deliver customer services in terms of quality, reliability, responsiveness, sustainability, timeliness, accessibility and cost. Statements should be written so customers can relate to them and Council is accountable through a customer satisfaction measure and a technical performance measure.
The relationship between costs and LoS depends on the type of activity. Some infrastructure has a steep initial cost with minimal servicing costs while other services will have higher proportions of operational and maintenance type costs. Costing needs to be meaningful and understandable, the cost per user should represent a tangible benefit or a better LoS.

Page 17 of 48 Richmond Valley Council Water Supply Network 2015-2025
Community Levels of Service Service levels are defined as either customer LoS or technical LoS. Community LoS measure how the community receives the service and whether Council is providing the community value.
Community LoS measures used in the AMP are:
Quality How good is the service? Function Does it meet users’ needs? Capacity/Utilisation Is the service over or under used?
The Council’s current and expected community service levels are detailed in Tables 2.1 and 2.2. Table 2.1 shows the agreed expected community LoS based on resource levels in the current LTFP and community consultation/engagement.
Service Attribute
Service Objective
Performance Measure Process
Current Performance
Expected position in 10 years based on current LTFP
COMMUNITY OUTCOMES Key findings from a customer satisfaction survey find that largest performance gaps for resident satisfaction were maintaining local roads, economic development and financial management. COMMUNITY LEVELS OF SERVICE Quality Water supplied taste
is acceptable and is Clear
Customer surveys Customer requests
To be provided from the Resident Survey
Requests received should not increase annually
Function Reliable water supply
Customer surveys Customer requests Ongoing monitoring
To be provided from the Resident Survey
Requests received should not increase annually
Safety Safe to drink Meets health standards
Monitoring and reporting program
Meets all health requirements
Meets all health requirements
Table 2.1: Community Level of Service
Technical Levels of Service Supporting the community service levels are operational or technical measures of performance. These technical measures relate to the allocation of resources to service activities that the organisation undertakes to best achieve the desired community outcomes and demonstrate effective organisational performance.
Technical service measures are linked to annual budgets covering:
Ø Operations – the regular activities to provide services such as opening hours, cleansing, mowing grass, energy, inspections, etc.,
Ø Maintenance – the activities necessary to retain an asset as near as practicable to an appropriate service condition (e.g. road patching, unsealed road grading, building and structure repairs),

Page 18 of 48 Richmond Valley Council Water Supply Network 2015-2025
Ø Renewal – the activities that return the service capability of an asset up to that which it had originally (e.g. frequency and cost of road resurfacing and pavement reconstruction, pipeline replacement and building component replacement), and
Ø Upgrade – the activities to provide a higher LoS (e.g. widening a road, sealing an unsealed road, replacing a pipeline with a larger size) or a new service that did not exist previously (e.g. a new library).
Service and AMPs, implement and control technical service levels to influence the customer service levels.3 Table 2.2 shows the technical level of service expected to be provided under this AM Plan. The agreed sustainable position in the table documents the position agreed by the Council following community consultation and trade-off of service levels performance, costs and risk within resources available in the long-term financial plan.
Description Units Target Level of Service
System Performance
Minimum pressure at water meter m head 12 except for existing high level zones
Average annual demand kL/res property 200
Domestic quantity available per peak day L/tenement/day 2,500
Consumption Restrictions in Droughts
Maximum frequency of restrictions (subject to supply volume, blue green algae and Rous Water Drought Management Strategy)
number of times per 10 years
5
Maximum duration of Restrictions months/10 yr period 12
Ability to supply demand through the worst drought on record
% of water demand 80 (i.e. a 20% reduction in consumption).
Interruptions to Supply (per year per supply)
Planned (95% of time)
Notice given to domestic customers (between 9am and 4pm)
days 1
Notice given to industrial and commercial customers (times to be negotiated)
days 7
Unplanned
Maximum duration hours 8
Maximum interruptions to supply per 1,000 properties p.a.
70
Main breaks per 100 km main p.a. 10
3 IPWEA, 2011, IIMM, p 2.22

Page 19 of 48 Richmond Valley Council Water Supply Network 2015-2025
Service Provided
Time to provide an individual, residential connection to water supply in serviced area
working days 10
Customer Complaints
Number events per 1000 properties p.a.
5
Water Quality
Potable Water Quality ADWG 2011
Response Time (time to have staff onsite or to investigate a problem or answer an enquiry)
Priority, Issues and Effects Customer given informed feedback
Repairs to commence
Priority 1: A complete failure to maintain continuity of supply to large number of customers or critical user at critical time
Possible Issues: Broken water main, broken service, jammed hydrant, no water, dirty water, leak creating a major issue. Typical Effects: Personal injury or risk to public health, loss of supply, major property damage, failure to maintain quality or quantity of service, large volume of water wasted, significant unplanned depletion of service reservoir, major environmental impact.
Within 1 hour Within 2 hours
Priority 2: Partial failure to maintain continuity of supply to small no. of customers or critical user at a non-critical time
Possible Issues: Missing hydrant/valve lid, poor pressure, leaking tapping, ferrule, stop tap, water main/service, valve or hydrant, minor leak on footpath or roadway, partial failure of connections, water hammer, faulty or damaged meter. Typical Effects: Minor property damage, minor environmental impact
Within 1 working day Within 24 hours
Priority 3: Known fault, non-urgent
Possible Issues: Service disconnection, faulty hydrant/valve, missing hydrant. Typical Effects: Need for preventative maintenance, minor customer impact.
Within 3 working days
Programmed Maintenance List
Table 2.2: Water Supply Levels of Service
Water Business Levels of Service Technical LoS is a function of ongoing serviceability (Operations, Maintenance and Administration (OMA) and renewing of depleted assets. Council factors 79% of budget for OMA or serviceability costs ($55.6 million), 19% for renewing depleted assets ($13.4 million) and 4% for new assets ($2.8 million) over the long term financial planning period (LTFP).
The LTFP water program allocates $13.4 million for budgeted renewals, $2.8 million for new works with a total program depreciation of $13.7 million and total asset disposals of $5.3 million. This results in a water business renewals ratio of 0.99 and a Bring to Satisfactory (BTS) ratio of 0.0.

Page 20 of 48 Richmond Valley Council Water Supply Network 2015-2025
Figure 2.3 shows the technical LoS expected to be provided under this AMP. The agreed sustainable position in the table documents the position agreed by the Council following community consultation and the trade-off of service levels performance, costs and risk management of resources available in the LTFP.
Figure 2.3: Water Business Levels of Service ($000)
2.2 Customer Research and Expectations Council engaged Micromex to conduct the Richmond Valley Council Community Research 20134. The poll from a sample of residents revealed their level of satisfaction with Council’s services. Council sought to examine community attitudes and perceptions towards current and future services and facilities provided by Council. Key objectives of the research included:
Ø To assess and establish the community’s priorities and satisfaction in relation to Council activities, services and facilities,
Ø To identify the community’s overall level of satisfaction with Council’s performance, Ø To identify the community’s level of satisfaction with regards to contact they have had with
Council staff.
Overall, the research has found a generally positive result for Council, with 29 of the 32 services/facilities/criteria rated as being of ‘moderate satisfaction’ to ‘very high satisfaction’.
At an overall level, residents expressed a ‘moderate’ level of satisfaction with the performance of Council, with 82% of the respondents giving a rating of ‘somewhat satisfied’ to ‘very satisfied’. Only 4% of residents indicated that they were ‘not at all satisfied’ with Council’s performance.
Compared to an All of NSW measure and Regional Councils, Richmond Valley has performed better than average. The most recent community satisfaction survey reported satisfaction levels for the following services in Table 2.3. The community is generally satisfied with services provided by Council and is very satisfied with the regional water supply service.
4 Micromex Research, 2013, Richmond Valley Council Community Research

Page 21 of 48 Richmond Valley Council Water Supply Network 2015-2025
Performance
Measure Satisfaction Level
Very Satisfied
Fairly Satisfied
Satisfied Somewhat satisfied
Not satisfied
Economic development and Local Employment
√
Community Consultation
√
Financial Management
√
Support for Community Organisations
√
Council Provision of Information for Residents
√
Council Policies and Plans
√
Town Water Supply
√
Maintaining Local Roads
√
Table 2.3: Community Satisfaction Survey Levels
2.3 Key Assumptions made in Financial Forecasts This section details the key assumptions made in presenting the information contained in this AMP and in preparing forecasts of required operating and capital expenditure and asset values, depreciation expense and carrying amount estimates. It is presented to enable readers to gain an understanding of the levels of confidence in the data behind the financial forecasts.
Forecast Reliability and Confidence The expenditure and valuations projections in this AMP are based on best available data. Currency and accuracy of data is critical to effective asset and financial management. Data confidence is classified on a five level scale5 in accordance with Table 2.4
5 IPWEA, 2011, IIMM, Table 2.4.6, p 2|59.

Page 22 of 48 Richmond Valley Council Water Supply Network 2015-2025
Confidence Grade
Description
A Highly reliable Data based on sound records, procedures, investigations and analysis, documented properly and recognised as the best method of assessment. Dataset is complete and estimated to be accurate ± 2%
B Reliable Data based on sound records, procedures, investigations and analysis, documented properly but has minor shortcomings, for example some of the data is old, some documentation is missing and/or reliance is placed on unconfirmed reports or some extrapolation. Dataset is complete and estimated to be accurate ± 10%
C Uncertain Data based on sound records, procedures, investigations and analysis which is incomplete or unsupported, or extrapolated from a limited sample for which grade A or B data are available. Dataset is substantially complete but up to 50% is extrapolated data and accuracy estimated ± 25%
D Very Uncertain Data is based on unconfirmed verbal reports and/or cursory inspections and analysis. Dataset may not be fully complete and most data is estimated or extrapolated. Accuracy ± 40%
E Unknown None or very little data held.
Table 2.4: Data Confidence Grading System
Key assumptions made in this AMP and risks that these may change are shown in Table 2.5
Key Assumptions Risks of Change to Assumptions Use of existing inventory data Data set is reliable; monetary movements have a
confidence level of A. Use of existing valuations and useful lives • Design lives confidence level A
• RUL confidence level B, some slight deviation observed when applying modified pattern asset movements over the LTFP.
Use of current expenditure information as best as this can be determined
Confidence level A. Council has integrated asset schedule.
Table 2.5: Key Assumptions made in AM Plan and Risks of Change
The estimated confidence level for and reliability of data used in this AMP is shown in Table 2.6.
Data Confidence Assessment
Comment
Demand drivers TBD Need calibration Growth projections Highly Reliable ABS and NSW DPI Operations expenditures Highly Reliable Low variations over four years Maintenance expenditures Highly Reliable Low variations over four years Projected Renewal exps. - Asset values
Reliable Dataset complete with some expected errors
- Asset residual values Reliable Dataset complete with some expected errors
Table 2.6: Data Confidence Assessment for Data used in AM Plan
Page 23 of 48 Richmond Valley Council Water Supply Network 2015-2025
3. Future Demand Demand management is an action plan to improve usage and efficiency for the water supply system. The capacity of an organisation is dependent on quantitative analysis and best judgements across the many factors impacting on service delivery. Issues include asset integrity, preventative maintenance, periodic renewal and network expansion to accommodate community development.
The potential benefits of a demand management program include sustainable usage patterns, delaying investment in new infrastructure and to reduce the operational costs of reticulated water services. LWU’s can balance demand management initiatives with supply side works and achieve triple bottom line benefits including lower rates for their customers, a more secure water supply; and increase residual water for environment uses.
Council experiences low water supply security resulting in water restrictions as an additional demand management measure. The region has benefited from recent above average rainfall seasons, therefore limiting restrictive measures. The average annual residential water usage has declined from 201 kL/year (NSW median 215 kL/year) in 2006 to 171 kL/year in 2011, 166 kL/year in 2012 and 184 kL/year in 2013 (NSW medians 159, 155 and 166 kL/year)6. These patterns demonstrate sustainable gains but at a lesser rate than LWUs across NSW.
Key Water Demand Definitions Key definitions used to discuss water demand are: Ø Water production - the total water that is passed through bulk meters and treatment facilities
into the reticulation system, and Ø Water consumption - the amount of water recorded in the Council customer database
through monitoring of water meters at each property.
In ideal systems water production and water consumption would be the same. Unaccounted For Water (UFW) represents system leakages and unmetered consumption. This is water that is produced but not charged for under the water supply tariff structure, it is non-revenue water (NRW). Historical water patterns indicate that the Casino water business had high UFW levels around 20% or twice the level of 10% considered as best practice7.
3.1 Drivers of Future Demand Predicted population growth for the Casino area is expected to be the biggest driver of demand for the reticulated water service. Other drivers of future demand include changes in household lot size, occupancy rates, dwelling mix and the uptake of water efficient devices.
The Region is expected to experience population growth (0.51% pa), decreasing household occupancy rates and an ageing population. The number of dwellings in the LGA is expected to increase from 9,150 in 2011 to 10,750 in 2031, an increase of 1,600 dwellings at an average growth rate of 0.81% p.a., with cumulative growth of 17.5%.
6 NSW Government, 2013, NSW Water Supply and Sewerage: Performance Monitoring Report
7 JWP, 2007, Richmond Valley Council Demand Management Plan

Page 24 of 48 Richmond Valley Council Water Supply Network 2015-2025
Key Water Statistics Council water business data analysed for the period 2011/12 to 2013/14 is summarised in Table 3.1. The data is averaged to smooth variations in particular the UFW indicator. Across the region the average residential household uses 153 kl per year, rural households use 3.6 times as much as urban households, businesses 6 times as much while a large industrial business use the equivalent of 1,555 urban households. This is reflected in the average usage in Table 3.1, with Casino having four large industrial businesses and Broadwater having one large industrial business.
Table 3.1: Council Water Data
Across the region UFW averages 9% which represents a significant gain from 2007 when the figure was estimated at 24%. Figure 3.1 and Figure 3.2 demonstrate seasonal variations in supply versus demand for the Lower Richmond River communities and for the urban centre of Casino. The gap between supplied water and consumed water represents UFW.
UFW can result from water leakage, unmetered or poorly recorded metering. Generally a UFW indicator of 10% is considered best practice but there is evidence to indicate a 6% target can provide economic benefits.
Figure 3.1: Water Supply and Consumption for Lower Richmond River Communities

Page 25 of 48 Richmond Valley Council Water Supply Network 2015-2025
Figure 3.2: Water Supply and Consumption for Casino
3.2 Future Water Demand Previous water demand modelling has confirmed that population and therefore number of households is the best predictor of water demand. For the region this equates to a growth rate of 0.81% p.a. The demand for Casino and Broadwater communities is skewed by the presence of large industrial businesses with the Broadwater sugar mill consuming 33 ML p.a. and the four industries consuming a combined 1,158 ML p.a.
Figure 3.3: Future Water Demand
Future demand as displayed in Figure 3.3 is based on the growth in household numbers with demand from the large industrial businesses remaining constant. Previous demand management forecasting for Casino anticipated consumption to exceed the Jabour Weir extraction limit of 3,427 ML/year by 2035.

Page 26 of 48 Richmond Valley Council Water Supply Network 2015-2025
Improved performance by Council in limiting UFW, more exact demand drivers and adjustment for industries like the Meatworks could extend supply availability from the Jabour Weir extraction licence out to 2118. The scenario described would be considered ideal, a more prudent scenario would factor uncertainty especially around the security of supply.
The ideal scenario is optimistic because growth would be based on employment opportunities with new industrial businesses. Using the same ratio of industrial to residential water usage from present users would see available supply in Casino extending to 2071 before augmented water sources were required. Water supply modelling is however highly variable (it is unrealistic to expect average 30 year stream flows to repeat over the next 30 years) and water supply security is the number one risk for the Council water business.
Jabour Weir is an on stream storage and has a capacity of 1,623ML, resulting in the reliability of the water system being relatively low and level 1 to 4 restrictions could be expected in any year. Monte Carlo simulations noted that the reliability of the water supply system was 17% and that the probability of running out of water is high (0.5%)8. To put this in perspective the probability of running out of water in Sydney is 0.01%. Council’s IWCM strategy identified and evaluated and range of opportunities to manage IWCM issues.
3.3 Potential Demand Management Measures Estimating the economic cost benefit relationship from water saving initiatives (NSW regulatory BASIX measures) and therefore delaying the costs of capital works and reducing future operational costs (i.e. customer benefits) has been modelled in the Richmond Valley Demand Management Plan. Table 3.2 shows the cost effectiveness of these reticulated water demand management measures.
Table 3.2: Cost Effectiveness of Demand Management Measures 8 JWP, 2008, Richmond Valley IWCM Strategy

Page 27 of 48 Richmond Valley Council Water Supply Network 2015-2025
Council implemented a Demand Management Plan in 2007, (Integrated 1 scenario - BASIX measures) focusing on best practice pricing, UFW reduction and a water conservation education campaign supplemented by a water showerhead retrofit program. Appropriate pricing through a ‘pay-for-use’ structure, the promotion of better gardening practices (mulching and watering methods) and a better than 50% reductions in UFW has improved water supply security.
Source Augmentation Strategies Council’s IWCM strategy identified water resource scarcity as an ongoing concern. In 2008, a TBL assessment (of economic, social and environmental measures), including a measured risk approach factoring the relatively long lead times to investigate viable source augmentation options resulted in a demand management approach.
After a period of protracted drought, recent favourable seasons have, increased river flows, enhanced the productivity of aquatic ecosystems and increased the water available in storages. Increased water security has complemented the Council LWU demand management approach.
Droughts occur naturally in Australia and can have major repercussions for all water users and the environment. Achieving a secure and sustainable LWU will require a large capital works program based on a high level regional study. The cost of a regional study is estimated at $500,000, it would need to be coordinated by the relevant state government departments.
Investigations would evaluate the cost benefits of augmenting current sources, identifying new sources and potential new sources, desalination, underground water, stormwater harvesting, recycled water and treated effluent. The scope of the investigations could include:
Ø Description and evaluation of current systems, Ø Baseline studies (demand analysis, surveying, water resources, preliminary geotechnical,
environmental, etc.), Ø Identification of options, Ø Provision of an indicative assessment of the costs, benefits and risks of each identified
option, and Ø Identification of the issues (political, economic, social and environmental) that need to be
resolved in more detailed studies; and Identification of the tasks required to progress from pre-feasibility to an implementation stage.
3.4 NOROC Regional Water Study NOROC has resolved to develop a long term (50 year) regional water supply strategy to evaluate potential benefits and future water supply security resulting from a regionally integrated system.
The current system serves approximately 80,000 residential properties and 7,000 non-residential properties with 23,000 ML p.a. demand/capacity. The current secure yield is 32,000 ML p.a. with a current supply surplus of 8,000 ML p.a. or 27%. The major sources are Rocky Creek Dam and Clarrie Hall Dam which provide 86% of supply to 90% of the region’s population.
By 2060 the Northern Rivers water supplies are expected to serve approximately 146,000 residential properties and 14,000 non-residential connections. Regional demand will increase by 74% to 40,000 ML p.a., while the secure yield is expected to reduce by 26% to 26,000 ML p.a. The net effect is that the region will experience a water supply deficit of 14,000 ML p.a. or 43% of requirement.

Page 28 of 48 Richmond Valley Council Water Supply Network 2015-2025
Hydrosphere Consulting has preliminarily investigated options and recommended five scenarios to secure the long-term supply of water services in the Northern Rivers. Number one recommendation is for a large-scale centralised desalination plant that provides benefits in term of yield, climate independence and scalability. Potential risks include energy cost and acceptable solutions for brine disposal. The overall attractiveness (based on five key criteria) is high and meets the objectives of the study.
Rous Water’s bulk supply will require augmentation by 2020, Casino by 2025 and Tweed by 2030. A regional approach to water security can provide improved financial outcomes through economies of scale as well as a range of options to improve efficiency, system resilience and operational flexibility. Financial outcomes can be achieved through staged development of water sources, increased flexibility of water schemes, reduction in duplicated infrastructure and sharing of OMA costs over a larger customer base.
The second regional option is to raise the Clarrie Hall Dam to increase yield by 8,250 ML/a and to develop Dunoon Dam (50,000 ML/a) on the Richmond River with a predicted yield of 6,100 ML/a. This option has an overall attractiveness of moderate, but is still susceptible to climate changes.
The third option includes raising the capacity of Dunoon Dam to 85,000 ML/a, but has a low attractiveness in not achieving any benefits over Option 2. Option 4 includes the usage of Toonumbar Dam with 20m of wall-raising, this provides benefits for Kyogle and Casino however its overall attractiveness is low. Option 5 involves Toonumbar Dam and raising the Clarrie Hall Dam; this scenario meets objectives of the study but is still susceptible to climate impact. Rous Water’s current preferred option is extraction of groundwater from coastal sands. This is currently under investigation.
The success of long-term regional planning will depend on a comprehensive water sharing plan developed by NOW, a two transfer system between major surface water sources a coordinated approach to scheme development. Individual LWU proceeding with large scale scheme developments to secure their own supplies would limit economies of scale achievable from a coordinated approach. Ultimately this will require sophisticated modelling to determine local cost benefit against regional cost benefit and ownership direction from NOW.
3.5 Drought Management The LGA is characterised by a sub-tropical climate with hot and humid summers and mild winters. The average rainfall for the area is 1,100 mm ranging from 1650mm along coastal areas and 1,025mm over the inland regions.
Council’s Drought Management Plan ensures sound and robust mechanisms to manage town water supplies during periods of drought. These include a staged approach to water security with five levels of water restrictions for Casino triggered by river flows at Jabour weir, and seven levels of restrictions for the MLRR area managed by Rous Water based on Rocky Creek dam storage levels.
This provides the LWU and residents with a timely, efficient and affordable response to reduce water consumption during drought periods. The LWU actively cooperates with key stakeholders from Kyogle Council, Rous Water and the Department of Natural Resources to ensure the provision of minimum water supplies for basic sanitation and health requirements.

Page 29 of 48 Richmond Valley Council Water Supply Network 2015-2025
A key planning objective of demand management and drought management is to ensure that, in the long term, restrictions are not required more than 5% of the time and that the average frequency of restrictions is less than once every 10 years (the level of service).
3.6 Flood Management Flooding in Casino and the downstream river towns is a regular occurrence due to the confluence of three major river inflows being the Richmond River, Wilsons River and Bubgawalbyn Creek. Approximately 35% of the LGA is vulnerable to flooding, with events in the lower river towns having reoccurrence intervals of five to ten years.
The Floodplain Risk Management Plans identify immediate and longer-term mitigation measures, including:
Ø Flood warning and emergency planning, Ø Raising community awareness, Ø Development control planning, Ø Voluntary house raising/purchase, and Ø Infrastructure measures including levees, creek protection and drainage measures9.
3.7 Demand Management Plan Council’s OMA practices continue to advance with improved predictive knowledge from information systems and the adoption of industry best practices. Managing demand for services is a combination of preventative and reactive maintenance practices that maintain asset serviceability, and the timely renewal of assets that have reached end of life.
Council continues to invest in information systems and evidence based data including conditions ratings, remaining useful life, depreciation patterns which improve the infrastructure and long term financial planning functions. Figure 3.4 illustrates the capital works planning for the next ten years and new works scheduled to improve the water business.
Fig 3.4 New Assets from Growth
9 RVC Casino Floodplain Risk Management Plan (2002a), RVC Mid-Richmond Floodplain Risk Management Risk (2002b)

Page 30 of 48 Richmond Valley Council Water Supply Network 2015-2025
Opportunities identified for demand management include monitoring community expectations to determine LoS and analysing the cost of provision to determine the long term affordability. There is a gap between community aspirations and their willingness to pay for these services. It is the responsibility of Council to articulate the evidence presented in asset and financial planning, therefore narrowing the expectations gap.
Financial results from best practices applied to the water business identify that 91% of capital expenditure will be required to maintain the existing network of assets. A total of $1.3 million has been allocated for new and improved serviceability of the water business. It is important to note that acquiring additional assets from growth or by provision of additional infrastructure services, will ultimately commit Council to fund ongoing operations and maintenance costs. These future costs should be identified and considered in developing forecasts of future operating and maintenance costs.
4. Lifecycle Management Plan A Lifecycle Asset Management Plan details how Council plans to manage and operate water business assets at the agreed levels of service while optimising lifecycle costs. The objective is to look at the lowest long term cost rather than seeking short term savings when making decisions. Sustainable financial management is about managing community outcomes by providing assets and services with the lowest long term cost.
4.1 Background Data The Council water network includes 10 asset classes (encasements are a part of the pipe network) consisting of 23,549 unique assets with a Current Replacement Cost (CRC) of $81.93 million. Reservoirs and WTPs have the oldest average age of 33 years and 27 years respectively and water meters are the newest assets in the network. The remaining useful life (RUL) for all water assets as a percentage of total life is 67.8%. Table 4.1 provides the descriptive attributes for water network assets.
Table 4.1: Water Asset Statistics

Page 31 of 48 Richmond Valley Council Water Supply Network 2015-2025
Long life assets have modified depreciation schedules reflecting reduced consumption patterns in earlier years and increasing consumption as the asset integrity declines towards end of useful life (Figure 4.1). Standard lifecycle asset terms include:
Ø CRC - the minimum it would cost, to replace the existing asset with a technologically modern equivalent new asset with the same economic benefits or service potential,
Ø Depreciable amount (DA) - CRC for depreciable assets less residual value (RV), Ø Depreciated replacement cost (DRC) - CRC less accumulated depreciation, and Ø Asset valuations by the valuer employ a modified depreciation pattern which results in asset
valuations as a percentage (DRC/CRC) being higher than the age percentage (RUL/Useful Life).
Council Water Asset Values (Table 4.2) shows the fair value of assets (CRC) is $81.93 million, with DA totalling $67.78 million with a residual component of $13.15 million; and DRC or the written down value (WDV) is totalling $69.34 million. Council water assets DRC is currently 84.6% of CRC (vs. current age of 67.8%) illustrating the effect of modified depreciation schedules. Annual depreciation of $767,194 reflects an asset consumption rate of 1.12%. The asset renewal funding ratio10 is 0.99 indicating Council plans to renew assets at the rate they are being consumed.
Figure 4.1: Depreciation Profile for Long Lived Assets
4.2 Physical Parameters The age profile of water assets shows that significant construction took place in the post-World War 2 time period. It is likely that much of this infrastructure will be well through its useful life and will require renewal in the near future. The profile also indicates that the age data on infrastructure requires development/further investigation.
Figure 4.2 examines the data by time periods. This graphic illustrates that the Reservoir network is aged with major works over 50 years ago supported by renewals in recent years. The average age of Reservoir assets is 33 years and their remaining useful life is 23 years indicating the network is 60% through its lifecycle.
10 AIFMG, 2012, Version 1.3, Financial Sustainability Indicator 4, Sec 2.6, p 2.16

Page 32 of 48 Richmond Valley Council Water Supply Network 2015-2025
Table 4.2: Water Asset Values
The water pump station and treatment plant networks built during the 1980’s have an average age of 20 and 27 years respectively and their remaining useful lives are 19 and 20 years and therefore approaching the latter stages of their respective lifecycles.
The remaining water supply hierarchy of assets are relatively new with their average useful lives greater than their average age. Water valve and service connection assets are approaching the 40% mark of their lifecycle with average ages of 23 years and remaining useful lives of 38 and 41 years. The water pipe and water hydrants assets on average have a remaining lifecycle of 70%. The water swabbing pits are comparatively new with an average remaining lifecycle of 87% and water meters with an average remaining life of 91%. Water asset construction data is presented in Table 4.3 and Figure 4.2.
Table 4.3: Water Asset Construction data ($000)

Page 33 of 48 Richmond Valley Council Water Supply Network 2015-2025
Figure 4.2: Water Asset Age Profile
Asset renewals Council’s asset register provides RUL’s for each asset which can be used to predict the capital renewals by decade (Table 4.5). Years with the highest renewal expenditures include 2084 with $10.8 million of works, 2075 with $10.2 million of works, 2058 with $9.6 million of works, 2040 with $5 million of works and 2033 with $4.6 million of asset renewal capital works.
Planning forward works is a function of renewals due and resourcing capacity. Over the LTFP period Council has $5.3 million of water assets requiring renewal and has allocated 2.51 times this amount to allow for contingencies, and the preservation of the network. The following tables display asset financial movements for EOL Disposals, Renewals and Depreciation values ($000s) for each water asset this current LTFP. These tables produce the key BTS and Renewals Ratios discussed below.
Council demonstrates a mature and integrated approach towards budget development, LTFP and capital works planning. This approach is influenced by best practice management and the future sustainability of Council businesses. Asset and financial planning primary considerations include replacement of end of life assets represented as a BTS Ratio, and the preservation of assets represented as a Renewals Ratio.
The following tables provide a time series for EOL disposal values, proposed capital renewals, annual depreciation values (which measure the consumption of assets) and WDV (which measure the remaining service potential of assets). The table with capital renewals presents Councils approach to achieving benchmark ratios of less than 0.02 for BTS and 1.0 for asset renewals.

Page 34 of 48 Richmond Valley Council Water Supply Network 2015-2025
Table 4.4.1: Capital End of Life Disposal Values ($000)
Table 4.4.2: Capital Renewals Values ($000)
BTS communicates the quantum of assets that are at risk or require immediate attention to restore their serviceability. With Council implementing best practice through professional revaluations on a five yearly cycle, Council’s control systems have dependable data on the current state of assets. Therefore calculation of BTS is a simple calculation of the total value of EOL assets in year (x) less the value of renewals in that year compared to the total WDV of the asset class. For the LTFP period the water network has a BTS measure of 0.0 and this is consistent across all asset types.
The Renewables Ratio communicates the preservation of asset integrity. Asset consumption as measured by depreciation reflects the loss of future service potential in infrastructure assets. In accordance with AASB 116, p60 Council estimates asset consumption most closely reflecting their real world deterioration rates. This increases the complexity of financial calculations and will ultimately focus attention on best practice maintenance and renewals programs to preserve asset integrity.
An ideal renewables ratio is 1.0. This simply means that the value of renewables in year (x) matches the consumption of asset in that year. The LTFP process has focused on a sustainable asset position at the end of 10 years across all community assets and this is reflected in improving Renewables Ratios each year. For the LTFP period the water network has a renewables ratio of 0.99 which is ideal.

Page 35 of 48 Richmond Valley Council Water Supply Network 2015-2025
Table 4.4.3: Capital Depreciation Values ($000)
Table 4.4.4: Capital Written Down Values ($000)
Table 4.5: Capital Renewal Schedule ($000)

Page 36 of 48 Richmond Valley Council Water Supply Network 2015-2025
Figure 4.3: Asset Renewals Profile
Asset Mix, Location and Current Issues
Casino Council has four Reservoirs located within Casino. Three of these are situated in North Casino with their install years varying from 1914 to 1977, while the fourth is situated in South Casino with an install year of 1943. Maintenance is mainly reactive with defects being fixed as they occur. Reservoir 1 at North Casino has easily eclipsed its useful life while the Reservoir at South Casino is approaching the end of its useful life. All Reservoirs regularly have safety inspections to ensure compliance with current Australian Standards.
Jabour Weir, constructed in 1972, has been raised twice, with the final weir raising constructed in 1976. The structure is generally in good condition with no signs of movement or major deterioration. The condition of the existing rockbolts has been assessed as at the limit for safety and stability. The structure is not considered stable for the flood operating condition unless the stabilising load in the existing rockbolts reaches ultimate capacity. This renewal work is programmed for 2015/16 year.
Council’s two pump stations at Colches Street and the Richmond River intake were both commissioned in 1985. Maintenance of pump stations since their initial construction has mainly being reactive with defects being fixed as they occur.
Council’s Water Filtration Plant was constructed in 1985 (which replaced the old water filtration plant at South Casino). The filtration plants performance is satisfactory although there have been some taste and odour complaint issues in the Casino area with fluctuations in the water quality. Fluctuating parameters include taste and colour, blue-green algae occurrence, residual chlorine levels and high manganese levels. A potassium permanganate dosing plant will be installed at the raw water pump station in the future to alleviate some of these problems. Maintenance on the Water Filtration Plant is carried out according to a schedule by the appropriate staff.

Page 37 of 48 Richmond Valley Council Water Supply Network 2015-2025
MLRR Council has nine reservoirs located within the Lower River district, with construction dates varying from 1949 to 2007. All Reservoirs regularly have safety inspections to ensure compliance with current Australian Standards.
Council’s four pump stations within the Lower River district were commissioned between 1990 and 2005. Maintenance of these pump stations since initial construction has mainly being reactive with defects being fixed as they occur.
Council’s asset management systems provide condition based intelligence that flows through to asset maintenance and asset rehabilitation programs. This provides engineers and field support staff with an early warning system the assets flagged as nearing the end of their useful lives. A network analysis of Council’s water supply system needs to be carried out to ensure the system meets service requirements in terms of pressure, flow and reliability.
Council in accordance with AASB 13 Fair Value Measurement and AASB 116 Property Plant and Equipment is progressively revaluing and conditioning each asset class by professional valuers. Council employed an additional engineering assistant in the 2014 financial year to improve condition based rating data which will generally enhance the predictive intelligence of asset management systems.
Fire Hydrants and Stop Valves are subject to quarterly inspections, but at this stage it is unknown how many hydrants or stop valves get inspected within the time allocated. Maintenance is carried out after these inspections and on a reactive basis.
Water Meters are inspected quarterly when the meters are read for billing purposes. Any defects are noted at this time and fixed accordingly. Other valves at this stage are not inspected. Maintenance of these valves is mainly reactive with defects being fixed as they occur.
Water service lines have no replacement or maintenance schedule with the maintenance of these lines being reactive with defects fixed when they occur. Council is progressively replacing existing asbestos piping with uPVC (Blue Brute) pipes. This follows a Council initiative to identify asbestos assets across the networks and to systematically replace these assets.
4.3 Asset Conditions Asset conditions are monitored on a rotating asset class schedule. This is a recent development at Council and it ensures that all assets will receive an observational rating once every four years. The water and sewer network of assets were rated in 2012, stormwater in 2014 and land and building assets in 2015. The condition profile of our water supply assets is shown in Figure 4.3. 85% of Council assets have a current condition rating of 1 or 2 generally reflecting a network in good condition.
Figures 4.3 and 4.3.1 illustrate the current condition profile for each asset type as a percentage with the black diamond showing the average condition (right hand scale) for each asset. Using Pipe Main as an example, in 2014, 84% of pipe assets were condition 1 or 2, with the black diamond indicating an average condition of 1.7. By 2025 all of the condition 1 Assets have moved to a condition 2 level, resulting in a weighted average condition of 3.4.

Page 38 of 48 Richmond Valley Council Water Supply Network 2015-2025
Figure 4.3: Asset Condition Rating Profile
Figure 4.3.1: Asset Condition Rating Profile

Page 39 of 48 Richmond Valley Council Water Supply Network 2015-2025
4.4 Financial Summary Council’s LWU operates the water business as single program with a restricted reserves fund to meet Capex under and over expenditure requirements. Council revenue streams include access and usage charges, grants revenue, developer service charges and interest on restricted reserves. Operating expenditure (OpEx) includes operations, maintenance and management activities (OMA). Capital expenditure (Capex) includes renewals program, improved LOS programs and augmentation programs. Table 4.6 provides a summary of cash flows for 20 years.
Cash flow predictions are based on current business expectations with 5% as the indicator for revenue streams and 3% for expense streams. Developer service pricing also provide some uncertainty for revenue flows. The LWU business demonstrates a healthy state with a net flow of $2 million into the restricted fund over the forward period.
Asset Lifecycle profiles for the water business is shown in Figure 4.4. The balance of funding for water asset class represents transfers from the water reserve fund. Annual consumption of assets (depreciation) is shown on the right axis.
Table 4.6 provides a summary of cash flows for 20 years. Cash flow predictions are based on current business expectations with 3% indexation for revenue and expense streams beyond the LTFP. Funding for the water program includes operating budgets, capital grants and contributions and internal transfers from the restricted water fund. This means a shortfall is balanced by transfers from restricted assets and a surplus will result in a transfer to restricted assets. For the next 10 years the water program will transfer $2.1 million to restricted funding.
Asset Lifecycle profiles for the water business are shown in Figure 4.4, this illustrates the flow of funds for operating and capital expenditures over the forward period. Annual consumption of assets (depreciation) is shown on the right axis.

Page 40 of 48 Richmond Valley Council Water Supply Network 2015-2025
Table 4.6: Projected Operating and Capital Expenditure ($000)
Figure 4.4: Projected OpEx and Capex

Page 41 of 48 Richmond Valley Council Water Supply Network 2015-2025
4.5 Sustainability of Service Delivery There are four key indicators for service delivery sustainability that have been considered in the analysis of the services provided by this asset category, these being the Asset Renewal Funding Ratio, Long Term Life Cycle Costs/Expenditures and medium term projected/budgeted expenditures over 5 and 10 years of the planning period.
Asset Renewal Funding Ratio11 - 1.0 The Asset Renewal Funding Ratio is the most important indicator and reveals that over the next 10 years, Council is forecasting that it will have 99% of the funds required for the optimal renewal and replacement of its assets.
Long term - Life Cycle Cost Life Cycle Costs (or whole of life costs) are the average costs that are required to sustain the service levels over the asset life cycle. Life Cycle Costs include operations and maintenance expenditure and asset consumption (depreciation expense).
Life Cycle Costs can be compared to life cycle expenditure to give an initial indicator of affordability of projected service levels when considered with age profiles. Life cycle expenditure includes operations, maintenance and capital renewal expenditure. Life cycle expenditure will vary depending on the timing of asset renewals. The life cycle expenditure over the 10 year planning period is $6.33 million per year (average operations and maintenance plus capital renewal budgeted expenditure in LTFP over 10 years). The 10 year Average LTCM indicator is $6.82 million per year
A shortfall between Life Cycle Costs and life cycle expenditure is the life cycle gap. The life cycle gap for services covered by this asset management plan is + $494,000 per year (negative = gap, positive = surplus).
10 Year AM Financial Indicator - Life cycle expenditure is 108% of Life Cycle Costs. The Life Cycle Costs and life cycle expenditure comparison highlights any difference between present outlays and the average cost of providing the service over the long term. If the life cycle expenditure is less than that Life Cycle Costs, it is most likely that outlays will need to be increased or cuts in services made in the future.
Knowing the extent and timing of any required increase in outlays and the service consequences if funding is not available will assist organisations in providing services to their communities in a financially sustainable manner. This is the purpose of the AMPs and LTFP.
Medium term – 10 year financial planning period This AMP identifies the projected operations, maintenance and capital renewal expenditures required to provide an agreed LoS to the community over a 10 year period. This provides input into 10 year financial and funding plans aimed at providing the required services in a sustainable manner.
11 AIFMG, 2012, Version 1.3, Financial Sustainability Indicator 4, Sec 2.6, p 2.16

Page 42 of 48 Richmond Valley Council Water Supply Network 2015-2025
These projected expenditures may be compared to budgeted expenditures in the 10 year period to identify any funding shortfall. In a core AMP, a gap is generally due to increasing asset renewals for ageing assets.
Medium Term – 5 year financial planning period The projected operations, maintenance and capital renewal expenditure required over the first five years of the planning period is $6.06 million on average per year.
Estimated (budget) operations, maintenance and capital renewal funding is $6.37 million on average per year giving a five year average funding surplus of $308,000. This indicates that Council expects to have 100% of projected expenditures required to provide the services shown in this AMP.
Providing services from infrastructure in a sustainable manner requires the matching and managing of service levels, risks, projected expenditures and financing to achieve a financial indicator of approximately 1.0 for the first years of the AMP and ideally over the 10 year life of the LTFP.
Long term Financial Plan Works Program Council’s LTCW program has an 11 year (current Budget plus LTFP) figure of $16.2 million for the water program. The asset register indicates $13.4 million of assets or 91% of the program will be renewals over the forward planning period. The balance of the program is divided 75% into improved LoS and 25% for scheme augmentation, therefore 7% of the program or $0.9 million is for LoS improvements and 0% or $0.3 million is for scheme augmentations over the planning period.
Operating and Management Costs The Typical Residential Bill (TRB) for water is low at $368 p.a. per assessment compared to state median of $516. OMA costs for water supply were 101c/kl similar to state median of 99c/kl. OMA for sewerage are 147c/kl slightly favourable to state median of 155c/kl for LWU’s with 3,000 to 10,000 properties.
5. Risk Management AM is about managing strategic and operational risks. The greatest strategic risk is whether a Council is sustainable. Efficient AM contributes to risk minimisation by providing reliable and relevant information to decision makers. Risk management is the demonstrated commitment to understand problems, to classify sensitivities, to prioritise solutions and to contain the adverse consequences of threats to an acceptable level.
A primary consideration when selecting risk protection and practices is to ensure that the costs incurred are not greater than the benefits gained. Factors affecting risk include the consequences of service failure, identification of significant and critical assets, and options to mitigate impact or reduce harm.

Page 43 of 48 Richmond Valley Council Water Supply Network 2015-2025
Water supply and quality has a high dependency on external factors not immediately addressed at the local level, they often require regional coordination and planning. Some uncertain risks have longer time frames and mitigation measures are too expensive to add value and therefore Council may choose to accept the risk.
The 2004 Australian Drinking Water Guidelines (ADWG) is a framework for managing drinking water quality. Hydrosphere developed a Gap Analysis to determine Council’s progress towards compliance and requirements for implementation of areas of responsibility. The Gap Analysis found that Council is proactive and responsive to known water quality risks when they were within their area of responsibility. Staff are experienced and qualified, planning is progressive to needs as they arise, however Council is yet to achieve compliance with ADWG.
Risks are generally identified and classified by the consensus approach through workshops or risk management tools (risk spectrum or risk matrix approach). These tools systematically quantify risk attributes into a risk factor, economic deprival, social disruption or environmental impact. Risk is associated with consequences completely enumerated in terms of probability. The consensus approach seeks answers to the types and source of risk, severity levels, possible outcomes and the scale of impact. Advanced techniques include ‘what if’ scenario type answers that seek to describe varying effects of events affecting a few customers through to widespread and unacceptable community risks.
In 2011 Council water group engaged consulting firm Hydrosphere to assess and report on Council’s water supply business and strategies in accordance with ISO 31000:2009. A total of 20 key risks were identified with either a high or extreme residual risk after existing controls. An assessment of risks (by Hydrosphere Consulting)12 associated with service delivery from infrastructure assets has identified critical risks that will result in loss or reduction in service from water network assets or a ‘financial shock’ to the organisation.
The risk assessment process identifies credible risks, the likelihood of the risk event occurring, the consequences should the event occur, develops a risk rating, evaluates the risk and develops a risk treatment plan for non-acceptable risks. Critical risks, being those assessed as ‘Very High’ - requiring immediate corrective action and ‘High’ – requiring prioritised corrective action are identified in the Infrastructure Risk Management Plan. A total of 20 key risks were identified with either a high or extreme residual risk rating (after existing controls):
Ø In general, the high or extreme risks are categorised by either a high rating for Consequence coupled with a low rating for Likelihood or a low rating for Consequence coupled with a high rating for Likelihood. No risk events had a combination of elevated Consequence and high levels of Probability.
Ø In some cases where either the Consequence or Likelihood is not known, the default rating of 4 out of 5 is assigned for these values. This results in a combined risk score which may be substantially higher than the real risk. In these cases, the recommended risk treatment aims, at least initially, to address this uncertainty.
Ø Key water supply risks related to failure of critical assets (e.g. Jabour Weir, raw water transfer system), drought, contamination of the Jabour Weir catchment, failure of the bulk
12Hydrosphere Consulting, August 2011, Risk Management Strategy: Water Supply

Page 44 of 48 Richmond Valley Council Water Supply Network 2015-2025
supply system, leakage, poorly documented AM and operation procedures, inadequate quality control procedures, climate change, urban water reform and non-compliance with regulatory requirements;
Ø Only one risk was rated as Extreme. This was related to the potential failure of Jabour Weir, the unknown condition of the rockbolts and the lack of knowledge regarding the ability to access residual storage within the river if the Weir storage fails. Factors contributing to the identified risks include ageing infrastructure, catchment influences on raw water quality, uncertainty regarding climate change and how this will influence water supply services and reliance on the knowledge of individual staff members combined with operations activities that are undertaken intuitively rather than following documented systems and procedures.
Ø Existing risk mitigation measures include ongoing strategic planning and investigations (e.g. assessment of Jabour Weir rockbolts, annual financial planning etc.), the Business Improvement Program, progressive development of operation and maintenance procedures, multi-skilling of operations staff, experienced staff members, conventional water supply system design and treatment processes.
Ø The causes of some key risks (e.g. drought, contamination of Jabour Weir catchment, leakage, climate change and urban water reform), cannot be directly addressed by the Council water group and therefore alternative mitigation measures need to be developed. In some cases, mitigation is expensive which means that Council may choose to accept a relatively high level of risk however, improved management systems and emergency response procedures can assist Council to better respond to these risks.
Key water supply risks related to failure of critical assets (e.g. Jabour Weir, raw water transfer system), drought, and contamination of the Jabour Weir catchment, failure of the bulk supply system, leakage, inadequate quality control procedures, climate change, urban water reform and non-compliance with regulatory requirements.
Factors contributing to the identified risks include ageing infrastructure, catchment influences on raw water quality, uncertainty regarding climate change and how this will influence water supply services, and reliance on the knowledge of individual staff members combined with operations activities that are undertaken intuitively rather than following documented systems and procedures.
Existing risk mitigation measures include ongoing strategic planning and investigations (e.g. assessment of the Jabour weir rockbolts, annual financial planning etc.), the Business Improvement Program, progressive development of operation and maintenance procedures, multi-skilling of operations staff, experienced staff members and conventional water supply system design and treatment processes.
The causes of some key risks e.g. drought, contamination of Jabour Weir catchment, leakage, climate change and urban water reform cannot be directly addressed by the Council water group and therefore alternative mitigation measures need to be developed. In some cases, mitigation is expensive which means that Council may choose to accept a relatively high level of risk. In any case, improved management systems and emergency response procedures (listed below) can assist Council to better respond to these risks.
A structural assessment report on Jabour weir found that its integrity relies heavily on rockbolts to remain stable from overturning or sliding in flood operation condition. A Factor of Safety rating FOS of 0.9 was determined and it should be 1.1.

Page 45 of 48 Richmond Valley Council Water Supply Network 2015-2025
It was concluded that the ultimate strength of the rockbolts increased the FOS to 1.1, preventing failure from flooding to date. Condition testing by Halcrow in 2012 indicates that 6 out of 8 bolts are fully functioning, the limit for acceptable stability and safety.
Council has engaged NSW Public Works to undertake a concept and design for the strengthening of Jabour weir ($57,860 scheduled for the 2014-15) and a capital works program totalling $540,000 in 2015/16 financial year. Jabour Weir is the sole water supply for Casino and weir strengthening using prestressed anchor bars will provide structural surety for at least 100 years.
6. Plan Improvement and Monitoring Asset systems is an outward function which interacts across the organisation and attempts to consolidate operational plans, risk management plans, business continuity planning, emergency response planning with higher level strategic and governance objectives. Overall the function is still developing and seeking regular appropriate input from the various asset delivery areas of Council which remain focused on their primary objectives. This restricts some asset planning outcomes but will rise in importance when quality AMPs align with higher strategic goals and provide a clear line of sight between operational, maintenance and asset rehabilitation initiatives. It is the intention of Council to ensure that the practices documented within the Asset Plans are a prime focus of culture within the workplace, so that the links from service delivery to long term strategic plans remain strong.
6.1 Accounting Standards and Regulations In accounting for Council’s assets, the following statutory requirements shall be adhered to: Ø NSW Local Government Act 1993, Ø NSW Code of Accounting Practice and Financial Reporting (updated annually), Ø Australian Accounting Standards, UIG Consensus Views and other prescribed requirements
and standards, Ø AASB 13 Fair Value Measurement, Ø AASB 116 Property Plant and Equipment, Ø AASB 5 Assets Held for Sale, and Ø AASB 136 Impairment.
6.2 Asset management system Council operates an integrated SQL based Asset Management System. The core programs include MapInfo a GIS asset information system and Asset Master, an Asset hierarchy and financial movements register. The programs are supported by MS Office programs and information provided by Council’s financial management systems. The financial systems are primarily managed by Council’s financial section. It is the responsibility of all persons with expenditure roles to ensure that costing is allocated to the correct account numbers so that financial reporting will be accurate and reliable.
The strength of the Asset Master process is the unique identifiers for each asset, accurate plans for work teams and detailed financial history of individual assets. Council has expanded its asset management and asset data team given the expansive task of data entry and data management. This is a continuing process that will produce more insight and accuracy into asset conditions, predictive strategies and financial observations.

Page 46 of 48 Richmond Valley Council Water Supply Network 2015-2025
Asset registers Council utilises the Asset Master system from Open Office Australia. This system has was deployed in 2012 and is continually being refined to produce quality asset information. Council systems are generally connected through an SQL server but often financial reporting is performed at a higher level. This is accomplished by excel reports exported by the various asset management and financial management systems.
All construction and maintenance costs are recorded in the Technology 1 Financial Management System. Capital costs are generally costed to a series of cost account numbers that can be related to a particular asset construction project. Personnel performing asset management system data functions require a high level of rounded numeracy and literacy skills. Although the functions have a high level of repetitive function primarily due to the scale of asset numbers accuracy is required with each process. Council systems are SQL driven requiring some scripting knowledge and also general abilities with financial data, accounting interpretations and knowledge of Australian Accounting Standards.
Required changes to asset management system arising from this AMP Council manages a wide range of physical assets. These assets provide a range of services to the Richmond Valley Community. In order to better manage its assets, Council has implemented an Integrated Asset Management System (AMS) namely Asset Master by Open Office. Asset Master enables Council to collect and store asset data and to manage its infrastructure maintenance and replacement programs.
Council’s objectives in the implementation and consequent management of Asset Master are as follows: Ø To have a central repository for all asset data, Ø To undertake life cycle management of all Council asset categories, Ø To facilitate an asset management culture, Ø To reduce the overall costs and risks associated with Council assets, and Ø To provide the ability to add advanced asset management functionality as the Council
matures with respect to asset management.
Monitoring and Review Procedures This AMP will be reviewed during annual budget planning processes and amended to recognise any material changes in service levels and/or resources available to provide these services as a result of budget decisions.
The AMP will be updated annually to ensure it represents the current service level, asset values, projected operations, maintenance, capital renewal and replacement, capital upgrade/new and asset disposal expenditures and projected expenditure values incorporated into Council’s LTFP.
The AMP has a life of four years (Council election cycle) and is due for a complete revision and updating within one year of each Council election.

Page 47 of 48 Richmond Valley Council Water Supply Network 2015-2025
Performance Measures The effectiveness of the asset management plan can be measured in the following ways: Ø The degree to which the required projected expenditures identified in this AMP are
incorporated into Council’s LTFP, Ø The degree to which 1-5 year detailed works programs, budgets, business plans and
organisational structures take into account the ‘global’ works program trends provided by the AMP,
Ø The degree to which the existing and projected service levels and service consequences (what we cannot do), risks and residual risks are incorporated into the Council’s Strategic Plan and associated plans,
Ø The Asset Renewal Funding Ratio achieving the target of 1.0.

Page 48 of 48 Richmond Valley Council Water Supply Network 2015-2025
7. References
IPWEA, 2006, ‘International Infrastructure Management Manual’, Institute of Public Works Engineering Australia, Sydney, www.ipwea.org/IIMM
IPWEA, 2008, ‘NAMS.PLUS Asset Management’, Institute of Public Works Engineering Australia, Sydney, www.ipwea.org/namsplus.
IPWEA, 2009, ‘Australian Infrastructure Financial Management Guidelines’, Institute of Public Works Engineering Australia, Sydney, www.ipwea.org/AIFMG.
IPWEA, 2011, ‘International Infrastructure Management Manual’, Institute of Public Works Engineering Australia, Sydney, www.ipwea.org/IIMM
Richmond Valley Council, Community Strategic Plan 2013 – 2025’,
Richmond Valley Council Strategic Business Plan for Water Supply and Sewerage Services,
RVC Strategic Planning FINMOD Analysis and Tariff Review – Water Supply Services
Richmond Valley Council - Annual Plan and Budget