appendix e: financial capacity - transportation ... e: financial capacity analysis i transportation...
TRANSCRIPT
Appendix E: Financial Capacity Analysis I Transportation Outlook 2040 E.1 2015 Plan Update
Federal regulations require Transportation Outlook 2040 to include a financial plan that demonstrates how the adopted long-range metropolitan transportation plan (MTP) can be implemented. The plan lists resources from public and private sources that are reasonably expected to be available to carry out the plan, and recommends additional financing strategies for needed projects and programs.
Transportation Outlook 2040 is financially constrained based on the estimates of available revenues and anticipated costs as described below. As these estimates are refined for future programming activities, adjustments will be made to the plan as needed.
The financial plan takes into account all projects and strategies proposed for funding by federal, state, local and private resources. Revenue and cost estimates that support the plan incorporate growth rates that reflect year-of-expenditure dollars based on reasonable financial principles and information that is cooperatively developed by states, transit operators and MARC.
Transportation Outlook 2040 includes, by reference, those projects and funding sources included in the Transportation Improvement Program (TIP). The TIP provides a more specific accounting for the first four years of the plan. The MTP’s financial plan uses 10-year aggregate cost ranges/bands (23 CFR 450.322(10)(v). The projected cost bands reflect reasonably expected future funding source(s) available to support identified projects.
This analysis projects anticipated revenues available to implement Transportation Outlook 2040 projects through the year 2040, and compares revenues to costs identified in the plan for specific projects. Also, estimates are developed for other cost categories in which specific projects have not been identified in the MTP, such as preservation (techniques that effectively extend the life of a transportation asset) and transportation operations and maintenance (O&M) activities. O&M include system management activities as snow removal, signing, striping, litter control, mowing, completing routine road and bridge repairs, traffic signal operations, system management and more.
APPENDIX E: FINANCIAL CAPACITY
Federal metropolitan planning regulations (23 U.S.C. 134) require:
“… a financial plan that demonstrates how the adopted transportation plan can be implemented, indicates resources from public and private sources that are reasonably expected to be made available to carry out the plan, and recommends any additional financing strategies for needed projects and programs. The financial plan may include, for illustrative purposes, additional projects that would be included in the adopted transportation plan if reasonable additional resources beyond those identified in the financial plan were available. For the purpose of developing the transportation plan, the metropolitan planning organization, transit operator, and State shall cooperatively develop estimates of funds that will be available to support plan implementation.”
Appendix E: Financial Capacity Analysis I Transportation Outlook 2040 E.2 2015 Plan Update
For purposes of the financial capacity analysis, highway and transit funds were accounted for separately, despite the fact that federal regulations (MAP-21) allow some categories of federal highway funds to be used for transit projects and vice versa. Estimates of highway revenues and expenditures were developed separately for the Kansas and Missouri portions of the metropolitan area, since federal and state highway funds generally must stay within a given state. Transit revenues and expenditures were estimated on a regional basis, because the majority of federal transit funds are allocated directly to the region. For this analysis, all revenue and expenditure estimates are reported in fiscal year 2014 dollars adjusted for inflation.
In earlier long-range transportation plans, prior to Transportation Outlook 2040, local, state and federal revenues were fairly stable and predictable. Projected revenues were based on predictable sources and assumptions:
• State transportation plans (Kansas Comprehensive Transportation Program (CTP)1, Transportation Works for Kansas (T-Works)2 and/or state revenues (Missouri Amendment3).
• State tax revenues dedicated to transportation.
• Historical growth and stability that drive local governments’ abilities to generate tax revenues that support transportation.
• A sufficient federal Highway Trust Fund balance.
The plan’s financial estimates were developed in an economic climate that is neither stable nor predictable. The Office of Management and Budget (OMB) and the Congressional Budget Office (CBO) have predicted insolvency of the Highway Trust Fund by the end of 2015. The nation and the region are still recovering from economic downturns that have not been experienced since the Great Depression. In this time of economic uncertainty, the MTP’s estimated revenues are based on a conservative approach of reasonably expected federal, state and local funds available for transportation. Estimates were derived through collaboration and consent by state, transit and federal planning partners. Local revenues estimates are based on the U.S. Census of Governments estimated percentage of general revenues available for transportation.
Revenues for the MTP are estimated at the planning level, not the programmatic level, as with the TIP. Transportation Outlook 2040 financial projections are reviewed and adjusted regularly to reflect future economic trends. Once there is clarity around the new federal transportation bill and/or state revenues, MARC will make adjustments to the plan’s revenue estimates.

Appendix E: Financial Capacity Analysis I Transportation Outlook 2040 E.3 2015 Plan Update
Forecast methodology and assumptionsTransportation revenues rely on taxes and generally reflect circumstances of the regional economy, and therefore they fluctuate from year to year. Because of the unstable, unpredictable economic climate as the nation and the region struggle to recover from a far-reaching economic recession, there will likely be variation in the annual transportation revenues available to the region over the 25-year time horizon for Transportation Outlook 2040. Because this variation is impossible to accurately predict, the MTP uses a conservative approach in anticipating gross-level forecasts needed to demonstrate fiscal constraint.
These forecasts assume steady growth in potential revenues from local sources based on an assumed constant inflation rate. Federal and state funds are derived using 2014 revenue estimates obtained from KDOT, MoDOT and other sources. Federal revenues are forecast to remain flat, while state revenues are expected to grow in years 2021 to 2040. The net present value of total potential revenues is estimated for three time periods: 2015–2020, 2021–2030 and 2031–2040.
Growth rates
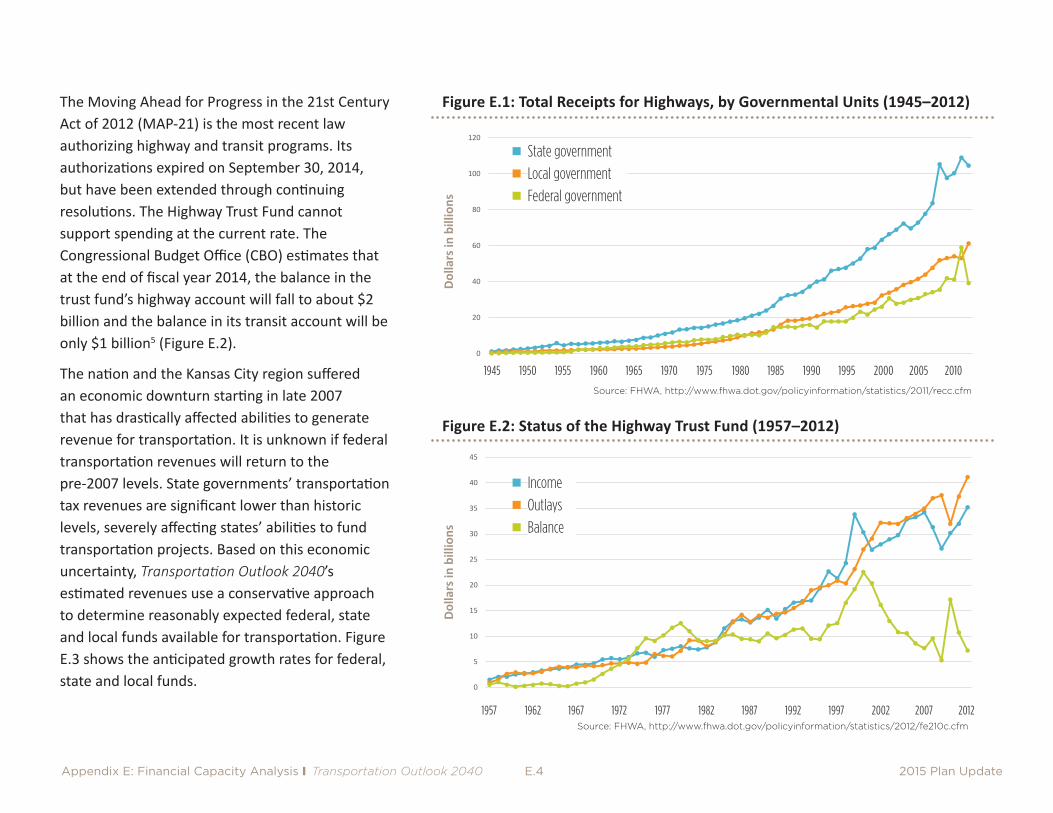
Almost all spending on highway infrastructure and transit projects in the United States is funded publicly. The federal government’s surface transportation programs are financed mostly through the Highway Trust Fund, an accounting mechanism in the federal budget that comprises two separate accounts, one for highways and one for mass transit. The trust fund records specific cash inflows from revenues collected through excise taxes on the sale of motor fuels, trucks and trailers, and truck tires; taxes on the use of certain kinds of vehicles; and interest credited to the fund. The Highway Trust Fund also records cash outflows for spending on designated highway and mass transit programs, mostly in the form of grants to states and local governments. Federal funding from the Highway Trust Fund traditionally has funded the majority of transportation projects identified in the Kansas City region’s MTP. By far, the largest component of the trust fund is the Federal Aid Highway Program, which accounts for about 90 percent of the federal fund’s outlay, and normally for 80 percent of federal-aid-qualified projects funded through the MTP. For several decades, the balances in the highway account were relatively stable or growing, but since 2001 receipts have consistently fallen below expenditures (Figure E.1).4
Appendix E: Financial Capacity Analysis I Transportation Outlook 2040 E.4 2015 Plan Update
The Moving Ahead for Progress in the 21st Century Act of 2012 (MAP-21) is the most recent law authorizing highway and transit programs. Its authorizations expired on September 30, 2014, but have been extended through continuing resolutions. The Highway Trust Fund cannot support spending at the current rate. The Congressional Budget Office (CBO) estimates that at the end of fiscal year 2014, the balance in the trust fund’s highway account will fall to about $2 billion and the balance in its transit account will be only $1 billion5 (Figure E.2).
The nation and the Kansas City region suffered an economic downturn starting in late 2007 that has drastically affected abilities to generate revenue for transportation. It is unknown if federal transportation revenues will return to the pre-2007 levels. State governments’ transportation tax revenues are significant lower than historic levels, severely affecting states’ abilities to fund transportation projects. Based on this economic uncertainty, Transportation Outlook 2040’s estimated revenues use a conservative approach to determine reasonably expected federal, state and local funds available for transportation. Figure E.3 shows the anticipated growth rates for federal, state and local funds.
Figure E.1: Total Receipts for Highways, by Governmental Units (1945–2012)
Figure E.2: Status of the Highway Trust Fund (1957–2012)
Source: FHWA, http://www.fhwa.dot.gov/policyinformation/statistics/2011/recc.cfm
Source: FHWA, http://www.fhwa.dot.gov/policyinformation/statistics/2012/fe210c.cfm
Dolla
rs in
bill
ions
Dolla
rs in
bill
ions
1945 1950 1955 1960 1965 1970 1975 1980 1985 1990 1995 2000 2005 2010
1957 1962 1967 1972 1977 1982 1987 1992 1997 2002 2007 2012
0
20
40
60
80
100
120
State government
Local government
Federal government
0
5
10
15
20
25
30
35
40
45
Income
Outlays
Balance

Appendix E: Financial Capacity Analysis I Transportation Outlook 2040 E.5 2015 Plan Update
Growth assumptions
Federal
The CBO states that although vehicles will travel more miles in the future (therefore consuming more taxable fuel), rising fuel efficiency standards and congressional refusal to increase the fuel tax or tie it to the rate of inflation means that the Federal Highway Trust Fund will receive less money. CBO’s insolvency projection assumed that Congress will not increase transportation spending beyond inflation-adjusted 2012 levels. At the time of this plan update, MAP-21, the current federal transportation bill, has expired and Congress has not authorized a new transportation bill. Despite uncertainty about a new federal transportation bill and balances in the Highway Trust Fund, the region assumes that federal transportation funding will continue throughout the life of the MTP (2015–2040) at current MAP-21 final year (2014) allocations.
Figure E.3: Projected Transportation Revenue Annual Growth Rates
Source of Funds
Years Federal State Local6
Kansas7 Missouri8
2015–2020 0% 0% 0% 2.26%
2021–2030 0% 1.5% 1.5% 2.26%
2031–2040 0% 1.5% 1.5% 2.26%
State
Kansas — The state has successfully funded comprehensive transportation programs for the last 20 years. Kansas’ current transportation program, T-Works, ends in 2020. Based on the state’s success in funding transportation, it is expected that Kansas will continue with comprehensive transportation programs through 2040. The regional plan assumes a modest increase of 1.5 percent in the state’s transportation program from 2021–2040.
Missouri — Although Missouri voters did not pass Amendment 79 in the summer of 2014, it is reasonable to assume that Missouri will successfully implement some type of state funded transportation program in the future. The regional plan presumes this will occur in 2021 and continue through the life of the plan. As with Kansas, the MTP assumes a modest 1.5 percent increase in funding in Missouri from 2021–2040.
Local
When estimating local growth, it is important to consider the effects of regional growth on the value of cash flows. For local transportation revenues, MARC relies on its REMI (Regional Economic Models, Inc.) model to forecast growth into the future. REMI estimates the economy in the Kansas City metropolitan statistical area (as measured by gross domestic product10) will grow at an average annual rate of 2.26 percent. It is assumed that local government transportation expenditure growth will occur at this same rate. This rate is more conservative than the 3 percent growth rate used in the 2010 plan.11

Appendix E: Financial Capacity Analysis I Transportation Outlook 2040 E.6 2015 Plan Update
Inflation and year of expenditure
In the previous federal transportation legislation, SAFETEA-LU, and continuing in MAP-21, regulations require the MTP to consider inflation. Specifically, the regulation states:
…revenue and cost estimates that support the metropolitan transportation plan must use an inflation rate(s) to reflect “year of expenditure dollars,” based on reasonable financial principles and information, developed cooperatively by the MPO, State(s), and public transportation operator(s).§450.3220, 23 CFR Ch. 1 (4-1-07 Edition)
MARC assumed project year of expenditure and O&M cost increases based on a 3 percent construction rate. The same inflation rate is assumed for highways and public transportation. According to the U.S. Census, construction spending for roadway projects is averaging 2 percent inflation.
Limitations
This analysis is subject to a number of inherent limitations:
• The projections are for a period of 25 years, during which time significant changes are possible in travel behavior and transportation finance.
• Financial estimates are based on future funding estimates, not project-specific estimates, as with the TIP’s programmatic approach.
• The analysis lumps federal, state and local funding together and compares the total against the aggregate expenditures identified in the plan. This ignores the fact that certain funding sources are
available only for specific purposes. For example, state highway funds generally cannot be used for non-state highway projects.
• Revenues from local sources are extrapolated from the U.S. Census of Governments’ estimated percentage of general revenues available for transportation. However, this may not account accurately for private-sector funding or for the level of general revenue funds that could support transportation improvements.
• Projections of federal funding involve a great deal of uncertainty due to shifts in the federal transportation budget and deficit-reduction policies and because these funds are largely administered on a statewide basis.
• Ongoing maintenance costs are estimated as an extension of the states’ current expenditures. Maintenance needs may be more accurately determined when region-wide pavement and bridge management/condition rating systems are in place.
• State and local governments describe transportation expenditures in different ways, particularly in maintenance categories. This may result in errors in the reporting of actual or projected expenditures.
• Cost estimates for many of the highway capacity projects may involve significant errors due to the long-range nature of the plan, the absence of detailed cost estimates based on actual design of the improvements, and the simplified methodology used to develop many of the estimates.
• Many of the roadway projects may contain a level of preservation that is not adequately projected in the plan to offset preservation cost.
• Preservation costs are based on level of condition goals that may not truly represent preservation goals of the region.
Appendix E: Financial Capacity Analysis I Transportation Outlook 2040 E.7 2015 Plan Update
Revenue forecastsMTPs must be based on reasonable estimates of available revenues in order to demonstrate financial feasibility and fiscal constraint. Transportation Outlook 2040 is based on estimates of expected available regional revenues for 25 years — from 2015 to 2040. The TIP provides more specific cost estimates that reflect the first four years of the plan’s development. As MTP projects come closer to implementation, project cost assumptions are adjusted and more specific costs are reflected in the TIP. The MTP is adjusted to reflect cost changes. This section outlines current estimates for potential highway and transit revenues.
Highway revenues
Highway revenues for Kansas and Missouri are accounted for separately, since there are restrictions prohibiting state and local entities from transferring funds across state lines. As a reasonable starting point for MARC’s long-range financial forecasts, the plan uses state and federal financial revenue forecasts for the base years of 2011–202012 for Kansas and 2014–201813 for Missouri. Additionally, MARC used an average of the U.S. Census of Governments14 from 2004 to 2011 to estimate what percentages of local government general revenues are directed toward transportation. The local revenue growth rate was derived from GDP forecasts from the region’s economic model (REMI), with the base year as 2012 and extrapolated to the year 2040.
The U.S. Census of Governments estimates that an average of 9 percent of local general revenues is allocated to transportation in
Kansas and 8.11 percent in Missouri. These percentages were used to establish the base year for local revenues. The Annual Census of Governments provides periodic and comprehensive statistics about governments and governmental financial activities. Revenue data include taxes (e.g., property, sales, tobacco, motor vehicle, licensing and permit), charges, interest and other earnings. Expenditure data includes totals by function (e.g., education, highways15, airports, water and sewers, health, hospitals, corrections, fire and police protection), and by accounting category (e.g., current operations and capital outlays16). Transportation expenditures as a percentage of all revenues provide a reasonable expectation of what local governments spend for transportation. These percentages do not take into account capital outlay and local governments’ ability to initiate dedicated transportation taxes, or their ability to direct additional general revenue funds to projects of local or regional importance.
MAP-21 expired in 2014 and has been extended through continuing resolutions, but has not yet been formally reauthorized. Kansas’s transportation program (T-Works) will expire in 2020, and a new Kansas program is anticipated in 2021. Missouri’s Amendment 3 projects ended in the MARC region in 2009. MoDOT is currently repaying bond obligations from transportation revenues. In August 2014, Missouri voters rejected a ballot initiative that would have implemented a statewide sales tax for transportation and a new statewide funding source has not been identified. This analysis assumes that new federal and state legislation will replace federal and state program funds.

Appendix E: Financial Capacity Analysis I Transportation Outlook 2040 E.8 2015 Plan Update
Historically MARC established high- and low-end expected revenue assumptions to account for anticipated growth. Due to the economic uncertainties facing the region, MARC elected — using the methods and assumptions described above — to establish a single potential revenue estimate for each source as shown in Figures E.5a–c.
New funding reality
Historically, the region has had enough federal, state and local resources to adequately fund preservation, O&M and future prioritized regional projects. A number of issues — federal funding reductions, revenue uncertainties, the failure of future statewide funding initiatives, and the requirement that state highway funds not be used on non-state highway projects or vice versa — place additional strains on regional transportation resources.
To better reflect expected regional revenues, the region’s historic funding principle assumes that state highway funds generally are not used on non-state projects or vice versa. Current institutional practices demonstrate that if the region continues to fund projects under this principle, or if new federal and/or state funding initiatives are not identified, there may not be an ability to fund anything more than preservation and O&M. However, projected revenues do not accurately consider all local and state funding from unidentified sources such as dedicated transportation taxes, private funding, or the priority a jurisdiction may place on a particular project. Local jurisdictions have options to fund projects on the state system or increase funding levels from general revenue to support priority transportation improvements.
The new funding reality shows the region may need to identify and promote new or additional funding streams to promote regional projects. It may become necessary for local jurisdictions to spend more local funds on the state highway system to help with regional projects.
Figure E.4: Building blocks of long-range highway revenue estimates
Topics listed in no particular order.
U.S. Census of Governments data
Reasonable assumptions
State Transportation Improvement Programs
Guidance and input from committees and
planning partners
Federal, state and local revenue
growth rates
Current and past federal transportation
spending
Historical allocations to Kansas City region
Federal and state legislative priorities

Appendix E: Financial Capacity Analysis I Transportation Outlook 2040 E.9 2015 Plan Update
Figure E.5a: Estimated highway revenues, Kansas side of region
Kansas highway revenues, 2015–2040
Kansas
Revenue sourceYears
Total2015–2020 2021–2030 2031–2040
Federal $364,000,000 $606,600,000 $606,600,000 $1,577,100,000
State $378,800,000 $685,900,000 $796,000,000 $1,860,600,000
Local $1,608,900,000 $3,210,700,000 $4,014,700,000 $8,834,300,000
Sub-allocated (MARC) $105,300,000 $174,000,000 $174,000,000 $453,300,000
Total $2,456,900,000 $4,677,100,000 $5,591,300,000 $12,725,300,000
Local$ 8,834,300,000 69%
MARC (sub-allocated)$ 453,300,000 4%
Federal $ 1,277,100,000 12%
State $ 1,860,600,000 15%

Appendix E: Financial Capacity Analysis I Transportation Outlook 2040 E.10 2015 Plan Update
Figure E.5b: Estimated highway revenues, Missouri side of region
Missouri highway revenues, 2015–2040
Local$ 11,393,100,000 77%
MARC (suballocated)$ 534,200,000 4%
Federal $ 1,011,200,000 7%
State $ 2,355,100,000 13%
Missouri
Revenue sourceYears
Total2015–2020 2021–2030 2031–2040
Federal $234,400,000 $388,400,000 $388,400,000 $1,011,200,000
State $455,800,000 $865,000,000 $1,034,300,000 $2,355,100,000
Local $2,074,900,000 $4,140,600,000 $5,177,600,000 $11,393,100,000
Sub-allocated (MARC) $122,200,000 $206,000,000 $206,000,000 $534,200,000
Total $2,887,300,000 $5,600,000,000 $6,806,300,000 $15,293,600,000
Appendix E: Financial Capacity Analysis I Transportation Outlook 2040 E.11 2015 Plan Update
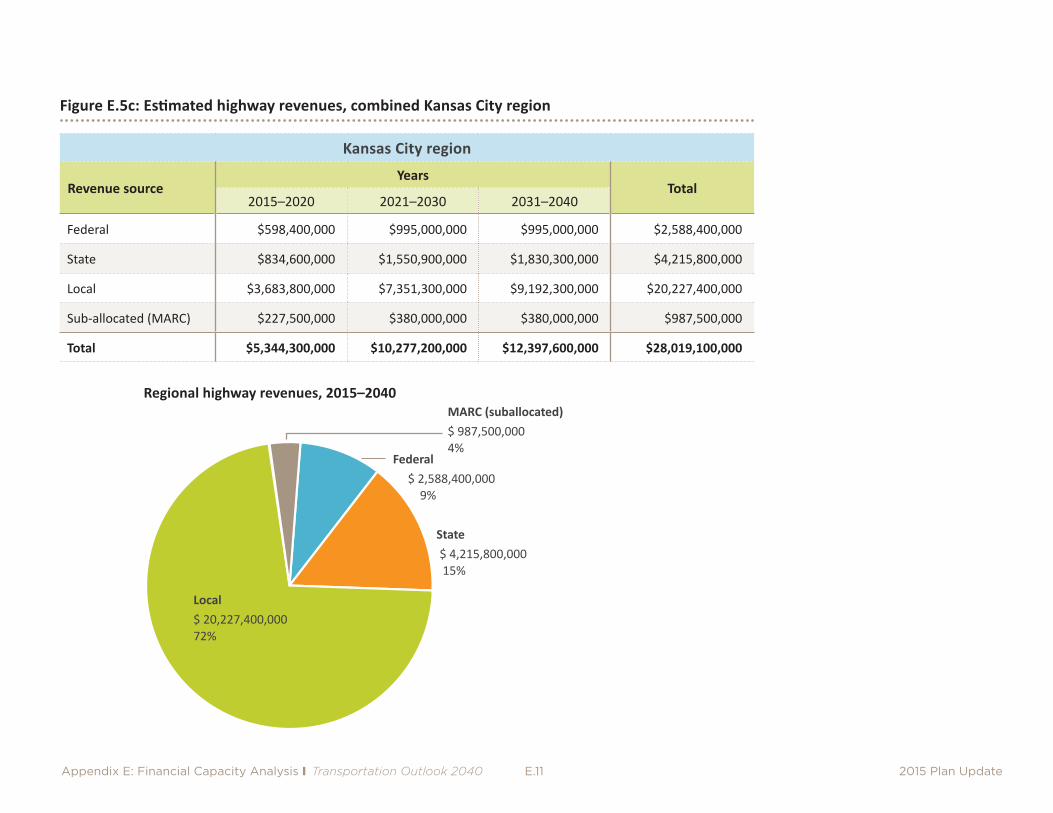
Figure E.5c: Estimated highway revenues, combined Kansas City region
Regional highway revenues, 2015–2040
Local$ 20,227,400,000 72%
MARC (suballocated)$ 987,500,000 4%
Federal $ 2,588,400,000 9%
State $ 4,215,800,000 15%
Kansas City region
Revenue sourceYears
Total2015–2020 2021–2030 2031–2040
Federal $598,400,000 $995,000,000 $995,000,000 $2,588,400,000
State $834,600,000 $1,550,900,000 $1,830,300,000 $4,215,800,000
Local $3,683,800,000 $7,351,300,000 $9,192,300,000 $20,227,400,000
Sub-allocated (MARC) $227,500,000 $380,000,000 $380,000,000 $987,500,000
Total $5,344,300,000 $10,277,200,000 $12,397,600,000 $28,019,100,000

Appendix E: Financial Capacity Analysis I Transportation Outlook 2040 E.12 2015 Plan Update
Transit
The public transportation analysis is limited to the three primary fixed-route transit operators — the Kansas City Area Transportation Authority, Johnson County Transit and Unified Government Transit — and their paratransit services, since they are recipients of virtually all federal funding for transit in Greater Kansas City.
Kansas City, Missouri, anticipates beginning streetcar operations in 2016. A financial analysis associated with the streetcar is performed separately because procurement, maintenance and operations are based on local Kansas City taxes. Currently, there are no initiatives that substantiate regional or federal financial support of future streetcar initiatives.
Public transportation revenue information was collected from Section 533517 reports by the primary fixed-route transit operators submitted to the Federal Transit Administration for fiscal year 2013 and the U.S. Census of Government 2013 local government revenues for transit. Figure E.6a shows the base-year transit revenues. The primary sources of revenue for public transportation include federal, state and local subsidies, fare box collections and other sources.18 These revenues were projected forward, adjusting for inflation where appropriate, to provide overall estimates for public transportation revenues for the 25-year MTP. Figure 6b shows projected future transit revenues.

Appendix E: Financial Capacity Analysis I Transportation Outlook 2040 E.13 2015 Plan Update
Figure E.6a: Starting year transit revenue estimates, 2015
State Category Source of base year estimate Base amount
Kansas Fares NTD* Johnson County Transit, Unified Government Transit. $ 1,769,826
Federal NTD Johnson County Transit, Unified Government Transit. $ 13,017,614
State NTD Johnson County Transit, Unified Government Transit. $ 1,743,177
Local 2013 U.S. Census of Governments average percentage for Kansas City MSA (Kansas) general revenues dedicated to transit.
$ 13,161,086
Other NTD Johnson County Transit, Unified Government Transit. $ 1,979,547
Missouri Fares NTD KCATA, cities of Liberty and Independence. $ 12,500,242
Federal NTD KCATA, cities of Liberty and Independence. $ 24,062,339
State NTD KCATA, cities of Liberty and Independence. $ 237,353
Local 2013 U.S. Census of Governments average percentage for Kansas City MSA (Missouri) general revenues dedicated to transit.
$ 79,759,727
Other NTD KCATA, cities of Liberty and Independence. $ 14,368,589

Appendix E: Financial Capacity Analysis I Transportation Outlook 2040 E.14 2015 Plan Update
Figure E.6b: Projected future transit revenues, FY 2012 dollars
Regional transit revenues, 2015–2040
Local$ 3,239,605,779
Other$ 452,711,122
Federal$ 964,078,778
Farebox$ 421,332,761
State$ 420,850,337
Regional
Revenue sourceYears
Total2015–2020 2021–2030 2031–2040
Farebox $ 87,789,671 $ 158,481,223 $ 175,061,866 $ 421,332,761
Federal $ 222,479,718 $ 370,799,530 $ 370,799,530 $ 964,078,778
State $ 11,883,180 $ 21,515,017 $ 24,969,056 $ 58,367,253
Local $ 589,990,470 $ 1,177,384,054 $ 1,472,231,255 $ 3,239,605,779
Other $ 99,323,131 $ 172,288,565 $ 181,099,425 $ 452,711,122
Total $ 1,011,466,170 $ 1,900,468,390 $ 2,224,161,132 $ 5,136,095,692

Appendix E: Financial Capacity Analysis I Transportation Outlook 2040 E.15 2015 Plan Update
Financial constraint
The transportation system that exists today was made possible through a tremendous investment of financial resources over time, and the Kansas City region has consistently placed a high priority on preserving and maintaining this investment. The importance of system preservation was continually reinforced by public and stakeholder input received during the update to Transportation Outlook 2040. In the adopted Policy Framework, the system condition goal seeks to “Ensure the transportation system is maintained in good condition.”
To demonstrate financial constraint in the plan, the cost to operate, maintain and preserve (including preservation projects designated as regionally significant) the transportation system in the MARC region is deducted from available transportation revenues first, and the remaining balance is available for other transportation investments. Figure E.7 depicts the basic accounting used to demonstrate financial constraint. The process is unique to highway and transit funding, but the equation is consistent. For a given funding source, the cost of projects in the MTP cannot exceed the financial resources available after accounting for operations and maintenance (O&M).
Figure E.7: Financial constraint
Highway
The Federal Highway Administration (FHWA) has placed great emphasis on regions demonstrating that there are adequate revenues available to fund operations and maintenance of the transportation system. Transportation Outlook 2040 defines the region’s highway transportation system as roadways eligible for federal funding (the Federal Aid System). The non-standard ways that local jurisdictions and state departments of transportation report current system condition information and O&M costs creates difficulties in establishing an appropriate regional O&M cost. To overcome the difficulty, the plan takes a conservative approach to O&M estimates based on inputs from the state DOTs. Kansas and Missouri have each taken different approaches to account for O&M and cost factors.
To establish regional O&M costs, MARC reviewed information from KDOT’s Statewide Improvement Program (STIP) and T-Works and MoDOT’s revenue assumptions for Taking Care of the System (TCOS).19
KDOT’s STIP assumes a statewide O&M cost of $6,200 per lane mile and T-Works assumes $2,800 per lane mile20 for the Kansas City urban area. MoDOT estimates O&M costs at $6,800 per lane mile for both urban and non-urban roadways (Figure E.8). The base year O&M costs were factored using a 3 percent inflation rate over the life of the plan.
Local governments and state DOTs are responsible for O&M activities on the Federal Aid System. MARC assumes local jurisdictions would need to expend O&M costs at the same per-lane-mile cost as the state DOTs to keep pace with current system O&M requirements.
KDOT only maintains 30 percent of the Federal Aid System in Kansas. The remaining system is the responsibility of local jurisdictions. KDOT’s statewide O&M cost are generally more robust in non-urban

Appendix E: Financial Capacity Analysis I Transportation Outlook 2040 E.16 2015 Plan Update
areas than is required in an urban area by virtue of frequency, nature and level of detail for required O&M work. MARC assumes that local jurisdictions may not expend O&M activities at the same frequency or level of detail as KDOT. Therefore, local jurisdictions will need to expend, at a minimum, KDOT’s statewide cost to keep pace with O&M requirements.
Figure E.9 shows the overall Kansas and Missouri O&M Federal Aid System cost for the life of the MTP. The region is committed to O&M of these miles, including any additional new mileage associated with projects of the MTP (Figure E.10). Costs were agreed upon in consultation with local and state planning partners. The plan’s O&M assumption was reviewed by the Transportation Outlook 2040 Subcommittee, which verified the reasonableness of the assumption.
Assumes 3 percent inflation from 2015–2040
Figure E.9: O&M Cost, 2015–2040
YearsKansas Missouri
TotalState Local State Local
2015–2020 $ 35,000,000 $ 187,000,000 $ 78,000,000 $ 278,000,000 $ 578,000,000
2021–2030 $ 75,000,000 $ 396,000,000 $ 166,000,000 $ 588,000,000 $ 1,225,000,000
2031–2040 $ 101,000,000 $ 532,000,000 $ 223,000,000 $ 790,000,000 $ 1,646,000,000
Total $ 211,000,000 $ 1,115,000,000 $ 467,000,000 $ 1,656,000,000 $ 3,449,000,000
Figure E.8: Federal Aid System and O&M cost per mile
O&M KDOT Kansas Local MoDOT/Local
Miles 1,958 4,664 8,094
P/LM Cost $ 2,800 $ 6,200 $ 6,800
Per Year $ 5,482,400 $ 28,916,800 $ 55,039,200
Figure E.10: Total Federal Aid System (miles)
State Federal Aid System
Kansas 6,632
Missouri 8,094
Total 14,726

Appendix E: Financial Capacity Analysis I Transportation Outlook 2040 E.17 2015 Plan Update
Transportation Outlook 2040 estimates that approximately $28 billion in revenues will be available for what are traditionally considered street and highway projects over the life of the plan. Revenue estimates are $12.7 billion for Kansas portions of the region and $14.8 billion in Missouri.
Figures E.11 (a-d) demonstrate financial constraint of the highway projects in the plan. Estimates of highway revenues and expenditures were developed separately for the Kansas and Missouri sides of the region, since federal and state highway funds generally must stay within a given state. Furthermore, financial constraint is demonstrated separately for state and local system projects. (For the purposes of this section, the revenues available for highway projects correspond to the highway revenues presented in Figures E.5a to E.5c.)
The new funding reality shows the region may need to identify and promote new or additional funding streams to promote regional projects. It may become necessary for local jurisdictions to spend more local funds on the state highway system within their jurisdictions to implement needed projects.
For highway revenues, the estimates in Figure E.5 were based on an annual amount that grows over time in a steady stream.
Figure E.11a: Financial constraint of Kansas state system projects
2015–2020 2021–2030 2031–2040 Total
Revenue $589,200,000 $1,435,500,000 $1,413,000,000 $3,437,700,000
2015-2018 TIP Non-preservation ($166,400,000) $0 $0 ($166,400,000)
O&M ($35,000,000) ($75,000,000) ($101,000,000) ($211,000,000)
Preservation ($356,000,000) ($753,000,000) ($1,012,000,000) ($2,121,000,000)
Available for projects $31,800,000 $607,500,000 $300,000,000 $939,300,000
Non-preservation MTP projects ($31,800,000) ($607,500,000) ($300,000,000) ($939,300,000)
Difference $0 $0 $0 $0
The MTP is constrained when the balances (difference) is positive. For help with definitions for tables E.11a–E.11d, see the next page.
Figure E.11b (Amendment 3): Financial constraint of Missouri state system projects
2015–2020 2021–2030 2031–2040 Total
Revenue $731,518,000 $1,518,250,000 $1,518,250,000 $3,768,018,000
2015-2018 TIP Non-preservation $0 $0 $0 $0
O&M ($78,000,000) ($166,000,000) ($223,000,000) ($467,000,000)
Preservation ($609,700,000) ($1,085,100,000) ($1,192,300,000) ($2,887,100,000)
Available for projects $43,818,000 $267,150,000 $102,950,000 $413,918,000
Non-preservation MTP projects ($39,000,000) $0 $0 ($39,000,000)
Difference $4,818,000 $267,150,000 $102,950,000 $374,918,000
Appendix E: Financial Capacity Analysis I Transportation Outlook 2040 E.18 2015 Plan Update
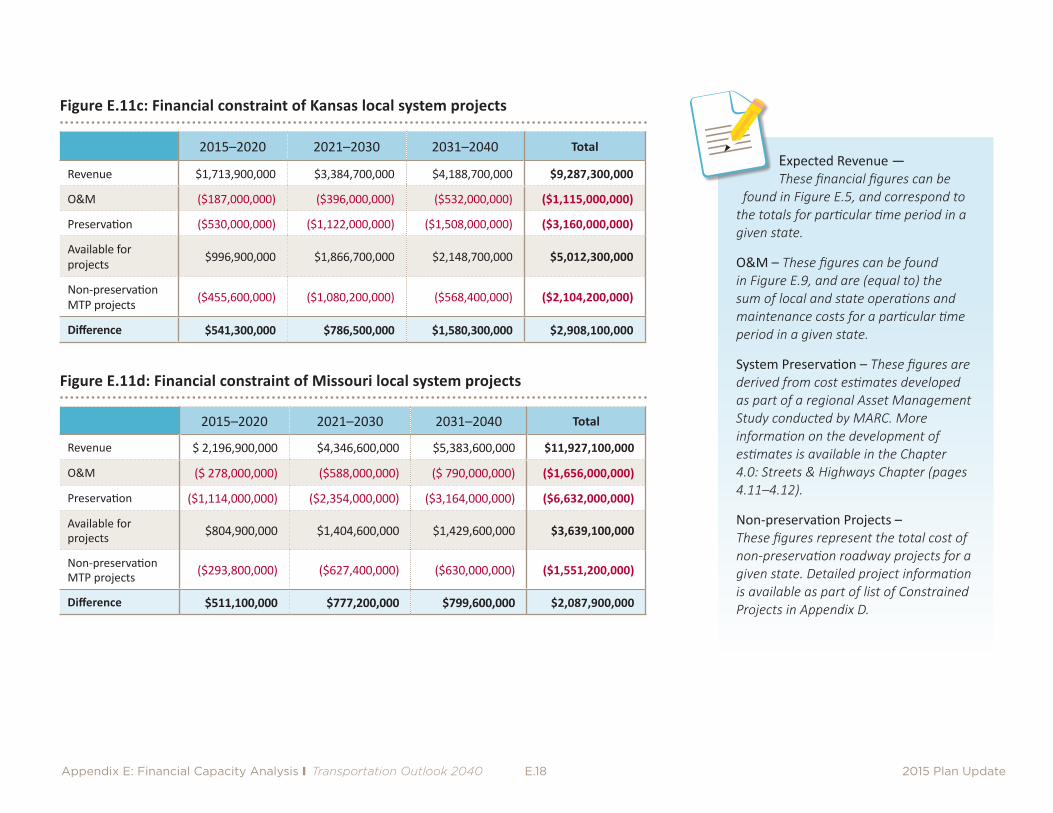
Figure E.11c: Financial constraint of Kansas local system projects
Figure E.11d: Financial constraint of Missouri local system projects
2015–2020 2021–2030 2031–2040 Total
Revenue $1,713,900,000 $3,384,700,000 $4,188,700,000 $9,287,300,000
O&M ($187,000,000) ($396,000,000) ($532,000,000) ($1,115,000,000)
Preservation ($530,000,000) ($1,122,000,000) ($1,508,000,000) ($3,160,000,000)
Available for projects $996,900,000 $1,866,700,000 $2,148,700,000 $5,012,300,000
Non-preservation MTP projects ($455,600,000) ($1,080,200,000) ($568,400,000) ($2,104,200,000)
Difference $541,300,000 $786,500,000 $1,580,300,000 $2,908,100,000
2015–2020 2021–2030 2031–2040 Total
Revenue $ 2,196,900,000 $4,346,600,000 $5,383,600,000 $11,927,100,000
O&M ($ 278,000,000) ($588,000,000) ($ 790,000,000) ($1,656,000,000)
Preservation ($1,114,000,000) ($2,354,000,000) ($3,164,000,000) ($6,632,000,000)
Available for projects $804,900,000 $1,404,600,000 $1,429,600,000 $3,639,100,000
Non-preservation MTP projects ($293,800,000) ($627,400,000) ($630,000,000) ($1,551,200,000)
Difference $511,100,000 $777,200,000 $799,600,000 $2,087,900,000
Expected Revenue — These financial figures can be
found in Figure E.5, and correspond to the totals for particular time period in a given state.
O&M – These figures can be found in Figure E.9, and are (equal to) the sum of local and state operations and maintenance costs for a particular time period in a given state.
System Preservation – These figures are derived from cost estimates developed as part of a regional Asset Management Study conducted by MARC. More information on the development of estimates is available in the Chapter 4.0: Streets & Highways Chapter (pages 4.11–4.12).
Non-preservation Projects – These figures represent the total cost of non-preservation roadway projects for a given state. Detailed project information is available as part of list of Constrained Projects in Appendix D.

Appendix E: Financial Capacity Analysis I Transportation Outlook 2040 E.19 2015 Plan Update
However, KDOT has no policy for the MARC area to receive a set annual allocation. Instead, they allocate funds on a project-by-project basis within multi-year state transportation programs. There is no basis to assume this will change in the future. In Figure E.11a, Kansas state transportation revenues were manually adjusted in each period to align with their constrained projects.
Accounting for O&M and preservation, the region will have approximately $7.1 billion or 26 percent of total funds available, to complete all proposed projects.
Transit
Understanding how the region’s current public transportation investment priorities compare to the projected amount of funding available is a first step in crafting a focused financial strategy. To paint a picture of the region’s financial situation as it relates to transit, financial projections were developed that include both transit revenues (projected funding for transit) and operation
Figure E.12: Transit O&M costs, 2015–2040
Year O&M*
2015–2020 ($663,630,000)
2021–2030 ($1,404,400,000)
2031–2040 ($1,887,390,000)
Total ($3,955,420,000)
*Includes future O&M costs.
Figure E.13: Financial constraint of transit projects, 2015–2040
2015–2020 2021–2030 2031–2040 Total
Anticipated revenue $1,011,460,000 $1,900,470,000 $2,224,160,000 $5,136,090,000
O&M ($663,630,000) ($1,404,400,000) ($1,887,390,000) ($3,955,420,000)
MTP projects ($258,300,000) ($314,800,000) ($307,900,000) ($881,000,000)
Balance $89,530,000 $181,270,000 $28,870,000 $299,670,000
*Includes existing TIP and 2040 Projects O&M
and maintenance expenses (the expected cost to maintain public transportation services already in place). Public transportation revenues show that the region could anticipate approximately $5 billion in transit revenues over the next three decades.
As with highways, the region must account for transit O&M costs21 (Figure E-12). O&M costs are projected to total approximately $3.9 billion over three decades, leaving roughly $1.2 billion over the life of the MTP for new transit projects to expand the regional transit system. O&M22 costs include the transit agencies’ current and future responsibilities and commitments.
Anticipated public transportation expenditures are summarized in Figure E.13, along with a comparison with projected revenues.
Financial challenges in meeting the region’s transit needs are clear. Financial resources are currently insufficient to provide for public transit and mobility services that would fully meet the needs of the region’s residents.

Appendix E: Financial Capacity Analysis I Transportation Outlook 2040 E.20 2015 Plan Update
As a regional priority, public transportation and mobility services must be sustained and supported for the long-term to meet the region’s transportation needs and create the lasting impact envisioned in the policy goals of Transportation Outlook 2040.
Mobility services currently rely on a variety of funding sources, including federal, state, local and private funds. While this plan does not attempt to estimate future revenue for mobility services, it would be beneficial to include these streams of funding into regional planning and programming carried out by the Regional Transit Coordinating Council.
Streetcar
Streetcar service is slated to begin in early 2016. The streetcar is funded by tax revenues earmarked specifically by the city of Kansas City, Missouri. The MTP does not account for these revenues as available for regional public transportation. The line will only serve Kansas City and no additional lines and/or alternative funding sources have been identified at the time of the plan.
Figure E-14: Financial constraint of streetcar, 2015–2040
Revenue source
YearsTotal
2015–2020 2021–2030 2031–2040
Kansas City, MO $56,100,000 $109,900,000 $137,400,000 $303,400,000
O&M ($21,500,000) ($55,700,000) ($74,900,000) ($152,200,000)
Debt service and other
($28,400,000) ($42,500,000) ($20,900,000) ($91,700,000)
Total $6,200,000 $11,700,000 $41,600,000 $59,500,000

Appendix E: Financial Capacity Analysis I Transportation Outlook 2040 E.21 2015 Plan Update
Other modes
The financial analysis does not explicitly address other transportation modes such as bicycle, pedestrian and goods movement. Although Transportation Outlook 2040 currently identifies specific projects in these categories, there are no dedicated funding sources for project development. Projects compete for the same funding sources identified in this analysis, particularly federal highway funds. Bikeway and pedestrian improvements may also be incorporated in other highway or transit projects without being specifically identified in the plan.
Summary and conclusionsIn the coming years, the region may need to use more local resources to complete regional projects than in the past. States will need to implement new funding strategies that support regional, state and national priorities. The region will need to make significant decisions about the best way to balance priorities, needs, wants and expectations based on limited funding resources.
One of the primary purposes of the MTP is to provide policy guidance on priorities for regional transportation resources. Decisions about allocating resources to different uses within the plan are significant and should impact actual funding decisions made for the regional Transportation Improvement Program (TIP) as well as other state and local programs.
The financial plan presented in this appendix provides reasonable estimates of future transportation revenues needed to implement the financially constrained projects in Transportation Outlook 2040.
In May 2014, MARC launched an online engagement panel called Community Pulse, which consists of approximately 1,000 members who represent the geographic distribution of the region. The panel has participated in various research activities, including polls, surveys and online discussions related to regional issues, including transportation. One particular survey addressed the types of funding residents would be willing to support to increase transportation revenues. Results indicated that panelists are more likely to support funding sources that are perceived to be directly related to the use of vehicle transportation. These sources include fuel and carbon taxes, license and registration fees, sales taxes on fuel, and tolls, with close to half of the participants (47 percent) in favor of higher gas taxes.

Appendix E: Financial Capacity Analysis I Transportation Outlook 2040 E.22 2015 Plan Update
Notes:1 KDOT’s CTP ended in 2009.
2 T-Works, adopted in May 2010, ends in 2020.
3 Revenues from Missouri’s Amendment 3 projects in the MARC region ended in 2008.
4 Federal Highway Administration, “Highway Statistics 2012.”
5 Congressional Budget Office, testimony to the U.S. Senate, May 2014,
6 Kansas City region’s economic model projected annual growth rate.
7 Assumes increase in next Kansas transportation program in 2021.
8 Assumes Missouri identifies new source of transportation revenues in 2021.
9 Amendment 7 was a 2014 ballot measure to temporarily raise Missouri’s sales tax by a three-quarters of a cent for transportation.
10 Gross Domestic Product is the monetary value of all the finished goods and services produced.
11 In 2010, Transportation Outlook 2040 used an approved growth rate of 3 percent (prior to recession).
12 KDOT 2011–2020 T-Works.
13 MoDOT 2014–2018 State Transportation Improvement Program (STIP) financial estimates.
14 The U.S. Census of Governments provides comprehensive statistics about governmental financial activities of state and local governments in the U.S., including counties, cities, townships, special districts and school districts. Data has been obtained from government organizations every five years since 1957. Most recent data and information is from 2012.
15 Highways — Construction, maintenance, and operation of highways, streets, and related structures, including toll highways, bridges, tunnels, ferries, street lighting and snow and ice removal. However, highway policing and traffic control are classed under police protection.
16 Capital outlay — Direct expenditure for contract or force account construction of buildings, grounds, and other improvements, and purchase of equipment, land and existing structures. Includes amounts for additions, replacements, and major alterations to fixed works and structures. However, expenditure for repairs to such works and structures are classified as current operation expenditures.
17 National Transit Database (NTD).
18 “Other” includes revenues for items such as billboards at bus stops and bus advertising.
19 MoDOT’s January 2014 Funding Distributions.
20 KDOT’s 2015–2018 STIP and T-Works Local Consultation, May 2010. KDOT is responsible for less than 9 percent of the Kansas NHS System in the Kansas City urban area.
The percent of mileage and urban system condition allows lower urban O&M cost.
21 Base yearly average established from the 2013 National Transit Database.
22 Transit O&M: The expenses associated with the operation of the transit agency and goods and services purchased.