appendix d: ac34 spectator sites on nps … · ac34 spectator sites on nps properties visitation...
TRANSCRIPT

The 34th America’s Cup / Environmental Assessment D-1
APPENDIX D:
AC34 SPECTATOR SITES ON NPS PROPERTIES
VISITATION ESTIMATES AND LEVEL OF SERVICE ASSESSMENT

America’s Cup 34 - Spectator Sites on NPS Properties
Visitation Estimates and Level of Service Assessment
Prepared by:
ORCA Consulting LLC
June 5, 2012

AC34 Spectator Sites 6/5/2012
Page 2
Contents Discussion ................................................................................................................................................................ 3
Methodology ........................................................................................................................................................... 3
Executive Summary ................................................................................................................................................. 5
Comparable Analysis Approaches for Level of Service Analysis ............................................................................. 6
FHA shared-use Level of Service Calculator ........................................................................................................ 6
Disney Pedestrian Planning Standard ................................................................................................................. 7
Pedestrian/Bicycle combined service level ......................................................................................................... 7
Level of Service on Walkways ............................................................................................................................. 8
Level of Service for “Defined Viewscapes” ......................................................................................................... 9
Density planning standards for large open areas ............................................................................................. 12
Level of service standards for other types of areas .......................................................................................... 12
Application of PAOT capacity ranges to SAFR & GGNRA areas ......................................................................... 12
AC34 Spectator Projections................................................................................................................................... 15
AC34 Spectator Estimates ................................................................................................................................. 15
Daily Visitation Profile ....................................................................................................................................... 16
Displacement and conversion of regular visitation to NPS sites........................................................................... 18
Projected AC34 impacts on Visitation at NPS sites ............................................................................................... 20
San Francisco Maritime National Historical Park (SAFR) .................................................................................. 21
Fort Mason ........................................................................................................................................................ 28
Crissy Field East ................................................................................................................................................. 34
Crissy Field West ............................................................................................................................................... 41
Crissy West Picnic Area ..................................................................................................................................... 46
Fort Point........................................................................................................................................................... 51
Crissy/Mason/McDowell Intersection .............................................................................................................. 54
Long Ave./Lincoln Blvd. Intersection................................................................................................................. 55
Golden Gate Bridge Overlook ........................................................................................................................... 57
Marin Headlands/Battery Spencer ................................................................................................................... 60
Fort Baker .......................................................................................................................................................... 64
Development of Monitoring Plan, Management Action Trigger Points and Measures........................................ 71
Appendix 1 – Area measurements ........................................................................................................................ 73
AC34 Spectator Sites 6/5/2012
Page 3
Appendix 2 – Pedestrian/Bicycle Flow Level of Service Ranges ............................................................................ 77
Appendix 3 – Visitor Count Study Maps ................................................................................................................ 85
Discussion
A major portion of the spectator viewing capacity for the upcoming 34th America’s Cup Race (AC34), planned for San Francisco Bay in 2012 and 2013, will be on the National Park Service (NPS) sites at San Francisco Maritime National Historical Park (SAFR) and Golden Gate National Recreation Area (GGNRA), including SAFR, Hyde Street Pier, Fort Mason, Crissy Field, Fort Point, Golden Gate Bridge overlook areas, Marin Headlands/Battery Spencer (Marin County) and Fort Baker (Marin County). The following report provides summaries of the key visitor use levels and characteristics that were experienced over the course of 11 study days in 2011 (August 24-28, 2011, September 7-11, 2011 and October 8, 2011 – Fleet Week Saturday) and expected visitation levels for the AC34 race days in 2012 and 2013. This report establishes an analysis methodology for visitor use conditions and provides an assessment of the impact of projected AC34 spectator levels on total visitation to the NPS sites (including non-AC34 visitation to these sites, as well as AC34 spectators), and of expected levels of crowding at these sites on the race days. The results of the analysis, as summarized in this report, provide a basis for event planning requirements that are dependent on the visitation levels at these sites, such as crowd management, security staffing and resource protection measures.
Methodology
The specific sites that will be impacted by AC34 spectators and are included in this analysis include:
• SAFR & Hyde Street Pier • Fort Mason • Crissy Field East (defined as the area of Crissy Field east of the airfield) • Crissy Field West (defined as the portion of Crissy Field west of the tidal marsh) • Crissy West Picnic & Warming Hut area • Fort Point • Golden Gate Bridge Overlook & Trails • Marin Headlands/Battery Spencer (Marin County) • Fort Baker (Marin County)
At each of these sites, data were collected of pedestrian and bicycle flow volumes at key monitoring points, along with people at one time (PAOT) counts at selected public areas. This study spanned an 11-day period, including August 24-28, 2011, September 7-11, 2011 (both of these periods included Wednesday through Sunday to capture weekday and weekend conditions), and October 8, 2011 (Saturday of Fleet Week). The inclusion of the Fleet Week day in the study enables comparisons to be made that provide insights into

AC34 Spectator Sites 6/5/2012
Page 4
spectator conditions that can be expected for the AC34 race days. For each study day, the counts were taken during three two-hour periods: 9-11 AM, 1-3 PM, and 4:30-6:30 PM. These specific periods were selected to span three key periods of the day: peak arrival, peak event, and peak departure period, respectively, for AC34. Daily counts were then estimated by interpolating the observed counts to the time periods that were not studied. Based on the AC34 spectator projections developed by AECOM, pedestrian flow volumes and PAOT counts were developed for the sites where spectator projections are available. For the smaller sites where specific projections were not available (Golden Gate Bridge Plaza viewing areas and Fort Point), spectator estimates were developed based on the projections for the Crissy West Picnic Area. These projections include the following race day scenarios:
• 2012 Peak Race Weekend Day • 2012 High Interest Weekend Day • 2012 Peak Race Weekday Day • 2013 Peak Race Weekend Day • 2013 Medium High Weekend Race Day • 2013 Average Weekend Race Day • 2013 Peak Race Weekday • 2012 AC45 Peak Race Day (Alternative E only) • 2012 AC72 Peak Race Day(Alternative E only) • 2012 Fleet Week Weekend Day (Alternative E only)
Four race programming scenarios were selected for detailed analysis, including:
• Alternative B (Sponsor Proposed Project) • Alternative C (No events on NPS sites) • Alternative D (Modified program on Crissy West on weekends and race course shift in
2012) • Alternative E (Preferred Alternative)
To assess the expected impact of the AC34 race days on the usage patterns of both spectators and regular visitors to these sites, visitation models were developed that combined the AC34 spectator projections for each alternative, site and race day scenario, with the existing visitation levels for each site (based on the August and September visitor use data) – this analysis combines the projected spectator levels with the existing visitation to the sites, also accounting for visitation that will either be displaced to other recreational destinations, or converted into AC34 spectators. Since it is important to assess the expected levels of crowding that will occur at these sites during the AC34 events, procedures were developed to establish people at one time (PAOT) counts and pedestrian/bicycle flow volumes associated with level of service (LOS) ranges “A” through “F” – a similar approach to what is used regularly for roadway and pedestrian capacity planning. Such an approach is necessary, because there is not an absolute capacity limit for each site – although it is physically possible to compress more and more people into a defined area, the quality of the spectator/visitor experience and safety would be

AC34 Spectator Sites 6/5/2012
Page 5
severely compromised if crowding conditions were allowed to increase to uncomfortable and unsafe levels. Furthermore, at higher crowding levels, increased levels of crowd management are needed, including security and crowd control staffing, temporary signage, and visitor services facilities. In general, LOS “A” corresponds to spacious and comfortable conditions (all visitors have excellent views and/or comfort), LOS “B” corresponds to busy, but comfortable conditions (almost all visitors have good views and/or comfort), LOS “C” corresponds to crowded, but manageable conditions (a significant portion of the visitors have reduced views and/or comfort), LOS “D” corresponds to very crowded conditions (the majority of the visitors have reduced views and/or comfort, and experience uncomfortable crowding levels), LOS “E” corresponds to extremely crowded with intermittent gridlock conditions, and LOS “F” corresponds to severe crowding with ongoing and unsafe gridlock conditions. For each of these levels of service, a set of management actions needs to be implemented to best support the visitation and crowding level experienced at that level. Finally, the projected site usage patterns (pedestrian/bicycle flow volumes and PAOT counts) were compared to the documented existing conditions for each site (including the 2011 Fleet Week Saturday), and to the established level of service ranges to determine the level of service that can be expected for each AC34 alternative and race day scenario and to identify areas of concern where high levels of crowding require special monitoring, crowd control, and visitation management measures. The results of the analysis are described in the following report sections.
Executive Summary
• In the following report section on Level of Service Analysis Approaches, comparable approaches that have been developed and applied at comparable venues are described and compared. A recommended set of approaches for the SAFR and GGNRA areas is established, and resulting capacity ranges corresponding to levels of service “A” to “F” for each site are summarized.
• In the following section on AC34 Spectator Projections, an analysis approach is described that was used to segment the spectator projections developed by AECOM into hourly arrivals, departures and onsite spectator counts (PAOT).
• The following section on Displacement and Conversion of regular visitation to NPS sites describes the approach that was developed and applied to assess the impact of existing visitation to the sites that will be displaced to other recreational destinations, or converted to AC34 spectators.
• In the section on Projected AC34 impacts on Visitation at NPS sites, the expected impacts of the AC34 race day scenarios and program alternatives on visitation levels and pedestrian/bicycle flow volumes are described, and compared to the equivalent levels that were documented in 2011 for weekdays, weekend days and Fleet Week Saturday (10/8/2011). Additionally, descriptions of the levels of service corresponding to the existing and calculated figures are provided for each area.

AC34 Spectator Sites 6/5/2012
Page 6
• In the section on Development of Monitoring Plan, Management Action Trigger Points and Measures, an approach is described and recommended for implementation that will establish the key locations to be monitored, and trigger points that will determine when management actions are required.
Comparable Analysis Approaches for Level of Service Analysis
Various level of service approaches for pedestrian/bicycle flow volumes and people at one time (PAOT) levels that have been documented and used at other recreational sites are described and compared below. Due to the varied and unique characteristics of the GGNRA and SAFR sites, there is no consistent and simple universal approach that can be applied. Instead, a tailored approach is needed that uses the comparable approaches, but which is also adjusted for the unique characteristics of these sites. Highway Capacity Manual Pedestrian Level of Service The Highway Capacity Manual (HCM) produced by the Transportation Research Board establishes pedestrian levels of service for walkways based on the flow volume (pedestrians per minute per foot width of walkway), as well as on pedestrian density (square feet per person). Direct application of these service levels to the combined volumes of pedestrians and bicycles indicates very high service levels for the majority of the SAFR/GGNRA paths – for example, at the SAFR entry on Jefferson Street, the level of service calculated per the HCM would always be “A”, except for the Fleet Week Saturday, where it drops only to LOS “B”. Similarly, the projected pedestrian volumes for AC34 would all be rated at LOS “A” for all NPS sites, except for the peak race days at Crissy Field West, which would reach LOS “B”. However, major shortfalls in applying the HCM standards to recreational use areas are that the criteria were developed for applications to high-volume urban applications where pedestrian traffic is moving constantly, and these standards do not address the use of paths for both transportation and recreation activities, as is consistently experienced at the NPS sites. Furthermore, the HCM approach does not account for the higher impact of bicycle traffic on reducing the level of service, and does not address the use of pathways as spectator viewing areas that occurs during events, which reduces the space available for pedestrian and bicycle traffic. Thus, the HCM standards tend to overestimate the true level of service, and underestimate congestion levels, due to these exclusions. These standards do reflect the fact that significant pedestrian volumes can be supported by the large widths of the major paths within SAFR and GGNRA, including the Golden Gate Promenade; but the lack of incorporating bicycle traffic and recreational-type use is a major limitation for applying these standards. FHA shared-use Level of Service Calculator According to the FHA shared-use level of service calculator, where bicycles are 25% of the total traffic (typical of conditions along the Golden Gate Promenade), LOS “F” is reached at 87 pedestrians/bicycles per hour for an 8’ wide path, and 229 pedestrians/bicycles per hour for a 20’ wide path. Per this methodology, the level of service is actually better with a higher percentage of bicycles, but this is due to the fact that the entire approach was specifically developed from the perspective of the bicycles. Since the Golden Gate Promenade and

AC34 Spectator Sites 6/5/2012
Page 7
almost all of the paths that need to be evaluated as part of the AC34 assessment regularly experience far more than 230 pedestrians/bicycles per hour on a regular basis, it is clear that this planning resource is more appropriate for low-volume rural applications, and is not directly applicable for the SAFR/GGNRA areas, although it does suggest that the high volume of pedestrians and bicycles that are experienced on the Golden Gate Promenade and other paths within SAFR and GGNRA is not a desirable mix (which is substantiated by the known ongoing traffic conflicts between pedestrians and bicyclists that occur on these paths). For example, at the SAFR Entry on Jefferson Street, the documented peak hour pedestrian/bicycle volume ranged from 830 (weekdays) to 2,900 (Fleet Week) – much higher than the FHA standard for LOS “F”. A higher volume of use must be established for these areas; otherwise, the pedestrian & bicycle volumes would indicate an unacceptable level of service on a consistent basis for the SAFR and GGNRA sites, even without the added bicycle and pedestrian traffic generated by special events such as AC34. Disney Pedestrian Planning Standard For the design of walkways at the Disney theme parks and resort developments, a planning range of 2.5 to 3.5 linear feet width per 1,000 hourly pedestrian flow volumes has been established. Applying this range to the documented Fleet Week pedestrian/bicycle volumes and estimated volumes for AC34 indicates that there is adequate space for all paths (except at the Ft. Mason pinch point). However, this approach also does not consider the impact of bicycles or spectators on the paths; but it does suggest that most paths are sufficiently sized to accommodate the pedestrian/bicycle volumes that can be expected for events such as AC34. Pedestrian/Bicycle combined service level As indicated above, application of the FHA Shared-use Level of Service Calculator tends to overestimate crowding conditions on pathways, while the HCM pedestrian planning guidelines tend to underestimate these conditions – this is because of the different objectives of these two planning approaches. Another major limitation of both approaches is that they are both based on pedestrian/bicycle flow on linear paths, and do not address traffic conditions at the path intersections, where traffic conflicts are consistently more severe and which are better indicators of traffic congestion levels. To facilitate the evaluation of the impact of AC34 pedestrian volumes on the paths, it is desirable to establish a tailored and appropriate planning approach from the available planning sources that can be used to assess pedestrian conditions for the AC34 events. It is apparent that there is no available documented approach that can be used to accurately assess levels of service for bicyclists and pedestrians on the SAFR and GGNRA Promenade and other paths – the HCM approach consistently underestimates level of service and the FHA shared-use approach consistently overestimates level of service – neither of these approaches was intended for application to recreational use areas such as SAFR and GGNRA. Per the FHA shared-use calculator, bicyclists typically travel 3.8 times faster than pedestrians, and require twice the width (4’ for bicyclists vs. 2’ for pedestrians). This implies that two bicyclists require the same amount of space as 15 pedestrians. By adjusting the
AC34 Spectator Sites 6/5/2012
Page 8
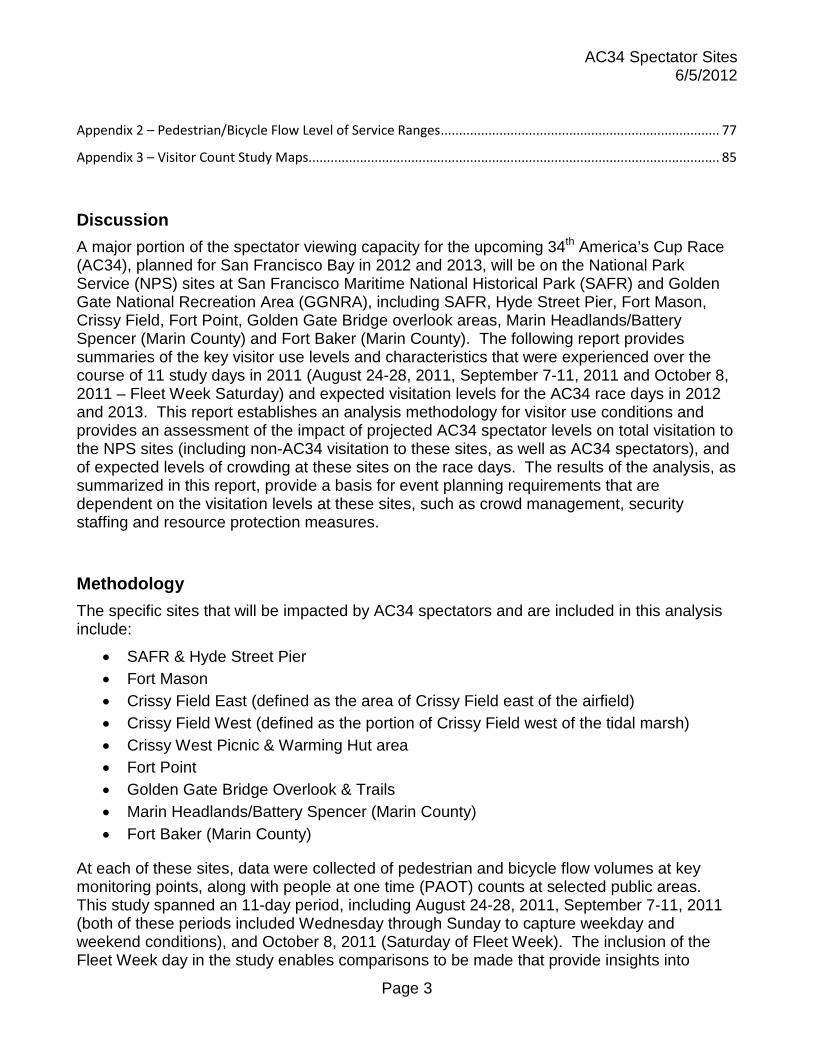
traffic volumes to account for the greater space needed for bicycles, the HCM level of service standards can be more realistically applied to these shared-use paths. Level of Service on Walkways As the following table shows, there is a very wide range in level of service standards that have been developed and applied for walkways at various venues. This reflects the fact that walkways have a significant ability to accommodate high crowding levels on busy days, although conditions can become uncomfortably crowded at these levels.
Square feet per person
Information Source LOS A LOS B LOS C
LOS D
LOS E LOS F
Highway Capacity Manual for Walkways 130+ 40-130 24-40
15-24
8-15 < 8
NFPA Std for Non-concentrated Use
15
Parks Victoria Standard for Walkways
15-40
National Mall walkways
10-50
Lincoln Memorial Staircase
10
Constitution Garden Walks 10-100
National Mall Tidal Basin & Walkways
3-50 Highway Capacity Manual Equivalent Flow Rate (ped/min/ft width) < 2 2-7 7-10 10-15 15-25 > 25
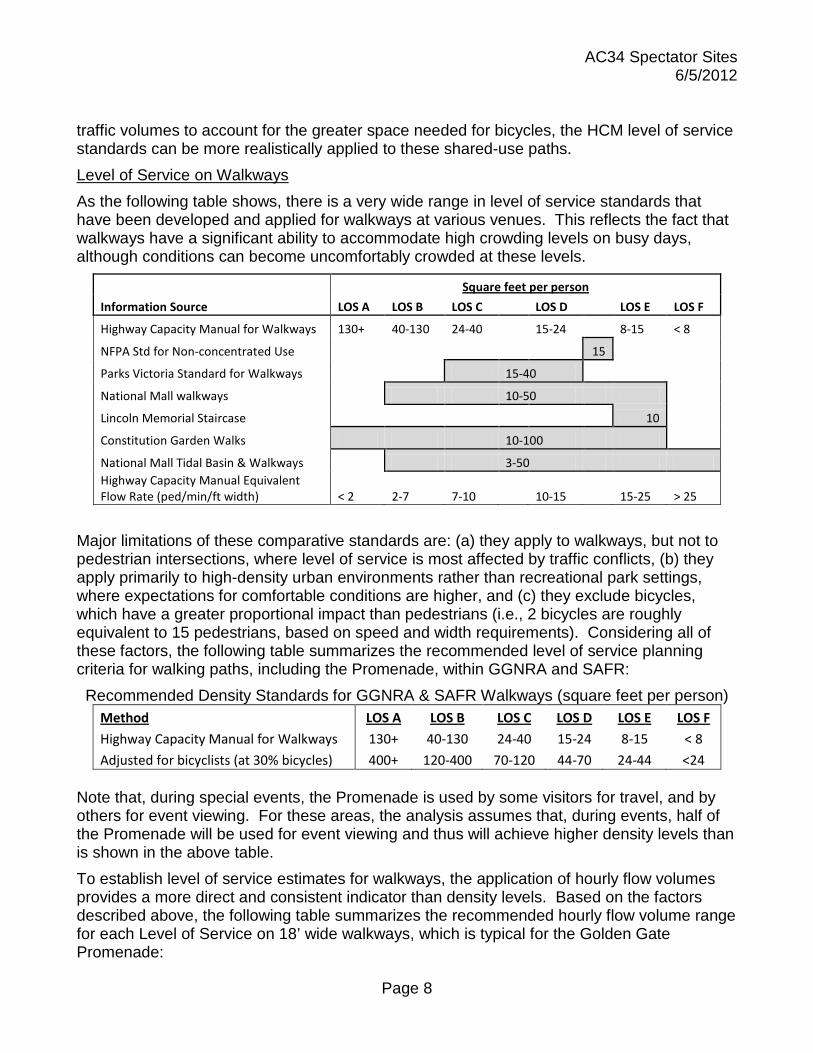
Major limitations of these comparative standards are: (a) they apply to walkways, but not to pedestrian intersections, where level of service is most affected by traffic conflicts, (b) they apply primarily to high-density urban environments rather than recreational park settings, where expectations for comfortable conditions are higher, and (c) they exclude bicycles, which have a greater proportional impact than pedestrians (i.e., 2 bicycles are roughly equivalent to 15 pedestrians, based on speed and width requirements). Considering all of these factors, the following table summarizes the recommended level of service planning criteria for walking paths, including the Promenade, within GGNRA and SAFR: Recommended Density Standards for GGNRA & SAFR Walkways (square feet per person)
Method LOS A LOS B LOS C LOS D LOS E LOS F
Highway Capacity Manual for Walkways 130+ 40-130 24-40 15-24 8-15 < 8
Adjusted for bicyclists (at 30% bicycles) 400+ 120-400 70-120 44-70 24-44 <24
Note that, during special events, the Promenade is used by some visitors for travel, and by others for event viewing. For these areas, the analysis assumes that, during events, half of the Promenade will be used for event viewing and thus will achieve higher density levels than is shown in the above table. To establish level of service estimates for walkways, the application of hourly flow volumes provides a more direct and consistent indicator than density levels. Based on the factors described above, the following table summarizes the recommended hourly flow volume range for each Level of Service on 18’ wide walkways, which is typical for the Golden Gate Promenade:

AC34 Spectator Sites 6/5/2012
Page 9
LOS Hourly Flow Volume
for 18' Walkway A <440 B 430-1589 C 1590-2149 D 2150-3229 E 3230-5379 F >5500
Note that, these ranges are directly proportional to the path width, so these ranges were adjusted for each location according to the individual path width, as described later in this report. Level of Service for “Defined Viewscapes” Although there are no specific capacity standards that have been established for defined viewscapes (i.e., specific viewing spaces where people frequently gather in large numbers), it is vital to evaluate these types of spaces, as they are important for planning purposes, and clearly should fall somewhere between walkways and queues in the range of density levels that can be achieved – visitors require less space than on walkways, as they do not need space to walk, but they normally desire more space than is provided in queue areas for the equivalent level of service range. The following table provides a comparison of density ranges that have been used for the comparable defined viewscapes, along with a suggested range, based on a composite of the comparables:
Density Standard Comparables for Defined Viewscapes Information Source Square feet per person
Parks Victoria Std for defined viewing areas
15-23
Mount Rushmore July 3rd Baseline
10-12
Grand Canyon 1995 GMP
15-30
Lincoln Memorial - peak season
7-10
National Mall - major event (short periods)
3
Vietnam Veterans Memorial 10-50
Thomas Jefferson Memorial Stairs & Plaza 10-50
Mall Elm Tree (demonstrations & events)
7 Washington Monument Grounds (above retaining wall) 7-50 Washington Monument Grounds (north of Independence Ave) 3-50
Lincoln Memorial Reflecting Pool 3-200
DC War Memorial
10
Constitution Gardens / Tidal Basin 10-100
Union Square
3-10
Mall Center Panels 3-50 JFK Hockey Fields/FDR Ball fields/ Polo Grounds 7-100

AC34 Spectator Sites 6/5/2012
Page 10
Information sources for the standards summarized in the above tables include the following:
• Matrix of Example Visitor Use Densities (NPS Denver Service Center)
• Highway Capacity Manual (Transportation Research Board)
• Estimating Capacities for Pedestrian Walkways and Viewing Platforms (Victoria Parks, June 2002)
• Shared Level of Use Calculator – A Users Guide (Federal Highway Administration, July 2006)
• Alternatives – Draft National Mall Plan / EIS (National Mall User Capacities)
In applying the above density ranges, it is important to ensure that the area specified as the “defined viewing area” has the ability to provide acceptable views throughout the defined area. To be more accurate, the capacity range for each level of service should also be a function of the linear distance of viewing area available, as well as the total amount of space, because the prime views are normally at the front edge of the defined viewing area, and become less desirable further away from the edge (due to longer viewing distances and visual conflict of spectators in front). For example, the large Crissy Field area, over 500’ deep at its widest point, cannot be expected to achieve the same spectator densities for AC34 throughout this depth as other areas with narrower widths and/or better lines-of-sight for viewing. A potential issue with applying this planning approach is the ability of the areas to support the estimated crowding levels. For example, at the SAFR beach, the highest density that was achieved on the 2011 Fleet Week Saturday was about 50 square feet per visitor, because visitors did not consider the beach to be a prime viewing area. Based on visual observations of the crowds, the beach, along with all of SAFR, was judged to be at maximum acceptable crowding conditions on that day (i.e., LOS “F” – see following photograph).
Fleet Week Spectators at SAFR (10/8/2011)

AC34 Spectator Sites 6/5/2012
Page 11
Similarly, the most crowded beaches at Crissy Field East achieved a density level of about 86 square feet per visitor, and this area was judged to be at LOS “E” (see following photograph).
Fleet Week Spectators at Crissy Field East Beach (10/8/2011)
Using these observed conditions for the Fleet Week Saturday to calibrate the level of service ranges, the following recommended density standards were developed for Defined Viewscapes within GGNRA and SAFR:
Recommended Density Standards for SAFR/GGNRA “Defined Viewscapes”
Square Feet per Person LOS A LOS B LOS C LOS D LOS E LOS F 200+ 100-200 54-100 33-54 26-33 <26
To account for the observed crowding levels at SAFR and Crissy Field East on the 2011 Fleet Week Saturday, and the uncertainty of achieving extremely high density levels throughout the defined viewscape areas, the above density level ranges were developed for the purpose of developing capacity ranges for “defined viewscape” areas within GGNRA and SAFR. It is advisable to set different ranges for the beaches and similar areas to account for the lower achievable density in these areas, especially considering that visitors at the beaches typically bring blankets to spread out - the following table shows recommend density standards for beaches, using the densities achieved at the SAFR and Crissy Field East beaches during Fleet Week (as LOS “E” to “F”) to calibrate the density ranges:

AC34 Spectator Sites 6/5/2012
Page 12
Recommended Density Standards for SAFR/GGNRA Beaches Square feet per person
LOS A LOS B LOS C LOS D LOS E LOS F
400+ 200-400 150-200 90-150 50-90 <50 Density planning standards for large open areas The following standards were developed for large open areas within the National Mall. Insufficient information is available to establish level of service factors for these ranges, especially considering the wide range in types of spaces. In general, the standards are more spacious than the ranges shown in the above tables, reflecting the fact that people normally desire a relatively uncrowded experience in a large open park setting, except at popular defined viewscapes and during special events.
Density Standard Comparables for Large Open Areas
Large open areas Square feet per person
National Mall - open recreational spaces 1,000 National Mall - events with blankets & chairs (concerts, etc) 200 Lincoln & Thomas Jefferson Memorials 50-100 National Mall - most memorials (e.g.: Washington Monument) 100-200 US Grant Memorial/Korean War Memorial/ Geo Mason Memorial 50-200 FDR Memorial 10-200 Mall Elm Tee Panels/Constitution Garden hillsides 200-1,000 West Potomac Park Riverfront/Washington Mnmt south of Independence Ave 100-1,000 Ash Woods 10,000 Lincoln Circle & Radial Roads / Watergate Area 50
Level of service standards for other types of areas Other public areas within SAFR and GGNRA also provide capacity for visitors and spectators, such as the east Crissy Field parking lot (where high numbers of tailgaters were observed), Crissy East Café area, east Crissy Field area by wetlands, SAFR tiered viewing areas, Battery Spencer areas, etc. The LOS ranges for these areas have been adjusted to ensure that they are accounted for in the capacity totals, and to reflect the unique characteristics of each area. Application of PAOT capacity ranges to SAFR & GGNRA areas Based on the level of service comparables and standards described above, the following table summarizes the density assumptions (sq.ft. per person) that were developed and used as the basis for capacity ranges for the AC34 sites at SAFR and GGNRA:

AC34 Spectator Sites 6/5/2012
Page 13
Density Standards for SAFR/GGNRA Areas
Square Feet per Person
Area type LOS A LOS B LOS C LOS D LOS E LOS F Beach 400+ 200-400 150-200 90-150 50-90 <50 Defined viewscape 200+ 100-200 54-100 33-54 26-33 <26 Walkway 400+ 200-400 150-200 80-150 50-80 <50 Open recreational spaces 1000+ 500-1000 300-500 200-300 100-200 <100 Blend - recreational space & defined viewscape 600+ 300-600 200-300 120-200 60-120 <60 Blend - defined viewscape & walkway ( including Promenade) 300+ 150-300 102-150 56-102 38-56 <38 Aquatic Park Tiered Waterfront Seating Area 140+ 70-140 40-70 22-40 18-22 <18 Aquatic Park Bleachers 20+ 15-20 13-15 13 13 <13 Unique - linear viewing (linear feet per person) 10+ 5-10 3-5 2-3 1.5-2 <1.5
Note that, for the main Promenade areas where spectators are able view races directly from the Promenade, the indicated sq.ft. per person factor assumes that the half of the Promenade is used for viewing and half for circulation. Based on the density factors shown in the above table, and measurements of each public area, the following table provides summary estimates for the number of visitors that can be supported (PAOT) at each NPS area and for each Level of Service range:
Calculated Level of Service Standards for SAFR/GGNRA Sites (PAOT)
NPS Area LOS A LOS B LOS C LOS D LOS E LOS F SAFR <1720 1720-2779 2780-3789 3790-5349 5350-7829 >7830 Fort Mason <100 100-199 200-299 300-499 500-739 >740 Crissy Field East <880 880-1759 1760-2409 2410-4049 4050-7119 >7120 Crissy Field West <3770 3770-6749 6750-9619 9620-14879 14880-26219 >26220 Crissy West Picnic Area <390 390-779 780-1199 1200-2039 2040-3389 >3390 Fort Point <70 70-129 130-219 220-329 330-429 >430 Battery Spencer <40 40-89 90-129 130-219 220-429 >430 GG Bridge Overlook (defined viewing areas) <20 20-39 40-69 70-119 120-149 >150 Fort Baker <390 390-779 780-1439 1440-23659 2360-2989 >2990 The capacity ranges for each level of service as shown in the above table are based on the area measurements documented in Appendix 1 of this report. To account for known situational considerations for which the actual crowding conditions are expected to differ from the above calculated ranges due to special event conditions in place, the following table provides revised ranges (highlighted figures) for several locations, including SAFR, Crissy Field East, Crissy Field West, Crissy Picnic Area, Ft. Point, and Batter Spencer:

AC34 Spectator Sites 6/5/2012
Page 14
NPS Area LOS A LOS B LOS C LOS D LOS E LOS F SAFR <550 550-1999 2000-3709 3710-5349 5350-7829 >7830 Fort Mason <100 100-199 200-299 300-499 500-739 >740 Crissy Field East <809 810-1149 1150-2409 2410-4049 4050-7119 >7120 Crissy Field West <1269 1270-2279 2280-9619 9620-14879 14880-26219 >26220 Crissy West Picnic Area <390 390-699 700-1199 1200-2039 2040-3389 >3390 Fort Point <70 70-79 80-219 220-329 330-429 >430 Battery Spencer <30 30-34 35-59 60-219 220-429 >430 GG Bridge Overlook (defined viewing areas) <20 20-39 40-69 70-119 120-149 >150 Fort Baker <300 300-509 510-1299 1300-2359 2360-2989 >2990
For SAFR, the ranges for LOS A through D were reduced to reflect the known crowding conditions that occur during special events – any major event at SAFR or Fisherman’s Wharf tends to draw additional traffic and visitation that creates additional crowding that warrant management measures, even at the lower visitation levels. For Crissy Field East, the ranges for LOS A through C were reduced to reflect the known crowding conditions that occur during major events at Crissy Field or Marina Green, which invariably draw additional crowding levels that warrant management measures, even at the lower visitation levels. For Crissy Field West, it is anticipated that visitor crowds during AC34 will be concentrated in the east Promenade and beach areas, due to the attractive viewing conditions there. To account for this expectation, the ranges for LOS A through C were reduced to reflect these anticipated conditions. For the Crissy West Picnic area, the ranges for LOS B & C were reduced to reflect the known draw of the Warming Hut area during special events, as this is the only location in the west Crissy Field area where food service and shopping opportunities are available. For Fort Point, the ranges for LOS A through C were reduced to reflect the need for management action to deal with safety problems associated with visitors occupying viewing areas along the narrow road (Marine Drive) and creating conflicts with vehicular traffic. For Battery Spencer, the ranges for LOS A through D were reduced to reflect the fact that additional management measures are required to handle safety problems associated with any increase in visitors occupying the steep viewing areas, and attempting to bypass the safety fence more frequently. In the above tables and throughout this report, LOS “A” corresponds to spacious and comfortable conditions (all spectators and visitors have excellent viewing and/or comfort levels), LOS “B” corresponds to busy, but comfortable conditions (almost all spectators and visitors/ have good viewing and/or comfort levels), LOS “C” corresponds to crowded, but manageable conditions (a substantial portion of the spectators and visitors have reduced vies and/or comfort levels), LOS “D” corresponds to very crowded conditions (the majority of the spectators and visitors have reduced visibility and experience uncomfortable crowding conditions), LOS “E” corresponds to extremely crowded conditions with intermittent gridlock

AC34 Spectator Sites 6/5/2012
Page 15
conditions, and LOS “F” corresponds to severe crowding with ongoing and unsafe gridlock conditions. These capacities were used to assess the expected levels of crowding for the AC34 events, based on the spectator attendance forecasts. The results of this assessment are summarized later in this report for each SAFR and GGNRA area studied.
AC34 Spectator Projections
The AC34 spectator projections developed by AECOM were used as the basis for determining pedestrian and bicycle flow volumes and people at one time (PAOT) counts at each of the SAFR and GGNRA sites studied. The analysis of these projections is described as follows: AC34 Spectator Estimates The following tables summarize the AC34 spectator estimates for the four project alternatives under consideration (alternatives B, C, D & E) for 2012 and 2013, developed by AECOM:
Alternative B Spectator Estimates (Sponsor Proposed Project)
2012 2013
NPS Site Peak
Weekday Very High Weekend
High Interest
Weekend Peak
Weekday Very High Weekend
Avg. Peak
Weekend Average
Weekend Marin Headlands 100 500 300 150 500 300 200 Ft Baker/Cavallo Point 100 350 210 100 500 250 150 Crissy Field East 2,000 5,000 3,000 1,500 6,000 3,000 2000 Crissy Field West 4,000 15,000 9,000 6,000 50,000 20,000 8000 SAFR 500 4,000 2,400 600 8,000 5,000 2500 Crissy Picnic Area 500 2,000 1,200 500 5,000 2,000 1000 Fort Mason 100 1,000 600 200 1,000 500 300
Alternative C Spectator Estimates (No events on NPS sites)
2012 2013
NPS Site Peak
Weekday Very High Weekend
High Interest
Weekend Peak
Weekday Very High Weekend
Avg. Peak
Weekend Average
Weekend Marin Headlands 100 500 300 100 500 300 200 Ft Baker/Cavallo Point 100 350 210 100 500 250 150 Crissy Field East 1,100 3,500 2,000 1,000 9,500 3,000 2000 Crissy Field West 1,000 3,000 1,900 1,000 9,000 3,000 1500 SAFR 500 2,000 1,200 500 4,000 2,000 1000 Crissy Picnic Area 200 600 360 100 1,500 400 200 Fort Mason 100 1,000 600 100 500 250 150

AC34 Spectator Sites 6/5/2012
Page 16
Alternative D Spectator Estimates (Modified Program on Crissy West on Weekends and Race Course Shift in 2012)
2012 2013
NPS Site Peak
Weekday Very High Weekend
High Interest
Weekend Peak
Weekday Very High Weekend
Avg. Peak
Weekend Average
Weekend Marin Headlands 100 500 300 150 500 300 200 Ft Baker/Cavallo Point 100 350 210 100 500 250 150 Crissy Field East 700 1,700 1,020 2,000 11,000 4,500 2000 Crissy Field West 200 900 540 1,750 17,000 7,000 3000 SAFR 1,000 5,000 3,000 850 5,000 3,500 1500 Crissy Picnic Area 100 350 210 250 2,500 1,000 500 Fort Mason 100 1,000 600 200 1,000 500 300
Alternative E Spectator Estimates
(Preferred Alternative - No events on NPS sites except SAFR, race course shifts)
2012 2013
NPS Site
Peak Race Day
(AC45)
Peak Exhibition Day (AC72)
Fleet Week Incremental1
Peak Weekday
Very High Weekend
Avg. Peak
Weekend Average
Weekend Marin Headlands 500 500 20 150 500 300 200 Ft Baker/Cavallo Point 350 350 220 100 500 250 150 Crissy Field East 2,000 3,500 600 1,000 9,500 3,000 2000 Crissy Field West 500 3,000 190 900 9,000 3,000 1500 SAFR 5,000 5,000 1,520 600 8,000 5,000 2500 Crissy Picnic Area 350 600 200 100 1,500 400 200 Fort Mason 600 1,000 570 100 500 250 150
Daily Visitation Profile As indicated in the following activity program, activities will be scheduled over a 12-hour period, before and after the races (10 AM to 10 PM), in addition to the race activities themselves, which are typically scheduled between 1 PM to 5 PM.
1 Note: both Fleet Week and AC34 will each draw spectators on the days during which both events are scheduled on the same days in October 2012; many of these spectators will watch both events. The indicated figures for “Fleet Week Incremental” represent the estimated incremental daily spectators that will be drawn by AC34 over the Fleet Week spectators on Friday, Saturday, and Sunday (October 5-7, 2012).

AC34 Spectator Sites 6/5/2012
Page 17
Time Activity Program 9:30 a.m. AC Village opens 10:00 a.m. – 11:00 a.m. Live entertainment on stage; boat activities 11:00 a.m. – 12:00 noon “The America’s Cup Dock out Show” 1:00 p.m. – 5:00 p.m. Racing 5:00 p.m. – 8:00 p.m. After Race Show 8:00 p.m. – 11:00 midnight Event Action and Entertainment 11:00 p.m. AC Village closes
This programming strategy will encourage a favorable spread in the distribution of spectator arrivals and departures, and will also encourage visitors to not converge on the spectator sites all at the same time. On days during which there are only one or two races, the majority of the visitors will be at the sites at the same time, but for most days when races are spread out over the planned 1 – 5 PM period, it can be expected that the a lower percentage of the total visitors will be at the spectator sites at the same time. There will be a wide range of arrival, departure, onsite spectator, and length-of-stay distributions, based on the popularity and timing of the various races from day to day. Since the races will always be scheduled between 1 PM and 5 PM, visitor arrivals will tend to build up during the late morning period, and taper off after about 1 PM, while departures will be typically be highest at the end of the last major race (assumed to be at 5 PM for planning purposes). During the race periods, there will be fewer arrivals and departures than before and after the races. The following charts provide estimated arrival and departure distributions, along with the resulting onsite spectators, as a percentage of total daily spectators, for two scenarios: a maximum of 65% of the spectators onsite during the peak period of the day (2-4 PM), and a maximum of 70% of the spectators onsite during the peak period:
0%
10%
20%
30%
40%
50%
60%
70%
9-10
10-1
1
11-1
2
12-1
1-2
2-3
3-4
4-5
5-6
6-7
7-8
8-9
9-10
10-1
1
% o
f Dai
ly S
pect
ator
s
Hour
Spectator Distribution for Scenario 1 (65% Peak Onsite Spectator Count)
Arrivals
Departures
% on site

AC34 Spectator Sites 6/5/2012
Page 18
Note that there will also be a wide range in the onsite lengths of stay for individual visitor groups – some visitors will take in all the races on a specific day, while others will just watch their favorite competitions; some visitors will attend the pre- and/or post-race events, while others will only come for the races themselves. Also, the individual race days will experience visitation characteristics that vary from the above estimates. These distributions represent estimates for the aggregate arrival & departure rates, length of stay and onsite counts for all spectators combined that will be experienced on typical race days. The above distributions for arrivals, departures and onsite spectators were used with the projections of daily spectator counts at each major site to establish estimates of the impacts of these spectators on pedestrian/bicycle flow volumes and spectator density levels for these sites. Using these estimates, and the distributions for hourly arrivals, departures and onsite spectator counts, hourly figures for arrivals, departures, and onsite counts were developed for each relevant NPS site and visitation scenario. Typically, the peak period is expected to occur between 2 PM and 5 PM, but this will vary based on the race schedule.
Displacement and conversion of regular visitation to NPS sites
Because of the high spectator attendance expected at the NPS sites during the AC34 races, a portion of the visitors that currently come to these sites will decide to go to other recreational destinations, and will thus be displaced from the sites used for AC34 viewing. Also, a portion of the regular visitation will be converted to AC34 spectators (i.e., visitors that would normally come to the NPS sites for recreational activities who will become spectators). The actual amount of visitation displacement/conversion that will occur is not specifically known, and is likely to vary between the individual sites based on visitors’ advanced expectations of crowding levels. The displacement/conversion assumptions used in the analysis are a function of the projected spectator counts – the higher the projected counts, the more displacement/conversion is assumed to occur. Based on the projected spectator
0% 10% 20% 30% 40% 50% 60% 70% 80%
9-10
10-1
1
11-1
2
12-1
1-2
2-3
3-4
4-5
5-6
6-7
7-8
8-9
9-10
10-1
1
% o
f Dai
ly S
pect
ator
s
Hour
Spectator Distribution for Scenario 2 (70% Peak Onsite Spectator Count)
Arrivals
Departures
% on site

AC34 Spectator Sites 6/5/2012
Page 19
counts for each AC34 scenario, the displacement/conversion percentages were adjusted to reflect the impact of the different spectator projections. These percentages are summarized in the following tables:
Estimated Percentage of Existing Visitors Displaced or Converted: Alternative B 2012 2013
NPS Site Weekday
Race
Peak Weekend
Race
High Interest
Weekend Weekday
Race
Peak Weekend
Race
Medium High
Weekend Average
Weekend SAFR 2% 8% 5% 2% 16% 10% 5% Ft Mason 1% 4% 3% 1% 4% 2% 1% Crissy Field East 10% 7% 4% 7% 8% 4% 3% Crissy Field West 7% 9% 5% 10% 30% 12% 5% Crissy Picnic Area 9% 5% 3% 9% 12% 5% 2% Marin Headlands 2% 4% 3% 3% 4% 3% 2% Fort Baker 2% 4% 2% 2% 6% 3% 2%
Estimated Percentage of Existing Visitors Displaced or Converted: Alternative C
2012 2013
NPS Site Weekday
Race
Peak Weekend
Race
High Interest
Weekend Weekday
Race
Peak Weekend
Race
Medium High
Weekend Average
Weekend SAFR 2% 4% 2% 2% 8% 4% 2%
Ft Mason 1% 4% 3% 1% 2% 1% 1%
Crissy Field East 5% 5% 3% 5% 13% 4% 3%
Crissy Field West 2% 2% 1% 2% 6% 2% 1%
Crissy Picnic Area 4% 2% 1% 2% 4% 1% 0%
Marin Headlands 2% 4% 3% 3% 4% 3% 2%
Fort Baker 2% 4% 2% 2% 6% 3% 2%
Estimated Percentage of Existing Visitors Displaced or Converted: Alternative D
2012 2013
NPS Site Weekday
Race
Peak Weekend
Race
High Interest
Weekend Weekday
Race
Peak Weekend
Race
Medium High
Weekend Average
Weekend SAFR 6% 10% 6% 1% 10% 7% 3% Ft Mason 1% 4% 3% 1% 4% 2% 1% Crissy Field East 3% 2% 1% 10% 15% 6% 3% Crissy Field West 0% 0% 0% 3% 10% 4% 2% Crissy Picnic Area 2% 1% 0% 5% 6% 2% 1% Marin Headlands 2% 4% 3% 3% 4% 3% 2% Fort Baker 2% 4% 2% 2% 6% 3% 2%
AC34 Spectator Sites 6/5/2012
Page 20
Estimated Percentage of Existing Visitors Displaced or Converted: Alternative E 2012 2013
NPS Site Weekday
Race
Peak Weekend
Race
High Interest
Weekend Weekday
Race
Peak Weekend
Race
Medium High
Weekend Average
Weekend SAFR 6% 10% 6% 1% 10% 7% 3% Ft Mason 1% 4% 3% 1% 4% 2% 1% Crissy Field East 3% 2% 1% 10% 15% 6% 3% Crissy Field West 0% 0% 0% 3% 10% 4% 2% Crissy Picnic Area 2% 1% 0% 5% 6% 2% 1% Marin Headlands 2% 4% 3% 3% 4% 3% 2% Fort Baker 2% 4% 2% 2% 6% 3% 2%
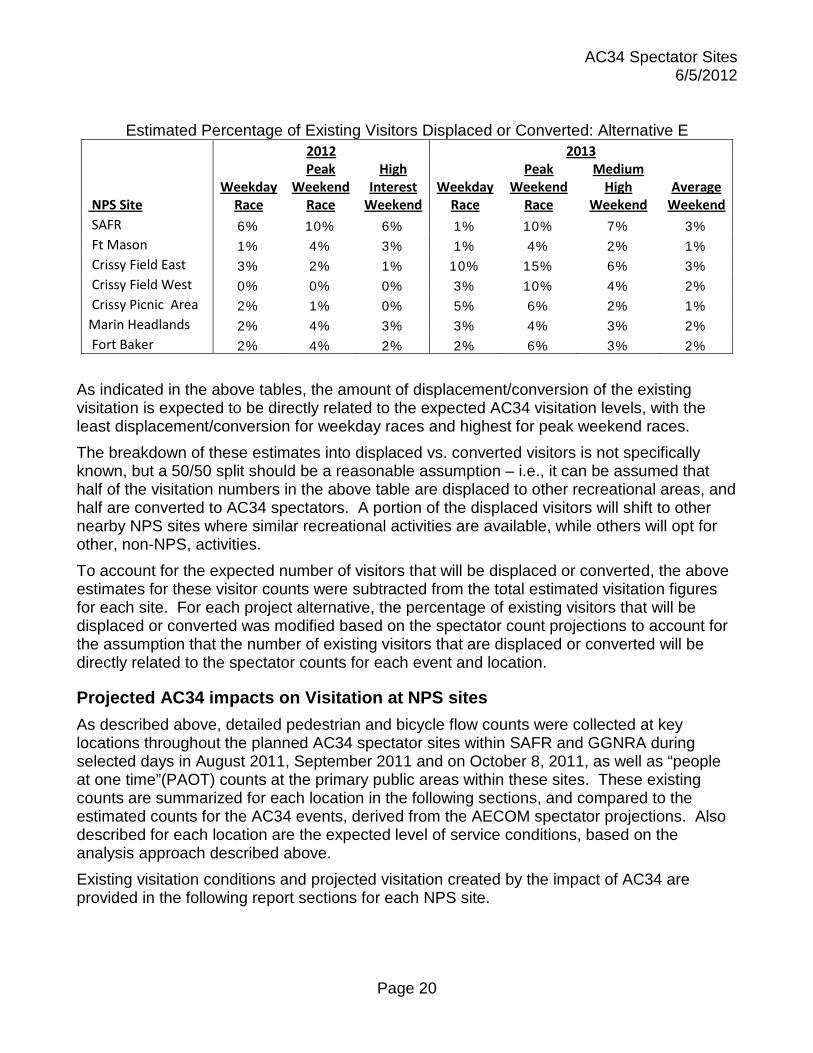
As indicated in the above tables, the amount of displacement/conversion of the existing visitation is expected to be directly related to the expected AC34 visitation levels, with the least displacement/conversion for weekday races and highest for peak weekend races. The breakdown of these estimates into displaced vs. converted visitors is not specifically known, but a 50/50 split should be a reasonable assumption – i.e., it can be assumed that half of the visitation numbers in the above table are displaced to other recreational areas, and half are converted to AC34 spectators. A portion of the displaced visitors will shift to other nearby NPS sites where similar recreational activities are available, while others will opt for other, non-NPS, activities. To account for the expected number of visitors that will be displaced or converted, the above estimates for these visitor counts were subtracted from the total estimated visitation figures for each site. For each project alternative, the percentage of existing visitors that will be displaced or converted was modified based on the spectator count projections to account for the assumption that the number of existing visitors that are displaced or converted will be directly related to the spectator counts for each event and location.
Projected AC34 impacts on Visitation at NPS sites
As described above, detailed pedestrian and bicycle flow counts were collected at key locations throughout the planned AC34 spectator sites within SAFR and GGNRA during selected days in August 2011, September 2011 and on October 8, 2011, as well as “people at one time”(PAOT) counts at the primary public areas within these sites. These existing counts are summarized for each location in the following sections, and compared to the estimated counts for the AC34 events, derived from the AECOM spectator projections. Also described for each location are the expected level of service conditions, based on the analysis approach described above. Existing visitation conditions and projected visitation created by the impact of AC34 are provided in the following report sections for each NPS site.

AC34 Spectator Sites 6/5/2012
Page 21
San Francisco Maritime National Historical Park (SAFR) Daily visitation
Estimates for the existing daily visitation to SAFR were developed from the pedestrian/bicycle flow counts that were collected during the 2011 study days. It is assumed that 65% of the daily visitation enters at the Jefferson Street entrance, 42% of the daily visitation passes by the Promenade at the Bath House, and 23% passes by the Promenade at the west end of SAFR – these assumptions take into account that a portion of the visitors to SAFR enter at other points, but Jefferson Street is the primary entry location. Applying these factors to the pedestrian/bicycle flow counts collected at SAFR results in the following estimates for existing daily visitation:
SAFR 2011 Daily Visitation Estimates
Weekday Weekend
Day Fleet Week 10/8/2011
6,650 9,720 19,440
It is assumed that a portion of the existing visitation will be displaced to other locations or converted to AC34 visitors. For each alternative and race day scenario, the following table summarizes the amount of existing visitation to SAFR that will continue to visit (i.e., will not be displaced or converted), based on the displacement/conversion percentages previously summarized:
SAFR Existing Daily Visitation Not Displaced or Converted 2012 2013
Alternative Peak Race Weekday
Peak Weekend
Race High Interest
Weekend Peak Race Weekday
Peak Weekend
Race
Medium High
Weekend
Average
Weekend Alternative B 6,550 8,920 9,240 6,530 8,120 8,720 9,220 Alternative C 6,550 9,320 9,480 6,550 8,920 9,320 9,520 Alternative D 6,250 8,720 9,120 6,570 8,720 9,020 9,420
Peak Race
Wkday AC72
Wkend AC45
Wkend
Fleet Week
Wkend Peak Race Weekday
Peak Weekend
Race
Medium High
Weekend
Average
Weekend Alternative E 6,250 8,720 8,720 19,440 6,530 8,120 8,720 9,220
The following table summarizes spectator estimates developed by AECOM for each alternative and race day scenario:
AC34 Spectator Sites 6/5/2012
Page 22
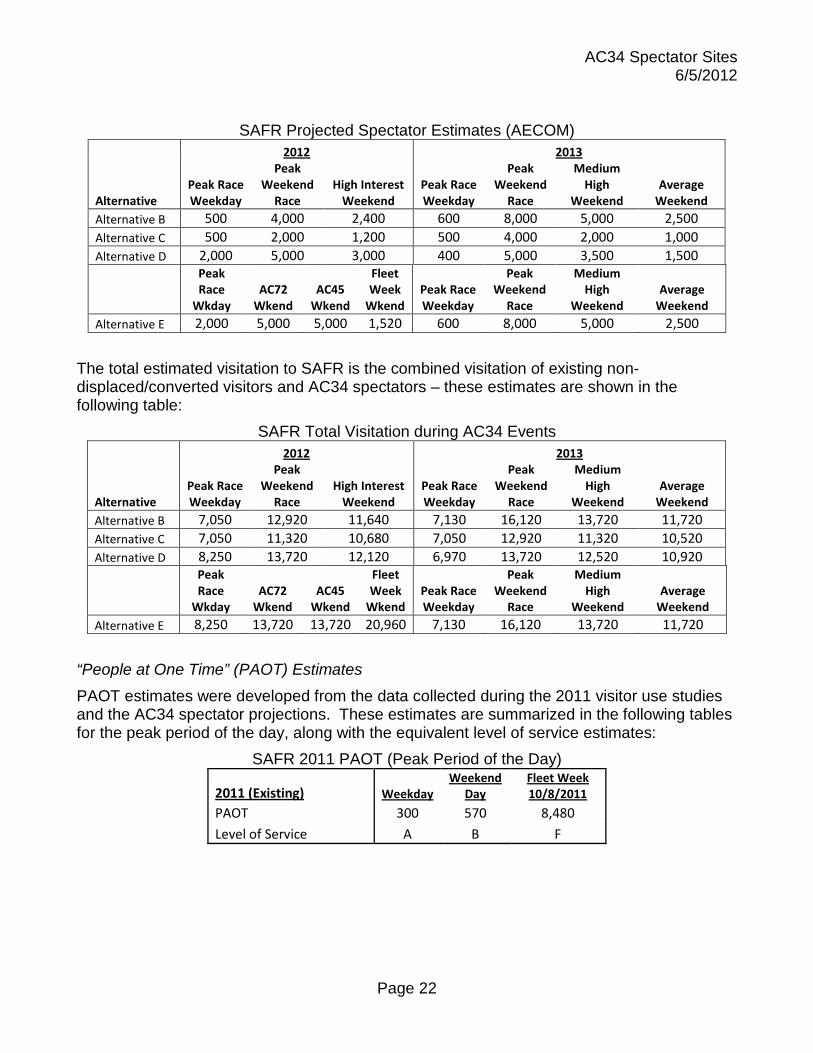
SAFR Projected Spectator Estimates (AECOM) 2012 2013
Alternative Peak Race Weekday
Peak Weekend
Race High Interest
Weekend Peak Race Weekday
Peak Weekend
Race
Medium High
Weekend
Average
Weekend Alternative B 500 4,000 2,400 600 8,000 5,000 2,500 Alternative C 500 2,000 1,200 500 4,000 2,000 1,000 Alternative D 2,000 5,000 3,000 400 5,000 3,500 1,500
Peak Race
Wkday AC72
Wkend AC45
Wkend
Fleet Week
Wkend Peak Race Weekday
Peak Weekend
Race
Medium High
Weekend
Average
Weekend Alternative E 2,000 5,000 5,000 1,520 600 8,000 5,000 2,500
The total estimated visitation to SAFR is the combined visitation of existing non-displaced/converted visitors and AC34 spectators – these estimates are shown in the following table:
SAFR Total Visitation during AC34 Events 2012 2013
Alternative Peak Race Weekday
Peak Weekend
Race High Interest
Weekend Peak Race Weekday
Peak Weekend
Race
Medium High
Weekend
Average
Weekend Alternative B 7,050 12,920 11,640 7,130 16,120 13,720 11,720 Alternative C 7,050 11,320 10,680 7,050 12,920 11,320 10,520 Alternative D 8,250 13,720 12,120 6,970 13,720 12,520 10,920
Peak Race
Wkday AC72
Wkend AC45
Wkend
Fleet Week
Wkend Peak Race Weekday
Peak Weekend
Race
Medium High
Weekend
Average
Weekend Alternative E 8,250 13,720 13,720 20,960 7,130 16,120 13,720 11,720
“People at One Time” (PAOT) Estimates
PAOT estimates were developed from the data collected during the 2011 visitor use studies and the AC34 spectator projections. These estimates are summarized in the following tables for the peak period of the day, along with the equivalent level of service estimates:
SAFR 2011 PAOT (Peak Period of the Day)
2011 (Existing) Weekday Weekend
Day Fleet Week 10/8/2011
PAOT 300 570 8,480
Level of Service A B F

AC34 Spectator Sites 6/5/2012
Page 23
SAFR PAOT Estimates (Peak Period of the Day) 2012 2013
Alternative Peak Race Weekday
Peak Weekend
Race High Interest
Weekend Peak Race Weekday
Peak Weekend
Race
Medium High
Weekend
Average
Weekend Alternative B
PAOT 610 3,150 2,120 680 5,740 3,710 2,030
Level of Service B* C C* B* E D* C* Alternative C
PAOT 610 1,800 1,310 610 3,150 1,800 1,130
Level of Service B* B B* B* C B B* Alternative D
PAOT 1,620 3,830 2,520 550 3,800 2,790 1,440
Level of Service B* D C* B* D C B*
Peak Race
Wkday AC72
Wkend AC45
Wkend
Fleet Week
Wkend Peak Race Weekday
Peak Weekend
Race
Medium High
Weekend
Average
Weekend Alternative E
PAOT 1,620 3,830 3,830 9,640 550 3,800 2,790 1,440
Level of Service B* D D F B* D C B* * Note: the indicated levels of service A through D were adjusted to reflect the impacts of expected variations in the distribution of PAOT volumes from the analysis results, based on knowledge of situational conditions at this location – any major event at SAFR or Fisherman’s Wharf tends to draw additional traffic and visitation that creates additional crowding that warrant management measures.
The figures in the above table indicate that the number of onsite visitors at SAFR will increase significantly over normal levels during the AC34 events – the “increase factors” shown in the tables indicate how much higher the projected counts are than the documented existing (non-event) levels. The increases are very high because, during events, spectators spend much more time on site than visitors typically do during normal days. This impact is also evidenced by the very high PAOT count documented on the 2011 Fleet Week Saturday (19 times higher than the normal weekend day). Applying the PAOT (people at one time) figures corresponding to each level of service range (described in a previous section of this report) to the above PAOTs results in the level of service estimates for each existing and projected use scenario, as shown in the above table. The analysis indicates that LOS “F” was reached during Fleet Week 2011. For Alternative B (Sponsor Proposed Project), the onsite crowding conditions, based on projected PAOT levels, can be expected to reach LOS “C” for the 2012 peak weekend race day and LOS “E” for the 2013 peak weekend race day, with corresponding significant increases in pedestrian/bicycle flow volumes to and from the site. These levels compare to an estimated LOS “F” that was experienced for the 2011 Fleet Week Saturday at this location, and which is also projected for the 2012 Fleet Week weekend. LOS “D” is projected for Alternative E (Preferred Alternative) for the AC72 and AC45 weekend days in 2012, and the 2013 Peak Weekend Race Day. Significant impacts will be experienced over typical visitor use levels, requiring the implementation of site mitigation measures, including the requirement for
AC34 Spectator Sites 6/5/2012
Page 24
bicyclists to dismount and walk during event periods, redirection of bicycle traffic around SAFR during peak crowding periods, and staffing of crowd control personnel. Pedestrian/bicycle flow estimates
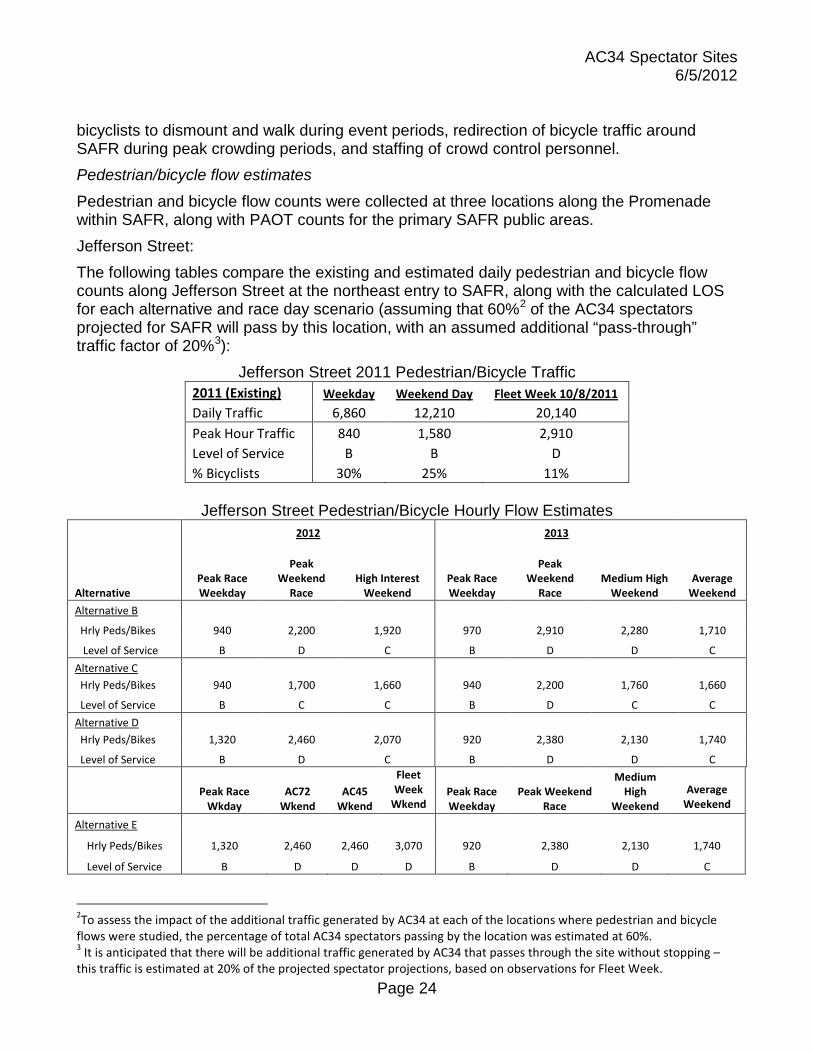
Pedestrian and bicycle flow counts were collected at three locations along the Promenade within SAFR, along with PAOT counts for the primary SAFR public areas. Jefferson Street: The following tables compare the existing and estimated daily pedestrian and bicycle flow counts along Jefferson Street at the northeast entry to SAFR, along with the calculated LOS for each alternative and race day scenario (assuming that 60%2 of the AC34 spectators projected for SAFR will pass by this location, with an assumed additional “pass-through” traffic factor of 20%3
Jefferson Street 2011 Pedestrian/Bicycle Traffic ):
2011 (Existing) Weekday Weekend Day Fleet Week 10/8/2011 Daily Traffic 6,860 12,210 20,140 Peak Hour Traffic 840 1,580 2,910 Level of Service B B D % Bicyclists 30% 25% 11%
Jefferson Street Pedestrian/Bicycle Hourly Flow Estimates
2012 2013
Alternative Peak Race Weekday
Peak Weekend
Race High Interest
Weekend Peak Race Weekday
Peak Weekend
Race Medium High
Weekend
Average
Weekend
Alternative B
Hrly Peds/Bikes 940 2,200 1,920 970 2,910 2,280 1,710
Level of Service B D C B D D C
Alternative C Hrly Peds/Bikes 940 1,700 1,660 940 2,200 1,760 1,660
Level of Service B C C B D C C
Alternative D
Hrly Peds/Bikes 1,320 2,460 2,070 920 2,380 2,130 1,740
Level of Service B D C B D D C
Peak Race Wkday
AC72 Wkend
AC45 Wkend
Fleet Week
Wkend Peak Race Weekday
Peak Weekend Race
Medium High
Weekend
Average
Weekend
Alternative E
Hrly Peds/Bikes 1,320 2,460 2,460 3,070 920 2,380 2,130 1,740
Level of Service B D D D B D D C
2To assess the impact of the additional traffic generated by AC34 at each of the locations where pedestrian and bicycle flows were studied, the percentage of total AC34 spectators passing by the location was estimated at 60%. 3 It is anticipated that there will be additional traffic generated by AC34 that passes through the site without stopping – this traffic is estimated at 20% of the projected spectator projections, based on observations for Fleet Week.

AC34 Spectator Sites 6/5/2012
Page 25
The levels of service shown in the above table are based on the indicated hourly flow volumes and measured path width of 18.0 feet (measured at the point where Jefferson Street merges with the Promenade). The pedestrian/bicycle volume ranges for each level of service at this location are shown in Appendix 2. As the above table indicates, the impacts at Jefferson Street are similar for most alternatives; reaching LOS “D” on peak weekend race days for 2012 and 2013. It should be noted that this area reached gridlock conditions during Fleet Week 2011 due to the presence of concessions tents and portable restrooms in this area – it is recommended that this configuration be improved for AC34 events by relocating concessions and portable restrooms. Golden Gate Promenade at Bath House: The following tables compare the existing and estimated daily pedestrian and bicycle flow counts along the Golden Gate Promenade at the Bath House, along with the calculated levels of service for each alternative and race day scenario (assuming that 60% of the AC34 spectators will pass by this location4, with an additional “pass-through” traffic factor assumption of 40%5
GG Promenade at Bath House - 2011 Pedestrian/Bicycle Traffic ):
2011 (Existing) Weekday Weekend Day Fleet Week 10/8/2011 Daily Traffic 5,840 8,150 21,930 Peak Hour Traffic 850 920 3,910 Level of Service B B E % Bicyclists 38% 33% 11%
4 To assess the impact of the additional traffic generated by AC34 at each of the locations where pedestrian and bicycle flows were studied, the percentage of total AC34 spectators passing by the location was estimated at 60%. 5 It is anticipated that there will be additional traffic generated by AC34 that passes through the site without stopping – this traffic is estimated at 40% of the projected spectator projections, based on observations for Fleet Week.

AC34 Spectator Sites 6/5/2012
Page 26
GG Promenade at Bath House - Pedestrian/Bicycle Hourly Flow Estimates 2012 2013
Alternative Peak Race Weekday
Peak Weekend
Race High Interest
Weekend Peak Race Weekday
Peak Weekend
Race
Medium High
Weekend Average
Weekend Alternative B
Hrly Peds/Bikes 970 1,910 1,510 990 2,900 2,090 1,400
Level of Service C* C C* C* D C C* Alternative C Hrly Peds/Bikes 970 1,320 1,160 970 1,910 1,360 1,080
Level of Service C* C* C* C* C C* C* Alternative D
Hrly Peds/Bikes 1,310 2,210 1,690 940 2,160 1,800 1,280
Level of Service C* D C C* D C C*
Peak Race
Wkday AC72
Wkend AC45
Wkend
Fleet Week
Wkend Peak Race Weekday
Peak Weekend
Race
Medium High
Weekend
Average
Weekend Alternative E
Hrly Peds/Bikes 1,310 2,210 2,210 4,140 940 2,160 1,800 1,280
Level of Service C* D D E C* D C C* * Note: the indicated level of service C was adjusted to reflect the impacts of expected variations in the distribution of spectator, pedestrian and bicycle volumes from the analysis results, based on knowledge of situational conditions at this location – during special events, visitors tend to congregate in this area, creating more congestion than would normally be experienced for the indicated pedestrian/bike flow volumes.
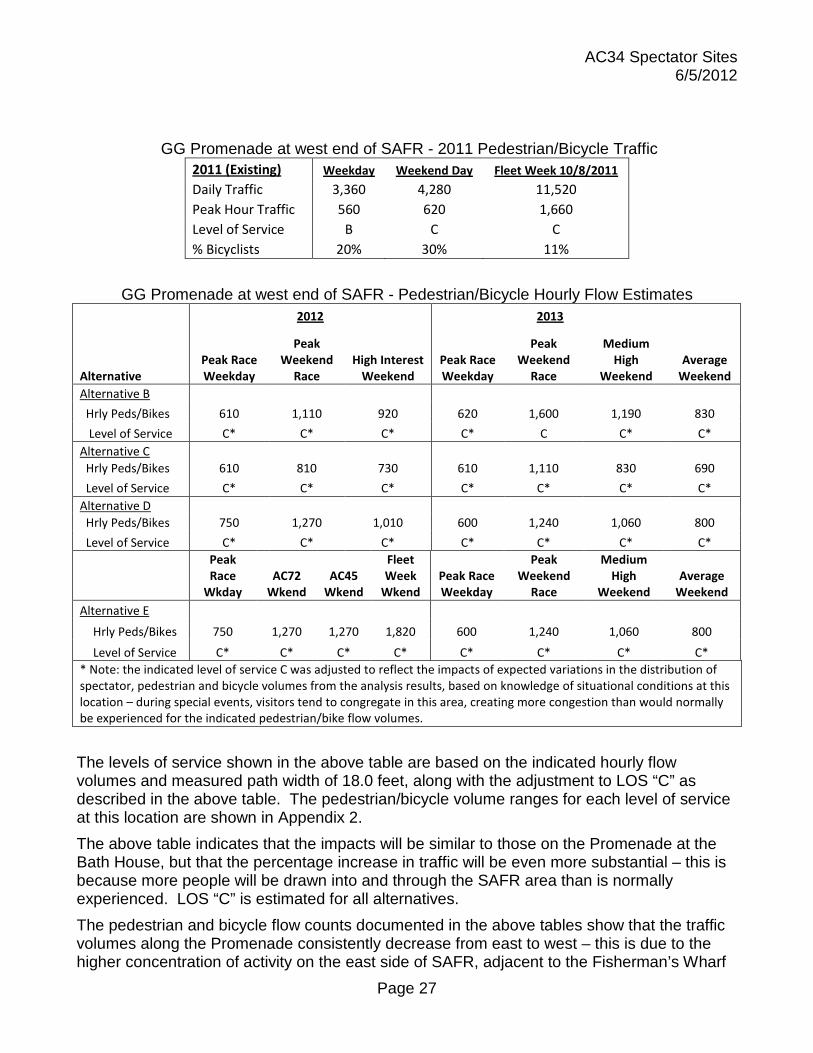
The levels of service shown in the above table are based on the indicated hourly flow volumes and measured path width of 18 feet, along with an adjustment to LOS “C” as described in the above table. The pedestrian/bicycle volume ranges for each level of service at this location are shown in Appendix 2. The above table indicates that the impacts will be similar to those at Jefferson Street, although the percentage increase in traffic will be more substantial for this location – this is because more people will be drawn into and through the SAFR area than is normally experienced. Similar to the Jefferson St. location, high crowding levels were experienced at this location during Fleet Week 2011 (LOS “E”). LOS “D” is estimated for the peak 2013 weekend race day, except for Alternative C, which has a lesser impact than the other alternatives due to the abscence of programming at SAFR for that alternative. Golden Gate Promenade at west end of SAFR: The following tables compare the existing and estimated daily pedestrian and bicycle flow counts along the Golden Gate Promenade at the west end of SAFR, along with calculated levels of service for each alternative and race day scenario (assuming that 40% of the AC34 spectators projected for SAFR will pass through this location, along with an additional “pass-through” factor of 10%):
AC34 Spectator Sites 6/5/2012
Page 27
GG Promenade at west end of SAFR - 2011 Pedestrian/Bicycle Traffic
2011 (Existing) Weekday Weekend Day Fleet Week 10/8/2011 Daily Traffic 3,360 4,280 11,520 Peak Hour Traffic 560 620 1,660 Level of Service B C C % Bicyclists 20% 30% 11%
GG Promenade at west end of SAFR - Pedestrian/Bicycle Hourly Flow Estimates
2012 2013
Alternative Peak Race Weekday
Peak Weekend
Race High Interest
Weekend Peak Race Weekday
Peak Weekend
Race
Medium High
Weekend Average
Weekend Alternative B
Hrly Peds/Bikes 610 1,110 920 620 1,600 1,190 830
Level of Service C* C* C* C* C C* C* Alternative C
Hrly Peds/Bikes 610 810 730 610 1,110 830 690
Level of Service C* C* C* C* C* C* C* Alternative D
Hrly Peds/Bikes 750 1,270 1,010 600 1,240 1,060 800
Level of Service C* C* C* C* C* C* C*
Peak Race
Wkday AC72
Wkend AC45
Wkend
Fleet Week
Wkend Peak Race Weekday
Peak Weekend
Race
Medium High
Weekend
Average
Weekend Alternative E
Hrly Peds/Bikes 750 1,270 1,270 1,820 600 1,240 1,060 800
Level of Service C* C* C* C* C* C* C* C* * Note: the indicated level of service C was adjusted to reflect the impacts of expected variations in the distribution of spectator, pedestrian and bicycle volumes from the analysis results, based on knowledge of situational conditions at this location – during special events, visitors tend to congregate in this area, creating more congestion than would normally be experienced for the indicated pedestrian/bike flow volumes.
The levels of service shown in the above table are based on the indicated hourly flow volumes and measured path width of 18.0 feet, along with the adjustment to LOS “C” as described in the above table. The pedestrian/bicycle volume ranges for each level of service at this location are shown in Appendix 2. The above table indicates that the impacts will be similar to those on the Promenade at the Bath House, but that the percentage increase in traffic will be even more substantial – this is because more people will be drawn into and through the SAFR area than is normally experienced. LOS “C” is estimated for all alternatives. The pedestrian and bicycle flow counts documented in the above tables show that the traffic volumes along the Promenade consistently decrease from east to west – this is due to the higher concentration of activity on the east side of SAFR, adjacent to the Fisherman’s Wharf

AC34 Spectator Sites 6/5/2012
Page 28
and Ghirardelli Square areas. These volumes will tend to even out to some degree during the AC34 races, as more visitors pass through SAFR seeking favorable viewing areas to the west. Pedestrian/bicycle traffic Level of Service assessment.
To account for both pedestrian and bicycle traffic on the Promenade, a modified “level of service” approach was developed that accounts for the greater amount of space needed for bicycle traffic compared to pedestrian traffic (it is estimated that 2 bicycles are equivalent to 15 pedestrians). Using this modified approach, the Promenade through SAFR is expected to operate at LOS “C” or “D” for most of the scenarios and alternatives. However, this approach assumes that the entire Promenade is available for pedestrian and bicycle traffic, and does not account for the impact that will occur at times during events when spectators on the Promenade take away space from pedestrians and bicyclists. Thus, reduced levels of service can be expected occasionally during the time periods that races are underway and clearly visible to spectators on the Promenade. Fort Mason Daily visitation
Estimates for the existing daily visitation to Fort Mason were developed from the pedestrian/bicycle flow counts collected in 2011, with the assumption that daily visitation for Fort Mason is equivalent to the sum of the visitors that enter on the Promenade from SAFR, plus 1/3 of the visitors that pass through the pinch point at the Laguna Street sidewalk. This assumption accounts for the fact that a large portion of the traffic through Ft. Mason passes through the site without actually visiting the site. Applying these factors to the pedestrian/bicycle flow counts collected at Fort Mason results in the following estimates for existing daily visitation:
Fort Mason 2011 Daily Visitation Estimates
Weekday Weekend
Day Fleet Week 10/8/2011
2,950 4,580 7,810
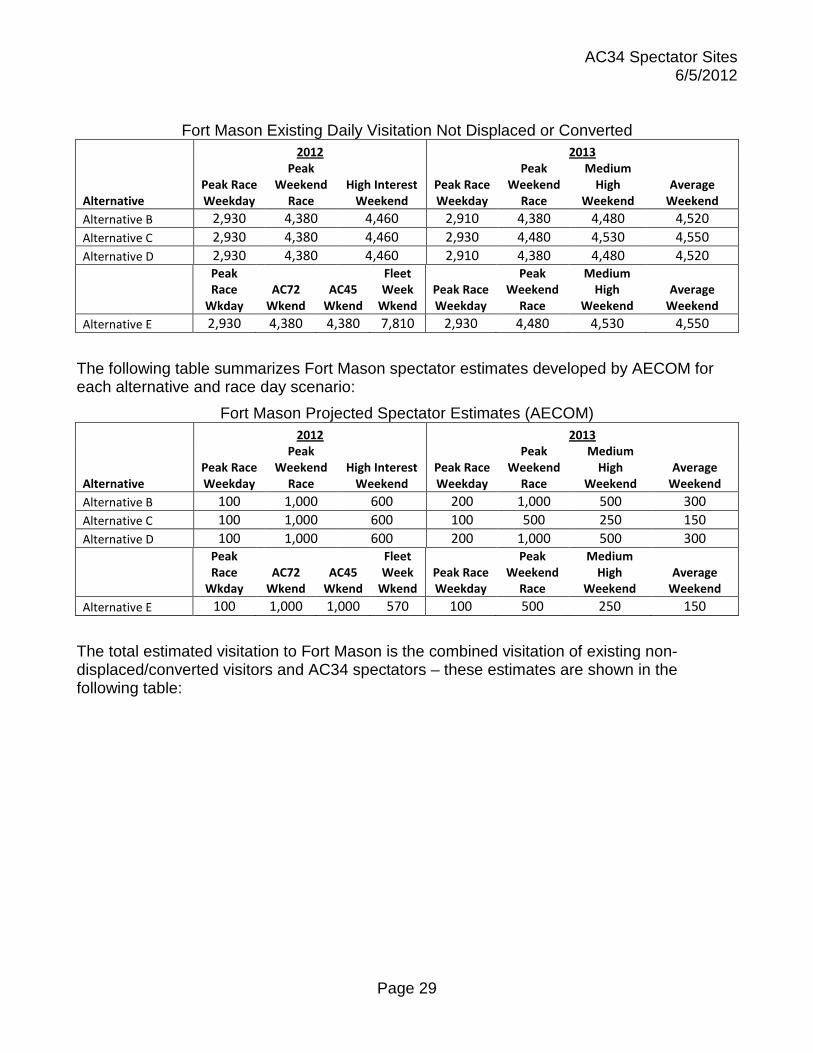
It is assumed that a portion of the existing visitation will be displaced to other locations or converted to AC34 visitors. For each alternative and race day scenario, the following table summarizes the amount of existing visitation to Fort Mason that will continue to visit (i.e., will not be displaced or converted), based on the displacement/conversion percentages previously summarized:
AC34 Spectator Sites 6/5/2012
Page 29
Fort Mason Existing Daily Visitation Not Displaced or Converted 2012 2013
Alternative Peak Race Weekday
Peak Weekend
Race High Interest
Weekend Peak Race Weekday
Peak Weekend
Race
Medium High
Weekend
Average
Weekend Alternative B 2,930 4,380 4,460 2,910 4,380 4,480 4,520 Alternative C 2,930 4,380 4,460 2,930 4,480 4,530 4,550 Alternative D 2,930 4,380 4,460 2,910 4,380 4,480 4,520
Peak Race
Wkday AC72
Wkend AC45
Wkend
Fleet Week
Wkend Peak Race Weekday
Peak Weekend
Race
Medium High
Weekend
Average
Weekend Alternative E 2,930 4,380 4,380 7,810 2,930 4,480 4,530 4,550
The following table summarizes Fort Mason spectator estimates developed by AECOM for each alternative and race day scenario:
Fort Mason Projected Spectator Estimates (AECOM) 2012 2013
Alternative Peak Race Weekday
Peak Weekend
Race High Interest
Weekend Peak Race Weekday
Peak Weekend
Race
Medium High
Weekend
Average
Weekend Alternative B 100 1,000 600 200 1,000 500 300 Alternative C 100 1,000 600 100 500 250 150 Alternative D 100 1,000 600 200 1,000 500 300
Peak Race
Wkday AC72
Wkend AC45
Wkend
Fleet Week
Wkend Peak Race Weekday
Peak Weekend
Race
Medium High
Weekend
Average
Weekend Alternative E 100 1,000 1,000 570 100 500 250 150
The total estimated visitation to Fort Mason is the combined visitation of existing non-displaced/converted visitors and AC34 spectators – these estimates are shown in the following table:

AC34 Spectator Sites 6/5/2012
Page 30
Fort Mason Total Visitation during AC34 Events 2012 2013
Alternative Peak Race Weekday
Peak Weekend
Race High Interest
Weekend Peak Race Weekday
Peak Weekend
Race
Medium High
Weekend
Average
Weekend Alternative B 3,030 5,380 5,060 3,110 5,380 4,980 4,820 Alternative C 3,030 5,380 5,060 3,030 4,980 4,780 4,700 Alternative D 3,030 5,380 5,060 3,110 5,380 4,980 4,820
Peak Race
Wkday AC72
Wkend AC45
Wkend
Fleet Week
Wkend Peak Race Weekday
Peak Weekend
Race
Medium High
Weekend
Average
Weekend Alternative E 3,030 5,380 5,380 8,380 3,030 4,980 4,780 4,700
“People at One Time” (PAOT) Estimates
PAOT estimates were developed from the data collected during the 2011 visitor use studies and the AC34 spectator projections. These estimates are summarized for each alternative and race day scenario at Ft. Mason in the following tables for the peak period of the day:
Ft. Mason 2011 PAOT (Peak Period of the Day) 2011 (Existing) Weekday Weekend Day Fleet Week 10/8/2011
PAOT 100 270 1,140 Level of Service B C E
Ft. Mason PAOT Estimates (Peak Period of the Day)
2012 2013
Alternative Peak Race Weekday
Peak Weekend
Race High Interest
Weekend Peak Race Weekday
Peak Weekend
Race
Medium High
Weekend Average
Weekend Alternative B
PAOT 160 860 620 220 860 520 390
Level of Service B F E C F E D Alternative C
PAOT 160 860 620 160 520 350 290
Level of Service B E E B E D C Alternative D
PAOT 160 860 620 220 860 520 390
Level of Service B F E C F E D
Peak Race
Wkday AC72
Wkend AC45
Wkend
Fleet Week
Wkend
Peak Race
Weekday
Peak Weekend
Race
Medium High
Weekend
Average
Weekend
Alternative E
PAOT 160 860 860 1,600 160 520 350 290
Level of Service B E E F B E D C

AC34 Spectator Sites 6/5/2012
Page 31
The figures in the above table indicates that the number of onsite visitors (PAOT) at Fort Mason will increase substantially over normal levels during the AC34 events – it is expected that available spectator areas within Ft. Mason will be highly used, but the spectator capacity of these areas is extremely limited. For Alternative B (Sponsor Proposed Project) and Alternative D, the onsite crowding conditions, based on projected PAOT levels, can be expected to reach LOS “F” for the 2012 and 2013 peak weekend race days, with corresponding significant increases in pedestrian/bicycle flow volumes to and from the site. For Alternative E (Preferred Alternative), LOS “E” is projected for the 2012 peak weekend race day. These levels compare to an estimated LOS D that was experienced for the 2011 Fleet Week Saturday at this location. The Great Meadow in Ft. Mason was heavily used by Fleet Week spectators, but this space will not provide suitable viewing capacity for AC34, so Ft. Mason’s spectator capacity will be considerably lower during AC34 than for Fleet Week. Although the PAOT’s during AC34 racing events are projected to increase substantially over normal levels, they will still be lower for Ft. Mason than was recorded on the Fleet Week Saturday (except for the 2012 Fleet Week days when PAOT’s will be higher than 2011), due to the spectator use of the Great Meadow that will not occur for AC34. Applying the PAOT (people at one time) figures corresponding to each level of service range (described in a previous section of this report) to the above PAOTs results in the level of service estimates for each existing and projected use scenario, as shown in the above table. The analysis indicates that LOS “D” was reached during Fleet Week 2011, LOS “F” can be expected for the 2012 and 2013 peak weekend race days for Alternatives B & D, LOS “F” can be expected for Alternative E on 2012 weekend days and LOS “E” on 2013 peak weekend days – note that spectator capacity was considerably higher for Fleet Week than it will be for AC34, due to the ability for people to view the Fleet Week air show from the Great Meadows. Clearly, access management will be needed at Ft. Mason Center to ensure that the limited capacities of the spectator areas are not overwhelmed. Pedestrian/bicycle flow estimates
Pedestrian and bicycle flow counts were collected at two locations within Ft. Mason (Promenade at the east end of Ft. Mason, and the Laguna sidewalk pinch point at the west end), along with PAOT counts for the Great Meadow. Golden Gate Promenade at east end of Ft. Mason: The following tables compare the existing and estimated daily pedestrian and bicycle flow counts on the Promenade at the east end of Ft. Mason, along with calculated levels of service for each alternative and race day scenario (assuming that 30% of the AC34 spectators projected for SAFR6
will pass through this location, with an additional “pass-through” traffic factor of 10%):
6 Note: the pedestrian/bike traffic at this location is assumed to be driven primarily by SAFR visitation, rather than by Ft. Mason visitation, as it is adjacent to SAFR.

AC34 Spectator Sites 6/5/2012
Page 32
GG Promenade at east end of Ft. Mason - 2011 Pedestrian/Bicycle Traffic 2011 (Existing) Weekday Weekend Day Fleet Week 10/8/2011 Daily Traffic 4,380 6,570 11,460 Peak Hour Traffic 580 760 1,660 Level of Service B B C % Bicyclists 40% 40% 14%
GG Promenade at east end of Ft. Mason - Pedestrian/Bicycle Hourly Flow Estimates
2012 2013
Alternative Peak Race Weekday
Peak Weekend
Race High Interest
Weekend Peak Race Weekday
Peak Weekend
Race
Medium High
Weekend Average
Weekend Alternative B
Hrly Peds/Bikes 630 1,040 920 650 1,360 1,070 810
Level of Service B C* C* C* C C* C* Alternative C Hrly Peds/Bikes 630 810 800 630 1,040 840 790
Level of Service B C* B B C* C* C* Alternative D
Hrly Peds/Bikes 810 1,160 980 620 1,120 1,010 830
Level of Service C* C* C* B C* C* C*
Peak Race
Wkday AC72
Wkend AC45
Wkend
Fleet Week
Wkend Peak Race Weekday
Peak Weekend
Race
Medium High
Weekend
Average
Weekend Alternative E
Hrly Peds/Bikes 810 1,160 1,160 1,700 650 1,360 1,110 910
Level of Service C* C* C* C C* C C* C* * Note: LOS C was adjusted to reflect the impacts of expected variations in the distribution of spectator, pedestrian and bicycle volumes from the analysis results, based on knowledge of situational conditions at this location – during special events, visitors tend to linger in this area, due to the opportunity for excellent viewing, creating more congestion than would normally be experienced for the indicated pedestrian/bike flow volumes.
The levels of service shown in the above table are based on the indicated hourly flow volumes and measured path width of 15.8 feet, along with the adjustments to the calculations as described in the above table. The pedestrian/bicycle volume ranges for each level of service at this location are shown in Appendix 2. The above table indicates that the traffic volumes are similar, but somewhat higher than, the Promenade traffic volumes at the west end of SAFR. This is likely due to the merging of pedestrian and bicycle traffic to & from the Van Ness area onto the Promenade to Ft. Mason. The Promenade at the east side of Ft. Mason is expected to operate at LOS “C” for most AC34 alternatives and scenarios, necessitating some management action, including staffing of crowd control personnel, to ensure that traffic continues to flow acceptably in this area.
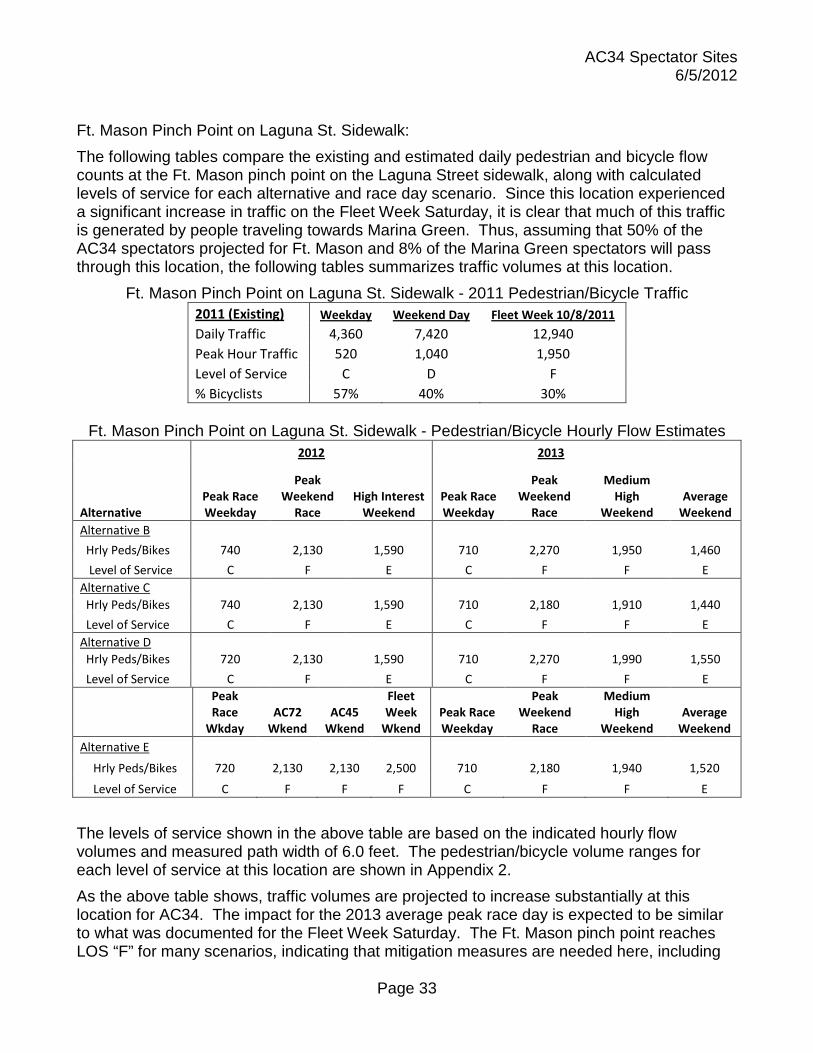
AC34 Spectator Sites 6/5/2012
Page 33
Ft. Mason Pinch Point on Laguna St. Sidewalk: The following tables compare the existing and estimated daily pedestrian and bicycle flow counts at the Ft. Mason pinch point on the Laguna Street sidewalk, along with calculated levels of service for each alternative and race day scenario. Since this location experienced a significant increase in traffic on the Fleet Week Saturday, it is clear that much of this traffic is generated by people traveling towards Marina Green. Thus, assuming that 50% of the AC34 spectators projected for Ft. Mason and 8% of the Marina Green spectators will pass through this location, the following tables summarizes traffic volumes at this location.
Ft. Mason Pinch Point on Laguna St. Sidewalk - 2011 Pedestrian/Bicycle Traffic 2011 (Existing) Weekday Weekend Day Fleet Week 10/8/2011 Daily Traffic 4,360 7,420 12,940 Peak Hour Traffic 520 1,040 1,950 Level of Service C D F % Bicyclists 57% 40% 30%
Ft. Mason Pinch Point on Laguna St. Sidewalk - Pedestrian/Bicycle Hourly Flow Estimates
2012 2013
Alternative Peak Race Weekday
Peak Weekend
Race High Interest
Weekend Peak Race Weekday
Peak Weekend
Race
Medium High
Weekend Average
Weekend Alternative B
Hrly Peds/Bikes 740 2,130 1,590 710 2,270 1,950 1,460
Level of Service C F E C F F E Alternative C
Hrly Peds/Bikes 740 2,130 1,590 710 2,180 1,910 1,440
Level of Service C F E C F F E Alternative D
Hrly Peds/Bikes 720 2,130 1,590 710 2,270 1,990 1,550
Level of Service C F E C F F E
Peak Race
Wkday AC72
Wkend AC45
Wkend
Fleet Week
Wkend Peak Race Weekday
Peak Weekend
Race
Medium High
Weekend
Average
Weekend Alternative E
Hrly Peds/Bikes 720 2,130 2,130 2,500 710 2,180 1,940 1,520
Level of Service C F F F C F F E
The levels of service shown in the above table are based on the indicated hourly flow volumes and measured path width of 6.0 feet. The pedestrian/bicycle volume ranges for each level of service at this location are shown in Appendix 2. As the above table shows, traffic volumes are projected to increase substantially at this location for AC34. The impact for the 2013 average peak race day is expected to be similar to what was documented for the Fleet Week Saturday. The Ft. Mason pinch point reaches LOS “F” for many scenarios, indicating that mitigation measures are needed here, including
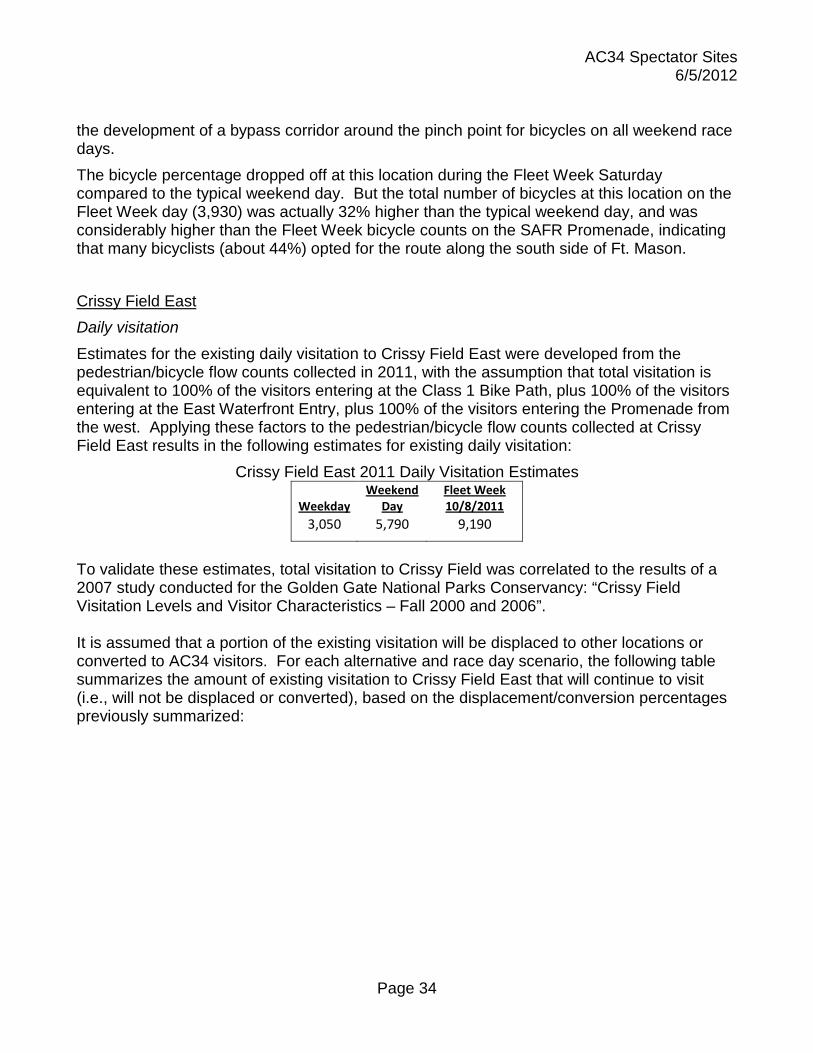
AC34 Spectator Sites 6/5/2012
Page 34
the development of a bypass corridor around the pinch point for bicycles on all weekend race days. The bicycle percentage dropped off at this location during the Fleet Week Saturday compared to the typical weekend day. But the total number of bicycles at this location on the Fleet Week day (3,930) was actually 32% higher than the typical weekend day, and was considerably higher than the Fleet Week bicycle counts on the SAFR Promenade, indicating that many bicyclists (about 44%) opted for the route along the south side of Ft. Mason. Crissy Field East Daily visitation
Estimates for the existing daily visitation to Crissy Field East were developed from the pedestrian/bicycle flow counts collected in 2011, with the assumption that total visitation is equivalent to 100% of the visitors entering at the Class 1 Bike Path, plus 100% of the visitors entering at the East Waterfront Entry, plus 100% of the visitors entering the Promenade from the west. Applying these factors to the pedestrian/bicycle flow counts collected at Crissy Field East results in the following estimates for existing daily visitation:
Crissy Field East 2011 Daily Visitation Estimates
Weekday Weekend
Day Fleet Week 10/8/2011
3,050 5,790 9,190
To validate these estimates, total visitation to Crissy Field was correlated to the results of a 2007 study conducted for the Golden Gate National Parks Conservancy: “Crissy Field Visitation Levels and Visitor Characteristics – Fall 2000 and 2006”. It is assumed that a portion of the existing visitation will be displaced to other locations or converted to AC34 visitors. For each alternative and race day scenario, the following table summarizes the amount of existing visitation to Crissy Field East that will continue to visit (i.e., will not be displaced or converted), based on the displacement/conversion percentages previously summarized:
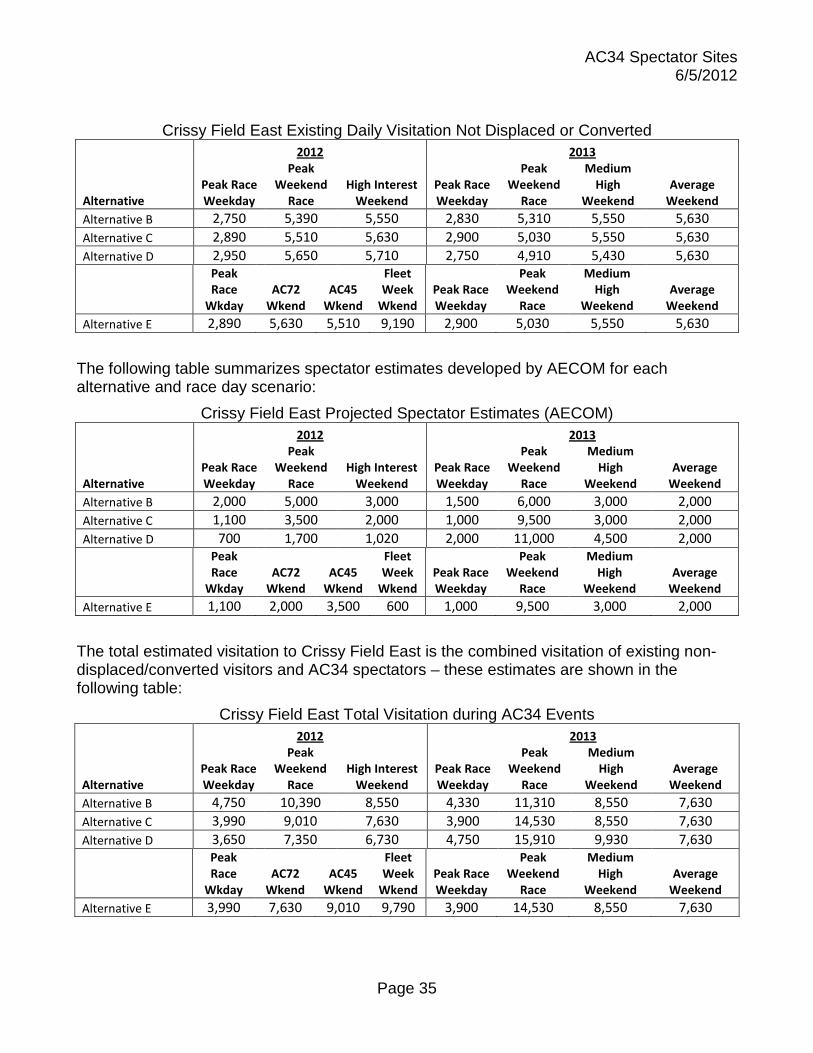
AC34 Spectator Sites 6/5/2012
Page 35
Crissy Field East Existing Daily Visitation Not Displaced or Converted 2012 2013
Alternative Peak Race Weekday
Peak Weekend
Race High Interest
Weekend Peak Race Weekday
Peak Weekend
Race
Medium High
Weekend
Average
Weekend Alternative B 2,750 5,390 5,550 2,830 5,310 5,550 5,630 Alternative C 2,890 5,510 5,630 2,900 5,030 5,550 5,630 Alternative D 2,950 5,650 5,710 2,750 4,910 5,430 5,630
Peak Race
Wkday AC72
Wkend AC45
Wkend
Fleet Week
Wkend Peak Race Weekday
Peak Weekend
Race
Medium High
Weekend
Average
Weekend Alternative E 2,890 5,630 5,510 9,190 2,900 5,030 5,550 5,630
The following table summarizes spectator estimates developed by AECOM for each alternative and race day scenario:
Crissy Field East Projected Spectator Estimates (AECOM) 2012 2013
Alternative Peak Race Weekday
Peak Weekend
Race High Interest
Weekend Peak Race Weekday
Peak Weekend
Race
Medium High
Weekend
Average
Weekend Alternative B 2,000 5,000 3,000 1,500 6,000 3,000 2,000 Alternative C 1,100 3,500 2,000 1,000 9,500 3,000 2,000 Alternative D 700 1,700 1,020 2,000 11,000 4,500 2,000
Peak Race
Wkday AC72
Wkend AC45
Wkend
Fleet Week
Wkend Peak Race Weekday
Peak Weekend
Race
Medium High
Weekend
Average
Weekend Alternative E 1,100 2,000 3,500 600 1,000 9,500 3,000 2,000
The total estimated visitation to Crissy Field East is the combined visitation of existing non-displaced/converted visitors and AC34 spectators – these estimates are shown in the following table:
Crissy Field East Total Visitation during AC34 Events 2012 2013
Alternative Peak Race Weekday
Peak Weekend
Race High Interest
Weekend Peak Race Weekday
Peak Weekend
Race
Medium High
Weekend
Average
Weekend Alternative B 4,750 10,390 8,550 4,330 11,310 8,550 7,630 Alternative C 3,990 9,010 7,630 3,900 14,530 8,550 7,630 Alternative D 3,650 7,350 6,730 4,750 15,910 9,930 7,630
Peak Race
Wkday AC72
Wkend AC45
Wkend
Fleet Week
Wkend Peak Race Weekday
Peak Weekend
Race
Medium High
Weekend
Average
Weekend Alternative E 3,990 7,630 9,010 9,790 3,900 14,530 8,550 7,630

AC34 Spectator Sites 6/5/2012
Page 36
“People at One Time” (PAOT) Estimates
PAOT estimates were developed from the data collected during the 2011 visitor use studies and the AC34 spectator projections. These estimates are summarized for each alternative and race day scenario at Crissy Field East in the following tables for the peak period of the day:
Crissy Field East 2011 PAOT (Peak Period of the Day) 2011 (Existing) Weekday Weekend Day Fleet Week 10/8/2011
PAOT 150 360 3,840 Level of Service A A D
Crissy Field East PAOT Estimates (Peak Period of the Day)
2012 2013
Alternative Peak Race Weekday
Peak Weekend
Race High Interest
Weekend Peak Race Weekday
Peak Weekend
Race
Medium High
Weekend Average
Weekend Alternative B
PAOT 1,480 3,660 2,340 1,150 4,370 2,350 1,670
Level of Service C* D C C* E C C* Alternative C
PAOT 880 2,670 1,680 810 6,710 2,320 1,650
Level of Service B* D C* B* E C C Alternative D
PAOT 610 1,480 1,030 1,480 7,710 3,330 1,640
Level of Service A C* B C* E D C*
Peak Race Wkday
AC72 Wkend
AC45 Wkend
Fleet Week
Wkend Peak Race Weekday
Peak Weekend
Race
Medium High
Weekend
Average
Weekend
Alternative E
PAOT 880 2,670 1,680 4,320 810 6,710 2,320 1,650
Level of Service B* D C* E B* E C C* * Note: the indicated levels of service A through C were adjusted to reflect the impacts of expected variations in the distribution of spectator, pedestrian and bicycle volumes from the analysis results,, based on knowledge of situational conditions at this location – major events at Crissy Field or Marina Green invariably draw additional crowding levels that warrant management measures, even at lower visitation levels.
The figures in the above table indicate that the number of onsite visitors (PAOT) at Crissy Field East will increase substantially over typical levels for the peak race days during the AC34 events. Conditions on the peak race days are projected to be significantly higher than those experienced during Fleet Week, due to the desirable race viewing conditions and proximity to Marina Green. For most alternatives, the onsite crowding conditions, based on projected PAOT levels, can be expected to reach LOS “D” for the 2012 peak weekend race day and LOS “E” for the 2013 peak weekend race days, with corresponding increases in pedestrian/bicycle flow volumes to

AC34 Spectator Sites 6/5/2012
Page 37
and from the site. These levels compare to an estimated LOS “D” that was experienced for the 2011 Fleet Week Saturday at this location. Applying the PAOT figures for each level of service range (described in a previous section of this report) to the above PAOTs indicates that LOS “D” will be reached for most scenarios on the 2012 peak weekend race day, and LOS “E” will be reached on the 2013 peak weekend race day. Pedestrian/bicycle flow estimates
Pedestrian and bicycle flow counts were collected at three locations within Crissy Field East (east end of the Class 1 bike lane, east waterfront path, and on the Promenade near the east side of the wetlands). Crissy Field East Class 1 Path: The following tables compare the existing and estimated daily pedestrian and bicycle flow counts on the Class 1 Path entry to Crissy Field East, along with calculated levels of service for each alternative and race day scenario (assuming that 80%7
Crissy Field East Class 1 Path - 2011 Pedestrian/Bicycle Traffic
of the AC34 spectators projected for Crissy Field East and 30% for Crissy Field West will pass by this location):
2011 (Existing) Weekday Weekend Day Fleet Week 10/8/2011 Daily Traffic 3,030 5,340 10,150 Peak Hour Traffic 330 710 1,420 Level of Service A B C % Bicyclists 60% 52% 46%
7 Based on the traffic patterns documented for Fleet Week, it was estimated that the majority of spectators at Crissy Field East will pass through the Class 1 Path.

AC34 Spectator Sites 6/5/2012
Page 38
Crissy Field East Class 1 Path - Pedestrian/Bicycle Hourly Flow Estimates 2012 2013
Alternative Peak Race Weekday
Peak Weekend
Race High Interest
Weekend Peak Race Weekday
Peak Weekend
Race
Medium High
Weekend Average
Weekend Alternative B
Hrly Peds/Bikes 760 3,530 2,390 1,360 7,540 3,570 2,040
Level of Service B D C C* E D C* Alternative C Hrly Peds/Bikes 440 1,890 1,390 700 4,180 1,750 1,320
Level of Service A C* C* B D C* B Alternative D
Hrly Peds/Bikes 350 1,210 1,000 1,040 5,420 2,600 1,520
Level of Service A B B B E C C*
Peak Race
Wkday AC72
Wkend AC45
Wkend
Fleet Week
Wkend Peak Race Weekday
Peak Weekend
Race
Medium High
Weekend
Average
Weekend Alternative E
Hrly Peds/Bikes 430 1,890 1,240 2,430 690 4,180 1,750 1,370
Level of Service A C* B C B D C* C* * Note: the lower end of the range for LOS C was reduced to 1,360 to reflect the impacts of expected variations in the distribution of spectator, pedestrian and bicycle volumes from the analysis results, based on knowledge of situational conditions at this location – due to the proximity of this location to Marina Green, it experiences significant spillover visitation, especially when Marina Green becomes crowded and many visitors seek less crowded conditions at Crissy Field.
The levels of service shown in the above table are based on the indicated hourly flow volumes and measured path width of 25 feet, along with the adjustments to the calculations as described in the above table. The pedestrian/bicycle volume ranges for each level of service at this location are shown in Appendix 2. As the above table shows, traffic volumes will increase substantially over typical levels at this location for AC34, with the expectation that 30% of the Crissy Field West spectators and 80% if the Crissy Field East spectators will take this route. The impact for the 2012 and 2013 peak weekend race days is projected to be higher than the 2011 Fleet Week Saturday – this reflects the expectation for higher AC34 spectator numbers at Crissy Field than were experienced at Fleet Week. LOS “E” is expected to be reached for the 2013 peak weekend race day for Alts B & E. LOS “D” is expected for 2013 peak weekend race days for Alts C & E, and for the 2012 peak weekend race day for Alt B. Crissy Field East Waterfront Entry: The following tables compare the existing and estimated daily pedestrian and bicycle flow counts on the east waterfront entry to Crissy Field East, near the Crissy Field Center, along with calculated levels of service for each alternative and race day scenario (assuming that 20% of the AC34 spectators projected for Crissy Field East will pass by this location):

AC34 Spectator Sites 6/5/2012
Page 39
Crissy Field East Waterfront Entry - 2011 Pedestrian/Bicycle Traffic 2011 (Existing) Weekday Weekend Day Fleet Week 10/8/2011 Daily Traffic 2,160 4,840 3,560 Peak Hour Traffic 270 600 440 Level of Service A B B % Bicyclists 29% 18% 29%
Crissy Field East Waterfront Entry - Pedestrian/Bicycle Hourly Flow Estimates
2012 2013
Alternative Peak Race Weekday
Peak Weekend
Race High Interest
Weekend Peak Race Weekday
Peak Weekend
Race
Medium High
Weekend Average
Weekend Alternative B
Hrly Peds/Bikes 360 830 740 330 960 760 700
Level of Service B* C* B B* C B B Alternative C Hrly Peds/Bikes 300 760 690 300 1160 730 670
Level of Service A B B A C* B B Alternative D
Hrly Peds/Bikes 280 680 650 360 1250 840 700
Level of Service A B B B* C* C* B
Peak Race
Wkday AC72
Wkend AC45
Wkend
Fleet Week
Wkend Peak Race Weekday
Peak Weekend
Race
Medium High
Weekend
Average
Weekend Alternative E
Hrly Peds/Bikes 300 760 690 890 300 1,160 740 700
Level of Service A B B C* A C* B B * Note: the range for LOS B was reduced to 360-829 and the lower end of the range for LOS C was reduced to 830 to reflect the impacts of expected variations in the distribution of spectator, pedestrian and bicycle volumes from the analysis results, based on knowledge of situational conditions at this location – due to the proximity of this location to Marina Green, it experiences significant spillover visitation, especially when Marina Green becomes crowded and many visitors seek less crowded conditions at Crissy Field.
The levels of service shown in the above table are based on the indicated hourly flow volumes and measured path width of 25 feet. The pedestrian/bicycle volume ranges for each level of service at this location are shown in Appendix 2. The previous table shows an increase in traffic volumes for the AC34 race days, although there was actually a decrease at this location for the Fleet Week Saturday – this is likely due to the filling of parking capacity in this vicinity on that day, so that this access route to Crissy Field was less convenient to most visitors than the Class 1 Path. It is expected that LOS “C” will be reached for the 2013 peak weekend race day for all alternatives. Crissy Field East Promenade at Wetlands: The following tables compare the existing and estimated daily pedestrian and bicycle flow counts on the Promenade near the Wetlands, along with calculated levels of service for each

AC34 Spectator Sites 6/5/2012
Page 40
alternative and race day scenario (assuming that 10% of the AC34 spectators projected for Crissy Field East and 10% of Crissy Field West will pass through this location):
Crissy Field East Promenade at Wetlands - 2011 Pedestrian/Bicycle Traffic 2011 (Existing) Weekday Weekend Day Fleet Week 10/8/2011 Daily Traffic 3,500 6,500 5,520 Peak Hour Traffic 440 820 720 Level of Service A B B % Bicyclists 25% 19% 24%
Crissy Field East Promenade at Wetlands - Pedestrian/Bicycle Hourly Flow Estimates
2012 2013
Alternative Peak Race Weekday
Peak Weekend
Race High Interest
Weekend Peak Race Weekday
Peak Weekend
Race
Medium High
Weekend Average
Weekend Alternative B
Hrly Peds/Bikes 540 1,360 1,140 590 2,690 1,550 1,110
Level of Service B* C* C* B* C C* C* Alternative C Hrly Peds/Bikes 460 930 890 460 1,330 920 840
Level of Service A B B A C* B B Alternative D
Hrly Peds/Bikes 460 860 860 460 1,640 1,120 940
Level of Service A B B A C* C* B
Peak Race
Wkday AC72
Wkend AC45
Wkend
Fleet Week
Wkend Peak Race Weekday
Peak Weekend
Race
Medium High
Weekend
Average
Weekend Alternative E
Hrly Peds/Bikes 460 930 840 1010 460 1330 940 890
Level of Service A B B B A C* B B * Note: he range for LOS B was reduced to 540-1109 and the lower end of the range for LOS C was reduced to 1110 to reflect the impacts of expected variations in the distribution of spectator, pedestrian and bicycle volumes from the analysis results, based on knowledge of situational conditions at this location – due to the proximity of this location to Marina Green, it experiences significant spillover visitation, especially when Marina Green becomes crowded and many visitors seek less crowded conditions at Crissy Field.
The levels of service shown in the above table are based on the indicated hourly flow volumes and measured path width of 25 feet, along with the adjustments to the calculations as described in the above table. The pedestrian/bicycle volume ranges for each level of service at this location are shown in Appendix 2. The above table indicates an increase in traffic volumes for the AC34 race days, although there was actually a decrease at this location for the Fleet Week Saturday – this is due to the fact that many spectators were unwilling to walk the long distances across Crissy Field, as evidenced by the low Fleet Week numbers. For AC34, it is assumed that this will be offset by

AC34 Spectator Sites 6/5/2012
Page 41
the favorable viewing areas available along the beach in this area. It is expected that LOS “C” will be reached for the 2013 peak weekend race day for all alternatives. Crissy Field West Daily visitation
Estimates for the existing daily visitation to Crissy Field West were developed from the pedestrian/bicycle flow counts collected in 2011 with the assumptions that existing visitation is equivalent to 20% of the traffic entering from the Class 1 path, plus 20% of the traffic entering on the Promenade from the east, plus 20% of the traffic entering on the Promenade from the west, plus 2% of the traffic passing through the Mason-Crissy-McDowell intersection. Applying these factors to the pedestrian/bicycle flow counts collected at Crissy Field West results in the following estimates for existing daily visitation:
Crissy Field West 2011 Daily Visitation Estimates
Weekday Weekend
Day Fleet Week 10/8/2011
1,170 2,100 3,410 To validate these estimates, total visitation to Crissy Field was correlated to the results of a 2007 study conducted for the Golden Gate National Parks Conservancy: “Crissy Field Visitation Levels and Visitor Characteristics – Fall 2000 and 2006”. It is assumed that a portion of the existing visitation will be displaced to other locations or converted to AC34 visitors. For each alternative and race day scenario, the following table summarizes the amount of existing visitation to Crissy Field West that will continue to visit (i.e., will not be displaced or converted), based on the displacement/conversion percentages previously summarized:
Crissy Field West Existing Daily Visitation Not Displaced or Converted
2012 2013
Alternative Peak Race Weekday
Peak Weekend
Race High Interest
Weekend Peak Race Weekday
Peak Weekend
Race
Medium High
Weekend
Average
Weekend Alternative B 1,090 1,910 1,990 1,050 1,480 1,850 2,000 Alternative C 1,150 2,060 2,080 1,150 1,980 2,060 2,080 Alternative D 1,170 2,090 2,090 1,140 1,890 2,010 2,060
Peak Race
Wkday AC72
Wkend AC45
Wkend
Fleet Week
Wkend Peak Race Weekday
Peak Weekend
Race
Medium High
Weekend
Average
Weekend Alternative E 1,150 2,090 2,060 3,410 1,150 1,990 2,060 2,080
The following table summarizes spectator estimates developed by AECOM for each alternative and race day scenario:

AC34 Spectator Sites 6/5/2012
Page 42
Crissy Field West Projected Spectator Estimates (AECOM) 2012 2013
Alternative Peak Race Weekday
Peak Weekend
Race High Interest
Weekend Peak Race Weekday
Peak Weekend
Race
Medium High
Weekend
Average
Weekend Alternative B 4,000 15,000 9,000 6,000 50,000 20,000 8,000 Alternative C 1,100 3,500 2,000 1,000 9,500 3,000 2,000 Alternative D 200 900 540 1,750 17,000 7,000 3,000
Peak Race
Wkday AC72
Wkend AC45
Wkend
Fleet Week
Wkend Peak Race Weekday
Peak Weekend
Race
Medium High
Weekend
Average
Weekend Alternative E 1,100 500 3,000 190 900 9,000 3,000 1,500
The total estimated visitation to Crissy Field West is the combined visitation of existing non-displaced/converted visitors and AC34 spectators – these estimates are shown in the following table:
Crissy Field West Total Visitation during AC34 Events 2012 2013
Alternative Peak Race Weekday
Peak Weekend
Race High Interest
Weekend Peak Race Weekday
Peak Weekend
Race
Medium High
Weekend
Average
Weekend Alternative B 5,090 16,910 10,990 7,050 51,480 21,850 10,000 Alternative C 2,250 5,560 4,080 2,150 11,480 5,060 4,080 Alternative D 1,370 2,990 2,630 2,890 18,890 9,010 5,060
Peak Race
Wkday AC72
Wkend AC45
Wkend
Fleet Week
Wkend Peak Race Weekday
Peak Weekend
Race
Medium High
Weekend
Average
Weekend Alternative E 2,250 2,590 5,060 3,600 2,050 10,990 5,060 3,580
“People at One Time” (PAOT) Estimates
PAOT estimates were developed from the data collected during the 2011 visitor use studies and the AC34 spectator projections. These estimates are summarized for each alternative and race day scenario at Crissy Field West in the following tables for the peak period of the day:
Crissy Field West 2011 PAOT (Peak Period of the Day) 2011 (Existing) Weekday Weekend Day Fleet Week 10/8/2011
PAOT 100 330 1,070 Level of Service A A A

AC34 Spectator Sites 6/5/2012
Page 43
Crissy Field West PAOT Estimates (Peak Period of the Day) 2012 2013
Alternative
Peak Race
Weekday
Peak Weekend
Race High Interest
Weekend
Peak Race
Weekday
Peak Weekend
Race
Medium High
Weekend Average
Weekend Alternative B
PAOT 2,790 10,350 6,320 4,140 33,920 13,670 5,570
Level of Service C* D C C F D C Alternative C
PAOT 780 2,290 1,550 780 6,330 2,280 1,270
Level of Service A C* B* A C C* B* Alternative D
PAOT 240 890 660 1,280 11,720 4,970 2,270
Level of Service A A A B* D C B
Peak Race Wkday
AC72 Wkend
AC45 Wkend
Fleet Week
Wkend Peak Race Weekday
Peak Weekend
Race
Medium High
Weekend
Average
Weekend
Alternative E
PAOT 780 2,290 630 2,440 710 6,330 2,280 1,270
Level of Service A C* A C A C C* B* * Note: levels of service A through C were adjusted to reflect the impacts of expected variations in the distribution of PAOT volumes from the analysis results, based on knowledge of situational conditions at this location – it is anticipated that visitor crowds during AC34 will be concentrated in the east Promenade and beach areas, due to the excellent viewing conditions there.
The figures in the above tables indicate that the number of onsite visitors (PAOT) at Crissy Field West will increase substantially over typical levels during the AC34 events – as much as 100 times higher on the 2013 Peak Weekend Race Day for Alternative A. Crowding will also be significantly higher than was documented on the Fleet Week Saturday, as this area experienced low usage by spectators during Fleet Week. For Alternative B (Sponsor Proposed Project), the onsite crowding conditions, based on projected PAOT levels, can be expected to reach LOS “D” for the 2012 peak weekend race day and LOS “F” for the 2013 peak weekend race days; for Alternative E (Preferred Alternative), LOS “C” can be expected on weekend days in both 2012 and 2013. These levels compare to an estimated LOS “A” that was experienced for the 2011 Fleet Week Saturday at this location. The significant impacts projected for this location indicate that visitation management measures will need to be implemented. Applying the PAOT figures for each level of service range (described in a previous section of this report) to the above PAOTs indicates that, for Alternative E, LOS (LOS) “A” will be maintained on race weekdays and LOS “C” will be reached on the peak and medium weekend race days in 2012 and 2013. For Alt B, LOS “F” is expected for the 2013 peak weekend race day.

AC34 Spectator Sites 6/5/2012
Page 44
Pedestrian/bicycle flow estimates
Pedestrian and bicycle flow counts were collected at two locations along the Crissy Field West Promenade (at the east and west ends of the old airfield). Crissy Field West Promenade: The following tables compare the existing and estimated daily pedestrian and bicycle flow counts on the Promenade at the east end of the airfield within Crissy Field West, along with calculated levels of service for each alternative and race day scenario (assuming that 15% of the AC34 spectators projected for Crissy Field West will pass through this location):
Crissy Field West Promenade (East End of Airfield) - 2011 Pedestrian/Bicycle Traffic 2011 (Existing) Weekday Weekend Day Fleet Week 10/8/2011 Daily Traffic 2,740 4,790 2,740 Peak Hour Traffic 310 630 950 Level of Service A B B % Bicyclists 27% 28% 16%
Crissy Field West Promenade (East End of Airfield) - Ped/Bicycle Hourly Flow Estimates
2012 2013
Alternative Peak Race Weekday
Peak Weekend
Race High Interest
Weekend Peak Race Weekday
Peak Weekend
Race
Medium High
Weekend Average
Weekend Alternative B
Hrly Peds/Bikes 470 1,200 930 580 2,930 1,400 790
Level of Service A C* B B D C* B Alternative C Hrly Peds/Bikes 340 690 660 340 950 680 660
Level of Service A B B A C* B B Alternative D
Hrly Peds/Bikes 320 640 640 380 1,340 840 690
Level of Service A B B A C* B B
Peak Race
Wkday AC72
Wkend AC45
Wkend
Fleet Week
Wkend Peak Race Weekday
Peak Weekend
Race
Medium High
Weekend
Average
Weekend Alternative E
Hrly Peds/Bikes 350 690 660 960 340 950 690 650
Level of Service A B B C* A C* B B * Note: the lower end of the range for LOS C was reduced to 950 to reflect the impacts of expected variations in the distribution of spectator, pedestrian and bicycle volumes from the analysis results, based on knowledge of situational conditions at this location – due to the proximity of this location to Marina Green, it experiences significant spillover visitation, especially when Marina Green becomes crowded and many visitors seek less crowded conditions at Crissy Field.
The levels of service shown in the above table are based on the indicated hourly flow volumes and measured path width of 22 feet, along with the adjustments to the calculations

AC34 Spectator Sites 6/5/2012
Page 45
as described in the above table. The pedestrian/bicycle volume ranges for each level of service at this location are shown in Appendix 2. As the above table shows, traffic volumes are expected to increase substantially at this location for the Alternative B 2013 peak weekend race day, due to the high AC34 spectator estimates for Crissy Field West. Volumes also increase for the other alternatives and scenarios, but the impacts are less. Traffic actually decreased on the Fleet Week Saturday from typical weekend levels, primarily because spectator use of Crissy Field West was low for Fleet Week, and cross-traffic between Crissy Field East and West was low. For the 2013 peak weekend race day, LOS “D” is expected for Alt B, and LOS “C” for the other alternatives. Crissy Field West Promenade (West End of Airfield): The following tables compare the existing and estimated daily pedestrian and bicycle flow counts on the Promenade at the east end of the airfield within Crissy Field West, along with calculated levels of service for each alternative and race day scenario (assuming that 30% of the AC34 spectators projected for Crissy Field West will pass through this location):
Crissy Field West Promenade (West End of Airfield) – 2011 Pedestrian/Bicycle Traffic
2011 (Existing) Weekday Weekend Day Fleet Week 10/8/2011 Daily Traffic 2,410 4,600 5,560 Peak Hour Traffic 270 580 840 Level of Service A B B % Bicyclists 28% 19% 16%
Crissy Field West Promenade (West End of Airfield) –
Pedestrian/Bicycle Hourly Flow Estimates 2012 2013
Alternative Peak Race Weekday
Peak Weekend
Race High Interest
Weekend Peak Race Weekday
Peak Weekend
Race Medium High
Weekend Average
Weekend
Alternative B
Hrly Peds/Bikes 620 2,030 1,440 830 5,590 2,490 1,250
Level of Service B C B B E C B
Alternative C
Hrly Peds/Bikes 350 860 750 350 1,470 850 700
Level of Service A B B A C B B
Alternative D
Hrly Peds/Bikes 290 650 620 410 2,270 1,250 850
Level of Service A B B B C B B
Peak Race Wkday
AC72 Wkend
AC45 Wkend
Fleet Week
Wkend Peak Race Weekday
Peak Weekend Race
Medium High Weekend
Average
Weekend
Alternative E
Hrly Peds/Bikes 350 860 610 920 340 1,470 850 710
Level of Service A B B B A C B B

AC34 Spectator Sites 6/5/2012
Page 46
The levels of service shown in the above table are based on the indicated hourly flow volumes and measured path width of 22 feet. The pedestrian/bicycle volume ranges for each level of service at this location are shown in Appendix 2. As the above table shows, traffic volumes are expected to increase substantially at this location for the Alternative B peak weekend race day, due to the high AC34 spectator estimates for Crissy Field West. Volumes also increase for the other alternatives and scenarios, but the impacts are less. Traffic was slightly higher on the Fleet Week Saturday over typical weekend levels, primarily because spectator use of Crissy Field West was low for Fleet Week. For the 2013 peak weekend race day, LOS “E” is expected for Alt B and LOS “C” for all other alternatives. Crissy West Picnic Area The Crissy West Picnic Area is defined as the area including the picnic area west of Crissy Field and Warming Hut area, including the beach and Torpedo Wharf. Daily visitation
Estimates for the existing daily visitation to Crissy West Picnic Area were developed from the pedestrian/bicycle flow counts collected in 2011 with the assumptions that visitation is equivalent to 80% of the traffic entering the Promenade to the east and west. Applying these factors to the pedestrian/bicycle flow counts collected at Crissy West Picnic Area results in the following estimates for existing daily visitation:
Crissy West Picnic Area 2011 Daily Visitation Estimates
Weekday Weekend
Day Fleet Week 10/8/2011
1,300 2,560 3,560
To validate these estimates, total visitation to Crissy Field was correlated to the results of a 2007 study conducted for the Golden Gate National Parks Conservancy: “Crissy Field Visitation Levels and Visitor Characteristics – Fall 2000 and 2006”. It is assumed that a portion of the existing visitation will be displaced to other locations or converted to AC34 visitors. For each alternative and race day scenario, the following table summarizes the amount of existing visitation to Crissy West Picnic Area that will continue to visit (i.e., will not be displaced or converted), based on the displacement/conversion percentages previously summarized:

AC34 Spectator Sites 6/5/2012
Page 47
Crissy West Picnic Area Existing Daily Visitation Not Displaced or Converted 2012 2013
Alternative Peak Race Weekday
Peak Weekend
Race High Interest
Weekend Peak Race Weekday
Peak Weekend
Race
Medium High
Weekend
Average
Weekend Alternative B 1,180 2,430 2,480 1,180 2,250 2,430 2,500 Alternative C 1,250 2,520 2,540 1,280 2,470 2,530 2,550 Alternative D 1,280 2,540 2,550 1,240 2,400 2,500 2,530
Peak Race
Wkday AC72
Wkend AC45
Wkend
Fleet Week
Wkend Peak Race Weekday
Peak Weekend
Race
Medium High
Weekend
Average
Weekend Alternative E 1,250 2,540 2,520 3,560 1,280 2,470 2,530 2,550
The following table summarizes spectator estimates developed by AECOM for each alternative and race day scenario:
Crissy West Picnic Area Projected Spectator Estimates (AECOM) 2012 2013
Alternative Peak Race Weekday
Peak Weekend
Race High Interest
Weekend Peak Race Weekday
Peak Weekend
Race
Medium High
Weekend
Average
Weekend Alternative B 500 2,000 1,200 500 5,000 2,000 1,000 Alternative C 200 600 360 100 1,500 400 200 Alternative D 100 350 210 250 2,500 1,000 500
Peak Race
Wkday AC72
Wkend AC45
Wkend
Fleet Week
Wkend Peak Race Weekday
Peak Weekend
Race
Medium High
Weekend
Average
Weekend Alternative E 200 350 600 200 100 1,500 400 200
The total estimated visitation to Crissy West Picnic Area is the combined visitation of existing non-displaced/converted visitors and AC34 spectators – these estimates are shown in the following table:
Crissy West Picnic Area Total Visitation during AC34 Events 2012 2013
Alternative Peak Race Weekday
Peak Weekend
Race High Interest
Weekend Peak Race Weekday
Peak Weekend
Race
Medium High
Weekend
Average
Weekend Alternative B 1,680 4,430 3,680 1,680 7,250 4,430 3,500 Alternative C 1,450 3,120 2,900 1,380 3,970 2,930 2,750 Alternative D 1,380 2,890 2,760 1,490 4,900 3,500 3,030
Peak Race
Wkday AC72
Wkend AC45
Wkend
Fleet Week
Wkend Peak Race Weekday
Peak Weekend
Race
Medium High
Weekend
Average
Weekend Alternative E 1,450 2,890 3,120 3,760 1,380 3,970 2,930 2,750

AC34 Spectator Sites 6/5/2012
Page 48
Since spectator projections were not developed specifically for Ft. Point, the above visitation estimates are assumed to represent the combined area of the Crissy West Picnic Area and Ft. Point. “People at One Time” (PAOT) Estimates
PAOT estimates were developed from the data collected during the 2011 visitor use studies and the AC34 spectator projections. These estimates are summarized for each alternative and race day scenario at the Crissy West Picnic Area in the following tables for the peak period of the day:
Crissy West Picnic Area 2011 PAOT (Peak Period of the Day) 2011 (Existing) Weekday Weekend Day Fleet Week 10/8/2011
PAOT 180 530 1,160 Level of Service A B C
Crissy West Picnic Area PAOT Estimates (Peak Period of the Day)
2012 2013
Alternative Peak Race Weekday
Peak Weekend
Race High Interest
Weekend Peak Race Weekday
Peak Weekend
Race
Medium High
Weekend Average
Weekend Alternative B
PAOT 430 1,600 1,170 430 3,280 1,500 910
Level of Service A C C A D C B Alternative C
PAOT 280 850 720 230 1,350 700 580
Level of Service A C C* A D C* B Alternative D
PAOT 230 710* 640 300 1,900 1,010 710
Level of Service A C B A D C C*
Peak Race Wkday
AC72 Wkend
AC45 Wkend
Fleet Week
Wkend
Peak Race
Weekday
Peak Weekend
Race
Medium High
Weekend
Average
Weekend
Alternative E
PAOT 280 850 710 1,320 230 1,350 700 580
Level of Service A C C* D A D C* B * Note: the indicated levels of service B & C were adjusted to reflect the impacts of expected variations in the distribution of PAOT volumes from the analysis results, based on knowledge of situational conditions at this location – the Warming Hut and picnic areas tend to draw concentrations of visitors during special events, as this is the only location in the west Crissy Field area where food service, shopping, and picnicking opportunities are available.
The figures in the above tables indicate that the number of onsite visitors (PAOT) at the Crissy West Picnic Area will increase considerably over normal levels during the AC34 events, and will also be higher than what was documented on the Fleet Week Saturday.
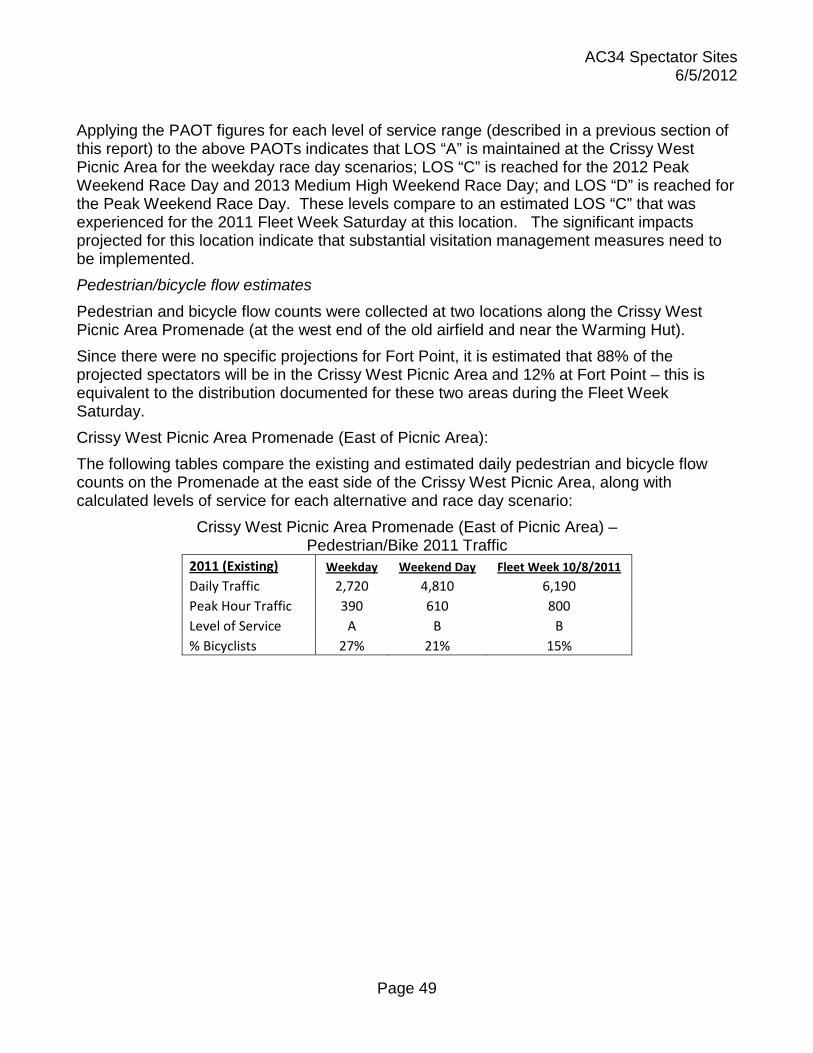
AC34 Spectator Sites 6/5/2012
Page 49
Applying the PAOT figures for each level of service range (described in a previous section of this report) to the above PAOTs indicates that LOS “A” is maintained at the Crissy West Picnic Area for the weekday race day scenarios; LOS “C” is reached for the 2012 Peak Weekend Race Day and 2013 Medium High Weekend Race Day; and LOS “D” is reached for the Peak Weekend Race Day. These levels compare to an estimated LOS “C” that was experienced for the 2011 Fleet Week Saturday at this location. The significant impacts projected for this location indicate that substantial visitation management measures need to be implemented. Pedestrian/bicycle flow estimates
Pedestrian and bicycle flow counts were collected at two locations along the Crissy West Picnic Area Promenade (at the west end of the old airfield and near the Warming Hut). Since there were no specific projections for Fort Point, it is estimated that 88% of the projected spectators will be in the Crissy West Picnic Area and 12% at Fort Point – this is equivalent to the distribution documented for these two areas during the Fleet Week Saturday. Crissy West Picnic Area Promenade (East of Picnic Area): The following tables compare the existing and estimated daily pedestrian and bicycle flow counts on the Promenade at the east side of the Crissy West Picnic Area, along with calculated levels of service for each alternative and race day scenario:
Crissy West Picnic Area Promenade (East of Picnic Area) – Pedestrian/Bike 2011 Traffic
2011 (Existing) Weekday Weekend Day Fleet Week 10/8/2011 Daily Traffic 2,720 4,810 6,190 Peak Hour Traffic 390 610 800 Level of Service A B B % Bicyclists 27% 21% 15%
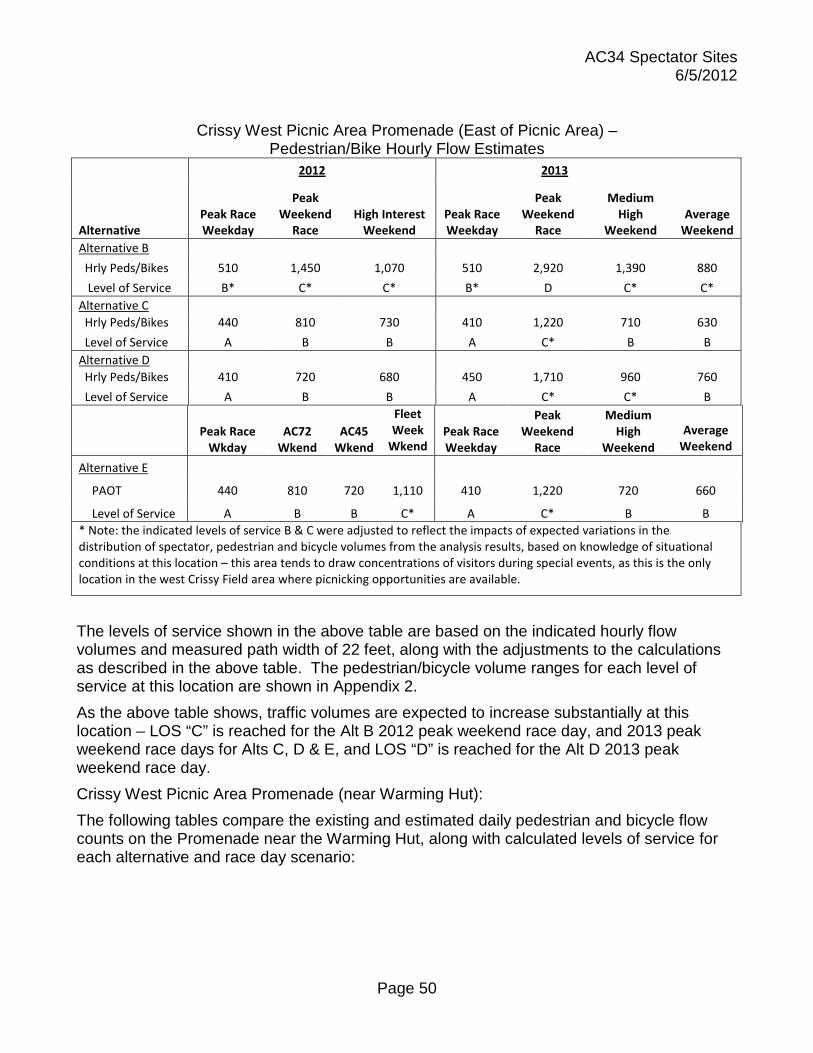
AC34 Spectator Sites 6/5/2012
Page 50
Crissy West Picnic Area Promenade (East of Picnic Area) – Pedestrian/Bike Hourly Flow Estimates
2012 2013
Alternative Peak Race Weekday
Peak Weekend
Race High Interest
Weekend Peak Race Weekday
Peak Weekend
Race
Medium High
Weekend Average
Weekend Alternative B
Hrly Peds/Bikes 510 1,450 1,070 510 2,920 1,390 880
Level of Service B* C* C* B* D C* C* Alternative C Hrly Peds/Bikes 440 810 730 410 1,220 710 630
Level of Service A B B A C* B B Alternative D
Hrly Peds/Bikes 410 720 680 450 1,710 960 760
Level of Service A B B A C* C* B
Peak Race Wkday
AC72 Wkend
AC45 Wkend
Fleet Week
Wkend Peak Race Weekday
Peak Weekend
Race
Medium High
Weekend
Average
Weekend
Alternative E
PAOT 440 810 720 1,110 410 1,220 720 660
Level of Service A B B C* A C* B B * Note: the indicated levels of service B & C were adjusted to reflect the impacts of expected variations in the distribution of spectator, pedestrian and bicycle volumes from the analysis results, based on knowledge of situational conditions at this location – this area tends to draw concentrations of visitors during special events, as this is the only location in the west Crissy Field area where picnicking opportunities are available.
The levels of service shown in the above table are based on the indicated hourly flow volumes and measured path width of 22 feet, along with the adjustments to the calculations as described in the above table. The pedestrian/bicycle volume ranges for each level of service at this location are shown in Appendix 2. As the above table shows, traffic volumes are expected to increase substantially at this location – LOS “C” is reached for the Alt B 2012 peak weekend race day, and 2013 peak weekend race days for Alts C, D & E, and LOS “D” is reached for the Alt D 2013 peak weekend race day. Crissy West Picnic Area Promenade (near Warming Hut): The following tables compare the existing and estimated daily pedestrian and bicycle flow counts on the Promenade near the Warming Hut, along with calculated levels of service for each alternative and race day scenario:

AC34 Spectator Sites 6/5/2012
Page 51
Crissy West Picnic Area Promenade (near Warming Hut) – Pedestrian/Bike 2011 Traffic
2011 (Existing) Weekday Weekend Day Fleet Week 10/8/2011 Daily Traffic 2,480 5,420 8,060 Peak Hour Traffic 340 660 1,010 Level of Service A B B % Bicyclists 31% 15% 10%
Crissy West Picnic Area Promenade (near Warming Hut) –
Pedestrian/Bike Hourly Flow Estimates 2012 2013
Alternative Peak Race Weekday
Peak Weekend
Race High Interest
Weekend
Peak Race
Weekday
Peak Weekend
Race
Medium High
Weekend Average
Weekend Alternative B
Hrly Peds/Bikes 660 1,930 1,420 660 3,900 1,850 1,180
Level of Service B C B B D C B Alternative C Hrly Peds/Bikes 470 1,040 890 410 1,630 880 750
Level of Service A B B A B B B Alternative D
Hrly Peds/Bikes 410 880 790 500 2,280 1,280 960
Level of Service A B B A C B B
Peak Race
Wkday AC72
Wkend AC45
Wkend
Fleet Week
Wkend
Peak Race
Weekday
Peak Weekend
Race
Medium High
Weekend
Average
Weekend Alternative E
Hrly Peds/Bikes 470 1,040 880 1,440 410 1,630 890 770
Level of Service A B B B A B B B
The levels of service shown in the above table are based on the indicated hourly flow volumes and measured path width of 22 feet. The pedestrian/bicycle volume ranges for each level of service at this location are shown in Appendix 2. For the 2013 peak weekend race day, LOS “D” is expected for Alt B, LOS “C” for Alt D, and LOS “B” for Alts C & E. Fort Point “People at One Time” (PAOT) Estimates
PAOT estimates were developed from the data collected during the 2011 visitor use studies and the AC34 spectator projections. Since the AC34 projections did not break out Fort Point spectators separately, it is estimated that 12% of the projected spectator counts for the Crissy West Picnic Area will go to Fort Point - this is equivalent to the estimated breakdown for Fleet

AC34 Spectator Sites 6/5/2012
Page 52
Week Saturday. These estimates are summarized for each alternative and race day scenario at Fort Point in the following tables for the peak period of the day:
Fort Point 2011 PAOT (Peak Period of the Day) 2011 (Existing) Weekday Weekend Day Fleet Week 10/8/2011
PAOT 50 120 160 Level of Service A C C
Fort Point PAOT Estimates (Peak Period of the Day)
2012 2013
Alternative Peak Race Weekday
Peak Weekend
Race High Interest
Weekend Peak Race Weekday
Peak Weekend
Race
Medium High
Weekend Average
Weekend Alternative B
PAOT 80 260 200 80 480 240 150
Level of Service C* D C C* E D C Alternative C
PAOT 60 160 150 60 230 140 120
Level of Service A C C A D C C Alternative D
PAOT 60 140 130 70 300 180 140
Level of Service A C C B D C C
Peak Race Wkday
AC72 Wkend
AC45 Wkend
Fleet Week
Wkend Peak Race Weekday
Peak Weekend
Race
Medium High
Weekend
Average
Weekend
Alternative E
PAOT 60 160 140 190 60 230 140 130
Level of Service A C C D A D C C * Note: the indicated levels of service A through C were adjusted to reflect the impacts of expected variations in the distribution of PAOT volumes from the analysis results, based on knowledge of situational conditions at this location – management action is needed during events, even at relatively low PAOT levels to deal with safety problems associated with visitors occupying viewing areas along the narrow road (Marine Drive) and creating conflicts with vehicular traffic.
The figures in the above tables indicate that the number of onsite visitors (PAOT) at Fort Point will increase over normal levels during the AC34 events, and will also be higher on weekend days than what was documented on the Fleet Week Saturday. For Alternative B (Sponsor Proposed Project), the onsite crowding conditions, based on projected PAOT levels, can be expected to reach LOS “D” for the 2012 peak weekend race day and LOS “E” for the 2013 peak weekend race days. For all other alternatives, LOS “C” is reached on the 2012 weekend race day and LOS “D” on the 2013 peak weekend race day. These levels compare to an estimated LOS “C” that was experienced for the 2011 Fleet Week Saturday at this location. The significant impacts projected for this location indicate that it will likely be necessary to close off vehicle access to Ft. Point for the 2013 weekend race days.
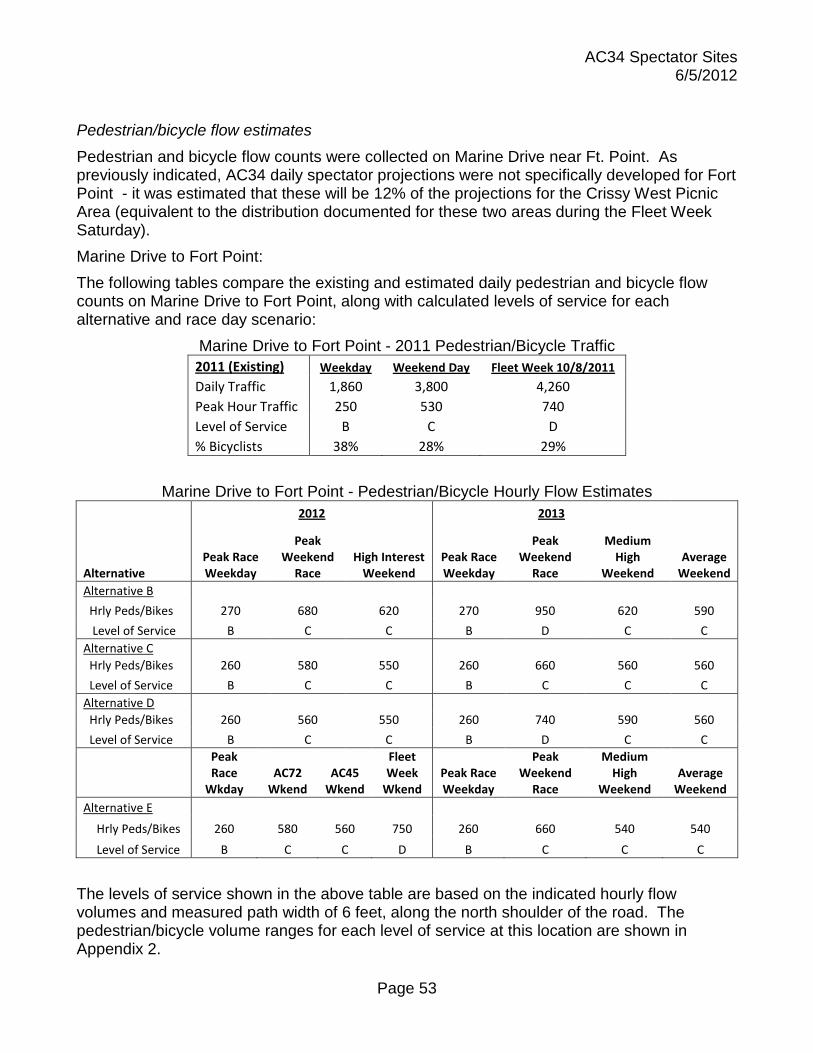
AC34 Spectator Sites 6/5/2012
Page 53
Pedestrian/bicycle flow estimates
Pedestrian and bicycle flow counts were collected on Marine Drive near Ft. Point. As previously indicated, AC34 daily spectator projections were not specifically developed for Fort Point - it was estimated that these will be 12% of the projections for the Crissy West Picnic Area (equivalent to the distribution documented for these two areas during the Fleet Week Saturday). Marine Drive to Fort Point: The following tables compare the existing and estimated daily pedestrian and bicycle flow counts on Marine Drive to Fort Point, along with calculated levels of service for each alternative and race day scenario:
Marine Drive to Fort Point - 2011 Pedestrian/Bicycle Traffic 2011 (Existing) Weekday Weekend Day Fleet Week 10/8/2011 Daily Traffic 1,860 3,800 4,260 Peak Hour Traffic 250 530 740 Level of Service B C D % Bicyclists 38% 28% 29%
Marine Drive to Fort Point - Pedestrian/Bicycle Hourly Flow Estimates
2012 2013
Alternative Peak Race Weekday
Peak Weekend
Race High Interest
Weekend Peak Race Weekday
Peak Weekend
Race
Medium High
Weekend Average
Weekend Alternative B
Hrly Peds/Bikes 270 680 620 270 950 620 590
Level of Service B C C B D C C Alternative C Hrly Peds/Bikes 260 580 550 260 660 560 560
Level of Service B C C B C C C Alternative D
Hrly Peds/Bikes 260 560 550 260 740 590 560
Level of Service B C C B D C C
Peak Race
Wkday AC72
Wkend AC45
Wkend
Fleet Week
Wkend Peak Race Weekday
Peak Weekend
Race
Medium High
Weekend
Average
Weekend Alternative E
Hrly Peds/Bikes 260 580 560 750 260 660 540 540
Level of Service B C C D B C C C
The levels of service shown in the above table are based on the indicated hourly flow volumes and measured path width of 6 feet, along the north shoulder of the road. The pedestrian/bicycle volume ranges for each level of service at this location are shown in Appendix 2.
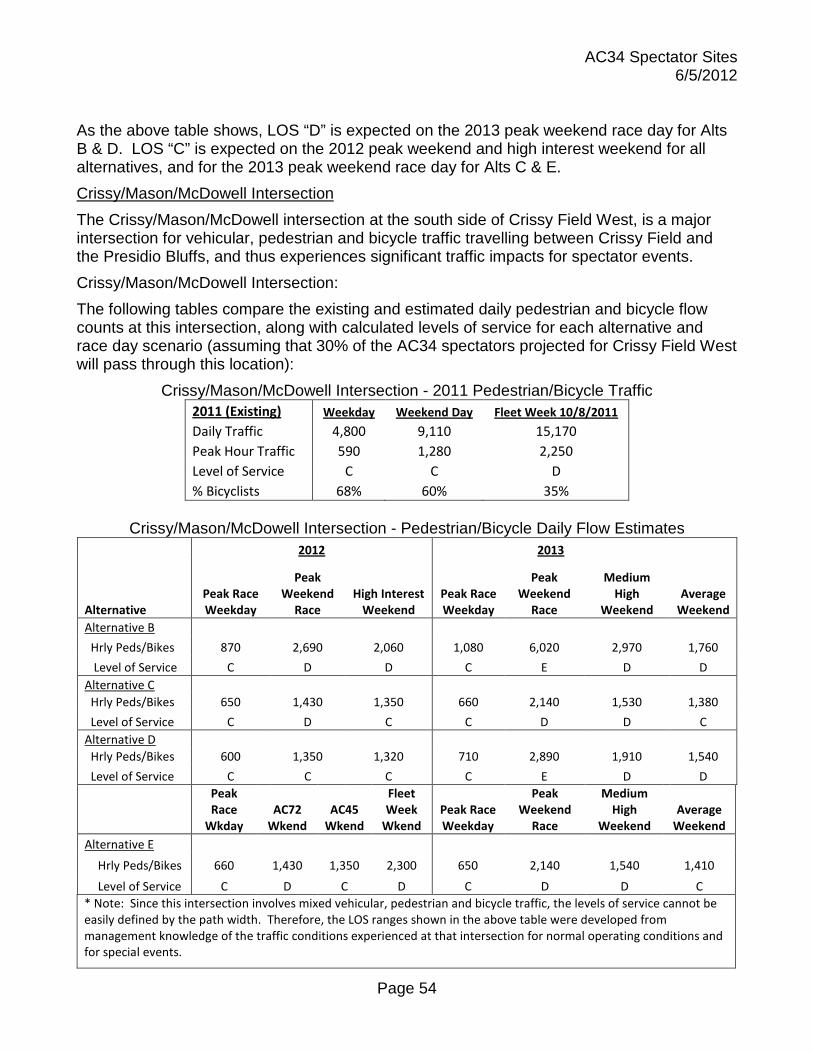
AC34 Spectator Sites 6/5/2012
Page 54
As the above table shows, LOS “D” is expected on the 2013 peak weekend race day for Alts B & D. LOS “C” is expected on the 2012 peak weekend and high interest weekend for all alternatives, and for the 2013 peak weekend race day for Alts C & E. Crissy/Mason/McDowell Intersection The Crissy/Mason/McDowell intersection at the south side of Crissy Field West, is a major intersection for vehicular, pedestrian and bicycle traffic travelling between Crissy Field and the Presidio Bluffs, and thus experiences significant traffic impacts for spectator events. Crissy/Mason/McDowell Intersection: The following tables compare the existing and estimated daily pedestrian and bicycle flow counts at this intersection, along with calculated levels of service for each alternative and race day scenario (assuming that 30% of the AC34 spectators projected for Crissy Field West will pass through this location):
Crissy/Mason/McDowell Intersection - 2011 Pedestrian/Bicycle Traffic 2011 (Existing) Weekday Weekend Day Fleet Week 10/8/2011 Daily Traffic 4,800 9,110 15,170 Peak Hour Traffic 590 1,280 2,250 Level of Service C C D % Bicyclists 68% 60% 35%
Crissy/Mason/McDowell Intersection - Pedestrian/Bicycle Daily Flow Estimates
2012 2013
Alternative Peak Race Weekday
Peak Weekend
Race High Interest
Weekend Peak Race Weekday
Peak Weekend
Race
Medium High
Weekend Average
Weekend Alternative B
Hrly Peds/Bikes 870 2,690 2,060 1,080 6,020 2,970 1,760
Level of Service C D D C E D D Alternative C Hrly Peds/Bikes 650 1,430 1,350 660 2,140 1,530 1,380
Level of Service C D C C D D C Alternative D
Hrly Peds/Bikes 600 1,350 1,320 710 2,890 1,910 1,540
Level of Service C C C C E D D
Peak Race
Wkday AC72
Wkend AC45
Wkend
Fleet Week
Wkend Peak Race Weekday
Peak Weekend
Race
Medium High
Weekend
Average
Weekend Alternative E
Hrly Peds/Bikes 660 1,430 1,350 2,300 650 2,140 1,540 1,410
Level of Service C D C D C D D C * Note: Since this intersection involves mixed vehicular, pedestrian and bicycle traffic, the levels of service cannot be easily defined by the path width. Therefore, the LOS ranges shown in the above table were developed from management knowledge of the traffic conditions experienced at that intersection for normal operating conditions and for special events.

AC34 Spectator Sites 6/5/2012
Page 55
The levels of service shown in the above table are based on the indicated hourly flow volumes and pedestrian/bicycle volume ranges for each level of service at this location are shown in Appendix 2. As shown in the above table, LOS “E” is expected for the Alts B & D 2013 peak weekend race day; LOS “D” for the 2012 peak weekend race days for Alts B, C & E, and for the 2013 peak weekend race days for Alts C & E. Long Ave./Lincoln Blvd. Intersection The intersection of Long Ave. and Lincoln Blvd., on the Presidio Bluffs above Crissy Field, is a major intersection for vehicular, pedestrian and bicycle traffic travelling between Crissy Field and the Presidio Bluffs, and thus experiences significant traffic impacts for spectator events. The following tables compare the existing and estimated daily pedestrian and bicycle flow counts at this intersection, along with calculated levels of service for each alternative and race day scenario (assuming that 15% of the AC34 spectators projected for Crissy Field West will pass through this intersection):
Long Ave./Lincoln Blvd. Intersection - 2011 Pedestrian/Bicycle Traffic 2011 (Existing) Weekday Weekend Day Fleet Week 10/8/2011 Daily Traffic 2,370 3,170 5,250 Peak Hour Traffic 340 470 810 Level of Service B B C % Bicyclists 86% 78% 52%

AC34 Spectator Sites 6/5/2012
Page 56
Long Ave./Lincoln Blvd. Intersection - Pedestrian/Bicycle Hourly Flow Estimates 2012 2013
Alternative Peak Race Weekday
Peak Weekend
R ace
High Interest Weekend
Peak Race
Weekday
Peak Weekend
Race
Medium High
Weekend Average
Weekend Alternative B
Hrly Peds/Bikes 450 1,170 890 590 2,910 1,370 760
Level of Service B D C* B E D C* Alternative C Hrly Peds/Bikes 360 610 560 370 910 600 530
Level of Service B C* B B D* C* B Alternative D
Hrly Peds/Bikes 350 520 500 390 1,300 800 610
Level of Service B B B B D* C C*
Peak Race
Wkday AC72
Wkend AC45
Wkend
Fleet Week
Wkend
Peak Race
Weekday
Peak Weekend
Race
Medium High
Weekend
Average
Weekend Alternative E
Hrly Peds/Bikes 360 610 490 840 370 910 610 540
Level of Service B C* B C B D* C* B
* Note: the ranges were adjusted for LOS C (600-909) and LOS D (910-1973) to reflect the impacts of expected variations in the distribution of spectator, pedestrian and bicycle volumes from the analysis results, based on the expectation than many AC34 visitors will pass through this intersection as part of their AC34 travel between the Crissy Field and Golden Gate Bridge areas – thus conditions at this intersection are expected to be more crowded than is indicated by the calculated ranges for these LOS’s.
The levels of service shown in the above table are based on the indicated hourly flow volumes and measured path width of 11 feet, along with the adjustments to the calculations as described in the above table. The pedestrian/bicycle volume ranges for each level of service at this location are shown in Appendix 2. The above tables indicate a lesser AC34 traffic impact for this intersection than for the Mason St./Crissy Field Ave. intersection, as it is further away from the focus of activity at Crissy Field. But this intersection will be crossed by visitors and spectators traveling between the Crissy Field and Golden Gate Bridge areas. For Fleet Week, almost all of the increased traffic was pedestrian – bicycle traffic remained about the same as normal levels. For the 2013 peak weekend race day, LOS “E” is expected for Alt B, and LOS “D” for all other alternatives. For the 2012 peak weekend race day, LOS “D” is expected for Alt B, and LOS “C” for Alts C & E. Thus, traffic control at this intersection will be warranted at this intersection for the 2012 and 2013 weekend race days.

AC34 Spectator Sites 6/5/2012
Page 57
Golden Gate Bridge Overlook “People at One Time” (PAOT) Estimates
PAOT estimates were developed for the two selected viewing areas from the data collected during the 2011 visitor use studies. These viewing areas represent key indicators of overall crowding levels at the GG Bridge Overlook area.
Golden Gate Bridge Plaza 2011 PAOT for selected viewing areas 2011 (Existing) Weekday Weekend Day Fleet Week 10/8/2011
PAOT 20 50 90 Level of Service B C D
Golden Gate Bridge Plaza PAOT Estimates for selected viewing areas
2012 2013
Alternative Peak Race Weekday
Peak Weekend
Race High Interest
Weekend Peak Race Weekday
Peak Weekend
Race
Medium High
Weekend Average
Weekend Alternative B
PAOT 50 90 80 50 120 100 70
Level of Service C D D C E D D Alternative C
PAOT 20 60 60 20 70 60 50
Level of Service B C C B D C C Alternative D
PAOT 25 60 55 30 80 70 60
Level of Service B C C B D D C
Peak Race Wkday
AC72 Wkend
AC45 Wkend
Fleet Week
Wkend Peak Race Weekday
Peak Weekend
Race
Medium High
Weekend
Average
Weekend
Alternative E
PAOT 25 60 60 110 25 70 60 55
Level of Service B C C `D B D C C
Without specific spectator projections available for this location, it is estimated that the visitation for this area will be 50% of the Fleet Week level for race weekdays, 100% for the 2012 weekend race day, and 130% for the 2013 weekend race day for Alternative B. For the other alternatives, visitation levels were correlated to the projections for the Crissy West Picnic Area. For Alternative B (Sponsor Proposed Project), the onsite crowding conditions, based on projected PAOT levels, can be expected to reach LOS “D” for the 2012 peak weekend race

AC34 Spectator Sites 6/5/2012
Page 58
day and LOS “E” for the 2013 peak weekend race days. For all other alternatives, LOS “D” is estimated for the 2013 peak weekend race day and LOS “C” for the 2012 peak weekend race day. The significant impacts projected for this location indicate that substantial visitation management measures need to be implemented. Pedestrian/bicycle flow estimates
Pedestrian and bicycle flow counts were collected at two locations on the Coastal Trail through the GGB Overlook area, along with PAOT counts at two selected viewing areas, as shown in the following map:
AC34 daily spectator projections were not specifically developed for GG Bridge Overlook – in lieu of specific data, it was estimated for this analysis that these counts will be similar on peak weekend days for Alt B to what was experienced for Fleet Week. For the other alternatives, traffic levels were correlated to the projections for the Crissy West Picnic Area. Coastal Trail at West Side of Golden Gate Bridge Overlook: The following tables compare the existing and estimated daily pedestrian and bicycle flow counts on the Coastal Trail at the western side of GGB Overlook (just below the bridge), along with calculated levels of service for each alternative and race day scenario:
Coastal Trail at West Side of GGB Overlook - 2011 Pedestrian/Bicycle Traffic 2011 (Existing) Weekday Weekend Day Fleet Week 10/8/2011 Daily Traffic 2,120 4,610 6,720 Peak Hour Traffic 290 630 910 Level of Service B B C % Bicyclists 37% 49% 43%

AC34 Spectator Sites 6/5/2012
Page 59
Coastal Trail at West Side of GGB Overlook - Pedestrian/Bicycle Hourly Flow Estimates 2012 2013
Alternative Peak Race Weekday
Peak Weekend
Race High Interest
Weekend Peak Race Weekday
Peak Weekend
Race
Medium High
Weekend Average
Weekend Alternative B
Hrly Peds/Bikes 490 840 760 490 940 850 710
Level of Service B B B B C C B Alternative C Hrly Peds/Bikes 350 690 670 330 720 690 650
Level of Service B B B B B B B Alternative D
Hrly Peds/Bikes 330 660 650 390 780 760 710
Level of Service B B B B B B B
Alternative
Peak Race
Wkday AC72
Wkend AC45
Wkend
Fleet Week
Wkend Peak Race Weekday
Peak Weekend
Race
Medium High
Weekend
Average
Weekend Alternative E
Hrly Peds/Bikes 350 690 690 930 330 720 710 680
Level of Service B B B C B B B B
The levels of service shown in the above table are based on the indicated hourly flow volumes and measured path width of 10 feet. The pedestrian/bicycle volume ranges for each level of service at this location are shown in Appendix 2. As the above table shows, traffic can be expected to increase on the Coastal Trail, especially on weekend race days. It is estimated that traffic volumes will be similar to those documented on the Fleet Week Saturday for Alt B. LOS “C” is projected for the Alt B 2013 peak weekend race day and medium high weekend day, with LOS “B” estimated for most other alternatives and scenarios.

AC34 Spectator Sites 6/5/2012
Page 60
Coastal Trail at East Side of GGB Overlook - Pedestrian/Bicycle Hourly Flow Estimates 2012 2013
Alternative Peak Race Weekday
Peak Weekend
Race High Interest
Weekend Peak Race Weekday
Peak Weekend
Race
Medium High
Weekend Average
Weekend Alternative B
Hrly Peds/Bikes 590 1,140 1,060 590 1,220 1,130 970
Level of Service C* D* C C* D D* C Alternative C Hrly Peds/Bikes 440 1,000 990 420 1,020 1,000 950
Level of Service B C C B C C C Alternative D
Hrly Peds/Bikes 410 970 960 480 1,080 1,060 1,020
Level of Service B C C B C C C
Peak Race
Wkday AC72
Wkend AC45
Wkend
Fleet Week
Wkend Peak Race Weekday
Peak Weekend
Race
Medium High
Weekend
Average
Weekend Alternative E
Hrly Peds/Bikes 440 1,000 1,000 1,130 420 1,020 1,010 990
Level of Service B C C D* B C C C * Note: levels of service C & D were adjusted to reflect the impacts of expected variations in the distribution of spectator, pedestrian and bicycle volumes from the analysis results, based on known situational considerations – during events, this trail is used heavily by visitors walking and biking between San Francisco and the Golden Gate Bridge areas.
The levels of service shown in the above table are based on the indicated hourly flow volumes and measured path width of 9.7 feet, along with the adjustments to the calculations as described in the above table. The pedestrian/bicycle volume ranges for each level of service at this location are shown in Appendix 2. Similar to the results for the west side of the Coastal Trail, traffic can be expected to increase, especially on weekend race days. It is estimated that traffic volumes will be similar to those documented on the Fleet Week Saturday for Alt B. LOS “D” is estimated for the Alt B 2012 peak weekend race day and 2013 peak weekend and medium high race days, and LOS “C” is estimated for most other weekend race alternatives and scenarios. Marin Headlands/Battery Spencer Daily visitation
Estimates for the existing daily visitation to Marin Headlands were developed from traffic data provided by NPS for Conzelman Road, resulting in the following estimates for existing daily visitation:
Marin Headlands 2011 Daily Visitation Estimates
Weekday Weekend
Day Fleet Week 10/8/2011
1,120 2,230 2,230

AC34 Spectator Sites 6/5/2012
Page 61
Since traffic is controlled during Fleet Week weekends, visitation does not increase significantly over typical weekend days. It is assumed that a portion of the existing visitation will be displaced to other locations or converted to AC34 visitors. For each alternative and race day scenario, the following table summarizes the amount of existing visitation to Marin Headlands that will continue to visit (i.e., will not be displaced or converted), based on the displacement/conversion percentages previously summarized:
Marin Headlands Existing Daily Visitation Not Displaced or Converted
2012 2013
Alternative Peak Race Weekday
Peak Weekend
Race High Interest
Weekend Peak Race Weekday
Peak Weekend
Race
Medium High
Weekend
Average
Weekend Alternative B 1,100 2,130 2,170 1,090 2,130 2,170 2,190 Alternative C 1,100 2,130 2,170 1,090 2,130 2,170 2,190 Alternative D 1,100 2,130 2,170 1,090 2,130 2,170 2,190
Peak Race
Wkday AC72
Wkend AC45
Wkend
Fleet Week
Wkend Peak Race Weekday
Peak Weekend
Race
Medium High
Weekend
Average
Weekend Alternative E 1,100 2,130 2,130 2,610 1,090 2,130 2,170 2,190
The following table summarizes spectator estimates developed by AECOM for each alternative and race day scenario:
Marin Headlands Projected Spectator Estimates (AECOM) 2012 2013
Alternative Peak Race Weekday
Peak Weekend
Race High Interest
Weekend Peak Race Weekday
Peak Weekend
Race
Medium High
Weekend
Average
Weekend Alternative B 100 500 300 150 500 300 200 Alternative C 100 500 300 150 500 300 200 Alternative D 100 500 300 150 500 300 200
Peak Race
Wkday AC72
Wkend AC45
Wkend
Fleet Week
Wkend Peak Race Weekday
Peak Weekend
Race
Medium High
Weekend
Average
Weekend Alternative E 100 500 500 20 150 500 300 200 The total estimated visitation to Marin Headlands is the combined visitation of existing non-displaced/converted visitors and AC34 spectators – these estimates are shown in the following table:

AC34 Spectator Sites 6/5/2012
Page 62
Marin Headlands Total Visitation during AC34 Events 2012 2013
Alternative Peak Race Weekday
Peak Weekend
Race High Interest
Weekend Peak Race Weekday
Peak Weekend
Race
Medium High
Weekend
Average
Weekend Alternative B 1,200 2,630 2,470 1,240 2,630 2,470 2,390 Alternative C 1,200 2,630 2,470 1,240 2,630 2,470 2,390 Alternative D 1,200 2,630 2,470 1,240 2,630 2,470 2,390
Peak Race
Wkday AC72
Wkend AC45
Wkend
Fleet Week
Wkend Peak Race Weekday
Peak Weekend
Race
Medium High
Weekend
Average
Weekend Alternative E 1,200 2,630 2,630 2,630 1,240 2,630 2,470 2,390
“People at One Time” (PAOT) Estimates. PAOT estimates were developed from the data collected during the 2011 visitor use studies. AC34 daily spectator projections represent all of Marin Headlands - it was assumed that 50% of these spectators will go to Battery Spencer. These estimates are summarized for each alternative and race day scenario at Battery Spencer in the following tables for the peak period of the day:
Battery Spencer 2011 PAOT (Peak Period of the Day) 2011 (Existing) Weekday Weekend Day Fleet Week 10/8/2011
PAOT 20 40 140 Level of Service A B D

AC34 Spectator Sites 6/5/2012
Page 63
Battery Spencer PAOT Estimates (Peak Period of the Day) 2012 2013
Alternative Peak Race Weekday
Peak Weekend
Race High Interest
Weekend
Peak Race
Weekday
Peak Weekend
Race
Medium High
Weekend Average
Weekend Alternative B
PAOT 25 50* 45* 35* 70* 60* 50*
Level of Service A C C C D D C Alternative C
PAOT 25 50 45 35 70 60 50
Level of Service A C* C* C* D* D* C* Alternative D
PAOT 25 50 45 35 70 60 50
Level of Service A C* C* C* D* D* C*
Peak Race Wkday
AC72 Wkend
AC45 Wkend
Fleet Week
Wkend Peak Race Weekday
Peak Weekend
Race
Medium High
Weekend
Average
Weekend
Alternative E
PAOT 25 50* 50* 160 35* 70* 60* 50*
Level of Service A C C D C D D C * Note: the indicated levels of service A through D were adjusted to reflect the impacts of expected variations in the distribution of PAOT volumes from the analysis results, based on knowledge of situational conditions at this location – management action is needed during events, even at relatively low PAOT levels to deal with safety problems associated with visitors occupying viewing areas along the narrow road (Marine Drive) and creating conflicts with vehicular traffic.
The figures in the above tables indicate that the number of onsite visitors (PAOT) at Battery Spencer will increase over normal levels during the AC34 events. For all alternatives, the onsite crowding conditions, based on projected PAOT levels, can be expected to reach LOS “C” for the 2012 peak weekend race day and LOS “D” for the 2013 peak weekend race days, with corresponding significant increases in pedestrian/bicycle flow volumes to and from the site. These levels compare to an estimated LOS “D” that was experienced for the 2011 Fleet Week Saturday at this location. The impacts projected for this location indicate that visitation management measures need to be implemented, especially considering the issues associated with safety fence at this viewing area. Pedestrian flow estimates
Pedestrian flow counts were collected on the walking path to Battery Spencer. AC34 daily spectator projections represent all of Marin Headlands - it was assumed that 50% of these spectators will go to Battery Spencer. Battery Spencer Main Walkways: The following tables compare the existing and estimated daily pedestrian flow counts on the paths to Battery Spencer, along with calculated levels of service for each alternative and race day scenario:

AC34 Spectator Sites 6/5/2012
Page 64
Battery Spencer Main Walkways - 2011 Pedestrian Traffic 2011 (Existing) Weekday8 Weekend Day Fleet Week 10/8/2011 Daily Traffic 470 940 1,270 Level of Service A A B Peak Hour Traffic 85 170 260
Battery Spencer Main Walkways - Pedestrian Hourly Flow Estimates
2012 2013
Alternative Peak Race Weekday
Peak Weekend
Race High Interest
Weekend Peak Race Weekday
Peak Weekend
Race
Medium High
Weekend Average
Weekend Alternative B
Hrly Peds/Bikes 90 240 210 90 230 200 180
Level of Service A B B A B B A Alternative C Hrly Peds/Bikes 90 240 210 90 230 200 180
Level of Service A B B A B B A Alternative D
Hrly Peds/Bikes 90 240 210 90 230 200 180
Level of Service A B B A B B A
Peak Race
Wkday AC72
Wkend AC45
Wkend
Fleet Week
Wkend Peak Race Weekday
Peak Weekend
Race
Medium High
Weekend
Average
Weekend Alternative E
Hrly Peds/Bikes 90 240 240 260 90 230 200 180
Level of Service A B B B A B B A
The levels of service shown in the above table are based on the indicated hourly flow volumes and measured path width of 8 feet. The pedestrian volume ranges for each level of service at this location are shown in Appendix 2. Battery Spencer access trails are expected to consistently operate at LOS “A” or “B” for all existing and future scenarios. This observation reflects the ample width of the access trails to Batter Spencer – the primary crowding issue is expected to occur at the overlook viewing area itself. Fort Baker Daily visitation
Estimates for the existing daily visitation to Fort Baker were developed from the pedestrian/bicycle flow counts collected in 2011 with the assumptions that pedestrian/bicycle visitation is equivalent to 50% of the entering traffic on Center Road, plus 50% of the entering
8 Note: Battery Spencer was closed on weekdays during the 2011 study period. Weekday counts are assumed to be 50% of weekend counts.

AC34 Spectator Sites 6/5/2012
Page 65
traffic on Moore Road, plus 100% of the entering traffic on Sommerville Road. Also, since vehicular traffic was not counted, it was assumed that visitation from vehicles is equal to visitation from pedestrians and bicycles. Applying these factors to the pedestrian/bicycle flow counts collected at Fort Baker results in the following estimates for existing daily visitation:
Fort Baker 2011 Daily Visitation Estimates
Weekday Weekend
Day Fleet Week 10/8/2011
890 1,770 3,550
It is assumed that a portion of the existing visitation will be displaced to other locations or converted to AC34 visitors. For each alternative and race day scenario, the following table summarizes the amount of existing visitation to Fort Baker that will continue to visit (i.e., will not be displaced or converted), based on the displacement/conversion percentages previously summarized:
Fort Baker Existing Daily Visitation Not Displaced or Converted
2012 2013
Alternative Peak Race Weekday
Peak Weekend
Race High Interest
Weekend Peak Race Weekday
Peak Weekend
Race
Medium High
Weekend
Average
Weekend Alternative B 870 1,700 1,730 870 1,670 1,720 1,740 Alternative C 870 1,700 1,730 870 1,670 1,720 1,740 Alternative D 870 1,700 1,730 870 1,670 1,720 1,740
Peak Race
Wkday AC72
Wkend AC45
Wkend
Fleet Week
Wkend Peak Race Weekday
Peak Weekend
Race
Medium High
Weekend
Average
Weekend Alternative E 870 1,700 1,700 3,550 870 1,670 1,720 1,740
The following table summarizes spectator estimates developed by AECOM for each alternative and race day scenario:
Fort Baker Projected Spectator Estimates (AECOM) 2012 2013
Alternative Peak Race Weekday
Peak Weekend
Race High Interest
Weekend Peak Race Weekday
Peak Weekend
Race
Medium High
Weekend
Average
Weekend Alternative B 100 350 210 100 500 250 150 Alternative C 100 350 210 100 500 250 150 Alternative D 100 350 210 100 500 250 150
Peak Race
Wkday AC72
Wkend AC45
Wkend
Fleet Week
Wkend Peak Race Weekday
Peak Weekend
Race
Medium High
Weekend
Average
Weekend Alternative E 100 350 350 220 100 500 250 150
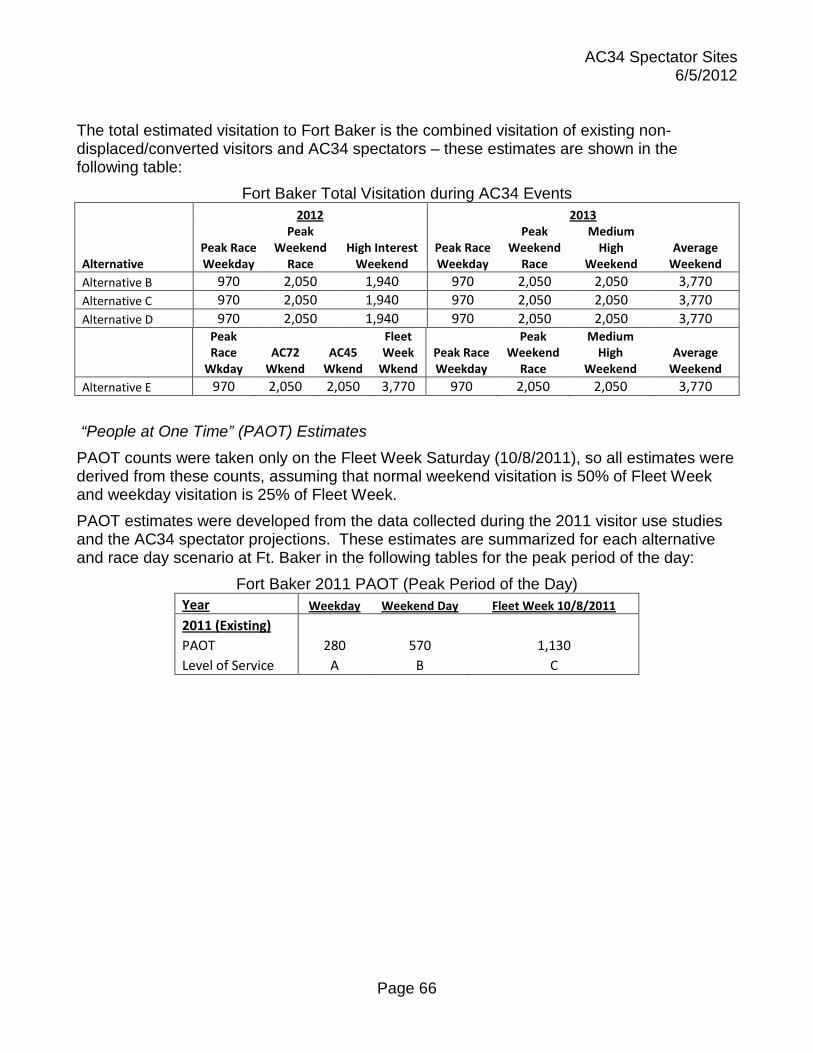
AC34 Spectator Sites 6/5/2012
Page 66
The total estimated visitation to Fort Baker is the combined visitation of existing non-displaced/converted visitors and AC34 spectators – these estimates are shown in the following table:
Fort Baker Total Visitation during AC34 Events 2012 2013
Alternative Peak Race Weekday
Peak Weekend
Race High Interest
Weekend Peak Race Weekday
Peak Weekend
Race
Medium High
Weekend
Average
Weekend Alternative B 970 2,050 1,940 970 2,050 2,050 3,770 Alternative C 970 2,050 1,940 970 2,050 2,050 3,770 Alternative D 970 2,050 1,940 970 2,050 2,050 3,770
Peak Race
Wkday AC72
Wkend AC45
Wkend
Fleet Week
Wkend Peak Race Weekday
Peak Weekend
Race
Medium High
Weekend
Average
Weekend Alternative E 970 2,050 2,050 3,770 970 2,050 2,050 3,770
“People at One Time” (PAOT) Estimates
PAOT counts were taken only on the Fleet Week Saturday (10/8/2011), so all estimates were derived from these counts, assuming that normal weekend visitation is 50% of Fleet Week and weekday visitation is 25% of Fleet Week. PAOT estimates were developed from the data collected during the 2011 visitor use studies and the AC34 spectator projections. These estimates are summarized for each alternative and race day scenario at Ft. Baker in the following tables for the peak period of the day:
Fort Baker 2011 PAOT (Peak Period of the Day) Year Weekday Weekend Day Fleet Week 10/8/2011
2011 (Existing) PAOT 280 570 1,130
Level of Service A B C

AC34 Spectator Sites 6/5/2012
Page 67
Fort Baker PAOT Estimates (Peak Period of the Day) 2012 2013
Alternative Peak Race Weekday
Peak Weekend
Race High Interest
Weekend
Peak Race
Weekday
Peak Weekend
Race
Medium High
Weekend Average
Weekend Alternative B
PAOT 340 780 690 320 850 680 610
Level of Service B C C B C C C Alternative C
PAOT 340 780 690 320 850 680 610
Level of Service B C C B C C C Alternative D
PAOT 340 780 690 320 850 680 610
Level of Service B C C B C C C
Peak Race Wkday
AC72 Wkend
AC45 Wkend
Fleet Week
Wkend
Peak Race
Weekday
Peak Weekend
Race
Medium High
Weekend
Average
Weekend
Alternative E
PAOT 300 780 780 1,310 320 850 680 610
Level of Service B C C D B C C C
The figures in the above tables indicate that the number of onsite visitors (PAOT) at Fort Point will increase over normal levels during the AC34 events. For all alternatives, the onsite crowding conditions, based on projected PAOT levels, can be expected to reach LOS “C” for the 2012 and 2013 peak weekend race days, with corresponding significant increases in pedestrian/bicycle flow volumes to and from the site. These levels compare to an estimated LOS “C” that was experienced for the 2011 Fleet Week Saturday at this location. The impacts projected for this location indicate that a certain level of visitation management measures will need to be implemented. Site “Level of Service” (LOS) Assessment. Applying the PAOT figures for each level of service range (described in a previous section of this report) to the above PAOTs indicates that level of service (LOS) “B” is maintained for the weekday races, and LOS “C” will be reached on the 2012 and 2013 weekend race days for all alternatives. Thus, visitor management measures are warranted for the 2012 and 2013 weekend race days. Pedestrian/bicycle flow estimates
Pedestrian and bicycle flow counts were collected along the major routes within Ft. Baker on Center Road, Moore Road and Sommerville Road. These counts were taken only on the Fleet Week Saturday (10/8/2011), so all estimates were derived from these counts, assuming that normal weekend visitation is 50% of Fleet Week and weekday visitation is 25% of Fleet Week.

AC34 Spectator Sites 6/5/2012
Page 68
Center Road: The following tables compare the existing and estimated daily pedestrian and bicycle flow counts at each of the three locations studied, along with calculated levels of service for each alternative and race day scenario:
Center Road - 2011 Pedestrian/Bicycle Traffic 2011 (Existing) Weekday Weekend Day Fleet Week 10/8/2011 Daily Traffic 400 800 1,610 Peak Hour Traffic 130 250 500 Level of Service B B C % Bicyclists 88% 88% 88%
Center Road - Pedestrian/Bicycle Hourly Flow Estimates
2012 2013
Alternative Peak Race Weekday
Peak Weekend
Race High Interest
Weekend Peak Race Weekday
Peak Weekend
Race
Medium High
Weekend Average
Weekend Alternative B
Hrly Peds/Bikes 140 280 270 140 280 260 260
Level of Service B C* B B C* B B Alternative C Hrly Peds/Bikes 130 280 270 130 280 260 260
Level of Service B C* B B C* B B Alternative D
Hrly Peds/Bikes 140 280 270 140 280 260 260
Level of Service B C* B B C* B B
Peak Race
Wkday AC72
Wkend AC45
Wkend
Fleet Week
Wkend Peak Race Weekday
Peak Weekend
Race
Medium High
Weekend
Average
Weekend Alternative E
Hrly Peds/Bikes 130 280 280 520 130 280 260 260
Level of Service B C* C* C B C* B B * Note: the indicated level of service C was adjusted to reflect the impacts of expected variations in the distribution of spectator, pedestrian and bicycle volumes from the analysis results, based on knowledge of situational conditions at this location – increased traffic due to special events creates additional crowding at this location than occurs at the same traffic levels during typical days.
The levels of service shown in the above table are based on the indicated hourly flow volumes and measured path width of 5 feet, along with the adjustments to the calculations as described in the above table. The pedestrian/bicycle volume ranges for each level of service at this location are shown in Appendix 2. The above table indicates that LOS “C” can be expected for peak weekend race days for all alternatives, and LOS “B” for all other race days for all alternatives.
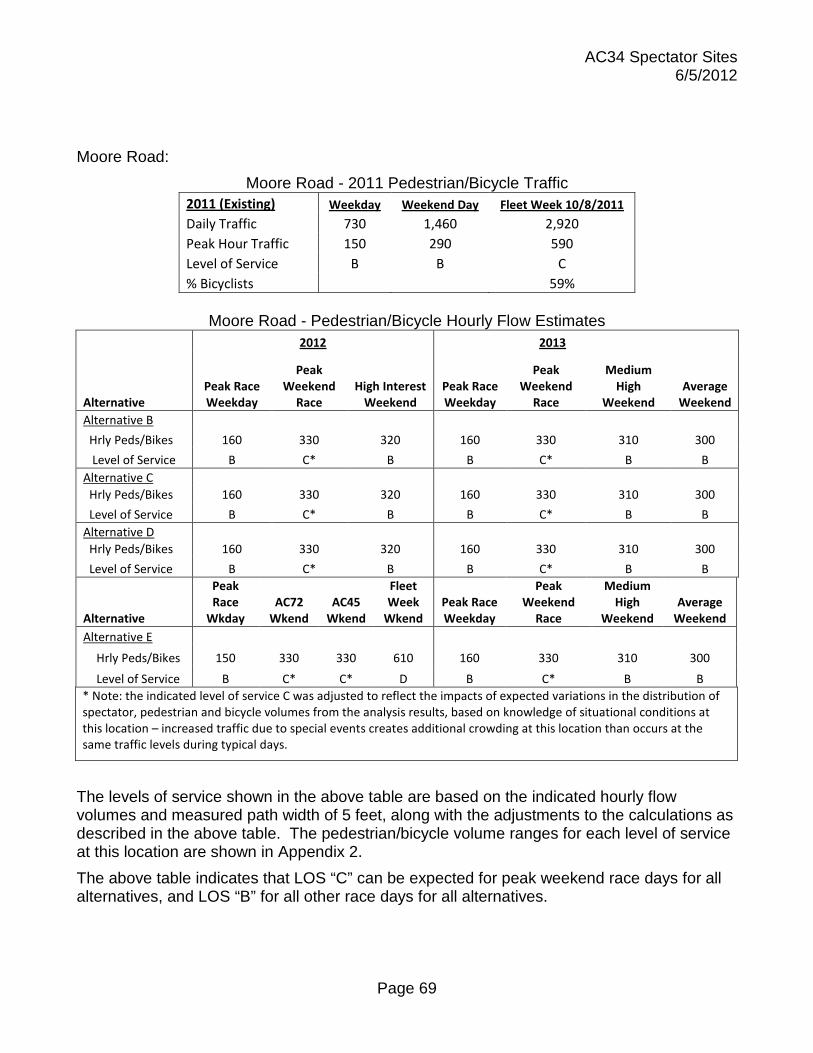
AC34 Spectator Sites 6/5/2012
Page 69
Moore Road:
Moore Road - 2011 Pedestrian/Bicycle Traffic 2011 (Existing) Weekday Weekend Day Fleet Week 10/8/2011 Daily Traffic 730 1,460 2,920 Peak Hour Traffic 150 290 590 Level of Service B B C % Bicyclists
59%
Moore Road - Pedestrian/Bicycle Hourly Flow Estimates
2012 2013
Alternative Peak Race Weekday
Peak Weekend
Race High Interest
Weekend Peak Race Weekday
Peak Weekend
Race
Medium High
Weekend Average
Weekend Alternative B
Hrly Peds/Bikes 160 330 320 160 330 310 300
Level of Service B C* B B C* B B Alternative C Hrly Peds/Bikes 160 330 320 160 330 310 300
Level of Service B C* B B C* B B Alternative D
Hrly Peds/Bikes 160 330 320 160 330 310 300
Level of Service B C* B B C* B B
Alternative
Peak Race
Wkday AC72
Wkend AC45
Wkend
Fleet Week
Wkend Peak Race Weekday
Peak Weekend
Race
Medium High
Weekend
Average
Weekend Alternative E
Hrly Peds/Bikes 150 330 330 610 160 330 310 300
Level of Service B C* C* D B C* B B * Note: the indicated level of service C was adjusted to reflect the impacts of expected variations in the distribution of spectator, pedestrian and bicycle volumes from the analysis results, based on knowledge of situational conditions at this location – increased traffic due to special events creates additional crowding at this location than occurs at the same traffic levels during typical days.
The levels of service shown in the above table are based on the indicated hourly flow volumes and measured path width of 5 feet, along with the adjustments to the calculations as described in the above table. The pedestrian/bicycle volume ranges for each level of service at this location are shown in Appendix 2. The above table indicates that LOS “C” can be expected for peak weekend race days for all alternatives, and LOS “B” for all other race days for all alternatives.
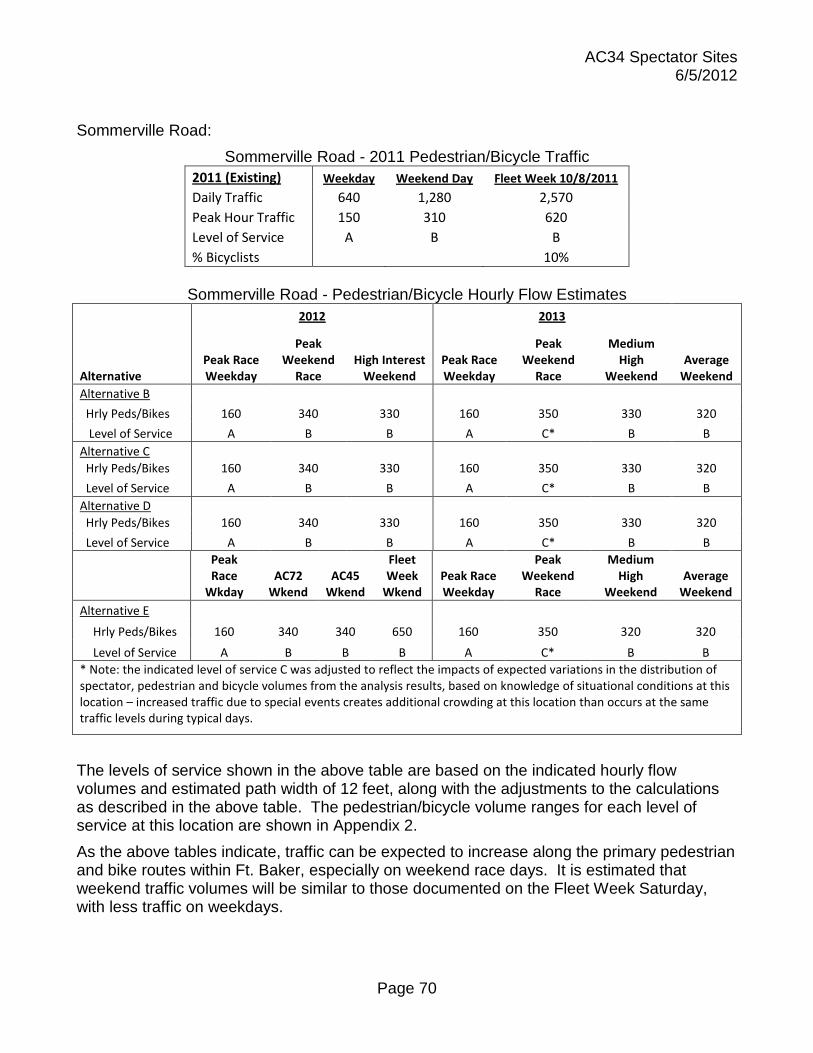
AC34 Spectator Sites 6/5/2012
Page 70
Sommerville Road: Sommerville Road - 2011 Pedestrian/Bicycle Traffic
2011 (Existing) Weekday Weekend Day Fleet Week 10/8/2011 Daily Traffic 640 1,280 2,570 Peak Hour Traffic 150 310 620 Level of Service A B B % Bicyclists
10%
Sommerville Road - Pedestrian/Bicycle Hourly Flow Estimates
2012 2013
Alternative Peak Race Weekday
Peak Weekend
Race High Interest
Weekend Peak Race Weekday
Peak Weekend
Race
Medium High
Weekend Average
Weekend Alternative B
Hrly Peds/Bikes 160 340 330 160 350 330 320
Level of Service A B B A C* B B Alternative C Hrly Peds/Bikes 160 340 330 160 350 330 320
Level of Service A B B A C* B B Alternative D
Hrly Peds/Bikes 160 340 330 160 350 330 320
Level of Service A B B A C* B B
Peak Race
Wkday AC72
Wkend AC45
Wkend
Fleet Week
Wkend Peak Race Weekday
Peak Weekend
Race
Medium High
Weekend
Average
Weekend Alternative E
Hrly Peds/Bikes 160 340 340 650 160 350 320 320
Level of Service A B B B A C* B B * Note: the indicated level of service C was adjusted to reflect the impacts of expected variations in the distribution of spectator, pedestrian and bicycle volumes from the analysis results, based on knowledge of situational conditions at this location – increased traffic due to special events creates additional crowding at this location than occurs at the same traffic levels during typical days.
The levels of service shown in the above table are based on the indicated hourly flow volumes and estimated path width of 12 feet, along with the adjustments to the calculations as described in the above table. The pedestrian/bicycle volume ranges for each level of service at this location are shown in Appendix 2. As the above tables indicate, traffic can be expected to increase along the primary pedestrian and bike routes within Ft. Baker, especially on weekend race days. It is estimated that weekend traffic volumes will be similar to those documented on the Fleet Week Saturday, with less traffic on weekdays.

AC34 Spectator Sites 6/5/2012
Page 71
Using the modified Level of Service approach, Sommerville Road is expected to reach LOS “C” for the 2013 peak weekend race day for all scenarios, LOS “B” for most other weekend scenarios, and LOS “A” for all weekday scenarios. The bicycle percentages at these locations on the Fleet Week Saturday were highest for Center Road (88%) and lowest for Sommerville Road (10%) – the bicycle percentage on Moore Road was between these two extremes at 59%.
Development of Monitoring Plan, Management Action Trigger Points and Measures
As the above analysis shows, the impact of the AC34 spectator projections for each of the NPS sites can be expected to result in various levels of crowding conditions, based on the specific site and race day scenario. Furthermore, since specific race events will have their own unique visitation profiles, there will be a level of uncertainty as to the spectator volumes that can be expected for any given race day. Thus, it is important that procedures be developed to enable ongoing monitoring of the visitation levels at each of the sites, trigger points be established at which specific management actions are implemented when critical visitation levels are reached, and that the required management action measures be developed. For each race day at each spectator site, preliminary management action measures will need to be planned in advance, as crowd control and security staff must be scheduled ahead of time. Thus, it will be important that the anticipated spectator levels for each AC34 race day be estimated well in advance of that race day to enable this advanced planning and scheduling for each race day. For the initial races in 2012, this estimation process will be inexact, but will become more accurate as knowledge is gained on the spectator levels and patterns from the early races. It is advisable to “over plan” the crowd control and security measures for the first few races, and refine these plans based on lessons learned from the first few races. Each race day will experience its own unique and unpredictable nature of visitation levels and patterns by both AC34 spectators and other visitors to the sites. A monitoring plan will be developed for the race days of bicycle and pedestrian traffic at key path locations, and PAOT counts at key spectator areas, so that the expected level of crowding and congestion for each site on that day can be anticipated as early in the day as possible, and management action measures be implemented as soon it is determined that the established trigger points are reached, or will be reached on that day. The following areas are recommended for these monitoring locations:
• Hyde Street Pier – pedestrian counts at pier entry, using existing electronic counter. • SAFR – pedestrian & bicycle counts at the Jefferson Street entrance; PAOT counts at
the bleachers and beach. • Fort Mason – pedestrian & bicycle counts at the pinch point on Laguna Ave. • Crissy Field East – pedestrian & bicycle counts at the Class 1 Path and at the
waterfront entry; PAOT counts at the beach.

AC34 Spectator Sites 6/5/2012
Page 72
• Crissy Field West – pedestrian & bicycle counts on the Promenade; PAOT counts at the beach and planned bleachers.
• Crissy West Picnic Area – pedestrian & bicycle counts on the Promenade; PAOT counts at the picnic area and Warming Hut plaza area.
• Fort Point – pedestrian & bicycle counts on Marine Drive; PAOT counts along the waterfront.
• Presidio intersections – pedestrian & bicycle counts at the Mason St./Crissy Field Ave. intersection and the Long Ave./Lincoln Blvd.
• Golden Gate Bridge Overlook – pedestrian & bicycle counts on the Coastal Trail; PAOT counts at the two selected viewing areas.
• Battery Spencer – pedestrian & bicycle counts on the entry trails to Battery Spencer; PAOT counts at the main viewing area.
• Fort Baker – pedestrian & bicycle counts on Center Road, Moore Road and Sommerville Road; PAOT counts at the main spectator areas.
Based on the analysis described above in this report, it is planned that trigger points will be developed for each of the above monitoring locations, corresponding to each relevant level of service (LOS “A” through LOS “F”). Management action measures will also be developed for implementation at each location that responds to the established management trigger for each relevant level of service. Initially, these will be based on the data collected and analysis to date, but later will be refined based on operating knowledge gained from the first few race events.
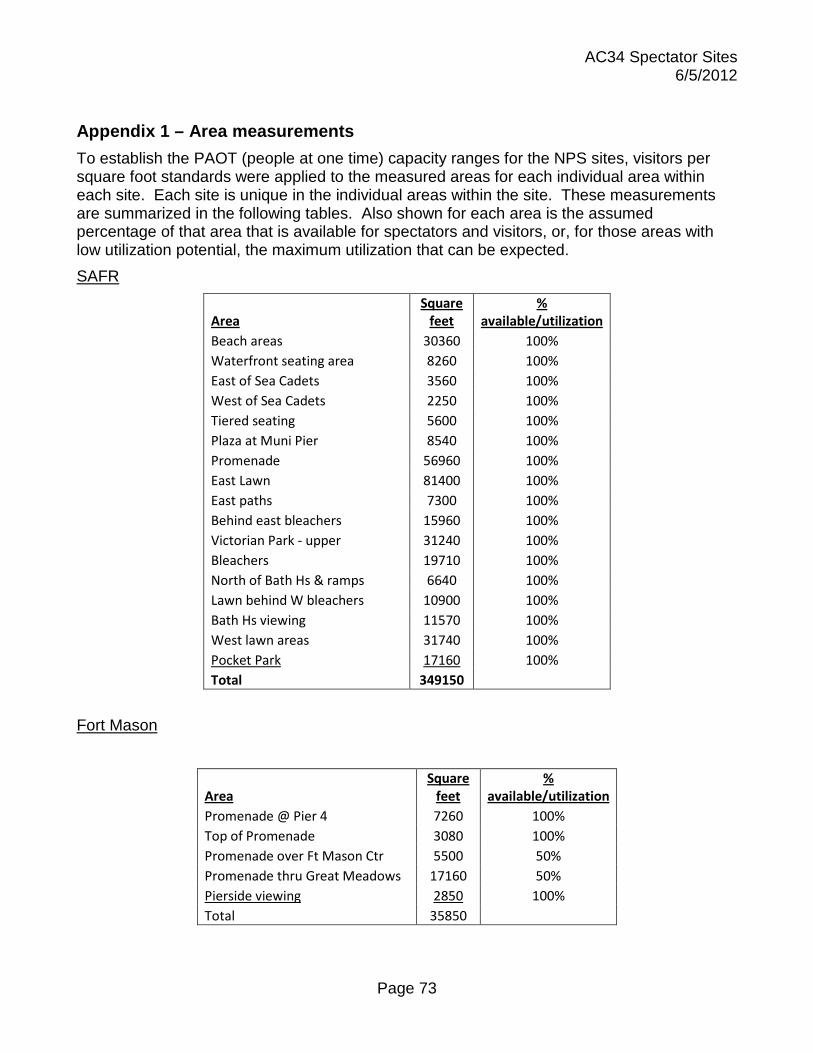
AC34 Spectator Sites 6/5/2012
Page 73
Appendix 1 – Area measurements
To establish the PAOT (people at one time) capacity ranges for the NPS sites, visitors per square foot standards were applied to the measured areas for each individual area within each site. Each site is unique in the individual areas within the site. These measurements are summarized in the following tables. Also shown for each area is the assumed percentage of that area that is available for spectators and visitors, or, for those areas with low utilization potential, the maximum utilization that can be expected. SAFR
Area Square
feet %
available/utilization Beach areas 30360 100% Waterfront seating area 8260 100% East of Sea Cadets 3560 100% West of Sea Cadets 2250 100% Tiered seating 5600 100% Plaza at Muni Pier 8540 100% Promenade 56960 100% East Lawn 81400 100% East paths 7300 100% Behind east bleachers 15960 100% Victorian Park - upper 31240 100% Bleachers 19710 100% North of Bath Hs & ramps 6640 100% Lawn behind W bleachers 10900 100% Bath Hs viewing 11570 100% West lawn areas 31740 100% Pocket Park 17160 100% Total 349150
Fort Mason
Area Square
feet %
available/utilization Promenade @ Pier 4 7260 100% Top of Promenade 3080 100% Promenade over Ft Mason Ctr 5500 50% Promenade thru Great Meadows 17160 50% Pierside viewing 2850 100% Total 35850

AC34 Spectator Sites 6/5/2012
Page 74
Crissy Field East
CFE Area Square
feet % available/
utilization Beach-3 18300 100% Beach-4 85380 100% Beach-5 106290 100% Beach-8 7410 100% Beach-9 26140 100% Beach-11 35720 100% Beach-12 14810 0% Beach-14 24390 0% Beach-16 19600 0% Beach-18 18730 0% Promenade-east 40130 100% Promenade-west 51550 0% Parking area (Tailgaters) 46390 50% Café area 7960 100% Field south of parking 18990 20% Field east of wetlands 25260 50% Total 547050
Note that, in the above table, the indicated beach numbers refer to sections of the beach, from east to west, that were divided for the purpose of facilitating visitor counts and measurements. Beach areas 12 to 18 represent the west beach areas that will be closed to the public. Crissy Field West
CFW Area Square
feet %
available/utilization Beach-1 80150 100% Beach-7 153767 100% Beach-7b 76666 100% Beach-8 44431 100% Promenade 53064 100% Field-2 502247 100% Field-3 321908 100% Field-4 234788 100% Field-5 82328 100% Total 1549350

AC34 Spectator Sites 6/5/2012
Page 75
Note that, in the above table, the indicated beach and field numbers refer to sections of these areas that were divided for the purpose of facilitating visitor counts and measurements. Crissy Picnic Area
Area Square
feet %
available/utilization Beach 16550 100% Promenade 18260 100% Field-1 20040 100% Field-2 45740 100% Field-4 16730 100% Field-5 12630 100% Dock 18730 100% Warming Hut Area-6 3970 100% Warming Hut Area-7 1060 100% Warming Hut Area-8 5890 100% Warming Hut Area-9 2800 100% Total 162400
Note that, in the above table, the indicated Warming Hut and field numbers refer to sections of these areas that were divided for the purpose of facilitating visitor counts and measurements. Fort Point
Area Square
feet %
available/utilization Bayside viewing areas 3570 100%
Golden Gate Bridge Viewing Areas
Area Square
feet %
available/utilization Upper Viewing Area 2470 100% Lower Viewing Area 1430 100% Total 3900
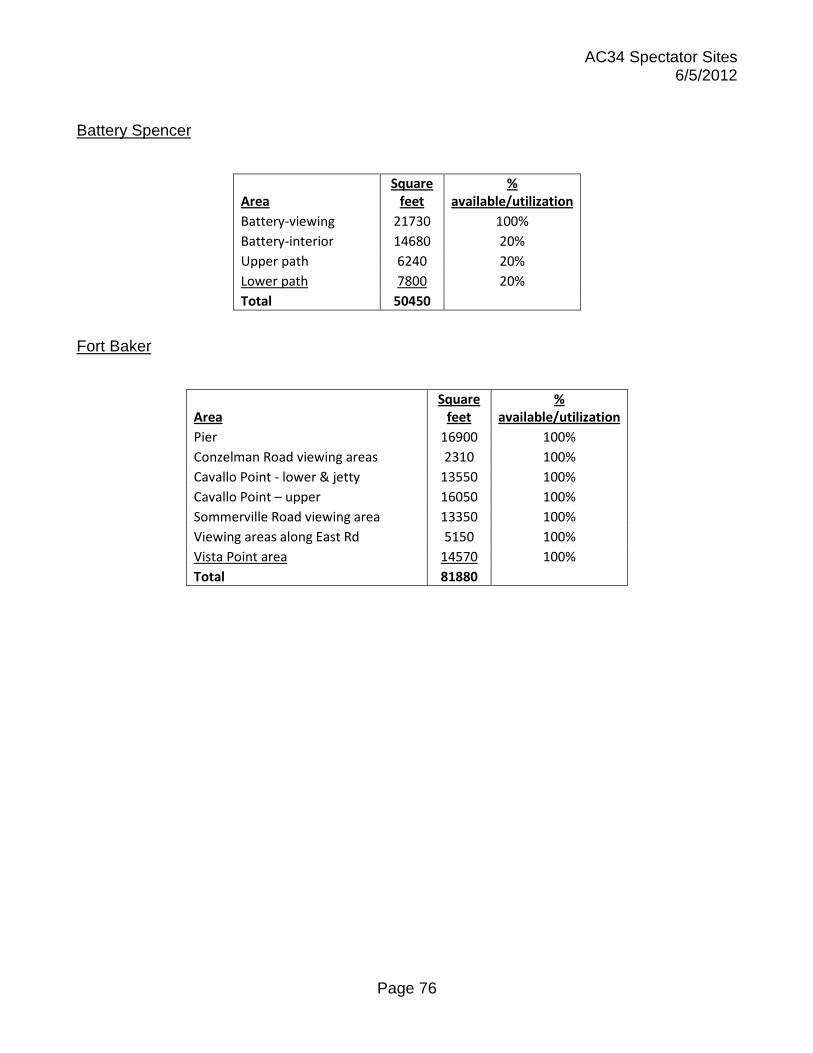
AC34 Spectator Sites 6/5/2012
Page 76
Battery Spencer
Area Square
feet %
available/utilization Battery-viewing 21730 100% Battery-interior 14680 20% Upper path 6240 20% Lower path 7800 20% Total 50450
Fort Baker
Area Square
feet %
available/utilization Pier 16900 100% Conzelman Road viewing areas 2310 100% Cavallo Point - lower & jetty 13550 100% Cavallo Point – upper 16050 100% Sommerville Road viewing area 13350 100% Viewing areas along East Rd 5150 100% Vista Point area 14570 100% Total 81880

AC34 Spectator Sites 6/5/2012
Page 77
Appendix 2 – Pedestrian/Bicycle Flow Level of Service Ranges
Jefferson Street (18.0’ path width at narrowest point)
LOS Hourly Flow Volume A <440 B 430-1589 C 1590-2149 D 2150-3229 E 3230-5379 F >5500
GG Promenade at Bath House (18.0’ width)
LOS Hourly Flow Volume A <440 B 430-939 C 940-2149 D 2150-3229 E 3230-5379 F >5500
Note: the lower end of the range for LOS C was reduced to 940 to reflect the impacts of expected variations in the distribution of spectator, pedestrian and bicycle volumes from the analysis results, based on knowledge of situational conditions at this location – during special events, visitors tend to congregate in this area, creating more congestion than would normally be experienced at the indicated pedestrian/bike flow volumes. GG Promenade at west end of SAFR (18.0’ path width)
LOS Hourly Flow Volume A <440 B 430-599 C 600-2149 D 2150-3229 E 3230-5379 F >5500
Note: the lower end of the range for LOS C was reduced to 600 to reflect the impacts of expected variations in the distribution of spectator, pedestrian and bicycle volumes from the analysis results, based on knowledge of situational conditions at this location – during special events, visitors tend to congregate in this area, creating more congestion than would normally be experienced at the indicated pedestrian/bike flow volumes.

AC34 Spectator Sites 6/5/2012
Page 78
GG Promenade at east end of Ft. Mason (15.8’ path width)
LOS Hourly Flow Volume A <377 B 377-649 C 650-1886 D 1887-2833 E 2834-4721 F >4722
Note: the lower end of the range for LOS C was reduced to 650 to reflect the impacts of expected variations in the distribution of spectator, pedestrian and bicycle volumes from the analysis results, based on knowledge of situational conditions at this location – during special events, visitors tend to linger in this area, due to the opportunity for excellent viewing, creating more congestion than would normally be experienced at the indicated pedestrian/bike flow volumes. Ft. Mason Pinch Point on Laguna St. Sidewalk (6.0’ width at pinch point)
LOS Hourly Flow Volume A <143 B 143-502 C 503-716 D 717-1076 E 1077-1793 F >1793
Crissy Field East Class 1 Path (25’ path width)
LOS Hourly Flow Volume A <597 B 597-1359 C 1360-2985 D 2986-4485 E 4486-7472 F >7472
Note: the lower end of the range for LOS C was reduced to 1,360 to reflect the impacts of expected variations in the distribution of spectator, pedestrian and bicycle volumes from the analysis results, based on knowledge of situational conditions at this location – due to the proximity of this location to Marina Green, it experiences significant spillover visitation, especially when Marina Green becomes crowded and many visitors seek less crowded conditions at Crissy Field..

AC34 Spectator Sites 6/5/2012
Page 79
Crissy Field East Waterfront Entry (25’ path width)
LOS Hourly Flow Volume A <360 B 360-829 C 830-2985 D 2986-4485 E 4486-7472 F >7472
Note: the range for LOS B was reduced to 360-829 and the lower end of the range for LOS C was reduced to 830 to reflect the impacts of expected variations in the distribution of spectator, pedestrian and bicycle volumes from the analysis results, based on knowledge of situational conditions at this location – due to the proximity of this location to Marina Green, it experiences significant spillover visitation, especially when Marina Green becomes crowded and many visitors seek less crowded conditions at Crissy Field.. Crissy Field East Promenade at Wetlands (25’ path width)
LOS Hourly Flow Volume A <540 B 540-1109 C 1110-2986 D 2986-4486 E 4486-7472 F >7472
Note: the range for LOS B was reduced to 540-1109 and the lower end of the range for LOS C was reduced to 1110 to reflect the impacts of expected variations in the distribution of spectator, pedestrian and bicycle volumes from the analysis results, based on knowledge of situational conditions at this location – due to the proximity of this location to Marina Green, it experiences significant spillover visitation, especially when Marina Green becomes crowded and many visitors seek less crowded conditions at Crissy Field.

AC34 Spectator Sites 6/5/2012
Page 80
Crissy Field West Promenade (East End of Airfield – 22’ path width)
LOS Hourly Flow Volume A <526 B 526-949 C 950-2627 D 2628-3947 E 3948-6576 F >6576
Note: the lower end of the range for LOS C was reduced to 950 to reflect the impacts of expected variations in the distribution of spectator, pedestrian and bicycle volumes from the analysis results, based on knowledge of situational conditions at this location – due to the proximity of this location to Marina Green, it experiences significant spillover visitation, especially when Marina Green becomes crowded and many visitors seek less crowded conditions at Crissy Field. Crissy Field West Promenade (West End of Airfield) – 22’ path width
LOS Hourly Flow Volume A <526 B 526-1845 C 1846-2627 D 2628-3947 E 3948-6576 F >6576
Crissy West Picnic Area Promenade (East of Picnic Area) – 22’ path width
LOS Hourly Flow Volume A <509 B 510-879 C 880-2627 D 2628-3947 E 3948-6576 F >6576
Note: the range for LOS B was reduced to 510-879, and the lower end of the range for LOS C was reduced to 880 to reflect the impacts of expected variations in the distribution of spectator, pedestrian and bicycle volumes from the analysis results, based on knowledge of situational conditions at this location – this area tends to draw concentrations of visitors during special events, as this is the only location in the west Crissy Field area where picnicking opportunities are available.

AC34 Spectator Sites 6/5/2012
Page 81
Crissy West Picnic Area Promenade (near Warming Hut) – 22’ path width
LOS Hourly Flow Volume A <526 B 526-1845 C 1846-2627 D 2628-3947 E 3948-6576 F >6576
Marine Drive to Fort Point (6’ walkway width)
LOS Hourly Flow Volume A <143 B 143-502 C 503-716 D 717-1076 E 1077-1793 F >1793
Crissy/Mason/McDowell Intersection
LOS Hourly Flow Volume A <260 B 263-589 C 590-1399 D 1400-2889 E 2890-6000 F >6000
Since this intersection involves mixed vehicular, pedestrian and bicycle traffic, the levels of service cannot be easily defined by the path width. Therefore, the LOS ranges shown in the above table were developed from management knowledge of the traffic conditions experienced at that intersection for normal operating conditions and for special events.

AC34 Spectator Sites 6/5/2012
Page 82
Long Ave./Lincoln Blvd. Intersection (11’ path width)
LOS Hourly Flow Volume A <263 B 263-599 C 600-909 D 910-1973 E 1974-3288 F >3288
Note: the range for LOS C was reduced to 600-909, and the lower end of the range for LOS D was reduced to 910 to reflect the impacts of expected variations in the distribution of spectator, pedestrian and bicycle volumes from the analysis results, based on knowledge of situational conditions at this location – since many visitors are expected to pass through this intersection as part of their AC34 travel between Crissy Field and the Golden Gate Bridge areas, conditions at this intersection are expected to be more crowded than is indicated by the calculated ranges for LOS C & D. Coastal Trail at West Side of GGB Overlook (10’ path width)
LOS Hourly Flow Volume A <239 B 239-838 C 839-1193 D 1194-1793 E 1794-2989 F >2989
Coastal Trail at East Side of GGB Overlook (9.7’ path width)
LOS Hourly Flow Volume A <232 B 232-579 C 580-1129 D 1130-1741 E 1741-2899 F >2899
Note: the range for LOS C was reduced to 580-1129, and the lower end of the range for LOS D was reduced to 1130 to reflect the impacts of expected variations in the distribution of spectator, pedestrian and bicycle volumes from the analysis results, based on knowledge of

AC34 Spectator Sites 6/5/2012
Page 83
situational conditions at this location – since many visitors are expected to pass through this trail as part of their AC34 travel between San Francisco and the Golden Gate Bridge areas, conditions at this intersection are expected to be more crowded than is indicated by the calculated ranges for LOS C & D. Battery Spencer Main Walkways – 8’ path width
LOS Hourly Flow Volume A <191 B 191-670 C 671-955 D 956-1435 E 1436-2391 F >2391
Center Road – 5’ path width
LOS Hourly Flow Volume A <119 B 119-279 C 280-596 D 597-896 E 897-1494 F >1494
Note: the lower end of the range for LOS C was reduced to 280 to reflect the impacts of expected variations in the distribution of spectator, pedestrian and bicycle volumes from the analysis results, based on knowledge of situational conditions at this location – increased traffic due to special events creates additional crowding at this location than occurs at the same traffic levels during normal days. Moore Road – 5’ path width
LOS Hourly Flow Volume A <119 B 119-329 C 330-596 D 597-896 E 897-1494 F >1494
Note: the lower end of the range for LOS C was reduced to 330 to reflect the impacts of expected variations in the distribution of spectator, pedestrian and bicycle volumes from the

AC34 Spectator Sites 6/5/2012
Page 84
analysis results, based on knowledge of situational conditions at this location – accommodating special events requires increased management over typical visitation conditions. Sommerville Road – 12’ wide path
LOS Hourly Flow Volume A <287 B 287-349 C 350-1433 D 1433-2153 E 2153-3587 F >3587
Note: the lower end of the range for LOS C was reduced to 350 to reflect the impacts of expected variations in the distribution of spectator, pedestrian and bicycle volumes from the analysis results, based on knowledge of situational conditions at this location – accommodating special events requires increased management over typical visitation conditions.

AC34 Spectator Sites 6/5/2012
Page 85
Appendix 3 – Visitor Count Study Maps
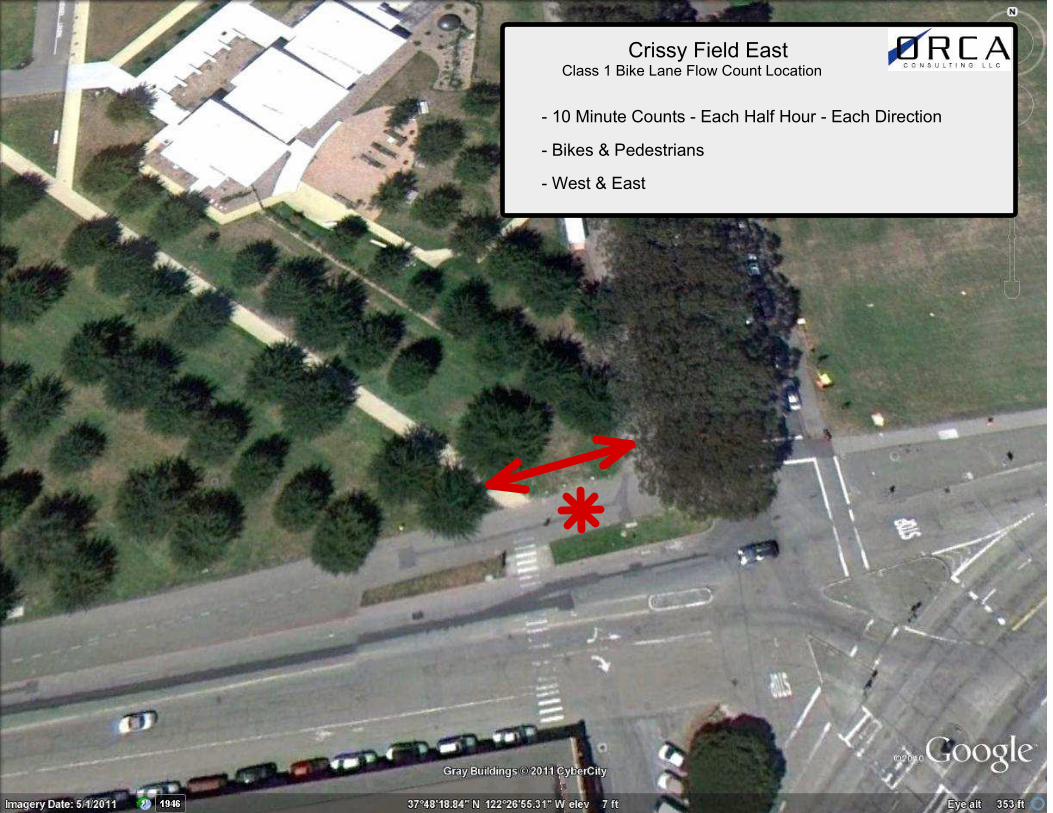
Crissy Field East
- 10 Minute Counts - Each Half Hour - Each Direction
Class 1 Bike Lane Flow Count Location
- Bikes & Pedestrians
- West & East

Crissy Field East
- 10 Minute Counts Each Direction Each Half-Hour
East Entry at Waterfront Flow Count Location
- Bicycles & Pedestrians
- East & West
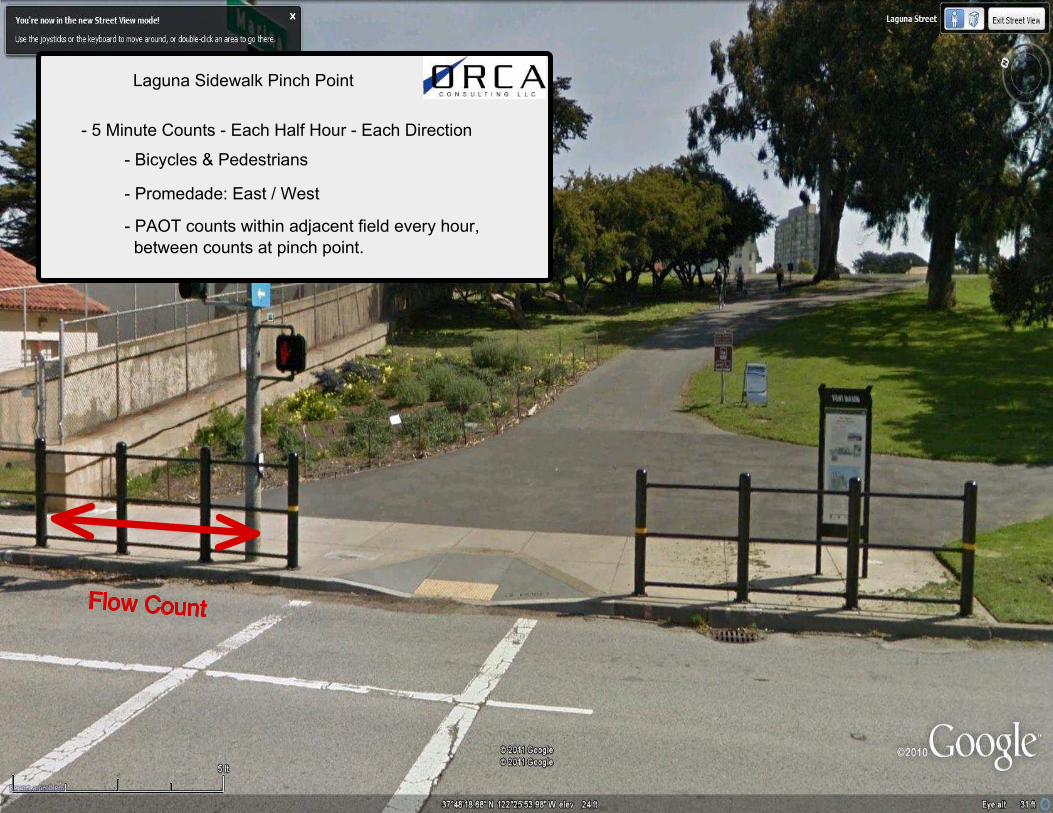
Flow Count
Laguna Sidewalk Pinch Point
- Bicycles & Pedestrians
- 5 Minute Counts - Each Half Hour - Each Direction
- Promedade: East / West
- PAOT counts within adjacent field every hour,
between counts at pinch point.
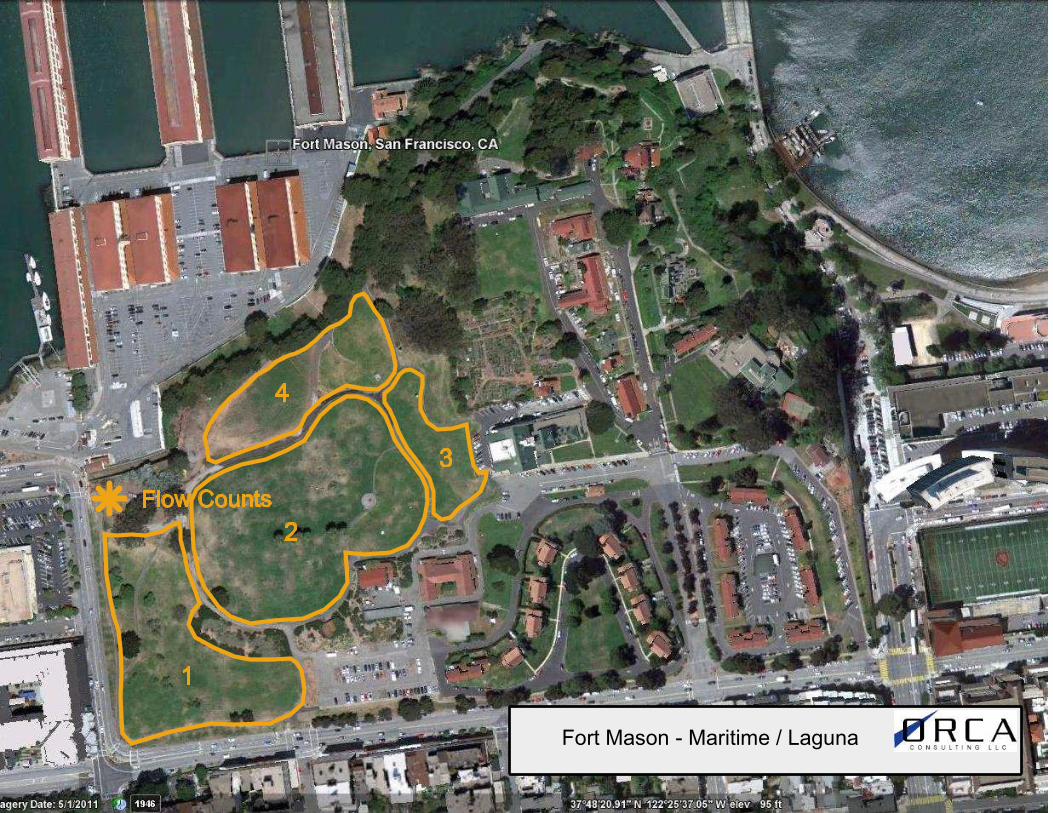
Fort Mason - Maritime / Laguna
Flow Counts
1
2
3
4

Jefferson St. Bollards - Flow Counts
- Bicycles & Pedestrians
- 10 Minute Counts Each Half Hour
- East & West


3
45
6
Cafe
Flow Counts
2
1
7
Crissy Field East 1
- PAOT Counts By Area:
- Pedestrian & Bike Flow Counts at 2 Locations
- Beach - Cafe: Indoor | Outdoor- Meadow
Flow Counts


Crissy Field West - Intersection
- For Each Intersection:
- Pedestrian & Bike Counts in Each Direction
- 5 Minutes Each Count
- Counts Each Half-Hour
Long &
Lincoln

Crissy Field West
- PAOT Counts By Area:
- Sample Flow Counts at Two Locations
- Beach
- Meadow
1
6
7
8
5
4
3
2
Sample
FlowB
Bollards
Sample
Flow
A

1
2
4
5
6
97
8
11
Sam
ple
FlowA
10
3
Sample
FlowB
Crissy West
- Sample Flow Counts at 2 Locations
- PAOT Counts:
- Warming Hut Areas- Meadow- Beach
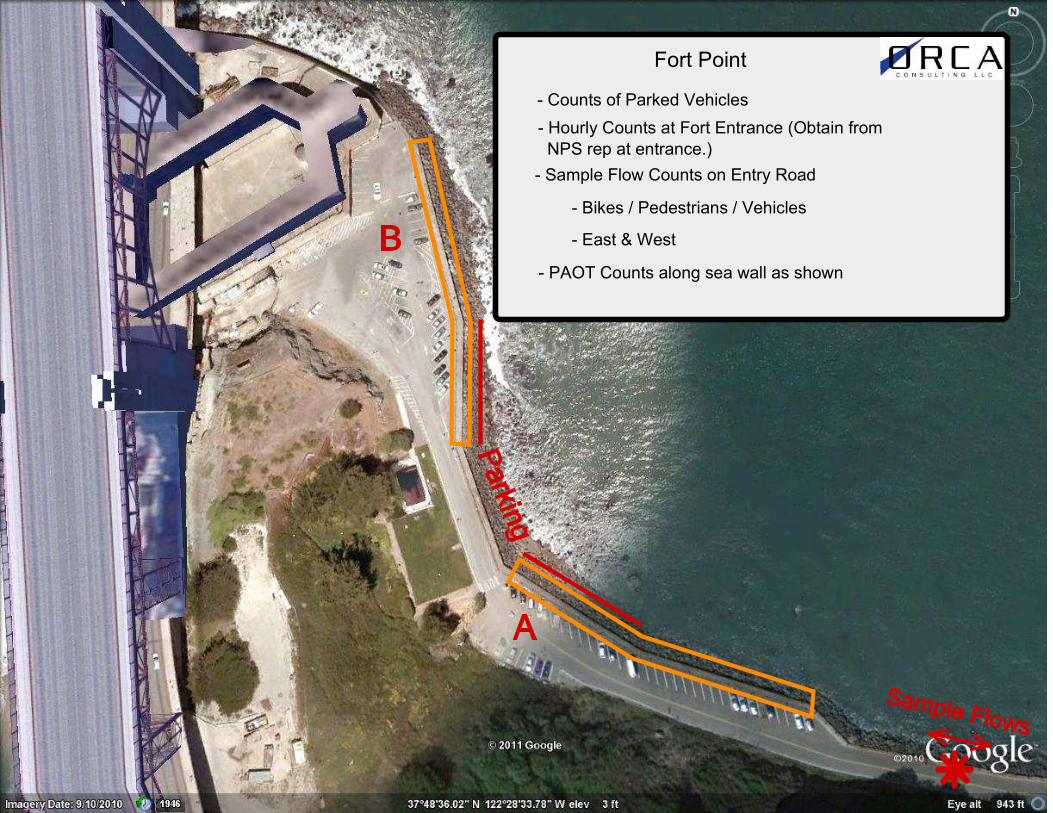
Fort Point
- Sample Flow Counts on Entry Road
- Counts of Parked Vehicles
- PAOT Counts along sea wall as shown
- Bikes / Pedestrians / Vehicles
- East & West
Sample Flows
B
Parkin
g
A
- Hourly Counts at Fort Entrance (Obtain from
NPS rep at entrance.)

1
A
10
1114
At Bollards
Maritime Park
- East Entry - Flow Counts
- PAOT Counts By Section
- Each Direction Per Half Hour
- 3 Locations - Flow Count Samples
B
5
6
7
8
9
1213
2
3
4
