appendix b – laboratory test resultsapps.azdot.gov/files/cns/portfolio/pf2016066/h... · poorly...
TRANSCRIPT
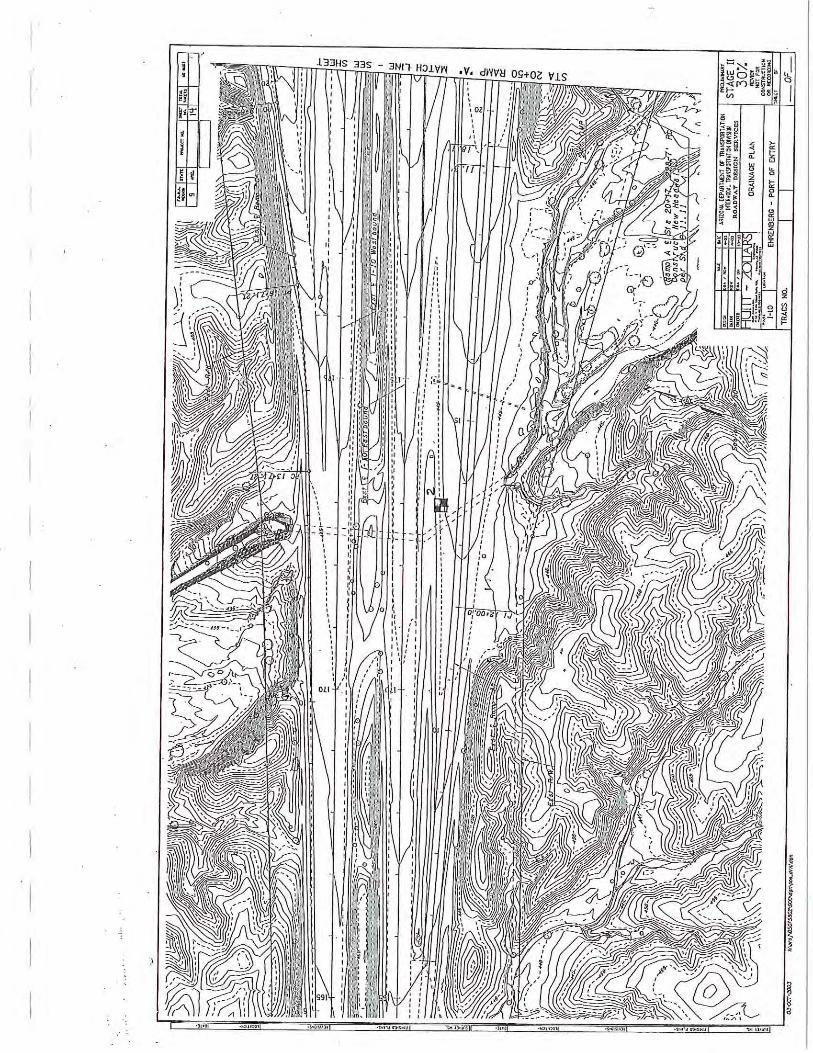
APPENDIX B – LABORATORY TEST RESULTS
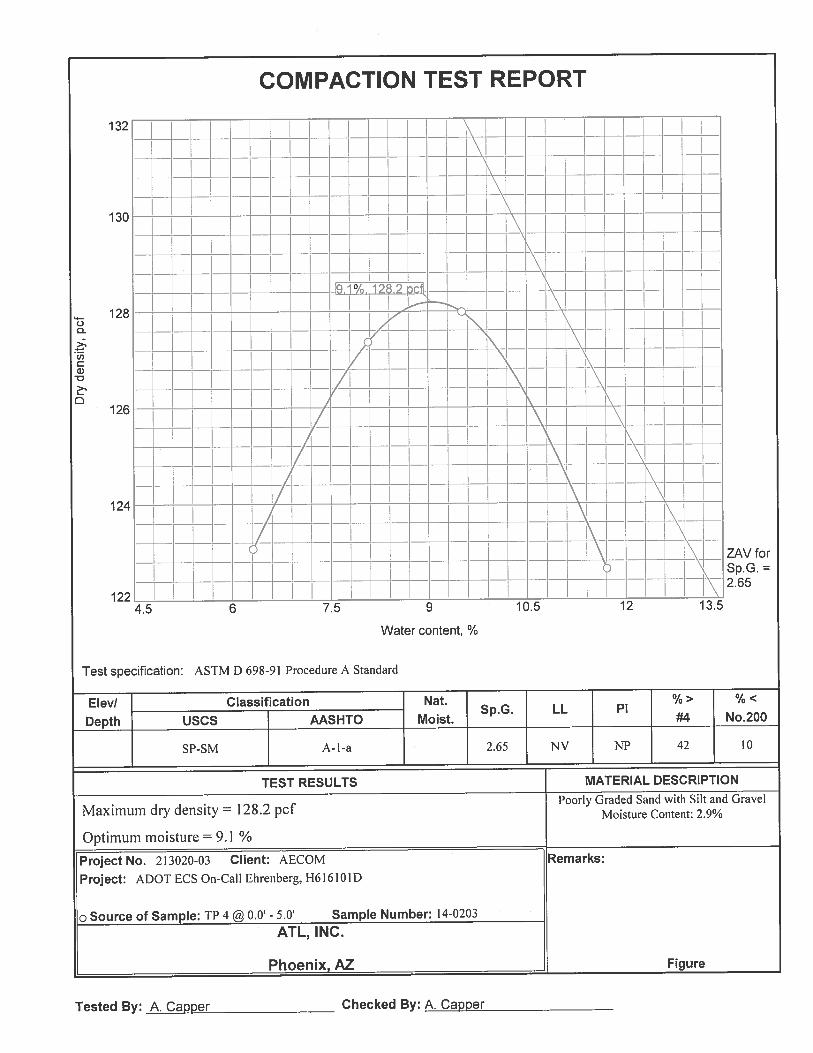
ATL, INC.
Phoenix, AZ
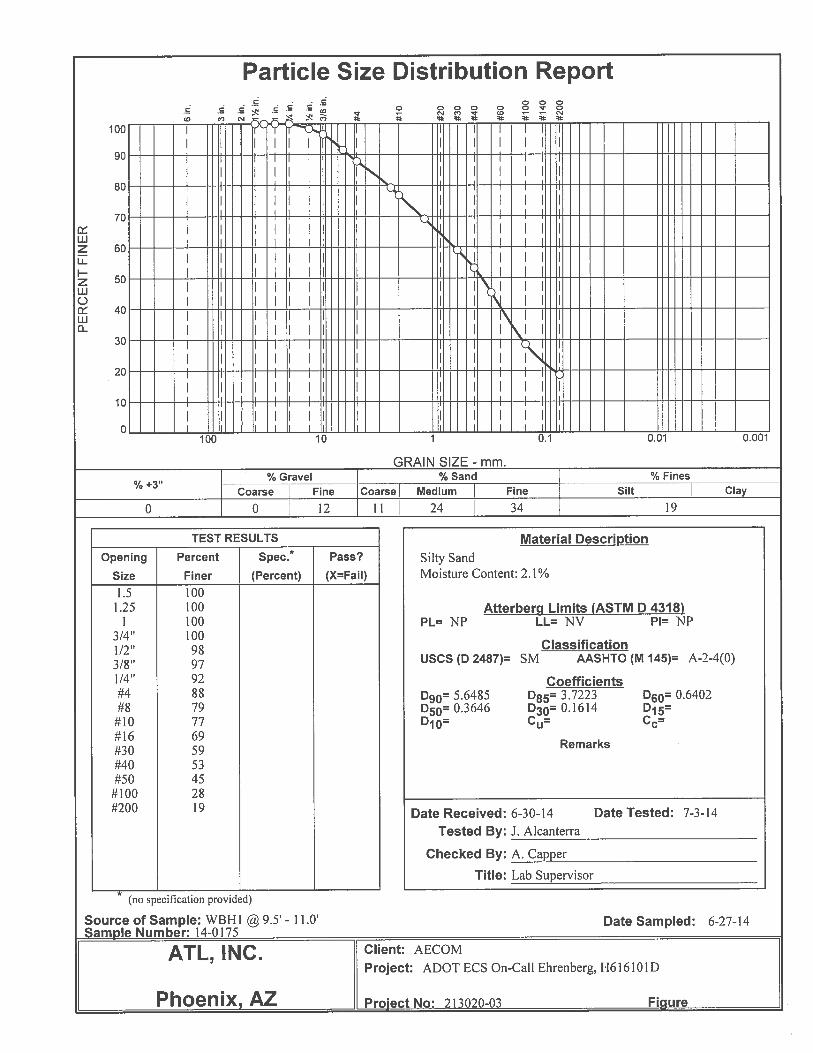
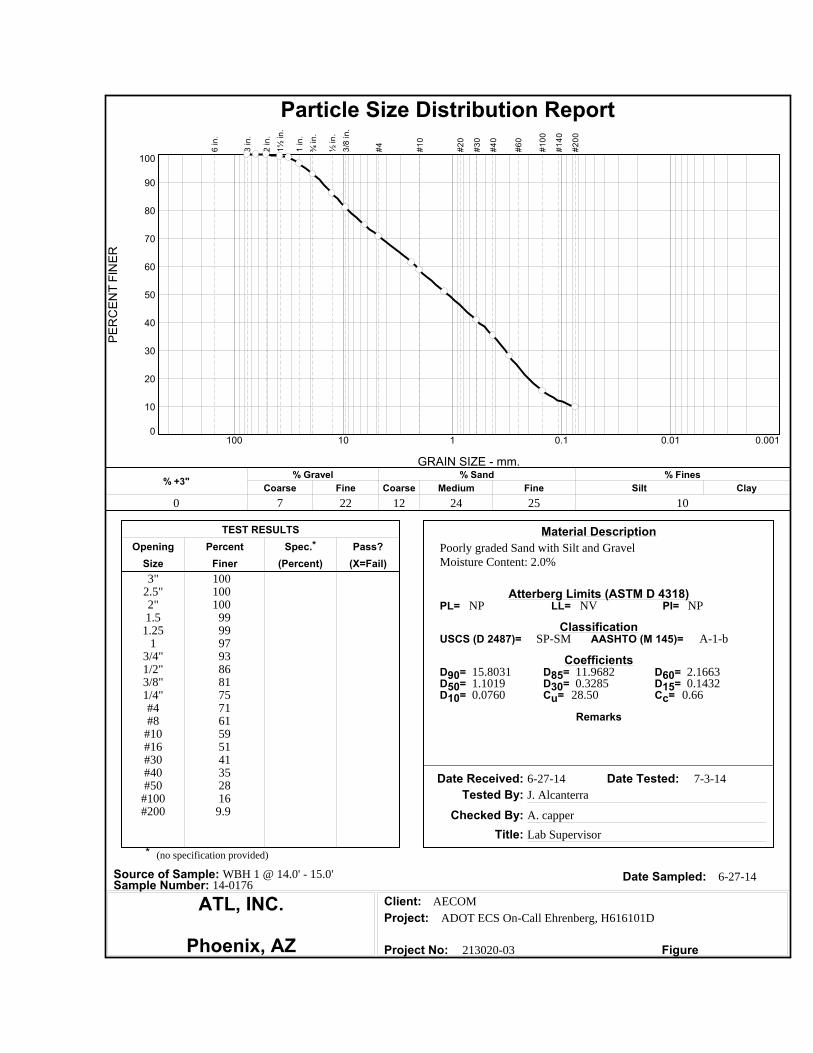
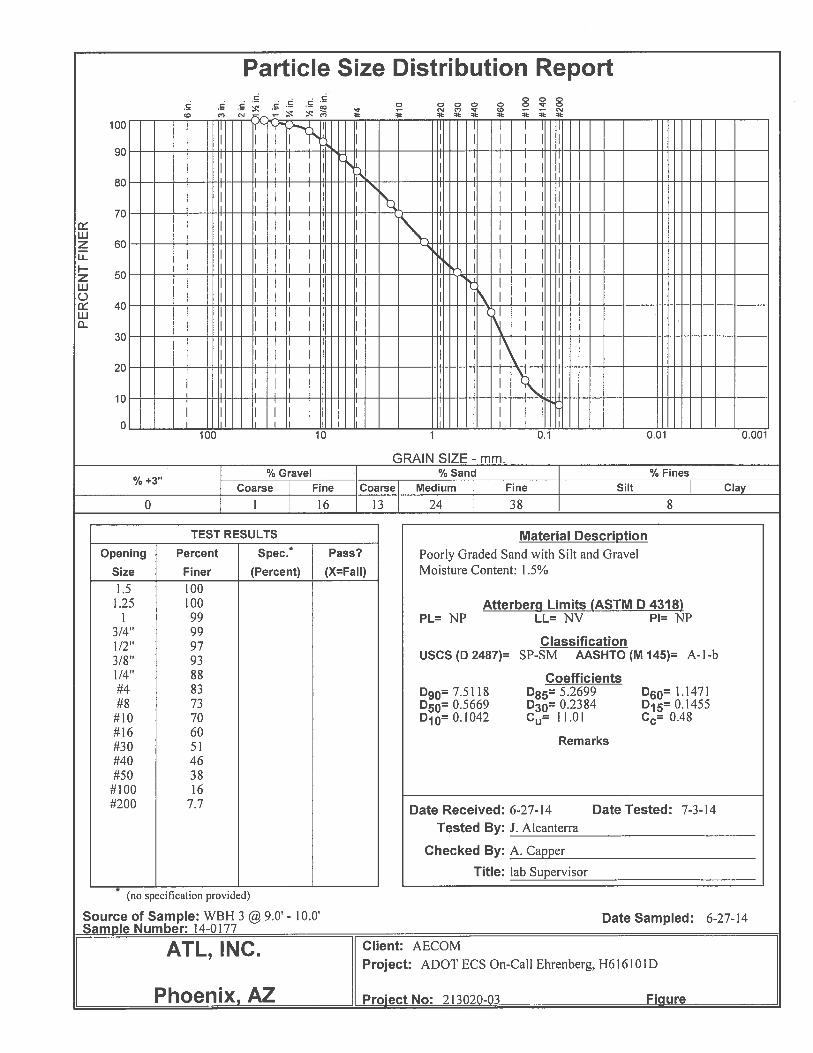
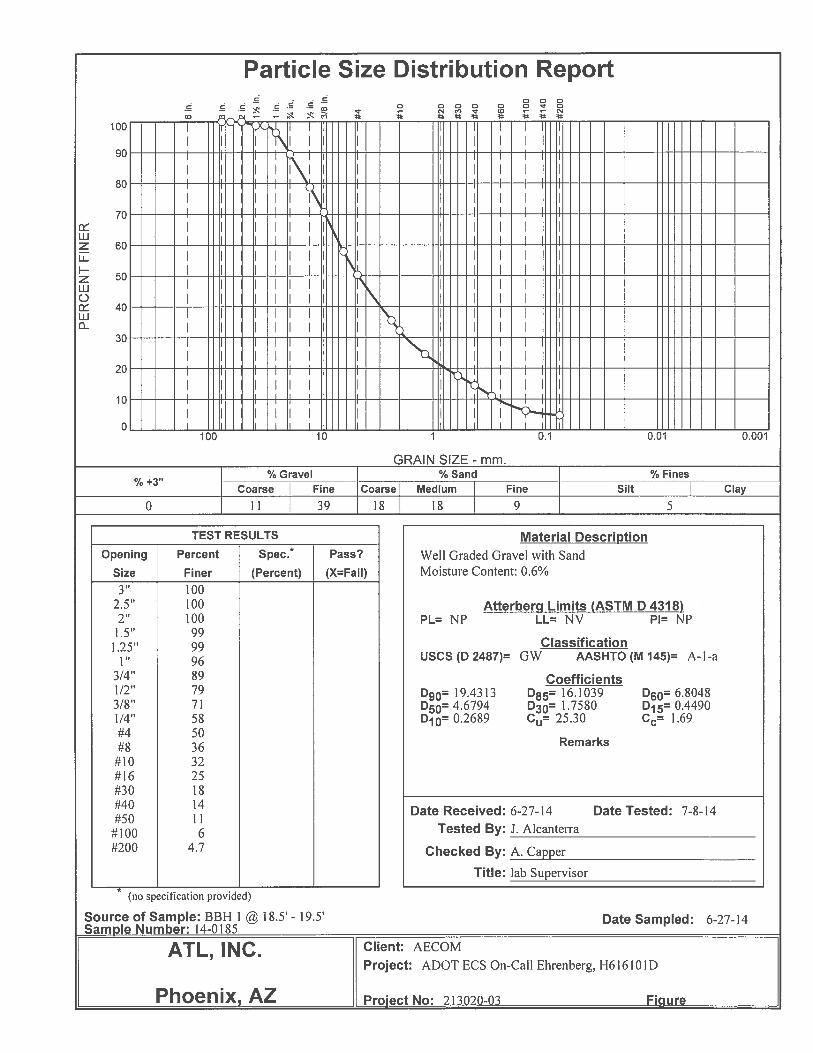
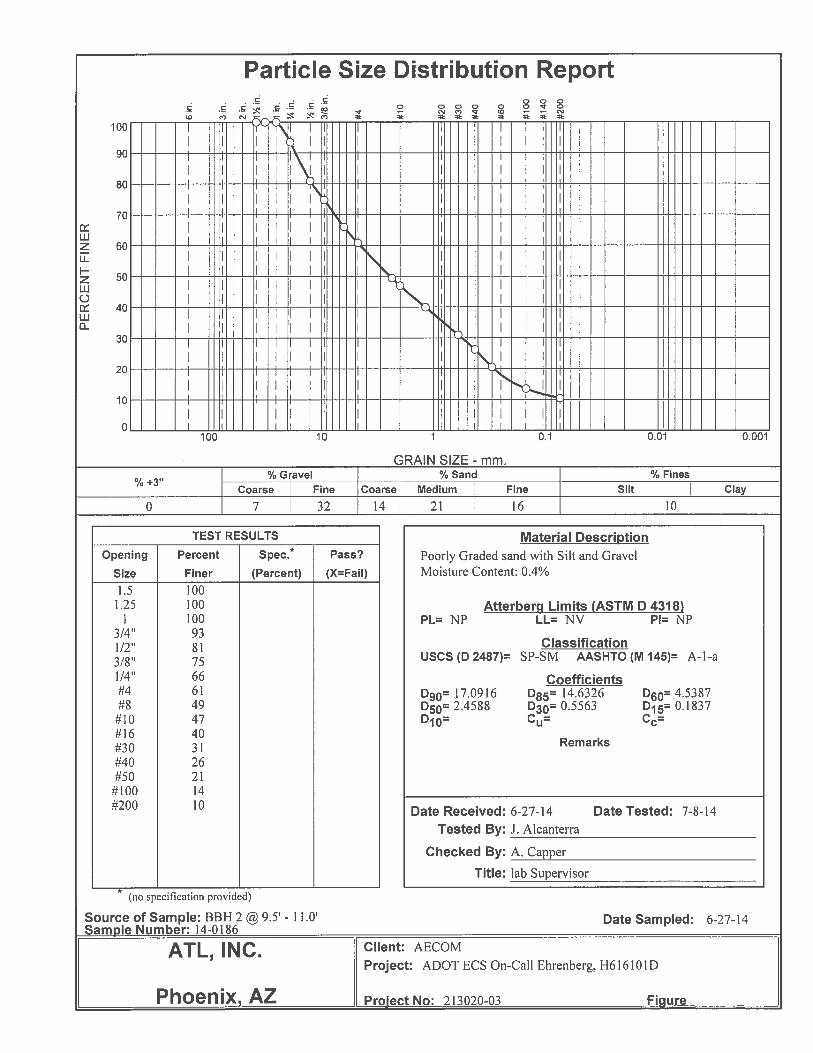
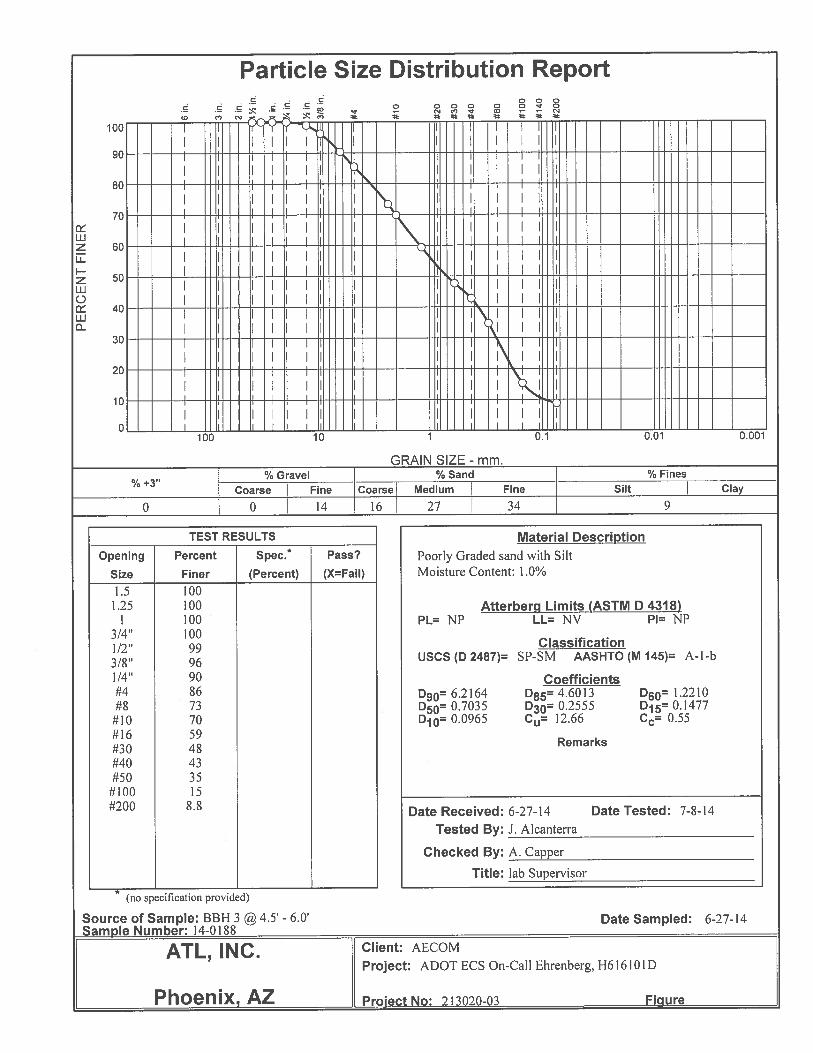
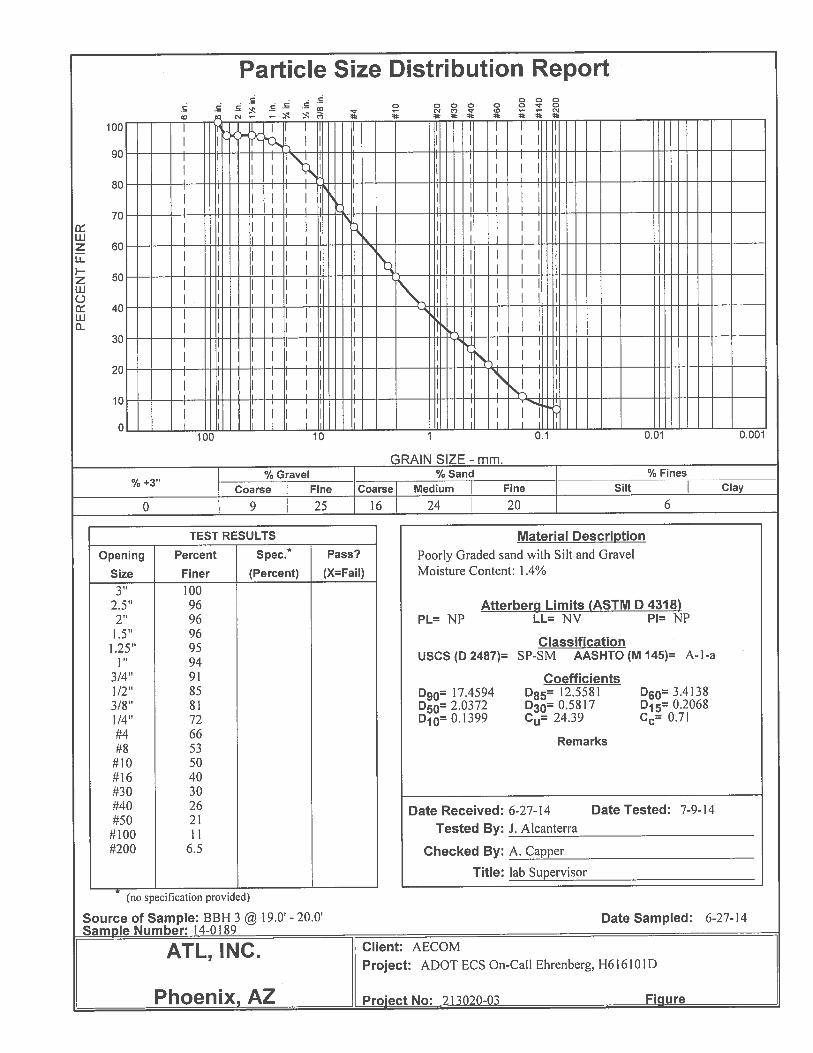
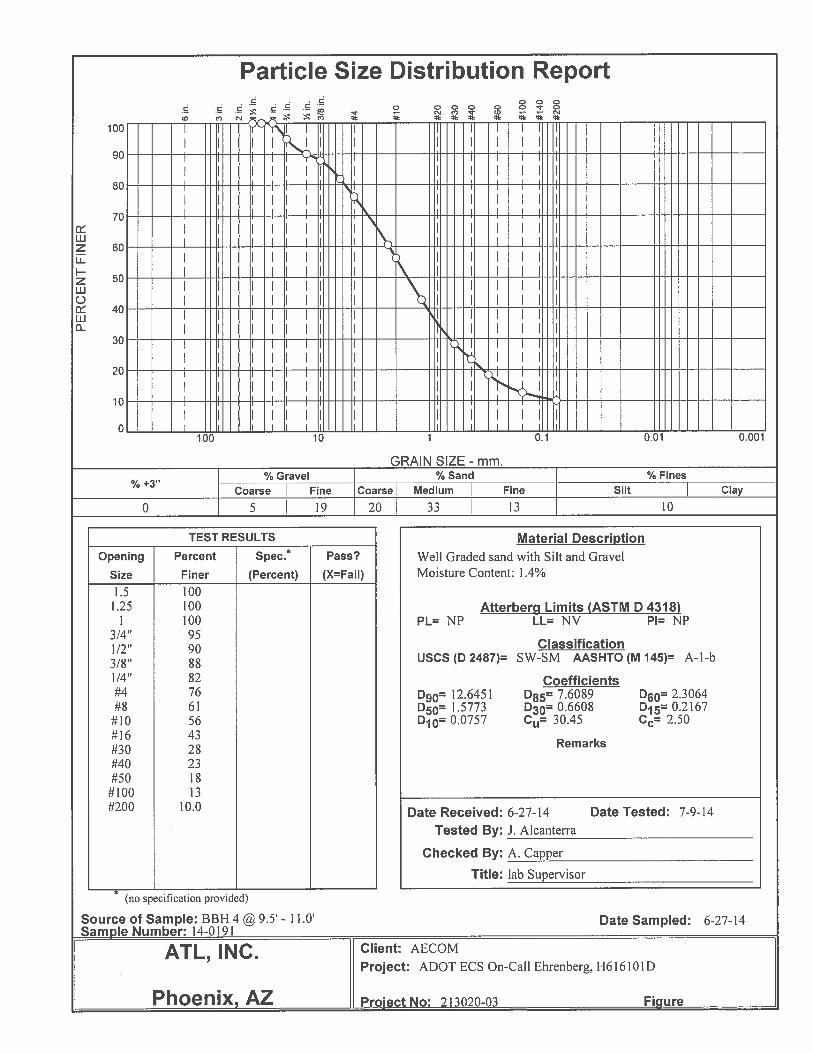
(no specification provided)*
PL= LL= PI=
USCS (D 2487)= AASHTO (M 145)=
D90= D85= D60=D50= D30= D15=D10= Cu= Cc=
Remarks
Poorly graded Sand with Silt and GravelMoisture Content: 2.0%
3"2.5"2"1.5
1.251
3/4"1/2"3/8"1/4"#4#8#10#16#30#40#50
#100#200
100100100
9999979386817571615951413528169.9
NP NV NP
SP-SM A-1-b
15.8031 11.9682 2.16631.1019 0.3285 0.14320.0760 28.50 0.66
6-27-14 7-3-14
J. Alcanterra
A. capper
Lab Supervisor
6-27-14
AECOM
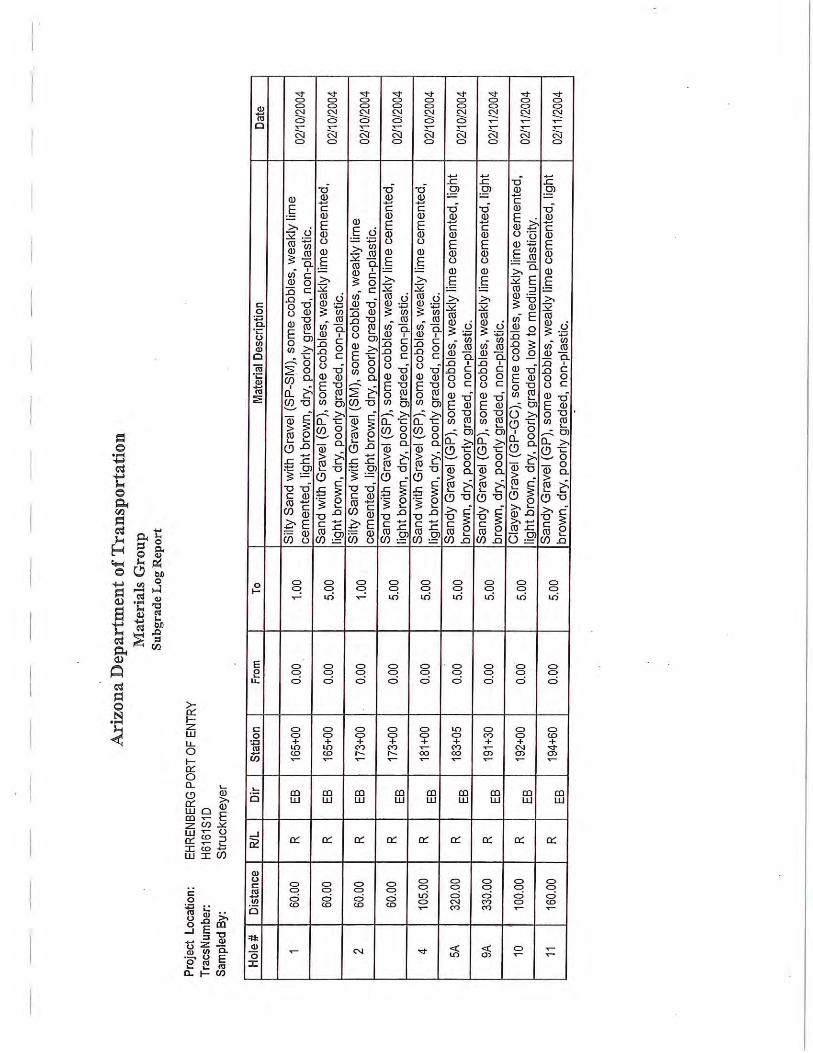
ADOT ECS On-Call Ehrenberg, H616101D
213020-03
Material Description
Atterberg Limits (ASTM D 4318)
Classification
Coefficients
Date Received: Date Tested:Tested By:
Checked By:Title:
Date Sampled:Source of Sample: WBH 1 @ 14.0' - 15.0'Sample Number: 14-0176
Client:Project:
Project No: Figure
TEST RESULTSOpening Percent Spec.* Pass?
Size Finer (Percent) (X=Fail)
PER
CEN
T FI
NER
0
10
20
30
40
50
60
70
80
90
100
GRAIN SIZE - mm.
0.0010.010.1110100
% +3" Coarse% Gravel
Fine Coarse Medium% Sand
Fine Silt% Fines
Clay0 7 22 12 24 25 10
6 in
.
3 in
.
2 in
.
1½ in
.
1 in
.
¾ in
.
½ in
.
3/8
in.
#4 #10
#20
#30
#40
#60
#100
#140
#200
Particle Size Distribution Report

ATL, INC.
Phoenix, AZ
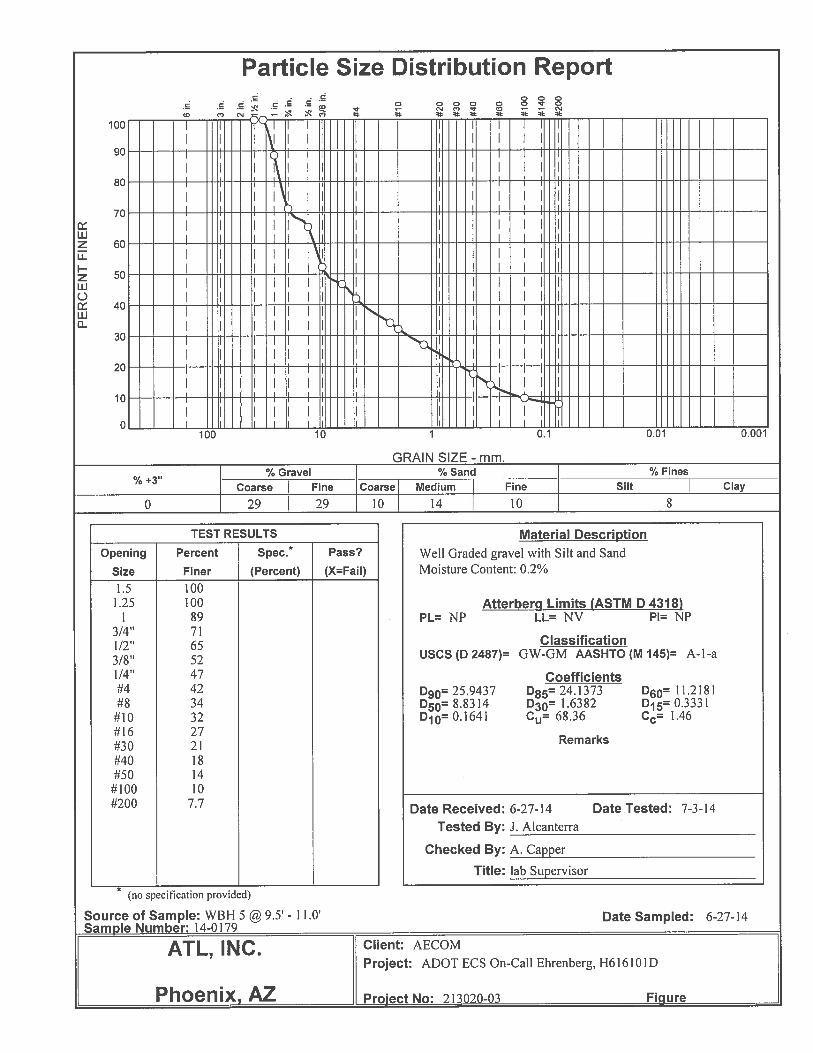
(no specification provided)*
PL= LL= PI=
USCS (D 2487)= AASHTO (M 145)=
D90= D85= D60=D50= D30= D15=D10= Cu= Cc=
Remarks
Silty Sand with gravelMoisture Content: 1.0%
1.51.25
13/4"1/2"3/8"1/4"#4#8#10#16#30#40#50
#100#200
100100
9795928881756359503933271813
NP NV NP
SM A-1-b
11.0771 7.8961 2.07251.1807 0.3532 0.1026
6-27-14 7-3-14
J. Alcanterra
A. Capper
lab Supervisor
6-27-14
AECOM
ADOT ECS On-Call Ehrenberg, H616101D
213020-03
Material Description
Atterberg Limits (ASTM D 4318)
Classification
Coefficients
Date Received: Date Tested:Tested By:
Checked By:Title:
Date Sampled:Source of Sample: WBH 3 @ 14.5' - 16.0'Sample Number: 14-0178
Client:Project:
Project No: Figure
TEST RESULTSOpening Percent Spec.* Pass?
Size Finer (Percent) (X=Fail)
PER
CEN
T FI
NER
0
10
20
30
40
50
60
70
80
90
100
GRAIN SIZE - mm.
0.0010.010.1110100
% +3" Coarse% Gravel
Fine Coarse Medium% Sand
Fine Silt% Fines
Clay0 5 20 16 26 20 13
6 in
.
3 in
.
2 in
.
1½ in
.
1 in
.
¾ in
.
½ in
.
3/8
in.
#4 #10
#20
#30
#40
#60
#100
#140
#200
Particle Size Distribution Report


ATL, INC.
Phoenix, AZ
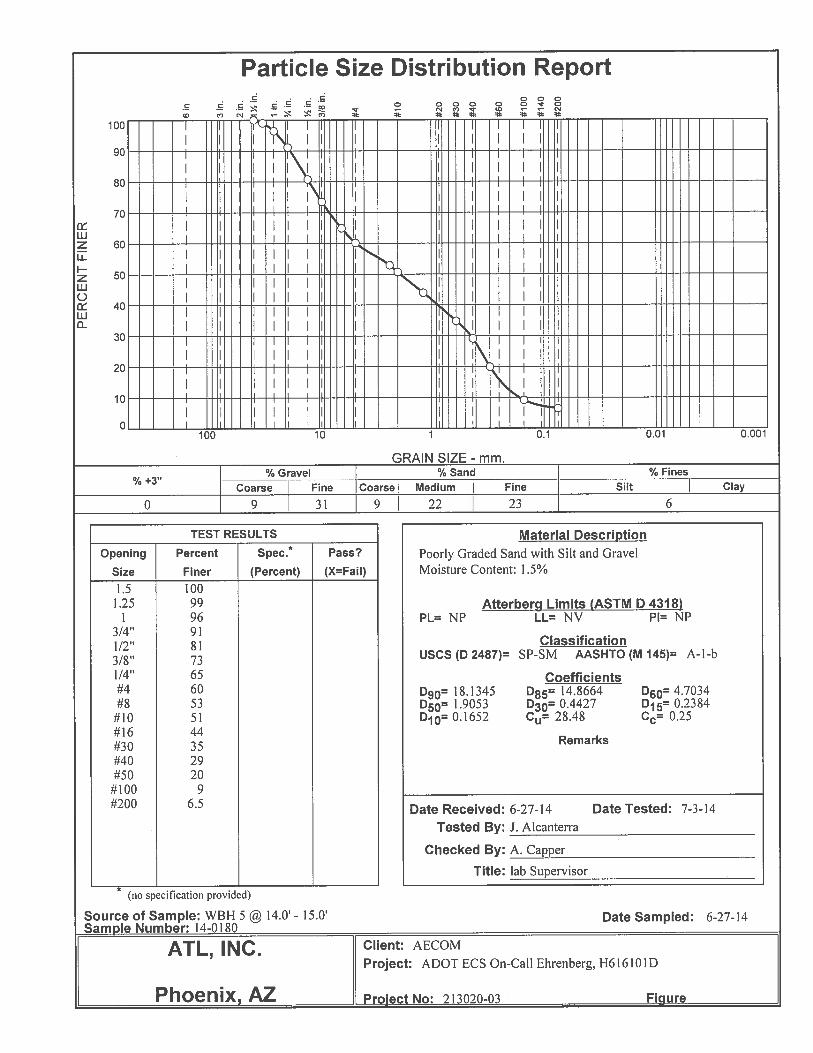
(no specification provided)*
PL= LL= PI=
USCS (D 2487)= AASHTO (M 145)=
D90= D85= D60=D50= D30= D15=D10= Cu= Cc=
Remarks
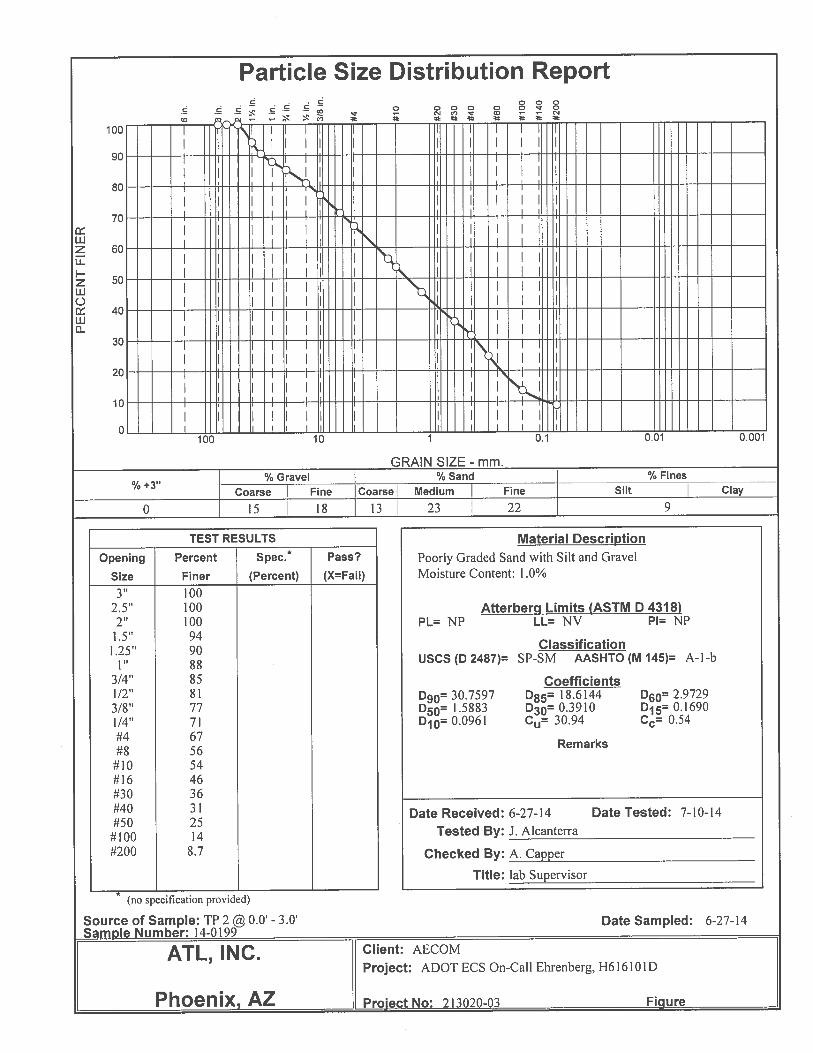
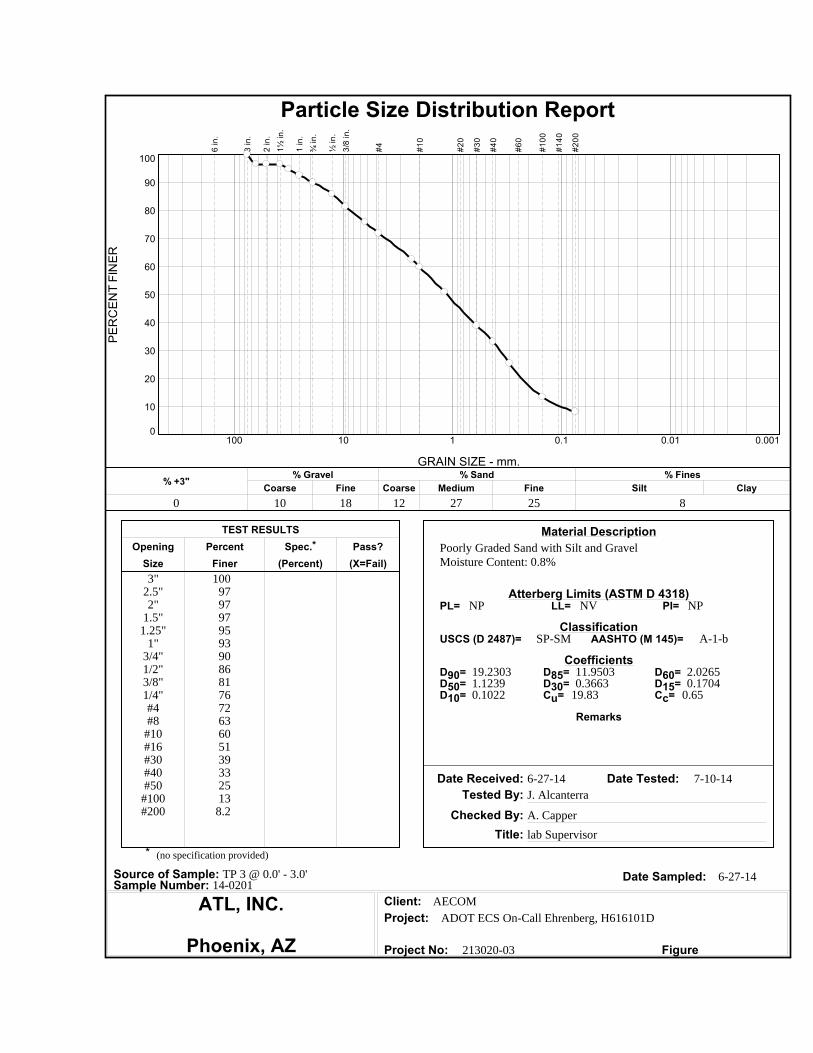
Poorly Graded Sand with Silt and GravelMoisture Content: 0.8%
3"2.5"2"
1.5"1.25"
1"3/4"1/2"3/8"1/4"#4#8#10#16#30#40#50
#100#200
10097979795939086817672636051393325138.2
NP NV NP
SP-SM A-1-b
19.2303 11.9503 2.02651.1239 0.3663 0.17040.1022 19.83 0.65
6-27-14 7-10-14
J. Alcanterra
A. Capper
lab Supervisor
6-27-14
AECOM
ADOT ECS On-Call Ehrenberg, H616101D
213020-03
Material Description
Atterberg Limits (ASTM D 4318)
Classification
Coefficients
Date Received: Date Tested:Tested By:
Checked By:Title:
Date Sampled:Source of Sample: TP 3 @ 0.0' - 3.0'Sample Number: 14-0201
Client:Project:
Project No: Figure
TEST RESULTSOpening Percent Spec.* Pass?
Size Finer (Percent) (X=Fail)
PER
CEN
T FI
NER
0
10
20
30
40
50
60
70
80
90
100
GRAIN SIZE - mm.
0.0010.010.1110100
% +3" Coarse% Gravel
Fine Coarse Medium% Sand
Fine Silt% Fines
Clay0 10 18 12 27 25 8
6 in
.
3 in
.
2 in
.
1½ in
.
1 in
.
¾ in
.
½ in
.
3/8
in.
#4 #10
#20
#30
#40
#60
#100
#140
#200
Particle Size Distribution Report


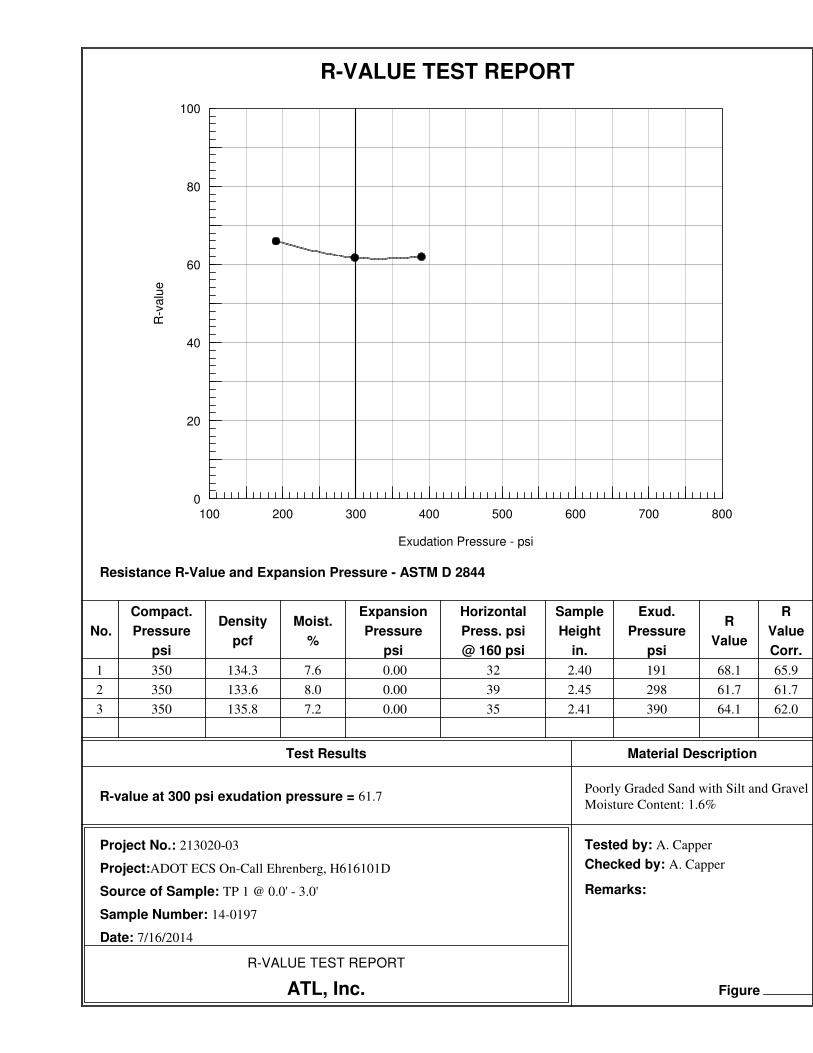
R-VALUE TEST REPORT
ATL, Inc.
R-VALUE TEST REPORT
Date: 7/16/2014
Project No.: 213020-03
Project:ADOT ECS On-Call Ehrenberg, H616101D
Source of Sample: TP 1 @ 0.0' - 3.0'
Sample Number: 14-0197
Remarks:
Checked by: A. Capper
Tested by: A. Capper
Poorly Graded Sand with Silt and Gravel
Moisture Content: 1.6%
Figure
Material DescriptionTest Results
No.
Compact.
Pressure
psi
Density
pcf
Moist.
%
Expansion
Pressure
psi
Horizontal
Press. psi
@ 160 psi
Sample
Height
in.
Exud.
Pressure
psi
R
Value
R
Value
Corr.
Resistance R-Value and Expansion Pressure - ASTM D 2844
R-value at 300 psi exudation pressure = 61.7
1 350 134.3 7.6 0.00 32 2.40 191 68.1 65.9
2 350 133.6 8.0 0.00 39 2.45 298 61.7 61.7
3 350 135.8 7.2 0.00 35 2.41 390 64.1 62.0
Exudation Pressure - psi
R
-valu
e
100 200 300 400 500 600 700 8000
20
40
60
80
100


Tested By: A. Capper Checked By: A. Capper
DIRECT SHEAR TEST REPORTATL, INC.
Phoenix, AZ
Client: AECOM
Project: ADOT ECS On-Call Ehrenberg, H616101D
Source of Sample: WBH 5 @ 15.0' - 16.0'
Sample Number: 14-0181
Proj. No.: 213020-03 Date Sampled: 6-27-14
Sample Type: In-Situ
Description: Poorly Graded Silt with gravel
Assumed Specific Gravity= 2.65
Remarks:
Figure
Sample No.
Water Content, %Dry Density, pcfSaturation, %Void RatioDiameter, in.Height, in.Water Content, %Dry Density, pcfSaturation, %Void RatioDiameter, in.Height, in.
Normal Stress, ksfFail. Stress, ksf Strain, %Ult. Stress, ksf Strain, %Strain rate, in./min.
Initi
alAt
Tes
t
Shea
r Stre
ss, k
sf
0
1.5
3
4.5
6
7.5
9
Strain, %
0 5 10 15 20
1
2
3
Fail.
Stre
ss, k
sf
0
3
6
9
Normal Stress, ksf
0 3 6 9 12 15 18
C, ksf f, deg Tan(f)
Results1.74053.98
1.38
1
6.5
125.6
54.6
0.3172
2.400
1.000
6.5
125.6
54.2
0.3172
2.400
1.0001.000
2.78014.6
0.020
2
5.8
125.9
49.1
0.3141
2.400
1.000
5.7
125.9
48.5
0.3141
2.400
1.0002.000
4.99516.7
0.020
3
6.8
125.7
56.8
0.3158
2.400
1.000
6.8
125.7
57.4
0.3158
2.400
1.0004.000
7.0748.3
0.020

Tested By: A. Capper Checked By: A. Capper
DIRECT SHEAR TEST REPORTATL, INC.
Phoenix, AZ
Client: AECOM
Project: ADOT ECS On-Call Ehrenberg, H616101D
Source of Sample: BBH 3 @ 20.0' - 21.0'
Sample Number: 14-0190
Proj. No.: 213020-03 Date Sampled:
Sample Type: In-Situ
Description: Poorly Graded Sand with Silt and
Gravel
Assumed Specific Gravity= 2.65
Remarks:
Figure
Sample No.
Water Content, %Dry Density, pcfSaturation, %Void RatioDiameter, in.Height, in.Water Content, %Dry Density, pcfSaturation, %Void RatioDiameter, in.Height, in.
Normal Stress, ksfFail. Stress, ksf Strain, %Ult. Stress, ksf Strain, %Strain rate, in./min.
Initi
alAt
Tes
t
Shea
r Stre
ss, k
sf
0
1
2
3
4
5
6
Strain, %
0 5 10 15 20
1
2
3
Fail.
Stre
ss, k
sf
0
2
4
6
Normal Stress, ksf
0 2 4 6 8 10 12
C, ksf f, deg Tan(f)
Results1.51438.34
0.79
1
2.2
114.2
13.2
0.4481
2.400
1.000
2.7
114.2
15.9
0.4481
2.400
1.0001.000
2.44110.4
0.020
2
2.5
114.7
15.1
0.4428
2.400
1.000
2.3
114.7
13.8
0.4428
2.400
1.0002.000
2.89310.4
0.020
3
2.7
113.5
15.7
0.4579
2.400
1.000
2.4
113.5
13.9
0.4579
2.400
1.0004.000
4.74610.4
0.020

APPENDIX B ADOT Geotechnical Report 04‐29
Dated August 31, 2004


APPENDIX C Method Specification for Compaction of Native Soils
203ERWK - E - 1/1
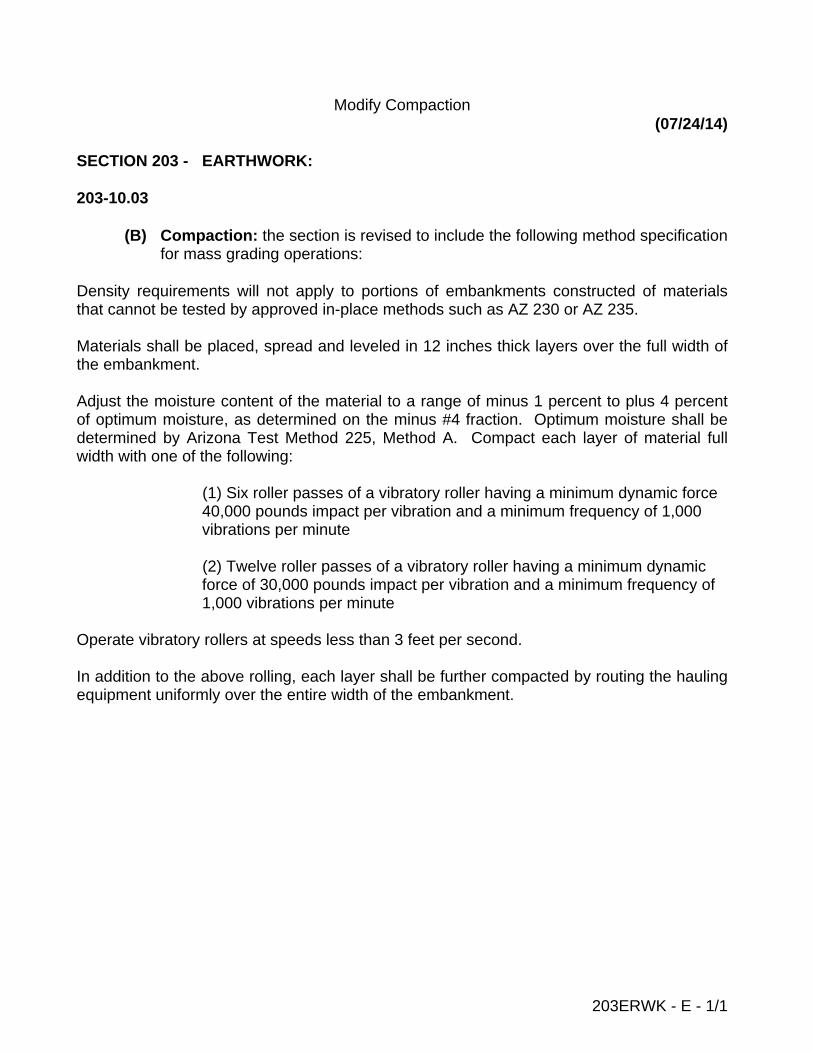
Modify Compaction (07/24/14)
SECTION 203 - EARTHWORK: 203-10.03
(B) Compaction: the section is revised to include the following method specification for mass grading operations:
Density requirements will not apply to portions of embankments constructed of materials that cannot be tested by approved in-place methods such as AZ 230 or AZ 235. Materials shall be placed, spread and leveled in 12 inches thick layers over the full width of the embankment. Adjust the moisture content of the material to a range of minus 1 percent to plus 4 percent of optimum moisture, as determined on the minus #4 fraction. Optimum moisture shall be determined by Arizona Test Method 225, Method A. Compact each layer of material full width with one of the following:
(1) Six roller passes of a vibratory roller having a minimum dynamic force 40,000 pounds impact per vibration and a minimum frequency of 1,000 vibrations per minute
(2) Twelve roller passes of a vibratory roller having a minimum dynamic force of 30,000 pounds impact per vibration and a minimum frequency of 1,000 vibrations per minute Operate vibratory rollers at speeds less than 3 feet per second. In addition to the above rolling, each layer shall be further compacted by routing the hauling equipment uniformly over the entire width of the embankment.