appendix a.2: riverworks market analysis - city...
TRANSCRIPT
1
Appendix A.2: Riverworks Market Analysis
Introduction
The Riverworks Market Analysis includes an assessment of businesses, industries, and land uses
within the two Riverworks Business Improvement Districts (BID 25 and 36), a comparison to other industrial BIDs in the City of Milwaukee, a housing and demographic profile of the surrounding neighborhoods, and a market profile of the area that
includes recommendations for potential development opportunities.
It is based on data from the Census and American Community Surveys, data derived from ESRIs Business Analyst program, as well as data
from the Riverworks Development Corporation. The Riverworks BIDs contain a major commercial corridor along Capitol Drive surrounded by a large industrial zone located to the south
and to the north. In addition to the BID areas, this economic profile includes an evaluation of the surrounding neighborhoods in order to describe and assess the
demographic component, and to evaluate the needs of local residents
that are likely to habituate the Capitol Drive commercial corridor or provide a local labor force for businesses and industries within the BIDs.
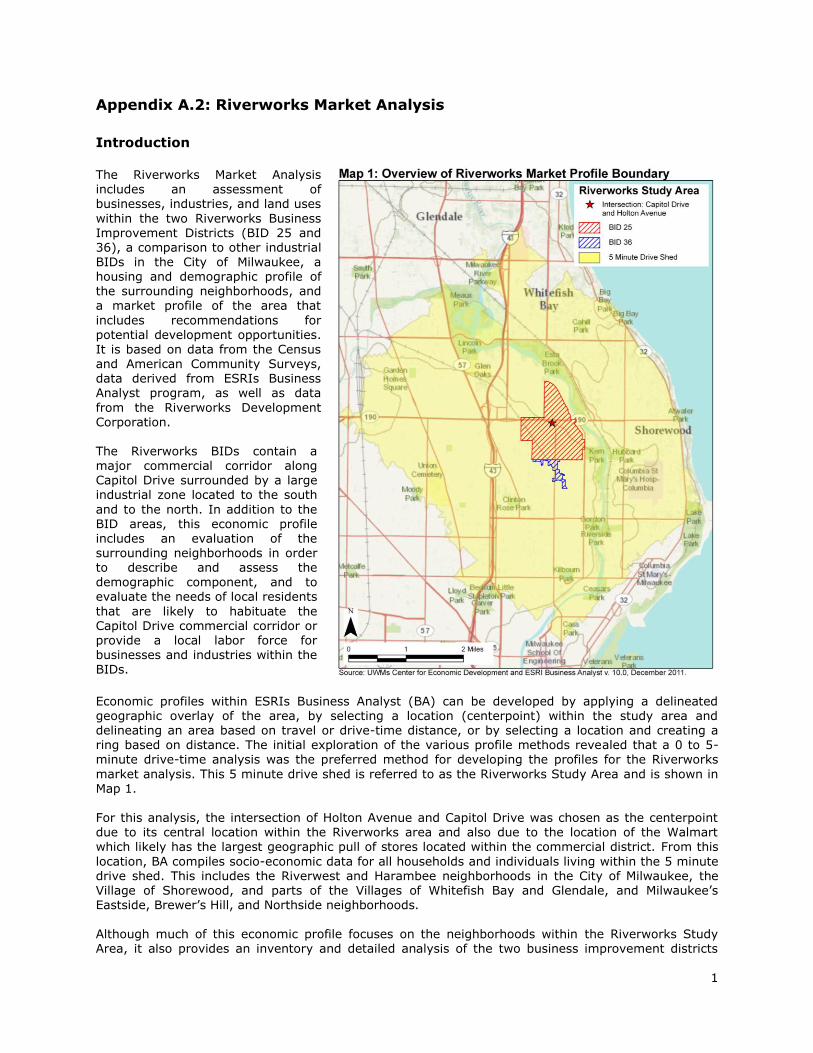
Economic profiles within ESRIs Business Analyst (BA) can be developed by applying a delineated geographic overlay of the area, by selecting a location (centerpoint) within the study area and delineating an area based on travel or drive-time distance, or by selecting a location and creating a ring based on distance. The initial exploration of the various profile methods revealed that a 0 to 5-minute drive-time analysis was the preferred method for developing the profiles for the Riverworks
market analysis. This 5 minute drive shed is referred to as the Riverworks Study Area and is shown in Map 1.
For this analysis, the intersection of Holton Avenue and Capitol Drive was chosen as the centerpoint due to its central location within the Riverworks area and also due to the location of the Walmart which likely has the largest geographic pull of stores located within the commercial district. From this
location, BA compiles socio-economic data for all households and individuals living within the 5 minute drive shed. This includes the Riverwest and Harambee neighborhoods in the City of Milwaukee, the Village of Shorewood, and parts of the Villages of Whitefish Bay and Glendale, and Milwaukee’s Eastside, Brewer’s Hill, and Northside neighborhoods. Although much of this economic profile focuses on the neighborhoods within the Riverworks Study Area, it also provides an inventory and detailed analysis of the two business improvement districts
2
(BID 25 and BID 26). Riverworks Development Corporation, the City of Milwaukee Department of City
Development, and the Wisconsin Department of Workforce Development provided the business and property data for this evaluation. Although much of the socio-economic data from this analysis is derived from ESRIs BA, supplemental data from the US Census Bureau and the American Community
Survey was utilized as noted.
The Riverworks Development Corporation and Business Improvement Districts 25
and 36
Introduction Riverworks is comprised of two separate business improvement districts (BIDs), public-private partnerships between the City of Milwaukee and business owners that work together to manage, develop, and promote the Riverworks Center business district. Each BID is a cooperative of local property owners that raise money through voluntary annual assessments to spend on projects that
will enhance the local business environment. Such projects generally include streetscaping, beautification, or other environmental enhancements; marketing or business recruitment and
retention; and safety and security. The two separate BIDs (25 and 36) are overseen by the Riverworks Development Corporation (RDC), a non-profit organization that provides management and technical support to both BIDs. RDC was
established in 1992 to provide centralized support to the BIDs in four key areas; workforce development, economic development, neighborhood planning and revitalization, and real estate development.1 RDC manages and administers three major programs for BIDs 25 and 36:
The Public Safety & Appearance program: Performs graffiti removal and sidewalk sweeping for the area.
The Marketing & Promotions program: Promotes the area as a first class destination for
shoppers, business owners and real estate developers. Business and Property Assistance program: Provides façade improvement grants (for
things like windows, doors, signage, etc.), fencing improvement grants, and safety and security grants to BID businesses.
Map 1 shows the boundaries of the two BIDs within the Riverworks Study Area. BID 25 is the larger of the two BIDs, with about 130 property owners participating in the program. BID 25 contains a
considerable amount of manufacturing and business services that are compatible with manufacturing uses, but also contains a major commercial corridor along Capitol Drive. Changes along the Capitol Drive corridor, particularly the catalytic redevelopment of the former American Motors Corporation property into commercial uses has provided the most significant change to the Riverworks neighborhood in the past 20 years. Although industrial development continues to be most predominant, commercial development along Capitol Drive has produced a resurgence in the
Riverworks neighborhood. BID 36 is smaller, with about 45 properties participating in the BID. Much of the recent work within BID 36 has focused on development of the Beerline Recreational Trail, a conversion of an abandoned railroad right-of-way to a pedestrian and bicycle trail. Similar to the changes along Capitol Drive, this project will have a significantly positive impact on the Riverworks neighborhood by removing blight.
Inventory of Businesses
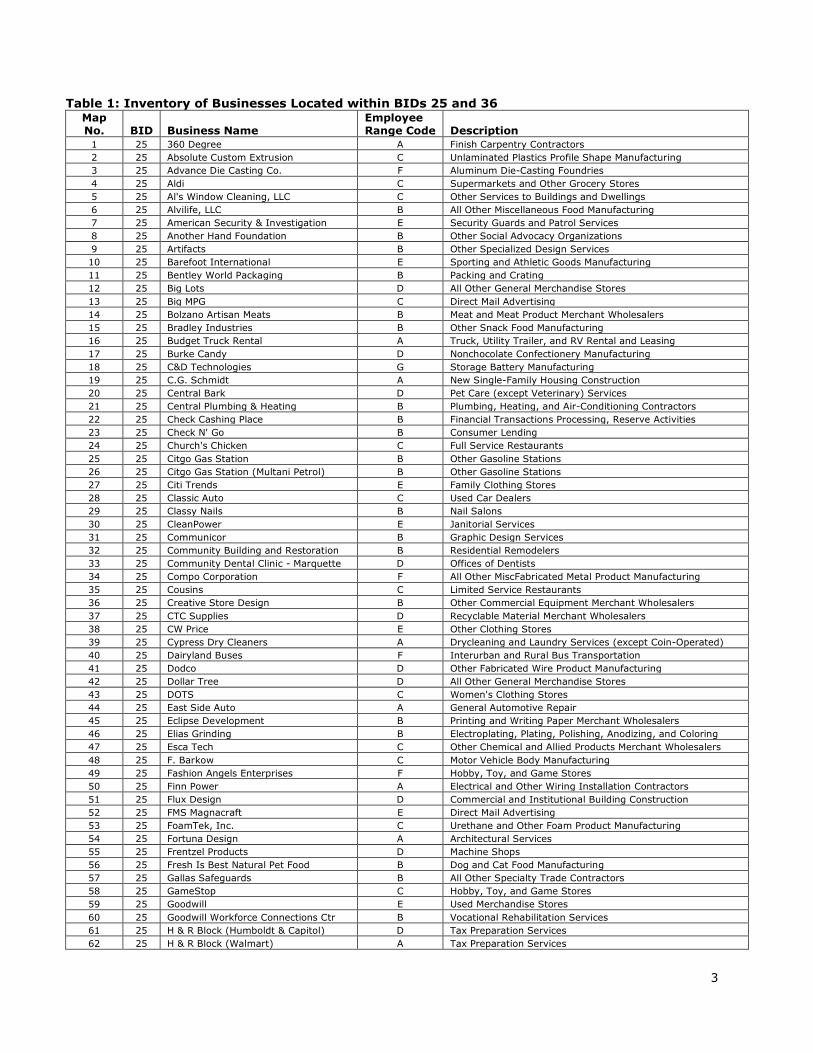
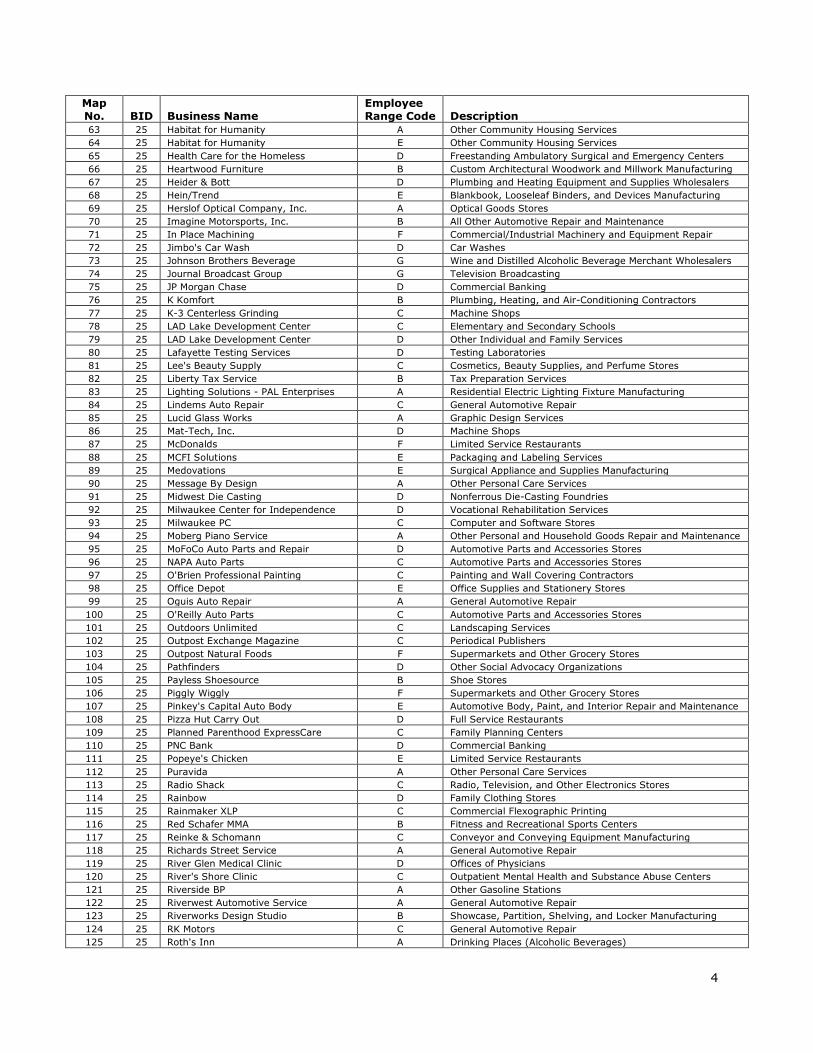
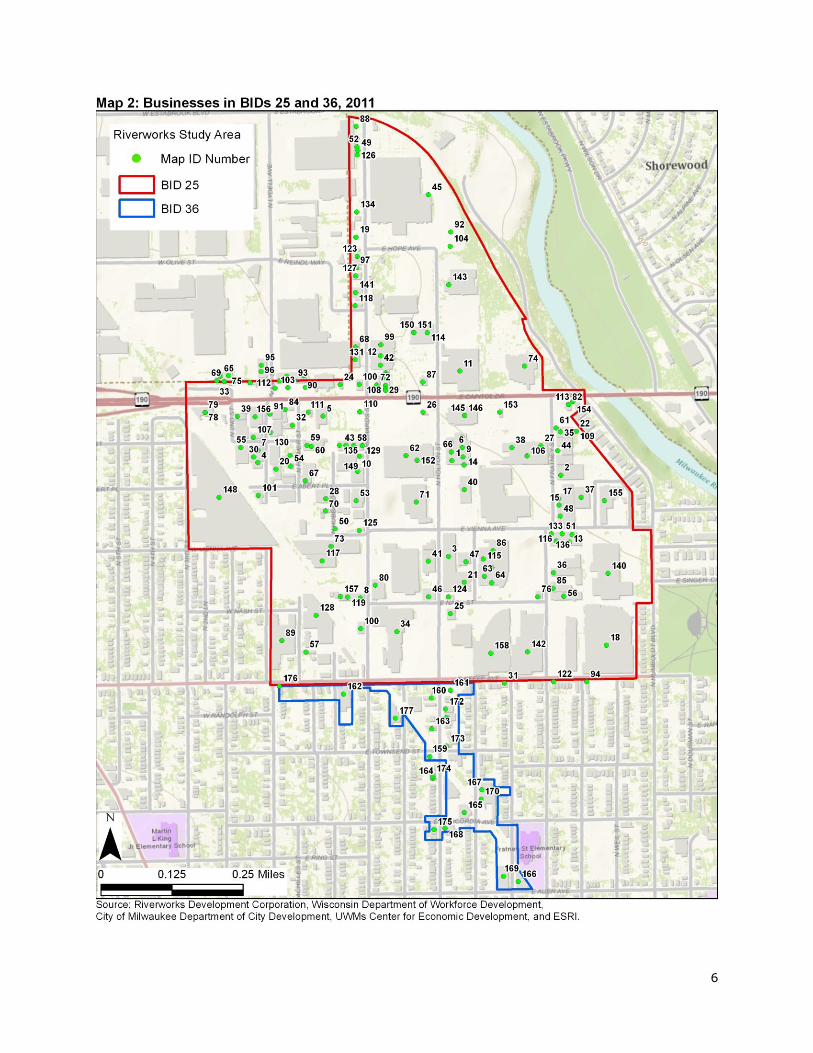
In 2012, a total of 177 businesses were located within the two BIDs. Approximately 158 businesses employing between 2,350 and 5,080 people were located within BID 25, and approximately 19 businesses were located within BID 36, employing between 60 and 135 people. A list of all businesses in BIDs 25 and 36 is included in Table 1 and Map 2 shows their locations. Table 2 shows a summary of businesses within the BIDs including the estimates on the number of employees within each category.
1 Riverworks Development Corporation’s Comprehensive Neighborhood Economic Development Approach is available at http://www.riverworksmke.org/rdc/neighborhood-dev-chart.pdf
3
Table 1: Inventory of Businesses Located within BIDs 25 and 36 Map No. BID Business Name
Employee Range Code Description
1 25 360 Degree A Finish Carpentry Contractors
2 25 Absolute Custom Extrusion C Unlaminated Plastics Profile Shape Manufacturing
3 25 Advance Die Casting Co. F Aluminum Die-Casting Foundries
4 25 Aldi C Supermarkets and Other Grocery Stores
5 25 Al's Window Cleaning, LLC C Other Services to Buildings and Dwellings
6 25 Alvilife, LLC B All Other Miscellaneous Food Manufacturing
7 25 American Security & Investigation E Security Guards and Patrol Services
8 25 Another Hand Foundation B Other Social Advocacy Organizations
9 25 Artifacts B Other Specialized Design Services
10 25 Barefoot International E Sporting and Athletic Goods Manufacturing
11 25 Bentley World Packaging B Packing and Crating
12 25 Big Lots D All Other General Merchandise Stores
13 25 Big MPG C Direct Mail Advertising
14 25 Bolzano Artisan Meats B Meat and Meat Product Merchant Wholesalers
15 25 Bradley Industries B Other Snack Food Manufacturing
16 25 Budget Truck Rental A Truck, Utility Trailer, and RV Rental and Leasing
17 25 Burke Candy D Nonchocolate Confectionery Manufacturing
18 25 C&D Technologies G Storage Battery Manufacturing
19 25 C.G. Schmidt A New Single-Family Housing Construction
20 25 Central Bark D Pet Care (except Veterinary) Services
21 25 Central Plumbing & Heating B Plumbing, Heating, and Air-Conditioning Contractors
22 25 Check Cashing Place B Financial Transactions Processing, Reserve Activities
23 25 Check N' Go B Consumer Lending
24 25 Church's Chicken C Full Service Restaurants
25 25 Citgo Gas Station B Other Gasoline Stations
26 25 Citgo Gas Station (Multani Petrol) B Other Gasoline Stations
27 25 Citi Trends E Family Clothing Stores
28 25 Classic Auto C Used Car Dealers
29 25 Classy Nails B Nail Salons
30 25 CleanPower E Janitorial Services
31 25 Communicor B Graphic Design Services
32 25 Community Building and Restoration B Residential Remodelers
33 25 Community Dental Clinic - Marquette D Offices of Dentists
34 25 Compo Corporation F All Other MiscFabricated Metal Product Manufacturing
35 25 Cousins C Limited Service Restaurants
36 25 Creative Store Design B Other Commercial Equipment Merchant Wholesalers
37 25 CTC Supplies D Recyclable Material Merchant Wholesalers
38 25 CW Price E Other Clothing Stores
39 25 Cypress Dry Cleaners A Drycleaning and Laundry Services (except Coin-Operated)
40 25 Dairyland Buses F Interurban and Rural Bus Transportation
41 25 Dodco D Other Fabricated Wire Product Manufacturing
42 25 Dollar Tree D All Other General Merchandise Stores
43 25 DOTS C Women's Clothing Stores
44 25 East Side Auto A General Automotive Repair
45 25 Eclipse Development B Printing and Writing Paper Merchant Wholesalers
46 25 Elias Grinding B Electroplating, Plating, Polishing, Anodizing, and Coloring
47 25 Esca Tech C Other Chemical and Allied Products Merchant Wholesalers
48 25 F. Barkow C Motor Vehicle Body Manufacturing
49 25 Fashion Angels Enterprises F Hobby, Toy, and Game Stores
50 25 Finn Power A Electrical and Other Wiring Installation Contractors
51 25 Flux Design D Commercial and Institutional Building Construction
52 25 FMS Magnacraft E Direct Mail Advertising
53 25 FoamTek, Inc. C Urethane and Other Foam Product Manufacturing
54 25 Fortuna Design A Architectural Services
55 25 Frentzel Products D Machine Shops
56 25 Fresh Is Best Natural Pet Food B Dog and Cat Food Manufacturing
57 25 Gallas Safeguards B All Other Specialty Trade Contractors
58 25 GameStop C Hobby, Toy, and Game Stores
59 25 Goodwill E Used Merchandise Stores
60 25 Goodwill Workforce Connections Ctr B Vocational Rehabilitation Services
61 25 H & R Block (Humboldt & Capitol) D Tax Preparation Services
62 25 H & R Block (Walmart) A Tax Preparation Services
4
Map No. BID Business Name
Employee Range Code Description
63 25 Habitat for Humanity A Other Community Housing Services
64 25 Habitat for Humanity E Other Community Housing Services
65 25 Health Care for the Homeless D Freestanding Ambulatory Surgical and Emergency Centers
66 25 Heartwood Furniture B Custom Architectural Woodwork and Millwork Manufacturing
67 25 Heider & Bott D Plumbing and Heating Equipment and Supplies Wholesalers
68 25 Hein/Trend E Blankbook, Looseleaf Binders, and Devices Manufacturing
69 25 Herslof Optical Company, Inc. A Optical Goods Stores
70 25 Imagine Motorsports, Inc. B All Other Automotive Repair and Maintenance
71 25 In Place Machining F Commercial/Industrial Machinery and Equipment Repair
72 25 Jimbo's Car Wash D Car Washes
73 25 Johnson Brothers Beverage G Wine and Distilled Alcoholic Beverage Merchant Wholesalers
74 25 Journal Broadcast Group G Television Broadcasting
75 25 JP Morgan Chase D Commercial Banking
76 25 K Komfort B Plumbing, Heating, and Air-Conditioning Contractors
77 25 K-3 Centerless Grinding C Machine Shops
78 25 LAD Lake Development Center C Elementary and Secondary Schools
79 25 LAD Lake Development Center D Other Individual and Family Services
80 25 Lafayette Testing Services D Testing Laboratories
81 25 Lee's Beauty Supply C Cosmetics, Beauty Supplies, and Perfume Stores
82 25 Liberty Tax Service B Tax Preparation Services
83 25 Lighting Solutions - PAL Enterprises A Residential Electric Lighting Fixture Manufacturing
84 25 Lindems Auto Repair C General Automotive Repair
85 25 Lucid Glass Works A Graphic Design Services
86 25 Mat-Tech, Inc. D Machine Shops
87 25 McDonalds F Limited Service Restaurants
88 25 MCFI Solutions E Packaging and Labeling Services
89 25 Medovations E Surgical Appliance and Supplies Manufacturing
90 25 Message By Design A Other Personal Care Services
91 25 Midwest Die Casting D Nonferrous Die-Casting Foundries
92 25 Milwaukee Center for Independence D Vocational Rehabilitation Services
93 25 Milwaukee PC C Computer and Software Stores
94 25 Moberg Piano Service A Other Personal and Household Goods Repair and Maintenance
95 25 MoFoCo Auto Parts and Repair D Automotive Parts and Accessories Stores
96 25 NAPA Auto Parts C Automotive Parts and Accessories Stores
97 25 O'Brien Professional Painting C Painting and Wall Covering Contractors
98 25 Office Depot E Office Supplies and Stationery Stores
99 25 Oguis Auto Repair A General Automotive Repair
100 25 O'Reilly Auto Parts C Automotive Parts and Accessories Stores
101 25 Outdoors Unlimited C Landscaping Services
102 25 Outpost Exchange Magazine C Periodical Publishers
103 25 Outpost Natural Foods F Supermarkets and Other Grocery Stores
104 25 Pathfinders D Other Social Advocacy Organizations
105 25 Payless Shoesource B Shoe Stores
106 25 Piggly Wiggly F Supermarkets and Other Grocery Stores
107 25 Pinkey's Capital Auto Body E Automotive Body, Paint, and Interior Repair and Maintenance
108 25 Pizza Hut Carry Out D Full Service Restaurants
109 25 Planned Parenthood ExpressCare C Family Planning Centers
110 25 PNC Bank D Commercial Banking
111 25 Popeye's Chicken E Limited Service Restaurants
112 25 Puravida A Other Personal Care Services
113 25 Radio Shack C Radio, Television, and Other Electronics Stores
114 25 Rainbow D Family Clothing Stores
115 25 Rainmaker XLP C Commercial Flexographic Printing
116 25 Red Schafer MMA B Fitness and Recreational Sports Centers
117 25 Reinke & Schomann C Conveyor and Conveying Equipment Manufacturing
118 25 Richards Street Service A General Automotive Repair
119 25 River Glen Medical Clinic D Offices of Physicians
120 25 River's Shore Clinic C Outpatient Mental Health and Substance Abuse Centers
121 25 Riverside BP A Other Gasoline Stations
122 25 Riverwest Automotive Service A General Automotive Repair
123 25 Riverworks Design Studio B Showcase, Partition, Shelving, and Locker Manufacturing
124 25 RK Motors C General Automotive Repair
125 25 Roth's Inn A Drinking Places (Alcoholic Beverages)

5
Map No. BID Business Name
Employee Range Code Description
126 25 Service Container D Corrugated and Solid Fiber Box Manufacturing
127 25 Service Master of Milwaukee C Janitorial Services
128 25 Shakeproof Industrial Products F Bolt, Nut, Screw, Rivet, and Washer Manufacturing
129 25 Shoe Time B Shoe Stores
130 25 Snider Painting D Painting and Wall Covering Contractors
131 25 Social Development Commission H Administration of Human Resource Programs
132 25 Soft Anointing Hands A Other Personal Care Services
133 25 SOS Mailing Services A Private Mail Centers
134 25 Spic and Span E Industrial Launderers
135 25 Subway C Limited Service Restaurants
136 25 SUP Design B Industrial Design Services
137 25 The Candlemaker A Toy and Hobby Goods and Supplies Merchant Wholesalers
138 25 T-Mobile A Wireless Telecommunications Carriers
139 25 Tobacco One A Tobacco Stores
140 25 Tramont Corporation G Plate Work Manufacturing
141 25 Trike Property Management D Lessors of Residential Buildings and Dwellings
142 25 Tulip G All Other Plastics Product Manufacturing
143 25 Turner Box B Industrial and Personal Service Paper Merchant Wholesalers
144 25 U.S. Cellular A Wireless Telecommunications Carriers
145 25 U-Haul C Truck, Utility Trailer, and RV Rental and Leasing
146 25 U-Haul E Truck, Utility Trailer, and RV Rental and Leasing
147 25 Unique Car Care A Car Washes
148 25 US Corrugated, Inc. E Corrugated and Solid Fiber Box Manufacturing
149 25 Valent's Bar and Restaurant B Drinking Places (Alcoholic Beverages)
150 25 Walgreen's: Rx D Pharmacies and Drug Stores
151 25 Walgreen's: Store E Pharmacies and Drug Stores
152 25 Wal-Mart H Discount Department Stores
153 25 Wendy's D Full-Service Restaurants
154 25 Western Union A All Other Nondepository Credit Intermediation
155 25 Wisconsin Thermoset Moulding E All Other Plastics Product Manufacturing
156 25 Wisconsin Wilderness Foods B Fruit and Vegetable Canning
157 25 Zanoni Painting B Painting and Wall Covering Contractors
158 25 ZeroPoint Manufacturing C Plumbing and Heating Equipment and Supplies Wholesalers
Subtotal BID 25 2,351 to 5,083 Employees
159 36 A Bishop Farm C Poured Concrete Foundation and Structure Contractors
160 36 A.B. Steel Auto Service A General Automotive Repair
161 36 Citgo B Other Gasoline Stations
162 36 D&R Auto Repair A General Automotive Repair
163 36 Downtown Auto Body B Automotive Body, Paint, and Interior Repair and Maintenance
164 36 Fala7 Investments C Other Activities Related to Real Estate
165 36 Family Dollar B All Other General Merchandise Stores
166 36 Hernia Movers D Used Household and Office Goods Moving
167 36 J & S Auto Body Repair A General Automotive Repair
168 36 Keepin It One Hundred B All Other General Merchandise Stores
169 36 Keystone Marble & Granite, Inc. C Cut Stone and Stone Product Manufacturing
170 36 Metal Forms Corporation E Sheet Metal Work Manufacturing
171 36 Mobile Car Care A General Automotive Repair
172 36 QBM, Inc. B Commercial and Industrial Machinery and Equipment Repair
173 36 RET Lounge A Drinking Places (Alcoholic Beverages)
174 36 Shock Construction Company A All Other Specialty Trade Contractors
175 36 Spot-Light Barber Shop A Barber Shops
176 36 Sunshine Foods B Supermarkets and Other Grocery (except Convenience)
177 36 Wenninger Compressor C Industrial Machinery and Equipment Merchant Wholesalers
Subtotal BID 36 63 to 135 Employees
TOTAL BIDs 25 and 36 2,414 to 5,218 Employees
Sources: Riverworks Development Corporation, Wisconsin Department of Workforce Development, ESRI, and UWMs
Center for Economic Development.
Note: Employee Size Range Coding: A = Self Employed B = 1 to 4 C = 5 to 9 D = 10 o 19
E = 20 to 49 F = 50 to 99 G = 100 to 249 H = 250 to 499
6

7
Table 2: Business Summary within BIDs 25 and 36
Business Category Number Percent Employee Range2 Max Percent Employees
Industrial 61 34.5 1,255 to 2,111 40.5
Manufacturing 32 18.1 668 to 1,535 29.4
Wholesale 11 6.2 140 to 331 6.3
Construction 14 7.9 44 to 89 1.7
Warehousing/Storage 1 0.6 1 to 4 0.1
Other 3 1.7 71 to 152 2.9
Professional Services 62 35.0 757 to 1,602 30.7
Business Services 18 10.2 128 to 290 5.6
Repair and Maintenance Services 16 9.0 52 to 104 2.0
Health Care and Social Assistance 13 7.3 343 to 689 13.2
Transportation and Storage Services 5 2.8 86 to 177 3.4
Financial Services 5 2.8 23 to 47 0.9
Real Estate Services 2 1.1 15 to 28 0.5
Information Distribution 2 1.1 105 to 258 4.9
Educational Services 1 0.6 5 to 9 0.2
Commercial 54 30.5 733 to 1,505 28.8
Retail 27 15.3 567 to 1,162 22.3
Food Service 10 5.6 108 to 219 4.2
Personal and Pet Care 10 5.6 50 to 104 2.0
Gas Stations 4 2.3 4 to 13 0.2
Cell Phone/Communications 2 1.1 3 to 3 0.0
Recreation 1 0.6 1 to 4 0.1
TOTAL 177 100.0 2,414 to 5,218 100.0
Source: Wisconsin Department of Workforce Development and Center for Economic Development. The businesses located within BIDs 25 and 36 represent a wide variety of industrial, commercial, and
professional services. Of the 177 businesses located within the two BIDs, 35 percent are related to industrial or manufacturing uses, 29 percent are related to retail or food service, and 31 percent are
other professional service-oriented businesses. Approximately 40.5 percent of all employees in the BIDs are employed in some kind of industrial business, while 28.8 percent are employed in commercial, and 30.7 percent in professional services. Businesses range in employee size from very small, family-owned or self-employed operations to large global enterprises with hundreds of employees. The two largest employers in the BIDs are Walmart and the Social Development Commission, each with between 250 and 499 employees. Most of the businesses within the BID boundaries are small to medium sized with fewer than 20 employees.
As of 2011, there are approximately 61 industrial businesses located within the BIDs, involved in manufacturing, wholesale, construction, or warehousing and storage. Several of these are large, ranging from 50 to 249 employees including C&D Technologies, Johnson Brothers Beverage, Tramont, Tulip, Advance Die Casting, Compo Corporation, and In Place Machining. Estimates indicate that between 1,255 and 2,111 workers were employed in industrial businesses in the BIDs in 2011.
Industrial Businesses Manufacturing plays a dominant role within the business mix of the Riverworks area. Manufacturing employs between 668 and 1,535 workers (about 29 percent), and represents about 18 percent of the businesses within the two BIDs. All but two of the 32 manufacturing businesses are located in BID 25. There is no single dominant type of manufacturing subsector within the area, although 11 businesses are related to metal including specialized metal fabrication and machining, representing about one
2 Estimates on the number of employees are derived from State of Wisconsin Department of Workforce Development SNAP data which provides an estimated employee size range for each company.
8
third of the manufacturing businesses within the area. Additionally, there are five businesses related
to food manufacturing and four businesses related to plastics; the remainder represent a variety of specialized manufacturing of either finished products or WIPs (works in process). The largest manufacturing employers include Tramont, C&D Technologies, and Tulip, each employing between 100
and 249 people. Construction, wholesale, and warehousing comprise the remaining industrial businesses in the BIDs. Wholesale companies account for about 6 percent of all businesses and about 6 percent of employment within the BIDs. Like manufacturing, there is a wide variety of wholesale business types, including food and beverage; industrial materials and products; paper and packaging; plumbing and construction materials; and finished products. Wholesale businesses employ between 140 and 331
workers, and with the exception of Johnson Brothers Beverage (100 to 249 estimated employees), most wholesalers tend to employ fewer than 20 people. There are 14 construction companies (8 percent) located in the BIDs, employing roughly 44 to 89 workers. These tend to be very small business: all employ fewer than 20 people, and all but two of these employ 10 or fewer people. Surprisingly, there is only one business identified as warehousing within the BIDs, Bentley World Packaging which employees between 1 and 4 people. In addition, there are 3 service-related industrial
businesses; these include an industrial launderer and two industrial maintenance and repair shops. Professional Services Approximately 62 businesses related to professional services were located in the BIDs, including 18 related to business services and support, 16 related to repair and maintenance, 13 related to health care and social assistance, 5 related to financial services, 5 to real estate services, 2 to information distribution, and one related to educational services. Estimates indicate that between 757 and 1,602
workers are employed in professional services in 2011. About half of the professional service businesses are compatible with industrial uses and roughly 25 percent of the services focus on the needs of industrial and manufacturing businesses including packaging/labeling, mailing services, janitorial and building services, security, and design and architectural services. Roughly 35 percent of the businesses do not directly support industrial uses but are fully compatible with them including all businesses related to transportation and storage (Hernia Movers, Uhaul, etc) and auto repair and maintenance shops. The remaining businesses represent a wide variety of other professional services.
Business services represent about 10 percent of all businesses (18) within the BIDs and employ
between 128 and 290 people (5.6 percent). This category includes services that provide support to other businesses and includes graphic design services, packaging and mailing services, industrial design, graphic design, architectural design, janitorial and building maintenance services, and tax preparation services. Most of these services (excluding tax preparation) are compatible with industrial
uses. In 2011, there were approximately 15 repair and maintenance businesses located within the BIDs; all but one were related to auto repair and maintenance. With the exception of Pinkey’s Capitol Auto Body and Jimbo’s Car Wash, these are very small businesses, generally with fewer than 5 employees. Estimates indicate that about 2 percent of the workforce (52 to 104) is employed in repair and maintenance.
Healthcare and social assistance services are the third largest employers within the BIDs, employing between 343 to 689 people (13.2 percent). This is based on the presence of the Social Development Commission (SDC), the purported largest employer in the BIDs with 250 to 499 employees. Most of
these businesses employ fewer than 20 people. Commercial Businesses
Approximately 54 commercial businesses were located in the BIDs, including 27 related to retail trade, 10 related to food service, 10 related to personal or pet care, 4 gas stations, 2 related to cell phone retail, and one related to recreation. Estimates indicate that between 733 and 1,505 workers are employed in commercial businesses in the BIDs in 2011. Most retail and restaurants are concentrated along the Capitol Drive corridor, and represent predominantly national chains with some local businesses present. The largest employer (250 to 499 employees) and the retailer with the greatest
pull factor in the Riverworks area is Walmart. In addition to Walmart, the area is well represented in national ‘general merchandise’ or ‘discount stores’ in the area, as there are three other major national
9
brands (Family Dollar, Big Lots, and Dollar Tree). In total, there are four stores that sell groceries
although only one would be considered a full service supermarket (Piggly Wiggly); Outpost Natural Foods and Aldis are both specialty food stores, and Sunshine Foods is a corner market. In total, there are six clothing and shoe stores, most catering to an ‘urban’ or younger clientele; 5 of the 6 are
national chains (Rainbow, CW Price, DOTS, Citi Trends, and Payless Shoesource). Additionally, there are three national chain auto parts stores in the area (Napa, Mofoco, and O’Briens). The remaining 10 retail businesses represent a variety of commercial needs (optical store, office supply store, hobby/game store, electronics store etc) that serve the local population; almost all of these are chain stores with affiliates located throughout Milwaukee and the Southeastern Wisconsin region. Food service within the Riverworks area includes 7 limited service (fast food) restaurants and 3 locally
owned taverns. Approximately 108 to 219 people are employed in food service (about 4 percent); with the exception of McDonalds and Popeye’s Chicken, most of the fast food restaurants employ fewer than 20 people. Similar to the retail, all of the restaurants are national chains. Again, these serve a very local clientele or cater to the clients that work within the BIDs. The remaining 17 businesses focus on the needs of the local population, and include 10 catering to
personal and pet care (pharmacy, pet care, dry cleaning, massage, barbershop, and beauty supplies) and 7 other local businesses (4 gas stations, 2 cell phone stores, and 1 recreational). Of these, 11 represent national chains and the remainder are local.
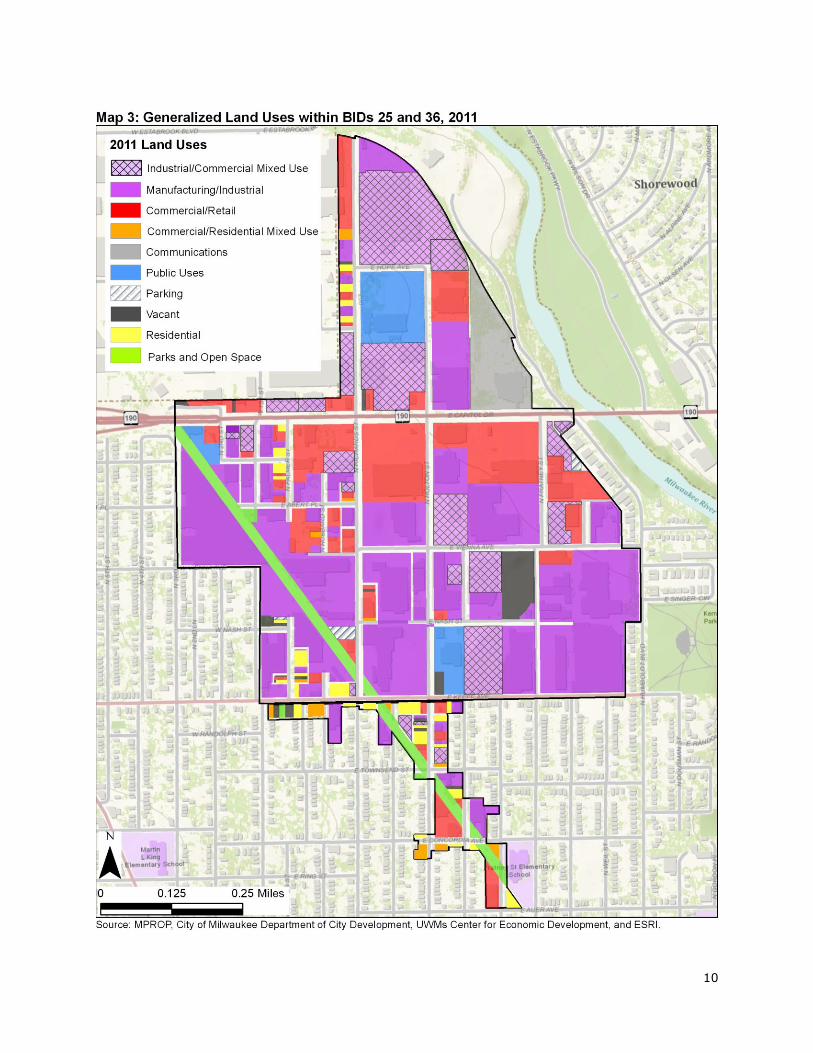
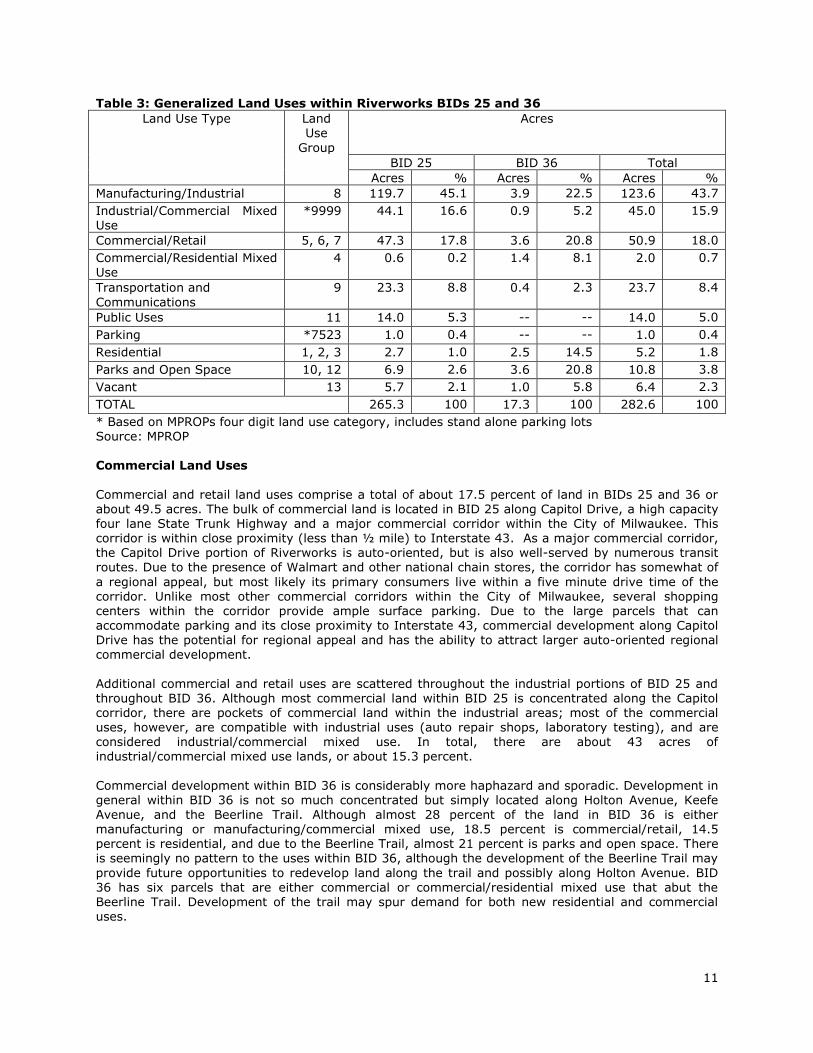
Land Use Profile BIDs 25 and 36 comprise approximately 329 acres of primarily industrially and commercially zoned lands. BID 25 is significantly larger encompassing a total of 307 acres, while BID 36 consists of 22 acres. Of the 329 acres within BIDs 25 and 36, approximately 42 acres is zoned for commercial uses and 230 is zoned for industrial uses. Map 3 and Table 3 show the breakouts of land uses within BIDs 25 and 36. Land within the BIDs totals
282.6 acres3; combined, the largest land uses within both BIDs are manufacturing/industrial (43.7 percent) and industrial/commercial mixed use (15.9 percent). Commercial/retail represents about 18.0 percent, and is mostly concentrated along the Capitol Drive corridor. Additionally, there are
about 23.3 acres of land categorized as Transportation and Communications (8.4 percent); this includes an 11 acre site owned by Journal Broadcast Group on Capitol Drive, while the remainder is the street grid.
Public uses represent about 5 percent and include the Holton Street Post Office, Lad Lake Education and Development Center, and the large Wisconsin National Guard facility. Parks and open space (3.8 percent) are comprised exclusively of lands reserved for the Beerline Trail, 10.8 acres that is currently under development and once complete, will wind its way through both BIDs. Additionally, there are several clusters of single family or duplex housing scattered throughout the BIDs; these are incompatible with the surrounding industrial and commercial uses, but their development likely
precedes all zoning in the area. In total there are 19 parcels that are currently vacant (6.4 acres) and three stand-alone parking lots. The three stand-alone parking lots total just under 1 acre in size; these may represent future opportunities for development of adjacent retail or industrial properties. Of the 19 vacant parcels, the average parcel size is about 1/3 of an acre; only 1 parcel is of substantial size (about 4 acres) for
industrial development. Most of the vacant parcels are scattered throughout the BIDs. A comparison
with vacancies within other industrial BIDs is discussed in a following section.
3 Acreage within the land use analysis is parcel based and therefore does not include roadways.
10
11
Table 3: Generalized Land Uses within Riverworks BIDs 25 and 36
Land Use Type Land Use
Group
Acres
BID 25 BID 36 Total
Acres % Acres % Acres %
Manufacturing/Industrial 8 119.7 45.1 3.9 22.5 123.6 43.7
Industrial/Commercial Mixed Use
*9999 44.1 16.6 0.9 5.2 45.0 15.9
Commercial/Retail 5, 6, 7 47.3 17.8 3.6 20.8 50.9 18.0
Commercial/Residential Mixed Use
4 0.6 0.2 1.4 8.1 2.0 0.7
Transportation and
Communications
9 23.3 8.8 0.4 2.3 23.7 8.4
Public Uses 11 14.0 5.3 -- -- 14.0 5.0
Parking *7523 1.0 0.4 -- -- 1.0 0.4
Residential 1, 2, 3 2.7 1.0 2.5 14.5 5.2 1.8
Parks and Open Space 10, 12 6.9 2.6 3.6 20.8 10.8 3.8
Vacant 13 5.7 2.1 1.0 5.8 6.4 2.3
TOTAL 265.3 100 17.3 100 282.6 100
* Based on MPROPs four digit land use category, includes stand alone parking lots Source: MPROP Commercial Land Uses
Commercial and retail land uses comprise a total of about 17.5 percent of land in BIDs 25 and 36 or about 49.5 acres. The bulk of commercial land is located in BID 25 along Capitol Drive, a high capacity four lane State Trunk Highway and a major commercial corridor within the City of Milwaukee. This corridor is within close proximity (less than ½ mile) to Interstate 43. As a major commercial corridor, the Capitol Drive portion of Riverworks is auto-oriented, but is also well-served by numerous transit routes. Due to the presence of Walmart and other national chain stores, the corridor has somewhat of
a regional appeal, but most likely its primary consumers live within a five minute drive time of the corridor. Unlike most other commercial corridors within the City of Milwaukee, several shopping centers within the corridor provide ample surface parking. Due to the large parcels that can accommodate parking and its close proximity to Interstate 43, commercial development along Capitol Drive has the potential for regional appeal and has the ability to attract larger auto-oriented regional commercial development.
Additional commercial and retail uses are scattered throughout the industrial portions of BID 25 and throughout BID 36. Although most commercial land within BID 25 is concentrated along the Capitol corridor, there are pockets of commercial land within the industrial areas; most of the commercial uses, however, are compatible with industrial uses (auto repair shops, laboratory testing), and are considered industrial/commercial mixed use. In total, there are about 43 acres of industrial/commercial mixed use lands, or about 15.3 percent.
Commercial development within BID 36 is considerably more haphazard and sporadic. Development in general within BID 36 is not so much concentrated but simply located along Holton Avenue, Keefe
Avenue, and the Beerline Trail. Although almost 28 percent of the land in BID 36 is either manufacturing or manufacturing/commercial mixed use, 18.5 percent is commercial/retail, 14.5 percent is residential, and due to the Beerline Trail, almost 21 percent is parks and open space. There is seemingly no pattern to the uses within BID 36, although the development of the Beerline Trail may
provide future opportunities to redevelop land along the trail and possibly along Holton Avenue. BID 36 has six parcels that are either commercial or commercial/residential mixed use that abut the Beerline Trail. Development of the trail may spur demand for both new residential and commercial uses.
12
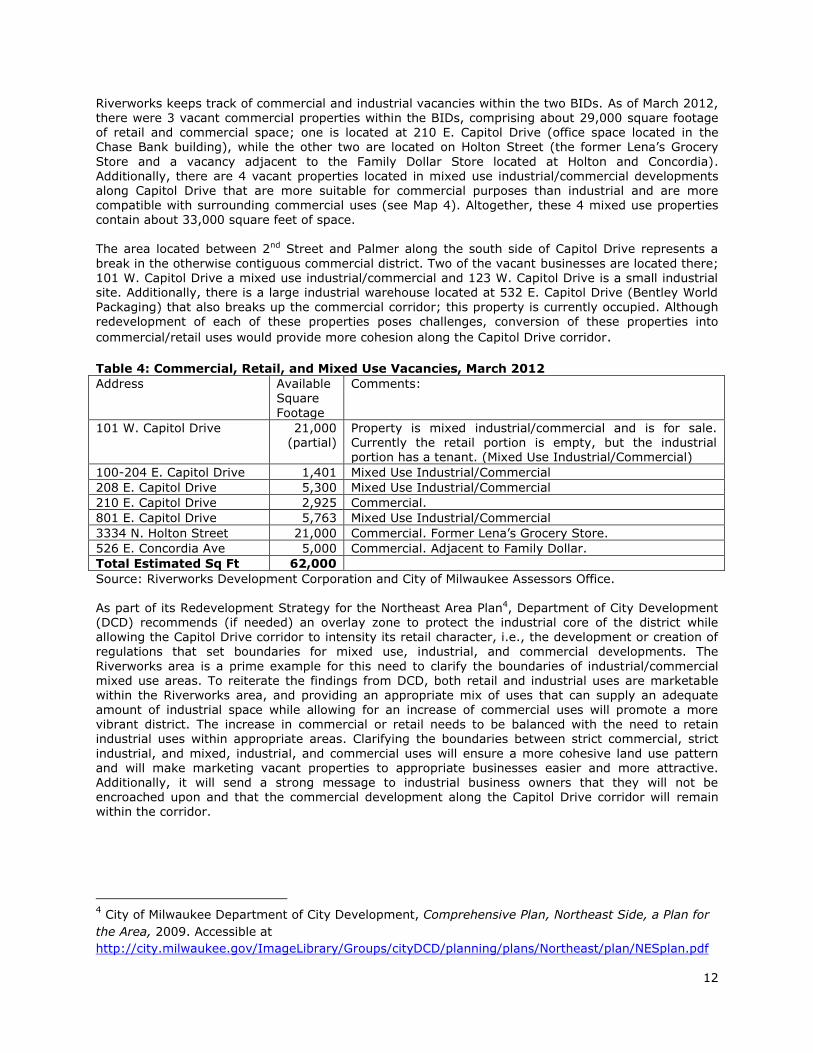
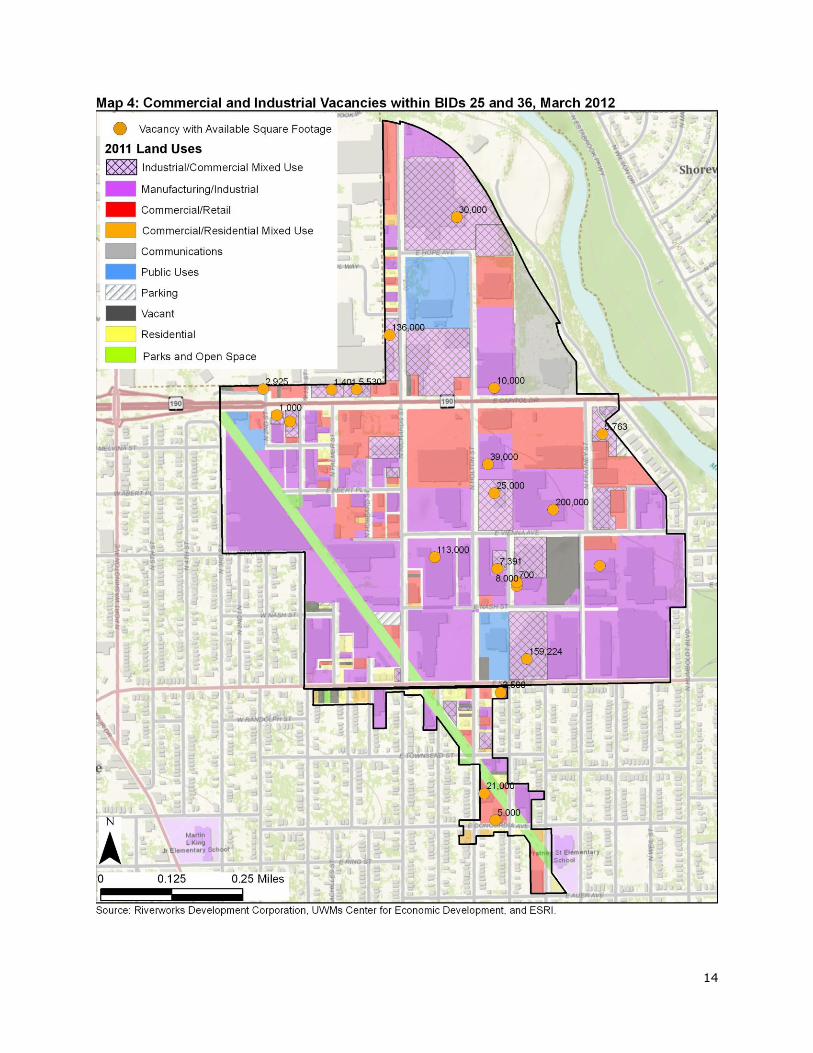
Riverworks keeps track of commercial and industrial vacancies within the two BIDs. As of March 2012,
there were 3 vacant commercial properties within the BIDs, comprising about 29,000 square footage of retail and commercial space; one is located at 210 E. Capitol Drive (office space located in the Chase Bank building), while the other two are located on Holton Street (the former Lena’s Grocery
Store and a vacancy adjacent to the Family Dollar Store located at Holton and Concordia). Additionally, there are 4 vacant properties located in mixed use industrial/commercial developments along Capitol Drive that are more suitable for commercial purposes than industrial and are more compatible with surrounding commercial uses (see Map 4). Altogether, these 4 mixed use properties contain about 33,000 square feet of space. The area located between 2nd Street and Palmer along the south side of Capitol Drive represents a
break in the otherwise contiguous commercial district. Two of the vacant businesses are located there; 101 W. Capitol Drive a mixed use industrial/commercial and 123 W. Capitol Drive is a small industrial site. Additionally, there is a large industrial warehouse located at 532 E. Capitol Drive (Bentley World Packaging) that also breaks up the commercial corridor; this property is currently occupied. Although redevelopment of each of these properties poses challenges, conversion of these properties into
commercial/retail uses would provide more cohesion along the Capitol Drive corridor.
Table 4: Commercial, Retail, and Mixed Use Vacancies, March 2012
Address Available Square
Footage
Comments:
101 W. Capitol Drive 21,000 (partial)
Property is mixed industrial/commercial and is for sale. Currently the retail portion is empty, but the industrial portion has a tenant. (Mixed Use Industrial/Commercial)
100-204 E. Capitol Drive 1,401 Mixed Use Industrial/Commercial
208 E. Capitol Drive 5,300 Mixed Use Industrial/Commercial
210 E. Capitol Drive 2,925 Commercial.
801 E. Capitol Drive 5,763 Mixed Use Industrial/Commercial
3334 N. Holton Street 21,000 Commercial. Former Lena’s Grocery Store.
526 E. Concordia Ave 5,000 Commercial. Adjacent to Family Dollar.
Total Estimated Sq Ft 62,000
Source: Riverworks Development Corporation and City of Milwaukee Assessors Office. As part of its Redevelopment Strategy for the Northeast Area Plan4, Department of City Development (DCD) recommends (if needed) an overlay zone to protect the industrial core of the district while allowing the Capitol Drive corridor to intensity its retail character, i.e., the development or creation of regulations that set boundaries for mixed use, industrial, and commercial developments. The
Riverworks area is a prime example for this need to clarify the boundaries of industrial/commercial mixed use areas. To reiterate the findings from DCD, both retail and industrial uses are marketable within the Riverworks area, and providing an appropriate mix of uses that can supply an adequate amount of industrial space while allowing for an increase of commercial uses will promote a more vibrant district. The increase in commercial or retail needs to be balanced with the need to retain industrial uses within appropriate areas. Clarifying the boundaries between strict commercial, strict
industrial, and mixed, industrial, and commercial uses will ensure a more cohesive land use pattern and will make marketing vacant properties to appropriate businesses easier and more attractive. Additionally, it will send a strong message to industrial business owners that they will not be encroached upon and that the commercial development along the Capitol Drive corridor will remain
within the corridor.
4 City of Milwaukee Department of City Development, Comprehensive Plan, Northeast Side, a Plan for
the Area, 2009. Accessible at
http://city.milwaukee.gov/ImageLibrary/Groups/cityDCD/planning/plans/Northeast/plan/NESplan.pdf
13
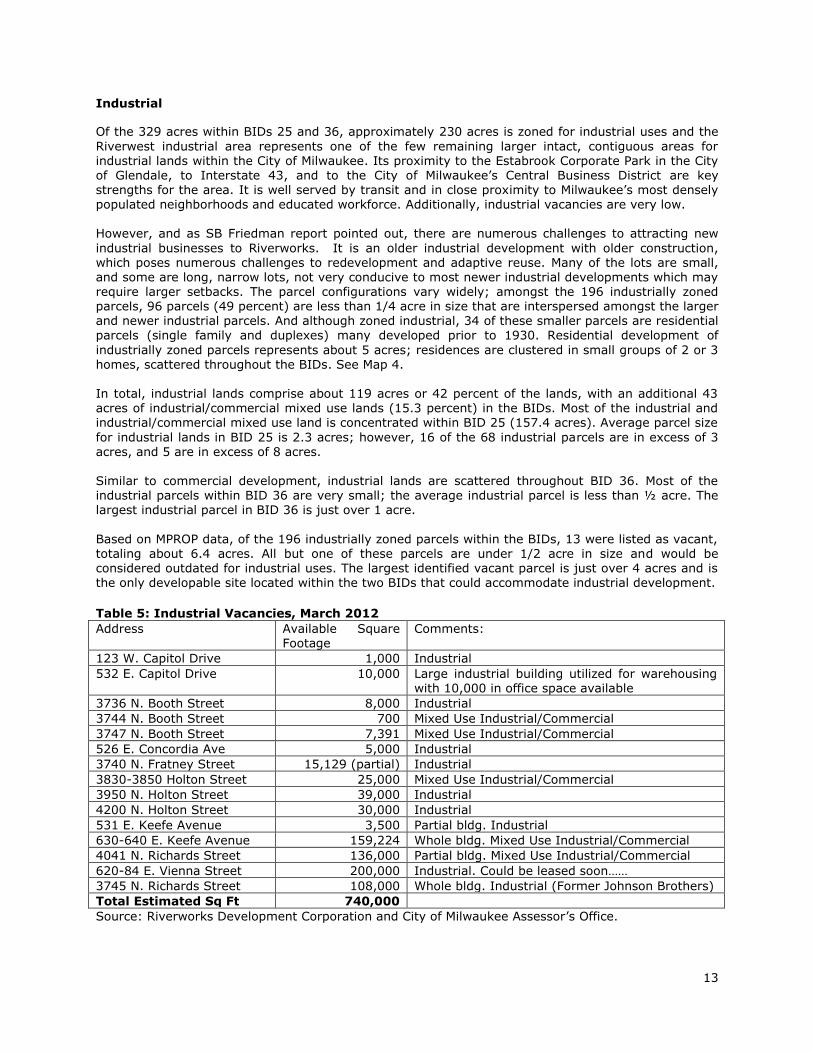
Industrial
Of the 329 acres within BIDs 25 and 36, approximately 230 acres is zoned for industrial uses and the
Riverwest industrial area represents one of the few remaining larger intact, contiguous areas for industrial lands within the City of Milwaukee. Its proximity to the Estabrook Corporate Park in the City of Glendale, to Interstate 43, and to the City of Milwaukee’s Central Business District are key strengths for the area. It is well served by transit and in close proximity to Milwaukee’s most densely populated neighborhoods and educated workforce. Additionally, industrial vacancies are very low. However, and as SB Friedman report pointed out, there are numerous challenges to attracting new
industrial businesses to Riverworks. It is an older industrial development with older construction, which poses numerous challenges to redevelopment and adaptive reuse. Many of the lots are small, and some are long, narrow lots, not very conducive to most newer industrial developments which may require larger setbacks. The parcel configurations vary widely; amongst the 196 industrially zoned parcels, 96 parcels (49 percent) are less than 1/4 acre in size that are interspersed amongst the larger and newer industrial parcels. And although zoned industrial, 34 of these smaller parcels are residential parcels (single family and duplexes) many developed prior to 1930. Residential development of
industrially zoned parcels represents about 5 acres; residences are clustered in small groups of 2 or 3 homes, scattered throughout the BIDs. See Map 4. In total, industrial lands comprise about 119 acres or 42 percent of the lands, with an additional 43 acres of industrial/commercial mixed use lands (15.3 percent) in the BIDs. Most of the industrial and industrial/commercial mixed use land is concentrated within BID 25 (157.4 acres). Average parcel size
for industrial lands in BID 25 is 2.3 acres; however, 16 of the 68 industrial parcels are in excess of 3 acres, and 5 are in excess of 8 acres. Similar to commercial development, industrial lands are scattered throughout BID 36. Most of the industrial parcels within BID 36 are very small; the average industrial parcel is less than ½ acre. The largest industrial parcel in BID 36 is just over 1 acre.
Based on MPROP data, of the 196 industrially zoned parcels within the BIDs, 13 were listed as vacant, totaling about 6.4 acres. All but one of these parcels are under 1/2 acre in size and would be considered outdated for industrial uses. The largest identified vacant parcel is just over 4 acres and is
the only developable site located within the two BIDs that could accommodate industrial development.
Table 5: Industrial Vacancies, March 2012
Address Available Square Footage
Comments:
123 W. Capitol Drive 1,000 Industrial
532 E. Capitol Drive 10,000 Large industrial building utilized for warehousing with 10,000 in office space available
3736 N. Booth Street 8,000 Industrial
3744 N. Booth Street 700 Mixed Use Industrial/Commercial
3747 N. Booth Street 7,391 Mixed Use Industrial/Commercial
526 E. Concordia Ave 5,000 Industrial
3740 N. Fratney Street 15,129 (partial) Industrial
3830-3850 Holton Street 25,000 Mixed Use Industrial/Commercial
3950 N. Holton Street 39,000 Industrial
4200 N. Holton Street 30,000 Industrial
531 E. Keefe Avenue 3,500 Partial bldg. Industrial
630-640 E. Keefe Avenue 159,224 Whole bldg. Mixed Use Industrial/Commercial
4041 N. Richards Street 136,000 Partial bldg. Mixed Use Industrial/Commercial
620-84 E. Vienna Street 200,000 Industrial. Could be leased soon……
3745 N. Richards Street 108,000 Whole bldg. Industrial (Former Johnson Brothers)
Total Estimated Sq Ft 740,000
Source: Riverworks Development Corporation and City of Milwaukee Assessor’s Office.
14
15
Riverworks Development Corporation keeps track of available industrial properties within the two
BIDs, and as of March 2012, there were an estimated 12 industrial or mixed industrial/commercial vacancies in BID 25 and 3 vacancies in BID 36. The size of the units varies considerably, from 700 square feet to 200,000 square feet, totaling over 740,000 square feet (see Table 5). Many of the
smaller units represent vacancies within larger properties. Although most of the properties are zoned and used for industrial purposes, one is an office unit within a larger industrial complex located on Capitol Drive, and five are identified as mixed use industrial/commercial. As stated in the previous section, DCD recommends the development of regulations (if needed) that set boundaries for mixed use, industrial, and commercial developments. Clarification of allowable uses within the BID boundaries would help the BIDs market vacant properties more easily. Additionally, it
will send a strong message to existing industrial business owners that they are not being forced out through encroachment of other uses such as commercial or residential. Comparison to Milwaukee’s Other Industrial BIDs In addition to Riverworks BIDs 25 and 36, there are four additional industrial BIDs located in the City
of Milwaukee: Menomonee Valley, Havenswoods, the 30th Street Corridor, and the Gateway Aerotropolis. Each of the BIDs is unique. Map 5 shows the locations of all of the industrial BIDs in the City of Milwaukee. Two of these BIDs (Menomonee Valley and 30th Street Corridor) have undergone or are undergoing major redevelopment efforts by the City of Milwaukee to transform large areas of outmoded small industrial parcels into modern industrial/corporate parks. Havenwoods is a relatively newer development with larger parcels and lower densities that compare well to newer industrial developments generally found in suburban and exurban areas. The Gateway Aerotropolis BID
primarily contains uses affiliated with airports including warehousing and trucking terminals as well as non-industrial uses such as hotels, restaurants, and parking. Table 6 shows a comparison of the amount of industrially zoned lands within each of the five industrial BIDs. Table 6 illustrates the amount of developable land within each of the BIDs. Table 6: Zoning Assessment of the City of Milwaukee’s Industrial BIDs
BID BID Name Total BID Acres
Acres Industrially Zoned Within BID Boundary
Acres Industrially Used Land*
Percent
25 and 36
Riverworks 1 and 2 328.6 230.5 142.7 61.9
26 Menomonee Valley 826.5 632.5 344.1 54.4
31 Havenwoods 1,097.8 619.3 302.3 48.8
37 30th Street Corridor 606.3 469.0 386.5 82.4
40 Gateway Aerotropolis 3,284.8 2,631.4 2,134.4 81.1
*Land Use Groups 8 and 9 Source: City of Milwaukee Department of City Development and MPROP. The following provides a brief overview of developable lands within Milwaukee’s five industrial BIDs:
Riverworks: There are only a total of 6.4 acres of developable land within the two Riverworks
BIDs. Most of the vacant lots within BIDs 25 and 36 are likely former housing parcels, which alone are very small and inappropriate for most industrial uses as they range in size from ¼ to less than ½ acre in size. These lots would need to be aggregated with adjacent lots for any
substantial development to occur. There is currently only 1 substantial developable parcel in
Riverworks, a 4 acre lot located in BID 25. Future development within the BID will rely most heavily on the reuse or redevelopment of existing properties, many of which are functionally obsolete.
Menomonee Valley:The Menomonee Valley has undergone a major transformation over the past two decades, which involved major environmental cleanup, demolition of abandoned, outdated, and outmoded properties, and the reassembling of properties into a modern industrial park. Developable
lands within the Menomonee Valley BID include about 104 acres amongst 30 vacant parcels, many of substantial size for development. The average parcel size

16
17
is 3.5 acres, and 8 of the parcels are over 5 acres; the largest include 3 parcels around 14.5
acres in size.
30th Street Corridor: The 30th Street Corridor is currently undergoing a major redevelopment, similar to the redevelopment that occurred in the Menomonee Valley. Like the Valley, the Corridor contains numerous abandoned, outdated, outmoded factories that are in the process of being acquired for demolition, environmental cleanup, and repackaging for new development. Based on the current MPROP data, developable lands include 95 vacant parcels comprising about 74 acres; however, due to the ongoing acquisition, clean up, and redevelopment efforts, this will likely greatly increase in the coming years. Currently, the
average (mean) vacant parcel size is 0.8 acres. There is currently one substantial 14 acre parcel, and there are several clusters of smaller vacant parcels that could be assembled into substantially larger parcels located throughout the 30th Street Corridor.
Havenwoods: In comparison to each of the other industrial BIDs, Havenwoods BID contains the greatest amount of developable parcels at 162.5 acres of vacant land. Havenwoods
contains 34 parcels with an average size of 4.8 acres. Ten of the 34 parcels are over 5 acres;
five of these are over 10 acres in size and its two largest parcels are 25 and 27 acres. Additionally, many of these parcels are contiguous and could be combined into even larger parcels. One major drawback for development, however, is the accessibility of some of the larger interior parcels which would require consolidation with exterior parcels and the development of major infrastructures in order to allow for development of the interior parcels.
Gateway Aerotropolis: There are about 58 vacant, developable parcels located within the Gateway Aerotropolis BID. Although the average size of the vacant parcels is 2.6 acres, there are 9 parcels that are over 5 acres in size, including one very substantial 21 acre parcel. Most of the development within the Gateway BID is dedicated to the airport and related uses. The airport area serves the function of a port, and although there are some industries and businesses located within the airport BID, much of it serves as storage and transfer facilities for goods coming in and out of Wisconsin.
Table 7: Vacant Parcels within the Industrial BIDs
BID BID Name Developable Acres Number of Vacant Parcels
Average Vacant Parcel Size
25 and 36
Riverworks 1 and 2 6.4 19 0.3
26 Menomonee Valley 103.9 30 3.5
31 Havenwoods 162.5 34 4.8
37 30th Street Corridor 74.0 95 0.8
40 Gateway Aerotropolis 148.6 58 2.6
Source: MPROP
In comparison to the other industrial BIDs, Riverworks is smaller and has very little developable land available within its boundaries. It also represents a much older and more compact form of industrial development that may seem outmoded in comparison to current trends in industrial development which favor large lot, greenfield development in exurban areas over infill or redevelopment within urban or suburban areas. In general, infill or redevelopment is far more costly than greenfield development. Costs for land acquisition, demolition, and brownfield cleanup generally outweigh the
costs for adding infrastructure to greenfields. Additionally, infill or redevelopment for industrial or
commercial purposes is generally more feasible when it occurs on a large plot of land which means that many of the small parcels within the Riverworks area would need to be aggregated with adjacent parcels in order to make them more attractive for redevelopment.
18
Housing Profile5 The housing market in the Riverworks study area is being impacted by a combination of national and
local economic and demographic factors. These include the aging of the population (particularly the baby boom generation), declines in average household incomes, declines in population, a decrease in average household size, coupled with the stagnancy of the housing market due to the Great Recession. Within the study area, there has been a slight decline in total population over the past decade, although this is projected to stabilize through 2015. The total number of housing units within the study area has grown since 2000 and is anticipated to continue to grow through the year 2015. Also, the number of owner occupied units has increased although the proportion of owner occupied
housing units has declined since 2000. Housing Unit Description Table 8 shows the mix of housing units by type in 2000 and in 2010 within the Riverworks study area. As of 2010, there were approximately 54,839 housing units within the study area, an increase of about 2,117 units since 2000. Single family units (both attached and detached) comprised the
greatest proportion of units, about 43.4 percent, a negligible decrease since 2000. About 582 new
single family units were added since 2000; Census data indicates that only 92 of new single family units were attached (condos), indicating that 490 units of detached single family homes were added. In 2010, duplexes comprised about 26.7 percent of all units, adding about 298 units since 2000, but declining in the share of total units. Table 8: Housing Unit Mix Change: 2000-2010
Housing Unit Type
2000 2010 2000 – 2010 Change
Number Percent Number Percent Number Percent
Single Family 23,252 44.1 23,834 43.4 582 2.5
Duplex 14,319 27.2 14,617 26.7 298 2.1
Multiplex 15,033 28.5 16,270 29.7 1,237 8.2
Mobile Home 95 0.2 118 0.2 23 24.2
Other 23 0.0 0 0.0 -23 -100.0
TOTAL 52,722 100.0 54,839 100.0 2,117 4.0
Sources: 2000 Census SF3, 2010 5 Year American Community Survey
Multiplex units (3 or more) comprised about 29.7 percent or 16,270 units, showing the greatest increase in units, 1,237, and share of units since 2000. Most growth within multiplex units occurred in buildings with large numbers of units, such as 20 to 49 unit complexes (446 units) or in buildings with over 50 units (373 units). Few small units (3-4 unit or 5 to 9 unit complexes) were added over this time period.
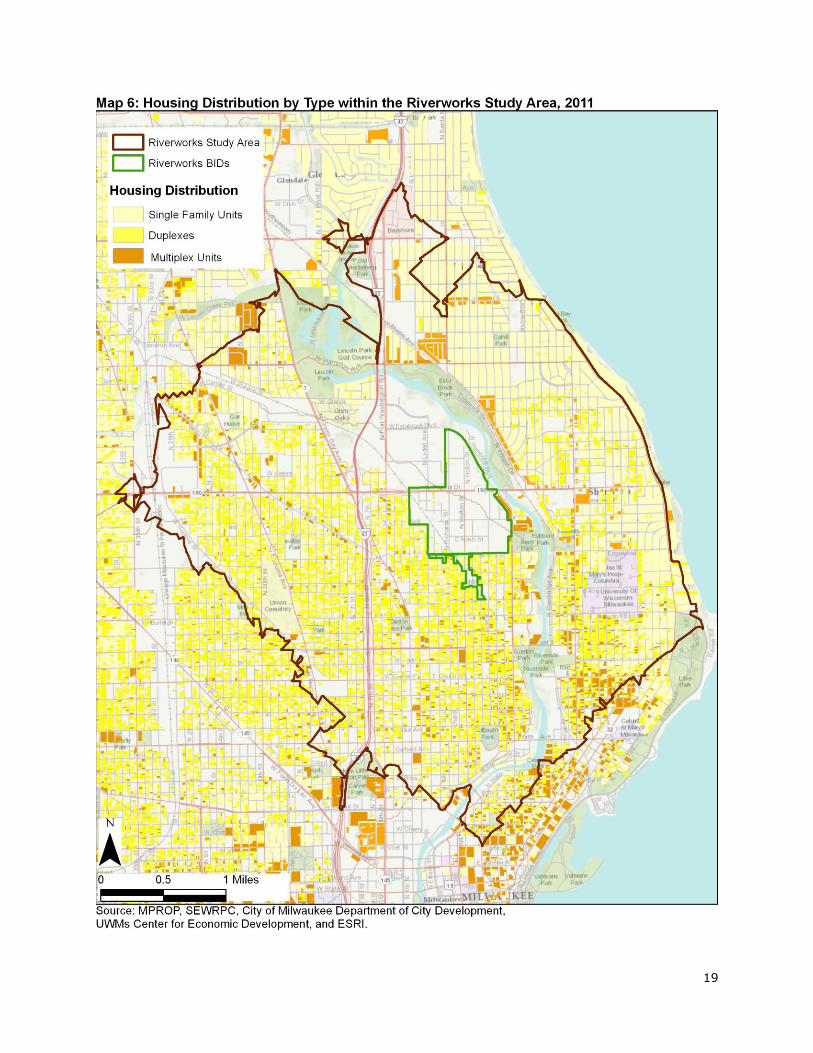
Map 6 shows the distribution of housing units by dwelling type within the Riverworks study area. Higher density duplex and multiplex units are concentrated more heavily to the south and east of the Riverworks BIDs, in the Riverwest and Eastside neighborhoods, particularly around the University of Wisconsin-Milwaukee and south of Locust Street. These areas have a significantly higher student population than other parts of the study area. North and east of the Milwaukee River, in Shorewood
and parts of Glendale and Whitefish Bay, housing becomes significantly less dense, and single family homes are the dominant dwelling type.
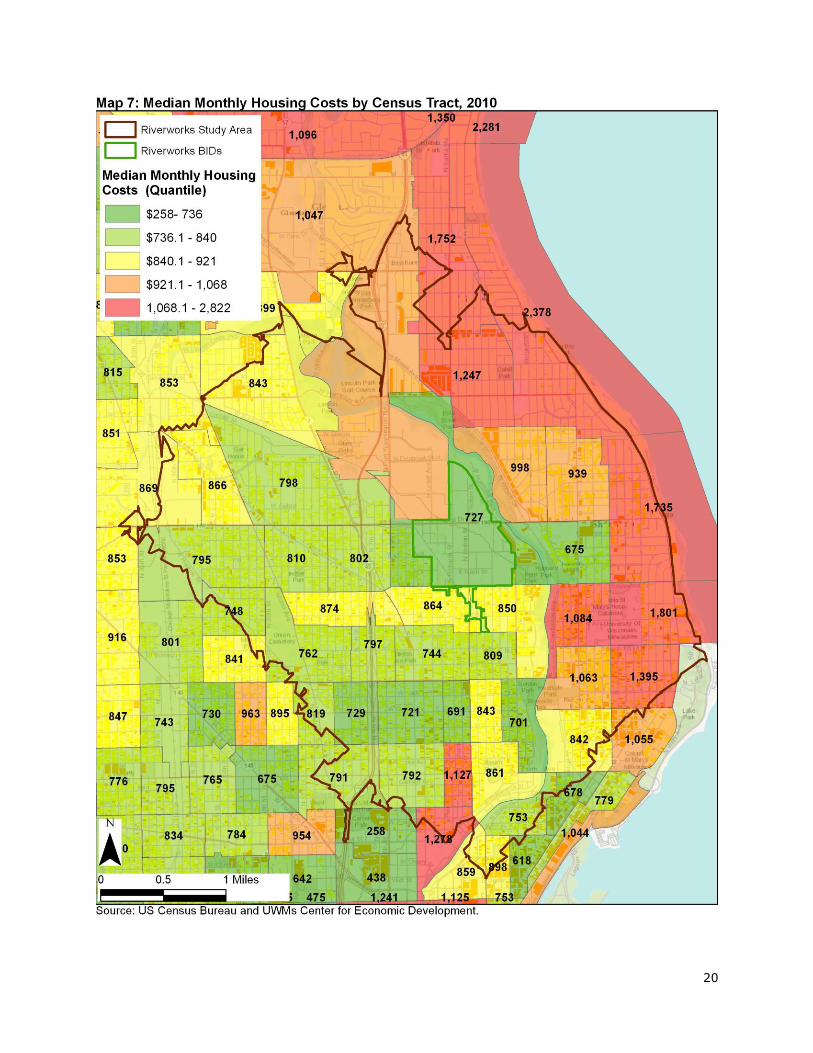
In 2010, median monthly housing costs are approximately $952 per month for the entire study area, although it varies significantly throughout the Riverworks study area (see Map 7). Monthly housing costs tend to be higher in Census tracts nearest to Lake Michigan and towards the southern end of the study area (communities of Shorewood, Whitefish Bay, and Milwaukee’s eastside and Brewer’s Hill
neighborhoods) and tend to decline further west from the Lake. The median housing unit value is
5 Based on insufficiencies in data, the housing analysis is based on aggregated Census Tract level data that approximates the 5 minute drive shed area. This compares housing characteristics from the year 2000 (Census Summary File 3) to 2010 (American Community Survey data for years 2006-2010).
19
20
21
about $153,000; again, the trend indicates that housing values increase significantly closer to the lake
and south and decline towards the west. Median gross rent was $756/mo for all housing units in 2010, an increase of $231 or 44 percent from 2000, and like monthly housing costs, gross rents are significantly higher in Census Tracts closer to the lake within the study area.
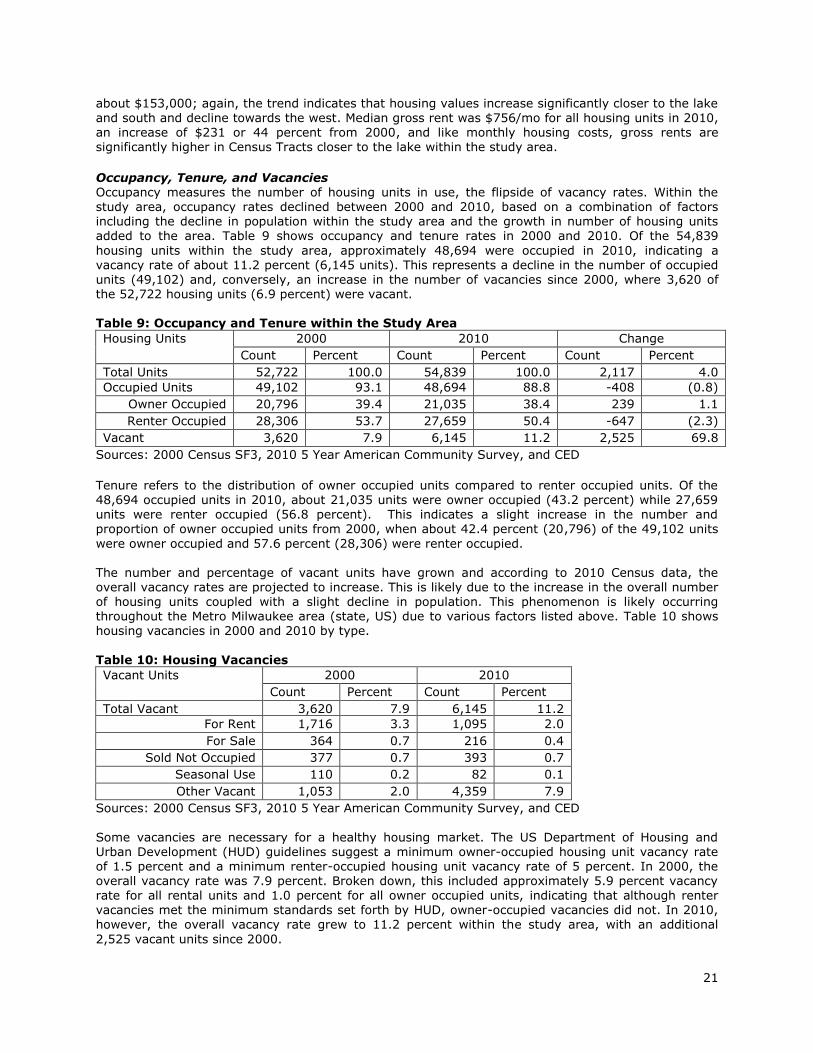
Occupancy, Tenure, and Vacancies Occupancy measures the number of housing units in use, the flipside of vacancy rates. Within the study area, occupancy rates declined between 2000 and 2010, based on a combination of factors including the decline in population within the study area and the growth in number of housing units added to the area. Table 9 shows occupancy and tenure rates in 2000 and 2010. Of the 54,839
housing units within the study area, approximately 48,694 were occupied in 2010, indicating a vacancy rate of about 11.2 percent (6,145 units). This represents a decline in the number of occupied units (49,102) and, conversely, an increase in the number of vacancies since 2000, where 3,620 of the 52,722 housing units (6.9 percent) were vacant. Table 9: Occupancy and Tenure within the Study Area
Housing Units 2000 2010 Change
Count Percent Count Percent Count Percent
Total Units 52,722 100.0 54,839 100.0 2,117 4.0
Occupied Units 49,102 93.1 48,694 88.8 -408 (0.8)
Owner Occupied 20,796 39.4 21,035 38.4 239 1.1
Renter Occupied 28,306 53.7 27,659 50.4 -647 (2.3)
Vacant 3,620 7.9 6,145 11.2 2,525 69.8
Sources: 2000 Census SF3, 2010 5 Year American Community Survey, and CED Tenure refers to the distribution of owner occupied units compared to renter occupied units. Of the 48,694 occupied units in 2010, about 21,035 units were owner occupied (43.2 percent) while 27,659 units were renter occupied (56.8 percent). This indicates a slight increase in the number and proportion of owner occupied units from 2000, when about 42.4 percent (20,796) of the 49,102 units
were owner occupied and 57.6 percent (28,306) were renter occupied.
The number and percentage of vacant units have grown and according to 2010 Census data, the overall vacancy rates are projected to increase. This is likely due to the increase in the overall number of housing units coupled with a slight decline in population. This phenomenon is likely occurring throughout the Metro Milwaukee area (state, US) due to various factors listed above. Table 10 shows housing vacancies in 2000 and 2010 by type.
Table 10: Housing Vacancies
Vacant Units 2000 2010
Count Percent Count Percent
Total Vacant 3,620 7.9 6,145 11.2
For Rent 1,716 3.3 1,095 2.0
For Sale 364 0.7 216 0.4
Sold Not Occupied 377 0.7 393 0.7
Seasonal Use 110 0.2 82 0.1
Other Vacant 1,053 2.0 4,359 7.9
Sources: 2000 Census SF3, 2010 5 Year American Community Survey, and CED
Some vacancies are necessary for a healthy housing market. The US Department of Housing and Urban Development (HUD) guidelines suggest a minimum owner-occupied housing unit vacancy rate of 1.5 percent and a minimum renter-occupied housing unit vacancy rate of 5 percent. In 2000, the overall vacancy rate was 7.9 percent. Broken down, this included approximately 5.9 percent vacancy rate for all rental units and 1.0 percent for all owner occupied units, indicating that although renter vacancies met the minimum standards set forth by HUD, owner-occupied vacancies did not. In 2010, however, the overall vacancy rate grew to 11.2 percent within the study area, with an additional
2,525 vacant units since 2000.
22
Planned Developments
In 2008, SB Friedman & Company produced the Northeast Side Market Study6 for the City of Milwaukee’s Department of City Development in which they assessed existing and planned developments within the Northeast Side Planning Area. SB Friedman found that a total of 1,018
occupancy permits, were issued between 2001 and 2006 or an annual rate of nearly 170 units per year during this time period. Due to a lack of available large-scale parcels, development in the planning area is almost exclusively infill development, and most of the residential permits (892) were issued for multifamily units (condos, apartments, and townhouses) or mixed use, with commercial development at street level and multi-unit residential above. There was some single family residential infill, with most of this developed by Habitat for Humanity.
Within the Riverworks Study Area, most of the residential development over the past decade focused on market rate multifamily or mixed-use multifamily units concentrated in the Lower Eastside and Brewer’s Hill Neighborhoods, particularly along the Milwaukee River. There was some affordable development (workforce housing or senior housing) although this was dwarfed by market rate development. A total of 293 affordable and senior multi-family units were developed along Martin Luther King Drive in the Harambee Neighborhood during this time period.
Residential development nose-dived following the 2008 Great Recession and subsequent housing crisis, although several existing commitments, such as the Park Lafayette Towers apartments (292 units), the Gallun Tannery (250), Latitude (25), and Park Bluff (33) in the Lower Eastside were completed. In 2008, SB Friedman identified nine major condominium projects with a total of 723 units planned for the Northeast Side area; of these nine, 4 were completed, one is undergoing the approval process, and 4 have either placed on hold or the proposals were withdrawn.
Although the pace of development has slowed considerably since the early part of the decade, multifamily units particularly for apartments are in great demand in the Lower Eastside and Brewers Hill Neighborhoods. And although demand for multifamily housing may be high, the Recession has tightened the lending practices by banks, often making new development unfeasible without resorting to alternative financing such as Wisconsin Housing and Economic Development Association (WHEDA) or Low Income Housing Tax Credits (LIHTC). Tax credits work by allowing the developer to sell tax
credits to investors to raise the capital for development; in return, they are required to charge affordable rates for either all or a portion of the units within the development. The demand for tax
credits has skyrocketed, but the number of tax credits available has not expanded (its contracted) and competition for tax credits has increased dramatically since the beginning of the Recession. Tax credits have been awarded to 5 developments (269 units) since 2008 in the Riverworks Study Area; RDC’s Riverworks Lofts was awarded WHEDA tax credits during the 2010 cycle.
Demographic Profile
Like the rest of the country, the Riverworks area is being impacted by a combination of economic and demographic factors including the aging of the population, stagnant average household incomes, a declining population, a decrease in average household size, the stagnancy of the housing market due to the Great Recession, and inflation. This profile includes an assessment of recent socio- and economic trends and projections of the population and households within the Riverworks Study Area.
Table 11: Population and Households
2000 2010 2015
Number Number Percent Change
(2000-2010)
Number Percent Change
(2010-2015)
Population 105,115 103,833 -1.2% 103,897 0.1%
Households 42,356 42,452 0.2% 42,618 0.4%
Source: US Census Bureau and ESRI Business Analyst
6 SB Friedman and Company Northeast Side Market Study, February 2008.
23
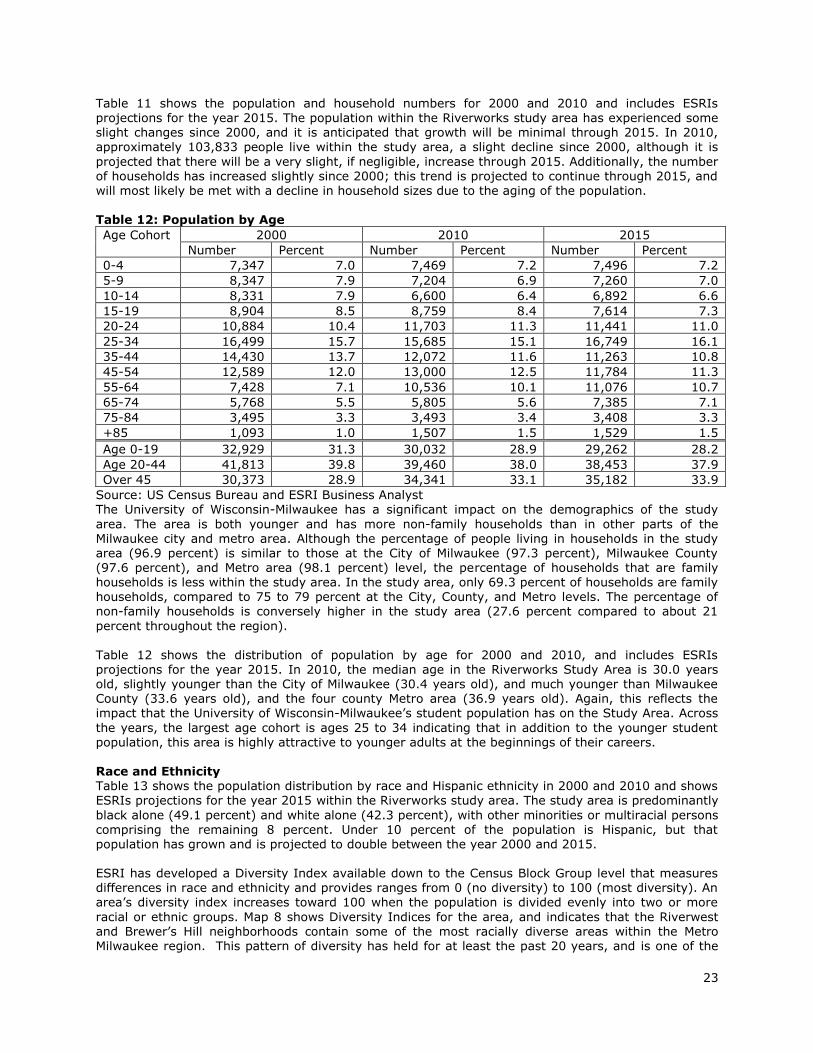
Table 11 shows the population and household numbers for 2000 and 2010 and includes ESRIs
projections for the year 2015. The population within the Riverworks study area has experienced some slight changes since 2000, and it is anticipated that growth will be minimal through 2015. In 2010, approximately 103,833 people live within the study area, a slight decline since 2000, although it is
projected that there will be a very slight, if negligible, increase through 2015. Additionally, the number of households has increased slightly since 2000; this trend is projected to continue through 2015, and will most likely be met with a decline in household sizes due to the aging of the population. Table 12: Population by Age
Age Cohort 2000 2010 2015
Number Percent Number Percent Number Percent
0-4 7,347 7.0 7,469 7.2 7,496 7.2
5-9 8,347 7.9 7,204 6.9 7,260 7.0
10-14 8,331 7.9 6,600 6.4 6,892 6.6
15-19 8,904 8.5 8,759 8.4 7,614 7.3
20-24 10,884 10.4 11,703 11.3 11,441 11.0
25-34 16,499 15.7 15,685 15.1 16,749 16.1
35-44 14,430 13.7 12,072 11.6 11,263 10.8
45-54 12,589 12.0 13,000 12.5 11,784 11.3
55-64 7,428 7.1 10,536 10.1 11,076 10.7
65-74 5,768 5.5 5,805 5.6 7,385 7.1
75-84 3,495 3.3 3,493 3.4 3,408 3.3
+85 1,093 1.0 1,507 1.5 1,529 1.5
Age 0-19 32,929 31.3 30,032 28.9 29,262 28.2
Age 20-44 41,813 39.8 39,460 38.0 38,453 37.9
Over 45 30,373 28.9 34,341 33.1 35,182 33.9
Source: US Census Bureau and ESRI Business Analyst The University of Wisconsin-Milwaukee has a significant impact on the demographics of the study
area. The area is both younger and has more non-family households than in other parts of the Milwaukee city and metro area. Although the percentage of people living in households in the study area (96.9 percent) is similar to those at the City of Milwaukee (97.3 percent), Milwaukee County (97.6 percent), and Metro area (98.1 percent) level, the percentage of households that are family
households is less within the study area. In the study area, only 69.3 percent of households are family households, compared to 75 to 79 percent at the City, County, and Metro levels. The percentage of non-family households is conversely higher in the study area (27.6 percent compared to about 21
percent throughout the region). Table 12 shows the distribution of population by age for 2000 and 2010, and includes ESRIs projections for the year 2015. In 2010, the median age in the Riverworks Study Area is 30.0 years old, slightly younger than the City of Milwaukee (30.4 years old), and much younger than Milwaukee County (33.6 years old), and the four county Metro area (36.9 years old). Again, this reflects the impact that the University of Wisconsin-Milwaukee’s student population has on the Study Area. Across
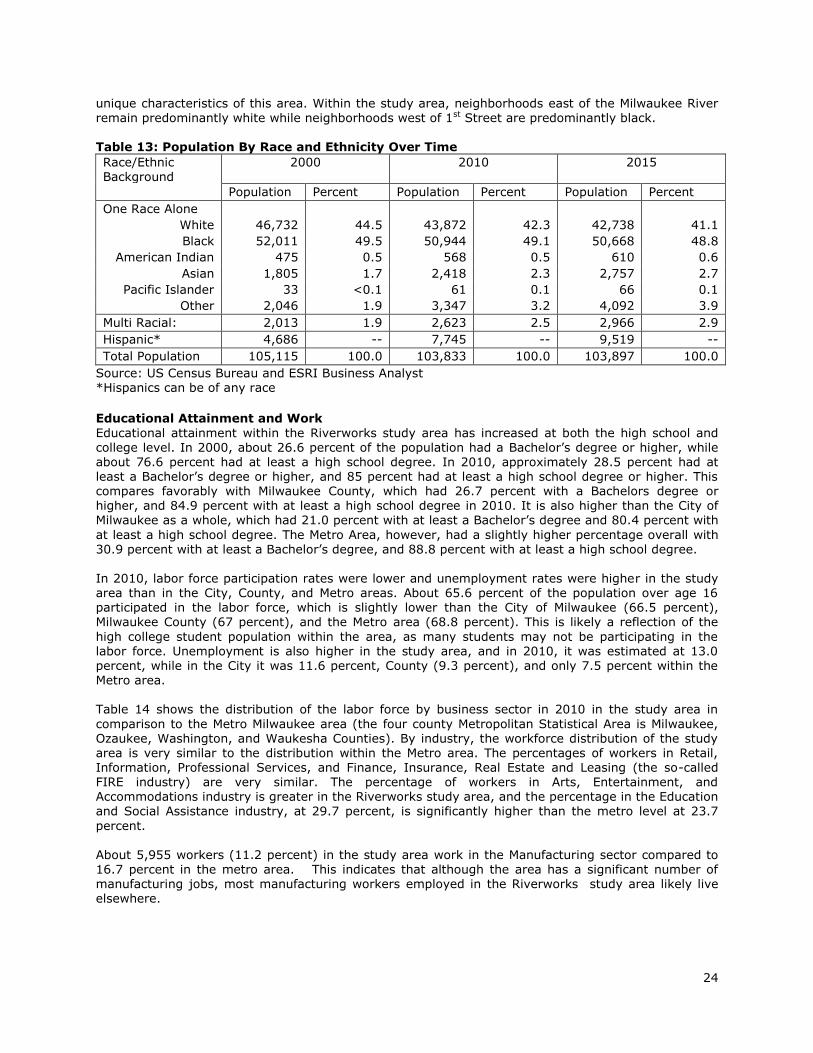
the years, the largest age cohort is ages 25 to 34 indicating that in addition to the younger student population, this area is highly attractive to younger adults at the beginnings of their careers. Race and Ethnicity Table 13 shows the population distribution by race and Hispanic ethnicity in 2000 and 2010 and shows ESRIs projections for the year 2015 within the Riverworks study area. The study area is predominantly
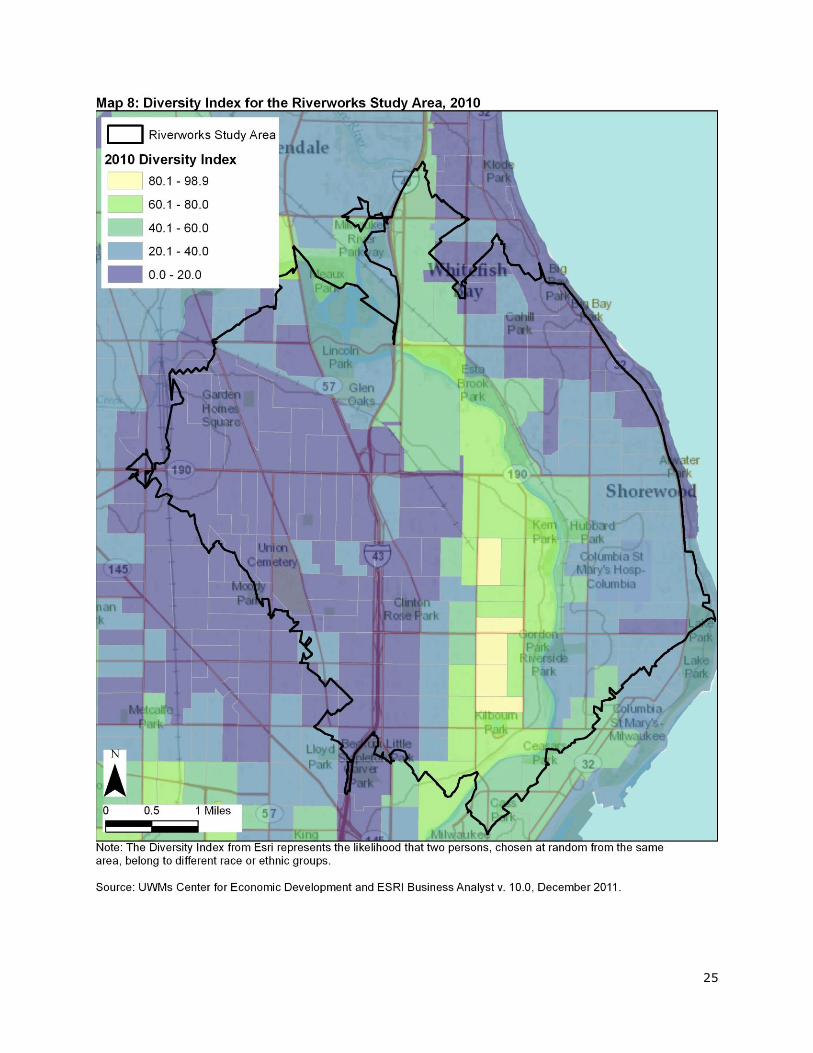
black alone (49.1 percent) and white alone (42.3 percent), with other minorities or multiracial persons comprising the remaining 8 percent. Under 10 percent of the population is Hispanic, but that population has grown and is projected to double between the year 2000 and 2015. ESRI has developed a Diversity Index available down to the Census Block Group level that measures differences in race and ethnicity and provides ranges from 0 (no diversity) to 100 (most diversity). An area’s diversity index increases toward 100 when the population is divided evenly into two or more
racial or ethnic groups. Map 8 shows Diversity Indices for the area, and indicates that the Riverwest and Brewer’s Hill neighborhoods contain some of the most racially diverse areas within the Metro Milwaukee region. This pattern of diversity has held for at least the past 20 years, and is one of the
24
unique characteristics of this area. Within the study area, neighborhoods east of the Milwaukee River
remain predominantly white while neighborhoods west of 1st Street are predominantly black. Table 13: Population By Race and Ethnicity Over Time
Race/Ethnic Background
2000 2010 2015
Population Percent Population Percent Population Percent
One Race Alone
White 46,732 44.5 43,872 42.3 42,738 41.1
Black 52,011 49.5 50,944 49.1 50,668 48.8
American Indian 475 0.5 568 0.5 610 0.6
Asian 1,805 1.7 2,418 2.3 2,757 2.7
Pacific Islander 33 <0.1 61 0.1 66 0.1
Other 2,046 1.9 3,347 3.2 4,092 3.9
Multi Racial: 2,013 1.9 2,623 2.5 2,966 2.9
Hispanic* 4,686 -- 7,745 -- 9,519 --
Total Population 105,115 100.0 103,833 100.0 103,897 100.0
Source: US Census Bureau and ESRI Business Analyst *Hispanics can be of any race Educational Attainment and Work
Educational attainment within the Riverworks study area has increased at both the high school and college level. In 2000, about 26.6 percent of the population had a Bachelor’s degree or higher, while about 76.6 percent had at least a high school degree. In 2010, approximately 28.5 percent had at least a Bachelor’s degree or higher, and 85 percent had at least a high school degree or higher. This compares favorably with Milwaukee County, which had 26.7 percent with a Bachelors degree or higher, and 84.9 percent with at least a high school degree in 2010. It is also higher than the City of Milwaukee as a whole, which had 21.0 percent with at least a Bachelor’s degree and 80.4 percent with
at least a high school degree. The Metro Area, however, had a slightly higher percentage overall with 30.9 percent with at least a Bachelor’s degree, and 88.8 percent with at least a high school degree.
In 2010, labor force participation rates were lower and unemployment rates were higher in the study area than in the City, County, and Metro areas. About 65.6 percent of the population over age 16 participated in the labor force, which is slightly lower than the City of Milwaukee (66.5 percent), Milwaukee County (67 percent), and the Metro area (68.8 percent). This is likely a reflection of the
high college student population within the area, as many students may not be participating in the labor force. Unemployment is also higher in the study area, and in 2010, it was estimated at 13.0 percent, while in the City it was 11.6 percent, County (9.3 percent), and only 7.5 percent within the Metro area. Table 14 shows the distribution of the labor force by business sector in 2010 in the study area in
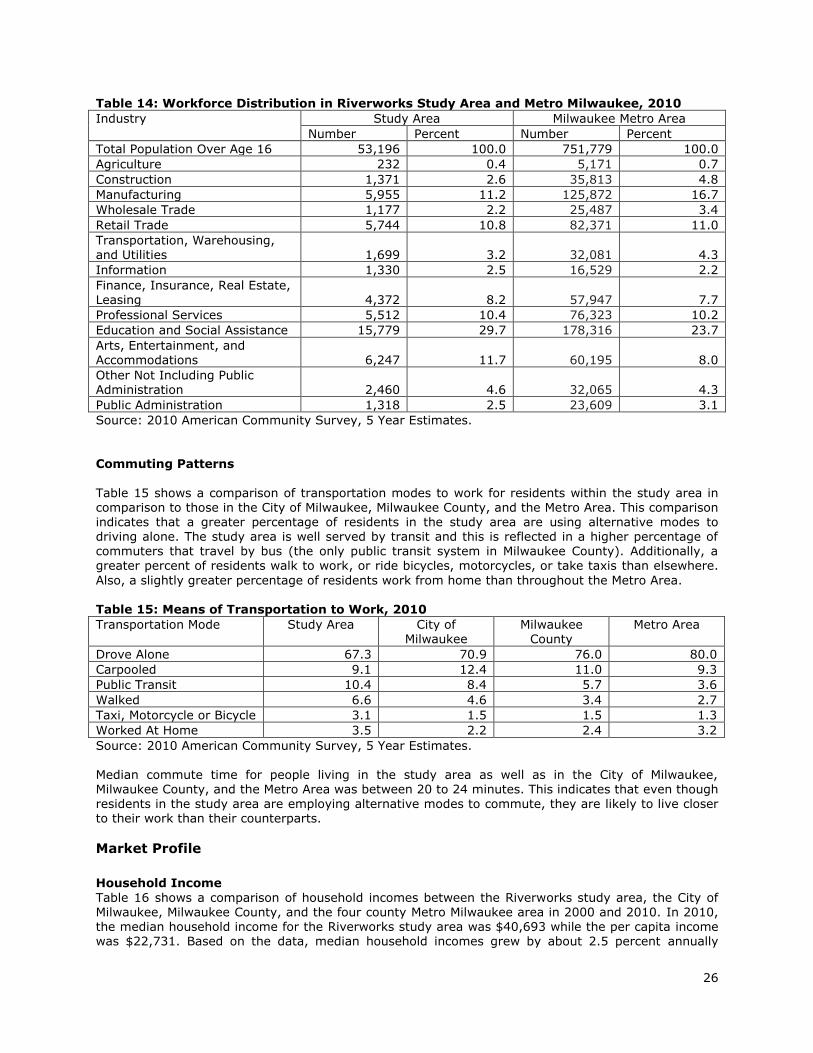
comparison to the Metro Milwaukee area (the four county Metropolitan Statistical Area is Milwaukee, Ozaukee, Washington, and Waukesha Counties). By industry, the workforce distribution of the study area is very similar to the distribution within the Metro area. The percentages of workers in Retail, Information, Professional Services, and Finance, Insurance, Real Estate and Leasing (the so-called FIRE industry) are very similar. The percentage of workers in Arts, Entertainment, and Accommodations industry is greater in the Riverworks study area, and the percentage in the Education
and Social Assistance industry, at 29.7 percent, is significantly higher than the metro level at 23.7
percent. About 5,955 workers (11.2 percent) in the study area work in the Manufacturing sector compared to 16.7 percent in the metro area. This indicates that although the area has a significant number of manufacturing jobs, most manufacturing workers employed in the Riverworks study area likely live elsewhere.
25
26
Table 14: Workforce Distribution in Riverworks Study Area and Metro Milwaukee, 2010
Industry Study Area Milwaukee Metro Area
Number Percent Number Percent
Total Population Over Age 16 53,196 100.0 751,779 100.0
Agriculture 232 0.4 5,171 0.7
Construction 1,371 2.6 35,813 4.8
Manufacturing 5,955 11.2 125,872 16.7
Wholesale Trade 1,177 2.2 25,487 3.4
Retail Trade 5,744 10.8 82,371 11.0
Transportation, Warehousing, and Utilities 1,699 3.2 32,081 4.3
Information 1,330 2.5 16,529 2.2
Finance, Insurance, Real Estate, Leasing 4,372 8.2 57,947 7.7
Professional Services 5,512 10.4 76,323 10.2
Education and Social Assistance 15,779 29.7 178,316 23.7
Arts, Entertainment, and Accommodations 6,247 11.7 60,195 8.0
Other Not Including Public Administration 2,460 4.6 32,065 4.3
Public Administration 1,318 2.5 23,609 3.1
Source: 2010 American Community Survey, 5 Year Estimates. Commuting Patterns
Table 15 shows a comparison of transportation modes to work for residents within the study area in comparison to those in the City of Milwaukee, Milwaukee County, and the Metro Area. This comparison indicates that a greater percentage of residents in the study area are using alternative modes to driving alone. The study area is well served by transit and this is reflected in a higher percentage of commuters that travel by bus (the only public transit system in Milwaukee County). Additionally, a greater percent of residents walk to work, or ride bicycles, motorcycles, or take taxis than elsewhere.
Also, a slightly greater percentage of residents work from home than throughout the Metro Area. Table 15: Means of Transportation to Work, 2010
Transportation Mode Study Area City of Milwaukee
Milwaukee County
Metro Area
Drove Alone 67.3 70.9 76.0 80.0
Carpooled 9.1 12.4 11.0 9.3
Public Transit 10.4 8.4 5.7 3.6
Walked 6.6 4.6 3.4 2.7
Taxi, Motorcycle or Bicycle 3.1 1.5 1.5 1.3
Worked At Home 3.5 2.2 2.4 3.2
Source: 2010 American Community Survey, 5 Year Estimates. Median commute time for people living in the study area as well as in the City of Milwaukee, Milwaukee County, and the Metro Area was between 20 to 24 minutes. This indicates that even though
residents in the study area are employing alternative modes to commute, they are likely to live closer to their work than their counterparts.
Market Profile
Household Income
Table 16 shows a comparison of household incomes between the Riverworks study area, the City of Milwaukee, Milwaukee County, and the four county Metro Milwaukee area in 2000 and 2010. In 2010, the median household income for the Riverworks study area was $40,693 while the per capita income was $22,731. Based on the data, median household incomes grew by about 2.5 percent annually
27
between 2000 and 2010 for households in the Riverworks area. This was a higher income growth rate
than at the City, the County, or even the Metro Area levels and indicates that the Riverworks study area performed very well in comparison.
It should be noted, however, that when adjusted for inflation, median household incomes since 2000 have remained very flat at all levels of geography; for example, the year 2000 median income for the Riverworks study area adjusted for inflation to 2010 is $40,258. Table 16: Median Household Income and Compound Annual Growth Rate (CAGR)
Area 2000 2010
Income Income CAGR (2000-2010)
Riverworks Study Area $31,792 $40,693 2.5%
City of Milwaukee 32,216 34,944 0.8%
Milwaukee County 38,100 42,134 1.0%
Metro Milwaukee 45,901 53,043 1.5%
Source: US Census Bureau and ESRI Business Analyst. Table 17 shows changes in income distribution by income range for households within the Riverworks
study area. In 2010, about 33.6 percent or a third of the Riverworks study area households earned between $35,000 and $75,000 per year, or were solidly middle class, and about 22.9 percent earned over $75,000 per year. About 43.5 percent of households earned less than $35,000, and many of these households earned significantly less than $35,000 per year. In 2000 and 2010, the greatest percentage of households earned under $15,000 per year (23.8 and 19.4 percent, respectively); this trend appears to be declining as this declined to 19.4 percent in
2010, and it is projected that by 2015, only 16.0 percent of households will earn less than $15,000 per year. Although seemingly good news, the impact of inflation negates any declines in the number of households earning less than $15,000 per year. Additionally, the 2009 federal poverty threshold7 is defined as a household with at least 2 people earning less than $14,570 per year. This indicates that there is still a significant percentage of households (about 19.4 percent) within the Riverworks study area living below the poverty level. Although there are likely many family households living in poverty
within the study area, there are also likely many non-family households (students) that are also below
the threshold. Table 17: Households Income Distribution
Income Range 2000 2010
Number Percent Number Percent
<$15,000 10,061 23.8 8,223 19.4
$15,000-24,999 6,835 16.2 5,293 12.5
$25,000-34,999 6,058 14.3 4,958 11.7
$35,000-49,999 6,488 15.4 6,822 16.1
$50,000-74,999 5,814 13.8 7,436 17.5
$75,000-99,999 2,983 7.1 4,926 11.6
$100,000-149,999 2,325 5.5 2,861 6.7
$150,000-199,999 674 1.6 856 2.0
$200,000+ 1,009 2.4 1,075 2.5
<$35,000 22,954 54.3 18,474 43.5
$35,000-$75,000 12,302 29.1 14,258 33.6
>$75,000 6,991 16.5 9,718 22.9
TOTAL Households 42,247 100.0 42,450 100.0
Source: US Census Bureau and ESRI Business Analyst.
7 2009 Poverty Guidelines from the US Department of Health and Human Services
28
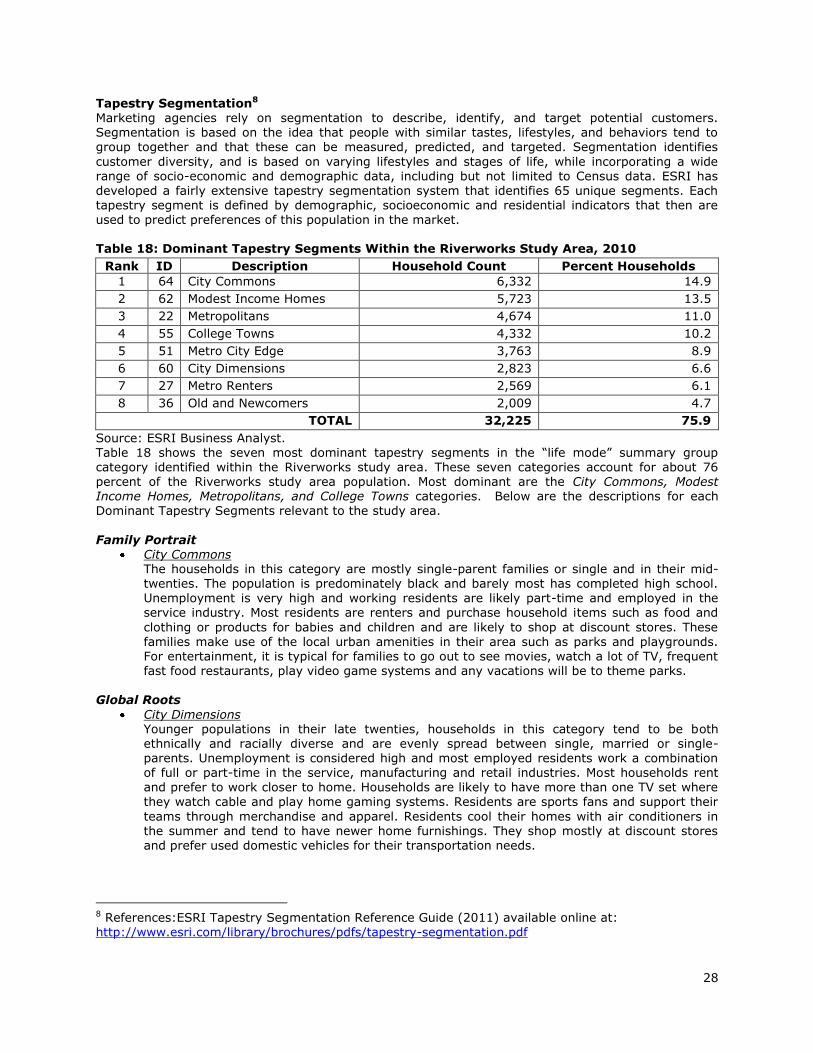
Tapestry Segmentation8
Marketing agencies rely on segmentation to describe, identify, and target potential customers. Segmentation is based on the idea that people with similar tastes, lifestyles, and behaviors tend to group together and that these can be measured, predicted, and targeted. Segmentation identifies
customer diversity, and is based on varying lifestyles and stages of life, while incorporating a wide range of socio-economic and demographic data, including but not limited to Census data. ESRI has developed a fairly extensive tapestry segmentation system that identifies 65 unique segments. Each tapestry segment is defined by demographic, socioeconomic and residential indicators that then are used to predict preferences of this population in the market. Table 18: Dominant Tapestry Segments Within the Riverworks Study Area, 2010
Rank ID Description Household Count Percent Households
1 64 City Commons 6,332 14.9
2 62 Modest Income Homes 5,723 13.5
3 22 Metropolitans 4,674 11.0
4 55 College Towns 4,332 10.2
5 51 Metro City Edge 3,763 8.9
6 60 City Dimensions 2,823 6.6
7 27 Metro Renters 2,569 6.1
8 36 Old and Newcomers 2,009 4.7
TOTAL 32,225 75.9
Source: ESRI Business Analyst. Table 18 shows the seven most dominant tapestry segments in the “life mode” summary group category identified within the Riverworks study area. These seven categories account for about 76 percent of the Riverworks study area population. Most dominant are the City Commons, Modest Income Homes, Metropolitans, and College Towns categories. Below are the descriptions for each Dominant Tapestry Segments relevant to the study area.
Family Portrait
City Commons The households in this category are mostly single-parent families or single and in their mid-
twenties. The population is predominately black and barely most has completed high school. Unemployment is very high and working residents are likely part-time and employed in the service industry. Most residents are renters and purchase household items such as food and
clothing or products for babies and children and are likely to shop at discount stores. These families make use of the local urban amenities in their area such as parks and playgrounds. For entertainment, it is typical for families to go out to see movies, watch a lot of TV, frequent fast food restaurants, play video game systems and any vacations will be to theme parks.
Global Roots
City Dimensions Younger populations in their late twenties, households in this category tend to be both ethnically and racially diverse and are evenly spread between single, married or single-parents. Unemployment is considered high and most employed residents work a combination of full or part-time in the service, manufacturing and retail industries. Most households rent and prefer to work closer to home. Households are likely to have more than one TV set where
they watch cable and play home gaming systems. Residents are sports fans and support their
teams through merchandise and apparel. Residents cool their homes with air conditioners in the summer and tend to have newer home furnishings. They shop mostly at discount stores and prefer used domestic vehicles for their transportation needs.
8 References:ESRI Tapestry Segmentation Reference Guide (2011) available online at: http://www.esri.com/library/brochures/pdfs/tapestry-segmentation.pdf

29
High Hopes
Great Expectations Residents are mostly young and single or young married-couple families at the start of their careers. Many have experience in education beyond high school and a majority of those in the
work force are employed in manufacturing, retail and the service sectors. Half own their own homes and half rent with most of the housing stock dedicated to single family use. Homeowners are likely to take on improvement remodeling projects and in general are active in recreational sports and outdoors activities. They eat out, shop at major chain grocery stores and go see movies. They receive information and entertainment from the radio, movies and TV news.
Metropolis Modest Income Homes
A high proportion of these residents are black and either single-person or single-parent households. Most adults are in their mid- to late thirties and it is not uncommon to have adult children still living with their elderly parents. Over a quarter of the population is retired and relying on Social Security benefits for income support. The unemployment rate is considered
high and residents who are employed are likely to work part-time in service and blue-collar occupations. Most of the housing stock is single-family dwellings and half of households are owners. Residents in this area watch a lot of daytime and prime time TV. They are unlikely to have home access to the internet and save money by shopping at discount stores and keep their optional costs low. Most drive used domestic sedans.
Solo Acts
Old and Newcomers Made up of a fairly even split of those in their twenties at the start of their careers and those above age 75 closer to retiring, most in this area are white and single. The unemployment rate is similar to that on a national scale and residents are likely to be well educated beyond high school. A majority of residents rent and many have moved within the last five years. Without large families, these households tend to spend less on food and typically have smaller vehicles to suit their needs. They take vacations out of town and have diverse entertainment
interests that cross several types of media such as news print, film, TV, radio and literature.
Young and Restless Residents in this category are in their late twenties and live busy active lifestyles easily as most are single or shared households without children. The area is ethically and racial diverse and individuals are career oriented so most are employed and in professional, sales, service or
administrative positions. They are likely renters in multiunit apartment buildings and will move for employment opportunities. This population is well educated and is technologically savvy. They go online to communicate or shop and conduct business. They are current with popular cultural trends and listen to the radio more than then watch TV. Even with busy schedules, they seek entertainment at bars and nightclubs and pay attention to staying in shape.
Metropolis
Metro City Edge Households are married couples, single parents and multigenerational families with many grandparents living with their adult children and providing childcare. Most people are black but white and American Indians are represented as well. Despite unemployment being high (twice
the national level), a majority work and are employed in the service sector and many have more than a high school education. Half the population owns their homes and several who rent choose to do so even with home prices at affordable levels. Residents spend conservatively on
household items and might be patrons at superstores and wholesalers. Scholars & Patriots
College Towns Most residents are young and single living in shared households. They are likely enrolled in high education institutions and many only work part-time and in the service industry.
Residents shop based on convenience and price although have a preference for brand name fashion and mainstream entertainment such as sports, music and bars. They are active in
30
recreational activities and are extremely technically savvy, dependent on the internet and
computers for school, work, communication and online banking. They receive information through public radio and popular culture TV.
The tapestry segmentation report reiterates that the area is an eclectic collection of diverse, urban neighborhoods. It also supports the assumption that the University of Wisconsin-Milwaukee has a significant mpact on the socio-economic and demographic make-up of the Riverworks study area. Although it is somewhat geared towards a younger generation (20 and 30-somethings), the area contains a very wide variety of housing choices for a variety of lifestyles and ages, and is both student and family friendly. Its proximity to downtown Milwaukee and the lakeshore also make it a very attractive place to live.
Retail Market Spending and Leakage Analysis A retail leakage analysis, also known as a gap analysis, measures the target area’s retail capacity or
supply with the demand of the local consumers. It is a method to understanding the strengths and weaknesses of the local retail sector and can indicate how well the local retail needs of the study area
residents are being met. It assesses the strengths and weaknesses in the local retail area and uncovers potential demand and opportunities for additional retail. For this analysis, ESRI BA estimates the amount of all households annual budget spent on a variety of household goods and services and applies that information to retail spending data within the target area, in this case, the Riverworks study area.
Table 19 shows the estimated annual budget for a typical household within the study area, showing the amount and percentages spent on goods and services, along with the total amount (in millions) estimated to be spent within the study area. This table shows the anticipated demand of a product or service within the study area. Table 20 shows the results of the leakage analysis, including the number of businesses providing the
product, supply of the product (amount in sales based on three- and four-digit NAICs codes), the demand for the product (expected amount that would be spent on the product), the gap or difference between supply and demand, and the leakage surplus factor. The leakage/surplus factor is a measure
of the difference between supply and demand. In this case, the supply (actual retail sales of a product or service) is measured against anticipated demand or spending by the households. Leakage in an area indicates that the supply in the area is less than the demand, and therefore that demand is being
satisfied by retailers located outside of the area (demand is leaking out). Surplus in an area indicates that the supply of a good or service is exceeding the area’s demand and therefore is likely attracting shoppers that reside outside the area. A positive leakage/surplus factor indicates a demand in the good or service, and the higher the factor, the greater the leakage. A negative leakage/surplus factor indicates that the supply is exceeding local demand but is attracting consumers from outside the study area. To note, although this study focuses on the Capitol Drive corridor, the leakage analysis takes into account all retail supply and demand data from within the entire Riverworks study area.
Although this method can provide insightful into the potential retail that could be attracted to an area, other factors need to be taken into consideration including the physical aspects of development, demographics, and the character or context of the development. Certain types of retail development have specific development and design requirements, such as big box retail or grocery stores generally require large, accessible, and highly visible parcels. Car dealerships have a tendency to locate in
suburban or exurban areas due to the lower costs associated with development, but also to develop in
clusters for the agglomeration factor. Conversely, certain small format retail development may be more appropriate in strip malls or in areas where other small format retail are concentrated or where similar uses are agglomerated. The character of the development should also be taken into consideration along with its proximity to other nearby retail areas. For example, the Capitol Drive corridor is an auto-oriented retail area; big
box stores, shopping centers, and drive-thru fast food places (Limited Service Eating Places) are appropriate for the corridor. Small format national chains can work well within some of the shopping centers while large format national big box retail also has a place. Its proximity to nearby Bayshore

31
Mall in Glendale, a major regional mall with a wide variety of stores, needs be taken into
consideration. Table 19: 2011 Average Household Budget Expenditures in the Riverworks Study Area
Description Spending Index
Average Amount Spent
Total (in Millions)
Percent
Total Expenditures 78 $52,676 $2,236.3 100.0
Food 83 6,374 270.6 12.1
Food At Home 83 3,701 157.1 7.0
Food Away From Home 83 2,673 113.5 5.1
Alcohol 88 504 21.4 1.0
Housing 81 16,409 696.6 31.2
Shelter 80 12,670 537.9 24.1
Utilities 83 3,741 158.8 7.1
Household Operations 74 1,162 49.3 2.2
Housekeeping Supplies 80 563 23.9 1.1
Household Furnishings/Equip 67 1,387 58.9 2.6
Apparel and Services 59 1,402 59.5 2.7
Transportation 80 8,003 339.7 15.2
Travel 73 1,379 58.5 2.6
Health Care 77 2,866 121.2 5.4
Entertainment/Recreation 78 2,531 107.4 4.8
Personal Care 80 561 23.8 1.1
Education 87 1,063 45.1 2.0
Smoking Products 95 406 17.2 0.8
Miscellaneous 77 899 38.2 1.7
Support Payments/Gifts 77 1,888 80.2 3.6
Life/Other Insurance 71 298 12.6 0.6
Pensions/Social Security 76 4,991 211.9 9.5
Source: ESRI Business Analyst
Demographics and shopping behaviors also need to be taken into account when determining
appropriate types of retail for the local clientele. For example, a younger, more mobile clientele may be able to support a greater number of restaurants, taverns, clothing stores, or coffee houses even if the leakage analysis indicates a saturation of those markets. As a whole, this area has a very broad mix of people, households, ages, income levels, and families. The Capitol Drive corridor has the ability to attract major national retail chains but it must also be sensitive to needs that may be met by the
larger Bayshore Shopping Center. Additionally, it is important to have a good understanding of the greater retail market as a whole and to be able to identify potential needs that are not being met within the larger community. Retail Leakage Analysis Results: SB Friedman also analyzed retail leakage for the entire Northeast Side Planning area in their 2008 report for DCD. The results of this leakage analysis are, not surprisingly, very similar to the findings of
the leakage analysis in the SB Friedman report. In the 2008 study, SB Friedman identified leakage from the following retail categories: Auto Dealerships, Furniture Stores, Gas Stations, Apparel Clothing Stores, General Merchandise Stores, and Full Service Restaurants. Based on the results and an
assessment of appropriate uses, SB Friedman recommended the following retail opportunities for the auto-oriented Capitol Drive corridor:
General Merchandise Stores (Target) Electronics and Appliance Stores (Best Buy) Discount Apparel and Accessories department stores (TJ Maxx) Home Furnishings Stores (Bed Bath and Beyond, Linens ‘N Things) Hobby and Craft Stores (Michaels) Furniture Stores

32
Table 20: 2011 Retail Market Spending and Leakage Analysis, Riverworks Study Area
Industry Demand Supply Leakage Leakage/ Surplus Factor
Businesses
Total Retail Trade $738,703,892 $512,183,127 $226,520,765 18.1 501
Total Food and Drink 134,262,074 137,773,861 -3,511,788 -1.3 259
Motor Vehicle and Part Dealers 168,634,814 28,376,580 140,258,233 71.2 20
Auto Dealers 147,708,207 19,788,981 127,919,226 76.4 7
Other Motor Vehicle Dealers 9,814,326 819,869 8,994,457 84.6 2
Auto Parts, Accessories, Tire Stores 11,112,280 7,767,730 3,344,550 17.7 11
Furniture & Home Furnishing Stores 24,607,104 9,664,841 14,942,263 43.6 12
Furniture Stores 18,304,866 7,579,510 10,725,356 41.4 7
Home Furnishings Stores 6,302,238 2,085,331 4,216,907 50.3 5
Electronics & Appliance Stores 18,336,921 7,942,887 10,394,034 39.6 22
Bldg Materials, Garden Equipment Stores 26,811,851 17,287,227 9,524,624 21.6 21
Bldg Material and Supplies Dealers 23,985,613 16,545,417 7,440,196 18.4 19
Lawn & Garden Equip/Supply Stores 2,826,238 741,810 2,084,428 58.4 2
Food and Beverage Stores 141,007,548 138,351,471 2,656,077 1.0 112
Grocery Stores 130,314,706 125,039,839 5,274,867 2.1 70
Specialty Food Stores 3,689,282 6,385,193 -2,695,911 -26.8 19
Beer, Wine, Liquor Stores 7,003,560 6,926,439 77,121 0.6 23
Health and Personal Care Stores 23,354,204 33,749,725 -10,395,522 -18.2 49
Gas Stations 123,103,683 79,772,950 43,330,734 21.4 33
Clothing and Clothing Accessory Stores 34,310,725 44,507,227 -10,196,501 -12.9 105
Clothing Stores 27,416,707 36,524,123 -9,107,417 -14.2 76
Shoe Stores 3,746,242 4,617,388 -871,146 -10.4 17
Jewelry, Luggage, Leather Goods 3,147,777 3,365,715 -217,938 -3.3 12
Sporting Goods, Hobby, Books and Music 9,619,792 23,018,540 -13,398,747 -41.1 35
Sporting Goods, Hobby 4,151,880 4,305,336 -153,456 -1.8 21
Book, Periodical, Music Stores 5,467,913 18,713,204 -13,245,291 -54.8 14
General Merchandise Stores 113,673,409 106,561,501 7,111,908 3.2 18
Dept Stores Excluding Leased Depts 41,836,667 38,530,396 3,306,270 4.1 6
Other General Merchandise Stores 71,836,742 68,031,104 3,805,638 2.7 12
Miscellaneous Store Retailers 12,120,189 9,740,664 2,379,525 10.9 67
Florists 802,771 598,336 204,435 14.6 14
Office Supplies, Stationary, Gifts 2,810,913 5,151,669 -2,340,756 -29.4 14
Used Merchandise Stores 1,119,733 825,666 294,067 15.1 16
Other Miscellaneous Store Retailers 7,386,772 3,164,993 4,221,779 40.0 24
Nonstore Retailers 43,123,652 13,209,515 29,914,137 53.1 6
Electronic Shopping and Mail-Order 35,601,920 1,552,183 34,049,737 91.6 1
Vending Machine Operators 1,597,114 5,053,334 -3,456,230 -52.0 1
Direct Selling Establishments 5,924,617 6,603,987 -679,370 -5.4 3
Food Services and Drinking Places 134,262,074 137,773,861 -3,511,788 -1.3 259
Full-Service Restaurants 48,374,354 52,610,697 -4,236,343 -4.2 99
Limited Service Eating Places 63,490,373 64,019,306 -528,933 -0.4 65
Special Food Services 13,266,703 3,394,943 9,871,760 59.2 7
Drinking Places – Alcoholic Beverages
9,130,644 17,748,915 -8,618,271 -32.1 88
Source: ESRI Business Analyst
Although most of these stores would likely succeed in the Capitol Drive corridor, the Great Recession
has had a significantly negative impact on Electronics and Appliance Stores. As the largest electronics store in the US, Best Buy is undergoing a major downsizing and their large store formats are being replaced by more compact shops or mobile-only stores. Although the likelihood of attracting a large format version of Best Buy is virtually nil, their newer small scale models would likely be appropriate for the Capitol Drive corridor. Another store recommended by SB Friedman in 2008 was Linens N Things, but that also has undergone a major downsizing and therefore might not be suitable. The
other stores (TJMaxx, Bed Bath and Beyond, and Michaels) have weathered the recession and are currently expanding.

33
Table 20 shows the results of the 2011 market spending and leakage within the area; retail categories
that are exhibiting a Leakage/Surplus factor of 20 or greater are highlighted in red. The categories that exhibit the highest levels of leakage and therefore indicate the greatest unmet demand within the study area include the following: Auto and Motor Vehicle Dealerships, Auto Parts and Accessories
stores, Furniture and Furnishing Stores, Electronic and Appliance Stores, Building Materials and Lawn and Garden stores, Gas Stations, Miscellaneous Store Retailers (this category includes niche retail such as pet supply stores, florists), Nonstore Retailers (this category includes Electronic Shopping and Mail Order, Vending Machine Operators, Direct Selling establishments), and Special Food Services (this category includes caterers and food cart vendors). The results indicate that the demand for goods and services that generally demand large scale or big
box retailers is highest (Auto Dealers, Furniture Stores, Electronics and Appliance Stores, and Building Materials/Lawn and Garden Stores). This is not surprising given that there are very few big box retailers within the study area. Auto Dealers are an unlikely category to locate within the Capitol Drive corridor given their tendency to co-locate or agglomerate. Current market trends must also be taken into consideration, particularly when looking at the demand
for Building Materials/Garden Equipment stores and Electronics/Appliance Stores. Given the presence of the Home Depot within the area, along with the downsizing of similar home improvement chains (Lowe’s), this would need further analysis to determine whether or not any similar retailer would be able to capture the demand. Although the analysis indicates a strong demand for Electronics and Appliance Stores, this category of stores has been significantly impacted by both the Recession and the proliferation of online electronic stores (Amazon, Newegg) and discount dealers (Costco, Sam’s Club). Electronics in particular is moving away from bricks and mortar to the internet.
Interestingly, the Nonstore Retailer category listed as Electronic Shopping and Mail Order indicated a very high demand leakage/surplus factor. The non-commercial areas of the BIDs could likely support Electronic Shopping and Mail Order businesses; these would likely be compatible with the industrial uses. More importantly, this also indicates that about 4.8 percent of the total retail trade is being spent on goods and services purchased through mail order or online.
Based on the 2011 retail leakage analysis and current market trends, the following store categories and national chains are recommended as potential retail opportunities for the Capitol Drive corridor:
General Merchandise Stores (Target) Discount Apparel and Accessories department stores (TJ Maxx, Marshalls, Burlington Coat
Factory)
Home Furnishings Stores (Bed Bath and Beyond, HomeGoods) Furniture Stores (Ashley Furniture) Specialty Stores geared towards children or babies (Toys ‘R Us, Babies ‘R Us, Buy Buy Baby,
Learning Shoppe) Full Service Restaurants – national chains or local (Red Robin, Cici’s) Limited Service Restaurants – national chains or local (Starbucks, Caribou Coffee, any fast
food chain)
Larger format discount clothing stores such as TJ Maxx, Marshalls, or Burlington Coat Factory are greatly needed in the study area and work well in contrast to smaller format national chain clothing stores at Bayshore Mall and with the specialty boutiques located throughout Shorewood and the
Eastside. Currently, due in part to the Recession, TJ Maxx has seen tremendous growth and the demand for discount clothing has risen. Both TJ Maxx and Marshall’s are part of TJX Companies, that also operates CW Price stores.
Large format furnishing and furniture stores would likely do very well within the corridor. Its proximity to UWM and the younger demographics indicate a greater demand for furniture and furnishings, and it would likely favor discount furniture such as an Ashley Furniture Store. There is also significant demand for furnishing stores like Bed Bath and Beyond in the area. Within the Metro Milwaukee region, these types of big box stores are generally located in the fringe suburbs. Additionally, big box
specialty stores that cater to children or babies, such as Toys/Babies ‘R Us and Buy Buy Baby are also
34
missing from both the study area, and from the great spending potential of Milwaukee’s Northshore
communities. SB Friedman recommended Hobby and craft stores (Michaels); although the 2011 leakage analysis did
not indicate a demand in this category, a Michaels store in the corridor could likely do well and further analysis should be considered. Although full and limited service restaurants are in supply, there are very few national chains represented throughout the study area. The Capitol Drive corridor has the capacity to include additional limited service restaurants as outlots as well as provide space for full service restaurants. Recommended chains include Cici’s (a pizza buffet), or Red Robin (gourmet burgers); further analysis
would be needed that would include an assessment of restaurants located at Bayshore Mall. Conclusions Commercial Opportunities
BID 25: Based on the current mix of national and local chain stores, commercial development along the Capitol Drive corridor can be marketed to attract a variety of additional national chains and franchises. Given the auto-oriented nature of the corridor, shopping centers as well as big box retail are appropriate for the scale of development. The retail leakage analysis indicates a dearth of home furnishings and furniture stores, and agglomerating large format general merchandise or clothing stores would strengthen the commercial appeal of the area. The existence of various shopping centers with a variety of chains, both local and national should continue to thrive. Additionally, there could be
further opportunities to expand redevelopment within the Capitol Drive corridor, namely the Bentley World Packaging plant as well as the area between 2nd Avenue and Palmer Street. The two blocks between 2nd Avenue and Palmer Street contain a mix of uses, including residential, industrial and commercial; redevelopment of unused or underutilized industrial or industrial mixed-use properties along Capitol Drive, particularly between 2nd and Palmer Streets on Capitol Drive as well as elsewhere within the corridor, would provide a more cohesive and attractive commercial mix. BID 36: Future redevelopment along the Beerline Trail could benefit by additional commercial and
retail development where appropriate in BID 36, where smaller parcels are more predominant. Delineating boundaries for commercial and industrial uses along the Beerline Trail will ensure that the
existing manufacturing businesses will continue to thrive and allow potential industrial businesses to view Riverworks as a viable industrial area.
Industrial
Opportunities The Riverwest industrial area represents one of the few remaining larger intact, contiguous areas for industrial lands within the City of Milwaukee. Its proximity to the Estabrook Corporate Park in the City of Glendale, to Interstate 43, and to the City of Milwaukee’s Central Business District are key strengths for the area. It is well served by transit and in close proximity to Milwaukee’s most densely populated neighborhoods and educated workforce.
However, and as SB Friedman report pointed out, there are numerous drawbacks to attracting new industrial businesses to Riverworks. It is an older industrial development with older construction, indicating a certain degree of functional obsolescence. Many of the lots are small, and some are long, narrow lots, not very conducive to most newer industrial developments which may require larger
setbacks. The parcel configurations vary widely; among the 196 industrially zoned parcels, 96 parcels (49 percent) are less than 1/4 acre in size and are interspersed amongst the larger and newer industrial parcels.
Also, uses within the BIDs do vary and as the City of Milwaukee Department of City Development pointed out, there is a great need to delineate between commercial and industrial uses throughout both BIDs so as not to send mixed messages to developers and business owners. Industrial businesses are not going to locate within either BID if they believe there is a chance of being pushed out due to retail development. Conversely, retail development is likely to be more attracted to other
commercial or retail development and not industrial. Additionally, there is a great need to minimize the impact that existing residential uses have within the BIDs. When given the opportunity, it would

35
be advantageous for the BIDs to acquisition the small single family or duplex residential parcels and
discourage additional residential uses within the industrial portions of the BIDs. As the SB Friedman study also pointed out, one of the drawbacks to attracting industrial businesses is
the lack of a cohesive street grid within BID 25, particularly throughout the western portions of the BID. Access, particularly semi-trailer access, to numerous properties is inhibited, particularly for properties along the former railroad line. As this is currently undergoing conversion to a pedestrian and bicycle trail, consideration should be given to reconfiguring street access as part of the Beerline Trail development.
* * *