appendix a. summary of statewide energy system modeling
TRANSCRIPT

242
SAN DIEGO REGIONAL DECARBONIZATION FRAMEWORK - DRAFT – NOT FOR CITATION
Appendix A. Summary of Statewide Energy System
Modeling
As noted in the Study Framework chapter, the detailed sectoral analysis presented in the RDF
was informed by energy system modeling at the state and national level. This work was done by
Evolved Energy Research using the modeling tools EnergyPATHWAYS and RIO presented in
Williams et al. (2021).1 These same modeling tools were also used in the Princeton Net-Zero
America study,2 SDSN’s Zero Carbon Action Plan,3 and the Decarb America Initiative.4 Unlike in
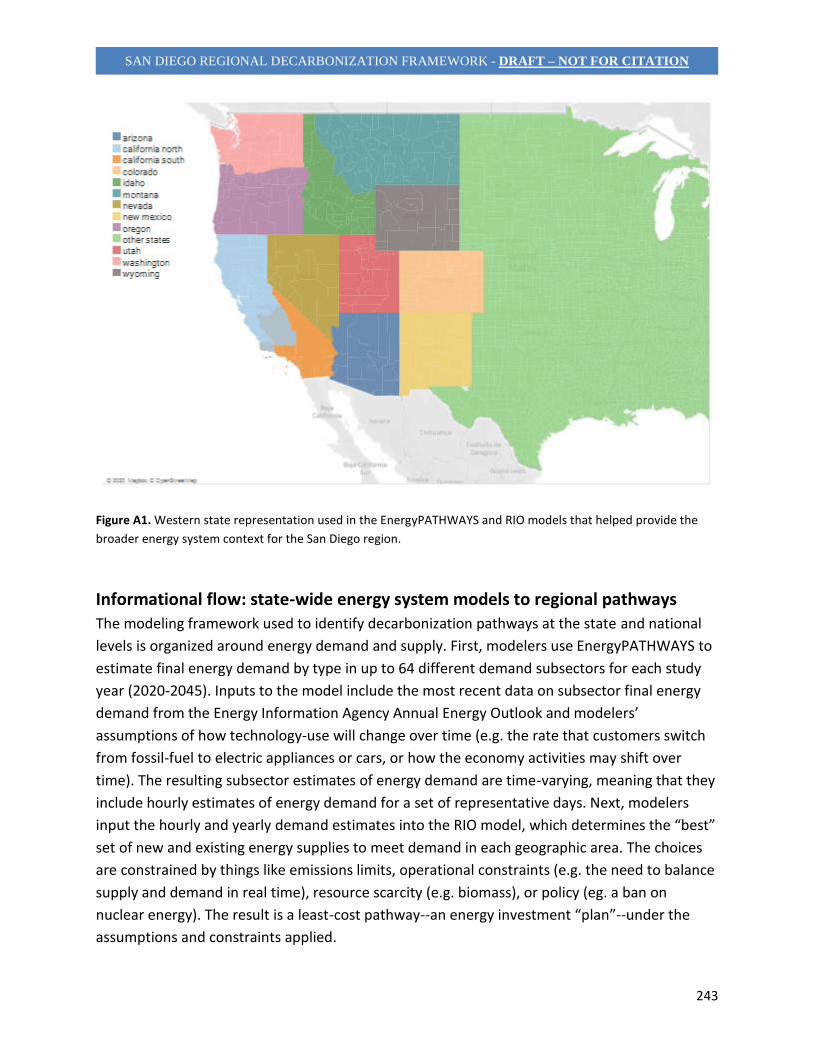
these national studies, the state-level analysis includes two zones for California (north and
south), zones for each of the other ten western states, and a final “other states” zone that
helped to set the boundary conditions for the west around variables such as the availability of
imported biofuels. The zonal representation is shown graphically in Figure A1 and is the same
used for the analysis in Wu et al. (forthcoming).
The Study Approach also notes that the energy system modeling was not prescriptive when it
came to the RDF. Instead, it is meant to guide more detailed local-level analyses capturing the
specific circumstances of the San Diego region. The larger energy system context presented
here creates an important backdrop for the region and explicitly acknowledges the
interconnectedness of our energy and land systems. This appendix focuses on summary results
from the EnergyPATHWAYS and RIO modeling, along with the basic input assumptions. Readers
looking for a more detailed description of both the methods and the underlying system-level
dynamics outside of California should reference Williams et al. (2021).
243
SAN DIEGO REGIONAL DECARBONIZATION FRAMEWORK - DRAFT – NOT FOR CITATION
Figure A1. Western state representation used in the EnergyPATHWAYS and RIO models that helped provide the
broader energy system context for the San Diego region.
Informational flow: state-wide energy system models to regional pathways
The modeling framework used to identify decarbonization pathways at the state and national
levels is organized around energy demand and supply. First, modelers use EnergyPATHWAYS to
estimate final energy demand by type in up to 64 different demand subsectors for each study
year (2020-2045). Inputs to the model include the most recent data on subsector final energy
demand from the Energy Information Agency Annual Energy Outlook and modelers’
assumptions of how technology-use will change over time (e.g. the rate that customers switch
from fossil-fuel to electric appliances or cars, or how the economy activities may shift over
time). The resulting subsector estimates of energy demand are time-varying, meaning that they
include hourly estimates of energy demand for a set of representative days. Next, modelers
input the hourly and yearly demand estimates into the RIO model, which determines the “best”
set of new and existing energy supplies to meet demand in each geographic area. The choices
are constrained by things like emissions limits, operational constraints (e.g. the need to balance
supply and demand in real time), resource scarcity (e.g. biomass), or policy (eg. a ban on
nuclear energy). The result is a least-cost pathway--an energy investment “plan”--under the
assumptions and constraints applied.

244
SAN DIEGO REGIONAL DECARBONIZATION FRAMEWORK - DRAFT – NOT FOR CITATION
Past decarbonization models have found that reaching net-zero nationwide and in California by
2045 can be done at manageable cost. In their national-level model, Williams et al (2021)
estimate that net costs of decarbonization would fall between 0.4% and 0.9% of GDP,
depending on the scenario, compared to a historical range of total US spending on energy
between 5.5%-13% of GDP from 1970 to the present. The geographic distribution of these costs
are not modeled at a high resolution, and so we do not present total decarbonization costs for
the San Diego region in the RDF. However, it should be noted that higher costs in a particular
geographic region are not necessarily a negative, as they imply greater investment, growth in
local industry and employment, and new infrastructure.
These system-level decarbonization pathways provide a useful guide for the detailed, sector-
level pathways laid out in the remainder of the RDF. No individual pathway should be treated as
a plan because the underlying assumptions are too uncertain. However, by applying several
different sets of assumptions and constraints--scenarios--to generate several different least-
cost pathways, modelers get a sense of which types of energy supply investments are most
robust, or chosen as “best” in most circumstances. This gives policymakers a common general
direction, at least initially, helping to alleviate policy gridlock, prevent conflicting approaches,
and eliminate dead-end strategies.
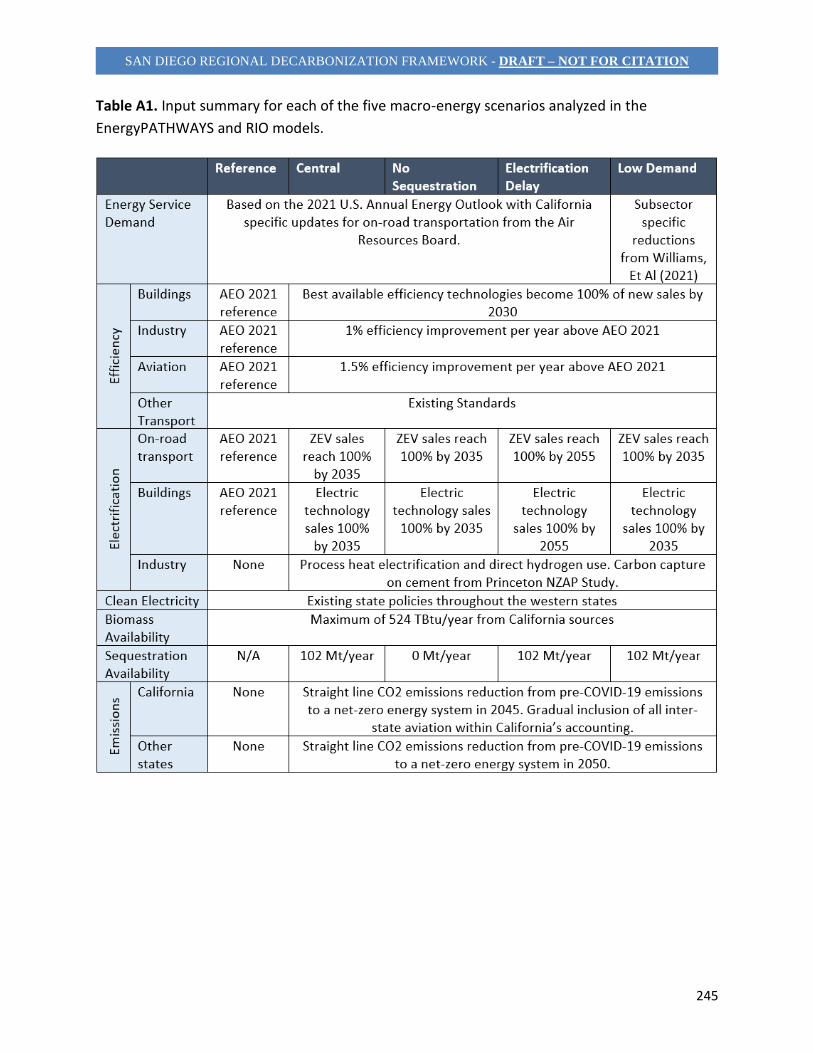
Scenario Descriptions
A set of five scenarios were modeled to help inform the RDF. First, a reference, or “baseline,”
scenario that does not enforce emissions constraints was run for comparison purposes. From
there, the other four scenarios explore sensitivity to different uncertainties in behavior, societal
preference, and technology development. These were chosen to reflect the broad debates
happening around climate policy and human behavior at the state level, and reflect a wide
range of plausible futures. The Central scenario meets reference energy service demand with
high demand-side uptake of electric, efficient technologies and with all energy-supply
technology options available. The Low Demand scenario uses assumptions from Williams et al.
(2021) to examine the implication of higher energy conservation on mitigating emissions from
the energy system. The Electrification Delay introduces a 20-year lag in the speed at which
customers adopt electric technologies. Finally, the No Sequestration scenario disallows geologic
storage of CO2 and subsequently emphasizes drop-in use of clean fuels, rather than continued
use of fossil fuels with captured carbon offsetting those emissions. This scenario reflects that,
while technical potential exists for geologic storage of carbon in California, political, regulatory,
and economic barriers may prevent this from becoming a reality. A summary of the inputs used
across each of the five scenarios is provided in Table A1.
245
SAN DIEGO REGIONAL DECARBONIZATION FRAMEWORK - DRAFT – NOT FOR CITATION
Table A1. Input summary for each of the five macro-energy scenarios analyzed in the
EnergyPATHWAYS and RIO models.

246
SAN DIEGO REGIONAL DECARBONIZATION FRAMEWORK - DRAFT – NOT FOR CITATION
Model Implications and Supplementary Results
Some relevant results from the EER state-level energy system modeling are shown below in
Figures A2-A10. Across the scenarios modeled, several broad themes emerge that inform the
detailed sector-level pathways for the San Diego region.
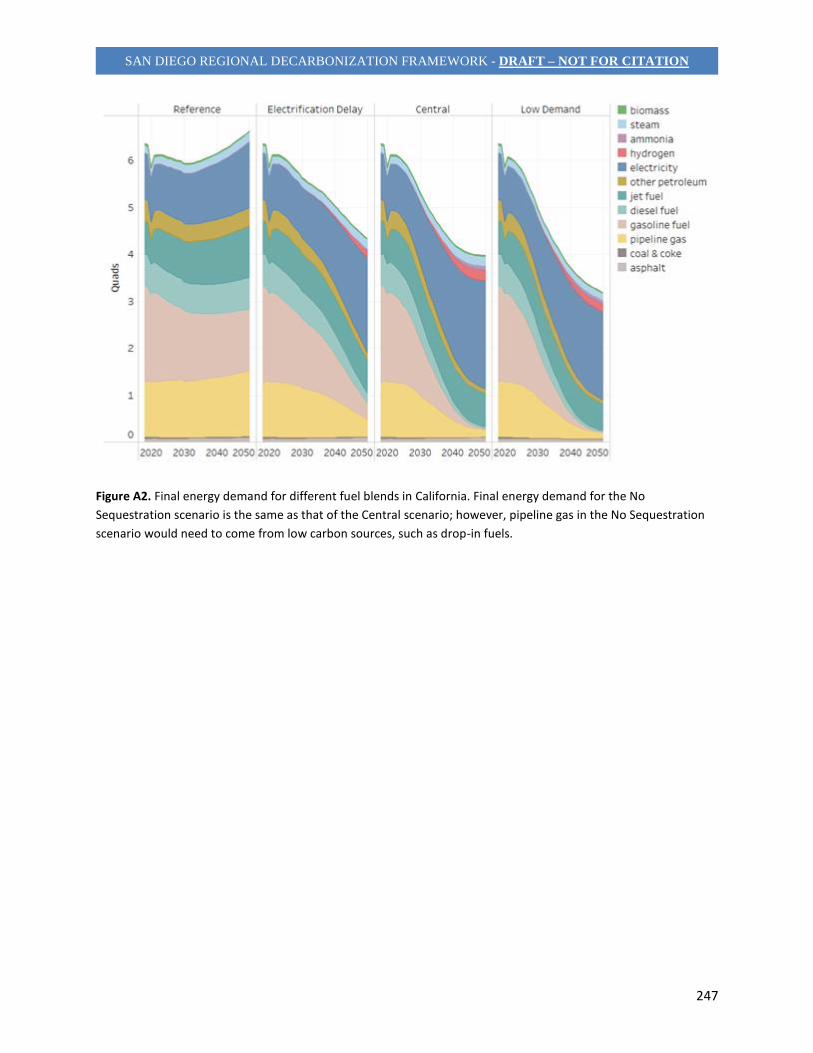
In all scenarios consistent with net zero emissions state-wide by 2045, energy end-uses must
rapidly electrify, implying dramatic reductions in the end-use of pipeline gas and gasoline fuel,
relative to the reference scenario (Figure A2). This means that, even with uncertainty around
the overall rate and extent of electrification, reaching net-zero emissions will require that
nearly all light duty vehicles and many medium and heavy duty vehicles be electric by 2045
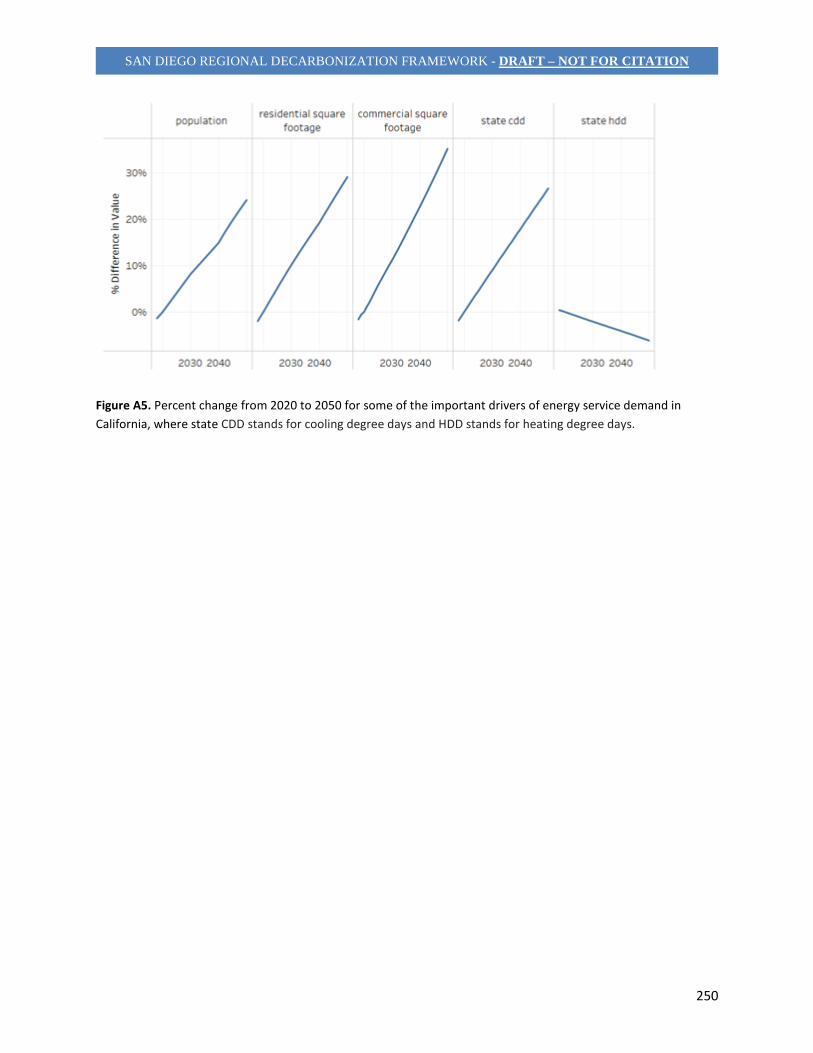
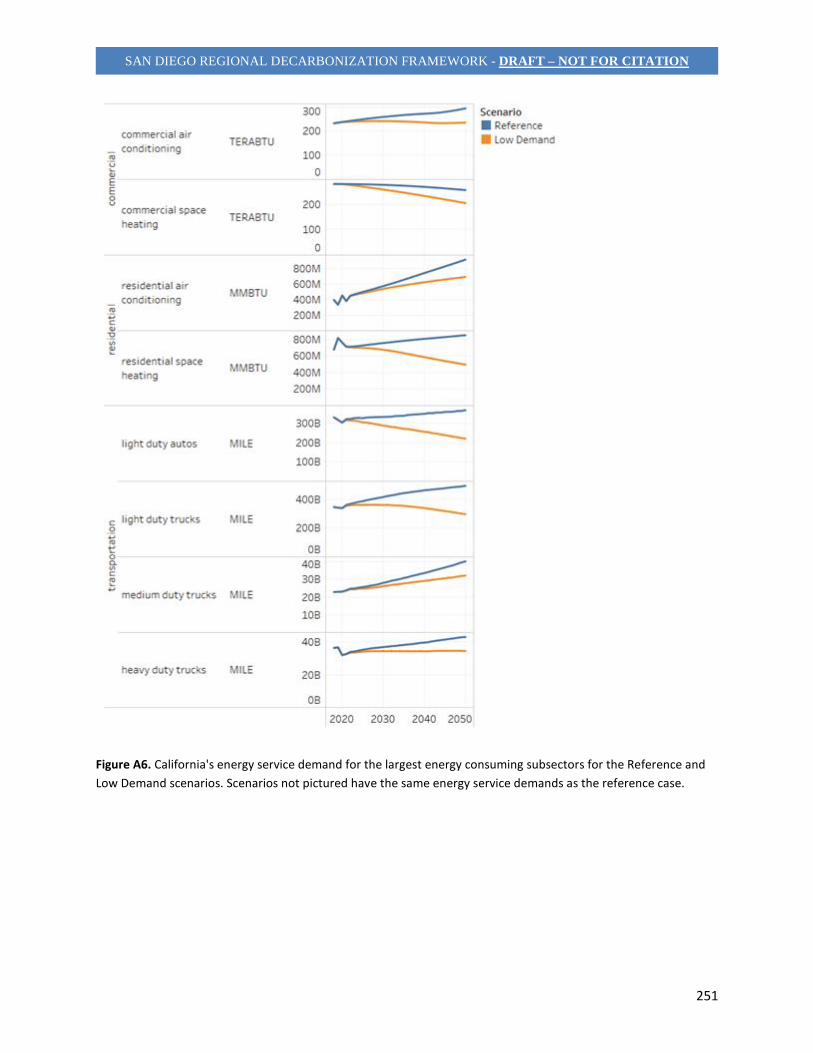
(Figure A7). Likewise, demand for heating and cooling in the built environment, mostly
expected to increase (Figure A6) as new buildings are constructed and temperatures rise
(Figure A5), must be met increasingly by electric devices.
The need for massive electrification drives the regional analyses of the transport and buildings
sectors. In transport, the RDF pathways outlines a need for significant efforts across
jurisdictions to rapidly increase EV adoption and the buildout of charging infrastructure. In
buildings, the RDF pathway emphasizes efforts to incentivize adoption of efficient heat pump-
based space and water heating systems in both new and existing buildings, with particular focus
on assistance for low-income residents and rental buildings.
Simultaneously, the electric sector itself must decarbonize, which in California means massive
increases in solar generation capacity and less in wind (Figure A3). This finding drives the
regional energy production pathway analysis, which identifies substantial opportunity for solar
development throughout the region.
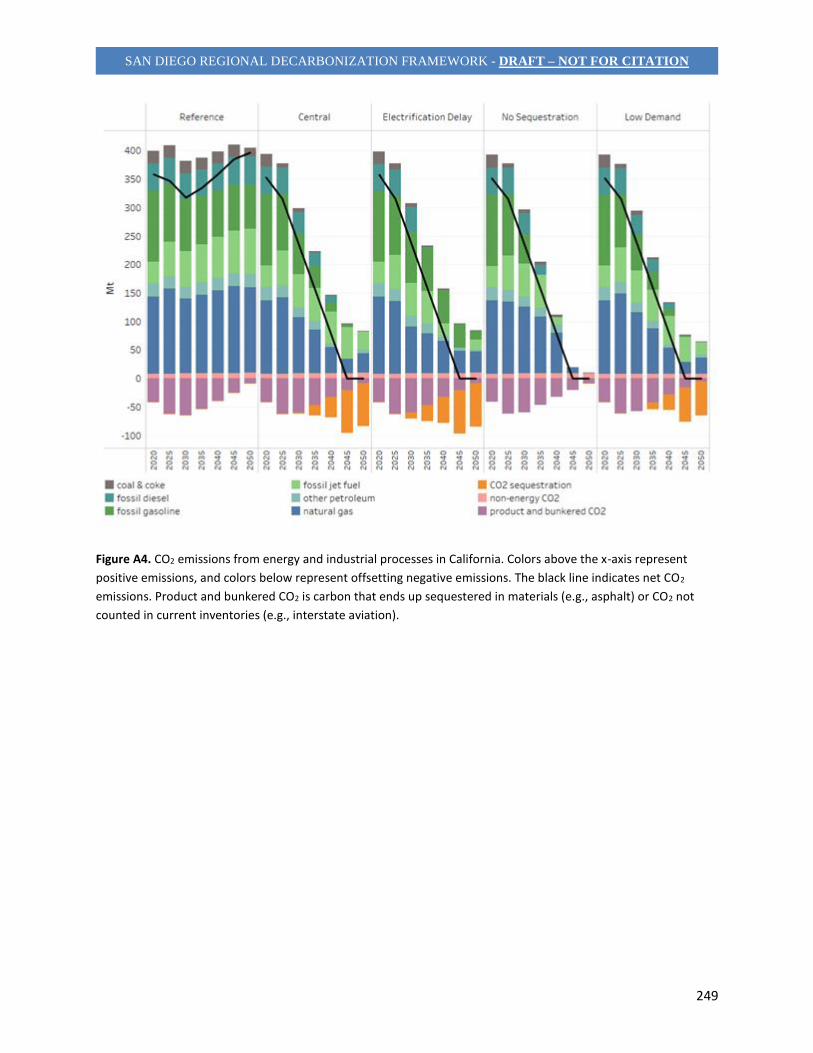
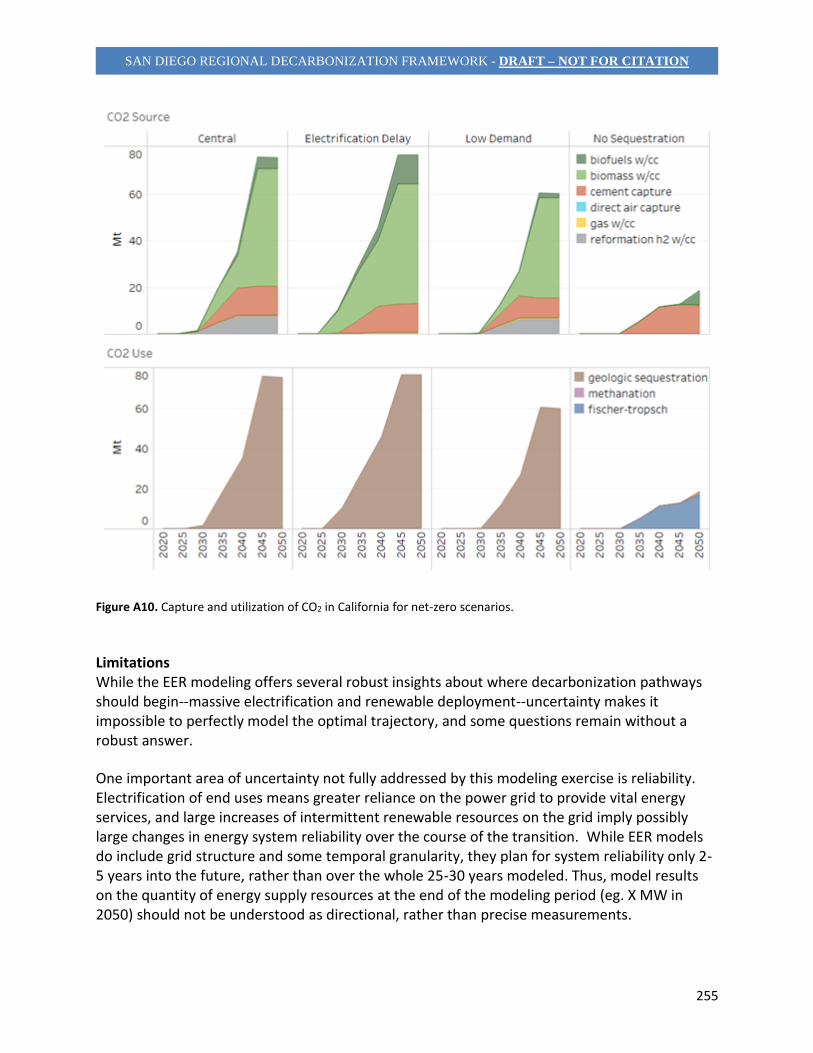
Finally, the EER models show that, if allowed by policy, carbon sequestration will likely be
necessary to achieve net-zero emissions. The land use and natural climate solutions regional
pathway analysis broadly assumes that this will require some level of natural carbon
sequestration and identifies land use and natural climate solutions which can enhance or
increase net negative land emissions.
247
SAN DIEGO REGIONAL DECARBONIZATION FRAMEWORK - DRAFT – NOT FOR CITATION
Figure A2. Final energy demand for different fuel blends in California. Final energy demand for the No
Sequestration scenario is the same as that of the Central scenario; however, pipeline gas in the No Sequestration
scenario would need to come from low carbon sources, such as drop-in fuels.

248
SAN DIEGO REGIONAL DECARBONIZATION FRAMEWORK - DRAFT – NOT FOR CITATION
Figure A3. Total installed electricity capacity in California.
249
SAN DIEGO REGIONAL DECARBONIZATION FRAMEWORK - DRAFT – NOT FOR CITATION
Figure A4. CO2 emissions from energy and industrial processes in California. Colors above the x-axis represent
positive emissions, and colors below represent offsetting negative emissions. The black line indicates net CO2
emissions. Product and bunkered CO2 is carbon that ends up sequestered in materials (e.g., asphalt) or CO2 not
counted in current inventories (e.g., interstate aviation).
250
SAN DIEGO REGIONAL DECARBONIZATION FRAMEWORK - DRAFT – NOT FOR CITATION
Figure A5. Percent change from 2020 to 2050 for some of the important drivers of energy service demand in
California, where state CDD stands for cooling degree days and HDD stands for heating degree days.
251
SAN DIEGO REGIONAL DECARBONIZATION FRAMEWORK - DRAFT – NOT FOR CITATION
Figure A6. California's energy service demand for the largest energy consuming subsectors for the Reference and
Low Demand scenarios. Scenarios not pictured have the same energy service demands as the reference case.

252
SAN DIEGO REGIONAL DECARBONIZATION FRAMEWORK - DRAFT – NOT FOR CITATION
Figure A7. Vehicle sales shares and resulting stocks in California

253
SAN DIEGO REGIONAL DECARBONIZATION FRAMEWORK - DRAFT – NOT FOR CITATION
Figure A8. California 2050 electricity consumption and supply. Fuel conversion loads include both electric boilers
and electrolysis.

254
SAN DIEGO REGIONAL DECARBONIZATION FRAMEWORK - DRAFT – NOT FOR CITATION
Figure A9. Transmission tie capacity from Northern and Southern California to surrounding zones.
255
SAN DIEGO REGIONAL DECARBONIZATION FRAMEWORK - DRAFT – NOT FOR CITATION
Figure A10. Capture and utilization of CO2 in California for net-zero scenarios.
Limitations While the EER modeling offers several robust insights about where decarbonization pathways should begin--massive electrification and renewable deployment--uncertainty makes it impossible to perfectly model the optimal trajectory, and some questions remain without a robust answer.
One important area of uncertainty not fully addressed by this modeling exercise is reliability. Electrification of end uses means greater reliance on the power grid to provide vital energy services, and large increases of intermittent renewable resources on the grid imply possibly large changes in energy system reliability over the course of the transition. While EER models do include grid structure and some temporal granularity, they plan for system reliability only 2-5 years into the future, rather than over the whole 25-30 years modeled. Thus, model results on the quantity of energy supply resources at the end of the modeling period (eg. X MW in 2050) should not be understood as directional, rather than precise measurements.

256
SAN DIEGO REGIONAL DECARBONIZATION FRAMEWORK - DRAFT – NOT FOR CITATION
Also, regional level costs—both demand and supply-side—reported by the EER model are subject to significant uncertainty. These models are meant to estimate costs over broad geographic areas, and do not produce detailed outlines of the geographic distribution of these costs in sub-regions. The distribution of costs depends on many factors—including fuel availability, sequestration costs, and economic and population trends, among other—which are very difficult to estimate over time at a high spatial resolution. For this reason, regional analyses have treated EER model cost estimates for zones (like Southern California) as broad approximations and have not been precisely reported here in this Appendix.
Works Cited
1. Williams, J. H. et al. Carbon-Neutral Pathways for the United States. AGU Adv. 2,
e2020AV000284 (2021).
2. Larson, E. et al. Net-Zero America: Potential Pathways, Infrastructure, and Impacts, interim
report. 345 (2020).
3. SDSN. Zero Carbon Action Plan. (2020).
4. Decarb America Research Initiative. Reports. https://decarbamerica.org/report/ (2021).