appendix a skills handbook a1 scientific inquiry
TRANSCRIPT
450 Appendix A NEL
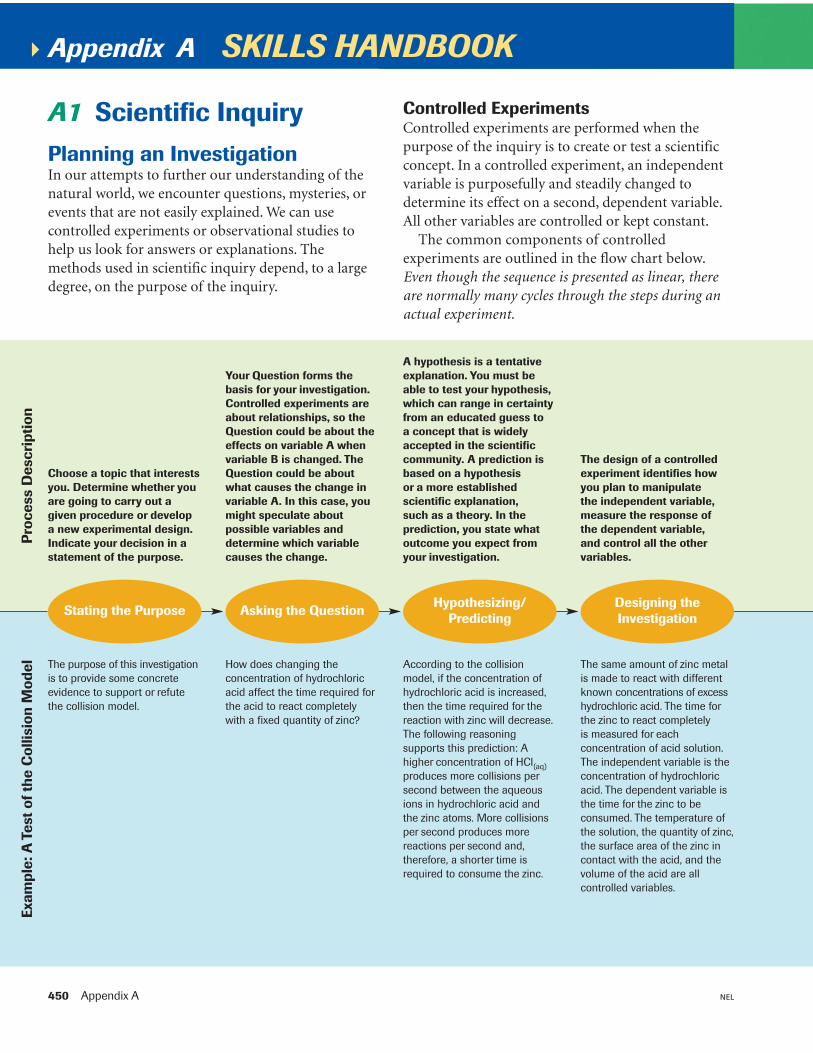
Planning an InvestigationIn our attempts to further our understanding of thenatural world, we encounter questions, mysteries, orevents that are not easily explained. We can usecontrolled experiments or observational studies tohelp us look for answers or explanations. Themethods used in scientific inquiry depend, to a largedegree, on the purpose of the inquiry.
Appendix A SKILLS HANDBOOK
A1 Scientific Inquiry
Choose a topic that interestsyou. Determine whether youare going to carry out agiven procedure or developa new experimental design.Indicate your decision in astatement of the purpose.
Your Question forms thebasis for your investigation.Controlled experiments areabout relationships, so theQuestion could be about theeffects on variable A whenvariable B is changed. TheQuestion could be aboutwhat causes the change invariable A. In this case, youmight speculate aboutpossible variables anddetermine which variablecauses the change.
A hypothesis is a tentativeexplanation. You must beable to test your hypothesis,which can range in certaintyfrom an educated guess toa concept that is widelyaccepted in the scientificcommunity. A prediction isbased on a hypothesisor a more establishedscientific explanation,such as a theory. In theprediction, you state whatoutcome you expect fromyour investigation.
The design of a controlledexperiment identifies howyou plan to manipulatethe independent variable,measure the response ofthe dependent variable,and control all the othervariables.
The purpose of this investigationis to provide some concreteevidence to support or refutethe collision model.
How does changing theconcentration of hydrochloricacid affect the time required forthe acid to react completelywith a fixed quantity of zinc?
According to the collisionmodel, if the concentration ofhydrochloric acid is increased,then the time required for thereaction with zinc will decrease.The following reasoningsupports this prediction: Ahigher concentration of HCl(aq)produces more collisions persecond between the aqueousions in hydrochloric acid andthe zinc atoms. More collisionsper second produces morereactions per second and,therefore, a shorter time isrequired to consume the zinc.
The same amount of zinc metalis made to react with differentknown concentrations of excesshydrochloric acid. The time forthe zinc to react completelyis measured for eachconcentration of acid solution.The independent variable is theconcentration of hydrochloricacid. The dependent variable isthe time for the zinc to beconsumed. The temperature ofthe solution, the quantity of zinc,the surface area of the zinc incontact with the acid, and thevolume of the acid are allcontrolled variables.
Stating the Purpose Asking the Question Hypothesizing/Predicting
Designing theInvestigation
Pro
cess
Des
crip
tion
Exam
ple:
A T
est
of t
he C
ollis
ion
Mod
el
Controlled ExperimentsControlled experiments are performed when thepurpose of the inquiry is to create or test a scientificconcept. In a controlled experiment, an independentvariable is purposefully and steadily changed todetermine its effect on a second, dependent variable.All other variables are controlled or kept constant.
The common components of controlledexperiments are outlined in the flow chart below.Even though the sequence is presented as linear, thereare normally many cycles through the steps during anactual experiment.

Skills Handbook 451NEL
Appendix A
A
There are many waysto gather and recordobservations during aninvestigation. It is helpful toplan ahead and think aboutwhat data you will need andhow best to record them.This helps you clarify yourthinking about the Questionposed at the beginning, thevariables, the number oftrials, the procedure, andyour skills. It will also helpyou organize your evidencefor easier analysis later.
After thoroughly analyzingyour observations, you mayhave sufficient andappropriate evidence toanswer the Question posedat the beginning of theinvestigation.
At this stage of theinvestigation, you willevaluate the processes thatyou followed to plan andperform the investigation.Evaluating the processesincludes reviewing the designand the procedure. You willalso evaluate the outcomeof the investigation, whichinvolves assessing theevidence—whether itsupports the hypothesis ornot—and the hypothesisitself.
In preparing your report, youraim should be to describeyour design and procedureaccurately, and to reportyour observations accuratelyand honestly.
Time to completion for thereaction will be measured usinga stopwatch and recorded in atable like Table 1.
The observations will bepresented in graphical format,with time on the horizontal axisand concentration of HCl(aq) onthe vertical axis. In this format,any trends or patterns will beeasier to see.
For a sample evaluation, see thesample lab report inAppendix A4.
For the format of a typical labreport, see the sample labreport in Appendix A4.
Gathering, recording,and organizingobservations
Analyzing theobservations
Evaluating theevidence and the
hypothesis
Reporting on theinvestigation
Table 1 Reaction Time for Zinc with HCl(aq)
Concentration of HCl(aq) (mol/L) Time for reaction (s)
2.5
2.0
1.5
1.0
0.5

452 Appendix A NEL
Observational StudiesOften the purpose of inquiry is simply to study anatural phenomenon with the intention of gainingscientifically significant information to answer aquestion. Observational studies involve observinga subject or phenomenon in an unobtrusive orunstructured manner, often with no specifichypothesis. A hypothesis to describe or explainthe observations may, however, be generated afterrepeated observations, and modified as newinformation is collected over time.
The flow chart below summarizes the stages andprocesses of scientific inquiry through anobservational study. Even though the sequence ispresented as linear, there are normally many cyclesthrough the steps during an actual study.
Choose a topic that interestsyou. Determine whether youare going to replicate orrevise a previous study, orcreate a new study. Indicateyour decision in a statementof the purpose.
In planning an observationalstudy, it is important to posea general question about thenatural world. You may ormay not follow the Questionwith the creation of ahypothesis.
A hypothesis is atentative explanation. Inan observational study, ahypothesis can be formedafter observations havebeen made and informationhas been gathered on atopic. A hypothesis may becreated in the analysis.
The design of anobservational studydescribes how you will makeobservations that arerelevant to the Question.
Although the quality of publicswimming areas is normallytested by the municipal orprovincial Department of Health,no chemical analysis is doneunless a problem arises. Thepurpose of this study is to carryout an environmentalassessment to determine thechemical quality of the localpublic swimming area.
What common chemicals arefound in the local publicswimming area, and in whatconcentrations are theypresent?
At this point, we have noindication of which chemicalsare present in the area, whattheir concentrations may be,and whether there are anythreats to swimmers. We haveno hypothesis and can make nopredictions.
We will take a sample of waterfrom five different locationswithin the local swimming areaeach week for a month. Note willbe made of other significantconditions (such as heavy rainor wind) that are present duringthe course of the study. Thewater samples will be tested fororganic and inorganic chemicalsthat may pose a health hazard.The testing facilities at theDepartment of Health will beused to determine the presenceand concentrations ofchemicals.
Stating the Purpose Asking the Question Hypothesizing/Predicting
Designing theInvestigation
Pro
cess
Des
crip
tion
Exam
ple:
Wat
erQ
ualit
y in
Pub
lic S
wim
min
g A
rea

Skills Handbook 453NEL
Appendix A
A
There are many waysto gather and recordobservations during aninvestigation. During yourobservational study, youshould quantify yourobservations where possible.All observations should beobjective and unambiguous.Consider ways to organizeyour information for easieranalysis.
After thoroughly analyzingyour observations, youmay have sufficient andappropriate evidence toanswer the Question posedat the beginning of the study.You may also have enoughobservations and informationto form a hypothesis.
At this stage of the study,you will evaluate theprocesses used to plan andperform the study. Evaluatingthe processes includesevaluating the materials, thedesign, the procedure, andyour skills. Often the resultsof such studies suggestfurther studies, perhapscorrelational studies orcontrolled experiments toexplore tentative hypothesesyou may have developed.
In preparing your report,your aim should be todescribe your design andprocedure accurately, andto report your observationsaccurately and honestly.
The data will be recorded in atable like Table 2. Thechemicals to be tested forinclude the following:— lead— mercury— cadmium— nitrates/nitrites— volatile organic compounds
such as benzene, toluene,and carbon tetrachloride
— petroleum products— chlorine
The concentrations of thechemicals found in theswimming area are determined.
We must determine if oursampling and testingprocedures are appropriate. Isthe number of samplessufficient? Were they taken atthe proper sites? Was thetesting of the samples carriedout with care and precision?
The presence of chemicalsin concentrations higher thanthe acceptable levels will alertus to potential problems withthe swimming area. This mightsuggest further studies todetermine the possiblesource(s) of the chemical(s).
For the format of a typical labreport, see the sample labreport in Appendix A4.
Gathering, recording,and organizingobservations
Analyzing theobservations
Evaluating theevidence and the
hypothesis
Reporting on theinvestigation
Table 2 Presence and Concentration of Chemicals in Public Swimming Area
Week 1 Week 2 Week 3 Week 4
Chemicals Sample area Sample area Sample area Sample area
1 2 3 4 5 1 2 3 4 5 1 2 3 4 5 1 2 3 4 5

454 Appendix A NEL
Modern life is filled with environmental and socialissues that have scientific and technological dimensions.An issue is defined as a problem that has at least twopossible solutions rather than a single solution. Therecan be many positions, generally determined by thevalues that an individual or a society holds, on a singleissue. Which solution is “best” is a matter of opinion;ideally, the solution that is put into practice is the onethat is most appropriate for society as a whole.
The common elements of the decision-makingprocess are outlined in the flow chart below. Eventhough the sequence is presented as linear, you may gothrough several cycles before deciding that you are readyto defend a decision.
A2 Decision Making
The first step in understanding an issueis to explain why it is an issue, describethe problems associated with the issue,and identify the individuals or groups(called stakeholders) involved in theissue. You could brainstorm thefollowing questions to research theissue: Who? What? Where? When?Why? How? Develop backgroundinformation on the issue by clarifyingfacts and concepts, and identifyingrelevant attributes, features, orcharacteristics of the problem.
Examine the issue and think of as manyalternative solutions as you can. At thispoint, it does not matter if the solutionsseem unrealistic. To analyze thealternatives, you should examine theissue from a variety of perspectives.Stakeholders may bring differentviewpoints to an issue, and theseviewpoints may influence their positionon the issue. Brainstorm or hypothesizehow various stakeholders would feelabout your alternatives.
Formulate a research question thathelps to limit, narrow, or define theissue. Then develop a plan to findreliable and relevant sources ofinformation. Outline the stages of yourinformation search: gathering, sorting,evaluating, selecting, and integratingrelevant information. You may considerusing a flow chart, a concept map, oranother graphic organizer to outline thestages of your information search.Gather information from many sources,including newspapers, magazines,scientific journals, the Internet, andthe library.
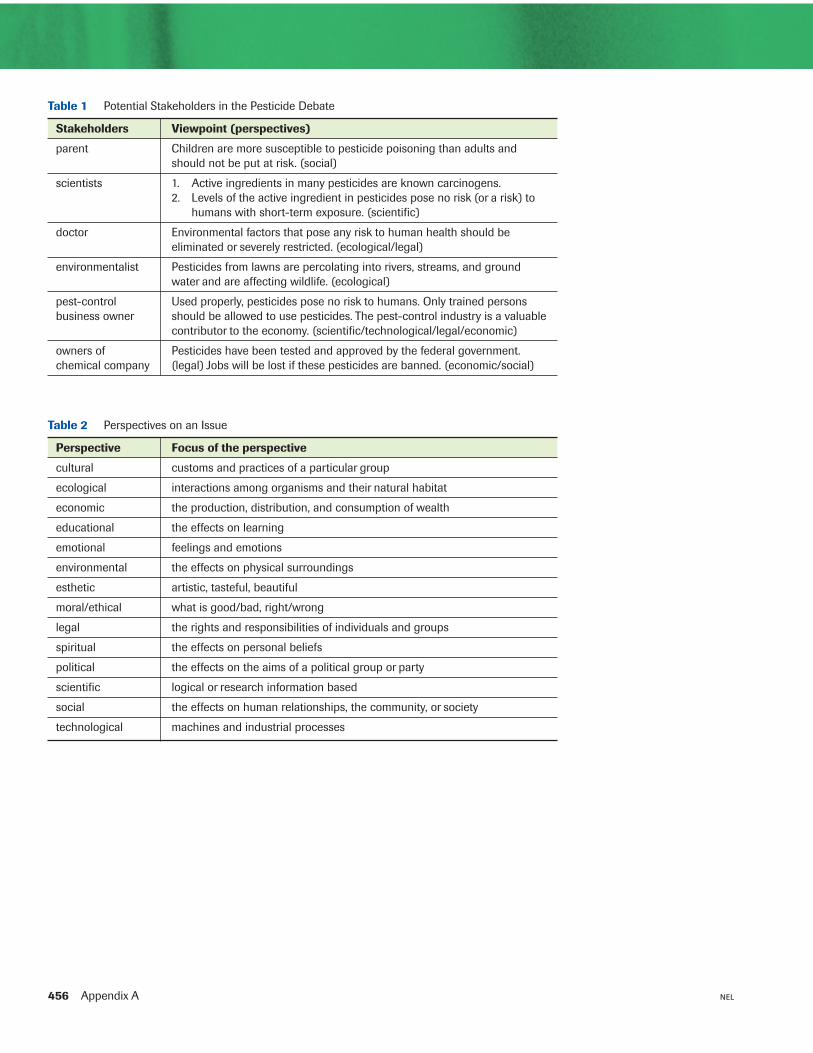
In recent years, the use of pesticides (herbicides,insecticides, and fungicides) on lawns has increaseddespite reports of health and environmental risks.Several attempts are being made to deal with theincreased use, including publicity campaigns byvarious groups, and attempts to ban or limit the useof pesticides at municipal and other governmentlevels. A list of possible stakeholders in this issue isstarted in Table 1 (p. 456).
Develop background information on the issue byclarifying information and concepts, and identifyingrelevant attributes, features, or characteristics of theproblem. For example:• While more research is needed on the health risks,
many lawn chemicals currently in use are knowncarcinogens. As well, there are numerous otherless serious symptoms (such as headaches,nausea, fever, and breathing difficulties)associated with pesticide poisoning.
• Manufacturers point out that the pesticides theymanufacture have been approved for use by thefederal government. Pesticides considered unsafe,such as DDT and fenitrothion, have been banned.
One possible solution for people concernedabout pesticide use is to ban the productionof pesticides. A solution for government mightbe to enforce stricter regulations governingpesticide use.
Think about how different stakeholdersmight feel about the alternatives. For example,citizens may be affected by the use ofpesticides in their neighbourhood. Whatwould be their perspective? What would bethe perspective of a parent of small children?A farmer? A pest-control business owner?A chemist? A gardener? Employees andowners of a company that producespesticides? An environmentalist? (SeeTable 2 for a start on this process.)Remember that one person can have morethan one perspective. It is also possible thattwo people, looking at an issue from the sameperspective, might disagree about the bestsolution or even the available information. Forexample, scientists might disagree about thedegree of risk associated with pesticide use.
Begin your search for reliable andrelevant sources of information aboutthe issue with a question such as,“What does the research say about therisks associated with pesticide use?” or“What are the established positions ofvarious groups on the issue?”
Defining the issue Identifyingalternatives/positions Researching the issue
Pro
cess
Des
crip
tion
Exam
ple:
The
Issu
e of
Pes
tici
de U
se

Skills Handbook 455NEL
Appendix A
A
There are five steps that must becompleted to analyze the issueeffectively:
1. Establish criteria for determiningthe relevance and significance ofthe data you have gathered.
2. Evaluate the sources of information.
3. Identify and determine whatassumptions have been made.Challenge unsupported evidence.
4. Determine any relationshipsassociated with the issue.
5. Evaluate the alternative solutions,possibly by conducting arisk–benefit analysis.
After analyzing your information, youcan answer your research question andtake an informed position on the issue.You should be able to defend yoursolution in an appropriate format—debate, class discussion, speech,position paper, multimedia presentation(such as a computer slide show),brochure, poster, or video.
Your position on the issue must bejustified using supporting informationthat you have researched. You should beable to defend your position to peoplewith different perspectives. Ask yourselfthe following questions:
• Do I have supporting evidence from avariety of sources?
• Can I state my position clearly?
• Can I show why this issue is relevantand important to society?
• Do I have solid arguments (with solidevidence) supporting my position?
• Have I considered arguments againstmy position, and identified theirfaults?
• Have I analyzed the strong and weakpoints of each perspective?
The final phase of decision makingincludes evaluating the decision itselfand the process used to reach thedecision. After you have made adecision, carefully examine the thinkingthat led to your decision.
Some questions to guide yourevaluation:
• What was my initial perspective onthe issue? How has my perspectivechanged since I first began to explorethe issue?
• How did we make our decision? Whatprocess did we use? What steps didwe follow?
• In what ways does our decisionresolve the issue?
• What are the likely short- and long-term effects of the decision?
• To what extent am I satisfied with thefinal decision?
• What reasons would I give to explainour decision?
• If we had to make this decision again,what would I do differently?
In our defence at the town hall meeting, wewill concentrate on our evidence that thereare alternative methods of pest control thatare effective and safe. By concentrating onthis, and on reasonable doubt about thesafety of pesticide use, we hope to be ableto counter arguments by opponents.
We tried to obtain information from a varietyof reputable sources; however, some of theresearch is highly technical, and it ispossible that we misunderstood its mainpoints or misjudged its relevance.
In the town hall meeting, we created abylaw to eliminate pesticide use on townproperty and to limit pesticide use on privateproperty to exceptional circumstances. Werealize that this decision will not satisfy allstakeholders, but we believe it is the bestsolution given the evidence at our disposal.
This decision may cause painful changesfor industries that produce pesticides and forseveral service industries. We believe thatafter a transition period, these industries willsurvive to produce and market safealternatives to conventional pesticides.
Analyzing the issue Defending the decision Evaluating the process
After reviewing government, chemicalindustry, and university studies, and readingnewspaper articles and papers byenvironmental groups, we concluded thatresearch seems to indicate that the activeingredients in many common pesticides arecarcinogenic and therefore pose asignificant risk to health.
There are reports that contradict ourview, and domestic pesticides have beenapproved for use by federal governmentagencies. There are many jobs, some ofthem based in our town, that rely oncontinued use of pesticides.
After performing a risk–benefit analysisof the various alternative solutions, wedecided that we should attempt to reduce oreliminate the use of pesticides on lawns.
Table 3 (p. 457) shows a risk–benefitanalysis of allowing pesticide use on lawns.
456 Appendix A NEL
Table 1 Potential Stakeholders in the Pesticide Debate
Stakeholders Viewpoint (perspectives)
parent Children are more susceptible to pesticide poisoning than adults andshould not be put at risk. (social)
scientists 1. Active ingredients in many pesticides are known carcinogens.2. Levels of the active ingredient in pesticides pose no risk (or a risk) to
humans with short-term exposure. (scientific)
doctor Environmental factors that pose any risk to human health should beeliminated or severely restricted. (ecological/legal)
environmentalist Pesticides from lawns are percolating into rivers, streams, and groundwater and are affecting wildlife. (ecological)
pest-control Used properly, pesticides pose no risk to humans. Only trained persons business owner should be allowed to use pesticides. The pest-control industry is a valuable
contributor to the economy. (scientific/technological/legal/economic)
owners of Pesticides have been tested and approved by the federal government. chemical company (legal) Jobs will be lost if these pesticides are banned. (economic/social)
Table 2 Perspectives on an Issue
Perspective Focus of the perspective
cultural customs and practices of a particular group
ecological interactions among organisms and their natural habitat
economic the production, distribution, and consumption of wealth
educational the effects on learning
emotional feelings and emotions
environmental the effects on physical surroundings
esthetic artistic, tasteful, beautiful
moral/ethical what is good/bad, right/wrong
legal the rights and responsibilities of individuals and groups
spiritual the effects on personal beliefs
political the effects on the aims of a political group or party
scientific logical or research information based
social the effects on human relationships, the community, or society
technological machines and industrial processes

Skills Handbook 457NEL
A Risk–Benefit Analysis ModelRisk–benefit analysis is a tool used to organize andanalyze information gathered in research. A thoroughanalysis of the risks and benefits associated with eachalternative solution can help you decide on the bestalternative.
• Research as many aspects of the proposal aspossible. Look at it from different perspectives.
• Collect as much evidence as you can, includingreasonable projections of likely outcomes if theproposal is adopted.
• Classify each potential result as being either abenefit or a risk.
• Quantify the size of the potential benefit or risk(perhaps as a dollar figure, as a number of livesaffected, or on a scale of 1 to 5).
• Estimate the probability (percentage) of thatevent occurring.
• By multiplying the size of a benefit (or risk) bythe probability of its happening, you can calculatea probability value for each potential result.
• Total the probability values of all the potentialrisks and all the potential benefits.
• Compare the sums to help you decide whether toaccept the proposed action.
Table 3 shows an incomplete risk–benefit analysisof one option in the lawn pesticide issue—making nochanges in regulations. Note that although you shouldtry to be objective in your assessment, the beliefs ofthe person making the risk–benefit analysis will havean effect on the final sums. The possible outcomesconsidered for analysis, the assessment of the relativeimportance of a cost or benefit, and the probability ofthe cost or benefit actually arising will vary accordingto who does the analysis. For example, would youagree completely with the values placed in the “Cost”and “Benefit” columns of the analysis in Table 3?
Appendix A
A
Table 3 Risk–Benefit Analysis of Continuing Use of Pesticides on Lawns
Risks Benefits
Possible Cost of Probability Cost � Possible Benefit of Probability Benefit �result result (scale of result probability result result (scale of result probability
of 1 to 5) occurring (%) of 1 to 5) occurring (%)
Pesticide use on very serious inconclusive 300 Pesticides high somewhat likely 240lawns presents 5 research eliminate pests, 4 (60%)human health (60%) which also risks. present health
risk.
Pesticide use on serious likely 320 Lawn-care high certain 400lawns affects 4 (80%) business is a 4 (100%)other species. valuable part of
local economy.
Health-care very serious likely 400 Well-kept lawn medium likely 240costs will 5 (80%) increases 3 (80%)increase. property value.
Total risk value 1020 Total benefit value 880

458 Appendix A NEL
There is a difference between science and technology.The goal of science is to understand the natural world.The goal of technological problem solving is to developor revise a product or a process in response to a humanneed. The product or process must fulfill its functionbut, in contrast with scientific problem solving, it isnot essential to understand why or how it works.
Technological solutions are evaluated based on suchcriteria as simplicity, reliability, efficiency, cost, andecological and political consequences.
Even though the sequence presented in the flow chartbelow is linear, there are normally many cycles throughthe steps in any problem-solving attempt.
A3 Technological Problem Solving
This process involves recognizing andidentifying the need for a technologicalsolution. You need to state clearly thequestion(s) that you want to investigate tosolve the problem and the criteria you will useto plan and evaluate your solution. In anydesign, some criteria may be more importantthan others. For example, if a tool measuresaccurately and is economical, but is not safe,then it is clearly unacceptable.
Use your prior knowledge,experience, and creativity topropose possible solutions.
During brainstorming, thegoal is to generate manyideas without judging them.They can be evaluated andaccepted or rejected later.
To visualize the possiblesolutions, it is helpful todraw sketches. Sketchesare often better thanverbal descriptions forcommunicating an idea.
Planning is the heart of the entire process.Your plan will outline your processes, identifypotential sources of information and materials,define your resource parameters, and establishevaluation criteria.
Seven types of resources are generally usedwhen developing technological solutions toproblems: people, information, materials, tools,energy, capital, and time.
We often need to solve technological problemsbefore we can conduct a scientific investigation.For example, imagine that you are asked toconduct an investigation in which you cannot, forsafety reasons, use the traditional, commercial pHindicators. Your task, then, is to design a safechemical indicator for pH that will be as effectiveas those available commercially.
If you are not given criteria for the solution tothe problem (criteria are often given intechnological problem solving), you can establishyour own by asking some basic questions aboutthe situation and the function of the device.
In this case, you are asked to design andproduce a chemical pH indicator to meet thefollowing criteria:• must be able to measure pH to at least the
nearest 0.5 on the pH scale• must be safe enough to pose no health hazard
if spilled on the skin or ingested• must have a shelf life of at least one month• must be at least as economical as a
comparable commercial product• must be produced from readily available
materials
Design 1: Poison PrimroseFlower ExtractThis extract is made by mixingdried and ground poisonprimrose flower petals, boilingthe resulting powder inisopropyl alcohol, and filteringthe resulting mixture to isolatethe extract.
Design 2: Red CabbageExtractThis extract is made by mixingchopped red cabbage withwater in a blender and strainingthe juice (extract) from theresulting mush.
People: The human resources required to solve thisproblem include you and your partner.Information: You already understand the conceptsof acidity and basicity. You will need to understandfully the pH scale. You may also need to find outabout naturally occurring substances that react withacids or bases to produce different (such as visible)effects.Materials: Within the limitations imposed by yourproposed solution, cost, availability, safety, and time,you can use whatever materials you deem necessary.Tools: Your design should not require any specializedtools or machines that are not immediately available.Energy: The solution to this problem should notrequire any external source of energy.Capital: The dollar cost must be low. Your solutionmust cost less to build than a comparablecommercial product would cost to buy.Time: Because of the time limit on the scientificinvestigation, there is an even shorter time limit onthe production of the indicator. You should be able toproduce your indicator within 60 min. (This does notinclude designing and testing.)
The solution will be evaluated on how well itmeets the design criteria established earlier.
Defining the problem Identifying possiblesolutions Planning
Pro
cess
Des
crip
tion
Exam
ple:
Inve
ntin
g a
pH M
eter

NEL
Appendix A
A
Gathering, recording, andorganizing observations Analyzing the observations Evaluating the
evidence and the hypothesisStating the Purpose Asking the Question Hypothesizing/predicting
Skills Handbook 459
Gathering, recording, andorganizing observations Analyzing the observations Evaluating the
evidence and the hypothesis
In this phase, you will construct and test yourprototype using trial and error. Try to changeonly one variable at a time. Use failures toinform the decisions you make before yournext trial. You may also complete acost–benefit analysis on the prototype.
To help you decide on the best solution, youcan rate each potential solution based on thedesign criteria. Use a five-point rating scale,with 1 being poor, 2 fair, 3 good, 4 very good,and 5 excellent. You can then compare yourproposed solutions by totalling the scores.
Once you have made the choice amongthe possible solutions, you need to produceand test a prototype. While making theprototype, you may need to experiment withthe characteristics of different components.A model, on a smaller scale, might help youdecide whether the product will be functional.The test of your prototype should answer threebasic questions:
• Does the prototype solve the problem?
• Does it satisfy the design criteria?
• Are there any unanticipated problems withthe design?
If these questions cannot be answeredsatisfactorily, you may have to modify thedesign or select another potential solution.
In presenting your solution, you willcommunicate your solution, identifypotential applications, and put yoursolution to use.
Once the prototype has beenproduced and tested, the bestpresentation of the solution is ademonstration of its use—a test underactual conditions. This demonstrationcan serve as a further test of the design,as well. Any feedback should beconsidered for future redesign.Remember that no solution should beconsidered the absolute final solution.
Evaluation is not restricted to thefinal step. However, it is importantto evaluate the final product usingthe criteria established earlier andto evaluate the processes usedwhile arriving at the solution.Consider the following questions:
• To what degree does the finalproduct meet the designcriteria?
• Did you have to make anycompromises in the design? Ifso, are there ways to minimizethe effects of the compromises?
• Did you exceed any of theresource parameters?
• Are there other possiblesolutions that deserve futureconsideration?
• How did your group work as ateam?
Our chosen product, red cabbage extract,meets most of the established criteria.Feedback from the chemistry classdemonstration was positive. Unfortunately,the indicator does not change colour in theintervals pH 3 to 4 and pH 9 to 10, whichlimits how it can be used.
Kept in the refrigerator, red cabbageextract is still acting as a good pH indicatorone month after it was prepared. Redcabbage is readily available. Its extract issafe for all uses and cheap to prepare.
In general, our group worked well as ateam. However, some individuals pitched ina little more than others, especially in areaswhere they felt they they were more skilled.We have agreed that in future projects,every member of the team will work onsomething that is new to them, which willgive each of us a chance to learn, andeveryone will do their fair share in the finalcleanup.
The chosen design was presented tothe chemistry class. A set of 12 testtubes was set up. Each test tubecontained a colourless solution ofknown pH, ranging from pH 1 to pH 14.Ten drops of red cabbage extract wasadded to each test tube. Studentsobserved the colour changes andrated the results using a rating scalesimilar to the one used in the producttesting stages. Students were given alist of the criteria used in the designand production stages, and wereasked to provide comments regardingthe indicator’s performance.
Constructing/testingsolutions
Presenting thepreferred solution
Evaluating thesolution and process
Table 1 illustrates the rating for two differentdesigns. Note that although Design 1 came out withthe highest rating, there is one factor (safety) thatsuggests we should go with Design 2. This is whatis referred to as a tradeoff. By reviewing orevaluating product and processes, we may be ableto modify Design 2 to optimize its performance onthe other criteria.
Table 1 Design Analysis
Criterion Design 1 Design 2
accuracy 5 3
safety 3 5
shelf life 3 4
economy 4 4
materials 5 3
Total score 20 19

460 Appendix A NEL
When carrying out investigations, it is importantthat scientists keep records of their plans and results,and share their findings. In order to have theirinvestigations repeated (replicated) and accepted bythe scientific community, scientists generally sharetheir work by publishing papers in which theyprovide details of their design, materials, procedure,evidence, analysis, and evaluation.
Lab reports are prepared after an investigation iscompleted. To ensure that you can accurately describethe investigation, it is important to keep thoroughand accurate records of your activities as you carryout the investigation.
Investigators use a similar format in their finalreports or lab books, although the headings andorder may vary. Your lab book or report shouldreflect the type of scientific inquiry that you usedin the investigation and should be based on thefollowing headings, as appropriate. (See Figure 1, onpages 462–463, for a sample lab report.)
TitleAt the beginning of your report, write the sectionnumber and title of your investigation. In this course,the title is usually given, but if you are designing yourown investigation, create a title that suggests what theinvestigation is about. Include the date the investigationwas conducted and the names of all lab partners (if youworked as a team).
PurposeState the purpose of the investigation. Why are youdoing the investigation?
QuestionThis is the Question that you attempted to answer inthe investigation. If it is appropriate to do so, state theQuestion in terms of independent and dependentvariables.
Hypothesis/PredictionBased on your reasoning or on a concept that youhave studied, formulate an explanation of whatshould happen (a hypothesis). From yourhypothesis you may make a prediction (a statementof what you expect to observe) before carrying outthe investigation. Depending on the nature of yourinvestigation, you may or may not have a hypothesisor a prediction.
Experimental DesignThis is a brief general overview (one to threesentences) of what was done. If your investigationinvolved independent, dependent, and controlledvariables, list them. Identify any control or controlgroup that was used in the investigation.
MaterialsThis is a detailed list of all materials used, includingsizes and quantities where appropriate. Be sure toinclude safety equipment such as goggles, lab apron,prospective gloves, and tongs, where needed. Draw adiagram to show any complicated setup of apparatus.
ProcedureDescribe, in detailed, numbered steps, the procedureyou followed to carry out your investigation. Includesteps to clean up and dispose of waste.
ObservationsThis includes all qualitative and quantitativeobservations you made. Be as precise as possiblewhen describing quantitative observations, includeany unexpected observations, and present yourinformation in a form that is easily understood.If you have only a few observations, this canbe a list. For controlled experiments and for manyobservations, a table will be more appropriate.
A4 Lab Reports

Skills Handbook 461NEL
AnalysisInterpret your observations and present the evidencein the form of tables, graphs, or illustrations, eachwith a title. Include any calculations, and show theresults of your calculations in a table. Makestatements about any patterns or trends you observed.Conclude the analysis with a statement based only onthe evidence you have gathered, answering thequestion that initiated the investigation.
EvaluationThe evaluation is your judgment about the quality ofevidence obtained and about the validity of theprediction and hypothesis (if present). This sectioncan be divided into two parts: evaluation of theinvestigation and evaluation of the prediction (andhypothesis). The following questions and suggestionsshould help you in each part of the process.
Evaluation of the Investigation• Did the design enable you to answer the
question?
• As far as you know, is the design the bestavailable or are there flaws that could becorrected?
• Were the steps in the investigation in the correctorder and adequate to gather sufficient evidence?
• What steps, if done incorrectly, could havesignificantly affected the results?
• What improvements could be made to theprocedure?
Sum up your conclusions about the procedure in astatement that begins like this: “The procedure isjudged to be adequate/inadequate because…”
• What specialized skills (such as measuring)might have an effect on the results?
• Was the evidence from repeated trials reasonablysimilar?
• Can the measurements be made more precise?
Sum up your conclusions about the required skillsin a statement that begins like this: “The skills arejudged to be adequate/inadequate because…”
• What are the sources of uncertainty and error inmy investigation?
• Based on any uncertainties and errors you haveidentified, do you have enough confidence inyour results to proceed with the evaluation of theprediction and hypothesis?
State your confidence level in a statement like this:“Based on my evaluation of the investigation, I amcertain/I am moderately certain/I am very certain ofmy results.”
Evaluation of the Prediction(and Hypothesis)
• Does the predicted answer clearly agree with theanswer in your analysis?
• Can any difference be accounted for by thesources of uncertainty or error listed earlier inthe evaluation?
Sum up your evaluation of the prediction in astatement that begins like this: “The prediction isjudged to be verified/inconclusive/falsified because…”
• Is the hypothesis supported by the evidence?
• Is there a need to revise the hypothesis or toreplace it with a new hypothesis?
If the prediction was verified, the hypothesisbehind it is supported. If the results wereinconclusive or the prediction is falsified, then thehypothesis is questionable. Sum up your evaluationof the hypothesis in a statement that begins like this:“The hypothesis being tested is judged to beacceptable/unacceptable because…”
Appendix A
A

462 Appendix A NEL
Figure 1Sample lab report
Investigation 2.5: The Effect of Concentration on Reaction Time
Conducted December 15, 2009
By Barry L. and Lakshmi B.
PurposeThe purpose of this investigation is to test one of the ideas of the collision model.
QuestionHow does changing the concentration of hydrochloric acid affect the time required for thereaction of hydrochloric acid with a fixed quantity of zinc?
Hypothesis/PredictionAccording to the collision model, if the concentration of hydrochloric acid is increased, thenthe time required for the reaction with zinc will decrease. The following reasoning supportsthis hypothesis: A higher concentration produces more collisions per second between thehydrochloric acid particles and the zinc atoms. More collisions per second produces morereactions per second and, therefore, a shorter time is required to consume the zinc.
Experimental DesignDifferent known concentrations of excess hydrochloric acid react with zinc metal. The timefor the zinc to react completely is measured for each concentration of acid solution. Theindependent variable is the concentration of hydrochloric acid. The dependent variable is thetime for the zinc to be consumed. The temperature of the solution, the quantity of zinc, thesurface area of the zinc in contact with the acid, and the volume of the acid are all controlledvariables.
Materialslab apron safety glassesfour 10-mL graduated cylinders four 18-mm by 150-mm test tubes and a test-tube rackclock or watch (precise to nearest second) four pieces of zinc metal strip, 5 mm by 5 mmstock solutions of HCl(aq): 2.0 mol/L, solution of a weak base (baking soda)
1.5 mol/L, 1.0 mol/L, 0.5 mol/L
Procedure1. 15 mL of 2.0 mol/L HCl(aq) was transferred into an 18-mm by 150-mm test tube.
2. A piece of Zn(s) was carefully placed into the hydrochloric acid solution. The startingtime of the reaction was noted.
3. The time required for all of the zinc to react was measured and recorded.
4. Steps 2 to 4 were repeated using 1.5 mol/L, 1.0 mol/L, and 0.5 mol/L HCl(aq).
5. Any acid remaining in the solutions was neutralized with a solution of the weak base andthen poured down the sink with large amounts of water.

Skills Handbook 463NEL
Appendix A
AObservations
AnalysisThe evidence is plotted on a graph of time versus concentration of HCl(aq) (below). The graphtends to level off at the two highest concentrations. From this trend, we can predict, both fromthe graph and from common sense, that if you keep increasing the concentration, the reactiontime will never reach zero. Wemight also predict that as theconcentration gets very low,the time required for all ofthe zinc to react will becomevery long.
Based on the evidencegathered in this investigation,increasing the concentrationof hydrochloric acid decreasesthe time required for thereaction of hydrochloric acidwith a fixed quantity of zinc.
EvaluationThe design, materials, and skills used in this investigation are adequate because this experimentproduced the type of evidence needed to answer the question with a high degree of certainty.The variables were easy to measure, manipulate, and control.
The procedure is also considered to be adequate since the steps are simple andstraightforward. We could have improved the procedure by extending the range ofconcentrations, by stirring, and by performing more than one trial for each concentration.
Sources of uncertainty in this investigation include the purity of the zinc metal strip, theconcentration of the stock acid, and the determination of when the last bit of zinc had reacted.
The hypothesis is supported by the evidence, which clearly shows that the reaction timedecreased as the concentration increased. Based on the evidence, the collision model is alsoacceptable.
SynthesisOther investigations using one of the controlled variables (such as temperature of the acid orsurface area of the zinc) as the independent variable could be carried out to determine theireffect on the reaction rate. Additional investigations studying the effect of concentration onreaction rate using different reactants and reaction types could be conducted.
The Effect of Concentration on Reaction Time
Concentration of HCl(aq) (mol/L) Time for reaction (s)
2.0 70
1.5 80
1.0 144
0.5 258
0.0 0.5 1.0 1.5 2.0 2.50
50
100
150
200
250
300
Tim
e (s
)
Concentration of HCL(aq) (mol/L)
Effect of Concentration on Reaction Time

464 Appendix A NEL
Scientific NotationIt is difficult to work with very large or very smallnumbers when they are written in common decimalnotation. Usually it is possible to accommodate suchnumbers by changing the SI prefix so that thenumber falls between 0.1 and 1000. For example,237 000 000 mm can be expressed as 237 km, and0.000 000 895 kg can be expressed as 0.895 mg.However, this prefix change is not always possible,either because an appropriate prefix does not exist orbecause a particular unit of measurement must beused. In these cases, the best method of dealing withvery large and very small numbers is to write themusing scientific notation. Scientific notation expressesa number by writing it in the form a � 10n, wherethe coefficient a is between 1 and 10, and the digits inthe coefficient a are all significant. Table 1 showssituations where scientific notation would be used.
Uncertainty in MeasurementsThere are two types of quantities that are used inscience: exact values and measurements. Exact valuesinclude defined quantities (1 m � 100 cm) andcounted values (5 cars in a parking lot).Measurements, however, are not exact because thereis some uncertainty or error associated with everymeasurement.
There are two types of measurement error.Random error results when an estimate is made toobtain the last significant figure for any measurement.The size of the random error is determined by theprecision of the measuring instrument. For example,when measuring length, it is necessary to estimatebetween the marks on the measuring tape. If thesemarks are 1 cm apart, the random error will begreater and the precision will be less than if the marksare 1 mm apart.
Systematic error is associated with an inherentproblem with the measuring system, such as thepresence of an interfering substance, incorrectcalibration, or room conditions. For example, ifthe balance is not zeroed at the beginning or if themetre stick is slightly worn, all the measurements willhave a systematic error.
The precision of measurements depends on thegradations of the measuring device. Precision is theplace value of the last measurable digit. For example,a measurement of 12.74 cm is more precise than ameasurement of 12.7 cm because the first value wasmeasured to hundredths of a centimetre, whereas thelatter value was measured to tenths of a centimetre.
When adding or subtracting measurements ofdifferent precision, the answer is rounded to the sameprecision as the least precise measurement. Forexample, using a calculator, add
11.7 cm � 3.29 cm � 0.542 cm � 15.532 cm
The answer must be rounded to 15.5 cm becausethe first measurement limits the precision to a tenthof a centimetre.
No matter how precise a measurement is, it stillmay not be accurate. Accuracy refers to how close avalue is to its true value. The comparison of the two
A5 Math Skills
To multiply numbers in scientific notation,multiply the coefficients and add the exponents; theanswer is expressed in scientific notation. Note thatwhen writing a number in scientific notation, thecoefficient should be between 1 and 10 and should berounded to the same certainty (number of significantdigits) as the measurement with the least certainty(fewest number of significant digits). Look at thefollowing examples:
(4.73 � 105 m)(5.82 � 107 m) � 27.5 � 1012 m2 � 2.75 � 1013 m2
(3.9 � 104 N)(5.3 � 10�3 m) � 21 � 101 N•m � 2.1 � 102 N•m
On many calculators, scientific notation is enteredusing a special key, labelled EXP or EE. This keyincludes “� 10” from the scientific notation, so youneed to enter only the exponent. For example, to enter
7.5 � 104 press 7.5 EXP 4
3.6 � 10�3 press 3.6 EXP �/�3
Table 1 Examples of Scientific Notation
Expression Common decimal Scientific notation notation
124.5 million kilometres 124 500 000 km 1.245 � 108 km
6 billion nanometres 6 000 000 000 nm 6 � 109 nm
5 gigabytes 5 000 000 000 bytes 5 � 109 bytes

Skills Handbook 465NEL
values can be expressed as a percentage difference.The percentage difference is calculated as follows:
% difference � � 100%
Figure 1 shows an analogy between precision andaccuracy, and the positions of darts thrown at adartboard.
How certain you are about a measurement dependson two factors: the precision of the instrument usedand the size of the measured quantity. More preciseinstruments give more certain values. For example, amass measurement of 13 g is less precise than ameasurement of 12.76 g; you are more certain aboutthe second measurement than the first. Certainty alsodepends on the measurement. For example, considerthe measurements 0.4 cm and 15.9 cm. Bothmeasurements have the same precision. If themeasuring instrument is precise to ± 0.1 cm,however, the first measurement is 0.4 ± 0.1 cm (0.3 cm or 0.5 cm) for an error of 25%, whereas thesecond measurement is 15.9 ± 0.1 cm (15.8 cm or 16.0 cm) for an error of 0.6%. For both factors—theprecision of the instrument used and the value of themeasured quantity—the more digits there are in ameasurement, the more certain you are about themeasurement.
Significant DigitsThe certainty of any measurement is communicated bythe number of significant digits in the measurement. Ina measured or calculated value, significant digits are thedigits that are certain plus one estimated (uncertain)digit. Significant digits include all digits correctlyreported from a measurement.
|experimental value � predicted value|�����
predicted value
Follow these rules to decide if a digit is significant:
1. If a decimal point is present, zeros to the left ofthe first non-zero digit (leading zeros) are notsignificant.
2. If a decimal point is not present, zeros to theright of the last non-zero digit (trailing zeros)are not significant.
3. All other digits are significant.
4. When a measurement is written in scientificnotation, all digits in the coefficient aresignificant.
5. Counted and defined values have infinitesignificant digits.
Table 2 shows some examples of significant digits.
Appendix A
A(a) (b) (c)
Figure 1The positions of the darts in these diagrams are analogous to measured or calculated results in a laboratory setting. In (a) the resultsare precise and accurate, in (b) they are precise but not accurate, and in (c) they are neither precise nor accurate.
Table 2 Significant Digits
Measurement Number of significant digits
32.07 m 4
0.0041 g 2
5 � 105 kg 1
6400 s 2
100 people (counted) infinite
An answer obtained by multiplying and/or dividingmeasurements is rounded to the same number ofsignificant digits as the measurement with the fewestnumber of significant digits. For example, you coulduse a calculator to solve the following equation:
77.8 km/h � 0.8967 h � 69.763 26 km
However, the certainty of the answer is limited to threesignificant digits, so the answer is rounded up to 69.8 km.
466 Appendix A NEL
Rounding OffThe following rules should be used when roundinganswers to calculations.
1. When the first digit discarded is less than 5, thelast digit retained should not be changed.
3.141 326 rounded to four digits is 3.141.
2. When the first digit discarded is greater than 5,or if it is a 5 followed by at least one digit otherthan zero, the last digit retained is increased by1 unit.
2.221 672 rounded to four digits is 2.222.
4.168 501 rounded to four digits is 4.169.
3. When the first digit discarded is 5 followed byonly zeros, the last digit retained is increased by1 if it is odd, but not changed if it is even.
2.35 rounded to two digits is 2.4.
2.45 rounded to two digits is 2.4.
�6.35 rounded to two digits is �6.4.
Measuring and EstimatingMany people believe that all measurements arereliable (consistent over many trials), precise (to asmany decimal places as possible), and accurate(representing the actual value). There are many thingsthat can go wrong when measuring, however.
• There may be limitations that make theinstrument or its use unreliable (inconsistent).
• The investigator may make a mistake or fail tofollow the correct techniques when reading themeasurement to the available precision (numberof decimal places).
• The instrument may be faulty or inaccurate. Asimilar instrument may give different readings.
For example, when measuring the temperature of aliquid, it is important to keep the thermometer at theproper depth and the bulb of the thermometer awayfrom the bottom and sides of the container. If you sit athermometer with its bulb at the bottom of a liquid-filled container, you will be measuring the temperatureof the bottom of the container and not the temperatureof the liquid. There are similar concerns with othermeasurements.
To be sure that you have measured correctly, youshould repeat your measurements at least three times.
If your measurements appear to be reliable, calculatethe mean and use this value. To be more certain aboutthe accuracy, repeat the measurements with adifferent instrument.
Every measurement is a best estimate of the actualvalue. The measuring instrument and the skill of theinvestigator determine the certainty and the precisionof the measurement. The usual rule is to make ameasurement that estimates between the smallestdivisions on the scale of the instrument.
LogarithmsAny positive number N can be expressed as a power ofsome base b where b > 1. Some obvious examples are
16 = 24 base 2, exponent 425 = 52 base 5, exponent 227 = 33 base 3, exponent 30.001 = 10–3 base 10, exponent –3
In each of these examples, the exponent is an integer.Exponents may be any real number, however, not justan integer. If you use the x y button on your calculator,you can experiment to obtain a better understandingof this concept.
The most common base is base 10. Some examplesfor base 10 are
100.5 = 3.162101.3 = 19.9510�2.7 = 0.001 995
By definition, the exponent to which a base b must beraised to produce a given number N is called thelogarithm of N to base b (abbreviated as logb). Whenthe value of the base is not written, it is assumed to bebase 10. Logarithms to base 10 are called commonlogarithms. We can express the previous examples aslogarithms:
log 3.162 = 0.5log 19.95 = 1.3log 0.001 995 = –2.7
Most measurement scales you have encountered arelinear in nature. For example, a speed of 80 km/h istwice as fast as a speed of 40 km/h and four times asfast as a speed of 20 km/h. However, there are severalexamples in science where the range of values of the

Skills Handbook 467NEL
variable being measured is so great that it is moreconvenient to use a logarithmic scale to base 10. Oneexample of this is the scale for measuring the acidityof a solution (the pH scale). For example, a solutionwith a pH of 3 is 10 times more acidic than a solutionwith a pH of 4 and 100 times (102) more acidic than asolution with a pH of 5. Other situations that uselogarithmic scales are sound intensity (the dB scale)and the intensity of earthquakes (the Richter scale).
Tables and GraphsBoth tables and graphs are used to summarizeinformation and to illustrate patterns or relationships.Preparing tables and graphs requires some knowledgeof accepted practice and some skill in designing thetable or graph to best describe the information.
Tables
1. Write a title that describes the contents or the relationship among the entries in the table.
2. The rows or columns with the controlledvariables and independent variable usuallyprecede the row or column with the dependentvariable.
3. Give each row or column a heading, includingunit symbols in parentheses where necessary.Units are not usually written in the main body ofthe table (Table 3).
vertical (y) axis with the name of thedependent variable.
(c) Include the unit symbols in parentheses oneach axis label: for example, “Time (s).”
2. Assign numbers to the scale on each axis.(a) As a general rule, the points should be spread
out so that at least one-half of the graphpaper is used.
(b) Choose a scale that is easy to read and hasequal divisions. Each division (or square)must represent a small simple number ofunits of the variable: for example, 0.1, 0.2,0.5, or 1.0.
(c) It is not necessary to have the same scale oneach axis or to start a scale at zero.
(d) Do not label every division line on the axis.Scales on graphs are labelled in a way similarto the way scales on rulers are labelled.
3. Plot the points.(a) Locate each point by making a small dot in
pencil. When you have drawn and checkedall the points, draw an X over each point orcircle each point in ink. The size of the circlecan be used to indicate the precision of themeasurement.
(b) Be suspicious of a point that is obviously notpart of the pattern. Double check thelocation of such a point, but do not eliminatethe point from the graph just because it doesnot align with the rest.
4. Draw the best fitting curve.(a) Using a sharp pencil, draw a line that best
represents the trend shown by the collectionof points. Do not force the line to go through
Appendix A
A
Table 3 The Effect of Concentration on Reaction Time
Concentration of HCl(aq) Time for Reaction(mol/L) (s)
2.0 70
1.5 80
1.0 144
0.5 258
Concentration of HCl(aq) (mol/L)
Time (s)
100
200
300
0.5 1.0 2.0
Effect of Concentration on Reaction Time
1.5
Figure 2
Graphs1. Write a title and label the axes (Figure 2).
(a) The title should be at the top of the graph. Astatement of the two variables is often usedas a title: for example, “Solubility versusTemperature for Sodium Chloride.”
(b) Label the horizontal (x) axis with the nameof the independent variable and the

468 Appendix A NEL
each point. Imprecision of experimentalmeasurements may cause some of the pointsto be misaligned.
(b) If the collection of points appears to fall ina straight line, use a ruler to draw the line.Otherwise draw a smooth curve that best represents the pattern of the points.
(c) Since the points are ink and the line is pencil,it is easy to change the position of the line ifyour first curve does not fit the points toyour satisfaction.
Problem Solving in Chemistry:The Factor-Label MethodSolving problems is a basic aspect of working inall sciences, including chemistry. One of thecharacteristics of good chemists is their ability to solve problems. Although there are several differentmethods for solving mathematical problems inchemistry, the factor-label method (also known asdimensional analysis) is one of the most usefulmethods.
The Factor-Label MethodThe factor-label method was developed as a logicaland consistent way of converting a quantity in oneunit into the equivalent quantity in another unit. Forexample, if you are asked to determine how manyseconds there are in 2 min, you might quickly answer,“There are 120 s in 2 min.” If asked to explain youranswer, you might say, “Since there are 60 s in 1 min,there are 2 � 60 s in 2 min, or 120 s.” Notice thatthe solution to the problem is based on the equality1 min = 60 s. Mathematically,
1 min = 60 s2(1 min) = 2(60 s)2 min = 120 s
To solve the same problem using the factor-labelmethod, you determine the required value (the valueyou are asked to find) by multiplying the given valueby a conversion factor.
required value = given value � conversion factor
The conversion factor is an equality that relates theunits of the required value (e.g., seconds) to the unitsof the given value (e.g., minutes). For the equality1 min = 60 s, the conversion factor is obtained bystating the equality in the form of a fraction equalto 1. In this case,
= 1 or = 1
These fractions are equal to 1 because, in both cases,the numerators and denominators are of equal value:60 s is the same length of time as 1 min, and viceversa. All conversion factors equal 1. The onlydifference is that one fraction is inverted whencompared to the other fraction.
The conversion factor you use in the solution to aproblem depends on the units of the given value.Choose the form of the conversion factor whosedenominator has the same units as the given value.Since multiplying by a conversion factor is likemultiplying by 1, only the units change.
Using the factor-label method, how many secondsare in a time (t) of 2 min?
t s in 2 min = 2.0 min �
We chose the conversion factor �16m0
isn
� because the
unit in the denominator of the conversion factor(min) is the same as the unit of the given value (min).By performing the numerical calculation, andcancelling like units in the numerator anddenominator (min), the required value is
t = 2.0 min �
t = 120 s
60 s�1 min
60 s�1 min
60 s�1 min
1 min�60 s
SAMPLE problem
One tablet of a popular antacid medicationcontains 0.25 g of calcium carbonate, CaCO3(s).What mass of calcium carbonate is in 48 tablets?
Step 1: List Given Values
number of tablets = 48mCaCO3(s)
= ?

Skills Handbook 469NEL
Appendix A
AStep 2: State Problem in Form: required value = given value � conversionfactor
mCaCO3(s)= 48 tablets � conversion factor
Step 3: Identify Equality and Two Possible Forms of Conversion Factor
Equality: 1 tablet = 0.25 g CaCO3(s)
Possible conversion factors:
or
Step 4: Substitute Appropriate Conversion Factor into Equation and Solve
In this case, we choose as the conversion factor because the
unit “tablet” in the denominator cancels the unit “tablet” in the given value.
mCaCO3(s)= 48 tablets � conversion factor
= 48 tablets �
mCaCO3(s)= 12 g
Therefore, 12 g of calcium carbonate is needed to make 48 tablets of the antacid.
Example One iron nail contains 2.6 g of iron, Fe(s). How many nails can be made from143 g of iron?
Solution
mFe(s)= 143 g
number of nails = ?
number of nails = 143 g Fe(s) �
number of nails = 55 nails
Therefore, 55 nails can be made from 143 g of iron.
1 nail��2.6 g Fe(s)
0.25 g CaCO3(s)��
1 tablet
0.25 g CaCO3(s)��
1 tablet
0.25 g CaCO3(s)��
1 tablet
1 tablet��0.25 g CaCO3(s)
Practice1. A 2003 Canadian $1 (loonie) coin contains 6.4 g of nickel. How many loonies
can be made with 460.8 g of nickel?
2. A single compact disc (CD) has a mass of 23 g. How many discs are in a575-g package of CDs? (Disregard the packaging material.)
3. A 250-mL cup of corn flakes contains 2.0 g of protein. What mass of proteinis contained in 850 mL of corn flakes?
Answers
1. 72 loonies
2. 25 CDs
3. 6.8 g

470 Appendix A NEL
Using a Bunsen BurnerPractise and memorize the following. Note the safetycaution. You are responsible for your safety and thesafety of others near you.
1. Turn the air and gas adjustments to the offposition (Figure 1).
2. Connect the burner hose to the gas outlet on thebench.
3. Turn the bench gas valve to the fully on position.
4. If you suspect that there may be a gas leak,replace the burner. (Give the leaky burner toyour teacher.)
5. While holding a lit match above and toone side of the barrel, open the burnergas valve until a small yellow flameresults (Figure 2). If a striker is usedinstead of matches, generate sparks overthe top of the barrel (Figure 3).
6. Adjust the air flow to obtain a pale blueflame with a dual cone (Figure 4). For
most Bunsen burners, rotating the barrel adjuststhe air intake. Rotate the barrel slowly. If toomuch air is added, the flame may go out. If thishappens, immediately turn off the gas flow andrelight the burner as outlined in step 5.
7. Adjust the gas valve on the burner to increase ordecrease the height of the blue flame. The hottestpart of the flame is the tip of the inner blue cone.Usually a 5 to 10 cm flame, which just abouttouches the object heated, is used.
A6 Laboratory Skills and Techniques
Figure 2A yellow flame is relativelycool and easier to obtain onlighting.
Figure 3To generate a spark with astriker, pull the side of thehandle containing the flint upand across.
Figure 4A pale blue-violet flame is much hotterthan a yellow flame. The hottest point is atthe tip of the inner blue cone.
barrel
gasvalve
air valve
gas supply
Figure 1The parts of a common Bunsen burner

Skills Handbook 471NEL
8. Bunsen burners, when lit, should not be leftunattended. If the burner is on but not beingused, adjust the air and gas intakes to obtain asmall yellow flame. This flame is more visibleand therefore less likely to cause problems.
Using a Laboratory BalanceA balance is a sensitive instrument that is used tomeasure the mass of an object. There are two types ofbalances: electronic (Figure 5) and mechanical(Figure 6).
• To avoid error due to convection currents in theair, allow hot or cold samples to return to roomtemperature before placing them on the balance.
• Always record masses showing the correctprecision. On a centigram balance, mass ismeasured to the nearest hundredth of a gram(0.01 g).
• When you need to move a balance, hold theinstrument by the base and steady the beam.Never lift a balance by the beams or pans.
• To avoid contaminating a whole bottle of reagent, ascoop should not be placed in the originalcontainer of a chemical. A quantity of the chemicalshould be poured out of the original reagent bottleinto a clean, dry beaker or bottle, from whichsamples can be taken. Another acceptable techniquefor dispensing a small quantity of chemical is torotate or tap the chemical bottle.
Using an Electronic BalanceElectronic balances are sensitive instruments,requiring care in their use. Be gentle when placingobjects on the pan, and remove the pan whencleaning it. Since an electronic balance is sensitive tosmall movements and changes in level, do not lean onthe lab bench.
To use an electronic balance, follow the steps below:
1. Place a container or weighing paper on thebalance.
2. Reset (tare) the balance so the mass of thecontainer registers as zero.
3. Add chemical until the desired mass of chemicalis displayed. The last digit may not be constant,indicating uncertainty due to air currents or thehigh sensitivity of the balance.
4. Remove the container and sample.
Using a Mechanical BalanceThere are different kinds of mechanical balance. Thisgeneral procedure applies to most kinds:
1. Clean and zero the balance. (Turn the zeroadjustment screw so that the beam is balancedwhen the instrument is set to read 0 g and noload is on the pan.)
Appendix A
A
Figure 5An electronic balance
Figure 6On this type of mechanical balance, the sample is balanced bymoving masses on several beams.
Below are some general rules that you shouldfollow when using a balance:
• All balances must be handled carefully and keptclean.
• Always place chemicals into a container, such as abeaker or plastic boat, to avoid contaminationand corrosion of the balance pan.

472 Appendix A NEL
2. Place the container on the pan.
3. Move the largest beam mass one notch at a timeuntil the beam drops. Then move the mass backone notch.
4. Repeat this process with the next smaller mass,and continue until all the masses have beenmoved and the beam is balanced. (If you areusing a dial-type balance, the final step will be toturn the dial until the beam balances.)
5. Record the mass of the container.
6. If you need a specific mass of a substance, set themasses on the beams to correspond to the totalmass of the container plus the desired sample.
7. Add the chemical until the beam is once againbalanced.
8. Remove the sample from the pan, and return allbeam masses to the zero position. (For a dial-typebalance, return the dial to the zero position.)
Using a PipetteA pipette is a specially designed glass tube used tomeasure precise volumes of liquids. There are twotypes of pipettes and a variety of sizes for each type.A volumetric pipette (Figure 7(a)) transfers a fixedvolume, such as 10.00 mL or 25.00 mL, accurate towithin 0.04 mL, for example. A graduated pipette(Figure 7(b)) measures a range of volumes within thelimit of the scale, just as a graduated cylinder does. A10-mL graduated pipette delivers volumes accurate towithin 0.1 mL.
To use a pipette, follow the steps below:
1. Rinse the pipette with small volumes of distilledwater using a wash bottle, and then with thesample solution. A clean pipette has no visibleresidue or liquid drops clinging to the inside wall.Rinsing with aqueous ammonia and scrubbingwith a pipe cleaner might be necessary to cleanthe pipette.
2. Hold the pipette with your thumb and fingersnear the top. Leave your index finger free.
3. Place the pipette in the sample solution, restingthe tip on the bottom of the container ifpossible. Be careful that the tip does not hit thesides of the container.
4. Squeeze the bulb into the palm of your hand, andplace the bulb firmly and squarely on the end ofthe pipette (Figure 8) with your thumb across thetop of the bulb.
Figure 7(a) A volumetric pipette delivers the volume printed on the label
if the temperature is near room temperature.(b) To use a graduated pipette, you must be able to start and
stop the flow of the liquid.
(a) (b)
Figure 8Release the bulb slowly. Pressing down with your thumb placedacross the top of the bulb maintains a good seal. Setting thepipette tip on the bottom slows the rise or fall of the liquid.

Skills Handbook 473NEL
5. Release your grip on the bulb until the liquid hasrisen above the calibration line. (This mayrequire bringing the level up in stages: removethe bulb, put your finger on the pipette, squeezethe air out of the bulb, replace the bulb, andcontinue the procedure.)
6. Remove the bulb, placing your index finger overthe top.
7. Wipe all solution from the outside of the pipetteusing a paper towel.
8. While touching the tip of the pipette to theinside of a waste beaker, gently roll your indexfinger (or rotate the pipette between your thumband fingers) to allow the liquid level to dropuntil the bottom of the meniscus reaches thecalibration line (Figure 9). To avoid parallaxerrors, set the meniscus at eye level. Stop the flowwhen the bottom of the meniscus is on thecalibration line. Use the bulb to raise the level ofthe liquid again if necessary.
9. While holding the pipette vertically, touch thepipette tip to the inside wall of a clean receivingcontainer. Remove your finger or adjust thevalve, and allow the liquid to drain freely untilthe solution stops flowing.
10. Finish by touching the pipette tip to the insideof the container at about a 45° angle (Figure 10).Do not shake the pipette. The delivery pipette iscalibrated to leave a small volume in the tip.
CrystallizationCrystallization is used to separate a solid from asolution by evaporating the solvent or lowering thetemperature. Evaporating the solvent is useful forquantitative analysis of a solution; lowering thetemperature is commonly used to purify and separatea solid whose solubility is temperature-sensitive.Chemicals that have a low boiling point or decomposeon heating cannot be separated by crystallizationusing a heat source. Fractional distillation is analternative design for the separation of a mixture ofliquids.
1. Measure the mass of a clean beaker orevaporating dish.
2. Place a precisely measured volume of thesolution in the container.
3. Set the container aside to evaporate the solutionslowly, or warm the container gently on a hotplate or with a Bunsen burner.
4. When the contents appear dry, measure the massof the container and solid.
5. Heat the solid with a hot plate or burner, cool it,and measure the mass again.
6. Repeat step 5 until the final mass remainsconstant. (Constant mass indicates that all of thesolvent has evaporated.)
Appendix A
A
Figure 9To allow the liquid to drop slowly to the calibration line, it isnecessary for your finger and the pipette top to be dry. Also keepthe tip on the bottom to slow down the flow.
Figure 10A vertical volumetric pipette is drained by gravity, and then the tipis placed against the inside wall of the container. A small volumeis expected to remain in the tip.

474 Appendix A NEL
FiltrationIn filtration, solid is separated from a mixture using aporous filter paper. The more porous papers are calledqualitative filter papers. Quantitative filter papersallow only invisibly small particles through the poresof the paper.
1. Set up a filtration apparatus (Figure 11): stand,funnel holder, filter funnel, waste beaker, washbottle, and a stirring rod with a flat plastic orrubber end for scraping.
2. Fold the filter paper along its diameter, and thenfold it again to form a cone. A better seal of thefilter paper on the funnel is obtained if a smallpiece of the outside corner of the filter paper istorn off (Figure 12).
3. Measure and record the mass of the filter paperafter removing the corner.
4. While holding the open filter paper in thefunnel, wet the entire paper and seal the top edgefirmly against the funnel with the tip of the conecentred in the bottom of the funnel.
5. With the stirring rod touching the spout of thebeaker, decant most of the solution into thefunnel (Figure 13). Transferring the solid toosoon clogs the pores of the filter paper. Keep thelevel of liquid about two-thirds up the height ofthe filter paper. The stirring rod should be rinsedeach time it is removed.
6. When most of the solution has been filtered,pour the remaining solid and solution into thefunnel. Use the wash bottle and the flat end ofthe stirring rod to clean any remaining solidfrom the beaker.
7. Use the wash bottle to rinse the stirring rod andthe beaker.
8. Wash the solid two or three times to ensure thatno solution is left in the filter paper. Direct agentle stream of water around the top of thefilter paper.
9. When the filtrate has stopped dripping from thefunnel, remove the filter paper. Press your thumbagainst the thick (three-fold) side of the filter
(a) (b) (c) (d)
Figure 12To prepare a filter paper, fold it in halftwice and then remove the outsidecorner as shown.
Figure 11The tip of the funnel should touch the inside wall of the collectingbeaker.
Figure 13The separation technique of pouring off clear liquid is calleddecanting. Pouring along the stirring rod prevents drops of liquidfrom going down the outside of the beaker when you stoppouring.

Skills Handbook 475NEL
paper, and slide the paper up the inside of thefunnel.
10. Transfer the filter paper from the funnel onto alabelled watch glass, and unfold the paper to letthe precipitate dry.
11. Determine the mass of the filter paper and dry precipitate.
Preparation of Standard SolutionsLaboratory procedures often call for the use of asolution of specific, precise concentration. Theapparatus that is used to prepare such a solution is avolumetric flask. A meniscus finder is useful in settingthe bottom of the meniscus on the calibration line(Figure 14).
Preparing a Standard Solution from a Solid Reagent
1. Calculate the required mass of solute from thevolume and concentration of the solution.
2. Obtain the required mass of solute in a clean, drybeaker or weighing boat. (Refer to “Using aLaboratory Balance” earlier in this section.)
3. Dissolve the solid in pure water using less thanone-half of the final solution volume.
4. Transfer the solution and all water used to rinsethe equipment into a clean volumetric flask.(The beaker and any other equipment should berinsed two or three times with pure water.)
5. Add pure water, using a medicine dropper forthe final few millilitres while using a meniscusfinder to set the bottom of the meniscus on thecalibration line.
6. Stopper the flask, and mix the solution by slowlyinverting the flask several times.
Preparing a Standard Solution by Dilution
1. Calculate the volume of concentrated reagentrequired.
2. Add approximately one-half of the final volumeof pure water to the volumetric flask.
3. Measure the required volume of stock solutionusing a pipette. (Refer to “Using a Pipette” earlierin this section.)
4. Transfer the stock solution slowly into thevolumetric flask while mixing.
5. Add pure water. Use a medicine dropper and ameniscus finder to set the bottom of themeniscus on the calibration line.
6. Stopper the flask, and mix the solution by slowlyinverting the flask several times.
TitrationTitration is used in the volumetric analysis of asolution of an unknown concentration. Titrationinvolves adding a solution (the titrant) from a buretteto another solution (the sample) in an Erlenmeyerflask until a recognizable endpoint, such as a colourchange, occurs.
1. Rinse the burette with small volumes of distilledwater using a wash bottle. Using a burette funnel,rinse with small volumes of the titrant(Figure 15, on the next page). (If liquid dropletsremain on the sides of the burette after rinsing,scrub the burette with a burette brush. If the tipof the burette is chipped or broken, replace thetip or the whole burette.)
2. Using a small burette funnel, pour the solutioninto the burette until the level is near the top.Open the stopcock for maximum flow to clearany air bubbles from the tip and to bring theliquid level down to the scale.
Appendix A
A
Figure 14Raise the meniscus finder along the back of the neck of thevolumetric flask until the meniscus is outlined as a sharp, blackline against a white background.

476 Appendix A NEL
3 Record the initial burette reading to the nearest0.01 mL. (Estimate the second decimal place.)Avoid parallax errors by reading volumes at eyelevel with the aid of a meniscus finder.
4. Pipette a sample of the solution of unknownconcentration into a clean Erlenmeyer flask.Place a white piece of paper beneath theErlenmeyer flask to make it easier to detectcolour changes.
5. Add an indicator if one is required. Add thesmallest quantity necessary (usually one to twodrops) to produce a noticeable colour change inyour sample.
6. Add the solution from the burette quickly atfirst, and then slowly, drop by drop, near theendpoint (Figure 16). Stop as soon as a drop ofthe titrant produces a permanent colour changein the sample solution. A permanent colourchange is considered to be a noticeable changethat lasts for 10 s after swirling.
7. Record the final burette reading to the nearest0.01 mL.
8. The final burette reading for one trial becomesthe initial burette reading for the next trial. Threetrials with results within 0.02 mL are normallyrequired for a reliable analysis of a solution ofunknown concentration.
9. Drain and rinse the burette with pure water.Store the burette upside down with the stopcockopen.
Diagnostic TestsThe tests described in Table 1 are commonly used todetect the presence of a specific substance. Thousandsmore are possible. All diagnostic tests include a briefprocedure, some expected evidence, and aninterpretation of the evidence obtained. This isconveniently communicated using the format“If [procedure] and [evidence], then [analysis].”
Diagnostic tests can be designed using anycharacteristic property of a substance. For example,diagnostic tests for acids, bases, and neutralsubstances can be specified in terms of the pH valuesof the solutions. For specific chemical reactions,properties of the products that the reactants do nothave (such as the insolubility of a precipitate, theproduction of a gas, or the colour of ions in aqueoussolutions) can be used to design diagnostic tests.
If possible, you should use a control to illustratethat the test does not give the same results with othersubstances. For example, in the test for oxygen,inserting a glowing splint into a test tube thatcontains only air is used to compare the effect of airon the splint with a test tube in which you expectoxygen has been collected.
For a test to be valid, it usually has to be conductedboth before and after a chemical change. Considerthis control when planning your designs andprocedures.
Figure 15A burette should be rinsed with water and then the titrant beforeuse. Use a burette brush only if necessary.
Figure 16Near the endpoint, continuous gentle swirling of the solution isparticularly important.

Skills Handbook 477NEL
Appendix A
ATable 1 Some Standard Diagnostic Tests
Substance Tested Diagnostic Test
water If cobalt(II) chloride paper is exposed to a liquid or vapour, and the paper turns from blue to pink, then water is likely present.
oxygen If a glowing splint is inserted into the test tube, and the splint glows brighter or relights, then oxygen gas is likely present.
hydrogen If a flame is inserted into the test tube, and a squeal or pop is heard, then hydrogen is likely present.
carbon dioxide If the gas is bubbled into a limewater solution, and the limewater turns cloudy, then carbon dioxide is likely present.
halogens If a few millilitres of chlorinated hydrocarbon solvent is added, with shaking, to a solution in a test tube, and the colour of the solvent appears to be• light yellow-green, then chlorine is likely present;• orange, then bromine is likely present;• purple, then iodine is likely present.
acid If strips of blue and red litmus paper are dipped into the solution, and the blue litmus turns red, then an acid is present.
base If strips of blue and red litmus paper are dipped into the solution, and the red litmus turns blue, then a base is present.
neutral solution If strips of blue and red litmus paper are dipped into the solution, and neither changes colour, then only neutral substances are likely present.
neutral ionic solution If a neutral substance is tested for conductivity with a voltmeter or multimeter, and the solution conducts a current, then a neutral ionic substance is likely present.
neutral molecular solution If a neutral solution is tested and does not conduct a current, then a neutral molecular substance is likely present.