appendix a rm 10.9 concentration data and figures for 2,3 ...passaic.sharepointspace.com/public...
TRANSCRIPT

Appendix A RM 10.9 Concentration Data and Figures for
2,3,7,8-TCDD, Mercury, and Total PCBs at Select Depth Intervals

!(
!(
!(!(
!(
!(
!(
!(
!(
!(
!(
!(
!(
!(
!( !(
!(
!(
!( !(
!(
!(
!( !(
!( !(
!( !(
!( !( !(
!(!( !( !(
!( !( !( !(
!( !( !( !(
!( !( !( !(
!( !( !( !( !(
!( !( !( !(!( !(
!( !( !( !( !(
!( !(!(
!(
!(
!(
!(
!(
!(
!(
!(
!(!(
!(
!(!(
!(!(
!(
2008 CLRC-066
2008 CLRC-067
2008 CLRC-1092008 CLRC-110
LPRC12A
LPRH11B
LPRH12B
LPRT11D
LPRT11E
LPRT11F
LPRT11G
LPRT12A
2011 -0301
2011 -03022011 -0303
2011 -0304
2011 9-0305
2011 -0306
2011 -0307
2011 -0308
2011 -0309
2011 -0310
2011 -0311
2011 -0312
2011 -0313
2011 -0314
2011 -0315
2011 -0316
2011 -0317
2011 -0318
2011 -0319
2011 -0320
2011 -0321
2011 -0322
2011 -0323
2011 -0324
2011 -0325
2011 -0326
2011 -0327
2011 -0328
2011 -0329
2011 -0330
2011 -0331
2011 -0332
2011 -0333
2011 -0334
2011 -0335
2011 -0336
2011 -0337
2011 -0338
2011 -0339
2011 -0340
2011 -0341
2011 -0342
2011 -0343
2011 -0344
2011 -0345
2011 -0346
2011 -0347
2011 -0348
2011 -0349
2011 -0350
2011 -0351
2011 -0352
2011 -03532011 -0354
2012 A-03552012 A-0356
2012 A-0357
2012 A-0358
2012 A-0359
2012 A-0360
2012 A-0361
2012 A-0362
2012 A-0363
2012 A-0364
2012 A-03652012 A-0366
2012 A-0367
2012 A-0368
2012 A-0369
2012 CLRC-0481
FIGURE A-1Sampling Locations
RM 10.9 Removal Action Pre-Final Design ReportLower Passaic River Study Area, New Jersey0 100 200 30050 Feet
¯
LEGEND!( 2012 River Mile 10.9 Sediment Investigation Addendum A!( 2012 LRC Supplemental Sampling Program!( 2011 River Mile 10.9 Sediment Investigation!( 2009/2010 Benthic Sediment Sampling!( 2008 Low-resolution Coring Program
Extent of Potentially Exposed Surface SedimentNavigation ChannelRM10.9 Removal AreaRM 10.9 Sediment Deposit Area
Notes:1. Orthophoto: NJGIS, 20072. The Extent of Potentially Exposed Surface Sediment was generated from the -2ft (NGVD29) elevation, which represents the Mean Low Water for this part of the river. The data source was the July 2011 Bathymetry Survey conducted as part of the RM 10.9 Characterization Program (CH2M HILL & AECOM, 2012).
DAY \
\ANTIG
ONE\P
ROJ\L
OWER
PASS
AICRI
VERG
RP\41
2305
LOWE
RPAS
SAIC
FS\G
IS\MA
PFILE
S\RM1
0-9\PF
DR\FI
GA-1_
SAMP
_LOC
S.MXD
ECL
ARK1
11/21
/2012
1:32
:28 PM

!(!(
!(!(
!(
!(!(
!(
!(
!(
!(
!(
!(
!(
!(
!(!(!(
!(!(!(!(!(
!(!(!(!(!(!(
!(!(!(!(!(
!(!(!(!(
!(!(!(!(
!(
!(
!(!(!(
!(!(!(!(
!(!(!(
!(!(
!(
!(!(
!(
!(
!(!(
!(
!(
!(
!(
!(
!(!(
!(
!(
!(
!(
!(
!(
!(
!(
!(
!(
!(
!(
2012 A-03681,070
2012 A-0367203
2012 A-036626,6002012 A-0365
29,000
2012 A-0364171
2012 A-036396.9
2012 A-036280.6
2012 A-03611.7
2012 A-0360111
2012 A-035988.3
2012 A-035819.6
2012 A-03570.42
2012 A-03561.1
2012 A-03555.1
2012 CLRC-048123,200
2011 -0354168
2011 -0353538
2011 -0352150
2011 -035149
2011 -03502,790
2011 -03491,400
2011 -0348459
2011 -034766.5
2011 -0346904
2011 -0345485
2011 -034421,600
2011 -03432,200
2011 -0342369
2011 -034122.4
2011 -034014,200
2011 -03396,600
2011 -03381,530
2011 -03379.5
2011 -033618.4
2011 -033517,100
2011 -033420,900
2011 -03331,400
2011 -033211.2
2011 -033116,400
2011 -03307,005
2011 -03291,070
2011 -0328402
2011 -03279,550
2011 -0304382
2011 -032610,200
2011 -03251,620
2011 -032418.9
2011 -032316,500
2011 -03222,170
2011 -0321677
2011 -032032.2
2011 -031948.3
2011 -03187,080
2011 -0317741
2011 -031612,100
2011 -0315369
2011 -0313316
2011 -03121,200
2011 -03119.12011 -03102,070
2011 -0309394
2011 -0308282
2011 -030738.1
2011 -0306322
2011 9-0305230
2011 -030371.7
2011 -0302267
2011 -0301221
2008 CLRC-110144 2008 CLRC-109
0.47
2008 CLRC-0676,490
2008 CLRC-06631.3
LPRT12A340
LPRT11G6,700
LPRT11E420
LPRT11D130
LPRH12B145
LPRC12A81
2012 A-03697,390
2011 -0314690
LPRT11F140
LPRH11B78
FIGURE A-2a2,3,7,8-TCDD Sediment Concentrations (ng/kg)
0 - 0.5 ft IntervalRM 10.9 Removal Action Pre-Final Design Report
Lower Passaic River Study Area, New Jersey0 100 200 30050 Feet
¯
LEGEND!( Sample Location
Extent of Potentially Exposed Surface SedimentNavigation ChannelRM10.9 Removal AreaRM 10.9 Sediment Deposit Area
Notes:1. Orthophoto: NJGIS, 20072. The Extent of Potentially Exposed Surface Sediment was generated from the -2ft (NGVD29) elevation, which represents the Mean Low Water for this part of the river. The data source was the July 2011 Bathymetry Survey conducted as part of the RM 10.9 Characterization Program (CH2M HILL & AECOM, 2012).
DAY \
\ANTIG
ONE\P
ROJ\L
OWER
PASS
AICRI
VERG
RP\41
2305
LOWE
RPAS
SAIC
FS\G
IS\MA
PFILE
S\RM1
0-9\PF
DR\FI
GA-2A
_237
8TCD
D_SE
D_0-0
5.MXD
ECL
ARK1
11/21
/2012
12:44
:25 PM

!(
!(!(
!(!(
!(
!(
!(
!(
!(
!(
!(
!(
!(!(!(
!(!(!(!(!(
!(!(!(!(!(!(
!(!(!(!(!(
!(!(!(
!(!(!(!(
!(
!(
!(!(!(
!(!(!(!(
!(!(!(
!(!(
!(
!(!(
!(
!(
!(!(
!(
!(
!(
!(
!(
!(!(
!(
!(
!(
!(
!(
2012 A-0368714
2012 A-036616,5002012 A-0365
31,000
2012 A-036325.1
2012 A-0362398
2012 A-03610.72
2012 A-0360515
2012 A-035917.9
2012 A-03587.3
2012 A-03570.1
2012 A-0356<0.126
2012 A-03550.12
2012 CLRC-048135,600
2011 -03546
2011 -035385.9
2011 -0352219
2011 -03514,730
2011 -035018,300
2011 -034918,550
2011 -03481,530
2011 -0347550
2011 -034613,200
2011 -0345890
2011 -034420,700
2011 -034315,700
2011 -03421,300
2011 -034158.2
2011 -034021,700
2011 -033918,800
2011 -03382,790
2011 -0337174
2011 -033618.4
2011 -03353,330
2011 -03349,080
2011 -03336,040
2011 -03317,100
2011 -03302,610
2011 -03291,330
2011 -0328751
2011 -03277,690
2011 -0304393
2011 -0326597
2011 -03251,550
2011 -0324258
2011 -0323321
2011 -03222,845
2011 -0321198
2011 -032081.3
2011 -031924.7
2011 -031820,500
2011 -0317671
2011 -031616,900
2011 -0315655
2011 -0313302
2011 -0312874
2011 -03115.42011 -0310680
2011 -0309559
2011 -0308547
2011 -0307148
2011 -0306585
2011 9-0305270
2011 -0303120
2011 -0302426
2011 -0301210
2008 CLRC-11022.5 2008 CLRC-109
<0.0563
2008 CLRC-06757,200
2008 CLRC-06622.6
2012 A-03691,110
2011 -03144,030
2011 -03321,410
FIGURE A-2b2,3,7,8-TCDD Sediment Concentrations (ng/kg)
0.5 - 1.5 ft IntervalRM 10.9 Removal Action Pre-Final Design Report
Lower Passaic River Study Area, New Jersey0 100 200 30050 Feet
¯
LEGEND!( Sample Location
Extent of Potentially Exposed Surface SedimentNavigation ChannelRM10.9 Removal AreaRM 10.9 Sediment Deposit Area
Notes:1. Orthophoto: NJGIS, 20072. The Extent of Potentially Exposed Surface Sediment was generated from the -2ft (NGVD29) elevation, which represents the Mean Low Water for this part of the river. The data source was the July 2011 Bathymetry Survey conducted as part of the RM 10.9 Characterization Program (CH2M HILL & AECOM, 2012).
DAY \
\ANTIG
ONE\P
ROJ\L
OWER
PASS
AICRI
VERG
RP\41
2305
LOWE
RPAS
SAIC
FS\G
IS\MA
PFILE
S\RM1
0-9\PF
DR\FI
GA-2B
_237
8TCD
D_SE
D_05
-15.M
XD E
CLAR
K1 11
/21/20
12 12
:43:19
PM

!(
!(!(
!(
!(
!(
!(
!(!(!(
!(!(!(!(!(
!(!(!(!(!(!(
!(!(!(!(!(
!(!(!(
!(!(!(!(
!(
!(
!(!(!(
!(!(!(!(
!(!(!(
!(!(
!(
!(!(
!(
!(
!(!(
!(
!(
!(
!(
!(
!(!(
!(
!(
!(
!(
!(
2012 A-03680.012
2012 A-036610.72012 A-0365
6.8
2012 A-03570.0004
2012 A-03560.0002
2012 A-03550.0002
2012 CLRC-04810.55
2011 -03540.056
2011 -03530.51
2011 -03520.66
2011 -035129
2011 -035021.3
2011 -03492.8
2011 -03483
2011 -03470.66
2011 -034621.5
2011 -03457.3
2011 -034420.8
2011 -034329.5
2011 -03424.3
2011 -03410.73
2011 -034021.8
2011 -033920.9
2011 -033821.5
2011 -03373.1
2011 -03360.88
2011 -03350.1
2011 -03340.098
2011 -033328.6
2011 -03310.023
2011 -03300.12
2011 -03298.2
2011 -03285.2
2011 -03271.3
2011 -03043.6
2011 -03260.021
2011 -03254
2011 -03240.79
2011 -03230.007
2011 -032219
2011 -03214.7
2011 -03200.34
2011 -03190.0048
2011 -031828.9
2011 -03174.6
2011 -031616.9
2011 -03153.2
2011 -03131.6
2011 -03126.7
2011 -03110.0912011 -03106.4
2011 -03092.4
2011 -03083.5
2011 -03070.2
2011 -03061.9
2011 9-03051.3
2011 -03031.7
2011 -03021.8
2011 -03011.2
2008 CLRC-1100.35 2008 CLRC-109
0.00004
2008 CLRC-0672.1
2008 CLRC-0661.6
2012 A-03690.16
2011 -031422.8
2011 -03326.4
FIGURE A-2c2,3,7,8-TCDD Sediment Concentrations (ng/kg)
1.5 - 2.5 ft IntervalRM 10.9 Removal Action Pre-Final Design Report
Lower Passaic River Study Area, New Jersey0 100 200 30050 Feet
¯
LEGEND!( Sample Location
Extent of Potentially Exposed Surface SedimentNavigation ChannelRM10.9 Removal AreaRM 10.9 Sediment Deposit Area
Notes:1. Orthophoto: NJGIS, 20072. The Extent of Potentially Exposed Surface Sediment was generated from the -2ft (NGVD29) elevation, which represents the Mean Low Water for this part of the river. The data source was the July 2011 Bathymetry Survey conducted as part of the RM 10.9 Characterization Program (CH2M HILL & AECOM, 2012).
DAY \
\ANTIG
ONE\P
ROJ\L
OWER
PASS
AICRI
VERG
RP\41
2305
LOWE
RPAS
SAIC
FS\G
IS\MA
PFILE
S\RM1
0-9\PF
DR\FI
GA-2C
_237
8TCD
D_SE
D_15
-25.M
XD E
CLAR
K1 11
/21/20
12 12
:44:01
PM

!(
!(
!(
!(
!(!(
!(!(!(!(!(
!(!(!(!(!(!(
!(!(!(!(!(
!(!(!(
!(!(!(!(
!(
!(
!(!(!(
!(!(!(!(
!(!(!(
!(!(
!(
!(!(
!(
!(
!(!(
!(
!(
!(
!(
!(
!(!(
!(
!(
!(
!(
2012 A-03653,280
2012 A-03570.09
2012 A-0356<0.103
2012 A-0355<0.135
2011 -0353<0.0805
2011 -03522.4
2011 -035123,800
2011 -03504,060
2011 -03494.5
2011 -03481,360
2011 -034726.3
2011 -03463,080
2011 -0345219
2011 -034429,800
2011 -034321,100
2011 -0342428
2011 -034131.1
2011 -034011,200
2011 -033927,500
2011 -033818,100
2011 -0337307
2011 -033690.5
2011 -03351.2
2011 -03345.4
2011 -033321,900
2011 -03319.2
2011 -0330<1.33
2011 -032978.1
2011 -0328323
2011 -03274
2011 -03042,435
2011 -0326<1.66
2011 -03253,660
2011 -0324192
2011 -03230.96
2011 -032222,800
2011 -03211,020
2011 -032037.7
2011 -0319<1.43
2011 -031819,100
2011 -0317926
2011 -0316756
2011 -0315732
2011 -0313621
2011 -03121,010
2011 -03115902011 -0310817
2011 -03091,890
2011 -0308380
2011 -0307873
2011 -0306712
2011 9-0305638
2011 -030384.1
2011 -03021,790
2011 -0301711
2008 CLRC-11029.4 2008 CLRC-109
<0.0282
2008 CLRC-06714.4
2008 CLRC-06633.8
2011 -031417,850
2011 -0332782
FIGURE A-2d2,3,7,8-TCDD Sediment Concentrations (ng/kg)
2.5 - 3.5 ft IntervalRM 10.9 Removal Action Pre-Final Design Report
Lower Passaic River Study Area, New Jersey0 100 200 30050 Feet
¯
LEGEND!( Sample Location
Extent of Potentially Exposed Surface SedimentNavigation ChannelRM10.9 Removal AreaRM 10.9 Sediment Deposit Area
Notes:1. Orthophoto: NJGIS, 20072. The Extent of Potentially Exposed Surface Sediment was generated from the -2ft (NGVD29) elevation, which represents the Mean Low Water for this part of the river. The data source was the July 2011 Bathymetry Survey conducted as part of the RM 10.9 Characterization Program (CH2M HILL & AECOM, 2012).
DAY \
\ANTIG
ONE\P
ROJ\L
OWER
PASS
AICRI
VERG
RP\41
2305
LOWE
RPAS
SAIC
FS\G
IS\MA
PFILE
S\RM1
0-9\PF
DR\FI
GA-2D
_237
8TCD
D_SE
D_25
-35.M
XD E
CLAR
K1 11
/21/20
12 12
:45:27
PM

!(!(
!(!(
!(
!(!(
!(
!(
!(
!(
!(
!(
!(
!(
!(!(!(
!(!(!(!(!(
!(!(!(!(!(!(
!(!(!(!(!(
!(!(!(
!(!(!(!(
!(
!(
!(!(!(
!(!(!(!(
!(!(!(
!(!(
!(
!(!(
!(
!(
!(!(
!(
!(
!(
!(
!(
!(!(
!(
!(
!(
!(
!(
!(
!(
!(
!(
!(
!(
!(
!(
2012 A-03683.3
2012 A-03672
2012 A-03669.72012 A-0365
10.6
2012 A-03640.34
2012 A-03630.46
2012 A-03620.35
2012 A-03610.025
2012 A-03600.53
2012 A-03590.24
2012 A-03580.14
2012 A-03570.024
2012 A-03560.04
2012 A-03550.13
2012 CLRC-048111.8
2011 -03543.3
2011 -03534.7
2011 -03520.79
2011 -03510.17
2011 -03502.7
2011 -03496.5
2011 -03485.8
2011 -03471.2
2011 -03463.5
2011 -03451.6
2011 -034420.9
2011 -03434.2
2011 -03421.7
2011 -03410.22
2011 -034016.4
2011 -033910.8
2011 -03389
2011 -03370.16
2011 -03360.12
2011 -033515.1
2011 -033420.1
2011 -033317.9
2011 -033113.7
2011 -03306.5
2011 -032921.5
2011 -03280.59
2011 -03279.4
2011 -03042
2011 -03268.8
2011 -032519.4
2011 -03240.2
2011 -03238.7
2011 -03225
2011 -03211.3
2011 -03200.37
2011 -03190.22
2011 -03187.9
2011 -03171.8
2011 -031618.7
2011 -03152.2
2011 -03131.9
2011 -03124.2
2011 -03110.22011 -03104.2
2011 -03092.2
2011 -03081.8
2011 -03070.34
2011 -03062.1
2011 9-03052.1
2011 -03030.54
2011 -03021.5
2011 -03011.4
2008 CLRC-1100.37 2008 CLRC-109
0.12
2008 CLRC-0672.6
2008 CLRC-0660.12
LPRT12A1.8
LPRT11G5.8
LPRT11E2.1
LPRT11D0.92
LPRH12B0.78
LPRC12A1.1
2012 A-03698.6
2011 -03143
LPRT11F1.8
LPRH11B0.3
2011 -03320.13
FIGURE A-3aMercury Sediment Concentrations (mg/kg)
0 - 0.5 ft IntervalRM 10.9 Removal Action Pre-Final Design Report
Lower Passaic River Study Area, New Jersey0 100 200 30050 Feet
¯
LEGEND!( Sample Location
Extent of Potentially Exposed Surface SedimentNavigation ChannelRM10.9 Removal AreaRM 10.9 Sediment Deposit Area
Notes:1. Orthophoto: NJGIS, 20072. The Extent of Potentially Exposed Surface Sediment was generated from the -2ft (NGVD29) elevation, which represents the Mean Low Water for this part of the river. The data source was the July 2011 Bathymetry Survey conducted as part of the RM 10.9 Characterization Program (CH2M HILL & AECOM, 2012).
DAY \
\ANTIG
ONE\P
ROJ\L
OWER
PASS
AICRI
VERG
RP\41
2305
LOWE
RPAS
SAIC
FS\G
IS\MA
PFILE
S\RM1
0-9\PF
DR\FI
GA-3A
_HG_
SED_
0-05.M
XD E
CLAR
K1 11
/21/20
12 12
:45:55
PM

!(
!(!(
!(!(
!(
!(
!(
!(
!(
!(
!(
!(
!(!(!(
!(!(!(!(!(
!(!(!(!(!(!(
!(!(!(!(!(
!(!(!(
!(!(!(!(
!(
!(
!(!(!(
!(!(!(!(
!(!(!(
!(!(
!(
!(!(
!(
!(
!(!(
!(
!(
!(
!(
!(
!(!(
!(
!(
!(
!(
!(
2012 A-03681.9
2012 A-03668.42012 A-0365
11.9
2012 A-03630.23
2012 A-03620.92
2012 A-03610.015
2012 A-03601.2
2012 A-03591.2
2012 A-03580.095
2012 A-03570.014
2012 A-03560.013
2012 A-03550.038
2012 CLRC-048113
2011 -03542.6
2011 -03532.7
2011 -03522.9
2011 -03514.3
2011 -035011.2
2011 -03499.8
2011 -03487.5
2011 -03472.9
2011 -034613.4
2011 -03455.8
2011 -034418.3
2011 -034316.6
2011 -034210.4
2011 -03410.32
2011 -034020
2011 -033915.6
2011 -03387.4
2011 -03370.71
2011 -03360.14
2011 -03355.7
2011 -03347.3
2011 -03338.6
2011 -03314.9
2011 -03303.7
2011 -032917
2011 -03283
2011 -03276.3
2011 -03043.1
2011 -03263.8
2011 -03258.3
2011 -03241.8
2011 -03232
2011 -03225.5
2011 -03211
2011 -03200.63
2011 -03191.1
2011 -031819.3
2011 -03174.7
2011 -031618.4
2011 -03152.9
2011 -03131.8
2011 -03126.8
2011 -03110.152011 -03107.6
2011 -03093.4
2011 -03084.3
2011 -03073.2
2011 -03062.6
2011 9-03052.1
2011 -03031.7
2011 -03022.4
2011 -03011.4
2008 CLRC-1100.65 2008 CLRC-109
0.036
2008 CLRC-06719
2008 CLRC-0660.17
2012 A-03691
2011 -03145
2011 -03327.4
FIGURE A-3bMercury Sediment Concentrations (mg/kg)
0.5 - 1.5 ft IntervalRM 10.9 Removal Action Pre-Final Design Report
Lower Passaic River Study Area, New Jersey0 100 200 30050 Feet
¯
LEGEND!( Sample Location
Extent of Potentially Exposed Surface SedimentNavigation ChannelRM10.9 Removal AreaRM 10.9 Sediment Deposit Area
Notes:1. Orthophoto: NJGIS, 20072. The Extent of Potentially Exposed Surface Sediment was generated from the -2ft (NGVD29) elevation, which represents the Mean Low Water for this part of the river. The data source was the July 2011 Bathymetry Survey conducted as part of the RM 10.9 Characterization Program (CH2M HILL & AECOM, 2012).
DAY \
\ANTIG
ONE\P
ROJ\L
OWER
PASS
AICRI
VERG
RP\41
2305
LOWE
RPAS
SAIC
FS\G
IS\MA
PFILE
S\RM1
0-9\PF
DR\FI
GA-3B
_HG_
SED_
05-15
.MXD
ECL
ARK1
11/21
/2012
12:46
:27 PM

!(
!(!(
!(
!(
!(
!(
!(!(!(
!(!(!(!(!(
!(!(!(!(!(!(
!(!(!(!(!(
!(!(!(
!(!(!(!(
!(
!(
!(!(!(
!(!(!(!(
!(!(!(
!(!(
!(
!(!(
!(
!(
!(!(
!(
!(
!(
!(
!(
!(!(
!(
!(
!(
!(
!(
2012 A-03680.11
2012 A-036611.62012 A-0365
6.4
2012 A-03570.017
2012 A-03560.011
2012 A-03550.0058
2012 CLRC-04814.1
2011 -03544.1
2011 -03534.3
2011 -03523.3
2011 -035124
2011 -035013
2011 -03493.5
2011 -03483
2011 -03470.29
2011 -034610.8
2011 -034512.1
2011 -034412.6
2011 -034319.5
2011 -03425.9
2011 -03410.45
2011 -034013.2
2011 -033912.6
2011 -033817.7
2011 -03375
2011 -03361.8
2011 -03351.1
2011 -03340.13
2011 -033317.3
2011 -03311.2
2011 -03302.3
2011 -03298.5
2011 -03289.7
2011 -03274.3
2011 -03042.7
2011 -03260.073
2011 -03253.6
2011 -03241
2011 -03230.023
2011 -032212.8
2011 -03216.1
2011 -03200.4
2011 -03193.4
2011 -031814.4
2011 -03177.9
2011 -031610.8
2011 -03155.2
2011 -03131.9
2011 -031212
2011 -03110.192011 -031013
2011 -03092.9
2011 -03085.7
2011 -03070.42
2011 -03062.6
2011 9-03051.9
2011 -03032.7
2011 -03022.5
2011 -03011.6
2008 CLRC-1100.52 2008 CLRC-109
0.025
2008 CLRC-0675.1
2008 CLRC-0660.4
2012 A-03692.4
2011 -031418.9
2011 -033214
FIGURE A-3cMercury Sediment Concentrations (mg/kg)
1.5 - 2.5 ft IntervalRM 10.9 Removal Action Pre-Final Design Report
Lower Passaic River Study Area, New Jersey0 100 200 30050 Feet
¯
LEGEND!( Sample Location
Extent of Potentially Exposed Surface SedimentNavigation ChannelRM10.9 Removal AreaRM 10.9 Sediment Deposit Area
Notes:1. Orthophoto: NJGIS, 20072. The Extent of Potentially Exposed Surface Sediment was generated from the -2ft (NGVD29) elevation, which represents the Mean Low Water for this part of the river. The data source was the July 2011 Bathymetry Survey conducted as part of the RM 10.9 Characterization Program (CH2M HILL & AECOM, 2012).
DAY \
\ANTIG
ONE\P
ROJ\L
OWER
PASS
AICRI
VERG
RP\41
2305
LOWE
RPAS
SAIC
FS\G
IS\MA
PFILE
S\RM1
0-9\PF
DR\FI
GA-3C
_HG_
SED_
15-25
.MXD
ECL
ARK1
11/21
/2012
12:46
:48 PM
!(
!(
!(
!(
!(!(
!(!(!(!(!(
!(!(!(!(!(!(
!(!(!(!(!(
!(!(!(
!(!(!(!(
!(
!(
!(!(!(
!(!(!(!(
!(!(!(
!(!(
!(
!(!(
!(
!(
!(!(
!(
!(
!(
!(
!(
!(!(
!(
!(
!(
!(
2012 A-036514.7
2012 A-03570.014
2012 A-03560.011
2012 A-03550.0084
2011 -03537.1
2011 -03523.3
2011 -035115.5
2011 -035014.8
2011 -03494.6
2011 -03486.4
2011 -03472.3
2011 -03463.2
2011 -03452.2
2011 -034417.1
2011 -034310.5
2011 -03421.4
2011 -03412.9
2011 -03407.7
2011 -033915.4
2011 -033819.1
2011 -03372.5
2011 -03360.43
2011 -03350.0078
2011 -03340.0092
2011 -033316
2011 -03310.021
2011 -03300.42
2011 -03298.6
2011 -03281.5
2011 -03273.1
2011 -03042.3
2011 -03260.012
2011 -03256
2011 -03242
2011 -03230.0094
2011 -032214.4
2011 -032112.9
2011 -03200.39
2011 -03190.017
2011 -03188.5
2011 -031715.8
2011 -03165.6
2011 -03156.1
2011 -03136
2011 -03125.2
2011 -03110.372011 -03103.9
2011 -03096
2011 -03082
2011 -03072.3
2011 -030610
2011 9-03054.5
2011 -03030.69
2011 -03024
2011 -03013.3
2008 CLRC-1100.38 2008 CLRC-109
0.039
2008 CLRC-0670.19
2008 CLRC-0660.98
2011 -031414
2011 -03323.1
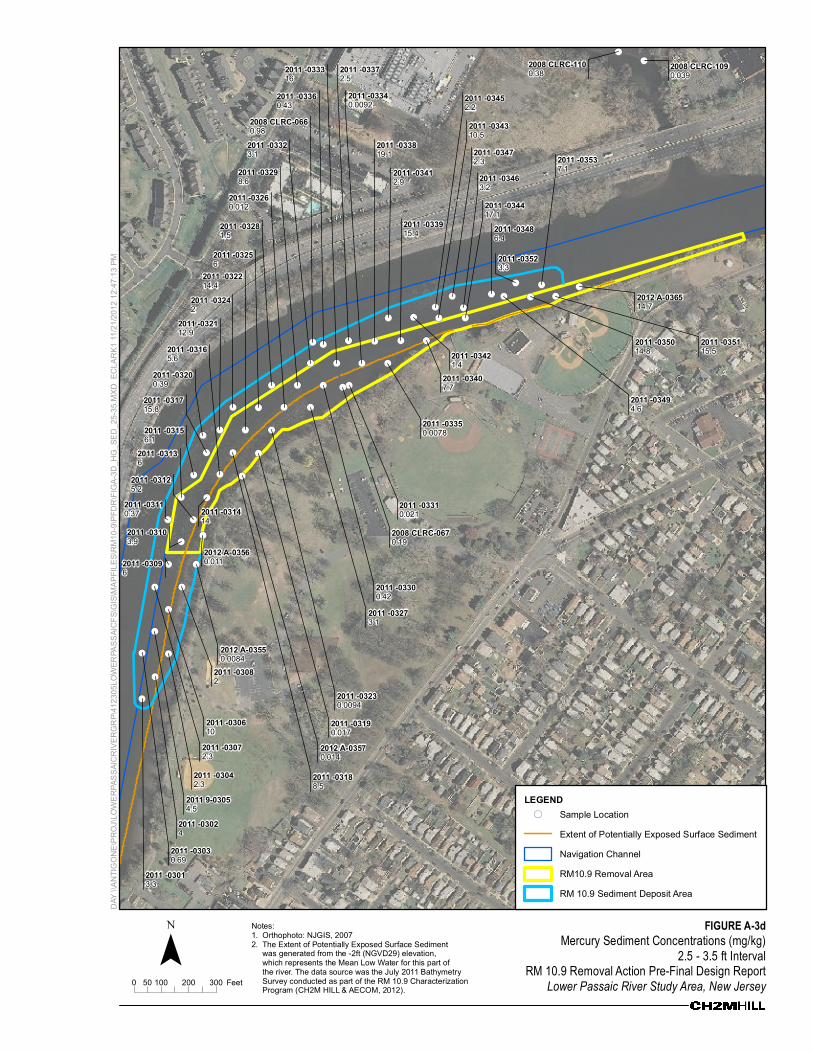
FIGURE A-3dMercury Sediment Concentrations (mg/kg)
2.5 - 3.5 ft IntervalRM 10.9 Removal Action Pre-Final Design Report
Lower Passaic River Study Area, New Jersey0 100 200 30050 Feet
¯
LEGEND!( Sample Location
Extent of Potentially Exposed Surface SedimentNavigation ChannelRM10.9 Removal AreaRM 10.9 Sediment Deposit Area
Notes:1. Orthophoto: NJGIS, 20072. The Extent of Potentially Exposed Surface Sediment was generated from the -2ft (NGVD29) elevation, which represents the Mean Low Water for this part of the river. The data source was the July 2011 Bathymetry Survey conducted as part of the RM 10.9 Characterization Program (CH2M HILL & AECOM, 2012).
DAY \
\ANTIG
ONE\P
ROJ\L
OWER
PASS
AICRI
VERG
RP\41
2305
LOWE
RPAS
SAIC
FS\G
IS\MA
PFILE
S\RM1
0-9\PF
DR\FI
GA-3D
_HG_
SED_
25-35
.MXD
ECL
ARK1
11/21
/2012
12:47
:13 PM

!(!(
!(!(
!(
!(!(
!(
!(
!(
!(
!(
!(
!(
!(
!(!(!(
!(!(!(!(!(
!(!(!(!(!(!(
!(!(!(!(!(
!(!(!(
!(!(!(!(
!(
!(
!(!(!(
!(!(!(!(
!(!(!(
!(!(
!(
!(!(
!(
!(
!(!(
!(
!(
!(
!(
!(
!(!(
!(
!(
!(
!(
!(
!(
!(
!(
!(
!(
!(
!(
!(
2012 A-03685.7
2012 A-03671.6
2012 A-036622.42012 A-0365
22.7
2012 A-03640.13
2012 A-03630.24
2012 A-03620.25
2012 A-03610.0041
2012 A-03600.31
2012 A-03590.16
2012 A-03580.027
2012 A-03570.0018
2012 A-03560.0072
2012 A-03550.026
2012 CLRC-048116.4
2011 -03540.61
2011 -03532.3
2011 -03520.43
2011 -03510.22
2011 -03503.7
2011 -03494.4
2011 -03483.2
2011 -03470.28
2011 -03462.7
2011 -03450.91
2011 -034433.9
2011 -03434.6
2011 -03421.2
2011 -03410.1
2011 -034020.1
2011 -033913.2
2011 -03385.4
2011 -03370.05
2011 -03360.12
2011 -033520.2
2011 -033430.8
2011 -03337.2
2011 -033122
2011 -033011.2
2011 -03298.5
2011 -03280.44
2011 -032714.2
2011 -03041.4
2011 -032615.3
2011 -03258.3
2011 -03240.12
2011 -032313.6
2011 -03227.3
2011 -03210.91
2011 -03200.24
2011 -03190.042
2011 -031810.9
2011 -03171.2
2011 -031620.7
2011 -03151.8
2011 -03131.4
2011 -03123.3
2011 -03110.042011 -03103.1
2011 -03091.6
2011 -03081.3
2011 -03070.11
2011 -03061.4
2011 9-03050.97
2011 -03030.5
2011 -03020.95
2011 -03010.92
2008 CLRC-1100.23 2008 CLRC-109
0.0032
2008 CLRC-0671.7
2008 CLRC-0660.11
LPRT12A1.2
LPRT11G8.9
LPRT11E1.2
LPRT11D0.45
LPRH12B0.52
LPRC12A0.54
2012 A-036915.3
2011 -03142.3
LPRT11F0.25
LPRH11B0.17
2011 -03320.082
FIGURE A-4aTotal PCB Congeners Sediment Concentrations (mg/kg)
0 - 0.5 ft IntervalRM 10.9 Removal Action Pre-Final Design Report
Lower Passaic River Study Area, New Jersey0 100 200 30050 Feet
¯
LEGEND!( Sample Location
Extent of Potentially Exposed Surface SedimentNavigation ChannelRM10.9 Removal AreaRM 10.9 Sediment Deposit Area
Notes:1. Orthophoto: NJGIS, 20072. The Extent of Potentially Exposed Surface Sediment was generated from the -2ft (NGVD29) elevation, which represents the Mean Low Water for this part of the river. The data source was the July 2011 Bathymetry Survey conducted as part of the RM 10.9 Characterization Program (CH2M HILL & AECOM, 2012).
DAY \
\ANTIG
ONE\P
ROJ\L
OWER
PASS
AICRI
VERG
RP\41
2305
LOWE
RPAS
SAIC
FS\G
IS\MA
PFILE
S\RM1
0-9\PF
DR\FI
GA-4A
_PCB
_SED
_0-05
.MXD
ECL
ARK1
11/21
/2012
12:47
:37 PM

!(
!(!(
!(!(
!(
!(
!(
!(
!(
!(
!(
!(
!(!(!(
!(!(!(!(!(
!(!(!(!(!(!(
!(!(!(!(!(
!(!(!(
!(!(!(!(
!(
!(
!(!(!(
!(!(!(!(
!(!(!(
!(!(
!(
!(!(
!(
!(
!(!(
!(
!(
!(
!(
!(
!(!(
!(
!(
!(
!(
!(
2012 A-03682.2
2012 A-036615.82012 A-0365
28.8
2012 A-03630.083
2012 A-03621.1
2012 A-03610.0027
2012 A-03600.42
2012 A-03590.018
2012 A-03580.02
2012 A-03570.002
2012 A-03560.0005
2012 A-03550.0005
2012 CLRC-048124.3
2011 -03540.18
2011 -03530.49
2011 -03521.3
2011 -03514
2011 -035024.1
2011 -034918.5
2011 -03485.7
2011 -03471.7
2011 -034617.1
2011 -03453.7
2011 -034428.1
2011 -034329.8
2011 -03425.1
2011 -03410.19
2011 -034035.2
2011 -033925.3
2011 -03387
2011 -03370.42
2011 -03360.15
2011 -03357.5
2011 -033410
2011 -033311.6
2011 -03316.1
2011 -03303.7
2011 -03297
2011 -03281.8
2011 -03279.2
2011 -03042
2011 -03261.4
2011 -03257.3
2011 -03241.1
2011 -03230.69
2011 -03227.7
2011 -03211.1
2011 -03200.51
2011 -03190.089
2011 -031826.9
2011 -03172.3
2011 -031626.4
2011 -03152.1
2011 -03131.4
2011 -03124.9
2011 -03110.0342011 -03104.6
2011 -03092.3
2011 -03084
2011 -03071.2
2011 -03061.7
2011 9-03051.2
2011 -03030.42
2011 -03021.6
2011 -03010.93
2008 CLRC-1100.32 2008 CLRC-109
0.0001
2008 CLRC-06718
2008 CLRC-0660.94
2012 A-03694
2011 -03147.1
2011 -03324.3
FIGURE A-4bTotal PCB Congeners Sediment Concentrations (mg/kg)
0.5 - 1.5 ft IntervalRM 10.9 Removal Action Pre-Final Design Report
Lower Passaic River Study Area, New Jersey0 100 200 30050 Feet
¯
LEGEND!( Sample Location
Extent of Potentially Exposed Surface SedimentNavigation ChannelRM10.9 Removal AreaRM 10.9 Sediment Deposit Area
Notes:1. Orthophoto: NJGIS, 20072. The Extent of Potentially Exposed Surface Sediment was generated from the -2ft (NGVD29) elevation, which represents the Mean Low Water for this part of the river. The data source was the July 2011 Bathymetry Survey conducted as part of the RM 10.9 Characterization Program (CH2M HILL & AECOM, 2012).
DAY \
\ANTIG
ONE\P
ROJ\L
OWER
PASS
AICRI
VERG
RP\41
2305
LOWE
RPAS
SAIC
FS\G
IS\MA
PFILE
S\RM1
0-9\PF
DR\FI
GA-4B
_PCB
_SED
_05-1
5.MXD
ECL
ARK1
11/21
/2012
12:47
:58 PM

!(
!(!(
!(
!(
!(
!(
!(!(!(
!(!(!(!(!(
!(!(!(!(!(!(
!(!(!(!(!(
!(!(!(
!(!(!(!(
!(
!(
!(!(!(
!(!(!(!(
!(!(!(
!(!(
!(
!(!(
!(
!(
!(!(
!(
!(
!(
!(
!(
!(!(
!(
!(
!(
!(
!(
2012 A-03680.012
2012 A-036610.72012 A-0365
6.8
2012 A-03570.0004
2012 A-03560.0002
2012 A-03550.0002
2012 CLRC-04810.55
2011 -03540.056
2011 -03530.51
2011 -03520.66
2011 -035129
2011 -035021.3
2011 -03492.8
2011 -03483
2011 -03470.66
2011 -034621.5
2011 -03457.3
2011 -034420.8
2011 -034329.5
2011 -03424.3
2011 -03410.73
2011 -034021.8
2011 -033920.9
2011 -033821.5
2011 -03373.1
2011 -03360.88
2011 -03350.1
2011 -03340.098
2011 -033328.6
2011 -03310.023
2011 -03300.12
2011 -03298.2
2011 -03285.2
2011 -03271.3
2011 -03043.6
2011 -03260.021
2011 -03254
2011 -03240.79
2011 -03230.007
2011 -032219
2011 -03214.7
2011 -03200.34
2011 -03190.0048
2011 -031828.9
2011 -03174.6
2011 -031616.9
2011 -03153.2
2011 -03131.6
2011 -03126.7
2011 -03110.0912011 -03106.4
2011 -03092.4
2011 -03083.5
2011 -03070.2
2011 -03061.9
2011 9-03051.3
2011 -03031.7
2011 -03021.8
2011 -03011.2
2008 CLRC-1100.35 2008 CLRC-109
0.00004
2008 CLRC-0672.1
2008 CLRC-0661.6
2012 A-03690.16
2011 -031422.8
2011 -03326.4
FIGURE A-4cTotal PCB Congeners Sediment Concentrations (mg/kg)
1.5 - 2.5 ft IntervalRM 10.9 Removal Action Pre-Final Design Report
Lower Passaic River Study Area, New Jersey0 100 200 30050 Feet
¯
LEGEND!( Sample Location
Extent of Potentially Exposed Surface SedimentNavigation ChannelRM10.9 Removal AreaRM 10.9 Sediment Deposit Area
Notes:1. Orthophoto: NJGIS, 20072. The Extent of Potentially Exposed Surface Sediment was generated from the -2ft (NGVD29) elevation, which represents the Mean Low Water for this part of the river. The data source was the July 2011 Bathymetry Survey conducted as part of the RM 10.9 Characterization Program (CH2M HILL & AECOM, 2012).
DAY \
\ANTIG
ONE\P
ROJ\L
OWER
PASS
AICRI
VERG
RP\41
2305
LOWE
RPAS
SAIC
FS\G
IS\MA
PFILE
S\RM1
0-9\PF
DR\FI
GA-4C
_PCB
_SED
_15-2
5.MXD
ECL
ARK1
11/21
/2012
12:48
:28 PM

!(
!(
!(
!(
!(!(
!(!(!(!(!(
!(!(!(!(!(!(
!(!(!(!(!(
!(!(!(
!(!(!(!(
!(
!(
!(!(!(
!(!(!(!(
!(!(!(
!(!(
!(
!(!(
!(
!(
!(!(
!(
!(
!(
!(
!(
!(!(
!(
!(
!(
!(
2012 A-03652.7
2012 A-03570.0004
2012 A-03560.0009
2012 A-03550.0001
2011 -03530.039
2011 -03520.053
2011 -035123.2
2011 -03508.8
2011 -03490.53
2011 -03482.4
2011 -03470.29
2011 -03463.5
2011 -03451.2
2011 -034420.4
2011 -034318
2011 -03421.1
2011 -03410.41
2011 -034011.5
2011 -033922
2011 -033828.4
2011 -03371.2
2011 -03360.59
2011 -03350.0017
2011 -03340.0061
2011 -033324.7
2011 -03310.0079
2011 -03300.0036
2011 -03292.5
2011 -03281.1
2011 -03270.076
2011 -03043.1
2011 -03260.0008
2011 -03259.2
2011 -03241.2
2011 -03230.0009
2011 -032224.9
2011 -03215.9
2011 -03200.41
2011 -03190.0001
2011 -031818
2011 -03176.6
2011 -03168
2011 -03157.3
2011 -03133.3
2011 -031210.7
2011 -03111.62011 -03108.7
2011 -03094.6
2011 -03083.9
2011 -03072.1
2011 -03065.9
2011 9-03052.5
2011 -03030.72
2011 -03024.7
2011 -03012.4
2008 CLRC-1100.46 2008 CLRC-109
0.0001
2008 CLRC-0670.013
2008 CLRC-0660.38
2011 -031424.9
2011 -03323.3
FIGURE A-4dTotal PCB Congeners Sediment Concentrations (mg/kg)
2.5 - 3.5 ft IntervalRM 10.9 Removal Action Pre-Final Design Report
Lower Passaic River Study Area, New Jersey0 100 200 30050 Feet
¯
LEGEND!( Sample Location
Extent of Potentially Exposed Surface SedimentNavigation ChannelRM10.9 Removal AreaRM 10.9 Sediment Deposit Area
Notes:1. Orthophoto: NJGIS, 20072. The Extent of Potentially Exposed Surface Sediment was generated from the -2ft (NGVD29) elevation, which represents the Mean Low Water for this part of the river. The data source was the July 2011 Bathymetry Survey conducted as part of the RM 10.9 Characterization Program (CH2M HILL & AECOM, 2012).
DAY \
\ANTIG
ONE\P
ROJ\L
OWER
PASS
AICRI
VERG
RP\41
2305
LOWE
RPAS
SAIC
FS\G
IS\MA
PFILE
S\RM1
0-9\PF
DR\FI
GA-4D
_PCB
_SED
_25-3
5.MXD
ECL
ARK1
11/21
/2012
12:48
:50 PM

Page 1 of 3
TABLE A-1RM 10.9 Sampling ProgramsRM 10.9 Pre-Final Design Report, Lower Passaic River Study Area, New Jersey
Sample Location Sampling Program River Mile East Coordinate North Coordinate
2008 CLRC-066 2008 Low-resolution Coring Program 10.96 593072 7233312008 CLRC-067 2008 Low-resolution Coring Program 10.95 593181 7231662008 CLRC-109 2008 Low-resolution Coring Program 11.23 594283.286 724359.7832008 CLRC-110 2008 Low-resolution Coring Program 11.21 594190.0325 724391.692011 RM10.9-0301 2011 River Mile 10.9 Sediment Investigation 10.67 592448 7220272011 RM10.9-0302 2011 River Mile 10.9 Sediment Investigation 10.69 592496 7221082011 RM10.9-0303 2011 River Mile 10.9 Sediment Investigation 10.7 592448 7221942011 RM10.9-0304 2011 River Mile 10.9 Sediment Investigation 10.71 592545 7221922011 RM10.9-0305 2011 River Mile 10.9 Sediment Investigation 10.72 592494 7222732011 RM10.9-0306 2011 River Mile 10.9 Sediment Investigation 10.74 592545 7223542011 RM10.9-0307 2011 River Mile 10.9 Sediment Investigation 10.75 592494 7224362011 RM10.9-0308 2011 River Mile 10.9 Sediment Investigation 10.76 592593 7224362011 RM10.9-0309 2011 River Mile 10.9 Sediment Investigation 10.77 592545 7225192011 RM10.9-0310 2011 River Mile 10.9 Sediment Investigation 10.79 592591 7226012011 RM10.9-0311 2011 River Mile 10.9 Sediment Investigation 10.8 592542 7226822011 RM10.9-0312 2011 River Mile 10.9 Sediment Investigation 10.8 592635 7226822011 RM10.9-0313 2011 River Mile 10.9 Sediment Investigation 10.82 592591 7227642011 RM10.9-0314 2011 River Mile 10.9 Sediment Investigation 10.82 592685 7227622011 RM10.9-0315 2011 River Mile 10.9 Sediment Investigation 10.83 592637 7228452011 RM10.9-0316 2011 River Mile 10.9 Sediment Investigation 10.84 592732 7228472011 RM10.9-0317 2011 River Mile 10.9 Sediment Investigation 10.85 592683 7229272011 RM10.9-0318 2011 River Mile 10.9 Sediment Investigation 10.86 592780 7229272011 RM10.9-0319 2011 River Mile 10.9 Sediment Investigation 10.87 592873 7229252011 RM10.9-0320 2011 River Mile 10.9 Sediment Investigation 10.86 592671 7229902011 RM10.9-0321 2011 River Mile 10.9 Sediment Investigation 10.87 592732 7230102011 RM10.9-0322 2011 River Mile 10.9 Sediment Investigation 10.88 592826 7230102011 RM10.9-0323 2011 River Mile 10.9 Sediment Investigation 10.89 592921 7230102011 RM10.9-0324 2011 River Mile 10.9 Sediment Investigation 10.89 592780 7230932011 RM10.9-0325 2011 River Mile 10.9 Sediment Investigation 10.9 592873 7230912011 RM10.9-0326 2011 River Mile 10.9 Sediment Investigation 10.91 592967 7230932011 RM10.9-0327 2011 River Mile 10.9 Sediment Investigation 10.93 593064 723093

Page 2 of 3
TABLE A-1RM 10.9 Sampling ProgramsRM 10.9 Pre-Final Design Report, Lower Passaic River Study Area, New Jersey
Sample Location Sampling Program River Mile East Coordinate North Coordinate
2011 RM10.9-0328 2011 River Mile 10.9 Sediment Investigation 10.91 592921 7231732011 RM10.9-0329 2011 River Mile 10.9 Sediment Investigation 10.93 593016 7231732011 RM10.9-0330 2011 River Mile 10.9 Sediment Investigation 10.94 593110 7231732011 RM10.9-0331 2011 River Mile 10.9 Sediment Investigation 10.96 593205 7231732011 RM10.9-0332 2011 River Mile 10.9 Sediment Investigation 10.95 593064 7232542011 RM10.9-0333 2011 River Mile 10.9 Sediment Investigation 10.96 593159 7232542011 RM10.9-0334 2011 River Mile 10.9 Sediment Investigation 10.98 593251 7232542011 RM10.9-0335 2011 River Mile 10.9 Sediment Investigation 10.99 593346 7232542011 RM10.9-0336 2011 River Mile 10.9 Sediment Investigation 10.96 593110 7233222011 RM10.9-0337 2011 River Mile 10.9 Sediment Investigation 10.98 593203 7233362011 RM10.9-0338 2011 River Mile 10.9 Sediment Investigation 10.99 593298 7233342011 RM10.9-0339 2011 River Mile 10.9 Sediment Investigation 11.01 593394 7233362011 RM10.9-0340 2011 River Mile 10.9 Sediment Investigation 11.03 593487 7233362011 RM10.9-0341 2011 River Mile 10.9 Sediment Investigation 11.01 593348 7234192011 RM10.9-0342 2011 River Mile 10.9 Sediment Investigation 11.02 593441 7234212011 RM10.9-0343 2011 River Mile 10.9 Sediment Investigation 11.04 593533 7234192011 RM10.9-0344 2011 River Mile 10.9 Sediment Investigation 11.06 593630 7234192011 RM10.9-0345 2011 River Mile 10.9 Sediment Investigation 11.04 593520 7234592011 RM10.9-0346 2011 River Mile 10.9 Sediment Investigation 11.06 593623 7234562011 RM10.9-0347 2011 River Mile 10.9 Sediment Investigation 11.06 593582 7234992011 RM10.9-0348 2011 River Mile 10.9 Sediment Investigation 11.08 593725 7235072011 RM10.9-0349 2011 River Mile 10.9 Sediment Investigation 11.09 593771 7234992011 RM10.9-0350 2011 River Mile 10.9 Sediment Investigation 11.11 593868 7234962011 RM10.9-0351 2011 River Mile 10.9 Sediment Investigation 11.13 593960 7234992011 RM10.9-0352 2011 River Mile 10.9 Sediment Investigation 11.1 593814 7235472011 RM10.9-0353 2011 River Mile 10.9 Sediment Investigation 11.12 593908 7235412011 RM10.9-0354 2011 River Mile 10.9 Sediment Investigation 11.13 593950 7235722012 CLRC-0481 2012 LRC Supplemental Sampling Program 11.26 594637 7237222012 RM10.9 A-0355 2012 River Mile 10.9 Sediment Investigation Addendum A 10.77 592646 7225182012 RM10.9 A-0356 2012 River Mile 10.9 Sediment Investigation Addendum A 10.8 592671 7226252012 RM10.9 A-0357 2012 River Mile 10.9 Sediment Investigation Addendum A 10.85 592814 722842
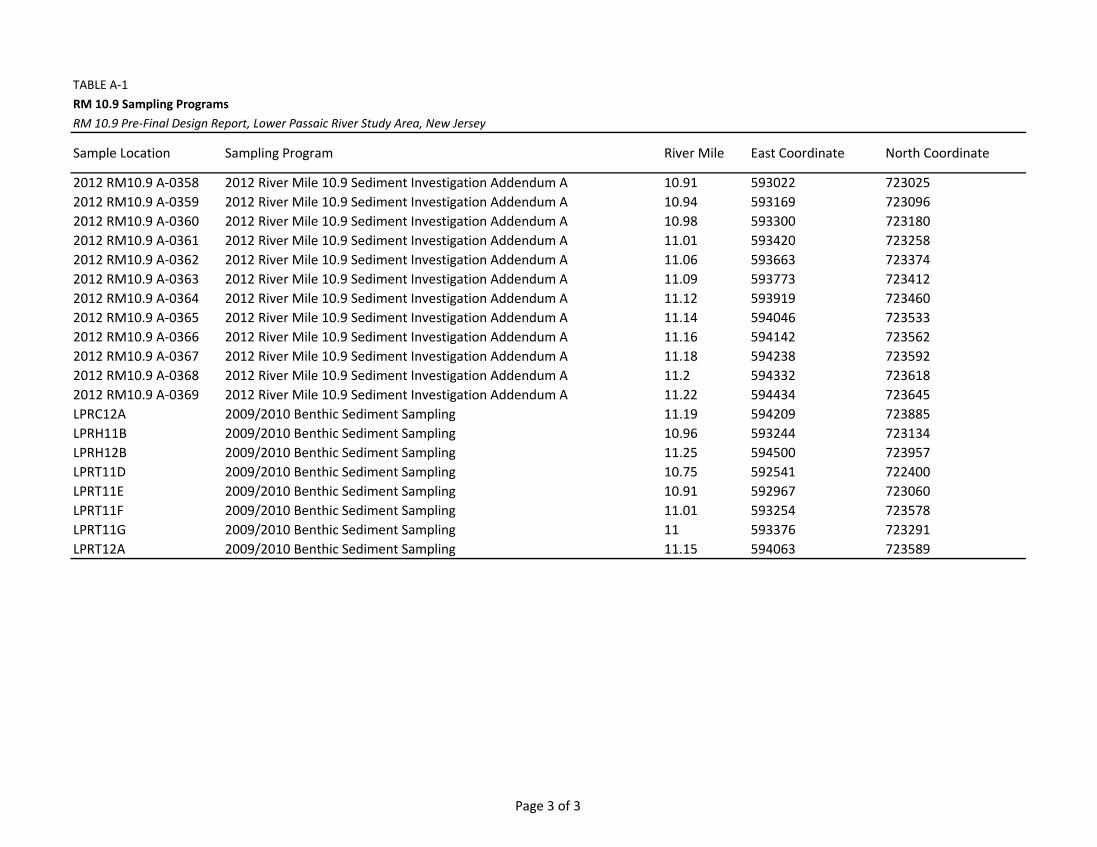
Page 3 of 3
TABLE A-1RM 10.9 Sampling ProgramsRM 10.9 Pre-Final Design Report, Lower Passaic River Study Area, New Jersey
Sample Location Sampling Program River Mile East Coordinate North Coordinate
2012 RM10.9 A-0358 2012 River Mile 10.9 Sediment Investigation Addendum A 10.91 593022 7230252012 RM10.9 A-0359 2012 River Mile 10.9 Sediment Investigation Addendum A 10.94 593169 7230962012 RM10.9 A-0360 2012 River Mile 10.9 Sediment Investigation Addendum A 10.98 593300 7231802012 RM10.9 A-0361 2012 River Mile 10.9 Sediment Investigation Addendum A 11.01 593420 7232582012 RM10.9 A-0362 2012 River Mile 10.9 Sediment Investigation Addendum A 11.06 593663 7233742012 RM10.9 A-0363 2012 River Mile 10.9 Sediment Investigation Addendum A 11.09 593773 7234122012 RM10.9 A-0364 2012 River Mile 10.9 Sediment Investigation Addendum A 11.12 593919 7234602012 RM10.9 A-0365 2012 River Mile 10.9 Sediment Investigation Addendum A 11.14 594046 7235332012 RM10.9 A-0366 2012 River Mile 10.9 Sediment Investigation Addendum A 11.16 594142 7235622012 RM10.9 A-0367 2012 River Mile 10.9 Sediment Investigation Addendum A 11.18 594238 7235922012 RM10.9 A-0368 2012 River Mile 10.9 Sediment Investigation Addendum A 11.2 594332 7236182012 RM10.9 A-0369 2012 River Mile 10.9 Sediment Investigation Addendum A 11.22 594434 723645LPRC12A 2009/2010 Benthic Sediment Sampling 11.19 594209 723885LPRH11B 2009/2010 Benthic Sediment Sampling 10.96 593244 723134LPRH12B 2009/2010 Benthic Sediment Sampling 11.25 594500 723957LPRT11D 2009/2010 Benthic Sediment Sampling 10.75 592541 722400LPRT11E 2009/2010 Benthic Sediment Sampling 10.91 592967 723060LPRT11F 2009/2010 Benthic Sediment Sampling 11.01 593254 723578LPRT11G 2009/2010 Benthic Sediment Sampling 11 593376 723291LPRT12A 2009/2010 Benthic Sediment Sampling 11.15 594063 723589

Page 1 of 9
TABLE A-2aRM 10.9 Concentration Data for 2,3,7,8-TCDD, Mercury, and Total PCBs, 0 to 0.5 ft bgs IntervalRM 10.9 Pre-Final Design Report, Lower Passaic River Study Area, New Jersey
Sample Location Parameter Concentration Units Sampling Program
2008 CLRC-067 0 0.5 2,3,7,8-TCDD 6,490 ng/kg 2008 Low-resolution Coring Program2008 CLRC-110 0 0.5 2,3,7,8-TCDD 144 ng/kg 2008 Low-resolution Coring Program2008 CLRC-066 0 0.5 2,3,7,8-TCDD 31.3 ng/kg 2008 Low-resolution Coring Program2008 CLRC-109 0 0.5 2,3,7,8-TCDD 0.47 ng/kg 2008 Low-resolution Coring ProgramLPRT11G 0 0.5 2,3,7,8-TCDD 6,700 ng/kg 2009/2010 Benthic Sediment SamplingLPRT11E 0 0.5 2,3,7,8-TCDD 420 ng/kg 2009/2010 Benthic Sediment SamplingLPRT12A 0 0.5 2,3,7,8-TCDD 340 ng/kg 2009/2010 Benthic Sediment SamplingLPRH12B 0 0.5 2,3,7,8-TCDD 145 ng/kg 2009/2010 Benthic Sediment SamplingLPRT11F 0 0.5 2,3,7,8-TCDD 140 ng/kg 2009/2010 Benthic Sediment SamplingLPRT11D 0 0.5 2,3,7,8-TCDD 130 ng/kg 2009/2010 Benthic Sediment SamplingLPRH11B 0 0.5 2,3,7,8-TCDD 78.0 ng/kg 2009/2010 Benthic Sediment SamplingLPRC12A 0 0.5 2,3,7,8-TCDD 81.0 ng/kg 2009/2010 Benthic Sediment Sampling2011 RM10.9-0344 0 0.5 2,3,7,8-TCDD 21,600 ng/kg 2011 River Mile 10.9 Sediment Investigation2011 RM10.9-0334 0 0.5 2,3,7,8-TCDD 20,900 ng/kg 2011 River Mile 10.9 Sediment Investigation2011 RM10.9-0335 0 0.5 2,3,7,8-TCDD 17,100 ng/kg 2011 River Mile 10.9 Sediment Investigation2011 RM10.9-0323 0 0.5 2,3,7,8-TCDD 16,500 ng/kg 2011 River Mile 10.9 Sediment Investigation2011 RM10.9-0331 0 0.5 2,3,7,8-TCDD 16,400 ng/kg 2011 River Mile 10.9 Sediment Investigation2011 RM10.9-0340 0 0.5 2,3,7,8-TCDD 14,200 ng/kg 2011 River Mile 10.9 Sediment Investigation2011 RM10.9-0316 0 0.5 2,3,7,8-TCDD 12,100 ng/kg 2011 River Mile 10.9 Sediment Investigation2011 RM10.9-0326 0 0.5 2,3,7,8-TCDD 10,200 ng/kg 2011 River Mile 10.9 Sediment Investigation2011 RM10.9-0327 0 0.5 2,3,7,8-TCDD 9,550 ng/kg 2011 River Mile 10.9 Sediment Investigation2011 RM10.9-0318 0 0.5 2,3,7,8-TCDD 7,080 ng/kg 2011 River Mile 10.9 Sediment Investigation2011 RM10.9-0330 0 0.5 2,3,7,8-TCDD 7,005 ng/kg 2011 River Mile 10.9 Sediment Investigation2011 RM10.9-0339 0 0.5 2,3,7,8-TCDD 6,600 ng/kg 2011 River Mile 10.9 Sediment Investigation2011 RM10.9-0350 0 0.5 2,3,7,8-TCDD 2,790 ng/kg 2011 River Mile 10.9 Sediment Investigation2011 RM10.9-0343 0 0.5 2,3,7,8-TCDD 2,200 ng/kg 2011 River Mile 10.9 Sediment Investigation2011 RM10.9-0322 0 0.5 2,3,7,8-TCDD 2,170 ng/kg 2011 River Mile 10.9 Sediment Investigation2011 RM10.9-0310 0 0.5 2,3,7,8-TCDD 2,070 ng/kg 2011 River Mile 10.9 Sediment Investigation2011 RM10.9-0325 0 0.5 2,3,7,8-TCDD 1,620 ng/kg 2011 River Mile 10.9 Sediment Investigation
Depth Interval
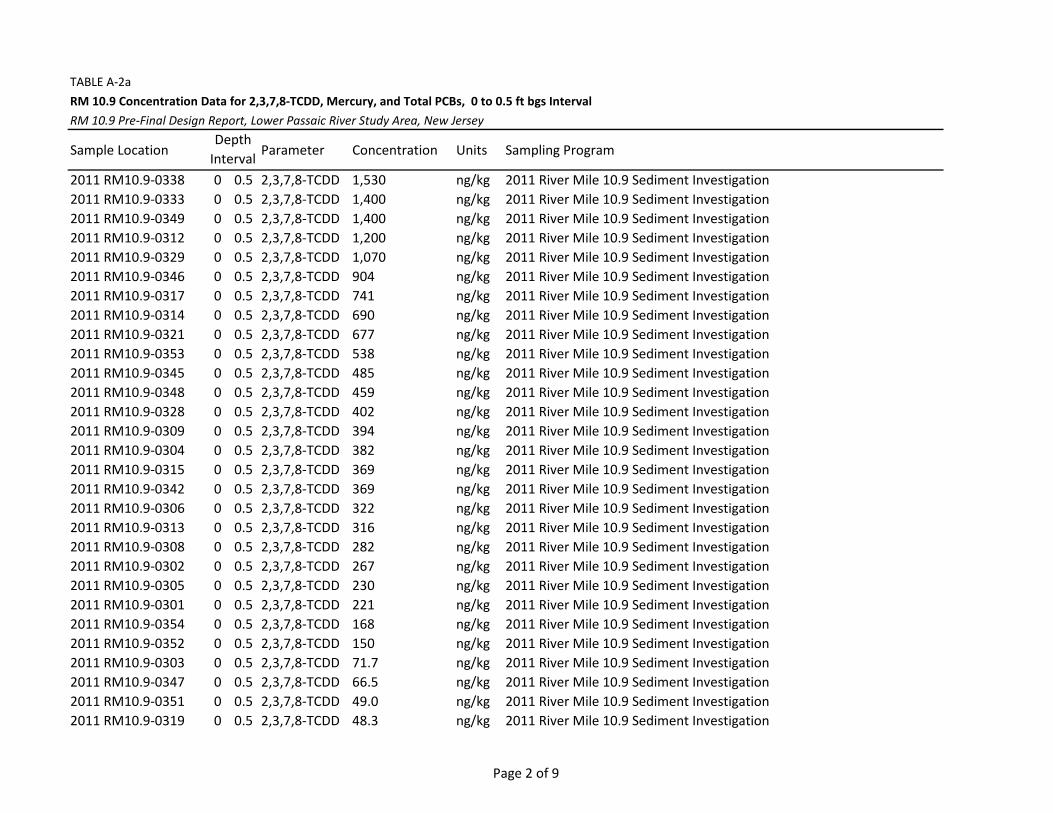
Page 2 of 9
TABLE A-2aRM 10.9 Concentration Data for 2,3,7,8-TCDD, Mercury, and Total PCBs, 0 to 0.5 ft bgs IntervalRM 10.9 Pre-Final Design Report, Lower Passaic River Study Area, New Jersey
Sample Location Parameter Concentration Units Sampling ProgramDepth
Interval 2011 RM10.9-0338 0 0.5 2,3,7,8-TCDD 1,530 ng/kg 2011 River Mile 10.9 Sediment Investigation
2011 RM10.9-0333 0 0.5 2,3,7,8-TCDD 1,400 ng/kg 2011 River Mile 10.9 Sediment Investigation2011 RM10.9-0349 0 0.5 2,3,7,8-TCDD 1,400 ng/kg 2011 River Mile 10.9 Sediment Investigation2011 RM10.9-0312 0 0.5 2,3,7,8-TCDD 1,200 ng/kg 2011 River Mile 10.9 Sediment Investigation2011 RM10.9-0329 0 0.5 2,3,7,8-TCDD 1,070 ng/kg 2011 River Mile 10.9 Sediment Investigation2011 RM10.9-0346 0 0.5 2,3,7,8-TCDD 904 ng/kg 2011 River Mile 10.9 Sediment Investigation2011 RM10.9-0317 0 0.5 2,3,7,8-TCDD 741 ng/kg 2011 River Mile 10.9 Sediment Investigation2011 RM10.9-0314 0 0.5 2,3,7,8-TCDD 690 ng/kg 2011 River Mile 10.9 Sediment Investigation2011 RM10.9-0321 0 0.5 2,3,7,8-TCDD 677 ng/kg 2011 River Mile 10.9 Sediment Investigation2011 RM10.9-0353 0 0.5 2,3,7,8-TCDD 538 ng/kg 2011 River Mile 10.9 Sediment Investigation2011 RM10.9-0345 0 0.5 2,3,7,8-TCDD 485 ng/kg 2011 River Mile 10.9 Sediment Investigation2011 RM10.9-0348 0 0.5 2,3,7,8-TCDD 459 ng/kg 2011 River Mile 10.9 Sediment Investigation2011 RM10.9-0328 0 0.5 2,3,7,8-TCDD 402 ng/kg 2011 River Mile 10.9 Sediment Investigation2011 RM10.9-0309 0 0.5 2,3,7,8-TCDD 394 ng/kg 2011 River Mile 10.9 Sediment Investigation2011 RM10.9-0304 0 0.5 2,3,7,8-TCDD 382 ng/kg 2011 River Mile 10.9 Sediment Investigation2011 RM10.9-0315 0 0.5 2,3,7,8-TCDD 369 ng/kg 2011 River Mile 10.9 Sediment Investigation2011 RM10.9-0342 0 0.5 2,3,7,8-TCDD 369 ng/kg 2011 River Mile 10.9 Sediment Investigation2011 RM10.9-0306 0 0.5 2,3,7,8-TCDD 322 ng/kg 2011 River Mile 10.9 Sediment Investigation2011 RM10.9-0313 0 0.5 2,3,7,8-TCDD 316 ng/kg 2011 River Mile 10.9 Sediment Investigation2011 RM10.9-0308 0 0.5 2,3,7,8-TCDD 282 ng/kg 2011 River Mile 10.9 Sediment Investigation2011 RM10.9-0302 0 0.5 2,3,7,8-TCDD 267 ng/kg 2011 River Mile 10.9 Sediment Investigation2011 RM10.9-0305 0 0.5 2,3,7,8-TCDD 230 ng/kg 2011 River Mile 10.9 Sediment Investigation2011 RM10.9-0301 0 0.5 2,3,7,8-TCDD 221 ng/kg 2011 River Mile 10.9 Sediment Investigation2011 RM10.9-0354 0 0.5 2,3,7,8-TCDD 168 ng/kg 2011 River Mile 10.9 Sediment Investigation2011 RM10.9-0352 0 0.5 2,3,7,8-TCDD 150 ng/kg 2011 River Mile 10.9 Sediment Investigation2011 RM10.9-0303 0 0.5 2,3,7,8-TCDD 71.7 ng/kg 2011 River Mile 10.9 Sediment Investigation2011 RM10.9-0347 0 0.5 2,3,7,8-TCDD 66.5 ng/kg 2011 River Mile 10.9 Sediment Investigation2011 RM10.9-0351 0 0.5 2,3,7,8-TCDD 49.0 ng/kg 2011 River Mile 10.9 Sediment Investigation2011 RM10.9-0319 0 0.5 2,3,7,8-TCDD 48.3 ng/kg 2011 River Mile 10.9 Sediment Investigation
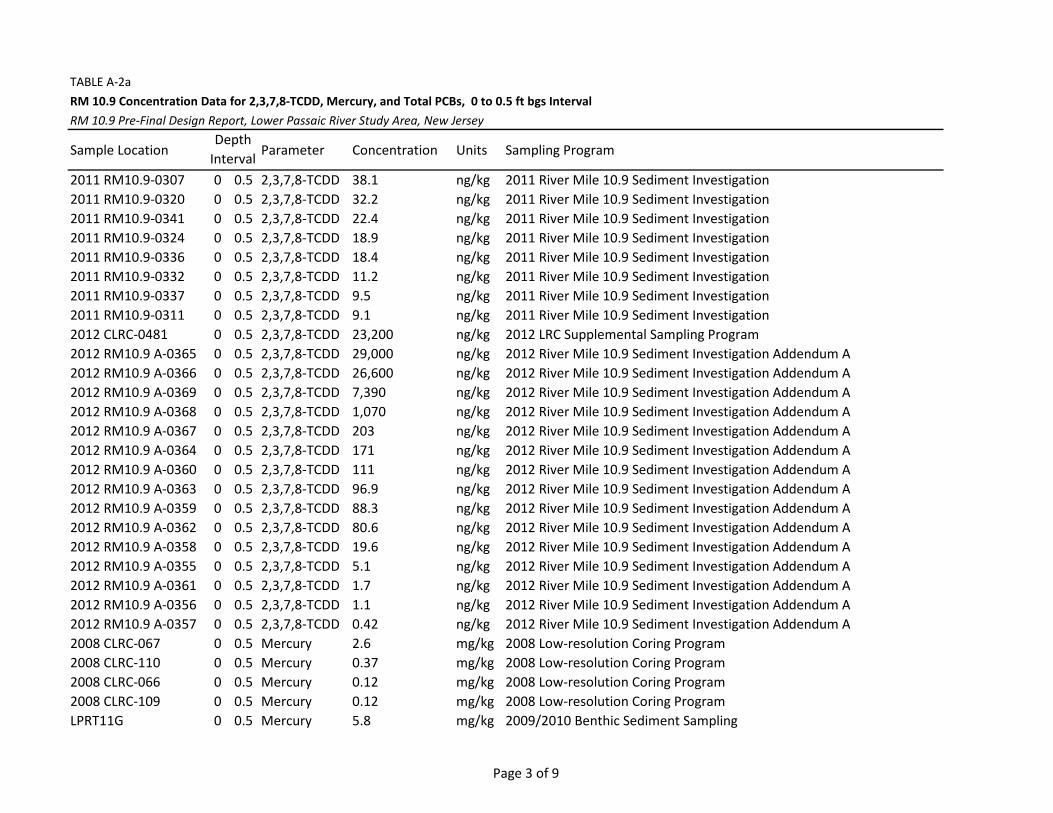
Page 3 of 9
TABLE A-2aRM 10.9 Concentration Data for 2,3,7,8-TCDD, Mercury, and Total PCBs, 0 to 0.5 ft bgs IntervalRM 10.9 Pre-Final Design Report, Lower Passaic River Study Area, New Jersey
Sample Location Parameter Concentration Units Sampling ProgramDepth
Interval 2011 RM10.9-0307 0 0.5 2,3,7,8-TCDD 38.1 ng/kg 2011 River Mile 10.9 Sediment Investigation
2011 RM10.9-0320 0 0.5 2,3,7,8-TCDD 32.2 ng/kg 2011 River Mile 10.9 Sediment Investigation2011 RM10.9-0341 0 0.5 2,3,7,8-TCDD 22.4 ng/kg 2011 River Mile 10.9 Sediment Investigation2011 RM10.9-0324 0 0.5 2,3,7,8-TCDD 18.9 ng/kg 2011 River Mile 10.9 Sediment Investigation2011 RM10.9-0336 0 0.5 2,3,7,8-TCDD 18.4 ng/kg 2011 River Mile 10.9 Sediment Investigation2011 RM10.9-0332 0 0.5 2,3,7,8-TCDD 11.2 ng/kg 2011 River Mile 10.9 Sediment Investigation2011 RM10.9-0337 0 0.5 2,3,7,8-TCDD 9.5 ng/kg 2011 River Mile 10.9 Sediment Investigation2011 RM10.9-0311 0 0.5 2,3,7,8-TCDD 9.1 ng/kg 2011 River Mile 10.9 Sediment Investigation2012 CLRC-0481 0 0.5 2,3,7,8-TCDD 23,200 ng/kg 2012 LRC Supplemental Sampling Program2012 RM10.9 A-0365 0 0.5 2,3,7,8-TCDD 29,000 ng/kg 2012 River Mile 10.9 Sediment Investigation Addendum A2012 RM10.9 A-0366 0 0.5 2,3,7,8-TCDD 26,600 ng/kg 2012 River Mile 10.9 Sediment Investigation Addendum A2012 RM10.9 A-0369 0 0.5 2,3,7,8-TCDD 7,390 ng/kg 2012 River Mile 10.9 Sediment Investigation Addendum A2012 RM10.9 A-0368 0 0.5 2,3,7,8-TCDD 1,070 ng/kg 2012 River Mile 10.9 Sediment Investigation Addendum A2012 RM10.9 A-0367 0 0.5 2,3,7,8-TCDD 203 ng/kg 2012 River Mile 10.9 Sediment Investigation Addendum A2012 RM10.9 A-0364 0 0.5 2,3,7,8-TCDD 171 ng/kg 2012 River Mile 10.9 Sediment Investigation Addendum A2012 RM10.9 A-0360 0 0.5 2,3,7,8-TCDD 111 ng/kg 2012 River Mile 10.9 Sediment Investigation Addendum A2012 RM10.9 A-0363 0 0.5 2,3,7,8-TCDD 96.9 ng/kg 2012 River Mile 10.9 Sediment Investigation Addendum A2012 RM10.9 A-0359 0 0.5 2,3,7,8-TCDD 88.3 ng/kg 2012 River Mile 10.9 Sediment Investigation Addendum A2012 RM10.9 A-0362 0 0.5 2,3,7,8-TCDD 80.6 ng/kg 2012 River Mile 10.9 Sediment Investigation Addendum A2012 RM10.9 A-0358 0 0.5 2,3,7,8-TCDD 19.6 ng/kg 2012 River Mile 10.9 Sediment Investigation Addendum A2012 RM10.9 A-0355 0 0.5 2,3,7,8-TCDD 5.1 ng/kg 2012 River Mile 10.9 Sediment Investigation Addendum A2012 RM10.9 A-0361 0 0.5 2,3,7,8-TCDD 1.7 ng/kg 2012 River Mile 10.9 Sediment Investigation Addendum A2012 RM10.9 A-0356 0 0.5 2,3,7,8-TCDD 1.1 ng/kg 2012 River Mile 10.9 Sediment Investigation Addendum A2012 RM10.9 A-0357 0 0.5 2,3,7,8-TCDD 0.42 ng/kg 2012 River Mile 10.9 Sediment Investigation Addendum A2008 CLRC-067 0 0.5 Mercury 2.6 mg/kg 2008 Low-resolution Coring Program2008 CLRC-110 0 0.5 Mercury 0.37 mg/kg 2008 Low-resolution Coring Program2008 CLRC-066 0 0.5 Mercury 0.12 mg/kg 2008 Low-resolution Coring Program2008 CLRC-109 0 0.5 Mercury 0.12 mg/kg 2008 Low-resolution Coring ProgramLPRT11G 0 0.5 Mercury 5.8 mg/kg 2009/2010 Benthic Sediment Sampling

Page 4 of 9
TABLE A-2aRM 10.9 Concentration Data for 2,3,7,8-TCDD, Mercury, and Total PCBs, 0 to 0.5 ft bgs IntervalRM 10.9 Pre-Final Design Report, Lower Passaic River Study Area, New Jersey
Sample Location Parameter Concentration Units Sampling ProgramDepth
Interval LPRT11E 0 0.5 Mercury 2.1 mg/kg 2009/2010 Benthic Sediment Sampling
LPRT12A 0 0.5 Mercury 1.8 mg/kg 2009/2010 Benthic Sediment SamplingLPRT11F 0 0.5 Mercury 1.8 mg/kg 2009/2010 Benthic Sediment SamplingLPRT11D 0 0.5 Mercury 0.92 mg/kg 2009/2010 Benthic Sediment SamplingLPRH12B 0 0.5 Mercury 0.78 mg/kg 2009/2010 Benthic Sediment SamplingLPRH11B 0 0.5 Mercury 0.30 mg/kg 2009/2010 Benthic Sediment SamplingLPRC12A 0 0.5 Mercury 1.1 mg/kg 2009/2010 Benthic Sediment Sampling2011 RM10.9-0329 0 0.5 Mercury 21.5 mg/kg 2011 River Mile 10.9 Sediment Investigation2011 RM10.9-0344 0 0.5 Mercury 20.9 mg/kg 2011 River Mile 10.9 Sediment Investigation2011 RM10.9-0334 0 0.5 Mercury 20.1 mg/kg 2011 River Mile 10.9 Sediment Investigation2011 RM10.9-0325 0 0.5 Mercury 19.4 mg/kg 2011 River Mile 10.9 Sediment Investigation2011 RM10.9-0316 0 0.5 Mercury 18.7 mg/kg 2011 River Mile 10.9 Sediment Investigation2011 RM10.9-0333 0 0.5 Mercury 17.9 mg/kg 2011 River Mile 10.9 Sediment Investigation2011 RM10.9-0340 0 0.5 Mercury 16.4 mg/kg 2011 River Mile 10.9 Sediment Investigation2011 RM10.9-0335 0 0.5 Mercury 15.1 mg/kg 2011 River Mile 10.9 Sediment Investigation2011 RM10.9-0331 0 0.5 Mercury 13.7 mg/kg 2011 River Mile 10.9 Sediment Investigation2011 RM10.9-0339 0 0.5 Mercury 10.8 mg/kg 2011 River Mile 10.9 Sediment Investigation2011 RM10.9-0327 0 0.5 Mercury 9.4 mg/kg 2011 River Mile 10.9 Sediment Investigation2011 RM10.9-0338 0 0.5 Mercury 9.0 mg/kg 2011 River Mile 10.9 Sediment Investigation2011 RM10.9-0326 0 0.5 Mercury 8.8 mg/kg 2011 River Mile 10.9 Sediment Investigation2011 RM10.9-0323 0 0.5 Mercury 8.7 mg/kg 2011 River Mile 10.9 Sediment Investigation2011 RM10.9-0318 0 0.5 Mercury 7.9 mg/kg 2011 River Mile 10.9 Sediment Investigation2011 RM10.9-0349 0 0.5 Mercury 6.5 mg/kg 2011 River Mile 10.9 Sediment Investigation2011 RM10.9-0330 0 0.5 Mercury 6.5 mg/kg 2011 River Mile 10.9 Sediment Investigation2011 RM10.9-0348 0 0.5 Mercury 5.8 mg/kg 2011 River Mile 10.9 Sediment Investigation2011 RM10.9-0322 0 0.5 Mercury 5.0 mg/kg 2011 River Mile 10.9 Sediment Investigation2011 RM10.9-0353 0 0.5 Mercury 4.7 mg/kg 2011 River Mile 10.9 Sediment Investigation2011 RM10.9-0312 0 0.5 Mercury 4.2 mg/kg 2011 River Mile 10.9 Sediment Investigation2011 RM10.9-0343 0 0.5 Mercury 4.2 mg/kg 2011 River Mile 10.9 Sediment Investigation

Page 5 of 9
TABLE A-2aRM 10.9 Concentration Data for 2,3,7,8-TCDD, Mercury, and Total PCBs, 0 to 0.5 ft bgs IntervalRM 10.9 Pre-Final Design Report, Lower Passaic River Study Area, New Jersey
Sample Location Parameter Concentration Units Sampling ProgramDepth
Interval 2011 RM10.9-0310 0 0.5 Mercury 4.2 mg/kg 2011 River Mile 10.9 Sediment Investigation
2011 RM10.9-0346 0 0.5 Mercury 3.5 mg/kg 2011 River Mile 10.9 Sediment Investigation2011 RM10.9-0354 0 0.5 Mercury 3.3 mg/kg 2011 River Mile 10.9 Sediment Investigation2011 RM10.9-0314 0 0.5 Mercury 3.0 mg/kg 2011 River Mile 10.9 Sediment Investigation2011 RM10.9-0350 0 0.5 Mercury 2.7 mg/kg 2011 River Mile 10.9 Sediment Investigation2011 RM10.9-0309 0 0.5 Mercury 2.2 mg/kg 2011 River Mile 10.9 Sediment Investigation2011 RM10.9-0315 0 0.5 Mercury 2.2 mg/kg 2011 River Mile 10.9 Sediment Investigation2011 RM10.9-0306 0 0.5 Mercury 2.1 mg/kg 2011 River Mile 10.9 Sediment Investigation2011 RM10.9-0305 0 0.5 Mercury 2.1 mg/kg 2011 River Mile 10.9 Sediment Investigation2011 RM10.9-0304 0 0.5 Mercury 2.0 mg/kg 2011 River Mile 10.9 Sediment Investigation2011 RM10.9-0313 0 0.5 Mercury 1.9 mg/kg 2011 River Mile 10.9 Sediment Investigation2011 RM10.9-0308 0 0.5 Mercury 1.8 mg/kg 2011 River Mile 10.9 Sediment Investigation2011 RM10.9-0317 0 0.5 Mercury 1.8 mg/kg 2011 River Mile 10.9 Sediment Investigation2011 RM10.9-0342 0 0.5 Mercury 1.7 mg/kg 2011 River Mile 10.9 Sediment Investigation2011 RM10.9-0345 0 0.5 Mercury 1.6 mg/kg 2011 River Mile 10.9 Sediment Investigation2011 RM10.9-0302 0 0.5 Mercury 1.5 mg/kg 2011 River Mile 10.9 Sediment Investigation2011 RM10.9-0301 0 0.5 Mercury 1.4 mg/kg 2011 River Mile 10.9 Sediment Investigation2011 RM10.9-0321 0 0.5 Mercury 1.3 mg/kg 2011 River Mile 10.9 Sediment Investigation2011 RM10.9-0347 0 0.5 Mercury 1.2 mg/kg 2011 River Mile 10.9 Sediment Investigation2011 RM10.9-0352 0 0.5 Mercury 0.79 mg/kg 2011 River Mile 10.9 Sediment Investigation2011 RM10.9-0328 0 0.5 Mercury 0.59 mg/kg 2011 River Mile 10.9 Sediment Investigation2011 RM10.9-0303 0 0.5 Mercury 0.54 mg/kg 2011 River Mile 10.9 Sediment Investigation2011 RM10.9-0320 0 0.5 Mercury 0.37 mg/kg 2011 River Mile 10.9 Sediment Investigation2011 RM10.9-0307 0 0.5 Mercury 0.34 mg/kg 2011 River Mile 10.9 Sediment Investigation2011 RM10.9-0319 0 0.5 Mercury 0.22 mg/kg 2011 River Mile 10.9 Sediment Investigation2011 RM10.9-0341 0 0.5 Mercury 0.22 mg/kg 2011 River Mile 10.9 Sediment Investigation2011 RM10.9-0324 0 0.5 Mercury 0.20 mg/kg 2011 River Mile 10.9 Sediment Investigation2011 RM10.9-0311 0 0.5 Mercury 0.20 mg/kg 2011 River Mile 10.9 Sediment Investigation2011 RM10.9-0351 0 0.5 Mercury 0.17 mg/kg 2011 River Mile 10.9 Sediment Investigation

Page 6 of 9
TABLE A-2aRM 10.9 Concentration Data for 2,3,7,8-TCDD, Mercury, and Total PCBs, 0 to 0.5 ft bgs IntervalRM 10.9 Pre-Final Design Report, Lower Passaic River Study Area, New Jersey
Sample Location Parameter Concentration Units Sampling ProgramDepth
Interval 2011 RM10.9-0337 0 0.5 Mercury 0.16 mg/kg 2011 River Mile 10.9 Sediment Investigation
2011 RM10.9-0332 0 0.5 Mercury 0.13 mg/kg 2011 River Mile 10.9 Sediment Investigation2011 RM10.9-0336 0 0.5 Mercury 0.12 mg/kg 2011 River Mile 10.9 Sediment Investigation2012 CLRC-0481 0 0.5 Mercury 11.8 mg/kg 2012 LRC Supplemental Sampling Program2012 RM10.9 A-0365 0 0.5 Mercury 10.6 mg/kg 2012 River Mile 10.9 Sediment Investigation Addendum A2012 RM10.9 A-0366 0 0.5 Mercury 9.7 mg/kg 2012 River Mile 10.9 Sediment Investigation Addendum A2012 RM10.9 A-0369 0 0.5 Mercury 8.6 mg/kg 2012 River Mile 10.9 Sediment Investigation Addendum A2012 RM10.9 A-0368 0 0.5 Mercury 3.3 mg/kg 2012 River Mile 10.9 Sediment Investigation Addendum A2012 RM10.9 A-0367 0 0.5 Mercury 2.0 mg/kg 2012 River Mile 10.9 Sediment Investigation Addendum A2012 RM10.9 A-0360 0 0.5 Mercury 0.53 mg/kg 2012 River Mile 10.9 Sediment Investigation Addendum A2012 RM10.9 A-0363 0 0.5 Mercury 0.46 mg/kg 2012 River Mile 10.9 Sediment Investigation Addendum A2012 RM10.9 A-0362 0 0.5 Mercury 0.35 mg/kg 2012 River Mile 10.9 Sediment Investigation Addendum A2012 RM10.9 A-0364 0 0.5 Mercury 0.34 mg/kg 2012 River Mile 10.9 Sediment Investigation Addendum A2012 RM10.9 A-0359 0 0.5 Mercury 0.24 mg/kg 2012 River Mile 10.9 Sediment Investigation Addendum A2012 RM10.9 A-0358 0 0.5 Mercury 0.14 mg/kg 2012 River Mile 10.9 Sediment Investigation Addendum A2012 RM10.9 A-0355 0 0.5 Mercury 0.13 mg/kg 2012 River Mile 10.9 Sediment Investigation Addendum A2012 RM10.9 A-0356 0 0.5 Mercury 0.040 mg/kg 2012 River Mile 10.9 Sediment Investigation Addendum A2012 RM10.9 A-0361 0 0.5 Mercury 0.025 mg/kg 2012 River Mile 10.9 Sediment Investigation Addendum A2012 RM10.9 A-0357 0 0.5 Mercury 0.024 mg/kg 2012 River Mile 10.9 Sediment Investigation Addendum A2008 CLRC-067 0 0.5 Total PCB 1.7 mg/kg 2008 Low-resolution Coring Program2008 CLRC-110 0 0.5 Total PCB 0.23 mg/kg 2008 Low-resolution Coring Program2008 CLRC-066 0 0.5 Total PCB 0.11 mg/kg 2008 Low-resolution Coring Program2008 CLRC-109 0 0.5 Total PCB 0.0032 mg/kg 2008 Low-resolution Coring ProgramLPRT11G 0 0.5 Total PCB 8.9 mg/kg 2009/2010 Benthic Sediment SamplingLPRT11E 0 0.5 Total PCB 1.2 mg/kg 2009/2010 Benthic Sediment SamplingLPRT12A 0 0.5 Total PCB 1.2 mg/kg 2009/2010 Benthic Sediment SamplingLPRH12B 0 0.5 Total PCB 0.52 mg/kg 2009/2010 Benthic Sediment SamplingLPRT11D 0 0.5 Total PCB 0.45 mg/kg 2009/2010 Benthic Sediment SamplingLPRT11F 0 0.5 Total PCB 0.25 mg/kg 2009/2010 Benthic Sediment Sampling

Page 7 of 9
TABLE A-2aRM 10.9 Concentration Data for 2,3,7,8-TCDD, Mercury, and Total PCBs, 0 to 0.5 ft bgs IntervalRM 10.9 Pre-Final Design Report, Lower Passaic River Study Area, New Jersey
Sample Location Parameter Concentration Units Sampling ProgramDepth
Interval LPRH11B 0 0.5 Total PCB 0.17 mg/kg 2009/2010 Benthic Sediment Sampling
LPRC12A 0 0.5 Total PCB 0.54 mg/kg 2009/2010 Benthic Sediment Sampling2011 RM10.9-0344 0 0.5 Total PCB 33.9 mg/kg 2011 River Mile 10.9 Sediment Investigation2011 RM10.9-0334 0 0.5 Total PCB 30.8 mg/kg 2011 River Mile 10.9 Sediment Investigation2011 RM10.9-0331 0 0.5 Total PCB 22.0 mg/kg 2011 River Mile 10.9 Sediment Investigation2011 RM10.9-0316 0 0.5 Total PCB 20.7 mg/kg 2011 River Mile 10.9 Sediment Investigation2011 RM10.9-0335 0 0.5 Total PCB 20.2 mg/kg 2011 River Mile 10.9 Sediment Investigation2011 RM10.9-0340 0 0.5 Total PCB 20.1 mg/kg 2011 River Mile 10.9 Sediment Investigation2011 RM10.9-0326 0 0.5 Total PCB 15.3 mg/kg 2011 River Mile 10.9 Sediment Investigation2011 RM10.9-0327 0 0.5 Total PCB 14.2 mg/kg 2011 River Mile 10.9 Sediment Investigation2011 RM10.9-0323 0 0.5 Total PCB 13.6 mg/kg 2011 River Mile 10.9 Sediment Investigation2011 RM10.9-0339 0 0.5 Total PCB 13.2 mg/kg 2011 River Mile 10.9 Sediment Investigation2011 RM10.9-0330 0 0.5 Total PCB 11.2 mg/kg 2011 River Mile 10.9 Sediment Investigation2011 RM10.9-0318 0 0.5 Total PCB 10.9 mg/kg 2011 River Mile 10.9 Sediment Investigation2011 RM10.9-0329 0 0.5 Total PCB 8.5 mg/kg 2011 River Mile 10.9 Sediment Investigation2011 RM10.9-0325 0 0.5 Total PCB 8.3 mg/kg 2011 River Mile 10.9 Sediment Investigation2011 RM10.9-0322 0 0.5 Total PCB 7.3 mg/kg 2011 River Mile 10.9 Sediment Investigation2011 RM10.9-0333 0 0.5 Total PCB 7.2 mg/kg 2011 River Mile 10.9 Sediment Investigation2011 RM10.9-0338 0 0.5 Total PCB 5.4 mg/kg 2011 River Mile 10.9 Sediment Investigation2011 RM10.9-0343 0 0.5 Total PCB 4.6 mg/kg 2011 River Mile 10.9 Sediment Investigation2011 RM10.9-0349 0 0.5 Total PCB 4.4 mg/kg 2011 River Mile 10.9 Sediment Investigation2011 RM10.9-0350 0 0.5 Total PCB 3.7 mg/kg 2011 River Mile 10.9 Sediment Investigation2011 RM10.9-0312 0 0.5 Total PCB 3.3 mg/kg 2011 River Mile 10.9 Sediment Investigation2011 RM10.9-0348 0 0.5 Total PCB 3.2 mg/kg 2011 River Mile 10.9 Sediment Investigation2011 RM10.9-0310 0 0.5 Total PCB 3.1 mg/kg 2011 River Mile 10.9 Sediment Investigation2011 RM10.9-0346 0 0.5 Total PCB 2.7 mg/kg 2011 River Mile 10.9 Sediment Investigation2011 RM10.9-0314 0 0.5 Total PCB 2.3 mg/kg 2011 River Mile 10.9 Sediment Investigation2011 RM10.9-0353 0 0.5 Total PCB 2.3 mg/kg 2011 River Mile 10.9 Sediment Investigation2011 RM10.9-0315 0 0.5 Total PCB 1.8 mg/kg 2011 River Mile 10.9 Sediment Investigation

Page 8 of 9
TABLE A-2aRM 10.9 Concentration Data for 2,3,7,8-TCDD, Mercury, and Total PCBs, 0 to 0.5 ft bgs IntervalRM 10.9 Pre-Final Design Report, Lower Passaic River Study Area, New Jersey
Sample Location Parameter Concentration Units Sampling ProgramDepth
Interval 2011 RM10.9-0309 0 0.5 Total PCB 1.6 mg/kg 2011 River Mile 10.9 Sediment Investigation
2011 RM10.9-0304 0 0.5 Total PCB 1.4 mg/kg 2011 River Mile 10.9 Sediment Investigation2011 RM10.9-0306 0 0.5 Total PCB 1.4 mg/kg 2011 River Mile 10.9 Sediment Investigation2011 RM10.9-0313 0 0.5 Total PCB 1.4 mg/kg 2011 River Mile 10.9 Sediment Investigation2011 RM10.9-0308 0 0.5 Total PCB 1.3 mg/kg 2011 River Mile 10.9 Sediment Investigation2011 RM10.9-0317 0 0.5 Total PCB 1.2 mg/kg 2011 River Mile 10.9 Sediment Investigation2011 RM10.9-0342 0 0.5 Total PCB 1.2 mg/kg 2011 River Mile 10.9 Sediment Investigation2011 RM10.9-0305 0 0.5 Total PCB 0.97 mg/kg 2011 River Mile 10.9 Sediment Investigation2011 RM10.9-0302 0 0.5 Total PCB 0.95 mg/kg 2011 River Mile 10.9 Sediment Investigation2011 RM10.9-0301 0 0.5 Total PCB 0.92 mg/kg 2011 River Mile 10.9 Sediment Investigation2011 RM10.9-0321 0 0.5 Total PCB 0.91 mg/kg 2011 River Mile 10.9 Sediment Investigation2011 RM10.9-0345 0 0.5 Total PCB 0.91 mg/kg 2011 River Mile 10.9 Sediment Investigation2011 RM10.9-0354 0 0.5 Total PCB 0.61 mg/kg 2011 River Mile 10.9 Sediment Investigation2011 RM10.9-0303 0 0.5 Total PCB 0.50 mg/kg 2011 River Mile 10.9 Sediment Investigation2011 RM10.9-0328 0 0.5 Total PCB 0.44 mg/kg 2011 River Mile 10.9 Sediment Investigation2011 RM10.9-0352 0 0.5 Total PCB 0.43 mg/kg 2011 River Mile 10.9 Sediment Investigation2011 RM10.9-0347 0 0.5 Total PCB 0.28 mg/kg 2011 River Mile 10.9 Sediment Investigation2011 RM10.9-0320 0 0.5 Total PCB 0.24 mg/kg 2011 River Mile 10.9 Sediment Investigation2011 RM10.9-0351 0 0.5 Total PCB 0.22 mg/kg 2011 River Mile 10.9 Sediment Investigation2011 RM10.9-0324 0 0.5 Total PCB 0.12 mg/kg 2011 River Mile 10.9 Sediment Investigation2011 RM10.9-0336 0 0.5 Total PCB 0.12 mg/kg 2011 River Mile 10.9 Sediment Investigation2011 RM10.9-0307 0 0.5 Total PCB 0.11 mg/kg 2011 River Mile 10.9 Sediment Investigation2011 RM10.9-0341 0 0.5 Total PCB 0.10 mg/kg 2011 River Mile 10.9 Sediment Investigation2011 RM10.9-0332 0 0.5 Total PCB 0.082 mg/kg 2011 River Mile 10.9 Sediment Investigation2011 RM10.9-0337 0 0.5 Total PCB 0.050 mg/kg 2011 River Mile 10.9 Sediment Investigation2011 RM10.9-0319 0 0.5 Total PCB 0.042 mg/kg 2011 River Mile 10.9 Sediment Investigation2011 RM10.9-0311 0 0.5 Total PCB 0.040 mg/kg 2011 River Mile 10.9 Sediment Investigation2012 CLRC-0481 0 0.5 Total PCB 16.4 mg/kg 2012 LRC Supplemental Sampling Program2012 RM10.9 A-0365 0 0.5 Total PCB 22.7 mg/kg 2012 River Mile 10.9 Sediment Investigation Addendum A

Page 9 of 9
TABLE A-2aRM 10.9 Concentration Data for 2,3,7,8-TCDD, Mercury, and Total PCBs, 0 to 0.5 ft bgs IntervalRM 10.9 Pre-Final Design Report, Lower Passaic River Study Area, New Jersey
Sample Location Parameter Concentration Units Sampling ProgramDepth
Interval 2012 RM10.9 A-0366 0 0.5 Total PCB 22.4 mg/kg 2012 River Mile 10.9 Sediment Investigation Addendum A
2012 RM10.9 A-0369 0 0.5 Total PCB 15.3 mg/kg 2012 River Mile 10.9 Sediment Investigation Addendum A2012 RM10.9 A-0368 0 0.5 Total PCB 5.7 mg/kg 2012 River Mile 10.9 Sediment Investigation Addendum A2012 RM10.9 A-0367 0 0.5 Total PCB 1.6 mg/kg 2012 River Mile 10.9 Sediment Investigation Addendum A2012 RM10.9 A-0360 0 0.5 Total PCB 0.31 mg/kg 2012 River Mile 10.9 Sediment Investigation Addendum A2012 RM10.9 A-0362 0 0.5 Total PCB 0.25 mg/kg 2012 River Mile 10.9 Sediment Investigation Addendum A2012 RM10.9 A-0363 0 0.5 Total PCB 0.24 mg/kg 2012 River Mile 10.9 Sediment Investigation Addendum A2012 RM10.9 A-0359 0 0.5 Total PCB 0.16 mg/kg 2012 River Mile 10.9 Sediment Investigation Addendum A2012 RM10.9 A-0364 0 0.5 Total PCB 0.13 mg/kg 2012 River Mile 10.9 Sediment Investigation Addendum A2012 RM10.9 A-0358 0 0.5 Total PCB 0.027 mg/kg 2012 River Mile 10.9 Sediment Investigation Addendum A2012 RM10.9 A-0355 0 0.5 Total PCB 0.026 mg/kg 2012 River Mile 10.9 Sediment Investigation Addendum A2012 RM10.9 A-0356 0 0.5 Total PCB 0.0072 mg/kg 2012 River Mile 10.9 Sediment Investigation Addendum A2012 RM10.9 A-0361 0 0.5 Total PCB 0.0041 mg/kg 2012 River Mile 10.9 Sediment Investigation Addendum A2012 RM10.9 A-0357 0 0.5 Total PCB 0.0018 mg/kg 2012 River Mile 10.9 Sediment Investigation Addendum ANotes: Duplicate samples averaged. 2,3,7,8-TCDD, 2,3,7,8-tetrachlorodibenzo-p-dioxin; PCB, polychlorinated biphenyl;ft bgs, feet below ground (sediment) surface; ng/kg, nanograms per kilogram; mg/kg, milligrams per kilogram.

Page 1 of 7
TABLE A-2bRM 10.9 Concentration Data for 2,3,7,8-TCDD, Mercury, and Total PCBs, 0.5 to 1.5 ft bgs IntervalRM 10.9 Pre-Final Design Report, Lower Passaic River Study Area, New Jersey
Sample Location Parameter Concentration Units Sampling Program
2008 CLRC-109 0.5 1.5 2,3,7,8-TCDD <0.0563 ng/kg 2008 Low-resolution Coring Program2008 CLRC-067 0.5 1.5 2,3,7,8-TCDD 57,200 ng/kg 2008 Low-resolution Coring Program2008 CLRC-066 0.5 1.5 2,3,7,8-TCDD 22.6 ng/kg 2008 Low-resolution Coring Program2008 CLRC-110 0.5 1.5 2,3,7,8-TCDD 22.5 ng/kg 2008 Low-resolution Coring Program2011 RM10.9-0340 0.5 1.5 2,3,7,8-TCDD 21,700 ng/kg 2011 River Mile 10.9 Sediment Investigation2011 RM10.9-0344 0.5 1.5 2,3,7,8-TCDD 20,700 ng/kg 2011 River Mile 10.9 Sediment Investigation2011 RM10.9-0318 0.5 1.5 2,3,7,8-TCDD 20,500 ng/kg 2011 River Mile 10.9 Sediment Investigation2011 RM10.9-0339 0.5 1.5 2,3,7,8-TCDD 18,800 ng/kg 2011 River Mile 10.9 Sediment Investigation2011 RM10.9-0349 0.5 1.5 2,3,7,8-TCDD 18,550 ng/kg 2011 River Mile 10.9 Sediment Investigation2011 RM10.9-0350 0.5 1.5 2,3,7,8-TCDD 18,300 ng/kg 2011 River Mile 10.9 Sediment Investigation2011 RM10.9-0316 0.5 1.5 2,3,7,8-TCDD 16,900 ng/kg 2011 River Mile 10.9 Sediment Investigation2011 RM10.9-0343 0.5 1.5 2,3,7,8-TCDD 15,700 ng/kg 2011 River Mile 10.9 Sediment Investigation2011 RM10.9-0346 0.5 1.5 2,3,7,8-TCDD 13,200 ng/kg 2011 River Mile 10.9 Sediment Investigation2011 RM10.9-0334 0.5 1.5 2,3,7,8-TCDD 9,080 ng/kg 2011 River Mile 10.9 Sediment Investigation2011 RM10.9-0327 0.5 1.5 2,3,7,8-TCDD 7,690 ng/kg 2011 River Mile 10.9 Sediment Investigation2011 RM10.9-0331 0.5 1.5 2,3,7,8-TCDD 7,100 ng/kg 2011 River Mile 10.9 Sediment Investigation2011 RM10.9-0333 0.5 1.5 2,3,7,8-TCDD 6,040 ng/kg 2011 River Mile 10.9 Sediment Investigation2011 RM10.9-0351 0.5 1.5 2,3,7,8-TCDD 4,730 ng/kg 2011 River Mile 10.9 Sediment Investigation2011 RM10.9-0314 0.5 1.5 2,3,7,8-TCDD 4,030 ng/kg 2011 River Mile 10.9 Sediment Investigation2011 RM10.9-0335 0.5 1.5 2,3,7,8-TCDD 3,330 ng/kg 2011 River Mile 10.9 Sediment Investigation2011 RM10.9-0322 0.5 1.5 2,3,7,8-TCDD 2,845 ng/kg 2011 River Mile 10.9 Sediment Investigation2011 RM10.9-0338 0.5 1.5 2,3,7,8-TCDD 2,790 ng/kg 2011 River Mile 10.9 Sediment Investigation2011 RM10.9-0330 0.5 1.5 2,3,7,8-TCDD 2,610 ng/kg 2011 River Mile 10.9 Sediment Investigation2011 RM10.9-0325 0.5 1.5 2,3,7,8-TCDD 1,550 ng/kg 2011 River Mile 10.9 Sediment Investigation2011 RM10.9-0348 0.5 1.5 2,3,7,8-TCDD 1,530 ng/kg 2011 River Mile 10.9 Sediment Investigation2011 RM10.9-0332 0.5 1.5 2,3,7,8-TCDD 1,410 ng/kg 2011 River Mile 10.9 Sediment Investigation2011 RM10.9-0329 0.5 1.5 2,3,7,8-TCDD 1,330 ng/kg 2011 River Mile 10.9 Sediment Investigation2011 RM10.9-0342 0.5 1.5 2,3,7,8-TCDD 1,300 ng/kg 2011 River Mile 10.9 Sediment Investigation2011 RM10.9-0345 0.5 1.5 2,3,7,8-TCDD 890 ng/kg 2011 River Mile 10.9 Sediment Investigation2011 RM10.9-0312 0.5 1.5 2,3,7,8-TCDD 874 ng/kg 2011 River Mile 10.9 Sediment Investigation2011 RM10.9-0328 0.5 1.5 2,3,7,8-TCDD 751 ng/kg 2011 River Mile 10.9 Sediment Investigation2011 RM10.9-0310 0.5 1.5 2,3,7,8-TCDD 680 ng/kg 2011 River Mile 10.9 Sediment Investigation
Depth Interval

Page 2 of 7
TABLE A-2bRM 10.9 Concentration Data for 2,3,7,8-TCDD, Mercury, and Total PCBs, 0.5 to 1.5 ft bgs IntervalRM 10.9 Pre-Final Design Report, Lower Passaic River Study Area, New Jersey
Sample Location Parameter Concentration Units Sampling ProgramDepth
Interval 2011 RM10.9-0317 0.5 1.5 2,3,7,8-TCDD 671 ng/kg 2011 River Mile 10.9 Sediment Investigation
2011 RM10.9-0315 0.5 1.5 2,3,7,8-TCDD 655 ng/kg 2011 River Mile 10.9 Sediment Investigation2011 RM10.9-0326 0.5 1.5 2,3,7,8-TCDD 597 ng/kg 2011 River Mile 10.9 Sediment Investigation2011 RM10.9-0306 0.5 1.5 2,3,7,8-TCDD 585 ng/kg 2011 River Mile 10.9 Sediment Investigation2011 RM10.9-0309 0.5 1.5 2,3,7,8-TCDD 559 ng/kg 2011 River Mile 10.9 Sediment Investigation2011 RM10.9-0347 0.5 1.5 2,3,7,8-TCDD 550 ng/kg 2011 River Mile 10.9 Sediment Investigation2011 RM10.9-0308 0.5 1.5 2,3,7,8-TCDD 547 ng/kg 2011 River Mile 10.9 Sediment Investigation2011 RM10.9-0302 0.5 1.5 2,3,7,8-TCDD 426 ng/kg 2011 River Mile 10.9 Sediment Investigation2011 RM10.9-0304 0.5 1.5 2,3,7,8-TCDD 393 ng/kg 2011 River Mile 10.9 Sediment Investigation2011 RM10.9-0323 0.5 1.5 2,3,7,8-TCDD 321 ng/kg 2011 River Mile 10.9 Sediment Investigation2011 RM10.9-0313 0.5 1.5 2,3,7,8-TCDD 302 ng/kg 2011 River Mile 10.9 Sediment Investigation2011 RM10.9-0305 0.5 1.5 2,3,7,8-TCDD 270 ng/kg 2011 River Mile 10.9 Sediment Investigation2011 RM10.9-0324 0.5 1.5 2,3,7,8-TCDD 258 ng/kg 2011 River Mile 10.9 Sediment Investigation2011 RM10.9-0352 0.5 1.5 2,3,7,8-TCDD 219 ng/kg 2011 River Mile 10.9 Sediment Investigation2011 RM10.9-0301 0.5 1.5 2,3,7,8-TCDD 210 ng/kg 2011 River Mile 10.9 Sediment Investigation2011 RM10.9-0321 0.5 1.5 2,3,7,8-TCDD 198 ng/kg 2011 River Mile 10.9 Sediment Investigation2011 RM10.9-0337 0.5 1.5 2,3,7,8-TCDD 174 ng/kg 2011 River Mile 10.9 Sediment Investigation2011 RM10.9-0307 0.5 1.5 2,3,7,8-TCDD 148 ng/kg 2011 River Mile 10.9 Sediment Investigation2011 RM10.9-0303 0.5 1.5 2,3,7,8-TCDD 120 ng/kg 2011 River Mile 10.9 Sediment Investigation2011 RM10.9-0353 0.5 1.5 2,3,7,8-TCDD 85.9 ng/kg 2011 River Mile 10.9 Sediment Investigation2011 RM10.9-0320 0.5 1.5 2,3,7,8-TCDD 81.3 ng/kg 2011 River Mile 10.9 Sediment Investigation2011 RM10.9-0341 0.5 1.5 2,3,7,8-TCDD 58.2 ng/kg 2011 River Mile 10.9 Sediment Investigation2011 RM10.9-0319 0.5 1.5 2,3,7,8-TCDD 24.7 ng/kg 2011 River Mile 10.9 Sediment Investigation2011 RM10.9-0336 0.5 1.5 2,3,7,8-TCDD 18.4 ng/kg 2011 River Mile 10.9 Sediment Investigation2011 RM10.9-0354 0.5 1.5 2,3,7,8-TCDD 6.0 ng/kg 2011 River Mile 10.9 Sediment Investigation2011 RM10.9-0311 0.5 1.5 2,3,7,8-TCDD 5.4 ng/kg 2011 River Mile 10.9 Sediment Investigation2012 CLRC-0481 0.5 1.5 2,3,7,8-TCDD 35,600 ng/kg 2012 LRC Supplemental Sampling Program2012 RM10.9 A-0356 0.5 1.5 2,3,7,8-TCDD <0.126 ng/kg 2012 River Mile 10.9 Sediment Investigation Addendum A2012 RM10.9 A-0365 0.5 1.5 2,3,7,8-TCDD 31,000 ng/kg 2012 River Mile 10.9 Sediment Investigation Addendum A2012 RM10.9 A-0366 0.5 1.5 2,3,7,8-TCDD 16,500 ng/kg 2012 River Mile 10.9 Sediment Investigation Addendum A2012 RM10.9 A-0369 0.5 1.5 2,3,7,8-TCDD 1,110 ng/kg 2012 River Mile 10.9 Sediment Investigation Addendum A2012 RM10.9 A-0368 0.5 1.5 2,3,7,8-TCDD 714 ng/kg 2012 River Mile 10.9 Sediment Investigation Addendum A

Page 3 of 7
TABLE A-2bRM 10.9 Concentration Data for 2,3,7,8-TCDD, Mercury, and Total PCBs, 0.5 to 1.5 ft bgs IntervalRM 10.9 Pre-Final Design Report, Lower Passaic River Study Area, New Jersey
Sample Location Parameter Concentration Units Sampling ProgramDepth
Interval 2012 RM10.9 A-0360 0.5 1.3 2,3,7,8-TCDD 515 ng/kg 2012 River Mile 10.9 Sediment Investigation Addendum A
2012 RM10.9 A-0362 0.5 1.2 2,3,7,8-TCDD 398 ng/kg 2012 River Mile 10.9 Sediment Investigation Addendum A2012 RM10.9 A-0363 0.5 1 2,3,7,8-TCDD 25.1 ng/kg 2012 River Mile 10.9 Sediment Investigation Addendum A2012 RM10.9 A-0359 0.5 1.3 2,3,7,8-TCDD 17.9 ng/kg 2012 River Mile 10.9 Sediment Investigation Addendum A2012 RM10.9 A-0358 0.5 1.5 2,3,7,8-TCDD 7.3 ng/kg 2012 River Mile 10.9 Sediment Investigation Addendum A2012 RM10.9 A-0361 0.5 0.9 2,3,7,8-TCDD 0.72 ng/kg 2012 River Mile 10.9 Sediment Investigation Addendum A2012 RM10.9 A-0355 0.5 1.5 2,3,7,8-TCDD 0.12 ng/kg 2012 River Mile 10.9 Sediment Investigation Addendum A2012 RM10.9 A-0357 0.5 1.5 2,3,7,8-TCDD 0.10 ng/kg 2012 River Mile 10.9 Sediment Investigation Addendum A2008 CLRC-067 0.5 1.5 Mercury 19.0 mg/kg 2008 Low-resolution Coring Program2008 CLRC-110 0.5 1.5 Mercury 0.65 mg/kg 2008 Low-resolution Coring Program2008 CLRC-066 0.5 1.5 Mercury 0.17 mg/kg 2008 Low-resolution Coring Program2008 CLRC-109 0.5 1.5 Mercury 0.036 mg/kg 2008 Low-resolution Coring Program2011 RM10.9-0340 0.5 1.5 Mercury 20.0 mg/kg 2011 River Mile 10.9 Sediment Investigation2011 RM10.9-0318 0.5 1.5 Mercury 19.3 mg/kg 2011 River Mile 10.9 Sediment Investigation2011 RM10.9-0316 0.5 1.5 Mercury 18.4 mg/kg 2011 River Mile 10.9 Sediment Investigation2011 RM10.9-0344 0.5 1.5 Mercury 18.3 mg/kg 2011 River Mile 10.9 Sediment Investigation2011 RM10.9-0329 0.5 1.5 Mercury 17.0 mg/kg 2011 River Mile 10.9 Sediment Investigation2011 RM10.9-0343 0.5 1.5 Mercury 16.6 mg/kg 2011 River Mile 10.9 Sediment Investigation2011 RM10.9-0339 0.5 1.5 Mercury 15.6 mg/kg 2011 River Mile 10.9 Sediment Investigation2011 RM10.9-0346 0.5 1.5 Mercury 13.4 mg/kg 2011 River Mile 10.9 Sediment Investigation2011 RM10.9-0350 0.5 1.5 Mercury 11.2 mg/kg 2011 River Mile 10.9 Sediment Investigation2011 RM10.9-0342 0.5 1.5 Mercury 10.4 mg/kg 2011 River Mile 10.9 Sediment Investigation2011 RM10.9-0349 0.5 1.5 Mercury 9.8 mg/kg 2011 River Mile 10.9 Sediment Investigation2011 RM10.9-0333 0.5 1.5 Mercury 8.6 mg/kg 2011 River Mile 10.9 Sediment Investigation2011 RM10.9-0325 0.5 1.5 Mercury 8.3 mg/kg 2011 River Mile 10.9 Sediment Investigation2011 RM10.9-0310 0.5 1.5 Mercury 7.6 mg/kg 2011 River Mile 10.9 Sediment Investigation2011 RM10.9-0348 0.5 1.5 Mercury 7.5 mg/kg 2011 River Mile 10.9 Sediment Investigation2011 RM10.9-0338 0.5 1.5 Mercury 7.4 mg/kg 2011 River Mile 10.9 Sediment Investigation2011 RM10.9-0332 0.5 1.5 Mercury 7.4 mg/kg 2011 River Mile 10.9 Sediment Investigation2011 RM10.9-0334 0.5 1.5 Mercury 7.3 mg/kg 2011 River Mile 10.9 Sediment Investigation2011 RM10.9-0312 0.5 1.5 Mercury 6.8 mg/kg 2011 River Mile 10.9 Sediment Investigation2011 RM10.9-0327 0.5 1.5 Mercury 6.3 mg/kg 2011 River Mile 10.9 Sediment Investigation

Page 4 of 7
TABLE A-2bRM 10.9 Concentration Data for 2,3,7,8-TCDD, Mercury, and Total PCBs, 0.5 to 1.5 ft bgs IntervalRM 10.9 Pre-Final Design Report, Lower Passaic River Study Area, New Jersey
Sample Location Parameter Concentration Units Sampling ProgramDepth
Interval 2011 RM10.9-0345 0.5 1.5 Mercury 5.8 mg/kg 2011 River Mile 10.9 Sediment Investigation
2011 RM10.9-0335 0.5 1.5 Mercury 5.7 mg/kg 2011 River Mile 10.9 Sediment Investigation2011 RM10.9-0322 0.5 1.5 Mercury 5.5 mg/kg 2011 River Mile 10.9 Sediment Investigation2011 RM10.9-0314 0.5 1.5 Mercury 5.0 mg/kg 2011 River Mile 10.9 Sediment Investigation2011 RM10.9-0331 0.5 1.5 Mercury 4.9 mg/kg 2011 River Mile 10.9 Sediment Investigation2011 RM10.9-0317 0.5 1.5 Mercury 4.7 mg/kg 2011 River Mile 10.9 Sediment Investigation2011 RM10.9-0308 0.5 1.5 Mercury 4.3 mg/kg 2011 River Mile 10.9 Sediment Investigation2011 RM10.9-0351 0.5 1.5 Mercury 4.3 mg/kg 2011 River Mile 10.9 Sediment Investigation2011 RM10.9-0326 0.5 1.5 Mercury 3.8 mg/kg 2011 River Mile 10.9 Sediment Investigation2011 RM10.9-0330 0.5 1.5 Mercury 3.7 mg/kg 2011 River Mile 10.9 Sediment Investigation2011 RM10.9-0309 0.5 1.5 Mercury 3.4 mg/kg 2011 River Mile 10.9 Sediment Investigation2011 RM10.9-0307 0.5 1.5 Mercury 3.2 mg/kg 2011 River Mile 10.9 Sediment Investigation2011 RM10.9-0304 0.5 1.5 Mercury 3.1 mg/kg 2011 River Mile 10.9 Sediment Investigation2011 RM10.9-0328 0.5 1.5 Mercury 3.0 mg/kg 2011 River Mile 10.9 Sediment Investigation2011 RM10.9-0352 0.5 1.5 Mercury 2.9 mg/kg 2011 River Mile 10.9 Sediment Investigation2011 RM10.9-0347 0.5 1.5 Mercury 2.9 mg/kg 2011 River Mile 10.9 Sediment Investigation2011 RM10.9-0315 0.5 1.5 Mercury 2.9 mg/kg 2011 River Mile 10.9 Sediment Investigation2011 RM10.9-0353 0.5 1.5 Mercury 2.7 mg/kg 2011 River Mile 10.9 Sediment Investigation2011 RM10.9-0306 0.5 1.5 Mercury 2.6 mg/kg 2011 River Mile 10.9 Sediment Investigation2011 RM10.9-0354 0.5 1.5 Mercury 2.6 mg/kg 2011 River Mile 10.9 Sediment Investigation2011 RM10.9-0302 0.5 1.5 Mercury 2.4 mg/kg 2011 River Mile 10.9 Sediment Investigation2011 RM10.9-0305 0.5 1.5 Mercury 2.1 mg/kg 2011 River Mile 10.9 Sediment Investigation2011 RM10.9-0323 0.5 1.5 Mercury 2.0 mg/kg 2011 River Mile 10.9 Sediment Investigation2011 RM10.9-0313 0.5 1.5 Mercury 1.8 mg/kg 2011 River Mile 10.9 Sediment Investigation2011 RM10.9-0324 0.5 1.5 Mercury 1.8 mg/kg 2011 River Mile 10.9 Sediment Investigation2011 RM10.9-0303 0.5 1.5 Mercury 1.7 mg/kg 2011 River Mile 10.9 Sediment Investigation2011 RM10.9-0301 0.5 1.5 Mercury 1.4 mg/kg 2011 River Mile 10.9 Sediment Investigation2011 RM10.9-0319 0.5 1.5 Mercury 1.1 mg/kg 2011 River Mile 10.9 Sediment Investigation2011 RM10.9-0321 0.5 1.5 Mercury 1.0 mg/kg 2011 River Mile 10.9 Sediment Investigation2011 RM10.9-0337 0.5 1.5 Mercury 0.71 mg/kg 2011 River Mile 10.9 Sediment Investigation2011 RM10.9-0320 0.5 1.5 Mercury 0.63 mg/kg 2011 River Mile 10.9 Sediment Investigation2011 RM10.9-0341 0.5 1.5 Mercury 0.32 mg/kg 2011 River Mile 10.9 Sediment Investigation

Page 5 of 7
TABLE A-2bRM 10.9 Concentration Data for 2,3,7,8-TCDD, Mercury, and Total PCBs, 0.5 to 1.5 ft bgs IntervalRM 10.9 Pre-Final Design Report, Lower Passaic River Study Area, New Jersey
Sample Location Parameter Concentration Units Sampling ProgramDepth
Interval 2011 RM10.9-0311 0.5 1.5 Mercury 0.15 mg/kg 2011 River Mile 10.9 Sediment Investigation
2011 RM10.9-0336 0.5 1.5 Mercury 0.14 mg/kg 2011 River Mile 10.9 Sediment Investigation2012 CLRC-0481 0.5 1.5 Mercury 13.0 mg/kg 2012 LRC Supplemental Sampling Program2012 RM10.9 A-0365 0.5 1.5 Mercury 11.9 mg/kg 2012 River Mile 10.9 Sediment Investigation Addendum A2012 RM10.9 A-0366 0.5 1.5 Mercury 8.4 mg/kg 2012 River Mile 10.9 Sediment Investigation Addendum A2012 RM10.9 A-0368 0.5 1.5 Mercury 1.9 mg/kg 2012 River Mile 10.9 Sediment Investigation Addendum A2012 RM10.9 A-0359 0.5 1.3 Mercury 1.2 mg/kg 2012 River Mile 10.9 Sediment Investigation Addendum A2012 RM10.9 A-0360 0.5 1.3 Mercury 1.2 mg/kg 2012 River Mile 10.9 Sediment Investigation Addendum A2012 RM10.9 A-0369 0.5 1.5 Mercury 1.0 mg/kg 2012 River Mile 10.9 Sediment Investigation Addendum A2012 RM10.9 A-0362 0.5 1.2 Mercury 0.92 mg/kg 2012 River Mile 10.9 Sediment Investigation Addendum A2012 RM10.9 A-0363 0.5 1 Mercury 0.23 mg/kg 2012 River Mile 10.9 Sediment Investigation Addendum A2012 RM10.9 A-0358 0.5 1.5 Mercury 0.095 mg/kg 2012 River Mile 10.9 Sediment Investigation Addendum A2012 RM10.9 A-0355 0.5 1.5 Mercury 0.038 mg/kg 2012 River Mile 10.9 Sediment Investigation Addendum A2012 RM10.9 A-0361 0.5 0.9 Mercury 0.015 mg/kg 2012 River Mile 10.9 Sediment Investigation Addendum A2012 RM10.9 A-0357 0.5 1.5 Mercury 0.014 mg/kg 2012 River Mile 10.9 Sediment Investigation Addendum A2012 RM10.9 A-0356 0.5 1.5 Mercury 0.013 mg/kg 2012 River Mile 10.9 Sediment Investigation Addendum A2008 CLRC-067 0.5 1.5 Total PCB 18.0 mg/kg 2008 Low-resolution Coring Program2008 CLRC-066 0.5 1.5 Total PCB 0.94 mg/kg 2008 Low-resolution Coring Program2008 CLRC-110 0.5 1.5 Total PCB 0.32 mg/kg 2008 Low-resolution Coring Program2008 CLRC-109 0.5 1.5 Total PCB 0.0001 mg/kg 2008 Low-resolution Coring Program2011 RM10.9-0340 0.5 1.5 Total PCB 35.2 mg/kg 2011 River Mile 10.9 Sediment Investigation2011 RM10.9-0343 0.5 1.5 Total PCB 29.8 mg/kg 2011 River Mile 10.9 Sediment Investigation2011 RM10.9-0344 0.5 1.5 Total PCB 28.1 mg/kg 2011 River Mile 10.9 Sediment Investigation2011 RM10.9-0318 0.5 1.5 Total PCB 26.9 mg/kg 2011 River Mile 10.9 Sediment Investigation2011 RM10.9-0316 0.5 1.5 Total PCB 26.4 mg/kg 2011 River Mile 10.9 Sediment Investigation2011 RM10.9-0339 0.5 1.5 Total PCB 25.3 mg/kg 2011 River Mile 10.9 Sediment Investigation2011 RM10.9-0350 0.5 1.5 Total PCB 24.1 mg/kg 2011 River Mile 10.9 Sediment Investigation2011 RM10.9-0349 0.5 1.5 Total PCB 18.5 mg/kg 2011 River Mile 10.9 Sediment Investigation2011 RM10.9-0346 0.5 1.5 Total PCB 17.1 mg/kg 2011 River Mile 10.9 Sediment Investigation2011 RM10.9-0333 0.5 1.5 Total PCB 11.6 mg/kg 2011 River Mile 10.9 Sediment Investigation2011 RM10.9-0334 0.5 1.5 Total PCB 10.0 mg/kg 2011 River Mile 10.9 Sediment Investigation2011 RM10.9-0327 0.5 1.5 Total PCB 9.2 mg/kg 2011 River Mile 10.9 Sediment Investigation

Page 6 of 7
TABLE A-2bRM 10.9 Concentration Data for 2,3,7,8-TCDD, Mercury, and Total PCBs, 0.5 to 1.5 ft bgs IntervalRM 10.9 Pre-Final Design Report, Lower Passaic River Study Area, New Jersey
Sample Location Parameter Concentration Units Sampling ProgramDepth
Interval 2011 RM10.9-0322 0.5 1.5 Total PCB 7.7 mg/kg 2011 River Mile 10.9 Sediment Investigation
2011 RM10.9-0335 0.5 1.5 Total PCB 7.5 mg/kg 2011 River Mile 10.9 Sediment Investigation2011 RM10.9-0325 0.5 1.5 Total PCB 7.3 mg/kg 2011 River Mile 10.9 Sediment Investigation2011 RM10.9-0314 0.5 1.5 Total PCB 7.1 mg/kg 2011 River Mile 10.9 Sediment Investigation2011 RM10.9-0338 0.5 1.5 Total PCB 7.0 mg/kg 2011 River Mile 10.9 Sediment Investigation2011 RM10.9-0329 0.5 1.5 Total PCB 7.0 mg/kg 2011 River Mile 10.9 Sediment Investigation2011 RM10.9-0331 0.5 1.5 Total PCB 6.1 mg/kg 2011 River Mile 10.9 Sediment Investigation2011 RM10.9-0348 0.5 1.5 Total PCB 5.7 mg/kg 2011 River Mile 10.9 Sediment Investigation2011 RM10.9-0342 0.5 1.5 Total PCB 5.1 mg/kg 2011 River Mile 10.9 Sediment Investigation2011 RM10.9-0312 0.5 1.5 Total PCB 4.9 mg/kg 2011 River Mile 10.9 Sediment Investigation2011 RM10.9-0310 0.5 1.5 Total PCB 4.6 mg/kg 2011 River Mile 10.9 Sediment Investigation2011 RM10.9-0332 0.5 1.5 Total PCB 4.3 mg/kg 2011 River Mile 10.9 Sediment Investigation2011 RM10.9-0351 0.5 1.5 Total PCB 4.0 mg/kg 2011 River Mile 10.9 Sediment Investigation2011 RM10.9-0308 0.5 1.5 Total PCB 4.0 mg/kg 2011 River Mile 10.9 Sediment Investigation2011 RM10.9-0345 0.5 1.5 Total PCB 3.7 mg/kg 2011 River Mile 10.9 Sediment Investigation2011 RM10.9-0330 0.5 1.5 Total PCB 3.7 mg/kg 2011 River Mile 10.9 Sediment Investigation2011 RM10.9-0309 0.5 1.5 Total PCB 2.3 mg/kg 2011 River Mile 10.9 Sediment Investigation2011 RM10.9-0317 0.5 1.5 Total PCB 2.3 mg/kg 2011 River Mile 10.9 Sediment Investigation2011 RM10.9-0315 0.5 1.5 Total PCB 2.1 mg/kg 2011 River Mile 10.9 Sediment Investigation2011 RM10.9-0304 0.5 1.5 Total PCB 2.0 mg/kg 2011 River Mile 10.9 Sediment Investigation2011 RM10.9-0328 0.5 1.5 Total PCB 1.8 mg/kg 2011 River Mile 10.9 Sediment Investigation2011 RM10.9-0306 0.5 1.5 Total PCB 1.7 mg/kg 2011 River Mile 10.9 Sediment Investigation2011 RM10.9-0347 0.5 1.5 Total PCB 1.7 mg/kg 2011 River Mile 10.9 Sediment Investigation2011 RM10.9-0302 0.5 1.5 Total PCB 1.6 mg/kg 2011 River Mile 10.9 Sediment Investigation2011 RM10.9-0313 0.5 1.5 Total PCB 1.4 mg/kg 2011 River Mile 10.9 Sediment Investigation2011 RM10.9-0326 0.5 1.5 Total PCB 1.4 mg/kg 2011 River Mile 10.9 Sediment Investigation2011 RM10.9-0352 0.5 1.5 Total PCB 1.3 mg/kg 2011 River Mile 10.9 Sediment Investigation2011 RM10.9-0305 0.5 1.5 Total PCB 1.2 mg/kg 2011 River Mile 10.9 Sediment Investigation2011 RM10.9-0307 0.5 1.5 Total PCB 1.2 mg/kg 2011 River Mile 10.9 Sediment Investigation2011 RM10.9-0324 0.5 1.5 Total PCB 1.1 mg/kg 2011 River Mile 10.9 Sediment Investigation2011 RM10.9-0321 0.5 1.5 Total PCB 1.1 mg/kg 2011 River Mile 10.9 Sediment Investigation2011 RM10.9-0301 0.5 1.5 Total PCB 0.93 mg/kg 2011 River Mile 10.9 Sediment Investigation

Page 7 of 7
TABLE A-2bRM 10.9 Concentration Data for 2,3,7,8-TCDD, Mercury, and Total PCBs, 0.5 to 1.5 ft bgs IntervalRM 10.9 Pre-Final Design Report, Lower Passaic River Study Area, New Jersey
Sample Location Parameter Concentration Units Sampling ProgramDepth
Interval 2011 RM10.9-0323 0.5 1.5 Total PCB 0.69 mg/kg 2011 River Mile 10.9 Sediment Investigation
2011 RM10.9-0320 0.5 1.5 Total PCB 0.51 mg/kg 2011 River Mile 10.9 Sediment Investigation2011 RM10.9-0353 0.5 1.5 Total PCB 0.49 mg/kg 2011 River Mile 10.9 Sediment Investigation2011 RM10.9-0337 0.5 1.5 Total PCB 0.42 mg/kg 2011 River Mile 10.9 Sediment Investigation2011 RM10.9-0303 0.5 1.5 Total PCB 0.42 mg/kg 2011 River Mile 10.9 Sediment Investigation2011 RM10.9-0341 0.5 1.5 Total PCB 0.19 mg/kg 2011 River Mile 10.9 Sediment Investigation2011 RM10.9-0354 0.5 1.5 Total PCB 0.18 mg/kg 2011 River Mile 10.9 Sediment Investigation2011 RM10.9-0336 0.5 1.5 Total PCB 0.15 mg/kg 2011 River Mile 10.9 Sediment Investigation2011 RM10.9-0319 0.5 1.5 Total PCB 0.089 mg/kg 2011 River Mile 10.9 Sediment Investigation2011 RM10.9-0311 0.5 1.5 Total PCB 0.034 mg/kg 2011 River Mile 10.9 Sediment Investigation2012 CLRC-0481 0.5 1.5 Total PCB 24.3 mg/kg 2012 LRC Supplemental Sampling Program2012 RM10.9 A-0365 0.5 1.5 Total PCB 28.8 mg/kg 2012 River Mile 10.9 Sediment Investigation Addendum A2012 RM10.9 A-0366 0.5 1.5 Total PCB 15.8 mg/kg 2012 River Mile 10.9 Sediment Investigation Addendum A2012 RM10.9 A-0369 0.5 1.5 Total PCB 4.0 mg/kg 2012 River Mile 10.9 Sediment Investigation Addendum A2012 RM10.9 A-0368 0.5 1.5 Total PCB 2.2 mg/kg 2012 River Mile 10.9 Sediment Investigation Addendum A2012 RM10.9 A-0362 0.5 1.2 Total PCB 1.1 mg/kg 2012 River Mile 10.9 Sediment Investigation Addendum A2012 RM10.9 A-0360 0.5 1.3 Total PCB 0.42 mg/kg 2012 River Mile 10.9 Sediment Investigation Addendum A2012 RM10.9 A-0363 0.5 1 Total PCB 0.083 mg/kg 2012 River Mile 10.9 Sediment Investigation Addendum A2012 RM10.9 A-0358 0.5 1.5 Total PCB 0.020 mg/kg 2012 River Mile 10.9 Sediment Investigation Addendum A2012 RM10.9 A-0359 0.5 1.3 Total PCB 0.018 mg/kg 2012 River Mile 10.9 Sediment Investigation Addendum A2012 RM10.9 A-0361 0.5 0.9 Total PCB 0.0027 mg/kg 2012 River Mile 10.9 Sediment Investigation Addendum A2012 RM10.9 A-0357 0.5 1.5 Total PCB 0.0020 mg/kg 2012 River Mile 10.9 Sediment Investigation Addendum A2012 RM10.9 A-0356 0.5 1.5 Total PCB 0.0005 mg/kg 2012 River Mile 10.9 Sediment Investigation Addendum A2012 RM10.9 A-0355 0.5 1.5 Total PCB 0.0005 mg/kg 2012 River Mile 10.9 Sediment Investigation Addendum ANotes: Duplicate samples averaged. 2,3,7,8-TCDD, 2,3,7,8-tetrachlorodibenzo-p-dioxin; PCB, polychlorinated biphenyl;ft bgs, feet below ground (sediment) surface; ng/kg, nanograms per kilogram; mg/kg, milligrams per kilogram.
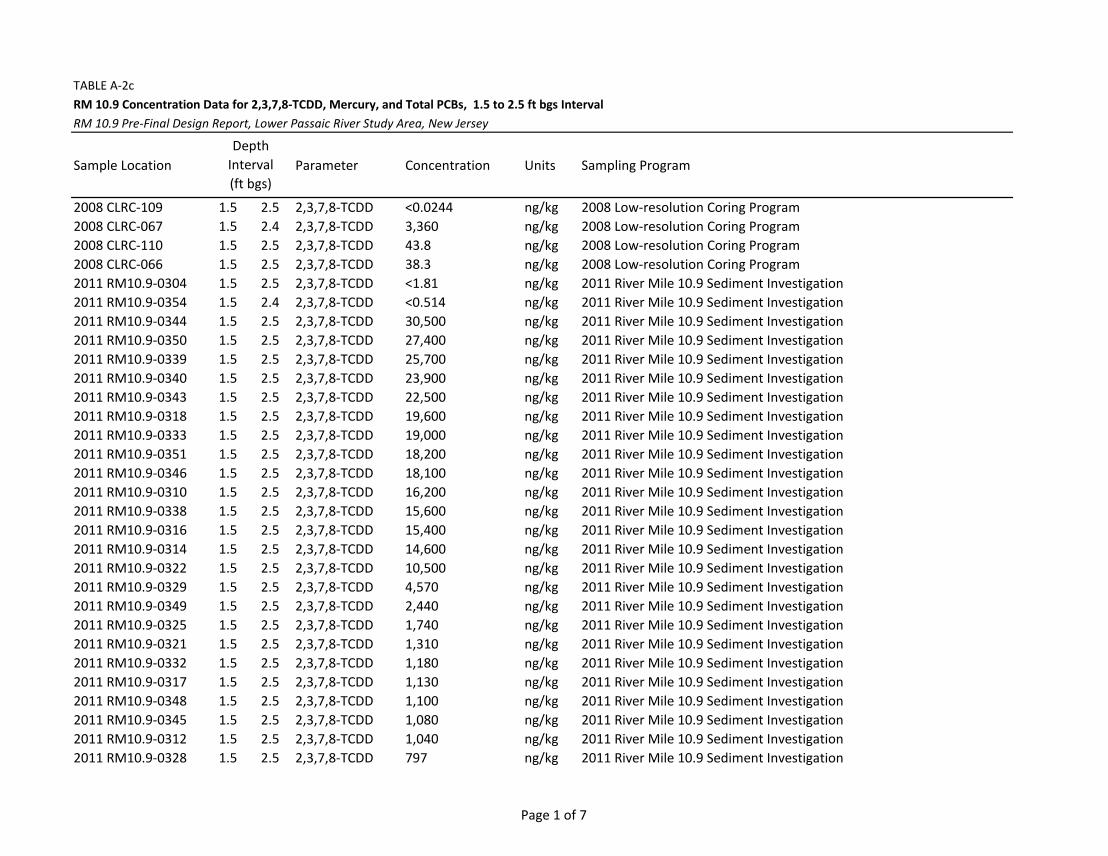
Page 1 of 7
TABLE A-2cRM 10.9 Concentration Data for 2,3,7,8-TCDD, Mercury, and Total PCBs, 1.5 to 2.5 ft bgs IntervalRM 10.9 Pre-Final Design Report, Lower Passaic River Study Area, New Jersey
Sample Location Parameter Concentration Units Sampling Program
2008 CLRC-109 1.5 2.5 2,3,7,8-TCDD <0.0244 ng/kg 2008 Low-resolution Coring Program2008 CLRC-067 1.5 2.4 2,3,7,8-TCDD 3,360 ng/kg 2008 Low-resolution Coring Program2008 CLRC-110 1.5 2.5 2,3,7,8-TCDD 43.8 ng/kg 2008 Low-resolution Coring Program2008 CLRC-066 1.5 2.5 2,3,7,8-TCDD 38.3 ng/kg 2008 Low-resolution Coring Program2011 RM10.9-0304 1.5 2.5 2,3,7,8-TCDD <1.81 ng/kg 2011 River Mile 10.9 Sediment Investigation2011 RM10.9-0354 1.5 2.4 2,3,7,8-TCDD <0.514 ng/kg 2011 River Mile 10.9 Sediment Investigation2011 RM10.9-0344 1.5 2.5 2,3,7,8-TCDD 30,500 ng/kg 2011 River Mile 10.9 Sediment Investigation2011 RM10.9-0350 1.5 2.5 2,3,7,8-TCDD 27,400 ng/kg 2011 River Mile 10.9 Sediment Investigation2011 RM10.9-0339 1.5 2.5 2,3,7,8-TCDD 25,700 ng/kg 2011 River Mile 10.9 Sediment Investigation2011 RM10.9-0340 1.5 2.5 2,3,7,8-TCDD 23,900 ng/kg 2011 River Mile 10.9 Sediment Investigation2011 RM10.9-0343 1.5 2.5 2,3,7,8-TCDD 22,500 ng/kg 2011 River Mile 10.9 Sediment Investigation2011 RM10.9-0318 1.5 2.5 2,3,7,8-TCDD 19,600 ng/kg 2011 River Mile 10.9 Sediment Investigation2011 RM10.9-0333 1.5 2.5 2,3,7,8-TCDD 19,000 ng/kg 2011 River Mile 10.9 Sediment Investigation2011 RM10.9-0351 1.5 2.5 2,3,7,8-TCDD 18,200 ng/kg 2011 River Mile 10.9 Sediment Investigation2011 RM10.9-0346 1.5 2.5 2,3,7,8-TCDD 18,100 ng/kg 2011 River Mile 10.9 Sediment Investigation2011 RM10.9-0310 1.5 2.5 2,3,7,8-TCDD 16,200 ng/kg 2011 River Mile 10.9 Sediment Investigation2011 RM10.9-0338 1.5 2.5 2,3,7,8-TCDD 15,600 ng/kg 2011 River Mile 10.9 Sediment Investigation2011 RM10.9-0316 1.5 2.5 2,3,7,8-TCDD 15,400 ng/kg 2011 River Mile 10.9 Sediment Investigation2011 RM10.9-0314 1.5 2.5 2,3,7,8-TCDD 14,600 ng/kg 2011 River Mile 10.9 Sediment Investigation2011 RM10.9-0322 1.5 2.5 2,3,7,8-TCDD 10,500 ng/kg 2011 River Mile 10.9 Sediment Investigation2011 RM10.9-0329 1.5 2.5 2,3,7,8-TCDD 4,570 ng/kg 2011 River Mile 10.9 Sediment Investigation2011 RM10.9-0349 1.5 2.5 2,3,7,8-TCDD 2,440 ng/kg 2011 River Mile 10.9 Sediment Investigation2011 RM10.9-0325 1.5 2.5 2,3,7,8-TCDD 1,740 ng/kg 2011 River Mile 10.9 Sediment Investigation2011 RM10.9-0321 1.5 2.5 2,3,7,8-TCDD 1,310 ng/kg 2011 River Mile 10.9 Sediment Investigation2011 RM10.9-0332 1.5 2.5 2,3,7,8-TCDD 1,180 ng/kg 2011 River Mile 10.9 Sediment Investigation2011 RM10.9-0317 1.5 2.5 2,3,7,8-TCDD 1,130 ng/kg 2011 River Mile 10.9 Sediment Investigation2011 RM10.9-0348 1.5 2.5 2,3,7,8-TCDD 1,100 ng/kg 2011 River Mile 10.9 Sediment Investigation2011 RM10.9-0345 1.5 2.5 2,3,7,8-TCDD 1,080 ng/kg 2011 River Mile 10.9 Sediment Investigation2011 RM10.9-0312 1.5 2.5 2,3,7,8-TCDD 1,040 ng/kg 2011 River Mile 10.9 Sediment Investigation2011 RM10.9-0328 1.5 2.5 2,3,7,8-TCDD 797 ng/kg 2011 River Mile 10.9 Sediment Investigation
Depth Interval(ft bgs)

Page 2 of 7
TABLE A-2cRM 10.9 Concentration Data for 2,3,7,8-TCDD, Mercury, and Total PCBs, 1.5 to 2.5 ft bgs IntervalRM 10.9 Pre-Final Design Report, Lower Passaic River Study Area, New Jersey
Sample Location Parameter Concentration Units Sampling ProgramDepth
Interval(ft bgs)
2011 RM10.9-0342 1.5 2.5 2,3,7,8-TCDD 795 ng/kg 2011 River Mile 10.9 Sediment Investigation2011 RM10.9-0315 1.5 2.5 2,3,7,8-TCDD 734 ng/kg 2011 River Mile 10.9 Sediment Investigation2011 RM10.9-0309 1.5 2.5 2,3,7,8-TCDD 594 ng/kg 2011 River Mile 10.9 Sediment Investigation2011 RM10.9-0327 1.5 2.5 2,3,7,8-TCDD 581 ng/kg 2011 River Mile 10.9 Sediment Investigation2011 RM10.9-0306 1.5 2.5 2,3,7,8-TCDD 525 ng/kg 2011 River Mile 10.9 Sediment Investigation2011 RM10.9-0337 1.5 2.5 2,3,7,8-TCDD 434 ng/kg 2011 River Mile 10.9 Sediment Investigation2011 RM10.9-0301 1.5 2.5 2,3,7,8-TCDD 432 ng/kg 2011 River Mile 10.9 Sediment Investigation2011 RM10.9-0302 1.5 2.5 2,3,7,8-TCDD 412 ng/kg 2011 River Mile 10.9 Sediment Investigation2011 RM10.9-0308 1.5 2.5 2,3,7,8-TCDD 385 ng/kg 2011 River Mile 10.9 Sediment Investigation2011 RM10.9-0303 1.5 2.5 2,3,7,8-TCDD 367 ng/kg 2011 River Mile 10.9 Sediment Investigation2011 RM10.9-0313 1.5 2.5 2,3,7,8-TCDD 365 ng/kg 2011 River Mile 10.9 Sediment Investigation2011 RM10.9-0305 1.5 2.5 2,3,7,8-TCDD 300 ng/kg 2011 River Mile 10.9 Sediment Investigation2011 RM10.9-0324 1.5 2.5 2,3,7,8-TCDD 171 ng/kg 2011 River Mile 10.9 Sediment Investigation2011 RM10.9-0336 1.5 2.5 2,3,7,8-TCDD 146 ng/kg 2011 River Mile 10.9 Sediment Investigation2011 RM10.9-0334 1.5 2.5 2,3,7,8-TCDD 75.9 ng/kg 2011 River Mile 10.9 Sediment Investigation2011 RM10.9-0341 1.5 2.5 2,3,7,8-TCDD 71.0 ng/kg 2011 River Mile 10.9 Sediment Investigation2011 RM10.9-0347 1.5 2.5 2,3,7,8-TCDD 68.1 ng/kg 2011 River Mile 10.9 Sediment Investigation2011 RM10.9-0330 1.5 2.5 2,3,7,8-TCDD 54.2 ng/kg 2011 River Mile 10.9 Sediment Investigation2011 RM10.9-0335 1.5 2.5 2,3,7,8-TCDD 44.2 ng/kg 2011 River Mile 10.9 Sediment Investigation2011 RM10.9-0320 1.5 2.5 2,3,7,8-TCDD 37.4 ng/kg 2011 River Mile 10.9 Sediment Investigation2011 RM10.9-0307 1.5 2.5 2,3,7,8-TCDD 35.2 ng/kg 2011 River Mile 10.9 Sediment Investigation2011 RM10.9-0352 1.5 2.5 2,3,7,8-TCDD 29.9 ng/kg 2011 River Mile 10.9 Sediment Investigation2011 RM10.9-0326 1.5 2.5 2,3,7,8-TCDD 14.8 ng/kg 2011 River Mile 10.9 Sediment Investigation2011 RM10.9-0331 1.5 2.5 2,3,7,8-TCDD 13.5 ng/kg 2011 River Mile 10.9 Sediment Investigation2011 RM10.9-0311 1.5 2.5 2,3,7,8-TCDD 10.5 ng/kg 2011 River Mile 10.9 Sediment Investigation2011 RM10.9-0323 1.5 2.5 2,3,7,8-TCDD 7.9 ng/kg 2011 River Mile 10.9 Sediment Investigation2011 RM10.9-0353 1.5 2.5 2,3,7,8-TCDD 3.4 ng/kg 2011 River Mile 10.9 Sediment Investigation2011 RM10.9-0319 1.5 2.5 2,3,7,8-TCDD 2.1 ng/kg 2011 River Mile 10.9 Sediment Investigation2012 CLRC-0481 1.5 2.41 2,3,7,8-TCDD 67.8 ng/kg 2012 LRC Supplemental Sampling Program2012 RM10.9 A-0356 1.5 2.5 2,3,7,8-TCDD <0.245 ng/kg 2012 River Mile 10.9 Sediment Investigation Addendum A

Page 3 of 7
TABLE A-2cRM 10.9 Concentration Data for 2,3,7,8-TCDD, Mercury, and Total PCBs, 1.5 to 2.5 ft bgs IntervalRM 10.9 Pre-Final Design Report, Lower Passaic River Study Area, New Jersey
Sample Location Parameter Concentration Units Sampling ProgramDepth
Interval(ft bgs)
2012 RM10.9 A-0357 1.5 2.5 2,3,7,8-TCDD <0.137 ng/kg 2012 River Mile 10.9 Sediment Investigation Addendum A2012 RM10.9 A-0355 1.5 2.5 2,3,7,8-TCDD <0.107 ng/kg 2012 River Mile 10.9 Sediment Investigation Addendum A2012 RM10.9 A-0366 1.5 2.2 2,3,7,8-TCDD 9,170 ng/kg 2012 River Mile 10.9 Sediment Investigation Addendum A2012 RM10.9 A-0365 1.5 2.5 2,3,7,8-TCDD 4,030 ng/kg 2012 River Mile 10.9 Sediment Investigation Addendum A2012 RM10.9 A-0369 1.5 2.75 2,3,7,8-TCDD 3.9 ng/kg 2012 River Mile 10.9 Sediment Investigation Addendum A2012 RM10.9 A-0368 1.5 2.2 2,3,7,8-TCDD 2.4 ng/kg 2012 River Mile 10.9 Sediment Investigation Addendum A2008 CLRC-067 1.5 2.4 Mercury 5.1 mg/kg 2008 Low-resolution Coring Program2008 CLRC-110 1.5 2.5 Mercury 0.52 mg/kg 2008 Low-resolution Coring Program2008 CLRC-066 1.5 2.5 Mercury 0.40 mg/kg 2008 Low-resolution Coring Program2008 CLRC-109 1.5 2.5 Mercury 0.025 mg/kg 2008 Low-resolution Coring Program2011 RM10.9-0351 1.5 2.5 Mercury 24.0 mg/kg 2011 River Mile 10.9 Sediment Investigation2011 RM10.9-0343 1.5 2.5 Mercury 19.5 mg/kg 2011 River Mile 10.9 Sediment Investigation2011 RM10.9-0314 1.5 2.5 Mercury 18.9 mg/kg 2011 River Mile 10.9 Sediment Investigation2011 RM10.9-0338 1.5 2.5 Mercury 17.7 mg/kg 2011 River Mile 10.9 Sediment Investigation2011 RM10.9-0333 1.5 2.5 Mercury 17.3 mg/kg 2011 River Mile 10.9 Sediment Investigation2011 RM10.9-0318 1.5 2.5 Mercury 14.4 mg/kg 2011 River Mile 10.9 Sediment Investigation2011 RM10.9-0332 1.5 2.5 Mercury 14.0 mg/kg 2011 River Mile 10.9 Sediment Investigation2011 RM10.9-0340 1.5 2.5 Mercury 13.2 mg/kg 2011 River Mile 10.9 Sediment Investigation2011 RM10.9-0310 1.5 2.5 Mercury 13.0 mg/kg 2011 River Mile 10.9 Sediment Investigation2011 RM10.9-0350 1.5 2.5 Mercury 13.0 mg/kg 2011 River Mile 10.9 Sediment Investigation2011 RM10.9-0322 1.5 2.5 Mercury 12.8 mg/kg 2011 River Mile 10.9 Sediment Investigation2011 RM10.9-0339 1.5 2.5 Mercury 12.6 mg/kg 2011 River Mile 10.9 Sediment Investigation2011 RM10.9-0344 1.5 2.5 Mercury 12.6 mg/kg 2011 River Mile 10.9 Sediment Investigation2011 RM10.9-0345 1.5 2.5 Mercury 12.1 mg/kg 2011 River Mile 10.9 Sediment Investigation2011 RM10.9-0312 1.5 2.5 Mercury 12.0 mg/kg 2011 River Mile 10.9 Sediment Investigation2011 RM10.9-0316 1.5 2.5 Mercury 10.8 mg/kg 2011 River Mile 10.9 Sediment Investigation2011 RM10.9-0346 1.5 2.5 Mercury 10.8 mg/kg 2011 River Mile 10.9 Sediment Investigation2011 RM10.9-0328 1.5 2.5 Mercury 9.7 mg/kg 2011 River Mile 10.9 Sediment Investigation2011 RM10.9-0329 1.5 2.5 Mercury 8.5 mg/kg 2011 River Mile 10.9 Sediment Investigation2011 RM10.9-0317 1.5 2.5 Mercury 7.9 mg/kg 2011 River Mile 10.9 Sediment Investigation

Page 4 of 7
TABLE A-2cRM 10.9 Concentration Data for 2,3,7,8-TCDD, Mercury, and Total PCBs, 1.5 to 2.5 ft bgs IntervalRM 10.9 Pre-Final Design Report, Lower Passaic River Study Area, New Jersey
Sample Location Parameter Concentration Units Sampling ProgramDepth
Interval(ft bgs)
2011 RM10.9-0321 1.5 2.5 Mercury 6.1 mg/kg 2011 River Mile 10.9 Sediment Investigation2011 RM10.9-0342 1.5 2.5 Mercury 5.9 mg/kg 2011 River Mile 10.9 Sediment Investigation2011 RM10.9-0308 1.5 2.5 Mercury 5.7 mg/kg 2011 River Mile 10.9 Sediment Investigation2011 RM10.9-0315 1.5 2.5 Mercury 5.2 mg/kg 2011 River Mile 10.9 Sediment Investigation2011 RM10.9-0337 1.5 2.5 Mercury 5.0 mg/kg 2011 River Mile 10.9 Sediment Investigation2011 RM10.9-0353 1.5 2.5 Mercury 4.3 mg/kg 2011 River Mile 10.9 Sediment Investigation2011 RM10.9-0327 1.5 2.5 Mercury 4.3 mg/kg 2011 River Mile 10.9 Sediment Investigation2011 RM10.9-0354 1.5 2.4 Mercury 4.1 mg/kg 2011 River Mile 10.9 Sediment Investigation2011 RM10.9-0325 1.5 2.5 Mercury 3.6 mg/kg 2011 River Mile 10.9 Sediment Investigation2011 RM10.9-0349 1.5 2.5 Mercury 3.5 mg/kg 2011 River Mile 10.9 Sediment Investigation2011 RM10.9-0319 1.5 2.5 Mercury 3.4 mg/kg 2011 River Mile 10.9 Sediment Investigation2011 RM10.9-0352 1.5 2.5 Mercury 3.3 mg/kg 2011 River Mile 10.9 Sediment Investigation2011 RM10.9-0348 1.5 2.5 Mercury 3.0 mg/kg 2011 River Mile 10.9 Sediment Investigation2011 RM10.9-0309 1.5 2.5 Mercury 2.9 mg/kg 2011 River Mile 10.9 Sediment Investigation2011 RM10.9-0303 1.5 2.5 Mercury 2.7 mg/kg 2011 River Mile 10.9 Sediment Investigation2011 RM10.9-0304 1.5 2.5 Mercury 2.7 mg/kg 2011 River Mile 10.9 Sediment Investigation2011 RM10.9-0306 1.5 2.5 Mercury 2.6 mg/kg 2011 River Mile 10.9 Sediment Investigation2011 RM10.9-0302 1.5 2.5 Mercury 2.5 mg/kg 2011 River Mile 10.9 Sediment Investigation2011 RM10.9-0330 1.5 2.5 Mercury 2.3 mg/kg 2011 River Mile 10.9 Sediment Investigation2011 RM10.9-0305 1.5 2.5 Mercury 1.9 mg/kg 2011 River Mile 10.9 Sediment Investigation2011 RM10.9-0313 1.5 2.5 Mercury 1.9 mg/kg 2011 River Mile 10.9 Sediment Investigation2011 RM10.9-0336 1.5 2.5 Mercury 1.8 mg/kg 2011 River Mile 10.9 Sediment Investigation2011 RM10.9-0301 1.5 2.5 Mercury 1.6 mg/kg 2011 River Mile 10.9 Sediment Investigation2011 RM10.9-0331 1.5 2.5 Mercury 1.2 mg/kg 2011 River Mile 10.9 Sediment Investigation2011 RM10.9-0335 1.5 2.5 Mercury 1.1 mg/kg 2011 River Mile 10.9 Sediment Investigation2011 RM10.9-0324 1.5 2.5 Mercury 1.0 mg/kg 2011 River Mile 10.9 Sediment Investigation2011 RM10.9-0341 1.5 2.5 Mercury 0.45 mg/kg 2011 River Mile 10.9 Sediment Investigation2011 RM10.9-0307 1.5 2.5 Mercury 0.42 mg/kg 2011 River Mile 10.9 Sediment Investigation2011 RM10.9-0320 1.5 2.5 Mercury 0.40 mg/kg 2011 River Mile 10.9 Sediment Investigation2011 RM10.9-0347 1.5 2.5 Mercury 0.29 mg/kg 2011 River Mile 10.9 Sediment Investigation

Page 5 of 7
TABLE A-2cRM 10.9 Concentration Data for 2,3,7,8-TCDD, Mercury, and Total PCBs, 1.5 to 2.5 ft bgs IntervalRM 10.9 Pre-Final Design Report, Lower Passaic River Study Area, New Jersey
Sample Location Parameter Concentration Units Sampling ProgramDepth
Interval(ft bgs)
2011 RM10.9-0311 1.5 2.5 Mercury 0.19 mg/kg 2011 River Mile 10.9 Sediment Investigation2011 RM10.9-0334 1.5 2.5 Mercury 0.13 mg/kg 2011 River Mile 10.9 Sediment Investigation2011 RM10.9-0326 1.5 2.5 Mercury 0.073 mg/kg 2011 River Mile 10.9 Sediment Investigation2011 RM10.9-0323 1.5 2.5 Mercury 0.023 mg/kg 2011 River Mile 10.9 Sediment Investigation2012 CLRC-0481 1.5 2.41 Mercury 4.1 mg/kg 2012 LRC Supplemental Sampling Program2012 RM10.9 A-0366 1.5 2.2 Mercury 11.6 mg/kg 2012 River Mile 10.9 Sediment Investigation Addendum A2012 RM10.9 A-0365 1.5 2.5 Mercury 6.4 mg/kg 2012 River Mile 10.9 Sediment Investigation Addendum A2012 RM10.9 A-0369 1.5 2.75 Mercury 2.4 mg/kg 2012 River Mile 10.9 Sediment Investigation Addendum A2012 RM10.9 A-0368 1.5 2.2 Mercury 0.11 mg/kg 2012 River Mile 10.9 Sediment Investigation Addendum A2012 RM10.9 A-0357 1.5 2.5 Mercury 0.017 mg/kg 2012 River Mile 10.9 Sediment Investigation Addendum A2012 RM10.9 A-0356 1.5 2.5 Mercury 0.011 mg/kg 2012 River Mile 10.9 Sediment Investigation Addendum A2012 RM10.9 A-0355 1.5 2.5 Mercury 0.0058 mg/kg 2012 River Mile 10.9 Sediment Investigation Addendum A2008 CLRC-067 1.5 2.4 Total PCB 2.1 mg/kg 2008 Low-resolution Coring Program2008 CLRC-066 1.5 2.5 Total PCB 1.6 mg/kg 2008 Low-resolution Coring Program2008 CLRC-110 1.5 2.5 Total PCB 0.35 mg/kg 2008 Low-resolution Coring Program2008 CLRC-109 1.5 2.5 Total PCB 0.00004 mg/kg 2008 Low-resolution Coring Program2011 RM10.9-0343 1.5 2.5 Total PCB 29.5 mg/kg 2011 River Mile 10.9 Sediment Investigation2011 RM10.9-0351 1.5 2.5 Total PCB 29.0 mg/kg 2011 River Mile 10.9 Sediment Investigation2011 RM10.9-0318 1.5 2.5 Total PCB 28.9 mg/kg 2011 River Mile 10.9 Sediment Investigation2011 RM10.9-0333 1.5 2.5 Total PCB 28.6 mg/kg 2011 River Mile 10.9 Sediment Investigation2011 RM10.9-0314 1.5 2.5 Total PCB 22.8 mg/kg 2011 River Mile 10.9 Sediment Investigation2011 RM10.9-0340 1.5 2.5 Total PCB 21.8 mg/kg 2011 River Mile 10.9 Sediment Investigation2011 RM10.9-0338 1.5 2.5 Total PCB 21.5 mg/kg 2011 River Mile 10.9 Sediment Investigation2011 RM10.9-0346 1.5 2.5 Total PCB 21.5 mg/kg 2011 River Mile 10.9 Sediment Investigation2011 RM10.9-0350 1.5 2.5 Total PCB 21.3 mg/kg 2011 River Mile 10.9 Sediment Investigation2011 RM10.9-0339 1.5 2.5 Total PCB 20.9 mg/kg 2011 River Mile 10.9 Sediment Investigation2011 RM10.9-0344 1.5 2.5 Total PCB 20.8 mg/kg 2011 River Mile 10.9 Sediment Investigation2011 RM10.9-0322 1.5 2.5 Total PCB 19.0 mg/kg 2011 River Mile 10.9 Sediment Investigation2011 RM10.9-0316 1.5 2.5 Total PCB 16.9 mg/kg 2011 River Mile 10.9 Sediment Investigation2011 RM10.9-0329 1.5 2.5 Total PCB 8.2 mg/kg 2011 River Mile 10.9 Sediment Investigation
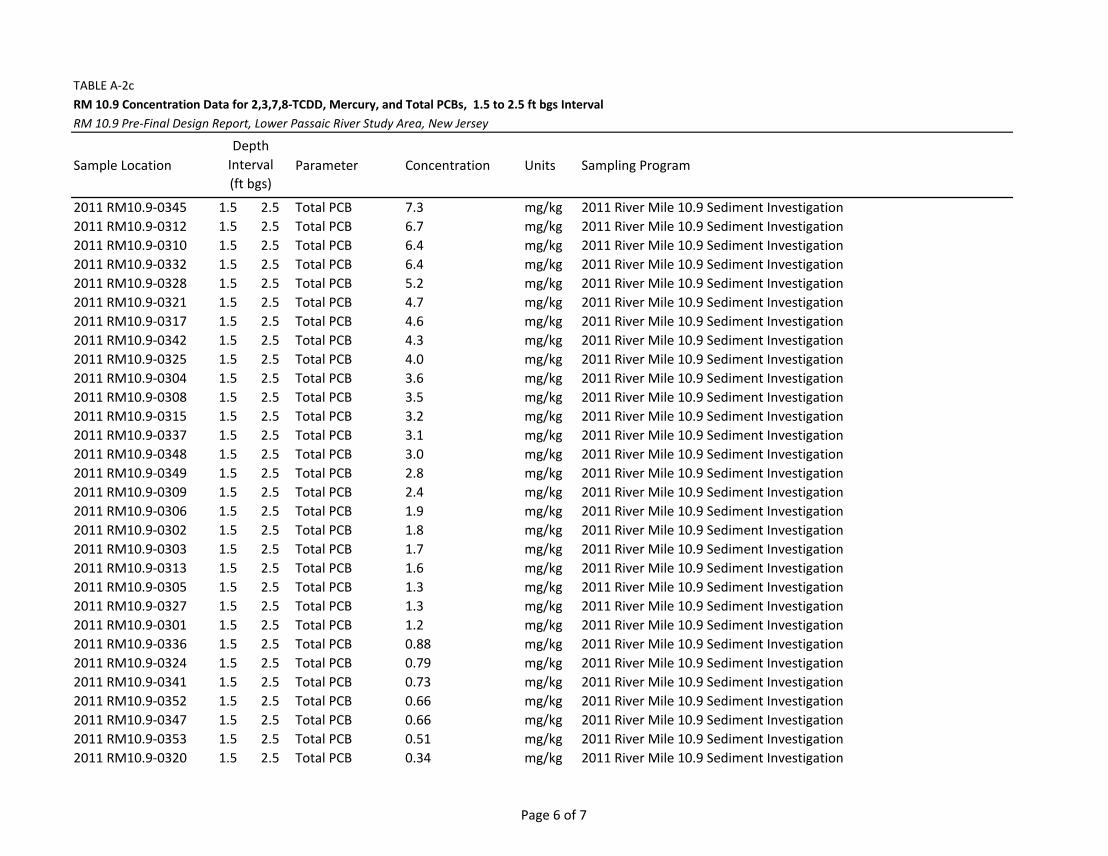
Page 6 of 7
TABLE A-2cRM 10.9 Concentration Data for 2,3,7,8-TCDD, Mercury, and Total PCBs, 1.5 to 2.5 ft bgs IntervalRM 10.9 Pre-Final Design Report, Lower Passaic River Study Area, New Jersey
Sample Location Parameter Concentration Units Sampling ProgramDepth
Interval(ft bgs)
2011 RM10.9-0345 1.5 2.5 Total PCB 7.3 mg/kg 2011 River Mile 10.9 Sediment Investigation2011 RM10.9-0312 1.5 2.5 Total PCB 6.7 mg/kg 2011 River Mile 10.9 Sediment Investigation2011 RM10.9-0310 1.5 2.5 Total PCB 6.4 mg/kg 2011 River Mile 10.9 Sediment Investigation2011 RM10.9-0332 1.5 2.5 Total PCB 6.4 mg/kg 2011 River Mile 10.9 Sediment Investigation2011 RM10.9-0328 1.5 2.5 Total PCB 5.2 mg/kg 2011 River Mile 10.9 Sediment Investigation2011 RM10.9-0321 1.5 2.5 Total PCB 4.7 mg/kg 2011 River Mile 10.9 Sediment Investigation2011 RM10.9-0317 1.5 2.5 Total PCB 4.6 mg/kg 2011 River Mile 10.9 Sediment Investigation2011 RM10.9-0342 1.5 2.5 Total PCB 4.3 mg/kg 2011 River Mile 10.9 Sediment Investigation2011 RM10.9-0325 1.5 2.5 Total PCB 4.0 mg/kg 2011 River Mile 10.9 Sediment Investigation2011 RM10.9-0304 1.5 2.5 Total PCB 3.6 mg/kg 2011 River Mile 10.9 Sediment Investigation2011 RM10.9-0308 1.5 2.5 Total PCB 3.5 mg/kg 2011 River Mile 10.9 Sediment Investigation2011 RM10.9-0315 1.5 2.5 Total PCB 3.2 mg/kg 2011 River Mile 10.9 Sediment Investigation2011 RM10.9-0337 1.5 2.5 Total PCB 3.1 mg/kg 2011 River Mile 10.9 Sediment Investigation2011 RM10.9-0348 1.5 2.5 Total PCB 3.0 mg/kg 2011 River Mile 10.9 Sediment Investigation2011 RM10.9-0349 1.5 2.5 Total PCB 2.8 mg/kg 2011 River Mile 10.9 Sediment Investigation2011 RM10.9-0309 1.5 2.5 Total PCB 2.4 mg/kg 2011 River Mile 10.9 Sediment Investigation2011 RM10.9-0306 1.5 2.5 Total PCB 1.9 mg/kg 2011 River Mile 10.9 Sediment Investigation2011 RM10.9-0302 1.5 2.5 Total PCB 1.8 mg/kg 2011 River Mile 10.9 Sediment Investigation2011 RM10.9-0303 1.5 2.5 Total PCB 1.7 mg/kg 2011 River Mile 10.9 Sediment Investigation2011 RM10.9-0313 1.5 2.5 Total PCB 1.6 mg/kg 2011 River Mile 10.9 Sediment Investigation2011 RM10.9-0305 1.5 2.5 Total PCB 1.3 mg/kg 2011 River Mile 10.9 Sediment Investigation2011 RM10.9-0327 1.5 2.5 Total PCB 1.3 mg/kg 2011 River Mile 10.9 Sediment Investigation2011 RM10.9-0301 1.5 2.5 Total PCB 1.2 mg/kg 2011 River Mile 10.9 Sediment Investigation2011 RM10.9-0336 1.5 2.5 Total PCB 0.88 mg/kg 2011 River Mile 10.9 Sediment Investigation2011 RM10.9-0324 1.5 2.5 Total PCB 0.79 mg/kg 2011 River Mile 10.9 Sediment Investigation2011 RM10.9-0341 1.5 2.5 Total PCB 0.73 mg/kg 2011 River Mile 10.9 Sediment Investigation2011 RM10.9-0352 1.5 2.5 Total PCB 0.66 mg/kg 2011 River Mile 10.9 Sediment Investigation2011 RM10.9-0347 1.5 2.5 Total PCB 0.66 mg/kg 2011 River Mile 10.9 Sediment Investigation2011 RM10.9-0353 1.5 2.5 Total PCB 0.51 mg/kg 2011 River Mile 10.9 Sediment Investigation2011 RM10.9-0320 1.5 2.5 Total PCB 0.34 mg/kg 2011 River Mile 10.9 Sediment Investigation

Page 7 of 7
TABLE A-2cRM 10.9 Concentration Data for 2,3,7,8-TCDD, Mercury, and Total PCBs, 1.5 to 2.5 ft bgs IntervalRM 10.9 Pre-Final Design Report, Lower Passaic River Study Area, New Jersey
Sample Location Parameter Concentration Units Sampling ProgramDepth
Interval(ft bgs)
2011 RM10.9-0307 1.5 2.5 Total PCB 0.20 mg/kg 2011 River Mile 10.9 Sediment Investigation2011 RM10.9-0330 1.5 2.5 Total PCB 0.12 mg/kg 2011 River Mile 10.9 Sediment Investigation2011 RM10.9-0335 1.5 2.5 Total PCB 0.10 mg/kg 2011 River Mile 10.9 Sediment Investigation2011 RM10.9-0334 1.5 2.5 Total PCB 0.098 mg/kg 2011 River Mile 10.9 Sediment Investigation2011 RM10.9-0311 1.5 2.5 Total PCB 0.091 mg/kg 2011 River Mile 10.9 Sediment Investigation2011 RM10.9-0354 1.5 2.4 Total PCB 0.056 mg/kg 2011 River Mile 10.9 Sediment Investigation2011 RM10.9-0331 1.5 2.5 Total PCB 0.023 mg/kg 2011 River Mile 10.9 Sediment Investigation2011 RM10.9-0326 1.5 2.5 Total PCB 0.021 mg/kg 2011 River Mile 10.9 Sediment Investigation2011 RM10.9-0323 1.5 2.5 Total PCB 0.0070 mg/kg 2011 River Mile 10.9 Sediment Investigation2011 RM10.9-0319 1.5 2.5 Total PCB 0.0048 mg/kg 2011 River Mile 10.9 Sediment Investigation2012 CLRC-0481 1.5 2.41 Total PCB 0.55 mg/kg 2012 LRC Supplemental Sampling Program2012 RM10.9 A-0366 1.5 2.2 Total PCB 10.7 mg/kg 2012 River Mile 10.9 Sediment Investigation Addendum A2012 RM10.9 A-0365 1.5 2.5 Total PCB 6.8 mg/kg 2012 River Mile 10.9 Sediment Investigation Addendum A2012 RM10.9 A-0369 1.5 2.75 Total PCB 0.16 mg/kg 2012 River Mile 10.9 Sediment Investigation Addendum A2012 RM10.9 A-0368 1.5 2.2 Total PCB 0.012 mg/kg 2012 River Mile 10.9 Sediment Investigation Addendum A2012 RM10.9 A-0357 1.5 2.5 Total PCB 0.0004 mg/kg 2012 River Mile 10.9 Sediment Investigation Addendum A2012 RM10.9 A-0355 1.5 2.5 Total PCB 0.0002 mg/kg 2012 River Mile 10.9 Sediment Investigation Addendum A2012 RM10.9 A-0356 1.5 2.5 Total PCB 0.0002 mg/kg 2012 River Mile 10.9 Sediment Investigation Addendum ANotes: Duplicate samples averaged. 2,3,7,8-TCDD, 2,3,7,8-tetrachlorodibenzo-p-dioxin; PCB, polychlorinated biphenyl;ft bgs, feet below ground (sediment) surface; ng/kg, nanograms per kilogram; mg/kg, milligrams per kilogram.

Page 1 of 7
TABLE A-2dRM 10.9 Concentration Data for 2,3,7,8-TCDD, Mercury, and Total PCBs, 2.5 to 3.5 ft bgs IntervalRM 10.9 Pre-Final Design Report, Lower Passaic River Study Area, New Jersey
Sample Location Parameter Concentration Units Sampling Program
2008 CLRC-109 2.5 3.5 2,3,7,8-TCDD <0.0282 ng/kg 2008 Low-resolution Coring Program2008 CLRC-066 2.5 3.5 2,3,7,8-TCDD 33.8 ng/kg 2008 Low-resolution Coring Program2008 CLRC-110 2.5 3.5 2,3,7,8-TCDD 29.4 ng/kg 2008 Low-resolution Coring Program2008 CLRC-067 2.4 3.3 2,3,7,8-TCDD 14.4 ng/kg 2008 Low-resolution Coring Program2011 RM10.9-0326 2.5 3.5 2,3,7,8-TCDD <1.66 ng/kg 2011 River Mile 10.9 Sediment Investigation2011 RM10.9-0319 2.5 3.5 2,3,7,8-TCDD <1.43 ng/kg 2011 River Mile 10.9 Sediment Investigation2011 RM10.9-0330 2.5 3.5 2,3,7,8-TCDD <1.33 ng/kg 2011 River Mile 10.9 Sediment Investigation2011 RM10.9-0353 2.5 3 2,3,7,8-TCDD <0.0805 ng/kg 2011 River Mile 10.9 Sediment Investigation2011 RM10.9-0344 2.5 3.5 2,3,7,8-TCDD 29,800 ng/kg 2011 River Mile 10.9 Sediment Investigation2011 RM10.9-0339 2.5 3.5 2,3,7,8-TCDD 27,500 ng/kg 2011 River Mile 10.9 Sediment Investigation2011 RM10.9-0351 2.5 3.5 2,3,7,8-TCDD 23,800 ng/kg 2011 River Mile 10.9 Sediment Investigation2011 RM10.9-0322 2.5 3.5 2,3,7,8-TCDD 22,800 ng/kg 2011 River Mile 10.9 Sediment Investigation2011 RM10.9-0333 2.5 3.5 2,3,7,8-TCDD 21,900 ng/kg 2011 River Mile 10.9 Sediment Investigation2011 RM10.9-0343 2.5 3.5 2,3,7,8-TCDD 21,100 ng/kg 2011 River Mile 10.9 Sediment Investigation2011 RM10.9-0318 2.5 3.5 2,3,7,8-TCDD 19,100 ng/kg 2011 River Mile 10.9 Sediment Investigation2011 RM10.9-0338 2.5 3.5 2,3,7,8-TCDD 18,100 ng/kg 2011 River Mile 10.9 Sediment Investigation2011 RM10.9-0314 2.5 3.5 2,3,7,8-TCDD 17,850 ng/kg 2011 River Mile 10.9 Sediment Investigation2011 RM10.9-0340 2.5 3.5 2,3,7,8-TCDD 11,200 ng/kg 2011 River Mile 10.9 Sediment Investigation2011 RM10.9-0350 2.5 3.5 2,3,7,8-TCDD 4,060 ng/kg 2011 River Mile 10.9 Sediment Investigation2011 RM10.9-0325 2.5 3.5 2,3,7,8-TCDD 3,660 ng/kg 2011 River Mile 10.9 Sediment Investigation2011 RM10.9-0346 2.5 3.5 2,3,7,8-TCDD 3,080 ng/kg 2011 River Mile 10.9 Sediment Investigation2011 RM10.9-0304 2.5 3.5 2,3,7,8-TCDD 2,435 ng/kg 2011 River Mile 10.9 Sediment Investigation2011 RM10.9-0309 2.5 3.5 2,3,7,8-TCDD 1,890 ng/kg 2011 River Mile 10.9 Sediment Investigation2011 RM10.9-0302 2.5 3.5 2,3,7,8-TCDD 1,790 ng/kg 2011 River Mile 10.9 Sediment Investigation2011 RM10.9-0348 2.5 2.8 2,3,7,8-TCDD 1,360 ng/kg 2011 River Mile 10.9 Sediment Investigation2011 RM10.9-0321 2.5 3.5 2,3,7,8-TCDD 1,020 ng/kg 2011 River Mile 10.9 Sediment Investigation2011 RM10.9-0312 2.5 3.5 2,3,7,8-TCDD 1,010 ng/kg 2011 River Mile 10.9 Sediment Investigation2011 RM10.9-0317 2.5 3.5 2,3,7,8-TCDD 926 ng/kg 2011 River Mile 10.9 Sediment Investigation2011 RM10.9-0307 2.5 3.5 2,3,7,8-TCDD 873 ng/kg 2011 River Mile 10.9 Sediment Investigation
Depth Interval(ft bgs)

Page 2 of 7
TABLE A-2dRM 10.9 Concentration Data for 2,3,7,8-TCDD, Mercury, and Total PCBs, 2.5 to 3.5 ft bgs IntervalRM 10.9 Pre-Final Design Report, Lower Passaic River Study Area, New Jersey
Sample Location Parameter Concentration Units Sampling ProgramDepth
Interval(ft bgs)
2011 RM10.9-0310 2.5 3.5 2,3,7,8-TCDD 817 ng/kg 2011 River Mile 10.9 Sediment Investigation2011 RM10.9-0332 2.5 3.5 2,3,7,8-TCDD 782 ng/kg 2011 River Mile 10.9 Sediment Investigation2011 RM10.9-0316 2.5 3.5 2,3,7,8-TCDD 756 ng/kg 2011 River Mile 10.9 Sediment Investigation2011 RM10.9-0315 2.5 3.5 2,3,7,8-TCDD 732 ng/kg 2011 River Mile 10.9 Sediment Investigation2011 RM10.9-0306 2.5 3.5 2,3,7,8-TCDD 712 ng/kg 2011 River Mile 10.9 Sediment Investigation2011 RM10.9-0301 2.5 3.5 2,3,7,8-TCDD 711 ng/kg 2011 River Mile 10.9 Sediment Investigation2011 RM10.9-0305 2.5 3.5 2,3,7,8-TCDD 638 ng/kg 2011 River Mile 10.9 Sediment Investigation2011 RM10.9-0313 2.5 3.5 2,3,7,8-TCDD 621 ng/kg 2011 River Mile 10.9 Sediment Investigation2011 RM10.9-0311 2.5 3.5 2,3,7,8-TCDD 590 ng/kg 2011 River Mile 10.9 Sediment Investigation2011 RM10.9-0342 2.5 3.5 2,3,7,8-TCDD 428 ng/kg 2011 River Mile 10.9 Sediment Investigation2011 RM10.9-0308 2.5 3.5 2,3,7,8-TCDD 380 ng/kg 2011 River Mile 10.9 Sediment Investigation2011 RM10.9-0328 2.5 3.5 2,3,7,8-TCDD 323 ng/kg 2011 River Mile 10.9 Sediment Investigation2011 RM10.9-0337 2.5 3.5 2,3,7,8-TCDD 307 ng/kg 2011 River Mile 10.9 Sediment Investigation2011 RM10.9-0345 2.5 3.5 2,3,7,8-TCDD 219 ng/kg 2011 River Mile 10.9 Sediment Investigation2011 RM10.9-0324 2.5 3.5 2,3,7,8-TCDD 192 ng/kg 2011 River Mile 10.9 Sediment Investigation2011 RM10.9-0336 2.5 3.5 2,3,7,8-TCDD 90.5 ng/kg 2011 River Mile 10.9 Sediment Investigation2011 RM10.9-0303 2.5 3.5 2,3,7,8-TCDD 84.1 ng/kg 2011 River Mile 10.9 Sediment Investigation2011 RM10.9-0329 2.5 3.5 2,3,7,8-TCDD 78.1 ng/kg 2011 River Mile 10.9 Sediment Investigation2011 RM10.9-0320 2.5 3.5 2,3,7,8-TCDD 37.7 ng/kg 2011 River Mile 10.9 Sediment Investigation2011 RM10.9-0341 2.5 3.1 2,3,7,8-TCDD 31.1 ng/kg 2011 River Mile 10.9 Sediment Investigation2011 RM10.9-0347 2.5 3.5 2,3,7,8-TCDD 26.3 ng/kg 2011 River Mile 10.9 Sediment Investigation2011 RM10.9-0331 2.5 3.5 2,3,7,8-TCDD 9.2 ng/kg 2011 River Mile 10.9 Sediment Investigation2011 RM10.9-0334 2.5 3.5 2,3,7,8-TCDD 5.4 ng/kg 2011 River Mile 10.9 Sediment Investigation2011 RM10.9-0349 2.5 3.5 2,3,7,8-TCDD 4.5 ng/kg 2011 River Mile 10.9 Sediment Investigation2011 RM10.9-0327 2.5 3.8 2,3,7,8-TCDD 4.0 ng/kg 2011 River Mile 10.9 Sediment Investigation2011 RM10.9-0352 2.5 3.5 2,3,7,8-TCDD 2.4 ng/kg 2011 River Mile 10.9 Sediment Investigation2011 RM10.9-0335 2.5 3.5 2,3,7,8-TCDD 1.2 ng/kg 2011 River Mile 10.9 Sediment Investigation2011 RM10.9-0323 2.5 3.5 2,3,7,8-TCDD 0.96 ng/kg 2011 River Mile 10.9 Sediment Investigation2012 RM10.9 A-0355 2.5 3.74 2,3,7,8-TCDD <0.135 ng/kg 2012 River Mile 10.9 Sediment Investigation Addendum A

Page 3 of 7
TABLE A-2dRM 10.9 Concentration Data for 2,3,7,8-TCDD, Mercury, and Total PCBs, 2.5 to 3.5 ft bgs IntervalRM 10.9 Pre-Final Design Report, Lower Passaic River Study Area, New Jersey
Sample Location Parameter Concentration Units Sampling ProgramDepth
Interval(ft bgs)
2012 RM10.9 A-0356 2.5 4 2,3,7,8-TCDD <0.103 ng/kg 2012 River Mile 10.9 Sediment Investigation Addendum A2012 RM10.9 A-0365 2.5 3.5 2,3,7,8-TCDD 3,280 ng/kg 2012 River Mile 10.9 Sediment Investigation Addendum A2012 RM10.9 A-0357 2.5 4 2,3,7,8-TCDD 0.090 ng/kg 2012 River Mile 10.9 Sediment Investigation Addendum A2008 CLRC-066 2.5 3.5 Mercury 0.98 mg/kg 2008 Low-resolution Coring Program2008 CLRC-110 2.5 3.5 Mercury 0.38 mg/kg 2008 Low-resolution Coring Program2008 CLRC-067 2.4 3.3 Mercury 0.19 mg/kg 2008 Low-resolution Coring Program2008 CLRC-109 2.5 3.5 Mercury 0.039 mg/kg 2008 Low-resolution Coring Program2011 RM10.9-0338 2.5 3.5 Mercury 19.1 mg/kg 2011 River Mile 10.9 Sediment Investigation2011 RM10.9-0344 2.5 3.5 Mercury 17.1 mg/kg 2011 River Mile 10.9 Sediment Investigation2011 RM10.9-0333 2.5 3.5 Mercury 16.0 mg/kg 2011 River Mile 10.9 Sediment Investigation2011 RM10.9-0317 2.5 3.5 Mercury 15.8 mg/kg 2011 River Mile 10.9 Sediment Investigation2011 RM10.9-0351 2.5 3.5 Mercury 15.5 mg/kg 2011 River Mile 10.9 Sediment Investigation2011 RM10.9-0339 2.5 3.5 Mercury 15.4 mg/kg 2011 River Mile 10.9 Sediment Investigation2011 RM10.9-0350 2.5 3.5 Mercury 14.8 mg/kg 2011 River Mile 10.9 Sediment Investigation2011 RM10.9-0322 2.5 3.5 Mercury 14.4 mg/kg 2011 River Mile 10.9 Sediment Investigation2011 RM10.9-0314 2.5 3.5 Mercury 14.0 mg/kg 2011 River Mile 10.9 Sediment Investigation2011 RM10.9-0321 2.5 3.5 Mercury 12.9 mg/kg 2011 River Mile 10.9 Sediment Investigation2011 RM10.9-0343 2.5 3.5 Mercury 10.5 mg/kg 2011 River Mile 10.9 Sediment Investigation2011 RM10.9-0306 2.5 3.5 Mercury 10.0 mg/kg 2011 River Mile 10.9 Sediment Investigation2011 RM10.9-0329 2.5 3.5 Mercury 8.6 mg/kg 2011 River Mile 10.9 Sediment Investigation2011 RM10.9-0318 2.5 3.5 Mercury 8.5 mg/kg 2011 River Mile 10.9 Sediment Investigation2011 RM10.9-0340 2.5 3.5 Mercury 7.7 mg/kg 2011 River Mile 10.9 Sediment Investigation2011 RM10.9-0353 2.5 3 Mercury 7.1 mg/kg 2011 River Mile 10.9 Sediment Investigation2011 RM10.9-0348 2.5 3.21 Mercury 6.4 mg/kg 2011 River Mile 10.9 Sediment Investigation2011 RM10.9-0315 2.5 3.5 Mercury 6.1 mg/kg 2011 River Mile 10.9 Sediment Investigation2011 RM10.9-0309 2.5 3.5 Mercury 6.0 mg/kg 2011 River Mile 10.9 Sediment Investigation2011 RM10.9-0313 2.5 3.5 Mercury 6.0 mg/kg 2011 River Mile 10.9 Sediment Investigation2011 RM10.9-0325 2.5 3.5 Mercury 6.0 mg/kg 2011 River Mile 10.9 Sediment Investigation2011 RM10.9-0316 2.5 3.5 Mercury 5.6 mg/kg 2011 River Mile 10.9 Sediment Investigation

Page 4 of 7
TABLE A-2dRM 10.9 Concentration Data for 2,3,7,8-TCDD, Mercury, and Total PCBs, 2.5 to 3.5 ft bgs IntervalRM 10.9 Pre-Final Design Report, Lower Passaic River Study Area, New Jersey
Sample Location Parameter Concentration Units Sampling ProgramDepth
Interval(ft bgs)
2011 RM10.9-0312 2.5 3.5 Mercury 5.2 mg/kg 2011 River Mile 10.9 Sediment Investigation2011 RM10.9-0349 2.5 3.5 Mercury 4.6 mg/kg 2011 River Mile 10.9 Sediment Investigation2011 RM10.9-0305 2.5 3.5 Mercury 4.5 mg/kg 2011 River Mile 10.9 Sediment Investigation2011 RM10.9-0302 2.5 3.5 Mercury 4.0 mg/kg 2011 River Mile 10.9 Sediment Investigation2011 RM10.9-0310 2.5 3.5 Mercury 3.9 mg/kg 2011 River Mile 10.9 Sediment Investigation2011 RM10.9-0352 2.5 3.5 Mercury 3.3 mg/kg 2011 River Mile 10.9 Sediment Investigation2011 RM10.9-0301 2.5 3.5 Mercury 3.3 mg/kg 2011 River Mile 10.9 Sediment Investigation2011 RM10.9-0346 2.5 3.5 Mercury 3.2 mg/kg 2011 River Mile 10.9 Sediment Investigation2011 RM10.9-0332 2.5 3.5 Mercury 3.1 mg/kg 2011 River Mile 10.9 Sediment Investigation2011 RM10.9-0327 2.5 3.8 Mercury 3.1 mg/kg 2011 River Mile 10.9 Sediment Investigation2011 RM10.9-0341 2.5 3.1 Mercury 2.9 mg/kg 2011 River Mile 10.9 Sediment Investigation2011 RM10.9-0337 2.5 3.5 Mercury 2.5 mg/kg 2011 River Mile 10.9 Sediment Investigation2011 RM10.9-0307 2.5 3.5 Mercury 2.3 mg/kg 2011 River Mile 10.9 Sediment Investigation2011 RM10.9-0347 2.5 3.5 Mercury 2.3 mg/kg 2011 River Mile 10.9 Sediment Investigation2011 RM10.9-0304 2.5 3.5 Mercury 2.3 mg/kg 2011 River Mile 10.9 Sediment Investigation2011 RM10.9-0345 2.5 3.5 Mercury 2.2 mg/kg 2011 River Mile 10.9 Sediment Investigation2011 RM10.9-0308 2.5 3.5 Mercury 2.0 mg/kg 2011 River Mile 10.9 Sediment Investigation2011 RM10.9-0324 2.5 3.5 Mercury 2.0 mg/kg 2011 River Mile 10.9 Sediment Investigation2011 RM10.9-0328 2.5 3.5 Mercury 1.5 mg/kg 2011 River Mile 10.9 Sediment Investigation2011 RM10.9-0342 2.5 3.5 Mercury 1.4 mg/kg 2011 River Mile 10.9 Sediment Investigation2011 RM10.9-0303 2.5 3.5 Mercury 0.69 mg/kg 2011 River Mile 10.9 Sediment Investigation2011 RM10.9-0336 2.5 3.5 Mercury 0.43 mg/kg 2011 River Mile 10.9 Sediment Investigation2011 RM10.9-0330 2.5 3.5 Mercury 0.42 mg/kg 2011 River Mile 10.9 Sediment Investigation2011 RM10.9-0320 2.5 3.5 Mercury 0.39 mg/kg 2011 River Mile 10.9 Sediment Investigation2011 RM10.9-0311 2.5 3.4 Mercury 0.37 mg/kg 2011 River Mile 10.9 Sediment Investigation2011 RM10.9-0331 2.5 3.5 Mercury 0.021 mg/kg 2011 River Mile 10.9 Sediment Investigation2011 RM10.9-0319 2.5 3.5 Mercury 0.017 mg/kg 2011 River Mile 10.9 Sediment Investigation2011 RM10.9-0326 2.5 3.5 Mercury 0.012 mg/kg 2011 River Mile 10.9 Sediment Investigation2011 RM10.9-0323 2.5 3.5 Mercury 0.0094 mg/kg 2011 River Mile 10.9 Sediment Investigation

Page 5 of 7
TABLE A-2dRM 10.9 Concentration Data for 2,3,7,8-TCDD, Mercury, and Total PCBs, 2.5 to 3.5 ft bgs IntervalRM 10.9 Pre-Final Design Report, Lower Passaic River Study Area, New Jersey
Sample Location Parameter Concentration Units Sampling ProgramDepth
Interval(ft bgs)
2011 RM10.9-0334 2.5 3.5 Mercury 0.0092 mg/kg 2011 River Mile 10.9 Sediment Investigation2011 RM10.9-0335 2.5 3.5 Mercury 0.0078 mg/kg 2011 River Mile 10.9 Sediment Investigation2012 RM10.9 A-0365 2.5 3.5 Mercury 14.7 mg/kg 2012 River Mile 10.9 Sediment Investigation Addendum A2012 RM10.9 A-0357 2.5 4 Mercury 0.014 mg/kg 2012 River Mile 10.9 Sediment Investigation Addendum A2012 RM10.9 A-0356 2.5 4 Mercury 0.011 mg/kg 2012 River Mile 10.9 Sediment Investigation Addendum A2012 RM10.9 A-0355 2.5 3.74 Mercury 0.0084 mg/kg 2012 River Mile 10.9 Sediment Investigation Addendum A2008 CLRC-110 2.5 3.5 Total PCB 0.46 mg/kg 2008 Low-resolution Coring Program2008 CLRC-066 2.5 3.5 Total PCB 0.38 mg/kg 2008 Low-resolution Coring Program2008 CLRC-067 2.4 3.3 Total PCB 0.013 mg/kg 2008 Low-resolution Coring Program2008 CLRC-109 2.5 3.5 Total PCB 0.0001 mg/kg 2008 Low-resolution Coring Program2011 RM10.9-0338 2.5 3.5 Total PCB 28.4 mg/kg 2011 River Mile 10.9 Sediment Investigation2011 RM10.9-0314 2.5 3.5 Total PCB 24.9 mg/kg 2011 River Mile 10.9 Sediment Investigation2011 RM10.9-0322 2.5 3.5 Total PCB 24.9 mg/kg 2011 River Mile 10.9 Sediment Investigation2011 RM10.9-0333 2.5 3.5 Total PCB 24.7 mg/kg 2011 River Mile 10.9 Sediment Investigation2011 RM10.9-0351 2.5 3.5 Total PCB 23.2 mg/kg 2011 River Mile 10.9 Sediment Investigation2011 RM10.9-0339 2.5 3.5 Total PCB 22.0 mg/kg 2011 River Mile 10.9 Sediment Investigation2011 RM10.9-0344 2.5 3.5 Total PCB 20.4 mg/kg 2011 River Mile 10.9 Sediment Investigation2011 RM10.9-0318 2.5 3.5 Total PCB 18.0 mg/kg 2011 River Mile 10.9 Sediment Investigation2011 RM10.9-0343 2.5 3.5 Total PCB 18.0 mg/kg 2011 River Mile 10.9 Sediment Investigation2011 RM10.9-0340 2.5 3.5 Total PCB 11.5 mg/kg 2011 River Mile 10.9 Sediment Investigation2011 RM10.9-0312 2.5 3.5 Total PCB 10.7 mg/kg 2011 River Mile 10.9 Sediment Investigation2011 RM10.9-0325 2.5 3.5 Total PCB 9.2 mg/kg 2011 River Mile 10.9 Sediment Investigation2011 RM10.9-0350 2.5 3.5 Total PCB 8.8 mg/kg 2011 River Mile 10.9 Sediment Investigation2011 RM10.9-0310 2.5 3.5 Total PCB 8.7 mg/kg 2011 River Mile 10.9 Sediment Investigation2011 RM10.9-0316 2.5 3.5 Total PCB 8.0 mg/kg 2011 River Mile 10.9 Sediment Investigation2011 RM10.9-0315 2.5 3.5 Total PCB 7.3 mg/kg 2011 River Mile 10.9 Sediment Investigation2011 RM10.9-0317 2.5 3.5 Total PCB 6.6 mg/kg 2011 River Mile 10.9 Sediment Investigation2011 RM10.9-0321 2.5 3.5 Total PCB 5.9 mg/kg 2011 River Mile 10.9 Sediment Investigation2011 RM10.9-0306 2.5 3.5 Total PCB 5.9 mg/kg 2011 River Mile 10.9 Sediment Investigation

Page 6 of 7
TABLE A-2dRM 10.9 Concentration Data for 2,3,7,8-TCDD, Mercury, and Total PCBs, 2.5 to 3.5 ft bgs IntervalRM 10.9 Pre-Final Design Report, Lower Passaic River Study Area, New Jersey
Sample Location Parameter Concentration Units Sampling ProgramDepth
Interval(ft bgs)
2011 RM10.9-0302 2.5 3.5 Total PCB 4.7 mg/kg 2011 River Mile 10.9 Sediment Investigation2011 RM10.9-0309 2.5 3.5 Total PCB 4.6 mg/kg 2011 River Mile 10.9 Sediment Investigation2011 RM10.9-0308 2.5 3.5 Total PCB 3.9 mg/kg 2011 River Mile 10.9 Sediment Investigation2011 RM10.9-0346 2.5 3.5 Total PCB 3.5 mg/kg 2011 River Mile 10.9 Sediment Investigation2011 RM10.9-0313 2.5 3.5 Total PCB 3.3 mg/kg 2011 River Mile 10.9 Sediment Investigation2011 RM10.9-0332 2.5 3.5 Total PCB 3.3 mg/kg 2011 River Mile 10.9 Sediment Investigation2011 RM10.9-0304 2.5 3.5 Total PCB 3.1 mg/kg 2011 River Mile 10.9 Sediment Investigation2011 RM10.9-0329 2.5 3.5 Total PCB 2.5 mg/kg 2011 River Mile 10.9 Sediment Investigation2011 RM10.9-0305 2.5 3.5 Total PCB 2.5 mg/kg 2011 River Mile 10.9 Sediment Investigation2011 RM10.9-0301 2.5 3.5 Total PCB 2.4 mg/kg 2011 River Mile 10.9 Sediment Investigation2011 RM10.9-0348 2.5 2.8 Total PCB 2.4 mg/kg 2011 River Mile 10.9 Sediment Investigation2011 RM10.9-0307 2.5 3.5 Total PCB 2.1 mg/kg 2011 River Mile 10.9 Sediment Investigation2011 RM10.9-0311 2.5 3.5 Total PCB 1.6 mg/kg 2011 River Mile 10.9 Sediment Investigation2011 RM10.9-0337 2.5 3.5 Total PCB 1.2 mg/kg 2011 River Mile 10.9 Sediment Investigation2011 RM10.9-0324 2.5 3.5 Total PCB 1.2 mg/kg 2011 River Mile 10.9 Sediment Investigation2011 RM10.9-0345 2.5 3.5 Total PCB 1.2 mg/kg 2011 River Mile 10.9 Sediment Investigation2011 RM10.9-0328 2.5 3.5 Total PCB 1.1 mg/kg 2011 River Mile 10.9 Sediment Investigation2011 RM10.9-0342 2.5 3.5 Total PCB 1.1 mg/kg 2011 River Mile 10.9 Sediment Investigation2011 RM10.9-0303 2.5 3.5 Total PCB 0.72 mg/kg 2011 River Mile 10.9 Sediment Investigation2011 RM10.9-0336 2.5 3.5 Total PCB 0.59 mg/kg 2011 River Mile 10.9 Sediment Investigation2011 RM10.9-0349 2.5 3.5 Total PCB 0.53 mg/kg 2011 River Mile 10.9 Sediment Investigation2011 RM10.9-0320 2.5 3.5 Total PCB 0.41 mg/kg 2011 River Mile 10.9 Sediment Investigation2011 RM10.9-0341 2.5 3.1 Total PCB 0.41 mg/kg 2011 River Mile 10.9 Sediment Investigation2011 RM10.9-0347 2.5 3.5 Total PCB 0.29 mg/kg 2011 River Mile 10.9 Sediment Investigation2011 RM10.9-0327 2.5 3.8 Total PCB 0.076 mg/kg 2011 River Mile 10.9 Sediment Investigation2011 RM10.9-0352 2.5 3.5 Total PCB 0.053 mg/kg 2011 River Mile 10.9 Sediment Investigation2011 RM10.9-0353 2.5 3 Total PCB 0.039 mg/kg 2011 River Mile 10.9 Sediment Investigation2011 RM10.9-0331 2.5 3.5 Total PCB 0.0079 mg/kg 2011 River Mile 10.9 Sediment Investigation2011 RM10.9-0334 2.5 3.5 Total PCB 0.0061 mg/kg 2011 River Mile 10.9 Sediment Investigation
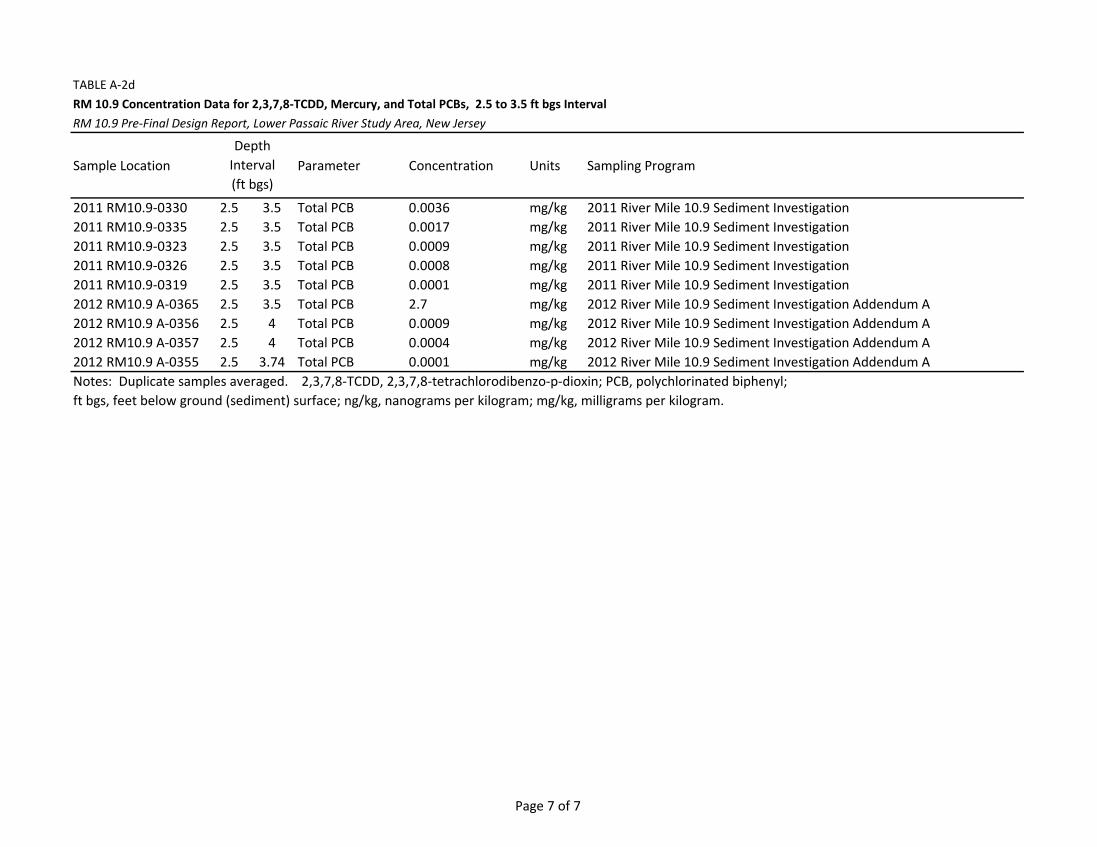
Page 7 of 7
TABLE A-2dRM 10.9 Concentration Data for 2,3,7,8-TCDD, Mercury, and Total PCBs, 2.5 to 3.5 ft bgs IntervalRM 10.9 Pre-Final Design Report, Lower Passaic River Study Area, New Jersey
Sample Location Parameter Concentration Units Sampling ProgramDepth
Interval(ft bgs)
2011 RM10.9-0330 2.5 3.5 Total PCB 0.0036 mg/kg 2011 River Mile 10.9 Sediment Investigation2011 RM10.9-0335 2.5 3.5 Total PCB 0.0017 mg/kg 2011 River Mile 10.9 Sediment Investigation2011 RM10.9-0323 2.5 3.5 Total PCB 0.0009 mg/kg 2011 River Mile 10.9 Sediment Investigation2011 RM10.9-0326 2.5 3.5 Total PCB 0.0008 mg/kg 2011 River Mile 10.9 Sediment Investigation2011 RM10.9-0319 2.5 3.5 Total PCB 0.0001 mg/kg 2011 River Mile 10.9 Sediment Investigation2012 RM10.9 A-0365 2.5 3.5 Total PCB 2.7 mg/kg 2012 River Mile 10.9 Sediment Investigation Addendum A2012 RM10.9 A-0356 2.5 4 Total PCB 0.0009 mg/kg 2012 River Mile 10.9 Sediment Investigation Addendum A2012 RM10.9 A-0357 2.5 4 Total PCB 0.0004 mg/kg 2012 River Mile 10.9 Sediment Investigation Addendum A2012 RM10.9 A-0355 2.5 3.74 Total PCB 0.0001 mg/kg 2012 River Mile 10.9 Sediment Investigation Addendum ANotes: Duplicate samples averaged. 2,3,7,8-TCDD, 2,3,7,8-tetrachlorodibenzo-p-dioxin; PCB, polychlorinated biphenyl;ft bgs, feet below ground (sediment) surface; ng/kg, nanograms per kilogram; mg/kg, milligrams per kilogram.