appendix a: psd air quality construction permit application
TRANSCRIPT

Basin Electric Deer Creek Station Project
South Dakota PUC Application
Appendix A: PSD Air Quality Construction Permit Application

Basin Electric Deer Creek Station Project
South Dakota PUC Application
This page intentionally left blank.

Basin Electric Power Cooperative Deer Creek Station
PSD Air Quality Construction Permit Application
Prepared for:
Basin Electric Power Cooperative Bismarck, North Dakota
Prepared by:
Sargent & Lundy, LLC Chicago, Illinois
May 29, 2009

Deer Creek Station Air Quality Construction PSD Permit Application May 29, 2009 TABLE OF CONTENTS
Page i
1.0 INTRODUCTION 2.0 PROJECT DESCRIPTION
2.1 Site Location 2.1.1 Site Setting 2.1.2 Local Air Quality Attainment/Non-attainment Status 2.1.3 Proximity to Class I Areas
2.2 Facility Equipment 2.2.1 Combustion Turbine / HRSG / Steam Turbine 2.2.2 Air Cooled Condenser 2.2.3 Emergency Generator and Fire Water Pump 2.2.4 Emergency Inlet Air Heater
2.3 Emission Sources 2.4 General Applicant Information 2.5 Standard Industrial Classification (SIC)
3.0 PROJECT EMISSIONS
3.1 Combustion Turbine / HRSG Emissions 3.1.1 CT/HRSG Emissions During Normal Operations 3.1.2 Combustion Turbine Startup Emissions 3.1.3 Annual CT/HRSG Emissions
3.2 Emergency Generator and Diesel Fire Water Pump Emissions 3.3 Emergency Inlet Air Heater Emissions 3.4 Potential Annual Emissions 3.5 Potential Emissions of Non-PSD Pollutants 3.6 Insignificant Activities
4.0 REGULATORY REVIEW
4.0 Introduction 4.1 Overview of Air Quality Regulations 4.2 South Dakota Air Emission Standards
4.2.1 Chapter 74:36:01 - Definitions 4.2.2 Chapter 74:36:02 – Ambient Air Quality 4.2.3 Chapter 74:36:03 – Air Quality Episodes 4.2.4 Chapter 74:36:04 – Operating Permits for Minor Sources 4.2.5 Chapter 74:36:05 – Operating Permits for Part 70 Sources 4.2.6 Chapter 74:36:06 – Regulated Air Pollutant Emissions 4.2.6.1 Subchapter 74:36:06:02 - Allowable Emissions for Fuel-Burning Units 4.2.7 Chapter 74:36:07 – New Source Performance Standards 4.2.8 Chapter 74:36:08 – National Emissions Standards for Hazardous Air Pollutants 4.2.9 Chapter 74:36:00 – Prevention of Significant Deterioration 4.2.10 Chapter 74:36:10 – New Source Review

Deer Creek Station Air Quality Construction PSD Permit Application May 29, 2009 TABLE OF CONTENTS
Page ii
4.2.11 Chapter 74:36:11 – Performance Testing 4.2.12 Chapter 74:36:12 – Control of Visible Emissions 4.2.13 Chapter 74:36:13 – Continuous Emission Monitoring Systems 4.2.14 Chapter 74:36:14 – Variances (Repealed, 23 SDR 106) 4.2.15 Chapter 74:36:15 – Open Burning 4.2.16 Chapter 74:36:16 – Acid Rain Program 4.2.17 Chapter 74:36:17 – Rapid City Street Sanding and Deicing 4.2.18 Chapter 74:36:18 – Regulations for State Facilities in the Rapid City Area 4.2.19 Chapter 74:36:19 – Mercury Budget Trading Program
4.3 New Source Performance Standards (NSPS) 4.3.1 40 CFR Part 60 Subpart A: General Provisions 4.3.2 40 CFR Part 60 Subpart KKKK: Combustion Turbines 4.3.3 40 CFR Part 60 Subpart IIII: Stationary Compression Ignition Internal
Combustion Engines 4.4 National Emission Standards for Hazardous Air Pollutants (NESHAPS) 4.5 Acid Rain Program 4.6 Compliance Assurance Monitoring
5.0 BEST AVALIABLE CONTROL TECHNOLOGY (BACT) ASSESSMENT
5.0 Introduction 5.1 Definition of BACT 5.2 Summary of Combustion Turbine/HRSG BACT Analysis 5.3 Summary of the Emergency Generator and Fire Water Pump BACT Analysis
6.0 MAXIMUM ACHIEVABLE CONTROL TECHNOLOGY (MACT) REQUIREMENTS
6.0 Introduction 6.1 Applicable MACT Standards
7.0 CLASS II AIR QUALITY IMPACT ANALYSIS - SUMMARY
8.0 ADDITIONAL IMPACT ANALYSIS
8.1 Class II Visibility Analysis 8.1.1 Class II Visibility Analysis Results 8.1.2 VISCREEN Input and Output Files
8.2 Growth Analysis 8.3 Soils & Vegetation Analysis
9.0 Proposed Emission Limits
9.1 Proposed Emission Limits – CT/HRSG 9.2 Proposed Emission Limits – Diesel-Fired Stationary Engines and Inlet Air Heater

Deer Creek Station Air Quality Construction PSD Permit Application May 29, 2009 TABLE OF CONTENTS
Page iii
APPENDICES:
Appendix A SD Application Forms Appendix B Supporting Calculations for Emission Estimates Appendix C Combustion Turbine/HRSG BACT Analysis Appendix D Class II Impact Modeling Results and Support Documentation

Deer Creek Station Air Quality Construction PSD Permit Application May 29, 2009 LIST OF TABLES
Page iv
TABLES
Table Description
2-1 Deer Creek CT/HRSG Operating Parameters – Base Load No Duct Firing
2-2 Deer Creek CT/HRSG Operating Parameters – Base Load With Duct Firing
2-3 Deer Creek CT/HRSG Operating Parameters – Annual Average Ambient Conditions Part Load Cases
2-4 Deer Creek CT/HRSG Operating Parameters – Summer Average Maximum Ambient Conditions Part Load Cases
2-5 Deer Creek Station Emission Point Designations
3-1 CT/HRSG Emissions – Base Load Without Supplemental Duct Firing
3-2 CT/HRSG Emissions – Base Load With Supplemental Duct Firing
3-3 CT/HRSG Maximum Hourly Emissions
3-4 CT/HRSG Startup Emissions – Cold Startup
3-5 CT/HRSG Startup Emissions – Warm Startup
3-6 CT/HRSG Startup Emissions – Hot Restart
3-7 CT/HRSG Estimated Startup Hours per Year
3-8 CT/HRSG Estimated Startup Emissions – NOx
3-9 CT/HRSG Estimated Startup Emissions – CO
3-10 CT/HRSG Estimated Startup Emissions – VOC
3-11 CT/HRSG Annual Emissions Summary
3-12 Emergency Diesel Generator Emissions
3-13 Fire Water Pump Emissions
3-14 Emergency Inlet Air Heater Emissions
3-15 Annual Potential-to-Emit (PTE) Summary
3-16 CT/HRSG – Potential HAP Emissions
3-17 Auxiliary Combustion Sources – HAP Emission Summary
3-18 Deer Creek Potential Annual HAP Emissions
4-1 National Ambient Air Quality Standards
4-2 Allowable PSD Increments and Significant Impact Levels
4-3 Summary of Applicable South Dakota Particulate Emission Limitations
4-4 Comparison of PSD Significant Levels and Expected Annual Emissions
Deer Creek Station Air Quality Construction PSD Permit Application May 29, 2009 LIST OF TABLES
Page v
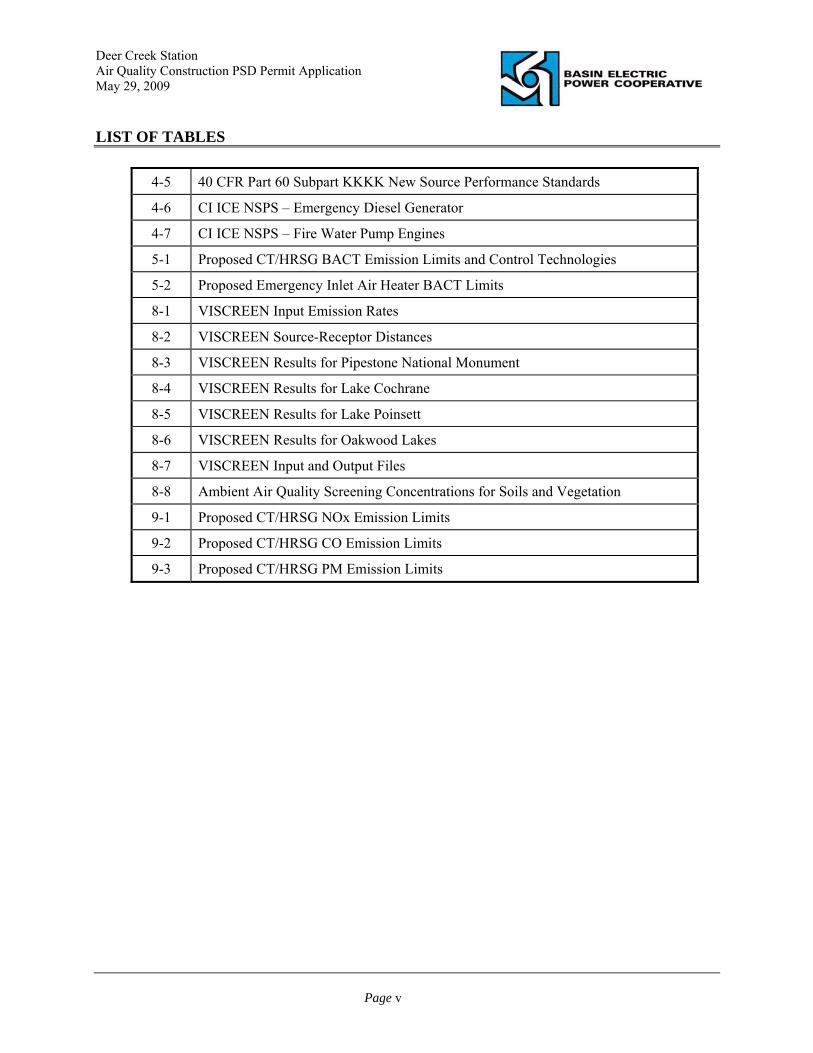
4-5 40 CFR Part 60 Subpart KKKK New Source Performance Standards
4-6 CI ICE NSPS – Emergency Diesel Generator
4-7 CI ICE NSPS – Fire Water Pump Engines
5-1 Proposed CT/HRSG BACT Emission Limits and Control Technologies
5-2 Proposed Emergency Inlet Air Heater BACT Limits
8-1 VISCREEN Input Emission Rates
8-2 VISCREEN Source-Receptor Distances
8-3 VISCREEN Results for Pipestone National Monument
8-4 VISCREEN Results for Lake Cochrane
8-5 VISCREEN Results for Lake Poinsett
8-6 VISCREEN Results for Oakwood Lakes
8-7 VISCREEN Input and Output Files
8-8 Ambient Air Quality Screening Concentrations for Soils and Vegetation
9-1 Proposed CT/HRSG NOx Emission Limits
9-2 Proposed CT/HRSG CO Emission Limits
9-3 Proposed CT/HRSG PM Emission Limits
Deer Creek Station Air Quality Construction PSD Permit Application May 29, 2009 LIST OF FIGURES
Page vi
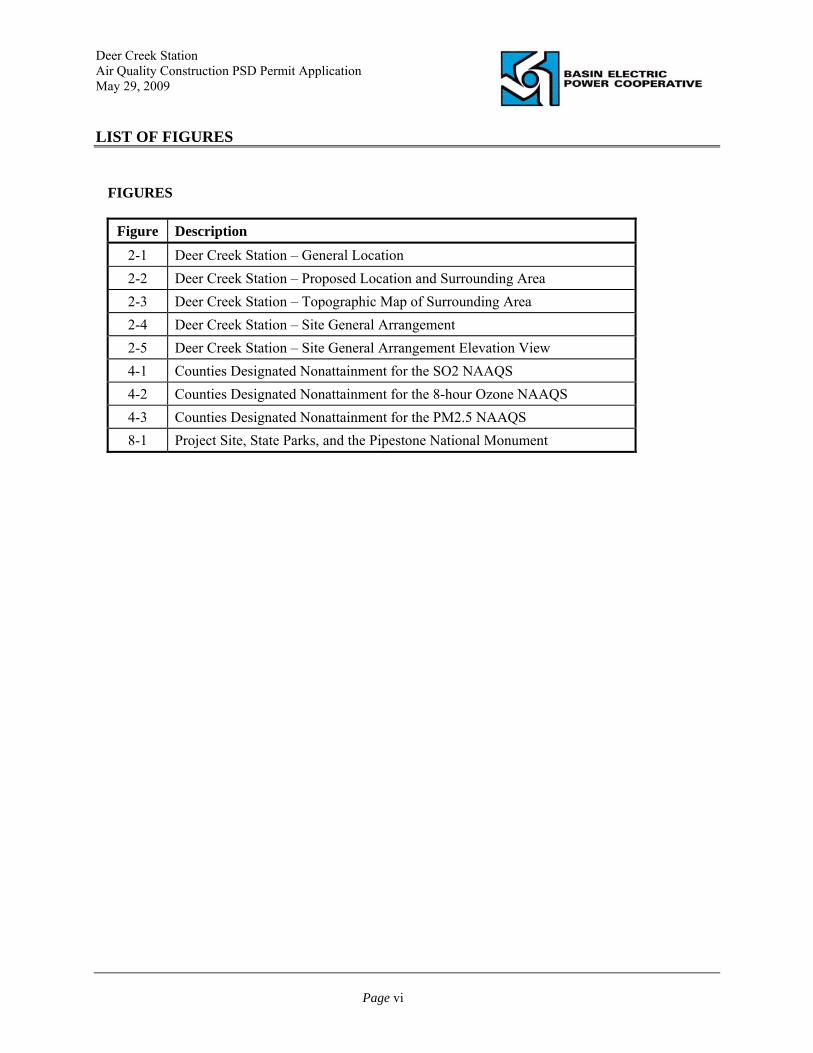
FIGURES
Figure Description
2-1 Deer Creek Station – General Location 2-2 Deer Creek Station – Proposed Location and Surrounding Area 2-3 Deer Creek Station – Topographic Map of Surrounding Area 2-4 Deer Creek Station – Site General Arrangement 2-5 Deer Creek Station – Site General Arrangement Elevation View 4-1 Counties Designated Nonattainment for the SO2 NAAQS 4-2 Counties Designated Nonattainment for the 8-hour Ozone NAAQS 4-3 Counties Designated Nonattainment for the PM2.5 NAAQS 8-1 Project Site, State Parks, and the Pipestone National Monument

Deer Creek Station Air Quality Construction PSD Permit Application May 29, 2009 ACRONYMS AND ABBREVIATION
Page vii
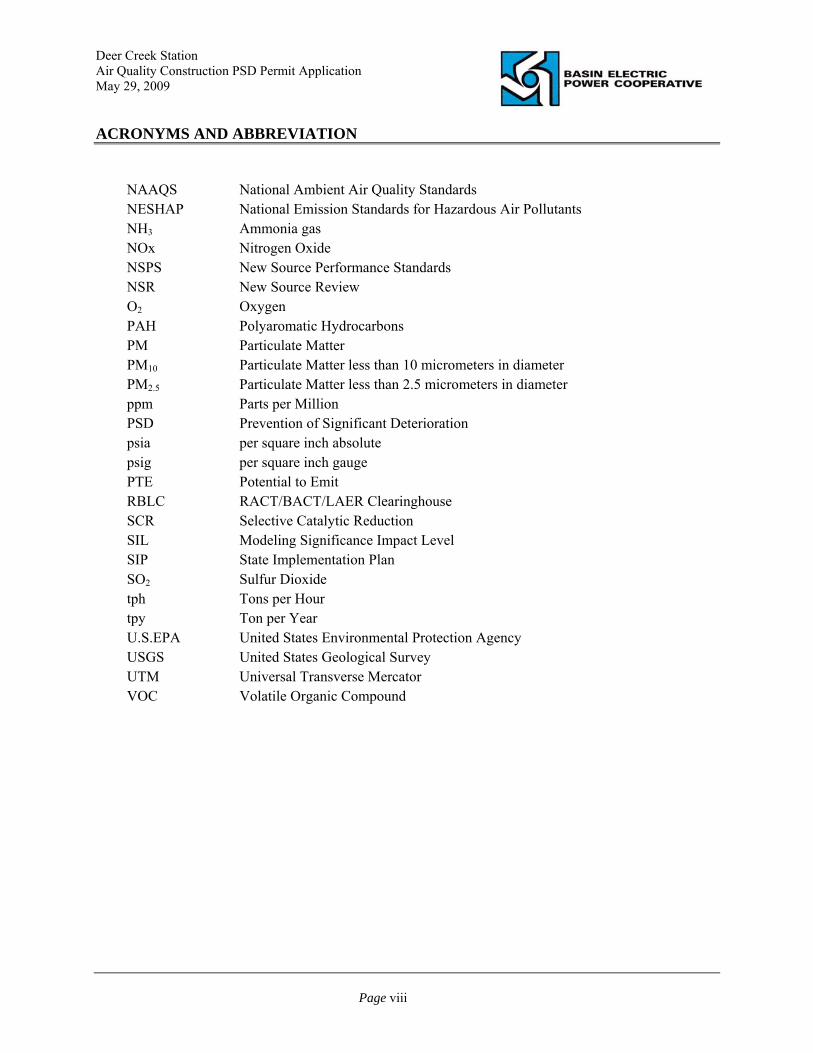
Acronyms and Abbreviations
AERMOD AMS/EPA Regulatory Model AP-42 EPA Compilation of Air Pollution Emission Factors AQRV Air Quality-Related Values BACT Best Available Control Technology BEPC Basin Electric Power Cooperative Btu/hr British thermal unit per hour CAA Clean Air Act CALMET Meteorological Processor for the CALPUFF Modeling System CALPOST Post-Processor for the CALPUFF Modeling System CALPUFF Long-Range Transport Air Dispersion Model System CEMS Continuous Emission Monitoring System CFR Code of Federal Regulations CO Carbon Monoxide CO2 Carbon Dioxide DENR South Dakota Department of Environmental and Natural Resources °F degrees Fahrenheit FGR Flue Gas Recirculation g/s Grams per Second GEP Good Engineering Practices gr/dscf Grains per Dry Standard Cubic Foot HAP Hazardous Air Pollutant hp Horsepower hr Hour km Kilometer kW Kilowatt kWh Kilowatt Hour LAER Lowest Achievable Emission Rate lb Pound lb/hr Pound per Hour lb/mmBtu Pounds of Emissions per Million British Thermal Units Heat Input LNB Low NOx Burner m Meter m/s Meters per Second MACT Maximum Achievable Control Technology μg/m3 Micrograms per Cubic Meter mmBtu/hr million British thermal units per hour MW Megawatt MWh Megawatt Hour
Deer Creek Station Air Quality Construction PSD Permit Application May 29, 2009 ACRONYMS AND ABBREVIATION
Page viii
NAAQS National Ambient Air Quality Standards NESHAP National Emission Standards for Hazardous Air Pollutants NH3 Ammonia gas NOx Nitrogen Oxide NSPS New Source Performance Standards NSR New Source Review O2 Oxygen PAH Polyaromatic Hydrocarbons PM Particulate Matter PM10 Particulate Matter less than 10 micrometers in diameter PM2.5 Particulate Matter less than 2.5 micrometers in diameter ppm Parts per Million PSD Prevention of Significant Deterioration psia per square inch absolute psig per square inch gauge PTE Potential to Emit RBLC RACT/BACT/LAER Clearinghouse SCR Selective Catalytic Reduction SIL Modeling Significance Impact Level SIP State Implementation Plan SO2 Sulfur Dioxide tph Tons per Hour tpy Ton per Year U.S.EPA United States Environmental Protection Agency USGS United States Geological Survey UTM Universal Transverse Mercator VOC Volatile Organic Compound

Deer Creek Station Air Quality Construction PSD Permit Application May 29, 2009 1. INTRODUCTION
Introduction Page 1-1
1.0 INTRODUCTION Basin Electric Power Cooperative (BEPC) proposes to construct a new natural gas-fired combined cycle power generating facility. The new facility, to be known as the Deer Creek Station, will be located approximately six miles southeast of White, South Dakota, in Brookings County. Upon completion the Deer Creek Station will include:
one F-class (or the equivalent) combustion turbine (CT) generator; one natural circulation, duct fired, heat recovery steam generator (HRSG); one steam turbine generator (STG); one diesel-fired emergency generator; one diesel-fired fire water pump; one natural gas-fired emergency inlet air heater; and one air cooled condenser (ACC).
The proposed electric generating facility has the potential to emit regulated pollutants in amounts above the significance levels defined in 40 CFR 52.21(b)(23) and South Dakota Air Pollution Control Program Chapter 74:36:09. Therefore, BEPC is applying to the South Dakota Department of Environmental and Natural Resources (DENR) for a Prevention of Significant Deterioration (PSD) Air Quality Construction Permit. PSD review includes:
determination of Best Available Control Technology (BACT); analysis of compliance with National Ambient Air Quality Standards (NAAQS); and evaluation of source-related impacts on growth, soils, vegetation, and visibility.
This permit application includes information required to approve the construction of a new major source located in an area meeting all National Ambient Air Quality Standards. Information is presented in the following sections and appendices:
Section 2 - Project Description contains information describing the proposed facility and equipment; the site location and geographic setting; the project proponent (including contact persons for this permit application); and the Standard Industrial Classification Code applicable to the proposed facility. Section 3 - Project Emissions provides a description of the emission sources and potential emissions from the proposed facility.
Deer Creek Station Air Quality Construction PSD Permit Application May 29, 2009 1. INTRODUCTION
Introduction Page 1-2
Section 4 - Regulatory Applicability and Compliance Evaluation provides an assessment of the applicable state and federal air quality regulations. Section 5 - Best Available Control Technology (BACT) provides a summary of the emission control technologies and emission rates proposed as BACT. The complete BACT Analysis is included in Appendix C. Section 6 – Maximum Achievable Control Technology provides a summary of the applicable MACT standards. Section 7 – Class II Ambient Air Quality Impact Analysis presents a summary of the ambient air quality impact modeling conducted to evaluate potential impacts to ambient air quality, PSD increments, and air quality related values. A detailed impact modeling report in included in Appendix C. Section 8 – Other Impact Analysis presents the results of reviews conducted to assess potential source-related impacts on growth, soils, vegetation, and visibility. Section 9 – Permit Limits provides a summary of the proposed emission limits. Appendix A contains the required DENR permit application forms. Appendix B contains the operating parameters, emission calculations and supporting documentation. Appendix C is the complete BACT Analysis for the proposed project. Appendix D is the complete Class II air quality impact assessment for the proposed project.
This permit application includes information and analysis demonstrating that the proposed project will meet the following criteria:
The proposed facility will comply with all the applicable South Dakota air quality regulations.
Emissions from the proposed facility will be controlled using technology representing BACT.
Emission units will meet all applicable new source performance standards.
Emissions from the proposed facility will not cause significant deterioration of existing ambient air quality in the region and will not exceed allowable PSD increments.
Deer Creek Station Air Quality Construction PSD Permit Application May 29, 2009 2. PROJECT DESCRIPTION
Project Description Page 2-1
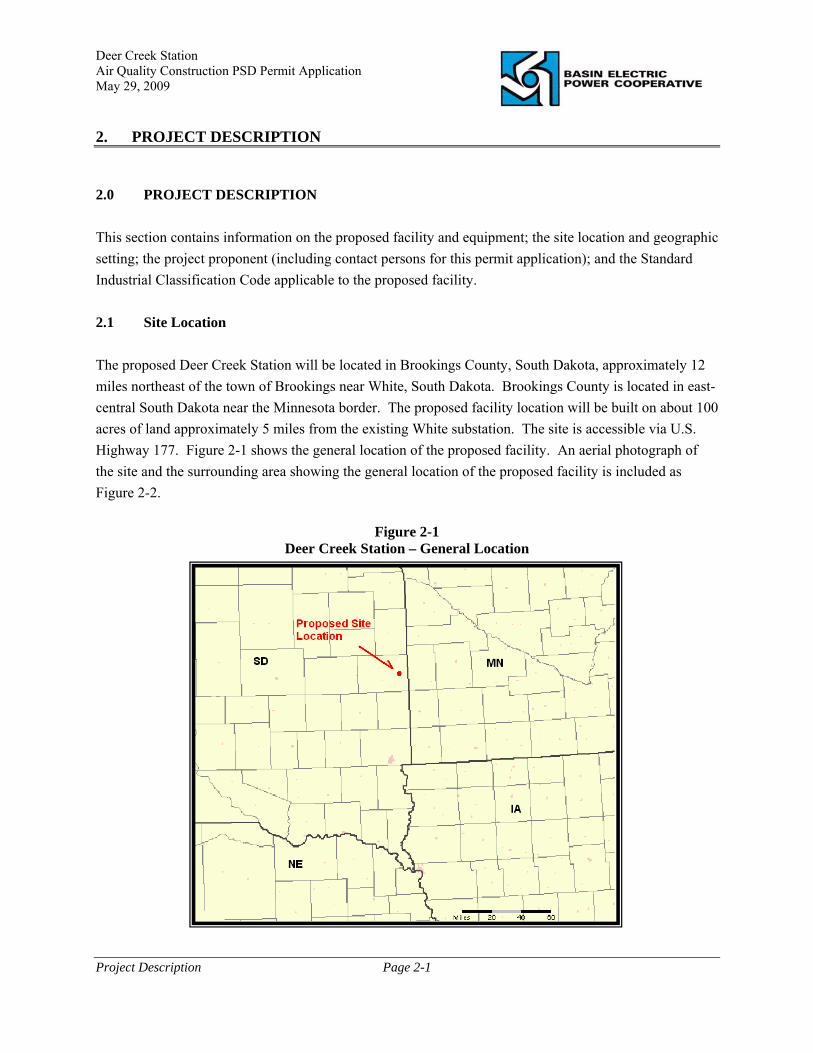
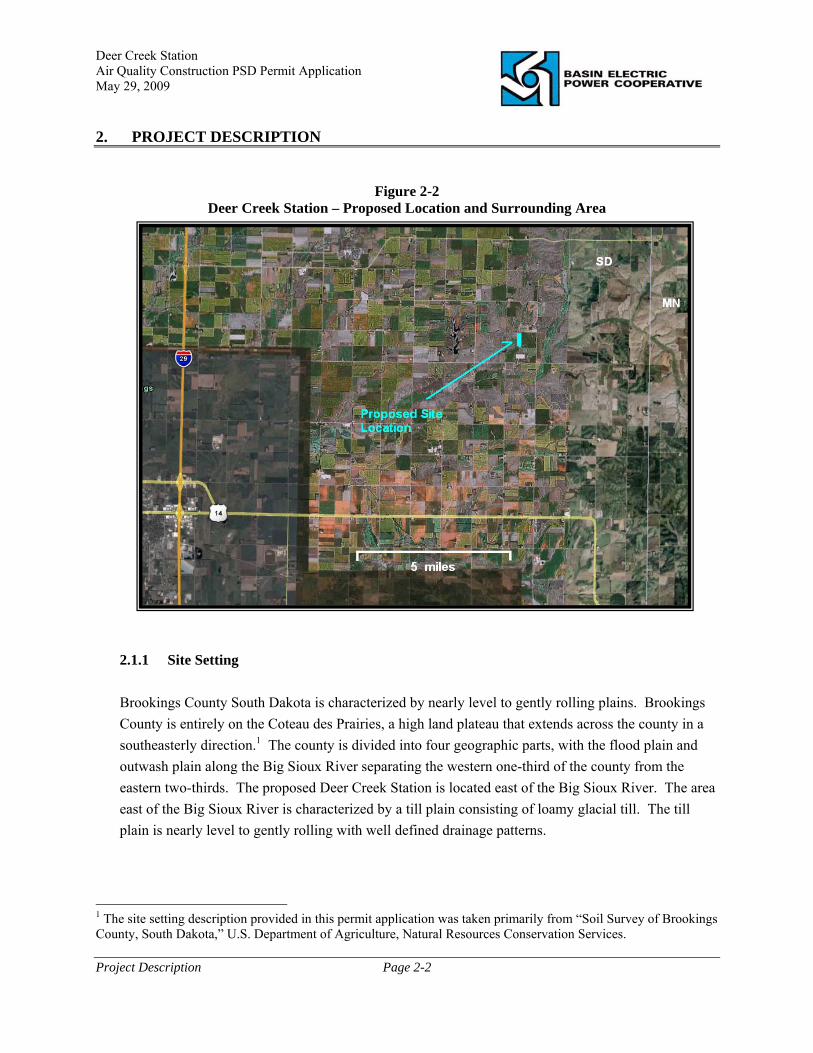
2.0 PROJECT DESCRIPTION This section contains information on the proposed facility and equipment; the site location and geographic setting; the project proponent (including contact persons for this permit application); and the Standard Industrial Classification Code applicable to the proposed facility. 2.1 Site Location The proposed Deer Creek Station will be located in Brookings County, South Dakota, approximately 12 miles northeast of the town of Brookings near White, South Dakota. Brookings County is located in east-central South Dakota near the Minnesota border. The proposed facility location will be built on about 100 acres of land approximately 5 miles from the existing White substation. The site is accessible via U.S. Highway 177. Figure 2-1 shows the general location of the proposed facility. An aerial photograph of the site and the surrounding area showing the general location of the proposed facility is included as Figure 2-2.
Figure 2-1 Deer Creek Station – General Location
Deer Creek Station Air Quality Construction PSD Permit Application May 29, 2009 2. PROJECT DESCRIPTION
Project Description Page 2-2
Figure 2-2 Deer Creek Station – Proposed Location and Surrounding Area
2.1.1 Site Setting Brookings County South Dakota is characterized by nearly level to gently rolling plains. Brookings County is entirely on the Coteau des Prairies, a high land plateau that extends across the county in a southeasterly direction.1 The county is divided into four geographic parts, with the flood plain and outwash plain along the Big Sioux River separating the western one-third of the county from the eastern two-thirds. The proposed Deer Creek Station is located east of the Big Sioux River. The area east of the Big Sioux River is characterized by a till plain consisting of loamy glacial till. The till plain is nearly level to gently rolling with well defined drainage patterns.
1 The site setting description provided in this permit application was taken primarily from “Soil Survey of Brookings County, South Dakota,” U.S. Department of Agriculture, Natural Resources Conservation Services.
Deer Creek Station Air Quality Construction PSD Permit Application May 29, 2009 2. PROJECT DESCRIPTION
Project Description Page 2-3
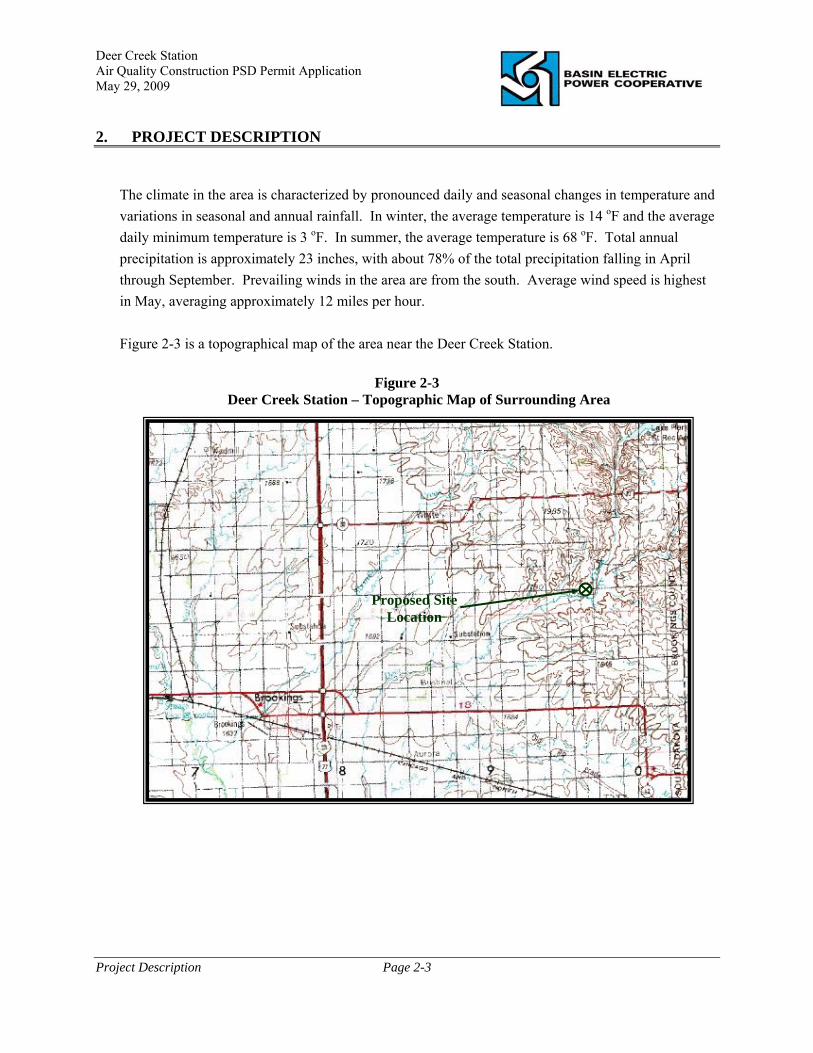
The climate in the area is characterized by pronounced daily and seasonal changes in temperature and variations in seasonal and annual rainfall. In winter, the average temperature is 14 oF and the average daily minimum temperature is 3 oF. In summer, the average temperature is 68 oF. Total annual precipitation is approximately 23 inches, with about 78% of the total precipitation falling in April through September. Prevailing winds in the area are from the south. Average wind speed is highest in May, averaging approximately 12 miles per hour. Figure 2-3 is a topographical map of the area near the Deer Creek Station.
Figure 2-3 Deer Creek Station – Topographic Map of Surrounding Area
Proposed Site Location
Deer Creek Station Air Quality Construction PSD Permit Application May 29, 2009 2. PROJECT DESCRIPTION
Project Description Page 2-4
2.1.2 Local Air Quality Attainment/Non-attainment Status Brookings County, and all counties surrounding the proposed site have been designated as attainment areas (or unclassifiable) for all existing national ambient air quality standards (NAAQS), including the 8-hour ozone and fine particulate matter (PM2.5) NAAQS. 2.1.3 Proximity to Class I Areas Certain national parks, wilderness areas, and national wildlife refuges are designated Federal Class I Areas. In general, allowable ambient air quality impacts within Class I Areas are more restrictive than allowable impacts within Class II areas (i.e., attainment areas). If a proposed new major source of emissions is located within approximately 300 km of a Class I Area, the applicant is required to demonstrate, through air quality modeling, that emissions from the proposed project will not cause or contribute to any violations of allowable increments within the affected Class I Area. Applicants are also required to evaluate potential impacts to air quality related values within the Class I Area, including visibility. The nearest Class I Area to the proposed Deer Creek Station is the Badlands National Park located approximately 420 km (260 miles) west-southwest of the facility. All other Class I Areas are located more than 450 km from the facility.
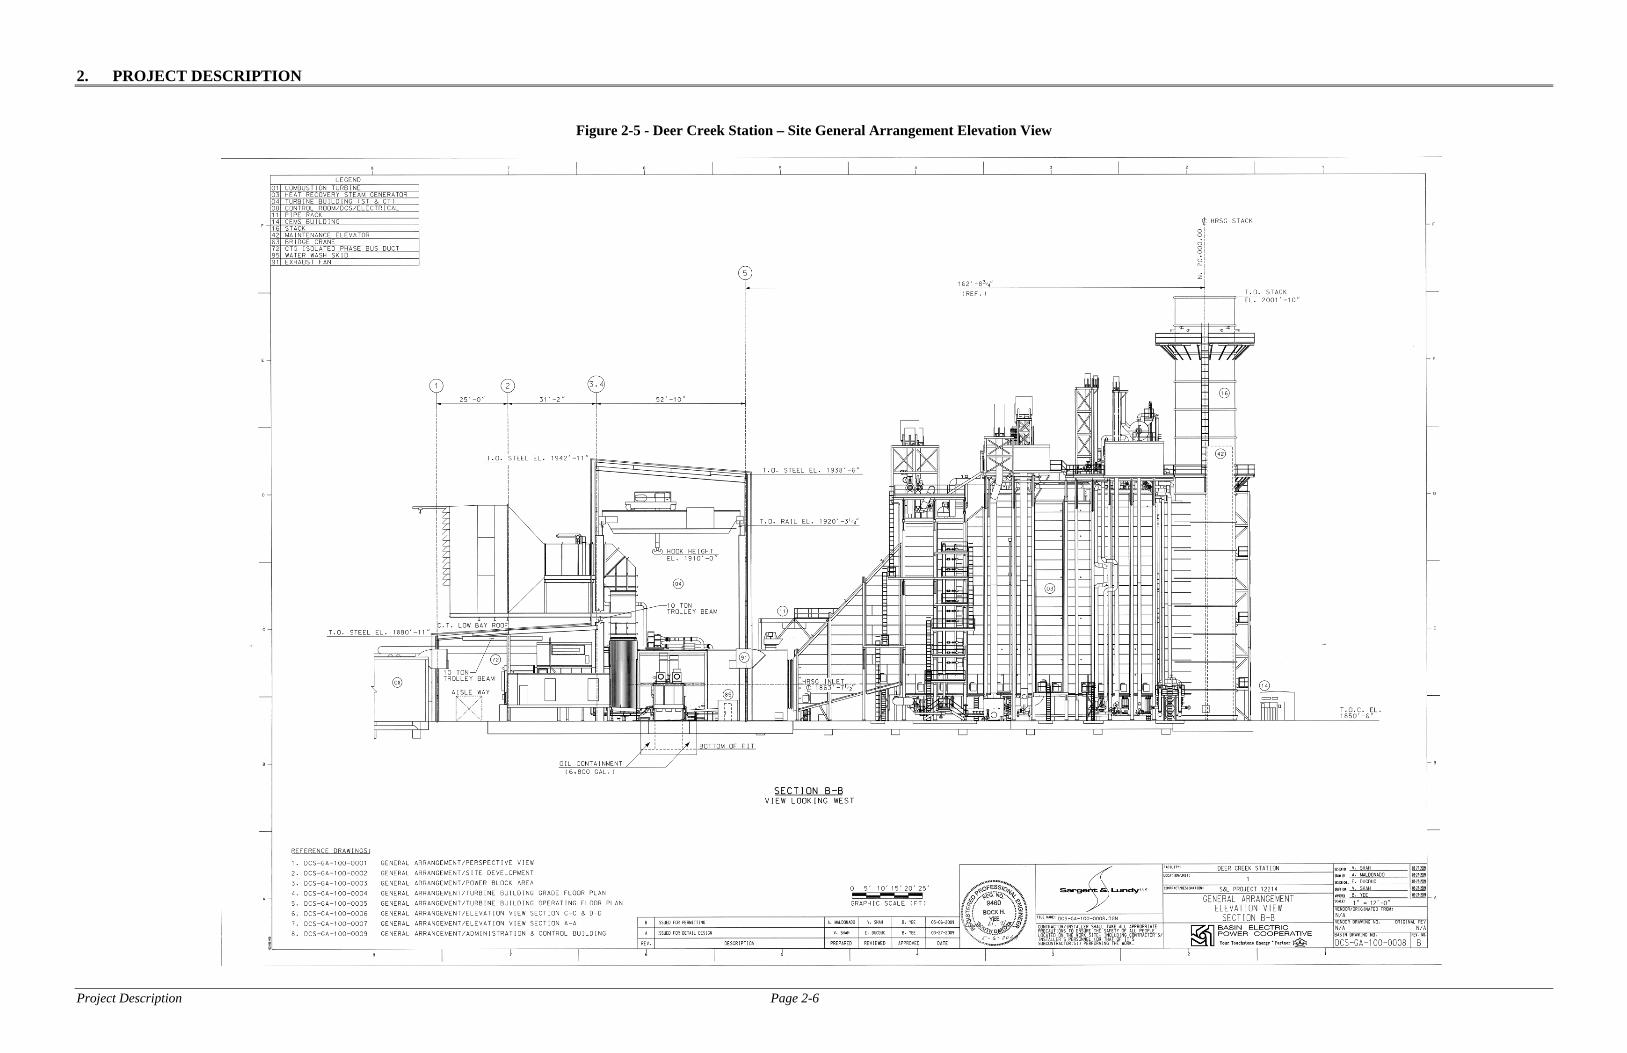
2.2 Facility Equipment The proposed Deer Creek Station will be a natural gas-fired combined cycle electric generating facility. Major components of the proposed facility include the combustion turbine, HRSG, and steam turbine generator. Other potential emissions sources at the facility include a diesel-fired emergency generator, diesel-fired fire-water pump, and a natural gas-fired emergency inlet air heater. The general facility layout, including the location of major pieces of equipment and the location of all proposed emission sources, is shown in Figure 2-4. Figure 2-5 shows an elevation view of the combustion turbine and HRSG.

2. PROJECT DESCRIPTION
Project Description Page 2-5
Figure 2-4 - Deer Creek Station – Site General Arrangement
2. PROJECT DESCRIPTION
Project Description Page 2-6
Figure 2-5 - Deer Creek Station – Site General Arrangement Elevation View

Deer Creek Station Air Quality Construction PSD Permit Application May 29, 2009 2. PROJECT DESCRIPTION
Project Description Page 2-7
2.2.1 Combustion Turbine/HRSG The Deer Creek project includes one F-class (or the equivalent) natural gas-fired combustion turbine (CT) and heat recovery steam generator (HRSG). The proposed CT includes an air compressor section, advanced natural gas combustion section, power turbine, and an electrical generator. Ambient air is drawn through an inlet air filter on the CT and compressed in a multiple-stage axial flow compressor. Compressed air and natural-gas are mixed and combusted in the CT combustion chamber. Based on the BACT analysis (Appendix C), dry low-NOx combustors will be used to minimize NOx formation during combustion. Exhaust gas from the combustion chamber is expanded through a multi-stage power turbine, which drives both the air compressor and an electric power generator. Hot exhaust gas from the CT is directed through the HRSG where excess heat is used to generate steam. The HRSG will be equipped with natural gas-fired duct burners. The duct burners are used to generate additional steam during periods of peak electrical demand. Steam from the HRSG is used to drive a single steam turbine connected to an electrical generator. Exhaust gas from the HRSG passes through additional emission control equipment prior to being discharged to the atmosphere through a single stack. The CT is designed to produce a nominal 166 MW of gross electrical power at full load and an average annual ambient temperature of 43 °F. CT power output will decrease somewhat as the ambient air temperature increases, and output will increase as ambient temperatures decrease. This change in power output is related to the mass flow of combustion air through the turbine. CT power output at full load with be in the range of 150 MW at a summer ambient temperature of 93 °F, and increase to approximately 180 MW at a winter extreme ambient temperature of -41 °F. The HRSG used for the Deer Creek Station will be equipped with natural gas-fired duct burners. Heat input to the duct burners will depend on steam requirements and ambient conditions. Based on heat balance performance calculations, heat input to the duct burners will be has high as 610 mmBtu/hr (LHV) during summer ambient conditions. Based on heat balances prepared for the project, steam production at average annual ambient conditions from the HRSG is estimated to be approximately 419,500 lb/hr without duct firing and 792,700 lb/hr without duct firing. Steam from the HRSG will drive a single steam turbine-generator with a nominal power output of 143 MW with duct firing and 84 MW without duct firing at the average annual ambient temperature of 43 °F. Steam turbine exhaust will be directed to an air cooled condenser, and the condensate will be re-used.
Deer Creek Station Air Quality Construction PSD Permit Application May 29, 2009 2. PROJECT DESCRIPTION
Project Description Page 2-8
Tables 2-1 and 2-2 provide operating parameters for the CT/HRSG at base load and three ambient air temperatures (93 °F, 43 °F, and -42 °F), with and without supplemental duct firing. Tables 2-3 and 2-4 provide operating parameters for the CT/HRSG at annual average and summer ambient conditions at 75%, 50%, and 25% load. These operating cases cover the expected range of operating conditions for the Deer Creek CT/HRSG, and bracket the expected worst-case emission cases. Emissions from the CT/HRSG will be controlled using BACT. The complete BACT analysis for Deer Creek is included in Appendix C of this permit application. Based on the BACT analysis, emissions from the CT/HRSG will be controlled by exclusively firing natural gas and using combustion controls (including dry low-NOx burners) and selective catalytic reduction (SCR). The exhaust gas will be ducted through a 150-foot stack. 2.2.2 Air Cooled Condenser Steam from the low pressure (LP) section of the steam turbine will be condensed in an air cooled condenser (ACC) prior to being recycled. In an air cooled condenser, steam discharged from the turbine enters a steam distribution manifold located at the top of the ACC and is distributed to a number of finned-tube heat exchangers. The steam flows downward through the heat exchanger tubes and is condensed. Mechanical fans are used to force ambient air over the heat exchangers to cool the steam. The condensate is collected in a series of pipes located at the base of the heat exchangers and returned to the steam turbine water system. There are both advantages and disadvantages to using an air cooled condensing system. The primary disadvantage is related to the auxiliary power requirement associated with the fans used to move ambient air past the heat exchangers. Advantages include a significant reduction in water use (compared to wet cooling systems) and elimination of particulate matter emissions. Because ambient air is used as the cooling medium, and the air cools the steam without coming into contact with the condensate or any other potential contaminants, there are no emissions associated with an air cooled condensing system. Therefore, the ACC has not been identified as an emissions source at the Deer Creek Station.
Deer Creek Station Air Quality Construction PSD Permit Application May 29, 2009 2. PROJECT DESCRIPTION
Project Description Page 2-9
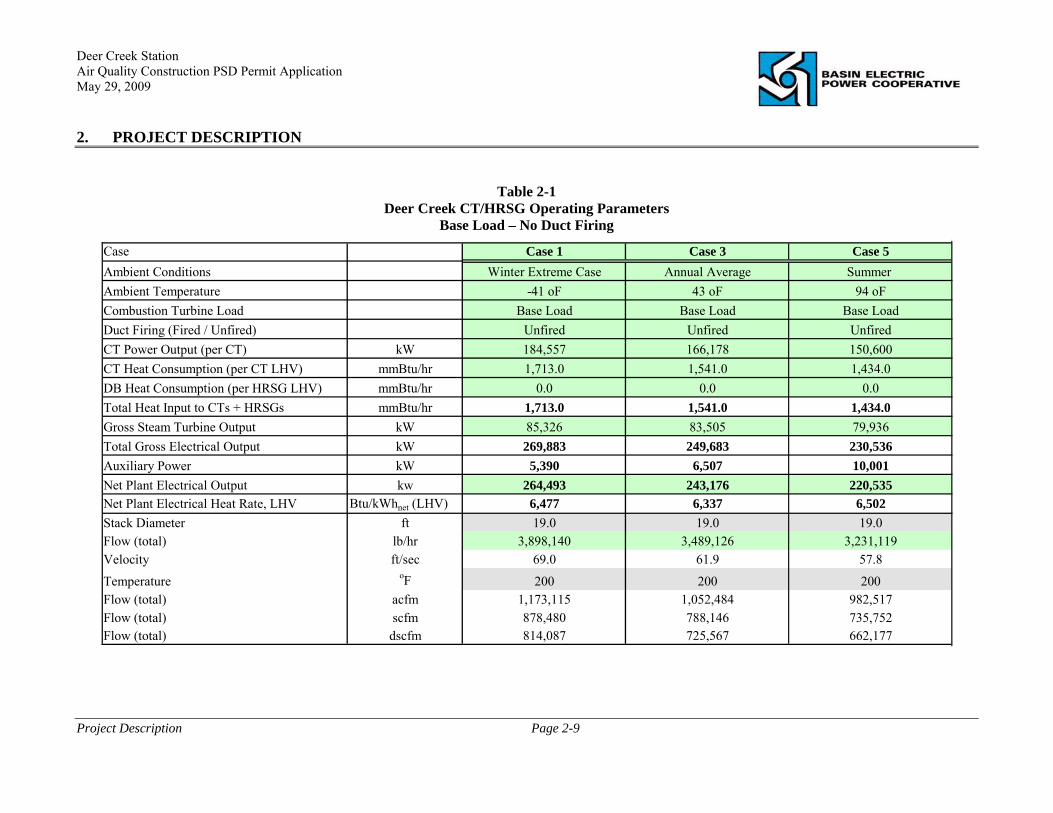
Table 2-1 Deer Creek CT/HRSG Operating Parameters
Base Load – No Duct Firing
Case Case 1 Case 3 Case 5Ambient Conditions Winter Extreme Case Annual Average Summer Ambient Temperature -41 oF 43 oF 94 oFCombustion Turbine Load Base Load Base Load Base LoadDuct Firing (Fired / Unfired) Unfired Unfired UnfiredCT Power Output (per CT) kW 184,557 166,178 150,600CT Heat Consumption (per CT LHV) mmBtu/hr 1,713.0 1,541.0 1,434.0DB Heat Consumption (per HRSG LHV) mmBtu/hr 0.0 0.0 0.0Total Heat Input to CTs + HRSGs mmBtu/hr 1,713.0 1,541.0 1,434.0Gross Steam Turbine Output kW 85,326 83,505 79,936Total Gross Electrical Output kW 269,883 249,683 230,536Auxiliary Power kW 5,390 6,507 10,001Net Plant Electrical Output kw 264,493 243,176 220,535Net Plant Electrical Heat Rate, LHV Btu/kWhnet (LHV) 6,477 6,337 6,502Stack Diameter ft 19.0 19.0 19.0Flow (total) lb/hr 3,898,140 3,489,126 3,231,119Velocity ft/sec 69.0 61.9 57.8
Temperature oF 200 200 200Flow (total) acfm 1,173,115 1,052,484 982,517Flow (total) scfm 878,480 788,146 735,752Flow (total) dscfm 814,087 725,567 662,177

Deer Creek Station Air Quality Construction PSD Permit Application May 29, 2009 2. PROJECT DESCRIPTION
Project Description Page 2-10
Table 2-2
Deer Creek CT/HRSG Operating Parameters Base Load – With Duct Firing
Case Case 2 Case 4 Case 6Ambient Conditions Winter Extreme Case Annual Average SummerAmbient Temperature -41 oF 43 oF 94 oFCombustion Turbine Load Base Load Base Load Base LoadDuct Firing (Fired / Unfired) Duct Firing Duct Firing Duct FiringCT Power Output (per CT) kW 184,557 166,178 150,600CT Heat Consumption (per CT LHV) mmBtu/hr 1,713.0 1,541.0 1,434.0DB Heat Consumption (per HRSG LHV) mmBtu/hr 297.9 511.1 610.4Total Heat Input to CTs + HRSGs mmBtu/hr 2,010.9 2,052.1 2,044.4Gross Steam Turbine Output kW 122,116 142,723 152,860Total Gross Electrical Output kW 306,673 308,901 303,460Auxiliary Power kW 6,393 8,528 10,884Net Plant Electrical Output kw 300,280 300,373 292,576Net Plant Electrical Heat Rate, LHV Btu/kWhnet (LHV) 6,697 6,832 6,988Stack Diameter ft 19.0 19.0 19.0Flow (total) lb/hr 3,912,713 3,514,130 3,260,979Velocity ft/sec 69.4 62.6 58.7
Temperature oF 200 200 200Flow (total) acfm 1,180,657 1,065,424 997,971Flow (total) scfm 884,127 797,836 747,324Flow (total) dscfm 808,711 716,344 651,161

Deer Creek Station Air Quality Construction PSD Permit Application May 29, 2009 2. PROJECT DESCRIPTION
Project Description Page 2-11
Table 2-3 Deer Creek CT/HRSG Operating Parameters
Annual Average Ambient Conditions – Part Load Cases
Case Case 12 Case 13 Case 14Ambient Conditions Annual Average Annual Average Annual AverageAmbient Temperature 43 oF 43 oF 43 oFCombustion Turbine Load 75% CT Load 50% CT Load 25% CT LoadDuct Firing (Fired / Unfired) Unfired Unfired UnfiredCT Power Output (per CT) kW 124,600 83,100 41,500CT Heat Consumption (per CT LHV) mmBtu/hr 1,252.0 1,003.0 691.0DB Heat Consumption (per HRSG LHV) mmBtu/hr 0.0 0.0 0.0Total Heat Input to CTs + HRSGs mmBtu/hr 1,252.0 1,003.0 691.0Gross Steam Turbine Output kW 71,819 61,058 45,227Total Gross Electrical Output kW 196,419 144,158 86,727Auxiliary Power kW 5,349 4,208 2,752Net Plant Electrical Output kw 191,070 139,950 83,975Net Plant Electrical Heat Rate, LHV Btu/kWhnet (LHV) 6,553 7,167 8,229Stack Diameter ft 19.0 19.0 19.0Flow (total) lb/hr 2,780,100 2,285,080 1,826,055Velocity ft/sec 49.3 40.5 32.3
Temperature oF 200 200 200Flow (total) acfm 838,744 689,055 549,374Flow (total) scfm 628,088 515,994 411,396Flow (total) dscfm 577,778 475,953 383,668
Deer Creek Station Air Quality Construction PSD Permit Application May 29, 2009 2. PROJECT DESCRIPTION
Project Description Page 2-12
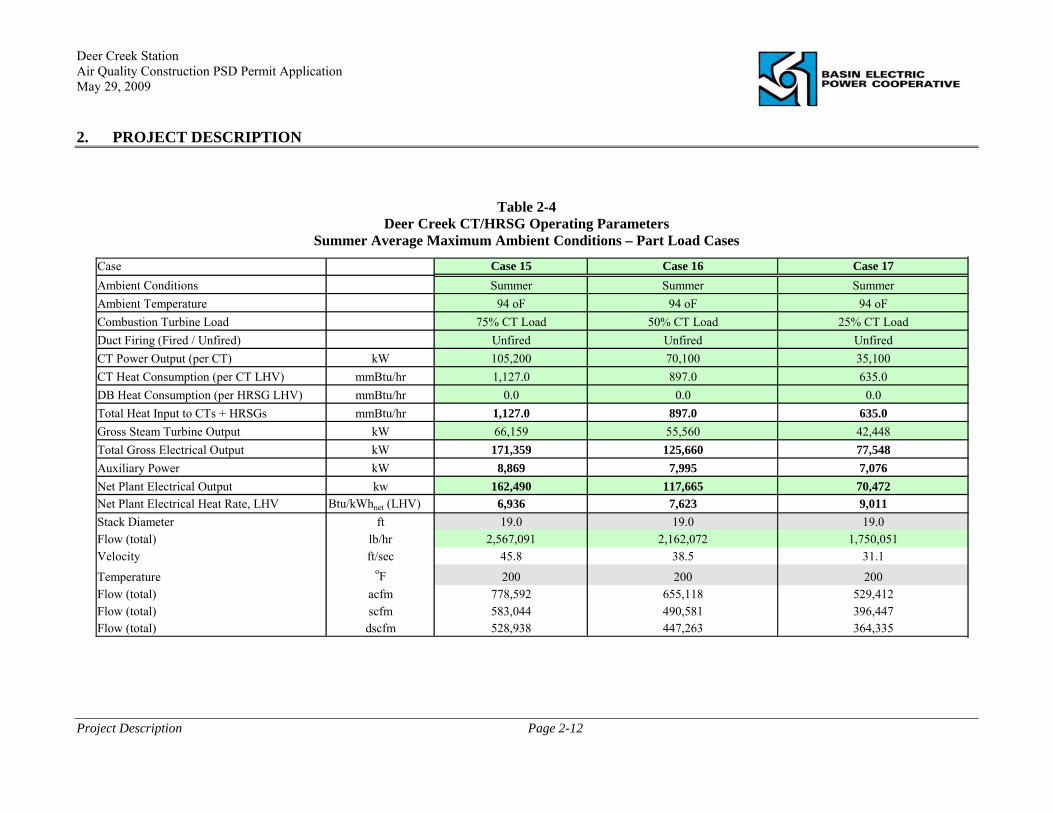
Table 2-4
Deer Creek CT/HRSG Operating Parameters Summer Average Maximum Ambient Conditions – Part Load Cases
Case Case 15 Case 16 Case 17Ambient Conditions Summer Summer SummerAmbient Temperature 94 oF 94 oF 94 oFCombustion Turbine Load 75% CT Load 50% CT Load 25% CT LoadDuct Firing (Fired / Unfired) Unfired Unfired UnfiredCT Power Output (per CT) kW 105,200 70,100 35,100CT Heat Consumption (per CT LHV) mmBtu/hr 1,127.0 897.0 635.0DB Heat Consumption (per HRSG LHV) mmBtu/hr 0.0 0.0 0.0Total Heat Input to CTs + HRSGs mmBtu/hr 1,127.0 897.0 635.0Gross Steam Turbine Output kW 66,159 55,560 42,448Total Gross Electrical Output kW 171,359 125,660 77,548Auxiliary Power kW 8,869 7,995 7,076Net Plant Electrical Output kw 162,490 117,665 70,472Net Plant Electrical Heat Rate, LHV Btu/kWhnet (LHV) 6,936 7,623 9,011Stack Diameter ft 19.0 19.0 19.0Flow (total) lb/hr 2,567,091 2,162,072 1,750,051Velocity ft/sec 45.8 38.5 31.1
Temperature oF 200 200 200Flow (total) acfm 778,592 655,118 529,412Flow (total) scfm 583,044 490,581 396,447Flow (total) dscfm 528,938 447,263 364,335
Deer Creek Station Air Quality Construction PSD Permit Application May 29, 2009 2. PROJECT DESCRIPTION
Project Description Page 2-13
2.2.3 Emergency Generator and Fire Water Pump Deer Creek will have an emergency diesel generator (EDG) and emergency fire-water pump (FWP). The EDG will supply power to the essential service motor control centers during an interruption of the electrical power supply to the site, including building heat and fuel supply systems, plant communication systems, and essential emergency lighting. Based on preliminary design calculations, the EDG will be designed to provide 2,000 kW power during emergency situations, and the FWP will be designed at 577 hp to provide water at a rate of 3,000 gpm. The diesel engines will be designed to fire low-sulfur diesel fuel. Both engines will be used only in case of an emergency and for periodic testing. 2.2.4 Emergency Inlet Air Heater The Deer Creek station will have one nature gas-fired emergency inlet heater to preheat the CT intake air under extremely cold ambient conditions (i.e., ambient temperatures less than approximately -25 °F). The heater will warm an ethylene glycol/water solution, which will be piped to a heat exchanger located at the CT air intake to heat the CT inlet air. The heater will operate for approximately 10 to 20 minutes during startup under extreme conditions. Once the CT is up to speed, the inlet air heater will be shut off and bleed heat from the compressor will be used to heat the inlet air. The emergency inlet heater design will be based on a maximum heat input of 25.0 mmBtu/hr to provide a heat duty of 19.0 mmBtu/hr, and will be designed to fire pipeline natural gas.
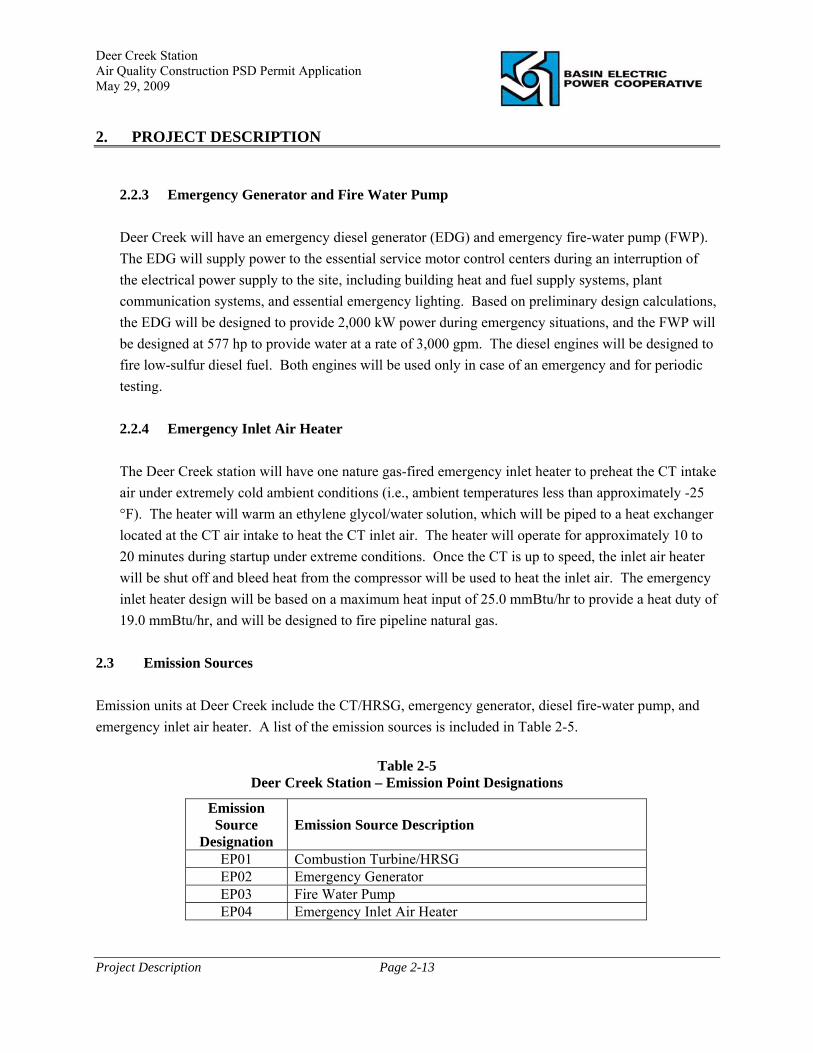
2.3 Emission Sources Emission units at Deer Creek include the CT/HRSG, emergency generator, diesel fire-water pump, and emergency inlet air heater. A list of the emission sources is included in Table 2-5.
Table 2-5 Deer Creek Station – Emission Point Designations
Emission Source
Designation
Emission Source Description
EP01 Combustion Turbine/HRSG EP02 Emergency Generator EP03 Fire Water Pump EP04 Emergency Inlet Air Heater
Deer Creek Station Air Quality Construction PSD Permit Application May 29, 2009 2. PROJECT DESCRIPTION
Project Description Page 2-14
2.4 General Applicant Information The Deer Creek Station will be owned and operated by Basin Electric Power Cooperative. To facilitate DENR’s review of this permit application, the individual most familiar with the proposed project and the permit application is identified below.
Project Owner Contact:
Mr. Jerry Menge Basin Electric Power Cooperative Air Quality Program Coordinator 1717 East Interstate Avenue Bismarck, ND 58501
2.5 Standard Industrial Classification (SIC) The United States government has devised a method for grouping all business activities according to their participation in the national commerce system. The system is based on classifying activities into “major groups” defined by the general character of a business operation. For example, electric, gas, and sanitary services, which include power production, are defined as a major group. Each major group is given a unique two digit number for identification. Power production activities have been assigned a major group code “49.” To provide more detailed identification of a particular operation, an additional two-digit code is appended to the major group code. In the case of electric power generating facilities, the two digit code is “11” in order to define the type of production involved. Thus, the Deer Creek Station is classified under the SIC system as:
Major Group 49 – Electric, Gas, and Sanitary Services Electric Services – 4911
Deer Creek Station Air Quality Construction PSD Permit Application May 29, 2009 3. PROJECT EMISSIONS
Project Emissions Page 3-1
3.0 Project Emissions Emissions from the Deer Creek Station will be primarily the products of natural gas combustion in the CT and HRSG. The emergency generator, fire-water pump, and emergency inlet air heater will have limited use, but are also sources of emissions associated with fuel combustion. Emission sources at the facility are listed in Table 2-5. Emission sources at the Deer Creek Station have the potential to emit the following NSR-PSD pollutants (i.e., pollutants for which PSD significance levels have been established in 40 CFR 52.21);
Nitrogen oxides (NOx) Carbon monoxide (CO) Volatile organic compounds (VOC) Sulfur dioxide (SO2) Particulate Matter (PM) PM with an aerodynamic diameter less than 10 microns (PM10) PM with an aerodynamic diameter less than 2.5 microns (PM2.5) Sulfuric Acid Mist (H2SO4)
Emissions were calculated for each emissions source. For the CT/HRSG, performance calculations were prepared at various loads and ambient conditions to envelope potential operating scenarios and identify the maximum potential emission rates. NOx, CO, VOC, and filterable PM emissions were calculated based on emissions data available from CT and HRSG vendors. SO2 emissions were calculated based on fuel flow to the combustion source, fuel sulfur content, and assuming 100% conversion of fuel sulfur to SO2. Condensible PM emissions were calculated using emission factors provided in U.S.EPA’s Compilation of Air Pollution Emission Factors, Volume 1: Stationary Point and Area Sources, (AP-42, Fifth Edition), and adding individual source-specific condensible constituents (e.g., sulfuric acid mist and/or ammonium sulfate). For natural gas combustion it was assumed that all of the PM would be emitted as PM2.5 (see, e.g., AP-42 Table 1.4-2); therefore, the PM, PM10 and PM2.5 emission rates are the same. Detailed emission calculations and methodologies used to calculate emissions are included in Appendix B of this permit application. In addition to calculating potential PSD pollutant emissions, emission estimates were prepared for certain non-PSD pollutants, including pollutants defined hazardous air pollutants (HAPs) in Section 112 of the Clean Air Act. Potential HAP emissions were estimated for each emission source based on published emission factors in AP-42. HAP emission estimates are included in Section 3.5 of this permit application.
Deer Creek Station Air Quality Construction PSD Permit Application May 29, 2009 3. PROJECT EMISSIONS
Project Emissions Page 3-2
Emission calculations were prepared for all emission sources at Deer Creek. Calculations were prepared for each potential emission source to determine: (1) emission rates during normal operation; (2) emission rates associated with startup of the combustion turbine; and (3) total annual emissions. 3.1 Combustion Turbine / HRSG Emissions The CT/HRSG will be designed to fire pipeline natural gas. Natural gas characteristics used to calculate CT/HRSG performance and estimate potential emissions are included in Appendix B. CT/HRSG performance calculations were performed for several CT load levels, duct firing rates, and ambient conditions. CT/HRSG performance calculations for each operating scenario are also included in Appendix B. Emissions were calculated based on the BACT analysis (Appendix C) and emission rates achieved in practice by similar sources, anticipated vendor guarantees, and published emission factors. During start-up, combustion turbines typically emit pollutants at rates (i.e., lb/mmBtu heat input) that are somewhat higher than the emission rates achieved during normal steady state operation. Emissions of NOx, CO, and VOC are expected to be somewhat higher during start-up of the Deer Creek CT than during normal operation. In addition, the proposed post-combustion control system (e.g., SCR for NOx control) will not effectively remove NOx when the exhaust gas temperature in the HRSG is below the minimum temperature required for effective operation. Emission calculations were prepared to account for increased emissions during CT startup. Startup emission calculations are included in Appendix B.
3.1.1 CT/HRSG Emissions During Normal Operations CT/HRSG performance calculations were prepared for several CT load levels, duct firing rates, and ambient conditions. Operating parameters were calculated for the CTs at four load levels (100%, 75%, 50%, and 25%), and three ambient air temperatures (94 °F, 43 °F and -41 °F). These temperatures represent the summer maximum average temperature (94 °F), annual average temperature (43 °F), and winter extreme (-41 °F), as determined from weather data collected at local meteorological reporting stations. Operating parameters for duct burner firing were calculated for all of the 100% load cases. These operating cases cover the expected range of conditions in which Deer Creek CT/HRSG may operate at full load, and they bracket the expected worst-case air pollution emissions. Table 3-1 summarizes the CT/HRSG performance calculations and emission estimates prepared for 100% load operation at each of the three ambient temperatures without supplemental duct firing.

Deer Creek Station Air Quality Construction PSD Permit Application May 29, 2009 3. PROJECT EMISSIONS
Project Emissions Page 3-3
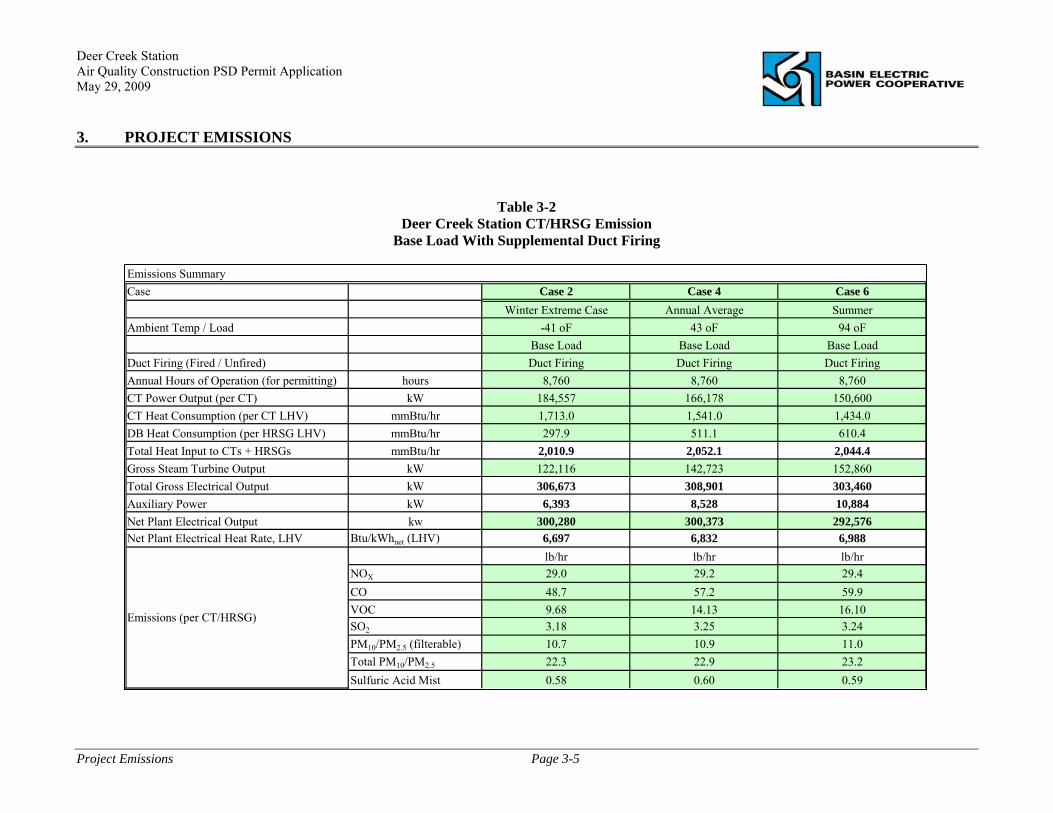
Maximum hourly emissions for each of the PSD pollutants are included. Table 3-2 provides a summary of the CT/HRSG emission calculations for each base load case with supplemental duct firing. Maximum heat input to the CT of 1,713 mmBtu/hr occurs at the winter extreme ambient conditions. Maximum heat input to the duct burner (610.4 mmBtu/hr) occurs at summer ambient conditions, and is needed to boost total gross electrical output to 303 MW during extreme summer conditions. Maximum total heat input to the CT/HRSG of 2,052 mmBtu/hr occurs at the average annual ambient conditions when duct firing is used to achieve a total gross electrical output of 308.9 MW (1,541 mmBtu/hr heat input to CT and 511.1 mmBtu/hr heat input to the duct burner). The emission estimates for the summer ambient conditions (94 °F) include duct burner firing to reflect worst-case operating conditions during periods of peak electricity demand. The emission estimates for the winter extreme conditions (-41°F) also include duct burner firing to reflect worst-case operating conditions during periods of winter peak electricity demand. The highest mass emission rates (lb/hr) for all pollutants occur at summer ambient conditions with duct firing. Maximum hourly mass emissions (lb/hr) from the Deer Creek CT/HRSG (with duct firing) are summarized in Table 3-3.

Deer Creek Station Air Quality Construction PSD Permit Application May 29, 2009 3. PROJECT EMISSIONS
Project Emissions Page 3-4
Table 3-1 Deer Creek Station CT/HRSG Emission
Base Load Without Supplemental Duct Firing
Emissions SummaryCase Case 1 Case 3 Case 5
Winter Extreme Case Annual Average Summer Ambient Temp / Load -41 oF 43 oF 94 oF
Base Load Base Load Base LoadDuct Firing (Fired / Unfired) Unfired Unfired UnfiredAnnual Hours of Operation (for permitting) hours 8,760 8,760 8,760CT Power Output (per CT) kW 184,557 166,178 150,600CT Heat Consumption (per CT LHV) mmBtu/hr 1,713.0 1,541.0 1,434.0DB Heat Consumption (per HRSG LHV) mmBtu/hr 0.0 0.0 0.0Total Heat Input to CTs + HRSGs mmBtu/hr 1,713.0 1,541.0 1,434.0Gross Steam Turbine Output kW 85,326 83,505 79,936Total Gross Electrical Output kW 269,883 249,683 230,536Auxiliary Power kW 5,390 6,507 10,001Net Plant Electrical Output kw 264,493 243,176 220,535Net Plant Electrical Heat Rate, LHV Btu/kWhnet (LHV) 6,477 6,337 6,502
lb/hr lb/hr lb/hrNOX 24.5 21.8 20.4CO 32.0 28.5 26.0VOC 3.07 2.74 2.55SO2 2.71 2.44 2.27PM10/PM2.5 (filterable) 9.0 8.1 7.6Total PM10/PM2.5 18.6 16.7 15.7Sulfuric Acid Mist 0.49 0.45 0.42
Emissions (per CT/HRSG)
Deer Creek Station Air Quality Construction PSD Permit Application May 29, 2009 3. PROJECT EMISSIONS
Project Emissions Page 3-5
Table 3-2 Deer Creek Station CT/HRSG Emission
Base Load With Supplemental Duct Firing
Emissions SummaryCase Case 2 Case 4 Case 6
Winter Extreme Case Annual Average SummerAmbient Temp / Load -41 oF 43 oF 94 oF
Base Load Base Load Base LoadDuct Firing (Fired / Unfired) Duct Firing Duct Firing Duct FiringAnnual Hours of Operation (for permitting) hours 8,760 8,760 8,760CT Power Output (per CT) kW 184,557 166,178 150,600CT Heat Consumption (per CT LHV) mmBtu/hr 1,713.0 1,541.0 1,434.0DB Heat Consumption (per HRSG LHV) mmBtu/hr 297.9 511.1 610.4Total Heat Input to CTs + HRSGs mmBtu/hr 2,010.9 2,052.1 2,044.4Gross Steam Turbine Output kW 122,116 142,723 152,860Total Gross Electrical Output kW 306,673 308,901 303,460Auxiliary Power kW 6,393 8,528 10,884Net Plant Electrical Output kw 300,280 300,373 292,576Net Plant Electrical Heat Rate, LHV Btu/kWhnet (LHV) 6,697 6,832 6,988
lb/hr lb/hr lb/hrNOX 29.0 29.2 29.4CO 48.7 57.2 59.9VOC 9.68 14.13 16.10SO2 3.18 3.25 3.24PM10/PM2.5 (filterable) 10.7 10.9 11.0Total PM10/PM2.5 22.3 22.9 23.2Sulfuric Acid Mist 0.58 0.60 0.59
Emissions (per CT/HRSG)
Deer Creek Station Air Quality Construction PSD Permit Application May 29, 2009 3. PROJECT EMISSIONS
Project Emissions Page 3-6
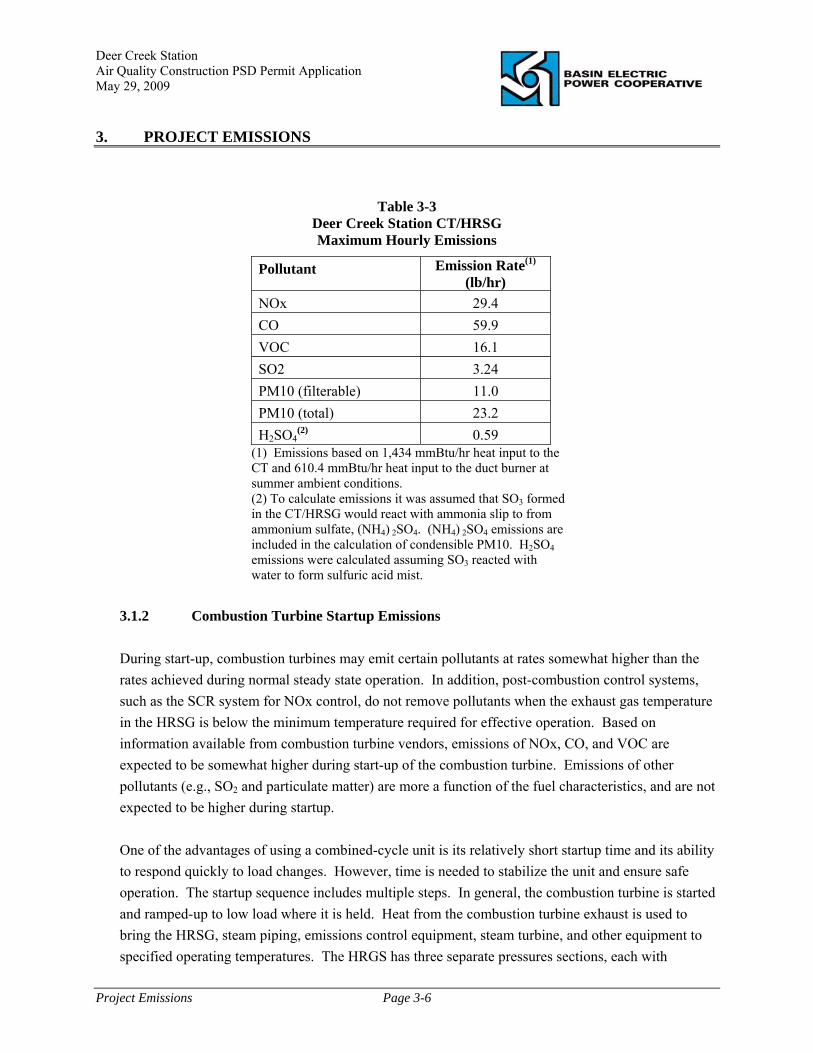
Table 3-3 Deer Creek Station CT/HRSG Maximum Hourly Emissions
Pollutant Emission Rate(1) (lb/hr)
NOx 29.4 CO 59.9 VOC 16.1 SO2 3.24 PM10 (filterable) 11.0 PM10 (total) 23.2 H2SO4
(2) 0.59 (1) Emissions based on 1,434 mmBtu/hr heat input to the CT and 610.4 mmBtu/hr heat input to the duct burner at summer ambient conditions. (2) To calculate emissions it was assumed that SO3 formed in the CT/HRSG would react with ammonia slip to from ammonium sulfate, (NH4) 2SO4. (NH4) 2SO4 emissions are included in the calculation of condensible PM10. H2SO4 emissions were calculated assuming SO3 reacted with water to form sulfuric acid mist.
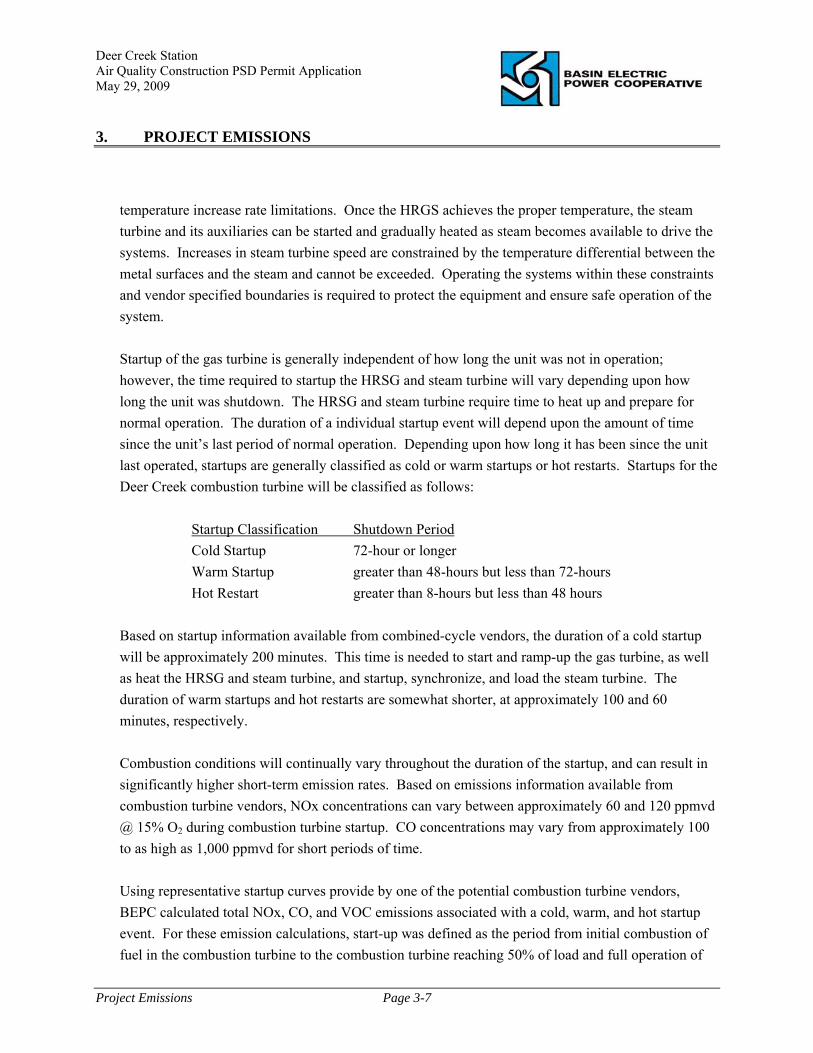
3.1.2 Combustion Turbine Startup Emissions During start-up, combustion turbines may emit certain pollutants at rates somewhat higher than the rates achieved during normal steady state operation. In addition, post-combustion control systems, such as the SCR system for NOx control, do not remove pollutants when the exhaust gas temperature in the HRSG is below the minimum temperature required for effective operation. Based on information available from combustion turbine vendors, emissions of NOx, CO, and VOC are expected to be somewhat higher during start-up of the combustion turbine. Emissions of other pollutants (e.g., SO2 and particulate matter) are more a function of the fuel characteristics, and are not expected to be higher during startup. One of the advantages of using a combined-cycle unit is its relatively short startup time and its ability to respond quickly to load changes. However, time is needed to stabilize the unit and ensure safe operation. The startup sequence includes multiple steps. In general, the combustion turbine is started and ramped-up to low load where it is held. Heat from the combustion turbine exhaust is used to bring the HRSG, steam piping, emissions control equipment, steam turbine, and other equipment to specified operating temperatures. The HRGS has three separate pressures sections, each with
Deer Creek Station Air Quality Construction PSD Permit Application May 29, 2009 3. PROJECT EMISSIONS
Project Emissions Page 3-7
temperature increase rate limitations. Once the HRGS achieves the proper temperature, the steam turbine and its auxiliaries can be started and gradually heated as steam becomes available to drive the systems. Increases in steam turbine speed are constrained by the temperature differential between the metal surfaces and the steam and cannot be exceeded. Operating the systems within these constraints and vendor specified boundaries is required to protect the equipment and ensure safe operation of the system. Startup of the gas turbine is generally independent of how long the unit was not in operation; however, the time required to startup the HRSG and steam turbine will vary depending upon how long the unit was shutdown. The HRSG and steam turbine require time to heat up and prepare for normal operation. The duration of a individual startup event will depend upon the amount of time since the unit’s last period of normal operation. Depending upon how long it has been since the unit last operated, startups are generally classified as cold or warm startups or hot restarts. Startups for the Deer Creek combustion turbine will be classified as follows:
Startup Classification Shutdown Period Cold Startup 72-hour or longer Warm Startup greater than 48-hours but less than 72-hours Hot Restart greater than 8-hours but less than 48 hours
Based on startup information available from combined-cycle vendors, the duration of a cold startup will be approximately 200 minutes. This time is needed to start and ramp-up the gas turbine, as well as heat the HRSG and steam turbine, and startup, synchronize, and load the steam turbine. The duration of warm startups and hot restarts are somewhat shorter, at approximately 100 and 60 minutes, respectively. Combustion conditions will continually vary throughout the duration of the startup, and can result in significantly higher short-term emission rates. Based on emissions information available from combustion turbine vendors, NOx concentrations can vary between approximately 60 and 120 ppmvd @ 15% O2 during combustion turbine startup. CO concentrations may vary from approximately 100 to as high as 1,000 ppmvd for short periods of time. Using representative startup curves provide by one of the potential combustion turbine vendors, BEPC calculated total NOx, CO, and VOC emissions associated with a cold, warm, and hot startup event. For these emission calculations, start-up was defined as the period from initial combustion of fuel in the combustion turbine to the combustion turbine reaching 50% of load and full operation of

Deer Creek Station Air Quality Construction PSD Permit Application May 29, 2009 3. PROJECT EMISSIONS
Project Emissions Page 3-8
the SCR system. Detailed startup emission calculations are included in Appendix B, and are summarized in Tables 3-4 through 3-6.
Table 3-4 CT/HRSG Startup Emissions
Cold Startup
Cold Startup Emissions Flame to
FSNL Initial Load to
>50% Load Total
Emissions per Startup
Estimated Overall
Startup Time
Average Startup
Emission Rate
Pollutant (lbs) (lbs) (lbs) (minutes) (lb/hr)
NOx 10.0 210.5 220.5 202 65.5 CO 250.0 586.7 836.7 202 248.5
VOC 14.0 35.1 49.1 202 14.6 PM10 0.16 8.11 8.27 202 2.46
Table 3-5 CT/HRSG Startup Emissions
Warm Startup
Warm Startup Emissions Flame to
FSNL Initial Load to
>50% Load Total
Emissions per Startup
Estimated Overall
Startup Time
Average Startup
Emission Rate
Pollutant (lbs) (lbs) (lbs) (minutes) (lb/hr)
NOx 10.0 77.9 87.9 98 53.8 CO 250.0 300.6 550.6 98 337.1
VOC 14.0 16.2 30.2 98 18.5 PM10 0.16 3.10 3.26 98 2.00

Deer Creek Station Air Quality Construction PSD Permit Application May 29, 2009 3. PROJECT EMISSIONS
Project Emissions Page 3-9
Table 3-6 CT/HRSG Startup Emissions
Hot Restart
Hot Re-Start Emissions Flame to
FSNL Initial Load to
>50% Load Total
Emissions per Startup
Estimated Overall
Startup Time
Average Startup
Emission Rate
Pollutant (lbs) (lbs) (lbs) (minutes) (lb/hr)
NOx 10.0 56.2 66.2 63 63.0 CO 250.0 96.6 346.6 63 330.1
VOC 14.0 5.2 19.2 63 18.3 PM10 0.17 1.79 1.96 63 1.87
The Deer Creek combined-cycle unit is being designed to follow changes in demand for electricity, and to provide more electricity during periods of high demand. Therefore, it is anticipated that the CT/HRSG will be subject to frequent load changes and startups. Based on a review of anticipated market conditions and historical demand curves, it is anticipated that the CT/HRSG will be subject to approximately 75 cold starts, 260 warm starts, and 30 hot re-starts each year. An estimate of the time the CT/HRSG will operate in each startup mode (hours per year) is provided in Table 3-7. Total NOx, CO, and VOC emissions associated with CT/HRSG startups are summarized in Tables 3-8, 3-9, and 3-10, respectively.
Table 3-7 CT/HRSG Startup Emissions
Estimated Startup Hours per Year
Estimated Number of Startups/Re-Starts per Year Number of Startups per Year
Time per Startup
Hours per Year
Startup Mode (#) (hours) (hours)
Cold Startup 75 3.37 252.8 Warm Startup 260 1.63 423.8 Hot Re-Start 30 1.05 31.5 Total Startup Hours per Year 708.1

Deer Creek Station Air Quality Construction PSD Permit Application May 29, 2009 3. PROJECT EMISSIONS
Project Emissions Page 3-10
Table 3-8 CT/HRSG Startup Emissions
Estimated Startup Emissions – NOx
Average Startup Emission Rate
Startup Hours per Year
Annual Startup Emissions
NOx Emissions
(lb/hr) (hr/year) (tpy) Cold Startups 65.5 252.8 8.28 Warm Startups 53.8 423.8 11.4 Hot Re-Starts 63.0 31.5 0.99 Total Startup Emissions 20.7
Table 3-9 CT/HRSG Startup Emissions
Estimated Startup Emissions – CO
Average Startup Emission Rate
Startup Hours per Year
Annual Startup Emissions
CO Emissions
(lb/hr) (hr/year) (tpy) Cold Startups 248.5 252.8 31.4 Warm Startups 337.1 423.8 71.4 Hot Re-Starts 330.1 31.5 5.20 Total Startup Emissions 108.0
Table 3-10 CT/HRSG Startup Emissions
Estimated Startup Emissions – VOC
Average Startup Emission Rate
Startup Hours per Year
Annual Startup Emissions
VOC Emissions
(lb/hr) (hr/year) (tpy) Cold Startups 14.6 252.8 1.84 Warm Startups 18.5 423.8 3.92 Hot Re-Starts 18.3 31.5 0.29 Total Startup Emissions 6.05
Deer Creek Station Air Quality Construction PSD Permit Application May 29, 2009 3. PROJECT EMISSIONS
Project Emissions Page 3-11
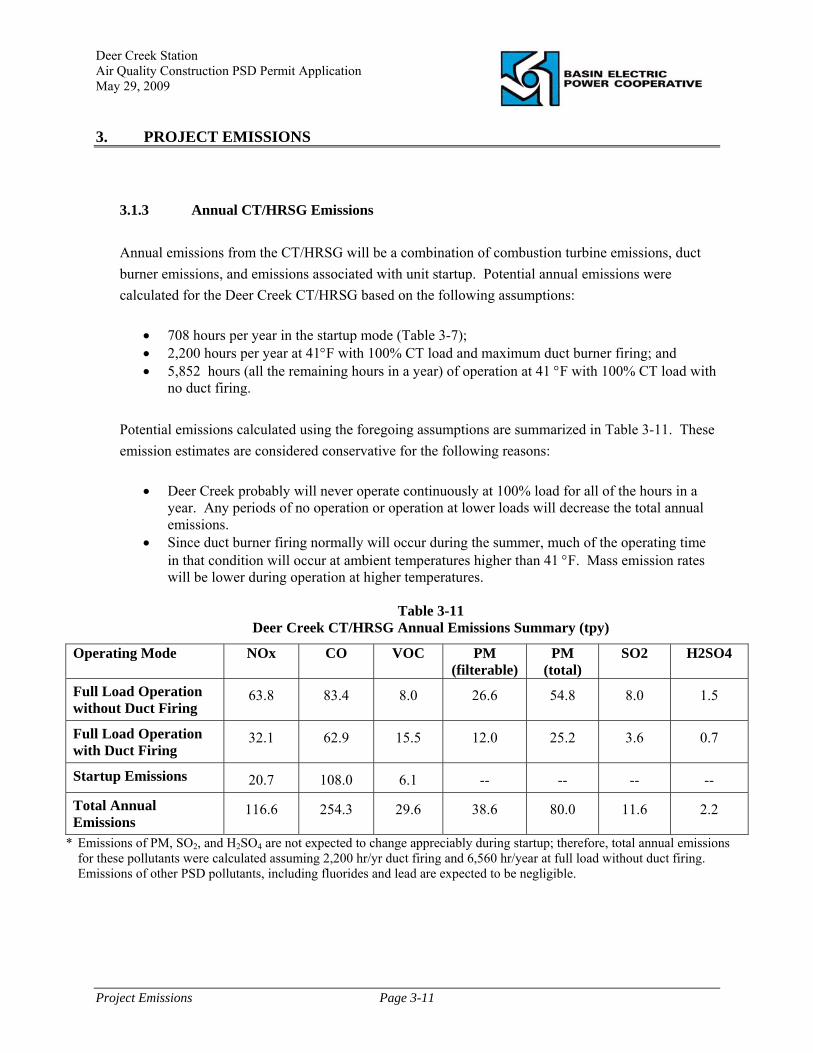
3.1.3 Annual CT/HRSG Emissions Annual emissions from the CT/HRSG will be a combination of combustion turbine emissions, duct burner emissions, and emissions associated with unit startup. Potential annual emissions were calculated for the Deer Creek CT/HRSG based on the following assumptions:
• 708 hours per year in the startup mode (Table 3-7); • 2,200 hours per year at 41°F with 100% CT load and maximum duct burner firing; and • 5,852 hours (all the remaining hours in a year) of operation at 41 °F with 100% CT load with
no duct firing.
Potential emissions calculated using the foregoing assumptions are summarized in Table 3-11. These emission estimates are considered conservative for the following reasons:
• Deer Creek probably will never operate continuously at 100% load for all of the hours in a year. Any periods of no operation or operation at lower loads will decrease the total annual emissions.
• Since duct burner firing normally will occur during the summer, much of the operating time in that condition will occur at ambient temperatures higher than 41 °F. Mass emission rates will be lower during operation at higher temperatures.
Table 3-11
Deer Creek CT/HRSG Annual Emissions Summary (tpy)
Operating Mode NOx CO VOC PM (filterable)
PM (total)
SO2 H2SO4
Full Load Operation without Duct Firing
63.8 83.4 8.0 26.6 54.8 8.0 1.5
Full Load Operation with Duct Firing
32.1 62.9 15.5 12.0 25.2 3.6 0.7
Startup Emissions 20.7 108.0 6.1 -- -- -- --
Total Annual Emissions
116.6 254.3 29.6 38.6 80.0 11.6 2.2
* Emissions of PM, SO2, and H2SO4 are not expected to change appreciably during startup; therefore, total annual emissions for these pollutants were calculated assuming 2,200 hr/yr duct firing and 6,560 hr/year at full load without duct firing. Emissions of other PSD pollutants, including fluorides and lead are expected to be negligible.
Deer Creek Station Air Quality Construction PSD Permit Application May 29, 2009 3. PROJECT EMISSIONS
Project Emissions Page 3-12
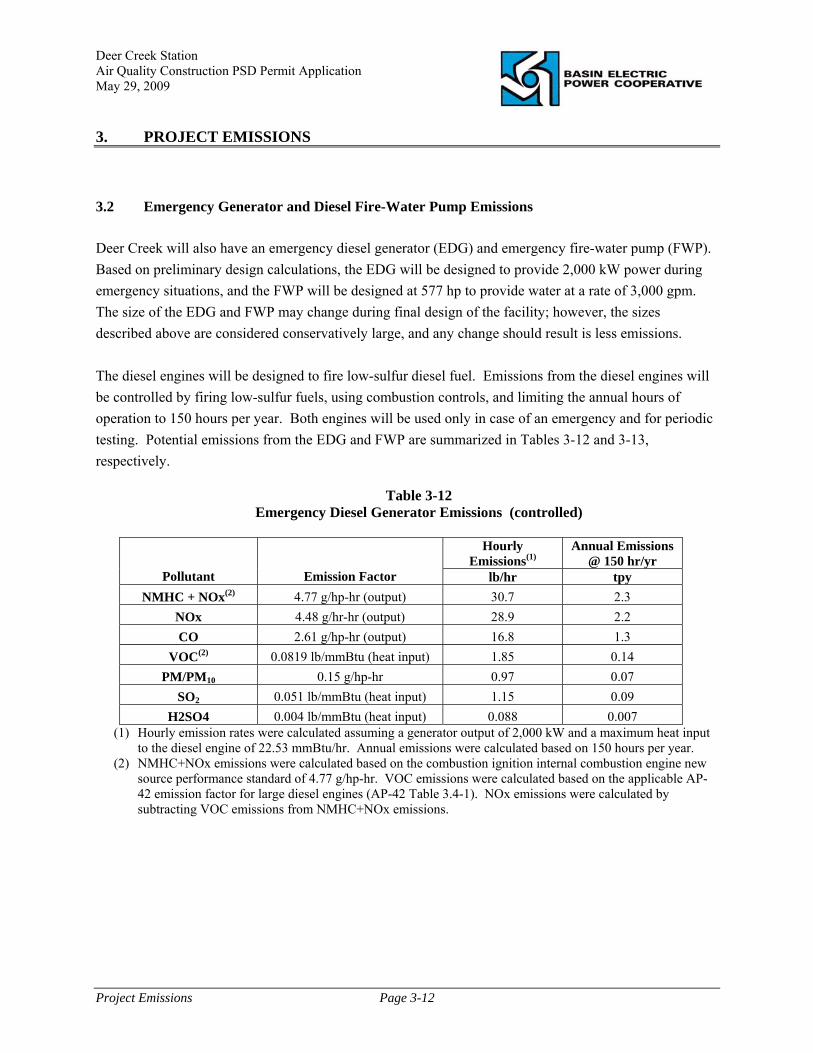
3.2 Emergency Generator and Diesel Fire-Water Pump Emissions Deer Creek will also have an emergency diesel generator (EDG) and emergency fire-water pump (FWP). Based on preliminary design calculations, the EDG will be designed to provide 2,000 kW power during emergency situations, and the FWP will be designed at 577 hp to provide water at a rate of 3,000 gpm. The size of the EDG and FWP may change during final design of the facility; however, the sizes described above are considered conservatively large, and any change should result is less emissions. The diesel engines will be designed to fire low-sulfur diesel fuel. Emissions from the diesel engines will be controlled by firing low-sulfur fuels, using combustion controls, and limiting the annual hours of operation to 150 hours per year. Both engines will be used only in case of an emergency and for periodic testing. Potential emissions from the EDG and FWP are summarized in Tables 3-12 and 3-13, respectively.
Table 3-12
Emergency Diesel Generator Emissions (controlled)
Hourly Emissions(1)
Annual Emissions @ 150 hr/yr
Pollutant
Emission Factor lb/hr tpy NMHC + NOx(2) 4.77 g/hp-hr (output) 30.7 2.3
NOx 4.48 g/hr-hr (output) 28.9 2.2 CO 2.61 g/hp-hr (output) 16.8 1.3
VOC(2) 0.0819 lb/mmBtu (heat input) 1.85 0.14 PM/PM10 0.15 g/hp-hr 0.97 0.07
SO2 0.051 lb/mmBtu (heat input) 1.15 0.09 H2SO4 0.004 lb/mmBtu (heat input) 0.088 0.007
(1) Hourly emission rates were calculated assuming a generator output of 2,000 kW and a maximum heat input to the diesel engine of 22.53 mmBtu/hr. Annual emissions were calculated based on 150 hours per year.
(2) NMHC+NOx emissions were calculated based on the combustion ignition internal combustion engine new source performance standard of 4.77 g/hp-hr. VOC emissions were calculated based on the applicable AP-42 emission factor for large diesel engines (AP-42 Table 3.4-1). NOx emissions were calculated by subtracting VOC emissions from NMHC+NOx emissions.

Deer Creek Station Air Quality Construction PSD Permit Application May 29, 2009 3. PROJECT EMISSIONS
Project Emissions Page 3-13
Table 3-13 Fire-Water Pump Emissions (controlled)
Hourly
Emissions(1) Annual Emissions
@ 150 hr/yr
Pollutant
Emission Factor lb/hr tpy NMHC + NOx(2) 3.0 g/hp-hr (output) 3.82 0.29
NOx 1.9 g/hr-hr (output) 2.39 0.18 CO 2.6 g/hp-hr 3.31 0.25
VOC(2) 2.47 x 10⁻³ lb/hp-hr (output) 1.43 0.11 PM/PM10 0.15 g/hp-hr 0.19 0.014
SO2 0.052 lb/mmBtu (heat input) 0.23 0.02 H2SO4 0.004 lb/mmBtu (heat input) 0.018 0.001
(1) Hourly emission rates were calculated assuming a diesel engine output of 577 hp and a maximum heat input of 4.45 mmBtu/hr. Annual emissions were calculated based on 150 hours per year.
(2) NMHC+NOx emissions were calculated based on the combustion ignition internal combustion engine new source performance standard of 3.0 g/hp-hr. VOC emissions were calculated based on the applicable AP-42 emission factor for diesel-fired engines (AP-42 Table 3.3-1). NOx emissions were calculated by subtracting VOC emissions from NMHC+NOx emissions.
3.3 Emergency Inlet Air Heater The Deer Creek station will have one nature gas-fired emergency air inlet heater to preheat the CT intake air under extreme cold (approximately -25 °F) conditions. The heater will warm a water and ethylene glycol mixture, which will be piped to the CT air intake to heat the air entering the turbine. The heater will operate for 10-20 minutes during startup under extreme conditions. Once the CT is up to speed, the inlet air heater will be shut off and bleed heat off the compressor will take over. The heater design will be based on a maximum heat input of 25.0 mmBtu/hr used to provide a heat duty of 19.0 mmBtu. The emergency inlet air heater will be designed to fire pipeline natural gas. Emissions from the heater will be controlled by using combustion controls and limiting the annual hours of operation to 150 hours per year. Potential emissions from the emergency inlet air heater are summarized in Tables 3-14.

Deer Creek Station Air Quality Construction PSD Permit Application May 29, 2009 3. PROJECT EMISSIONS
Project Emissions Page 3-14
Table 3-14 Emergency Inlet Air Heater Emissions
Hourly Emissions(1)
Annual Emissions @ 150 hr/yr
Pollutant
Emission Factor lb/hr tpy NOx 50 lb/mmscf 1.23 0.09 CO 84 lb/mmscf 2.06 0.15
VOC 5.5 lb/mmscf 0.13 0.01 PM/PM10 7.6 lb/mmscf 0.19 0.01
SO2 0.714 lb/mmscf 0.02 0.002 H2SO4 0.055 lb/mmscf 0.001 0.000075
(1) Hourly emission rates were calculated assuming a maximum heat input of 25.0 mmBtu/hr and AP-42 natural gas emission factors (AP-42 Table 1.4-1). Annual emissions were calculated based on 150 hours per year.
3.5 Potential Annual Emissions Potential annual emissions from all emission sources at the Deer Creek Station are summarized in Table 3-15.
Table 3-15 Annual Potential-to-Emit (PTE) Summary
CT/HRSG Emergency Generator
Fire-Water Pump
Emergency Inlet Heater Total Pollutant
tpy tpy tpy tpy tpy NOx 116.6 2.2 0.18 0.09 119.1
CO 254.3 1.3 0.25 0.15 256.0
VOC 29.6 0.14 0.11 0.010 29.7
PM (filterable) 38.6 0.07 0.014 0.004 38.7
PM Total(1) 80.0 0.07 0.014 0.014 80.1
SO2 11.6 0.09 0.02 0.002 11.7
H2SO4(1) 2.2 0.007 0.001 0.000075 2.21
Lead(1) 3.59 x 10⁻⁴ neg. neg. 9.38 x 10⁻⁷ 3.60 x 10⁻⁴ (1) Total PM10 includes filterable and condensible constituents. Condensible emissions are assumed to include
ammonium sulfate emissions from the CT/HRSG. (2) Sulfuric acid mist emissions from the CT/HRSG were calculated assuming SO3 formed during the combustion
process reacts with water to form H2SO4. To calculate emissions from the CT/HRSG it was also assumed that SO3 formed in the CT/HRSG would react with ammonia slip to from ammonium sulfate, (NH4) 2SO4. (NH4) 2SO4 emissions were included in the calculation of condensible PM10.
(3) Emission rates designated as “neg.” are considered to be negligible or were not calculated because of the lack of an applicable AP-42 emission factor.
Deer Creek Station Air Quality Construction PSD Permit Application May 29, 2009 3. PROJECT EMISSIONS
Project Emissions Page 3-15
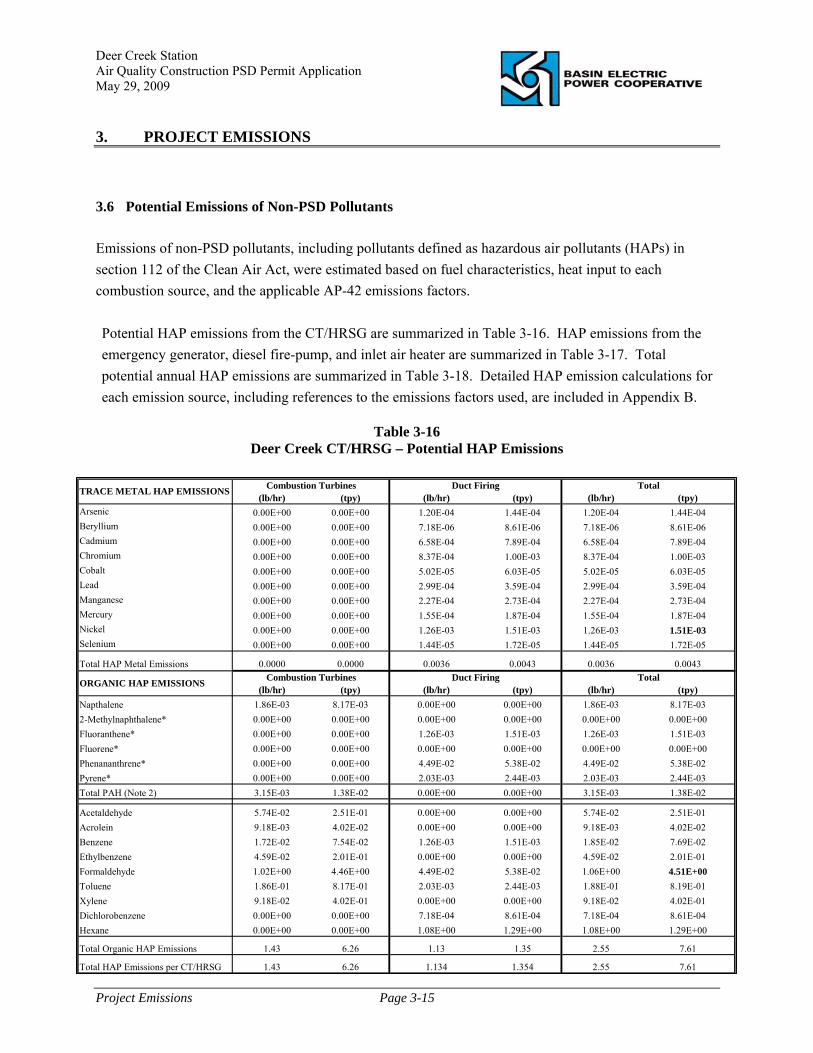
3.6 Potential Emissions of Non-PSD Pollutants Emissions of non-PSD pollutants, including pollutants defined as hazardous air pollutants (HAPs) in section 112 of the Clean Air Act, were estimated based on fuel characteristics, heat input to each combustion source, and the applicable AP-42 emissions factors. Potential HAP emissions from the CT/HRSG are summarized in Table 3-16. HAP emissions from the emergency generator, diesel fire-pump, and inlet air heater are summarized in Table 3-17. Total potential annual HAP emissions are summarized in Table 3-18. Detailed HAP emission calculations for each emission source, including references to the emissions factors used, are included in Appendix B.
Table 3-16
Deer Creek CT/HRSG – Potential HAP Emissions
(lb/hr) (tpy) (lb/hr) (tpy) (lb/hr) (tpy)Arsenic 0.00E+00 0.00E+00 1.20E-04 1.44E-04 1.20E-04 1.44E-04Beryllium 0.00E+00 0.00E+00 7.18E-06 8.61E-06 7.18E-06 8.61E-06Cadmium 0.00E+00 0.00E+00 6.58E-04 7.89E-04 6.58E-04 7.89E-04Chromium 0.00E+00 0.00E+00 8.37E-04 1.00E-03 8.37E-04 1.00E-03Cobalt 0.00E+00 0.00E+00 5.02E-05 6.03E-05 5.02E-05 6.03E-05Lead 0.00E+00 0.00E+00 2.99E-04 3.59E-04 2.99E-04 3.59E-04Manganese 0.00E+00 0.00E+00 2.27E-04 2.73E-04 2.27E-04 2.73E-04Mercury 0.00E+00 0.00E+00 1.55E-04 1.87E-04 1.55E-04 1.87E-04Nickel 0.00E+00 0.00E+00 1.26E-03 1.51E-03 1.26E-03 1.51E-03Selenium 0.00E+00 0.00E+00 1.44E-05 1.72E-05 1.44E-05 1.72E-05
Total HAP Metal Emissions 0.0000 0.0000 0.0036 0.0043 0.0036 0.0043
(lb/hr) (tpy) (lb/hr) (tpy) (lb/hr) (tpy)Napthalene 1.86E-03 8.17E-03 0.00E+00 0.00E+00 1.86E-03 8.17E-032-Methylnaphthalene* 0.00E+00 0.00E+00 0.00E+00 0.00E+00 0.00E+00 0.00E+00Fluoranthene* 0.00E+00 0.00E+00 1.26E-03 1.51E-03 1.26E-03 1.51E-03Fluorene* 0.00E+00 0.00E+00 0.00E+00 0.00E+00 0.00E+00 0.00E+00Phenananthrene* 0.00E+00 0.00E+00 4.49E-02 5.38E-02 4.49E-02 5.38E-02Pyrene* 0.00E+00 0.00E+00 2.03E-03 2.44E-03 2.03E-03 2.44E-03Total PAH (Note 2) 3.15E-03 1.38E-02 0.00E+00 0.00E+00 3.15E-03 1.38E-02
Acetaldehyde 5.74E-02 2.51E-01 0.00E+00 0.00E+00 5.74E-02 2.51E-01Acrolein 9.18E-03 4.02E-02 0.00E+00 0.00E+00 9.18E-03 4.02E-02Benzene 1.72E-02 7.54E-02 1.26E-03 1.51E-03 1.85E-02 7.69E-02Ethylbenzene 4.59E-02 2.01E-01 0.00E+00 0.00E+00 4.59E-02 2.01E-01Formaldehyde 1.02E+00 4.46E+00 4.49E-02 5.38E-02 1.06E+00 4.51E+00Toluene 1.86E-01 8.17E-01 2.03E-03 2.44E-03 1.88E-01 8.19E-01Xylene 9.18E-02 4.02E-01 0.00E+00 0.00E+00 9.18E-02 4.02E-01Dichlorobenzene 0.00E+00 0.00E+00 7.18E-04 8.61E-04 7.18E-04 8.61E-04Hexane 0.00E+00 0.00E+00 1.08E+00 1.29E+00 1.08E+00 1.29E+00
Total Organic HAP Emissions 1.43 6.26 1.13 1.35 2.55 7.61
Total HAP Emissions per CT/HRSG 1.43 6.26 1.134 1.354 2.55 7.61
Combustion Turbines Duct Firing TotalTRACE METAL HAP EMISSIONS
ORGANIC HAP EMISSIONS Combustion Turbines Duct Firing Total

Deer Creek Station Air Quality Construction PSD Permit Application May 29, 2009 3. PROJECT EMISSIONS
Project Emissions Page 3-16
Table 3-17 Auxiliary Combustion Sources – HAP Emission Summary
Metal HAPs Organic HAPs Total HAP Emissions Source
tpy tpy tpy Emergency Diesel Generator
-- 2.5 x 10⁻³ 2.5 x 10⁻³
Fire Water Pump -- 2.1 x 10⁻³ 2.1 x 10⁻³
Emergency Inlet Air Heater
1.1 x 10⁻⁵ 3.5 x 10⁻³ 3.5 x 10⁻³
Total 1.1 x 10⁻⁵ 8.1 x 10⁻³ 8.1 x 10⁻³
Table 3-18 Deer Creek Potential Annual HAP Emissions*
Total HAP Emissions Source
tpy CT/HRSG 7.61 Emergency Diesel Generator
2.5 x 10⁻³
Fire Water Pump 2.1 x 10⁻³
Emergency Inlet Air Heater
3.5 x 10⁻³
Total 7.62

Deer Creek Station Air Quality Construction PSD Permit Application May 29, 2009 3. PROJECT EMISSIONS
Project Emissions Page 3-17
3.6 Insignificant Activities Insignificant activities that are excluded from the South Dakota Part 70 operating permit requirements are defined in subsection 74:36:05:04.01. Operation of the Deer Creek Station may include the following insignificant activities:
Combustion Equipment
Mobile internal combustion engines, including engines in autos, trucks, and tractors; Laboratory equipment used exclusively for chemical or physical analysis; A device or apparatus that has a heat input capability of not more than 3.5 mmBtu/hr; An air conditioning or ventilating system not designed to remove air pollutants from equipment; Routine housekeeping or plant upkeep activities such as painting buildings, re-tarring roofs, or
paving parking lots; A unit that has the potential to emit two tons or less per year of any criteria pollutant before the
application of control equipment. A unit may not be considered insignificant if a state or federal limit is applicable to the unit; and
A unit that has the potential to emit two tons or less per year of any hazardous air pollutant. However, the hazardous air pollutant emissions from the unit must be included in determining if the source is a major or minor source. A unit cannot be considered insignificant if a state or federal limit is applicable to the unit.
Potential insignificant activities associated with the Deer Creek project include diesel storage tanks for the emergency generator and fire water pump, as well as lubricating oil storage tanks associated with the CT/HRSG.
Deer Creek Station Air Quality Construction PSD Permit Application May 29, 2009 4. REGULATORY REVIEW
Regulatory Review Page 4-1
4.0 Introduction This section reviews air quality regulations governing the construction and operation of the Deer Creek Station. The following State and Federal air quality regulations were evaluated for applicability to the proposed project:
South Dakota Air Pollution Control Program – Administrative Rules of South Dakota Regulations Article 74:36
National Ambient Air Quality Standards New Source Review Permitting Requirements, including Prevention of Significant Deterioration
and Non-Attainment New Source Review New Source Performance Standards National Emission Standards for Hazardous Air Pollutants Federal Acid Rain Program (40 CFR Parts 72, 73, 74, 75, and 76) Compliance Assurance Monitoring (40 CFR Part 64)
4.1 Overview of Air Quality Regulations The Federal Clean Air Act, as amended (CAA), mandated U.S.EPA to establish national ambient air quality standards (NAAQS) for specific pollutants, and required each state to develop a state implementation plan (SIP) to attain and maintain the NAAQS within the state. EPA evaluates each states’ SIP, and, upon approval, publishes a notice of approval in the Federal Register which is then codified in the Code of Federal Regulations (CFR) at 40 CFR Part 52. The State of South Dakota has developed a SIP, and has been granted authorization to implement and enforce regulations governing the permitting and operation of air emission sources. (40 CFR Part 52 Subpart QQ). Federal regulations promulgated pursuant to the CAA are codified in Title 40 of the Code of Federal Regulations (40 CFR). The South Dakota air pollution control regulations are in Article 74:36 of the Administrative Rules of South Dakota (ARSD). Both Federal and South Dakota regulations require new major stationary sources of air pollution to undergo review and obtain a permit before commencing construction. In addition to the pre-construction permitting requirements, Federal and State regulations include new source performance standards (NSPS), national emission standards for hazardous air pollutants (NESHAPs), and standards governing the emission of pollutants that contribute to the formation of acid rain. A summary of the air emission standards applicable to the Deer Creek Station is provided below.

Deer Creek Station Air Quality Construction PSD Permit Application May 29, 2009 4. REGULATORY REVIEW
Regulatory Review Page 4-2
4.2 South Dakota Air Emission Standards The South Dakota air pollution control regulations are codified in ARSD Article 74:36 (Air Pollution Control Program). A summary of the applicable State regulations is provided below.
4.2.1 Chapter 74:36:01 – Definitions Chapter 74:36:01 of the South Dakota air pollution control program includes the definition of terms used throughout Article 74:36. 4.2.2 Chapter 74:36:02 – Ambient Air Quality The CAA mandated the U.S.EPA to establish NAAQS for certain criteria pollutants. Pursuant to this mandate, U.S.EPA established NAAQS for criteria pollutants including CO, NOx, SO2, PM10, PM2.5, ozone (regulated as volatile organic compounds), and lead. Geographic areas that meet the NAAQS for a given pollutant are classified as “attainment” areas, while those that do not meet the NAAQS are classified as “non-attainment” areas. Areas where there is insufficient monitoring data to determine whether the area has attained the NAAQS are designated as “unclassifiable,” however, these areas are treated as attainment areas for permitting purposes. U.S.EPA recently finalized revisions to the NAAQS for ozone and particulate matter. The existing 8-hour ozone NAAQS (0.08 ppm) was replaced with a more stringent 0.075 ppm 8-hour average standard. The primary particulate matter standard was revised to include two new standards for fine particles (generally referring to particles less than or equal to 2.5 micrometers (μm) in diameter, PM2.5), and a more stringent PM10 standard. EPA revised the level of the 24-hour PM2.5 standard from 65 μm/m3 to 35 μg/m3 and retained the level of the annual PM2.5 standard at 15 μg/m3. With regard to the PM10 standards, EPA retained the 24-hour PM10 NAAQS and revoked the annual PM10 standard. Chapter 74:36:02 incorporates, by reference, the ambient air quality standards listed in 40 CFR Part 50. The primary and secondary ambient air quality standards are summarized in Table 4-1.

Deer Creek Station Air Quality Construction PSD Permit Application May 29, 2009 4. REGULATORY REVIEW
Regulatory Review Page 4-3
Table 4-1 National Ambient Air Quality Standards
Primary Standards Secondary Standards Pollutant Level Averaging Time Level Averaging
Time 9 ppm
(10 mg/m3) 8-hour (1) Carbon
Monoxide 35 ppm
(40 mg/m3) 1-hour (1)
None
0.15 µg/m3 (2) Rolling 3-Month Average Same as Primary Lead 1.5 µg/m3 Quarterly Average Same as Primary
Nitrogen Dioxide
0.053 ppm (100 µg/m3)
Annual (Arithmetic Mean)
Same as Primary
Particulate Matter (PM10)
150 µg/m3 24-hour (3) Same as Primary
15.0 µg/m3 Annual (4) (Arithmetic Mean)
Same as Primary Particulate Matter (PM2.5)
35 µg/m3 24-hour (5) Same as Primary 0.075 ppm (2008 std) 8-hour (6) Same as Primary 0.08 ppm (1997 std) 8-hour (7) Same as Primary
Ozone
0.12 ppm 1-hour (8) (Applies only in limited areas)
Same as Primary
0.03 ppm Annual (Arithmetic Mean)
Sulfur Dioxide
0.14 ppm 24-hour (1)
0.5 ppm (1300 µg/m3)
3-hour (1)
(1) Not to be exceeded more than once per year. (2) Final rule signed October 15, 2008. (3) Not to be exceeded more than once per year on average over 3 years. (4) To attain this standard, the 3-year average of the weighted annual mean PM2.5 concentrations from single or
multiple community-oriented monitors must not exceed 15.0 µg/m3. (5) To attain this standard, the 3-year average of the 98th percentile of 24-hour concentrations at each population-
oriented monitor within an area must not exceed 35 µg/m3 (effective December 17, 2006). (6) To attain this standard, the 3-year average of the fourth-highest daily maximum 8-hour average ozone
concentrations measured at each monitor within an area over each year must not exceed 0.075 ppm. (effective May 27, 2008)
(7) (a) To attain this standard, the 3-year average of the fourth-highest daily maximum 8-hour average ozone concentrations measured at each monitor within an area over each year must not exceed 0.08 ppm. (b) The 1997 standard—and the implementation rules for that standard—will remain in place for implementation purposes as EPA undertakes rulemaking to address the transition from the 1997 ozone standard to the 2008 ozone standard.
(8) (a) The standard is attained when the expected number of days per calendar year with maximum hourly average concentrations above 0.12 ppm is < 1. (b) As of June 15, 2005 EPA revoked the 1-hour ozone standard in all areas except the 8-hour ozone nonattainment Early Action Compact (EAC) Areas.

Deer Creek Station Air Quality Construction PSD Permit Application May 29, 2009 4. REGULATORY REVIEW
Regulatory Review Page 4-4
In order to implement the NAAQS, each State was required to use air monitoring data to designate areas within the State that do not meet the standards, and provide this information as a recommendation to EPA for its non-attainment area designations. Shown in figures 4-1 thorough 4-3 are the designated nonattainment areas for SO2, 8-hour ozone, and PM2.5.
Figure 4-1
Counties Designated Nonattainment for the SO2 NAAQS

Deer Creek Station Air Quality Construction PSD Permit Application May 29, 2009 4. REGULATORY REVIEW
Regulatory Review Page 4-5
Figure 4-2 Counties Designated Nonattainment for the 8-hour Ozone NAAQS
Figure 4-1
Counties Designated Nonattainment for the PM2.5 NAAQS

Deer Creek Station Air Quality Construction PSD Permit Application May 29, 2009 4. REGULATORY REVIEW
Regulatory Review Page 4-6
The Deer Creek Station will be constructed in Brookings County South Dakota. Currently all counties in South Dakota are classified as attainment or unclassifiable for all ambient air quality standards. In addition to establishing the NAAQS, EPA also established Prevention of Significant (PSD) increment levels. A PSD increment is the maximum allowable increase in concentration that is allowed to occur above a baseline concentration for a given criteria pollutant. The baseline concentration is defined for each pollutant and, in general, is the ambient concentration existing at the time that the first complete PSD permit application affecting the area was submitted. PSD increments are applicable to units located within attainment areas, and are designed to prevent the air quality in the attainment area from deteriorating to a level set by the NAAQS. The PSD allowable increments are summarized in Table 4-2.
Table 4-2
Allowable PSD Increments and Significant Impact Levels (μg/m3)
PSD Increments Significant Impact Levels
Pollutant Averaging Time
Class I Class II Class II Annual Arithmetic Mean
4 17 1 PM10
24-hour Maximum 8 30 5 Annual Arithmetic Mean
2 20 1
24-hour Maximum 5 91 5
SO2
3-hour Maximum 25 512 25 8-hour Maximum NA NA 500 CO 1-hour Maximum NA NA 2,000
NOx Annual Arithmetic Mean
2.5 25 1
NA = Not applicable – no standard exists for this pollutant and averaging time. Source: 40 CFR 52.21, 40 CFR 51.165
4.2.3 Chapter 74:36:03 – Air Quality Episodes Chapter 74:36:03 incorporates by reference regulations included in 40 CFR 50.151 and 50.152, requiring the DENR to develop and maintain an episode emergency contingency plan, and use the criteria in 40 CFR 51.151 and Appendix L to Part 51, to proclaim an air pollution emergency episode if the accumulation of air pollutants in any place is attaining or has attained levels which could, if such levels are sustained or exceeded, lead to a substantial threat to the health of the public.

Deer Creek Station Air Quality Construction PSD Permit Application May 29, 2009 4. REGULATORY REVIEW
Regulatory Review Page 4-7
4.2.4 Chapter 74:36:04 - Operating Permits for Minor Sources Regulations in Chapter 74:36:04 state that “[a] person may not construct, install, modify, or operate any source or unit likely to cause the emission of air pollutants into the ambient air or any equipment which prevents or controls the emission of air pollutants into the ambient air until the applicable preconstruction permit or operating permit has been issued by the board or the secretary.” The provisions in Chapter 74:36:04 apply to minor emission sources. The term “minor source” is defined in Chapter 74:36:01 as “a source whose potential emissions of a criteria pollutant are less than 100 tons a year and which does not meet the definition of a Part 70 source.” As discussed below, the Dry Creek Station will meet the definition of a Part 70 source; therefore, the minor source permitting requirements in Chapter 74:36:04 are not applicable to this project. 4.2.5 Chapter 74:36:05 - Operating Permits for Part 70 Sources Regulations in Chapter 74:36:05.02 state that “[a] person may not construct, install, modify, revise, or operate any source or unit likely to cause the emission of air pollutants into the ambient air or any equipment which prevents or controls the emission of air pollutants into the ambient air until the applicable preconstruction permit or Part 70 operating permit has been issued by the board or the secretary.” The provisions in Chapter 74:36:05 apply to all sources required to obtain a Part 70 operating permit. Sources required to obtain a Part 70 operating permit include:
1) Any major source; 2) Any source, including an area source, subject to a standard or regulation promulgated under
§111 of the Clean Air Act; 3) Any source, including an area source, subject to a standard or regulation promulgated under
§112 of the Clean Air Act, except for a source that is solely subject to the regulations or requirements of §112(r);
4) Any affected source subject to Title IV of the Clean Air Act; and 5) Any source in a source category designated by the administrator of the EPA through the
Clean Air Act pursuant to Title V of the Clean Air Act. As discussed below (subsection 4.2.9), the Deer Creek Station meets the definition of a major source. Therefore, the facility will be subject to the Chapter 74:36:05 Operating Permit requirements. Provisions in 74:36:05:03.01 state that “[t]he submittal of a complete application for an operating
Deer Creek Station Air Quality Construction PSD Permit Application May 29, 2009 4. REGULATORY REVIEW
Regulatory Review Page 4-8
permit for a Part 70 source does not affect the requirement that a source have a PSD or NSR preconstruction permit as required under §110, 165, 172, or 173 of the Clean Air Act or chapters 74:36:09 and 74:36:10. A PSD or NSR source must submit a complete application for a Part 70 operating permit within 12 months after commencing operation.” The Deer Creek Station will be subject to the PSD permitting requirements in chapter 74:36:09 (see, subsection 4.2.9), and will be required to obtain a PSD air construction permit prior to commencing construction of the facility. This permit application is the facility’s PSD air construction permit application. In accordance with the requirements in Chapter 74:36:05:03.01, the facility will be required to submit a Part 70 operating permit application within 12 months after commencing operation. 4.2.6 Chapter 74:36:06 - Regulated Air Pollutant Emissions The provisions in Chapter 74:36:06:01 state that “any unit required to be permitted under [Article 74:36] must comply with the standards and requirements in this chapter except as otherwise specified in chapter 74:36:07, 74:36:09, 74:36:09, 74:36:10, or 74:36:16.” The Deer Creek Station will be required to be permitted under Article 74:36:09 (Prevention of Significant Deterioration) and will be subject to the emission standards in Chapter 74:36:06. Emission standards in Chapter 74:36:06 are summarized below:
4.2.6.1 Subchapter 74:36:06:02 – Allowable Emissions for Fuel-Burning Units Subchapter 74:36:06:02 includes the following emission limits applicable to the owner/operator of a fuel-burning unit. The term “fuel-burning unit” is defined in chapter 74:36:01 to include “a furnace, boiler, apparatus, stack, or any of their components used in the process of burning fuel or other combustible material for the primary purposes of producing heat or power by indirect heat transfer.” Based on the definition of “fuel-burning unit” these emission standards apply to the combustion turbine, duct burners, emergency diesel generator, fire-water pump, and emergency inlet air heater at the Deer Creek Station.
Particulate Matter: (a) A fuel-burning unit with a heat input values less than 10 mmBtu/hr may not exceed 0.6 pounds of particulate matter per million Btu heat input.

Deer Creek Station Air Quality Construction PSD Permit Application May 29, 2009 4. REGULATORY REVIEW
Regulatory Review Page 4-9
(b) A fuel-burning unit with a heat input equal to or greater than 10 mmBtu/hr may not exceed the particulate emissions rate determined by the following equation:
E = 0.811H-0.131, where E = allowable particulate emissions rate in lb/mmBtu heat input; and H = heat input in mmBtu/hr
A comparison of the particulate emission standards to the proposed Deer Creek emission limits is provided in Table 4-3. All of the proposed emission sources will meet the applicable 74:36:06:02 particulate emission limit.
Table 4-3
Summary of Applicable South Dakota Particulate Emission Limitations Case Maximum Design
Heat Input (mmBtu/hr)
Applicable PM Emission Limit
(lb/mmBtu)
Calculated PM Emission Limit
(lb/mmBtu) Fire-Water Pump 4.45 0.60 0.043 Emergency Diesel Generator 22.5 0.54 0.043 Emergency Inlet Air Heater 25.0 0.53 0.0076 CT/HRSG 2044.4 0.30 0.011
Provision 74:36:06:02(2) states that “[a] fuel-burning unit may not emit sulfur dioxide emissions to the ambient air in an amount greater than three pounds of sulfur dioxide per million Btu heat input to the unit based on a three-hour rolling average, which is the arithmetic average of three contiguous one-our periods.” Because of the low sulfur content of natural gas and diesel fuel, SO2 emissions from the fuel-burning units at the Deer Creek Station will be significantly below the 3.0 lb/mmBtu standard.
4.2.7 Chapter 74:36:07 – New Source Performance Standards Chapter 74:36:07 establishes state standards for certain new or modified facilities in accordance with the authority delegated by the EPA under Section 111(b) of the Federal CAA. In general, Federal New Source Performance Standards (NSPS) applicable to emission sources at the Deer Creek Station have been incorporated into the State regulations by reference. Federal new source performance standards applicable to emission sources at Deer Creek are reviewed in Section 4.3.
Deer Creek Station Air Quality Construction PSD Permit Application May 29, 2009 4. REGULATORY REVIEW
Regulatory Review Page 4-10
4.2.8 Chapter 74:36:08 – National Emissions Standards for Hazardous Air Pollutants Chapter 74:36:08 establishes state standards for the emission of hazardous air pollutants (HAPs) from specific emission source categories in accordance with the authority delegated by EPA under Section 112 of the CAA. In general, Federal national emission standards for HAPs applicable to emission sources at the Deer Creek Station have been incorporated into the state regulations by reference. Federal HAP emission standards applicable to emission sources at Deer Cree are reviewed in Section 4.4. 4.2.9 Chapter 74:36:09 – Prevention of Significant Deterioration Chapter 74:36:09 applies to all areas of the state which are designated attainment or unclassifiable for the NAAQS. Chapter 74:36:09 requires any new major source or major modification to an existing major stationary source located in an attainment or unclassified area to obtain a Prevention of Significant Deterioration (PSD) permit prior to beginning actual construction. In general, the federal PSD regulations in 40 CFR 52.21 have been incorporated into the state regulations by reference. The proposed Deer Creek Station will be located in Brookings County. Brookings County has been designated as an attainment (or unclassifiable) area for all NAAQS. Therefore, the Deer Creek Station will be subject to the PSD standards if the proposed facility meets the definition of a major stationary source. A source is considered a major source if it is one of the 28 named PSD source categories listed in Section 169 of the federal Clean Air Act, and has the potential to emit 100 tons per year (tpy) or more of any regulated pollutant. The major source threshold for all other sources (i.e., not included in one of the 28 named source categories) is 250 tpy of any regulated pollutant. Fossil fuel-fired steam electric plants of more than 250 mmBtu/hr heat input are included as one of the 28 named PSD source categories. Although combustion turbines are not included within this source category (as they are not considered steam electric plants), fossil-fuel combustion in the HRSG meets the definition of steam electric plant. Maximum heat input to the Deer Creek duct burners will be greater than 250 mmBtu/hr; therefore, the Deer Creek Station falls into one of the 28 named PSD source categories and will be considered a major source if it has the potential to emit greater than 100 tpy of any regulated pollutant. Based on emission calculations summarized in Section 3, the Deer Creek Station has the potential to emit greater than 100 tpy of NOx and CO. Therefore, the Station meets the definition of a major source.

Deer Creek Station Air Quality Construction PSD Permit Application May 29, 2009 4. REGULATORY REVIEW
Regulatory Review Page 4-11
Once a source is considered major, all regulated air pollutants emitted at a rate above the “significant” rate are subject to PSD review. The PSD significant emission rates are included in 40 CFR 52.21(b)(23) a, and are summarized Table 4-4 along with potential emissions from the Deer Creek Station. Based on emission calculations, the Deer Creek Station will be subject to PSD review for CO, NOx, and PM (including PM10 and PM2.5).
Table 4-4 Comparison of PSD Significant Levels and Expected Annual Emissions
NSR Regulated Pollutants
PSD Significant
Level
Deer Creek Station Potential-
to-Emit (PTE)
Does PTE Exceed the Significant
Level? (tpy) (tpy) (Yes / No) Carbon Monoxide 100 256.0 Yes Nitrogen Oxides 40 119.1 Yes Sulfur Dioxide 40 11.7 No PM (total) 25 80.1 Yes PM10 (total) 15 80.1 Yes PM2.5 (total) 10 80.1 Yes Ozone (VOC) 40 29.7 No Lead 0.6 3.60 x 10⁻⁴ No Sulfuric Acid Mist 7 2.21 No
The Federal PSD regulations were recently amended to add PM2.5 as a regulated pollutant. On May 16, 2008, U.S.EPA published it final regulations implementing the NSR program for PM2.5 (73 FR 28321, May 16, 2008). The final rule included the major source threshold and significant emissions rate for PM2.5, as well as offset ratios for PM2.5 inter-pollutant trading and applicability of NSR to PM2.5 precursors (including SO2 and NOx). The final rule established a significant emissions level of 10 tpy for direct PM2.5 emissions, and a significant emissions level of 40 tpy for SO2 (as a PM2.5 precursor) and NOx (as a PM2.5 precursor – if regulated). The May 16, 2008 rule also describes the process states should follow to implement the new PM2.5 NSR rules, and how PM emissions should be permitted during the transition period. States with SIP-approved PSD programs (such as South Dakota) must amend their SIPs to incorporate federal rule changes, and need time to accomplish these SIP amendments. Accordingly, the final rule requires states with SIP-approved PSD programs to submit revised PSD programs for PM2.5 by May 2011
Deer Creek Station Air Quality Construction PSD Permit Application May 29, 2009 4. REGULATORY REVIEW
Regulatory Review Page 4-12
(within 3-years of publication of the final rule). During the transition period, states may continue to implement a PM10 program as a surrogate to meet the PSD program requirements for PM2.5. The PSD regulations require the applicant to control regulated emissions using the Best Available Control Technology (BACT), conduct impact modeling to demonstrate that emissions from the proposed source will not cause or contribute to a violation of the NAAQS or exceed the PSD increment, and comply with the public participation requirements in 74:36:09:03. A complete BACT analysis for NOx, CO, and PM is included in Appendix C, and a summary of the BACT results is included in Section 5.0. As discussed above, for the combustion of natural gas it was assumed that all of the PM emitted would have an aerodynamic diameter less than 2.5 microns (see, e.g., AP-42 Table 1.4-2). Therefore, PM, PM10, and PM2.5 emissions from the CT/HRSG are assumed to be the same, and the evaluation of BACT control technologies is applicable to all three categories of PM emissions. Results of the air quality impact modeling are summarized in Section 7 of this permit application. Detailed impact modeling, including a description of the methodology used to conduct the impact modeling is included in Appendix D. In accordance with the May 16, 2008 NSR implementation rule, PM10 emissions were used as a surrogate for PM2.5 to demonstrate that emissions from the proposed facility will not exceed the applicable significant impact level (SIL) or PSD increment, and to demonstrate compliance with the PM10 and PM2.5 NAAQS. 4.2.10 Chapter 74:36:10 – New Source Review The regulations included in Chapter 74:36:10 apply to areas of the state which are designated as non-attainment pursuant to §107 of the Clean Air Act. As discussed above, the Deer Creek Station will be located in Brookings County, which has been designated as attainment (or unclassifiable) for all NSR regulated pollutants. Therefore, the provisions of Chapter 74:36:10 are not applicable to the Deer Creek Station. 4.2.11 Chapter 74:36:11 – Performance Testing Section 74:36:11:01 requires all stack performance tests to be made in accordance with the applicable test method specified in 40 CFR §60.17; Part 60 Appendix A; §63.14; Part 63 Appendix A; and Part 51, Appendix M (all July 1, 2005). Section 74:36:11:02 states that the secretary may require a performance test of emissions, including stack sampling, for air pollutants from any source to determine compliance with regulated pollutant emission standards. To ensure compliance with this
Deer Creek Station Air Quality Construction PSD Permit Application May 29, 2009 4. REGULATORY REVIEW
Regulatory Review Page 4-13
Chapter, BEPC has proposed compliance tests that will demonstrate compliance with the proposed emission limits and averaging times, and BEPC has proposed to use U.S.EPA approved test methods. 4.2.12 Chapter 74:36:12 – Control of Visible Emissions Section 74:36:12:01 restricts the discharge into the ambient air from a single unit of emissions any air pollutant of a density equal to or greater than that designated as 20% opacity, as established by U.S. EPA Method 9. Where applicable, BEPC has proposed opacity limits that are in compliance with the requirements of Chapter 74:36:12. 4.2.13 Chapter 74:36:13 – Continuous Emission Monitoring Systems Section 74:36:13:01 states that the secretary may require major stationary air pollution sources to install, calibrate, operate, and maintain equipment approved by the department for the continuous monitoring and recording of emission data to determine compliance with a regulated air pollutant standard. BEPC has proposed continuous emissions monitoring systems (CEMS) to measure NOx and CO emissions from the CT/HRSG. 4.2.14 Chapter 74:36:14 – Variances (Repealed, 23 SDR 106, effective December 29, 1996) 4.2.15 Chapter 74:36:15 – Open Burning Air pollution control regulations in Chapter 74:36:15 have been transferred to other sections or have been repealed, and will impose no additional limitations on the Deer Creek facility. 4.2.16 Chapter 74:36:16 – Acid Rain Program In general, Chapter 74:36:16 incorporates the Federal Acid Rain Program into the state regulations by reference. Pursuant to Title IV of the 1990 CAA Amendments, U.S.EPA established a program to control pollution emissions that contribute to the formation of acid rain. The acid rain regulations, codified under 40 CFR Parts 72, 75 and 76 are applicable to “affected units” as defined in the regulations. A summary of the applicable Acid Rain Program regulations is provided in Section 4.5. 4.2.17 Chapter 74:36:17 – Rapid City Street Sanding and Deicing The provisions of Chapter 74:36:17 are not applicable to the Deer Creek Station.

Deer Creek Station Air Quality Construction PSD Permit Application May 29, 2009 4. REGULATORY REVIEW
Regulatory Review Page 4-14
4.2.18 Chapter 74:36:18 – Regulations for State Facilities in the Rapid City Area The provisions of Chapter 74:36:18 are not applicable to the Deer Creek Station. 4.2.19 Chapter 74:36:19 – Mercury Budget Trading Program In general, Chapter 74:36:19 incorporated, by reference, the federal mercury budget trading program. The federal mercury budget trading program was applicable to coal-fired boilers serving a generator with a nameplate capacity greater than 25 MW producing electricity for sale (40 CFR 4104(a)). Subsequently, the U.S. Court of Appeals for the District of Columbia Circuit vacated the federal mercury budget trading program. Therefore, the provisions of Chapter 74:36:19 are not applicable to the Deer Creek Station.
4.3 New Source Performance Standards (NSPS) The U.S.EPA has established NSPS for many kinds of industrial facilities and processes. As described above, federal NSPS standards have been incorporated into Chapter 74:36:07 of the South Dakota Air Pollution Control Program. NSPS regulations that may be applicable to the Deer Creek Station include:
40 CFR Part 60 Subpart A General Provisions 40 CFR Part 60 Subpart KKKK Stationary Combustion Turbines 40 CFR Part 60 Subpart IIII Standards of Performance for Stationary Compression Ignition
Internal Combustion Engines The applicable NSPS requirements are summarized below:
4.3.1 40 CFR Part 60 Subpart A: General Provisions The general provisions included in Subpart A are applicable to any source subject to a source-specific NSPS. Unless specifically excluded by the source-specific NSPS, Subpart A requires, among other things: (1) notification of the date construction is commenced; (2) notification of the actual date of initial startup; (3) initial performance tests within specified time frames; (4) notification of any performance test dates; (5) general monitoring requirements; and (6) general record keeping requirements. As described in subsection 4.3.2, the Deer Creek CT/HRSG will be subject to the
Deer Creek Station Air Quality Construction PSD Permit Application May 29, 2009 4. REGULATORY REVIEW
Regulatory Review Page 4-15
combustion turbine NSPS; therefore, the facility will be subject to the Subpart A general provisions summarized above. 4.3.2 40 CFR Part 60 Subpart KKKK: Combustion Turbines On July 6, 2006, U.S.EPA published a final rule promulgating standards of performance for new stationary gas turbines in 40 CFR part 60, subpart KKKK. The updated standards reflect changes in the NOx emission control technologies and turbine design since standards for these units were originally promulgated in 40 CFR part 60, subpart GG. The subpart KKKK standards of performance (40 CFR §§60.4300 to 60.4420, inclusive) have been incorporated into South Dakota air quality regulations at Chapter 74:36:07:89. The subpart KKKK NSPS applies to stationary combustion turbines with a heat input at peak load equal to or greater than 10.7 GJ (10 mmBtu) per hour that commence construction, modification, or reconstruction after February 18, 2005. A stationary combustion turbine is defined as all equipment, including but not limited to the combustion turbine, the fuel, air, lubrication and exhaust gas systems, control systems (except emissions control equipment), heat recovery system, and any ancillary components and sub-components comprising any simple cycle stationary combustion turbine, and regenerative/recuperative cycle stationary combustion turbine, any combined-cycle combustion turbine, and any combined heat and power combustion turbine based system. The applicability in subpart KKKK is similar to that of 40 CFR Part 60, subpart GG, except that the subpart KKKK rules apply to new, modified, and reconstructed stationary combustion turbines, and their associated heat recovery steam generators (HRSG) and duct burners. The stationary combustion turbines subject to subpart KKKK are exempt from the requirements of NSPS requirements in 40 CFR Part 60, subpart GG. Heat recovery steam generators and duct burners subject to subpart KKKK are exempt from the NSPS requirements of 40 CFR Part 60, subparts Da, Db, and Dc (applicable to boilers). Subpart KKKK includes emission standards for NOx and SO2. The applicable subpart KKKK emission standards are summarized in Table 4-5.

Deer Creek Station Air Quality Construction PSD Permit Application May 29, 2009 4. REGULATORY REVIEW
Regulatory Review Page 4-16
Table 4-5 40 CFR Part 60 Subpart KKKK New Source Performance Standards
Pollutant
Standard
Compliance Monitoring
NOx
New, modified, or reconstructed turbine firing natural gas with a combustion turbine heat input at peak load >850 mmBtu/hr (HHV)
15 ppm @ 15% O2 or 54 ng/J of useful output (0.43 lb/MWh)
SO2 110 ng/J (0.90 lb/MWh gross output), or
must not burn any fuel which contains total potential sulfur emissions in excess of 26 ng SO2/J (0.060 lb SO2/mmBtu) heat input
Based on emission calculations summarized in Section 3.0, NOx and SO2 emissions from the Deer Creek CT/HRSG will meet the applicable subpart KKKK NSPS requirements. In addition, to the NSPS emission standards, subpart KKKK requires initial performance tests be conducted to demonstrate compliance with the emission standards, as well as emissions monitoring, record keeping and reporting requirements. 4.3.3 40 CFR Part 60 Subpart IIII: Stationary Compression Ignition Internal Combustion
Engines On July 11, 2006, U.S.EPA published new source performance standards for stationary compression ignition (CI) internal combustion engines (ICE) (71 FR 39154). The CI ICE NSPS standards of performance (40 CFR Part 60 subpart IIII) have been incorporated into South Dakota air quality regulations at Chapter 74:36:07:88. The CI ICE NSPS limits emissions of NOx, PM, SO2, CO, and hydrocarbons (HC) from stationary diesel internal combustion engines. Provisions of the CI ICE NSPS apply to manufacturers, owners, and operators of stationary CI internal combustion engines. In general, BEPC will be required to purchase engines certified by the manufacturer to meet the applicable emissions levels. CI engines include internal combustion engines that are not spark ignition engines, including diesel engines. Both the emergency diesel generator and fire-water pump proposed for the Deer Creek Station are classified as stationary CI engines subject to the provisions of the CI ICE NSPS. Emissions standards established in the rule depend on the engine’s horsepower class and mode of operation (e.g., continuous operation or emergency operation). Specific definitions applicable to the Deer Creek diesel engines include “emergency stationary internal combustion engine” and “fire pump engine”. The Deer Creek emergency diesel generator and fire water pump are both classified as
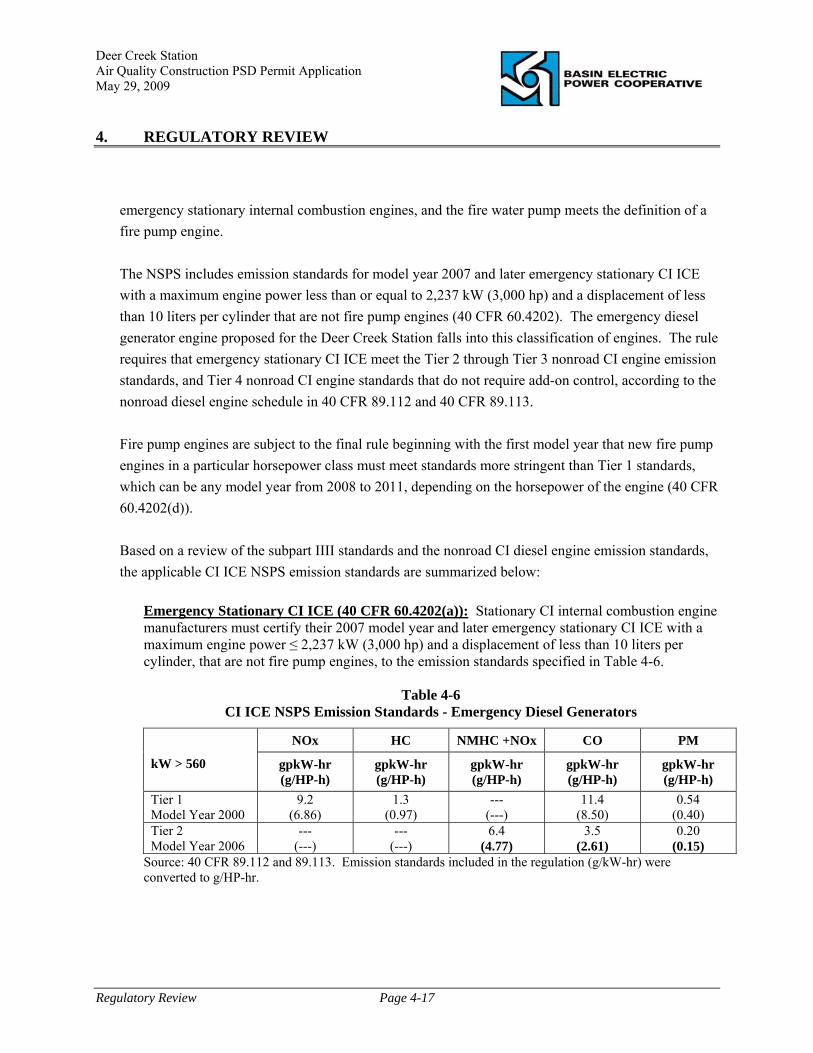
Deer Creek Station Air Quality Construction PSD Permit Application May 29, 2009 4. REGULATORY REVIEW
Regulatory Review Page 4-17
emergency stationary internal combustion engines, and the fire water pump meets the definition of a fire pump engine. The NSPS includes emission standards for model year 2007 and later emergency stationary CI ICE with a maximum engine power less than or equal to 2,237 kW (3,000 hp) and a displacement of less than 10 liters per cylinder that are not fire pump engines (40 CFR 60.4202). The emergency diesel generator engine proposed for the Deer Creek Station falls into this classification of engines. The rule requires that emergency stationary CI ICE meet the Tier 2 through Tier 3 nonroad CI engine emission standards, and Tier 4 nonroad CI engine standards that do not require add-on control, according to the nonroad diesel engine schedule in 40 CFR 89.112 and 40 CFR 89.113. Fire pump engines are subject to the final rule beginning with the first model year that new fire pump engines in a particular horsepower class must meet standards more stringent than Tier 1 standards, which can be any model year from 2008 to 2011, depending on the horsepower of the engine (40 CFR 60.4202(d)). Based on a review of the subpart IIII standards and the nonroad CI diesel engine emission standards, the applicable CI ICE NSPS emission standards are summarized below:
Emergency Stationary CI ICE (40 CFR 60.4202(a)): Stationary CI internal combustion engine manufacturers must certify their 2007 model year and later emergency stationary CI ICE with a maximum engine power ≤ 2,237 kW (3,000 hp) and a displacement of less than 10 liters per cylinder, that are not fire pump engines, to the emission standards specified in Table 4-6.
Table 4-6 CI ICE NSPS Emission Standards - Emergency Diesel Generators
NOx HC NMHC +NOx CO PM
kW > 560 gpkW-hr (g/HP-h)
gpkW-hr (g/HP-h)
gpkW-hr (g/HP-h)
gpkW-hr (g/HP-h)
gpkW-hr (g/HP-h)
Tier 1 Model Year 2000
9.2 (6.86)
1.3 (0.97)
--- (---)
11.4 (8.50)
0.54 (0.40)
Tier 2 Model Year 2006
--- (---)
--- (---)
6.4 (4.77)
3.5 (2.61)
0.20 (0.15)
Source: 40 CFR 89.112 and 89.113. Emission standards included in the regulation (g/kW-hr) were converted to g/HP-hr.

Deer Creek Station Air Quality Construction PSD Permit Application May 29, 2009 4. REGULATORY REVIEW
Regulatory Review Page 4-18
Stationary Fire Pump Engines (40 CFR 60.4202(d)): Fire pump engines are subject to the final rule beginning with the first model year that new fire pump engines in a particular horsepower class must meet standards more stringent than Tier 1 standards, which can be any model year from 2008 to 2011, depending on the horsepower of the engine. A summary of the applicable emission standards is provided in Table 4-7
Table 4-7 CI ICE NSPS Emission Standards - Fire Water Pump Engines
NMHC +NOx CO PM Maximum Engine Power
Model Year g/kW-h g/HP-h
g/kW-h g/HP-h
g/kW-h g/HP-h
2008 and earlier 10.5 (7.8)
3.5 (2.6)
0.54 (0.40) 175 ≤ HP < 300
2009+ (Note 1) 4.0 (3.0)
3.5 (2.6)
0.20 (0.15)
2008 and earlier 10.5 (7.8)
3.5 (2.6)
0.54 (0.40) 300 ≤ HP < 600
2009+ (Note 1) 4.0 (3.0)
3.5 (2.6)
0.20 (0.15)
Source: Table 4 to Subpart IIII of Part 60 – Emission Standards for Stationary Fire Pump Engines. Note: In model years 2009–11, manufacturers of fire pump stationary CI ICE in this engine power category with a rated speed of greater than 2,650 rpm may comply with the emission limitations for 2008 model year engines.
To ensure compliance with the applicable CI ICE NSPS emission standards, BEPC will be required to purchase engines certified by the manufacturer to meet the applicable emissions levels.
4.4 National Emission Standards for Hazardous Air Pollutants (NESHAPS) Section 112 of the CAA requires EPA to list categories and subcategories of major sources of hazardous air pollutants (HAPs), and to establish national emission standards for hazardous air pollutants (NESHAPs) for each source category. The NESHAP regulations, codified under 40 CFR Parts 61 and 63 and incorporated in to the South Dakota Air Pollution Control Program at Chapter 74:36:08, are designed to regulate specific categories of stationary sources with the potential to emit one or more hazardous air pollutant. Applicability of the rules regulating HAP emissions from source categories are limited to emission sources located at major source of HAP emissions. A major source of HAP emissions is a plant site that emits or has the potential to emit any single HAP at a rate of 10 tpy or more, or any combination of HAP at a rate of 25 tpy or more.
Deer Creek Station Air Quality Construction PSD Permit Application May 29, 2009 4. REGULATORY REVIEW
Regulatory Review Page 4-19
Based on emission calculations summarized in section 3.5 (and detailed in Appendix C), potential HAP emissions from all sources at the Deer Creek Station will be less than 25 tpy (7.67 tpy, see Table 3-18). Formaldehyde is the individual HAP constituent that will be emitted in the greatest quantity. Based on emission calculations, potential formaldehyde emissions from all emission sources will be 4.51 tpy (see, Table 3-16, and Appendix B). Because the facility does not have the potential to emit any single HAP at a rate greater than 10 tpy, or any combination of HAP at a rate of 25 tpy or more, the Deer Creek Station does not meet the definition of a major source of HAP emissions. Therefore, potentially applicable NESHAP standards do not apply to emission sources at the Deer Creek Station. 4.5 Acid Rain Program Pursuant to Title IV of the 1990 CAA Amendments, U.S.EPA established a program to control pollution emissions that contribute to the formation of acid rain. The Federal Acid Rain Program has been incorporated into the South Dakota Air Pollution Control Program at Chapter 75:36:16. The acid rain regulations, codified under 40 CFR Parts 72, 75 and 76 are applicable to “affected units” as defined in the regulations. As a “new utility unit,” the Deer Creek CT/HRSG meets the definition of an affected unit under 40 CFR 72.6(a)(3), and is therefore subject to the Acid Rain Program. Owners or operators of an affected unit are subject to the following Acid Rain Program requirements:
Acid Rain Permit Application; SO2 emission allowances; NOx emission limitations; Acid Rain Compliance Plan; and Emission monitoring requirements.
For new units, an Acid Rain Permit application must be submitted at least 24 months before the date of initial operation of the unit. The application must demonstrate compliance with the Acid Rain Program requirements and include a complete compliance and monitoring plan. 4.6 Compliance Assurance Monitoring The Compliance Assurance Monitoring (CAM) Rule (40 CFR Part 64) applies to pollutant-specific emissions units meeting the following criteria:
Deer Creek Station Air Quality Construction PSD Permit Application May 29, 2009 4. REGULATORY REVIEW
Regulatory Review Page 4-20
the unit is subject to an emissions limitation or standard for the pollutant of concern; an “active” control device is used to achieve compliance with the emission limit; and the emission unit’s pre-control potential-to-emit is greater than the applicable major source
threshold. Compliance assurance monitoring is applicable to permit applications received on or after April 20, 1998, from major sources applying for a Title V air quality permit. The CAM rule does not apply to emission units or pollutants subject to a Section 111 NSPS or Section 112 NESHAP issued after November 15, 1990, the Acid Rain Program, or emissions trading programs. In addition, the CAM rules do not apply to inherent process equipment that does not meet the definition of an emission control device under the rule. Emissions from sources at the Deer Creek Station, including the CT/HRSG, emergency diesel generator, and fire-water pump are subject an NSPS, NESHAP, or the Acid Rain Program monitoring requirements, and therefore exempt from the CAM standards. Therefore, the Deer Creek Station is not required to conduct a compliance assurance monitoring review or implement a CAM plan for these sources. CAM applicability for emission sources at the facility will be re-evaluated, and a CAM plan meeting the requirements of 40 CFR Part 64 will be developed for submittal (if needed) with the facility’s Title V operating permit application.

Deer Creek Station Air Quality Construction PSD Permit Application May 29, 2009 5. BEST AVAILABLE CONTROL TECHNOLOGY
Best Available Control Technology Page 5-1
5.0 Introduction The Deer Creek Station will be classified as a new major source of emissions. Deer Creek emission sources are subject to BACT review for each pollutant emitted in quantities greater than the significant level defined in 40 CFR 52.21(b)(23) (see, Table 4-4). Based on potential-to-emit emission calculations summarized in Section 3.0, the Deer Creek Station is subject to BACT review for the following NSR-PSD pollutants:
Nitrogen Oxides (NOx) Carbon Monoxide (CO) Particulate Matter (including PM, PM10 and PM2.5)
Based on emission calculations, SO2, VOC, sulfuric acid mist, and lead emissions from the Deer Creek Station will be below the applicable PSD significant levels. Therefore, emissions of these PSD pollutants are not subject to BACT review. Other pollutants for which PSD significance levels are established, including fluorides, asbestos, vinyl chloride, H2S, and total reduced sulfur (TRS) are not expected to be emitted from sources at Deer Creek. This section summarizes the results of the Deer Creek Station BACT analysis, including the proposed emission controls and emission limits. The complete BACT analysis is included in Appendix C. 5.1 Definition of BACT The requirements to conduct a BACT analysis are set forth in Chapter 74:36:09 of the South Air Pollution Control Program, and 40 CFR 52.21. BACT is defined in 40 CFR 52.21(b)(12) as:
…an emissions limitation (including a visible emission standard) based on the maximum degree of reduction for each pollutant subject to regulation under [the CAA] which would be emitted from any proposed major stationary source or major modification which the [secretary], on a case-by-case basis, taking into account energy, environmental, and economic impacts and other costs, determines is achievable for such source or modification through application of production processes or available methods, systems, and techniques, including fuel cleaning or treatment or innovative fuel combustion techniques for control of such pollutant….”
According to U.S.EPA policy, BACT should be determined using the "top-down" approach, whereby the applicant is responsible for identifying and ranking, according to control effectiveness, all technically feasible control options for each pollutant subject to BACT. If it can be shown that the most stringent alternative is unrepresentative of BACT based on energy, environmental, or economic impacts, this alternative may be
Deer Creek Station Air Quality Construction PSD Permit Application May 29, 2009 5. BEST AVAILABLE CONTROL TECHNOLOGY
Best Available Control Technology Page 5-2
rejected and the next most stringent alternative is considered. This process continues until the alternative under consideration cannot be rejected by any substantial or unique technical, economic, energy or adverse environmental objection. 5.2 Summary of CT/HRSG BACT Analysis Based on the detailed BACT analysis included in Appendix C of this permit application, a combination of combustion controls and post-combustion emission control systems is being proposed as BACT for the Deer Creek CT/HRSG. BEPC is proposing selective catalytic reduction (SCR) in combination with low-NOx combustion controls as BACT for NOx control, and a controlled NOx emission limit of 3.5 ppmvd @ 15% O2 (30-day rolling average). A controlled NOx emission rate of 3.5 ppmvd @ 15% O2 (30-day average) represents the most aggressive NOx emission rate achievable on an on-going long-term basis without significant collateral environmental impacts associated with SCR control. SCR has been approved as BACT for natural gas-fired combined cycle units, and an emission rate of 3.5 ppmvd @ 15% O2 is consistent with the BACT emission limit established for other similarly sized combined cycle units. Combustion controls represent BACT for CO control. BEPC is proposing to meet a CO BACT emission limit of 9.0 ppmvd without duct firing and 18.3 ppmvd when duct firing (30-day rolling average). CO emissions will be somewhat higher when duct firing due to the higher CO emission rate associated with the duct burners. Post-combustion CO controls were determined not to be economically feasible for the Deer Creek Station. Based on the BACT economic impact analysis (Appendix C, Section 4.4.1), the average annual cost effectiveness of an oxidation catalyst control system was calculate to be $3,324/ton. Equipment costs, energy costs, and annual operating costs (e.g., routine catalyst replacement) all have a significant impact on the cost of an oxidation catalyst control system. Total annual costs associated with the oxidation catalyst system, including capital recovery and annual O&M, are estimated to be in the range of $479,300/year. The cost effectiveness of an oxidation catalyst system at the Deer Creek Station is significant, and should preclude the control system from consideration as BACT. BEPC is proposing natural gas-firing and combustion controls as BACT for PM (including PM10 and PM2.5). Based on information available from combustion turbine and duct burner vendors, BEPC is proposing a total PM BACT emission limit of 0.011 lb/mmBtu (18.6 lb/hr without duct firing and 23.2 lb/hr when duct firing). This emission rate includes both filterable and condensible PM emissions. No potentially feasible and applicable post-combustion PM control systems were identified. The proposed CT/HRSG BACT emission limits and control technologies are summarized in Table 5-1.
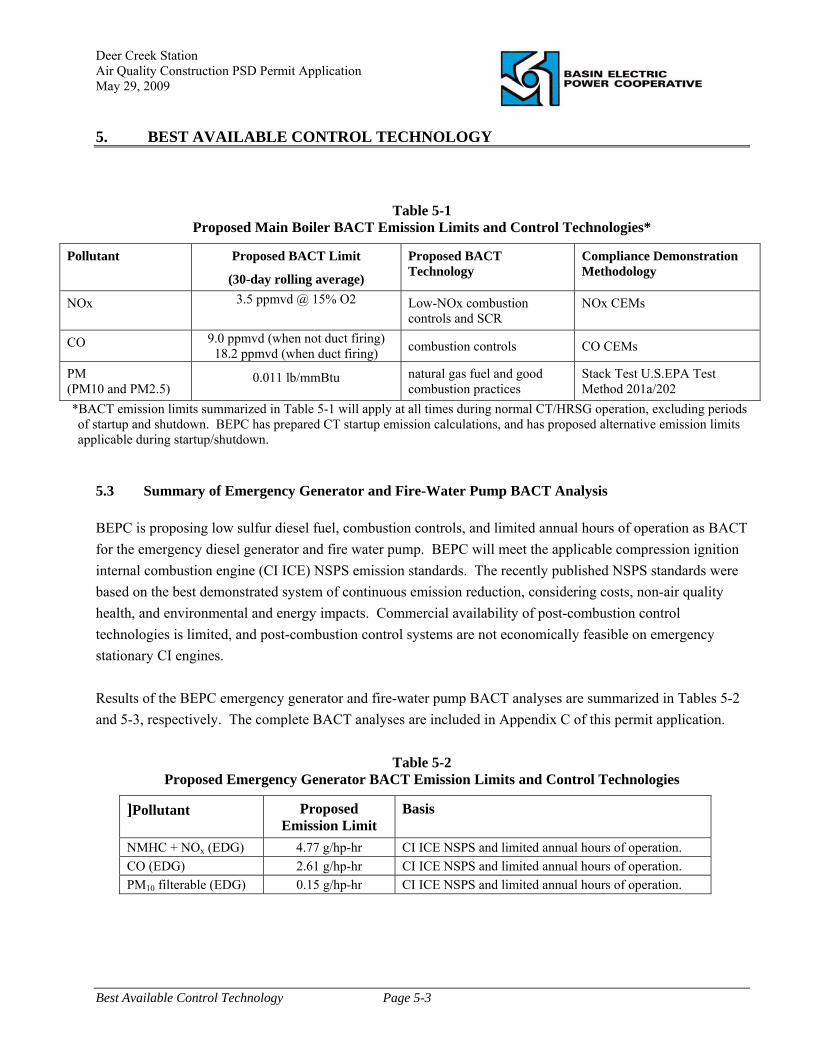
Deer Creek Station Air Quality Construction PSD Permit Application May 29, 2009 5. BEST AVAILABLE CONTROL TECHNOLOGY
Best Available Control Technology Page 5-3
Table 5-1 Proposed Main Boiler BACT Emission Limits and Control Technologies*
Pollutant Proposed BACT Limit
(30-day rolling average)
Proposed BACT Technology
Compliance Demonstration Methodology
NOx 3.5 ppmvd @ 15% O2 Low-NOx combustion controls and SCR
NOx CEMs
CO 9.0 ppmvd (when not duct firing) 18.2 ppmvd (when duct firing) combustion controls CO CEMs
PM (PM10 and PM2.5)
0.011 lb/mmBtu natural gas fuel and good combustion practices
Stack Test U.S.EPA Test Method 201a/202
*BACT emission limits summarized in Table 5-1 will apply at all times during normal CT/HRSG operation, excluding periods of startup and shutdown. BEPC has prepared CT startup emission calculations, and has proposed alternative emission limits applicable during startup/shutdown.
5.3 Summary of Emergency Generator and Fire-Water Pump BACT Analysis BEPC is proposing low sulfur diesel fuel, combustion controls, and limited annual hours of operation as BACT for the emergency diesel generator and fire water pump. BEPC will meet the applicable compression ignition internal combustion engine (CI ICE) NSPS emission standards. The recently published NSPS standards were based on the best demonstrated system of continuous emission reduction, considering costs, non-air quality health, and environmental and energy impacts. Commercial availability of post-combustion control technologies is limited, and post-combustion control systems are not economically feasible on emergency stationary CI engines. Results of the BEPC emergency generator and fire-water pump BACT analyses are summarized in Tables 5-2 and 5-3, respectively. The complete BACT analyses are included in Appendix C of this permit application.
Table 5-2 Proposed Emergency Generator BACT Emission Limits and Control Technologies
]Pollutant Proposed Emission Limit
Basis
NMHC + NOx (EDG) 4.77 g/hp-hr CI ICE NSPS and limited annual hours of operation. CO (EDG) 2.61 g/hp-hr CI ICE NSPS and limited annual hours of operation. PM10 filterable (EDG) 0.15 g/hp-hr CI ICE NSPS and limited annual hours of operation.
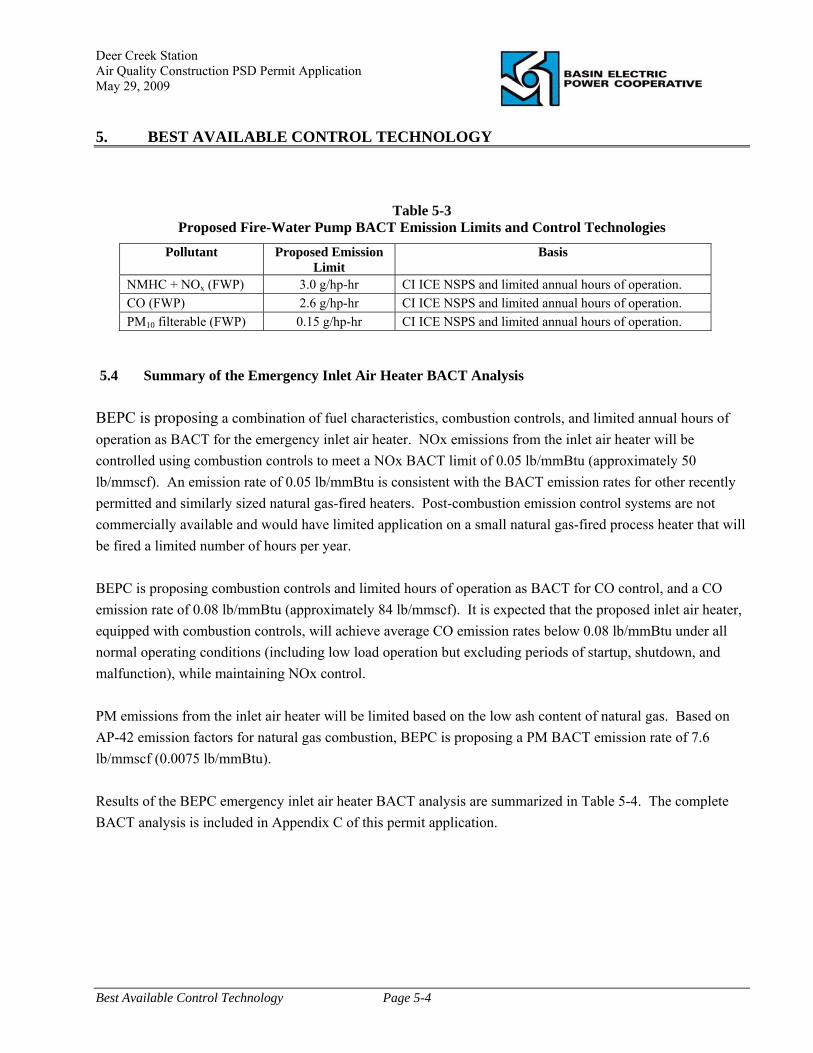
Deer Creek Station Air Quality Construction PSD Permit Application May 29, 2009 5. BEST AVAILABLE CONTROL TECHNOLOGY
Best Available Control Technology Page 5-4
Table 5-3 Proposed Fire-Water Pump BACT Emission Limits and Control Technologies
Pollutant Proposed Emission Limit
Basis
NMHC + NOx (FWP) 3.0 g/hp-hr CI ICE NSPS and limited annual hours of operation. CO (FWP) 2.6 g/hp-hr CI ICE NSPS and limited annual hours of operation. PM10 filterable (FWP) 0.15 g/hp-hr CI ICE NSPS and limited annual hours of operation.
5.4 Summary of the Emergency Inlet Air Heater BACT Analysis BEPC is proposing a combination of fuel characteristics, combustion controls, and limited annual hours of operation as BACT for the emergency inlet air heater. NOx emissions from the inlet air heater will be controlled using combustion controls to meet a NOx BACT limit of 0.05 lb/mmBtu (approximately 50 lb/mmscf). An emission rate of 0.05 lb/mmBtu is consistent with the BACT emission rates for other recently permitted and similarly sized natural gas-fired heaters. Post-combustion emission control systems are not commercially available and would have limited application on a small natural gas-fired process heater that will be fired a limited number of hours per year. BEPC is proposing combustion controls and limited hours of operation as BACT for CO control, and a CO emission rate of 0.08 lb/mmBtu (approximately 84 lb/mmscf). It is expected that the proposed inlet air heater, equipped with combustion controls, will achieve average CO emission rates below 0.08 lb/mmBtu under all normal operating conditions (including low load operation but excluding periods of startup, shutdown, and malfunction), while maintaining NOx control. PM emissions from the inlet air heater will be limited based on the low ash content of natural gas. Based on AP-42 emission factors for natural gas combustion, BEPC is proposing a PM BACT emission rate of 7.6 lb/mmscf (0.0075 lb/mmBtu). Results of the BEPC emergency inlet air heater BACT analysis are summarized in Table 5-4. The complete BACT analysis is included in Appendix C of this permit application.
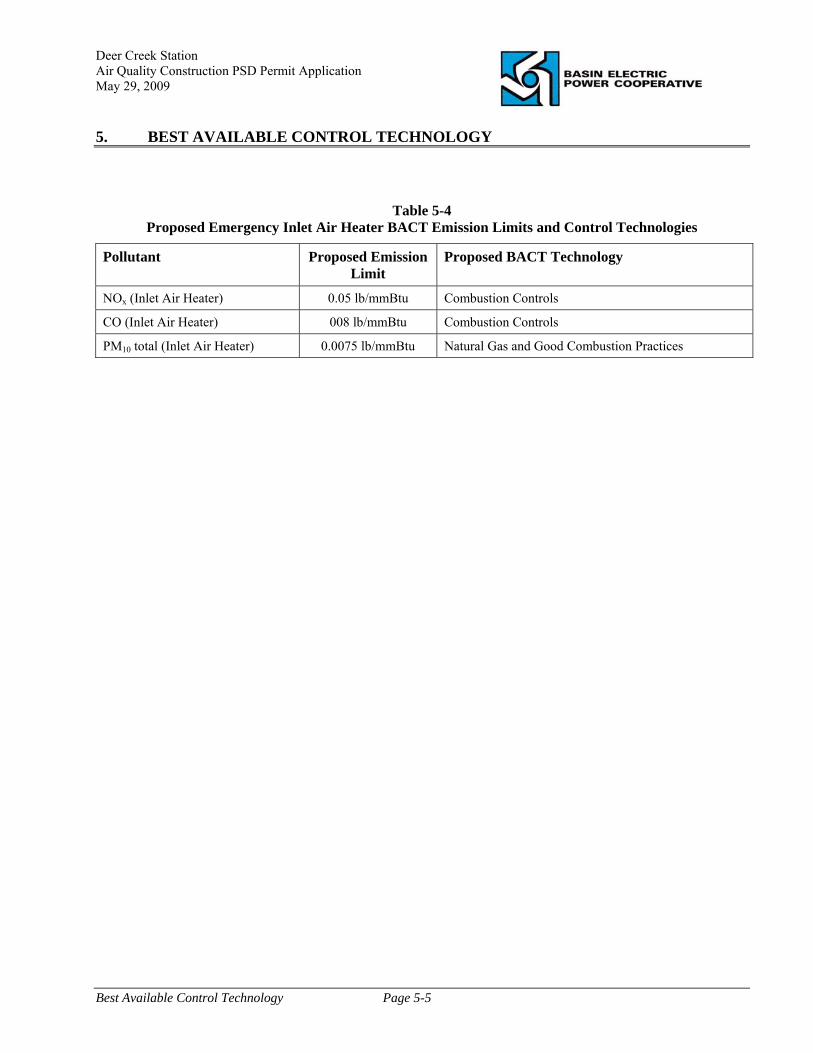
Deer Creek Station Air Quality Construction PSD Permit Application May 29, 2009 5. BEST AVAILABLE CONTROL TECHNOLOGY
Best Available Control Technology Page 5-5
Table 5-4 Proposed Emergency Inlet Air Heater BACT Emission Limits and Control Technologies
Pollutant Proposed Emission Limit
Proposed BACT Technology
NOx (Inlet Air Heater) 0.05 lb/mmBtu Combustion Controls
CO (Inlet Air Heater) 008 lb/mmBtu Combustion Controls
PM10 total (Inlet Air Heater) 0.0075 lb/mmBtu Natural Gas and Good Combustion Practices

Deer Creek Station Air Quality Construction PSD Permit Application May 29, 2009 6. MAXIMUM ACHIEVABLE CONTROL TECHNOLOGY
Maximum Achievable Control Technologies Page 6-1
6.0 Introduction Section 112 of the CAA requires EPA to list categories and subcategories of major sources of hazardous air pollutants (HAPs), and to establish national emission standards for hazardous air pollutants (NESHAPs) for each source category. The NESHAP regulations (codified under 40 CFR Parts 61 and 63 and incorporated in to the South Dakota Air Pollution Control Program at Chapter 74:36:08) are designed to regulate specific categories of stationary sources with the potential to emit one or more hazardous air pollutant. Applicability of the rules regulating HAP emissions from source categories are limited to emission sources located at major source of HAP emissions. A major source of HAP emissions is a plant site that emits or has the potential to emit any single HAP at a rate of 10 tpy or more, or any combination of HAP at a rate of 25 tpy or more. 6.1 Applicable MACT Standards Based on emission calculations provide in Appendix C and summarized in section 3.5, potential HAP emissions from all sources at the Deer Creek Station will be less than 25 tpy (7.62 tpy, see Table 3-18). Formaldehyde is the individual HAP constituent that will be emitted in the greatest quantity. Based on emission calculations, potential formaldehyde emissions from all emission sources will be 4.51 typ (see, Table 3-16, and Appendix B). Because the facility does not have the potential to emit any single HAP at a rate greater than 10 tpy, or any combination of HAP at a rate of 25 tpy or more, the Deer Creek Station does not meet the definition of a major source of HAP emissions. Therefore, potentially applicable NESHAP standards do not apply to emission sources at the Deer Creek Station.
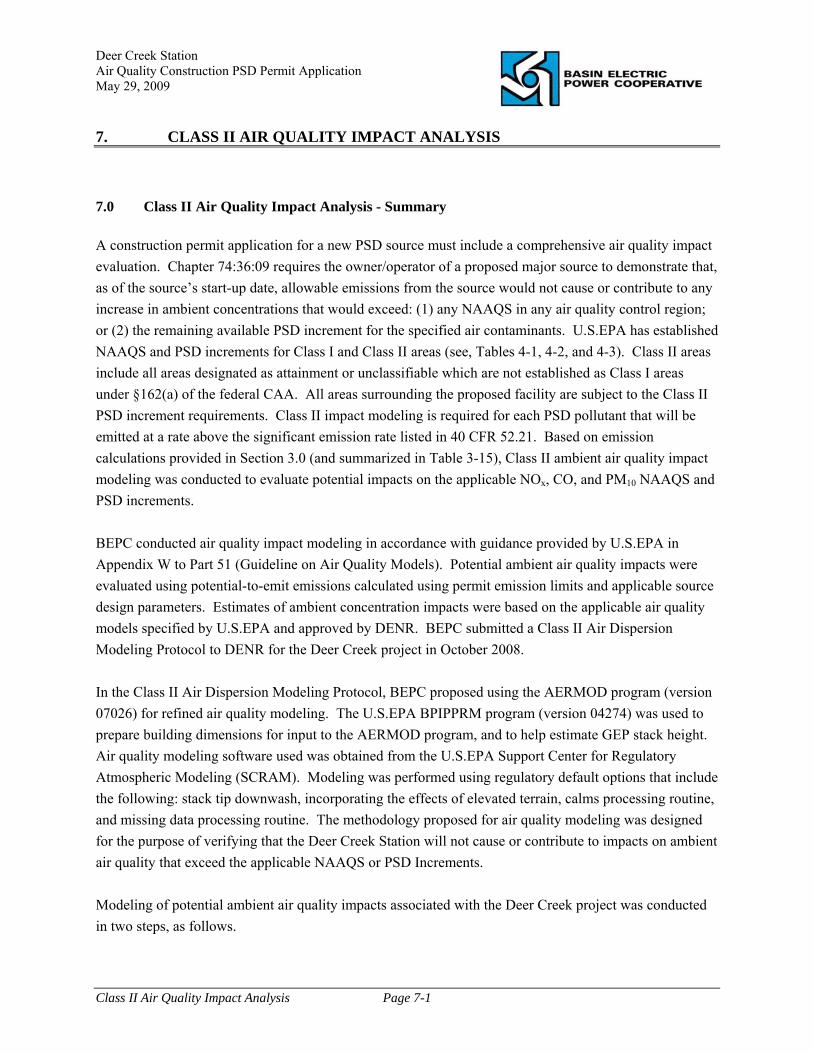
Deer Creek Station Air Quality Construction PSD Permit Application May 29, 2009 7. CLASS II AIR QUALITY IMPACT ANALYSIS
Class II Air Quality Impact Analysis Page 7-1
7.0 Class II Air Quality Impact Analysis - Summary A construction permit application for a new PSD source must include a comprehensive air quality impact evaluation. Chapter 74:36:09 requires the owner/operator of a proposed major source to demonstrate that, as of the source’s start-up date, allowable emissions from the source would not cause or contribute to any increase in ambient concentrations that would exceed: (1) any NAAQS in any air quality control region; or (2) the remaining available PSD increment for the specified air contaminants. U.S.EPA has established NAAQS and PSD increments for Class I and Class II areas (see, Tables 4-1, 4-2, and 4-3). Class II areas include all areas designated as attainment or unclassifiable which are not established as Class I areas under §162(a) of the federal CAA. All areas surrounding the proposed facility are subject to the Class II PSD increment requirements. Class II impact modeling is required for each PSD pollutant that will be emitted at a rate above the significant emission rate listed in 40 CFR 52.21. Based on emission calculations provided in Section 3.0 (and summarized in Table 3-15), Class II ambient air quality impact modeling was conducted to evaluate potential impacts on the applicable NOx, CO, and PM10 NAAQS and PSD increments. BEPC conducted air quality impact modeling in accordance with guidance provided by U.S.EPA in Appendix W to Part 51 (Guideline on Air Quality Models). Potential ambient air quality impacts were evaluated using potential-to-emit emissions calculated using permit emission limits and applicable source design parameters. Estimates of ambient concentration impacts were based on the applicable air quality models specified by U.S.EPA and approved by DENR. BEPC submitted a Class II Air Dispersion Modeling Protocol to DENR for the Deer Creek project in October 2008. In the Class II Air Dispersion Modeling Protocol, BEPC proposed using the AERMOD program (version 07026) for refined air quality modeling. The U.S.EPA BPIPPRM program (version 04274) was used to prepare building dimensions for input to the AERMOD program, and to help estimate GEP stack height. Air quality modeling software used was obtained from the U.S.EPA Support Center for Regulatory Atmospheric Modeling (SCRAM). Modeling was performed using regulatory default options that include the following: stack tip downwash, incorporating the effects of elevated terrain, calms processing routine, and missing data processing routine. The methodology proposed for air quality modeling was designed for the purpose of verifying that the Deer Creek Station will not cause or contribute to impacts on ambient air quality that exceed the applicable NAAQS or PSD Increments. Modeling of potential ambient air quality impacts associated with the Deer Creek project was conducted in two steps, as follows.

Deer Creek Station Air Quality Construction PSD Permit Application May 29, 2009 7. CLASS II AIR QUALITY IMPACT ANALYSIS
Class II Air Quality Impact Analysis Page 7-2
(1) First, via refined modeling the significant impact area of emissions from the project will be determined for all applicable pollutants and averaging times. The impact of emissions from the project alone was compared to the Significant Impact Levels (SILs), the NAAQS, and the PSD Increments.
(2) Second, if any pollutants for which emissions from the project alone would have been predicted
to have significant impacts, significant impact radii would have been defined and reported. A multi-source analysis would then be performed, incorporating a regional source emission inventory as supplied by the DENR. That regional source inventory would include existing sources and permitted PSD sources that have not yet begun operation. PSD or “new” sources would include all sources that have consumed PSD Increment in the vicinity of the proposed source since the PSD baseline date, or will consume PSD Increment in the future after they begin operation. Predictions of air quality impacts for PSD pollutants due to emissions from the new source inventory would be compared to the PSD Increments to demonstrate compliance. Predictions of air quality impacts for NAAQS criteria pollutants due to emissions from the inventory of all sources including existing and new, would be summed with background ambient air quality levels (provided by the DENR), and compared to the NAAQS to demonstrate compliance.
The air dispersion modeling analysis has been included in this Permit Application as Appendix D. The results of the analysis that ambient air quality impacts from the project will not exceed the PSD SILs, NAAQS, or PSD Increment. Therefore, the Deer Creek project will not cause or contribute to adverse ambient air quality impacts.

Deer Creek Station Air Quality Construction PSD Permit Application May 29, 2009 8. ADDITIONAL IMPACT ASSESSMENT
Additional Impact Assessment Page 8-1
8.0 Additional Impact Assessment The PSD regulations (40 CFR 51.166) require an analysis of potential secondary impacts resulting from growth associated with a proposed PSD project. The growth analysis requires an assessment of the projected air quality impacts and impairment to visibility, soils, and vegetation as a result of the new source and general commercial, residential, industrial, and other growth associated with the source. This section includes an assessment of potential Class II visibility impacts, and an assessment of potential impacts to soils and vegetation as a result of Deer Creek Station and general commercial, residential, and industrial growth associated with the Deer Creek project. 8.1 Class II Visibility Analysis The Clean Air Act amendments of 1977 require additional evaluation of new emission sources to determine potential impacts on visibility. A Level-1 visibility impact screening was conducted using the U.S.EPA VISCREEN model (version 88341). The screening followed guidance provided U.S.EPA’s document "Workbook for Plume Visual Impact Screening and Analysis (Revised)”. The analysis was performed for the Pipestone National Monument (PNM) in southwestern Minnesota. PNM is located approximately 45 km south-southeast of the proposed facility. Per discussion with DENR, visibility analyses were also performed for South Dakota state parks within 50 km of the facility. Visibility analyses were performed for the following state parks:
• Lake Cochrane, SD (35 km north of project) • Lake Poinsett, SD (47 km northwest of project) • Oakwood Lakes, SD (34 km west of project)
A map showing PNM, the state parks, and the proposed facility is provided in Figure 8-1.
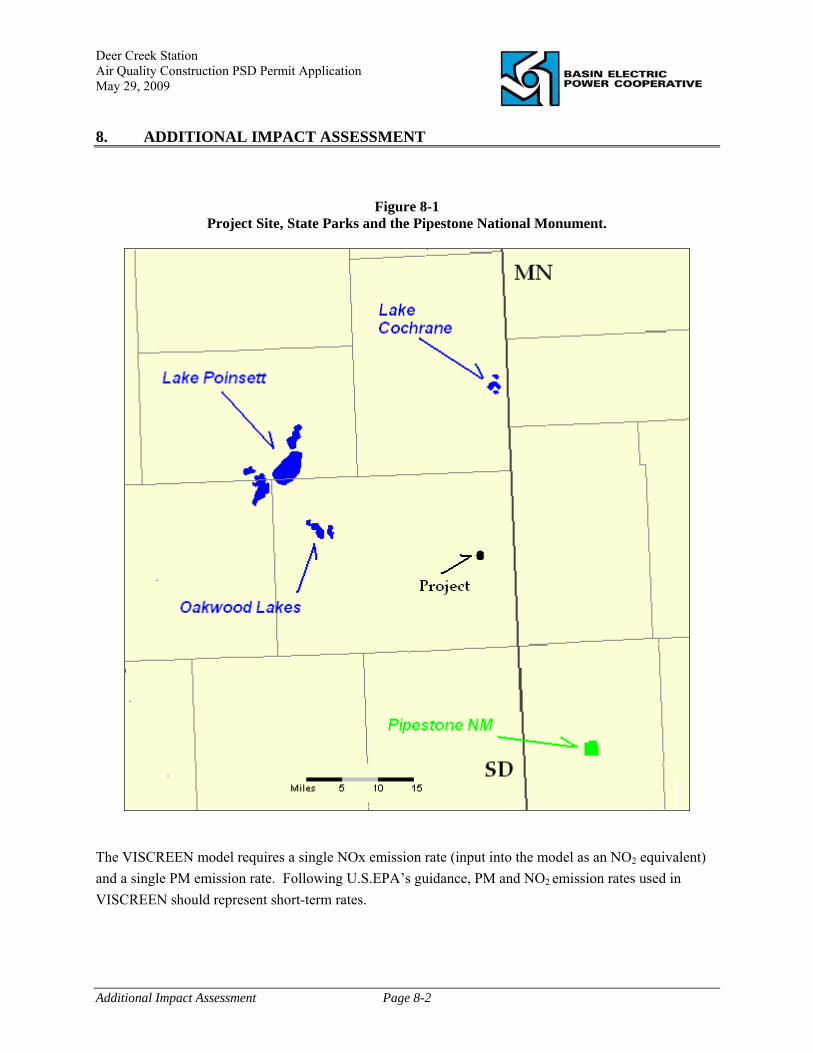
Deer Creek Station Air Quality Construction PSD Permit Application May 29, 2009 8. ADDITIONAL IMPACT ASSESSMENT
Additional Impact Assessment Page 8-2
Figure 8-1 Project Site, State Parks and the Pipestone National Monument.
The VISCREEN model requires a single NOx emission rate (input into the model as an NO2 equivalent) and a single PM emission rate. Following U.S.EPA’s guidance, PM and NO2 emission rates used in VISCREEN should represent short-term rates.

Deer Creek Station Air Quality Construction PSD Permit Application May 29, 2009 8. ADDITIONAL IMPACT ASSESSMENT
Additional Impact Assessment Page 8-3
The PM emission rate input into VISCREEN (24.55 lb/hr) is the sum of the maximum total (condensable plus filterable) PM emission rates from the CT/HRSG (23.2 lb/hr; see Appendix D, Table 7); emergency inlet air heater (0.19 lb/hr; see Appendix D, Table 9); emergency generator (0.97 lb/hr; see Appendix D, Table 10); and fire water pump (0.19 lb/hr; see Appendix D, Table 10). Per discussion with DENR, a conservative NO2 / NOx ratio of 1.0 was assumed (see Appendix D, Section 5.7.1). The NOx emission rate input into VISCREEN (99.24 lb/hr) is the sum of the maximum hourly NOx emission rate from the CT/HRSG (65.5 lb/hr during cold start-up; see Appendix D, Table 8); emergency inlet air heater (2.45 lb/hr; see Appendix D, Table 9); emergency generator (28.9 lb/hr; see Appendix D, Table 10); and fire water pump (2.39 lb/hr; see Appendix D, Table 10). The PM and NOx emission rates used in VISCREEN are summarized in Table 8-1.
Table 8-1 VISCREEN Input Emission Rates
=Pollutant Input emission rate (lb/hr)
Notes
PM
24.55
Sum of maximum hourly total PM emission rate from the CT/HRSG, air inlet heater, emergency generator and fire water pump.
NO2
99.24
Sum of maximum hourly total NOx emission rate from the CT/HRSG, air inlet heater, emergency generator and fire water pump. Assumes a NO2 / NOx ratio of 1.0.
VISCREEN requires background visible range and course-receptor distances. Per U.S.EPA guidance the background visible range was set to 40 km. VISCREEN also requires source-observer distances and maximum/minimum receptor distances. These distances were determined following EPA guidance. These distances are listed in Table 8-2.
Table 8-2 VISCREEN Source-Receptor Distances
Receptor Source-Observer Distance (km)
Minimum Source-Observer Distance
(km)
Maximum Source-Observer Distance
(km) Pipestone NM 44 44 46 Lake Cochrane 34 34 38 Lake Poinsett 45 45 59 Oakwood Lakes 34 34 41
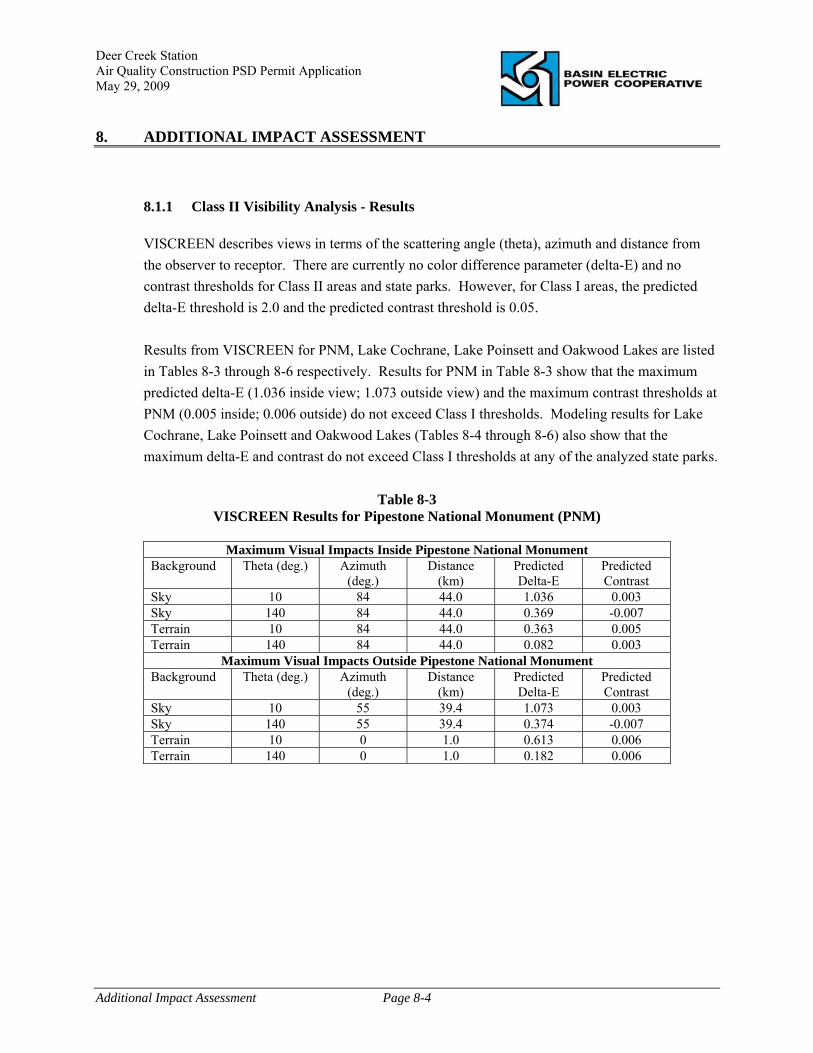
Deer Creek Station Air Quality Construction PSD Permit Application May 29, 2009 8. ADDITIONAL IMPACT ASSESSMENT
Additional Impact Assessment Page 8-4
8.1.1 Class II Visibility Analysis - Results VISCREEN describes views in terms of the scattering angle (theta), azimuth and distance from the observer to receptor. There are currently no color difference parameter (delta-E) and no contrast thresholds for Class II areas and state parks. However, for Class I areas, the predicted delta-E threshold is 2.0 and the predicted contrast threshold is 0.05. Results from VISCREEN for PNM, Lake Cochrane, Lake Poinsett and Oakwood Lakes are listed in Tables 8-3 through 8-6 respectively. Results for PNM in Table 8-3 show that the maximum predicted delta-E (1.036 inside view; 1.073 outside view) and the maximum contrast thresholds at PNM (0.005 inside; 0.006 outside) do not exceed Class I thresholds. Modeling results for Lake Cochrane, Lake Poinsett and Oakwood Lakes (Tables 8-4 through 8-6) also show that the maximum delta-E and contrast do not exceed Class I thresholds at any of the analyzed state parks.
Table 8-3
VISCREEN Results for Pipestone National Monument (PNM)
Maximum Visual Impacts Inside Pipestone National Monument Background Theta (deg.) Azimuth
(deg.) Distance
(km) Predicted Delta-E
Predicted Contrast
Sky 10 84 44.0 1.036 0.003 Sky 140 84 44.0 0.369 -0.007 Terrain 10 84 44.0 0.363 0.005 Terrain 140 84 44.0 0.082 0.003
Maximum Visual Impacts Outside Pipestone National Monument Background Theta (deg.) Azimuth
(deg.) Distance
(km) Predicted Delta-E
Predicted Contrast
Sky 10 55 39.4 1.073 0.003 Sky 140 55 39.4 0.374 -0.007 Terrain 10 0 1.0 0.613 0.006 Terrain 140 0 1.0 0.182 0.006
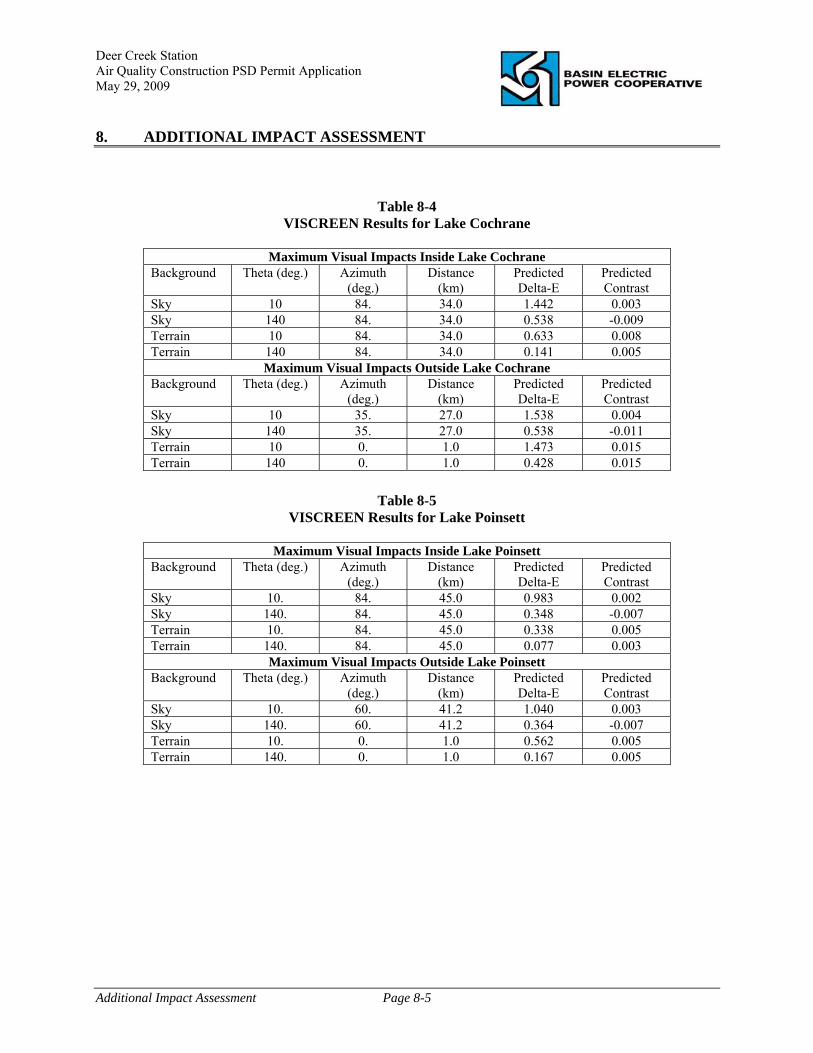
Deer Creek Station Air Quality Construction PSD Permit Application May 29, 2009 8. ADDITIONAL IMPACT ASSESSMENT
Additional Impact Assessment Page 8-5
Table 8-4 VISCREEN Results for Lake Cochrane
Maximum Visual Impacts Inside Lake Cochrane
Background Theta (deg.) Azimuth (deg.)
Distance (km)
Predicted Delta-E
Predicted Contrast
Sky 10 84. 34.0 1.442 0.003 Sky 140 84. 34.0 0.538 -0.009 Terrain 10 84. 34.0 0.633 0.008 Terrain 140 84. 34.0 0.141 0.005
Maximum Visual Impacts Outside Lake Cochrane Background Theta (deg.) Azimuth
(deg.) Distance
(km) Predicted Delta-E
Predicted Contrast
Sky 10 35. 27.0 1.538 0.004 Sky 140 35. 27.0 0.538 -0.011 Terrain 10 0. 1.0 1.473 0.015 Terrain 140 0. 1.0 0.428 0.015
Table 8-5
VISCREEN Results for Lake Poinsett
Maximum Visual Impacts Inside Lake Poinsett Background Theta (deg.) Azimuth
(deg.) Distance
(km) Predicted Delta-E
Predicted Contrast
Sky 10. 84. 45.0 0.983 0.002 Sky 140. 84. 45.0 0.348 -0.007 Terrain 10. 84. 45.0 0.338 0.005 Terrain 140. 84. 45.0 0.077 0.003
Maximum Visual Impacts Outside Lake Poinsett Background Theta (deg.) Azimuth
(deg.) Distance
(km) Predicted Delta-E
Predicted Contrast
Sky 10. 60. 41.2 1.040 0.003 Sky 140. 60. 41.2 0.364 -0.007 Terrain 10. 0. 1.0 0.562 0.005 Terrain 140. 0. 1.0 0.167 0.005

Deer Creek Station Air Quality Construction PSD Permit Application May 29, 2009 8. ADDITIONAL IMPACT ASSESSMENT
Additional Impact Assessment Page 8-6
Table 8-6 VISCREEN Results for Oakwood Lakes
Maximum Visual Impacts Inside Oakwood Lakes
Background Theta (deg.) Azimuth (deg.)
Distance (km)
Predicted Delta-E
Predicted Contrast
Sky 10. 84. 34.0 1.442 0.003 Sky 140. 84. 34.0 0.538 -0.009 Terrain 10. 84. 34.0 0.633 0.008 Terrain 140. 84. 34.0 0.141 0.005
Maximum Visual Impacts Outside Oakwood Lakes Background Theta (deg.) Azimuth
(deg.) Distance
(km) Predicted Delta-E
Predicted Contrast
Sky 10. 35. 27.0 1.538 0.004 Sky 140. 35. 27.0 0.538 -0.011 Terrain 10. 0. 1.0 1.473 0.015 Terrain 140. 0. 1.0 0.428 0.015
8.1.2 VISCREEN Input and Output Files
Specifications of the VISCREEN input and output files are listed in Table 8-7 for reference.
Table 8-7 VISCREEN Input and Output Files
File contents File name
Input file with parameters for PNM Pipeston.inp Output file with results for PNM Pipeston.out Input file with parameters for Lake Cochrane State Park Lcochran.inp Output file with parameters for Lake Cochrane State Park Lcochran.out Input file with parameters for Lake Poinsett State Park Lpoinset.inp Output file with parameters for Lake Poinsett State Park Lpoinset.out Input file with parameters for Oakwood Lake State Park Oakwoodl.inp Output file with parameters for Oakwood Lake State Park Oakwoodl.out

Deer Creek Station Air Quality Construction PSD Permit Application May 29, 2009 8. ADDITIONAL IMPACT ASSESSMENT
Additional Impact Assessment Page 8-7
8.2 Growth Analysis
A growth analysis is intended to quantify the amount of new growth that is likely to occur in support of the proposed facility and to estimate secondary emissions resulting from that associated growth. Associated growth includes residential and commercial/industrial growth projected as a result of the proposed project. Residential growth depends on the number of new employees and the availability of housing in the area, while associated commercial and industrial growth consists of new sources providing services to the new employees and the facility. While secondary activities are not directly related to operating the proposed project, the growth analysis identifies and evaluates emissions from secondary activities that can reasonably be expected to occur. A growth analysis was prepared for the Deer Creek Project, including:
review of the current population and land use in the area; estimated project-related industrial, commercial, and residential growth in the area; estimated air emissions generated by permanent project-related growth; and qualitative air quality impact assessment associated with projected growth related emission.
The proposed Deer Creek Station will be located in Brookings County, South Dakota. The project site is located in a rural area in South Dakota. White, South Dakota (population 530) is the nearest town, located approximately six miles northwest of the project site. Nearby major population centers include Brookings, Watertown and Sioux Falls. Brookings is located approximately 12 miles southwest of the project site, Watertown is located approximately 45 miles northwest of the project site, and Sioux Falls is located approximately 50 miles southwest of the project.
The Deer Creek Station is expected to increase employment in the area. During construction, which is projected to last approximately 2 years, the project is expected to employ as many as 430 workers. Following the construction phase, projected employment, reflecting full-time jobs directly tied to the operation of Deer Creek, is estimated at 25 to 30. Although qualified craft workers (e.g., electricians, pipe fitters, welders, etc.) may be available from the Brookings, Watertown, and Sioux Falls areas, the availability of craft workers in the immediate area may be limited. Therefore, some of the skilled workers needed during the construction phase are expected to temporarily relocate from major metropolitan areas in the central U.S., including Minneapolis, Minnesota (located within about 170 miles of the project location) and Omaha, Nebraska (located approximately 205 miles from the project location). It is anticipated that additional craft workers needed during the construction phase will temporarily relocate to the east-central South Dakota area.

Deer Creek Station Air Quality Construction PSD Permit Application May 29, 2009 8. ADDITIONAL IMPACT ASSESSMENT
Additional Impact Assessment Page 8-8
It is expected that workers relocating to east-central South Dakota during the construction phase will commute to the project site. Emissions associated with the increase in vehicle miles traveled, and emissions directly associated with the construction activities (e.g., grading, bulldozing, cranes, etc.) will increase overall air-shed emissions during the construction phase. The presence of temporary workers during the construction phase will likely cause short-term demand for services in area, including rental lodging, hotels, and restaurants. However, the construction phase is temporary and will not contribute to permanent growth-related emissions in the area. Therefore, the construction period is assumed to be short-term, with a primarily transient work force that does not contribute substantially to long-term growth. Following the construction phase, there will be approximately 25 to 30 employees at the Deer Creek Station. Plant employees are expected to come from nearby rural communities in Brookings County, as well as the larger population centers in the nearby counties of Codington and Minnehaha. The 2000 population of Brookings, Deuel, Codington, Hamlin, Kingsbury, Lake, Moody, and Minnehaha counties was approximately 236,100 persons. The maximum construction force of 430 persons represents approximately 0.18% of the population in the 8-county area. The post-construction operation employees (25 - 30) represents approximately 0.011 to 0.013% of the population. It is expected that a majority of the post-construction positions will be filled with persons already residing in the east-central South Dakota area, and that the additional permanent jobs will not add significantly to the overall population within the 8-county area. Because a majority of the permanent jobs are expected to be filled with persons already living in the area, secondary employment and commercial growth associated with the project (e.g., automotive repair, grocery stores, motels, equipment supply, etc.) are expected to be minimal. The additional permanent jobs are not expected to result in any residential construction or construction-related emissions. No significant project-related industrial growth is expected to accompany the Deer Creek project. Project-related support services such as maintenance, cleaning, painting, and other related services already support existing industrial facilities in east-central South Dakota. Operating the Deer Creek Station is not expected to trigger significant expansion of the existing support services industry in the area. The majority of growth-related emissions associated with the project are expected to be related to the increased workforce (e.g., vehicle emissions associated with commuting). With respect to permanent employee vehicle emissions, it is anticipated that most workers will commute an average of 25 miles to

Deer Creek Station Air Quality Construction PSD Permit Application May 29, 2009 8. ADDITIONAL IMPACT ASSESSMENT
Additional Impact Assessment Page 8-9
the facility. Vehicle emissions were estimated using average vehicle emission rates available in U.S.EPA’s AP-42 Appendix I: Emission Sensitivity Tables (All Vehicles Combined). The AP-42 Appendix I emission factors were developed using U.S.EPA’s Mobile5 model. Mobile5 estimates emissions of hydrocarbons (HC), NOx, and CO from passenger cars, motorcycles, light- and heavy-duty trucks. Using emission factors summarized in AP-42 Appendix I, increased vehicle emissions associated with permanent employees at the Deer Creek Station are expected to be in the range of 7.6 tpy (CO), 1.4 tpy (NOx), and 1.0 tpy (VOC). Growth-related secondary emissions associated with the project are expected to be minimal. Project-related industrial growth is not expected to be significant. The project will result in approximately 25 to 30 permanent jobs at the facility, however, the increase in permanent jobs is not expected to result in significant commercial or residential growth in east-central South Dakota. The project may result in a minimal increase in vehicle emissions associated with employee commuting, however, emissions associated with increased employment are minimal and will have no impact on overall emissions in the region.
8.3 Soils & Vegetation Analysis
PSD regulations require an analysis of air quality impacts on soils and vegetation in the vicinity of the proposed project. Potential effects of NO2, CO associated with the Deer Creek project on the nearby vegetation and soil were examined. The Deer Creek Station will be located in Brookings County in east-central South Dakota. East-central South Dakota is located in the Coteau des Prairies physiographic region of South Dakota. The area is characterized as a high land plateau that extends across the county in a southeasterly direction. Brookings County is part of the tall grass prairie and native vegetation is dominated by tall and mid grasses and forbs. Soil is the most important natural resource in the county. It provides a growing medium for crops and for the grass grazed by livestock. About 65% of the acreage in the county is used for cultivated crops, and 7% is used for tame pasture or as hayland. Dryland farming is dominant, with only about 3% of the land irrigated. Crops cultivated in the areas include corn, soybeans, and small grain. Other natural resources in the county are water, sand and gravel, and wildlife The potential effects of the air emissions to vegetation within the immediate vicinity of Deer Creek were evaluated by comparing modeled ambient air quality impacts to scientific research examining the effects of pollution on vegetation. Evaluation of impacts on sensitive vegetation were performed by comparing
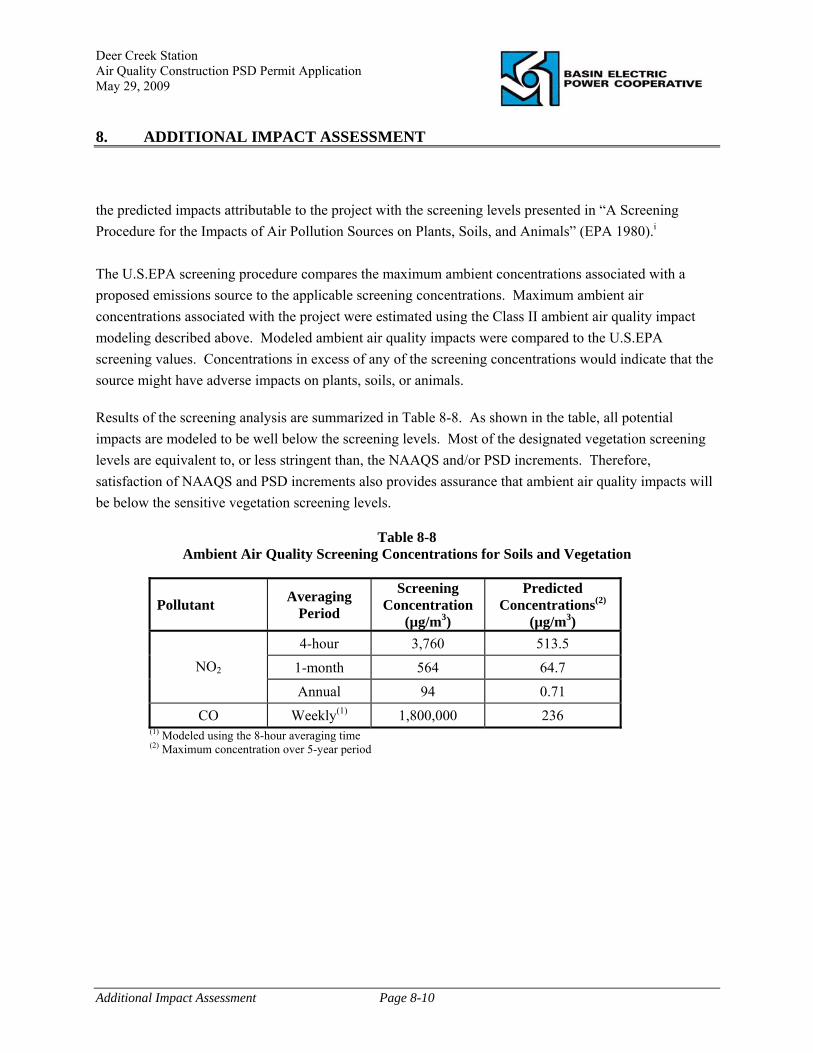
Deer Creek Station Air Quality Construction PSD Permit Application May 29, 2009 8. ADDITIONAL IMPACT ASSESSMENT
Additional Impact Assessment Page 8-10
the predicted impacts attributable to the project with the screening levels presented in “A Screening Procedure for the Impacts of Air Pollution Sources on Plants, Soils, and Animals” (EPA 1980).i The U.S.EPA screening procedure compares the maximum ambient concentrations associated with a proposed emissions source to the applicable screening concentrations. Maximum ambient air concentrations associated with the project were estimated using the Class II ambient air quality impact modeling described above. Modeled ambient air quality impacts were compared to the U.S.EPA screening values. Concentrations in excess of any of the screening concentrations would indicate that the source might have adverse impacts on plants, soils, or animals.
Results of the screening analysis are summarized in Table 8-8. As shown in the table, all potential impacts are modeled to be well below the screening levels. Most of the designated vegetation screening levels are equivalent to, or less stringent than, the NAAQS and/or PSD increments. Therefore, satisfaction of NAAQS and PSD increments also provides assurance that ambient air quality impacts will be below the sensitive vegetation screening levels.
Table 8-8 Ambient Air Quality Screening Concentrations for Soils and Vegetation
Pollutant Averaging Period
Screening Concentration
(µg/m3)
Predicted Concentrations(2)
(µg/m3) 4-hour 3,760 513.5
1-month 564 64.7 NO2
Annual 94 0.71 CO Weekly(1) 1,800,000 236
(1) Modeled using the 8-hour averaging time (2) Maximum concentration over 5-year period
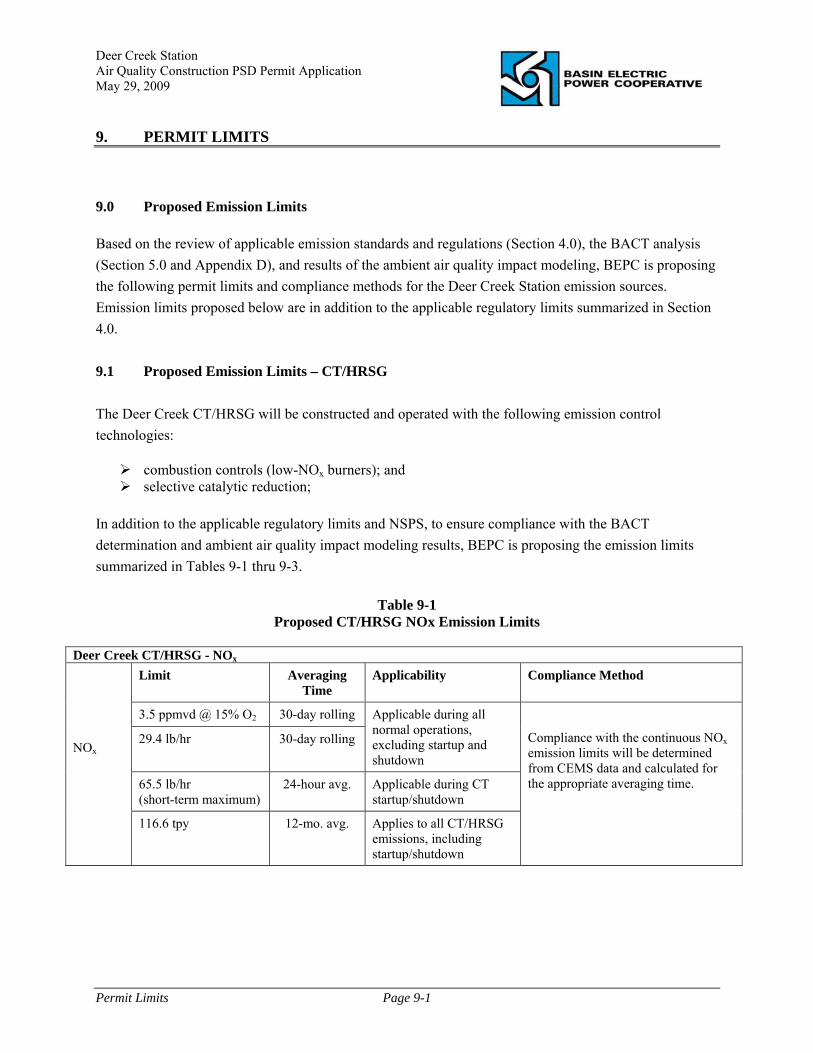
Deer Creek Station Air Quality Construction PSD Permit Application May 29, 2009 9. PERMIT LIMITS
Permit Limits Page 9-1
9.0 Proposed Emission Limits Based on the review of applicable emission standards and regulations (Section 4.0), the BACT analysis (Section 5.0 and Appendix D), and results of the ambient air quality impact modeling, BEPC is proposing the following permit limits and compliance methods for the Deer Creek Station emission sources. Emission limits proposed below are in addition to the applicable regulatory limits summarized in Section 4.0. 9.1 Proposed Emission Limits – CT/HRSG The Deer Creek CT/HRSG will be constructed and operated with the following emission control technologies:
combustion controls (low-NOx burners); and selective catalytic reduction;
In addition to the applicable regulatory limits and NSPS, to ensure compliance with the BACT determination and ambient air quality impact modeling results, BEPC is proposing the emission limits summarized in Tables 9-1 thru 9-3.
Table 9-1 Proposed CT/HRSG NOx Emission Limits
Deer Creek CT/HRSG - NOx
Limit Averaging Time
Applicability Compliance Method
3.5 ppmvd @ 15% O2 30-day rolling
29.4 lb/hr 30-day rolling
Applicable during all normal operations, excluding startup and shutdown
65.5 lb/hr (short-term maximum)
24-hour avg. Applicable during CT startup/shutdown
NOx
116.6 tpy 12-mo. avg. Applies to all CT/HRSG emissions, including startup/shutdown
Compliance with the continuous NOx emission limits will be determined from CEMS data and calculated for the appropriate averaging time.
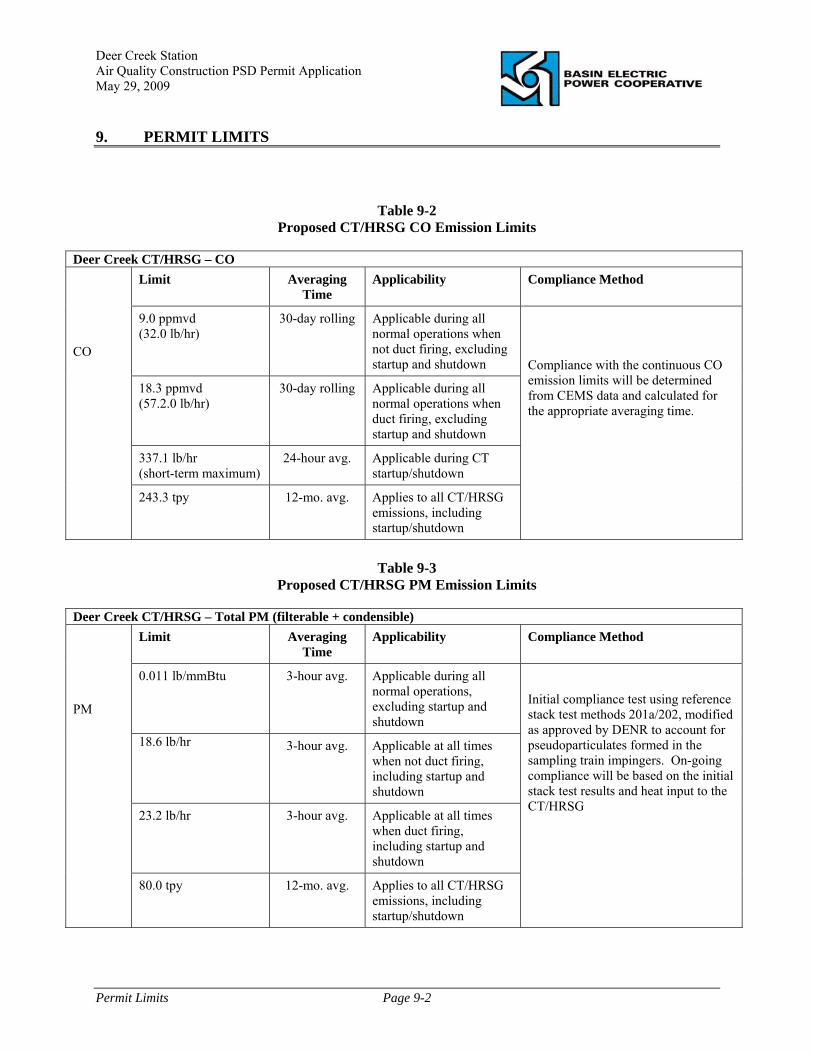
Deer Creek Station Air Quality Construction PSD Permit Application May 29, 2009 9. PERMIT LIMITS
Permit Limits Page 9-2
Table 9-2 Proposed CT/HRSG CO Emission Limits
Deer Creek CT/HRSG – CO
Limit Averaging Time
Applicability Compliance Method
9.0 ppmvd (32.0 lb/hr)
30-day rolling Applicable during all normal operations when not duct firing, excluding startup and shutdown
18.3 ppmvd (57.2.0 lb/hr)
30-day rolling Applicable during all normal operations when duct firing, excluding startup and shutdown
337.1 lb/hr (short-term maximum)
24-hour avg. Applicable during CT startup/shutdown
CO
243.3 tpy 12-mo. avg. Applies to all CT/HRSG emissions, including startup/shutdown
Compliance with the continuous CO emission limits will be determined from CEMS data and calculated for the appropriate averaging time.
Table 9-3
Proposed CT/HRSG PM Emission Limits
Deer Creek CT/HRSG – Total PM (filterable + condensible) Limit Averaging
Time Applicability Compliance Method
0.011 lb/mmBtu 3-hour avg. Applicable during all normal operations, excluding startup and shutdown
18.6 lb/hr 3-hour avg. Applicable at all times when not duct firing, including startup and shutdown
23.2 lb/hr 3-hour avg. Applicable at all times when duct firing, including startup and shutdown
PM
80.0 tpy 12-mo. avg. Applies to all CT/HRSG emissions, including startup/shutdown
Initial compliance test using reference stack test methods 201a/202, modified as approved by DENR to account for pseudoparticulates formed in the sampling train impingers. On-going compliance will be based on the initial stack test results and heat input to the CT/HRSG

Deer Creek Station Air Quality Construction PSD Permit Application May 29, 2009 9. PERMIT LIMITS
Permit Limits Page 9-3
9.2 Proposed Emission Limits – Diesel-Fired Stationary Engines and Inlet Air Heater The emergency generator and fire-water pump will meet the applicable Stationary Compression Ignition Internal Combustion Engine (CI ICE) NSPS (40 CFR Part 60 Subpart IIII). The CI ICE NSPS limits emissions of NOx, PM, SO2, CO, and HC from stationary diesel internal combustion engines. Provisions of the CI ICE NSPS apply to manufacturers, owners, and operators of stationary CI internal combustion engines. BEPC will be required to purchase engines certified by the manufacturer to meet the applicable emissions levels. Annual emissions from these diesel engines will also be reduced by limiting the annual hours of operation to 150 hours/year (each engine). Emissions from the emergency inlet air heater will be limited by firing natural gas and limiting the annual hours of operation. As described above, the inlet air heater will be used to preheat the CT intake air under extremely cold ambient conditions (approximately -25 °F). Based on the preliminary design, it is expected that the heater will operate for 10 to 20 minutes during startup under these conditions. Emissions from the inlet air heater will be controlled by using combustion controls and limiting the annual hours of operation to 150 hours per year.

Deer Creek Station Air Quality Construction PSD Permit Application May 29, 2009 APPENDICES
Appendices
APPENDICES
Appendix A DENR Permit Application Forms Appendix B Supporting Calculations for Emission Estimates Appendix C BACT Analysis Appendix D Class II Impact Modeling Results and Support Documentation

Basin Electric Power Cooperative
Deer Creek Station PSD Air Quality Construction Permit Application
Appendix A South Dakota Department of Environment and Natural Resources
Permit Application Forms
May 29, 2009

Basin Electric Power Cooperative
Deer Creek Station PSD Air Quality Construction Permit Application
Appendix A – List of Forms
1. Air Quality Permit Application Form Title V (Part 70) Operating Permit General Information Form and Certification of Applicant Form
2. Air Quality Permit Application Form Boiler Turbine or Furnace (CT/HRSG #1 – EP01) 3. Air Quality Permit Application Form Miscellaneous Control Device (Low NOx Combustion and Selective Catalytic Reduction – CT/HRSG #1 – EP01) 4. Air Quality Permit Application Form Miscellaneous Process (Emergency Diesel Generator – EP02) 5. Air Quality Permit Application Form Miscellaneous Process (Fire Water Pump – EP03) 6. Air Quality Permit Application Form Miscellaneous Process (Emergency Inlet Gas Heater – EP04) 7. Air Quality Permit Application Form Storage Tanks (Emergency Diesel Generator Fuel Tank – TK-1) 8. Air Quality Permit Application Form Storage Tanks (Fire Water Pump Fuel Tank – TK-2)

Title V (Part 70) Permit Application From Page 1 of 6
Air Quality Permit Application Form
Title V (Part 70) Operating Permit
General Information Form And
Certification of Applicant Form
SEND ALL MATERIALS TO: SD Department of Environment and Natural Resources Air Quality Program 523 East Capitol Pierre, South Dakota 57501-3181 (Please complete shaded areas - if you have questions call (605) 773-3151) GENERAL INFORMATION If permit is being renewed or amended, give existing permit number: 1. Facility name: Deer Creek Station 2. Mailing address: Street and/or box number 1717 East Interstate Avenue City, state, zip code Bismarck, North Dakota 58503-0564 3. Facility location (if plant is portable, enter location at time of submittal): Street and city 6 miles southeast of White, South Dakota Legal description and county E 1/2 of the NW 1/4 of Sec. 25, Township 111 N, Range 48 W, Brookings Co (Quarter, Section, Township, Range) 4. Permit contact: Name/title Jerry Menge, Air Quality Program Coordinator Telephone number (701) 223-0441 5. Facility contact, if different than permit contact (Person to contact for arranging inspections): Name/title Telephone number 6. Responsible official: Name/title Robert W. Holzwarth, Vice President of Operations Telephone number (701) 223-0441 A responsible official is defined as a president, vice president, secretary, or treasurer for a corporation; general partner or the proprietor for a partnership; and principal executive officer or ranking elected
official for municipal, state, federal or public agency.

Title V (Part 70) Permit Application From Page 2 of 6
B. PLANT DESCRIPTION 1. Standard Industrial Classification Code (SIC code): Primary SIC code: 4911 Secondary SIC code (if applicable):
Please contact the Department if unable to determine your SIC code. 2. Briefly describe the operations at the facility, including raw materials and finished products: Natural gas-fired combustion turbine and heat recovery steam generator for electricity generation.
Please attach one copy, if available, of any prepared plans and the manufacturer’s specifications of any equipment, including pollution control devices. If additional space is needed to describe operations,
please attach the additional paper to this application. 3. A new source or modification to an existing source is required to demonstrate that the operation of the new source or modification will not prevent or interfere with the attainment or maintenance of an applicable ambient air quality standard. Please attach air dispersion modeling or other documents that will demonstrate the new source or modification will not prevent or interfere with the attainment or maintenance of an applicable ambient air quality standard. Has air dispersion modeling been conducted (please check one)? X Yes No
If air dispersion modeling has been conducted, please attach a copy of the report to this application unless the Department has a copy already.
C. COMPLIANCE PLAN If it is anticipated that a permitted unit will not be operating in compliance at the time of permit issuance, a proposed compliance plan shall be included with the application. The proposed compliance plan shall include a narrative description of the following: 1. The requirements (i.e., statutes, air quality rules, permit conditions, etc.) the source is not in
compliance with at the time of submittal of this application or permit issuance; 2. How the facility intends to bring the unit(s) into compliance; and 3. A compliance schedule for when the source will achieve compliance with such requirements; The compliance schedule must include a statement that progress reports will be submitted at least once every six months and must be at least as stringent as that contained in any judicial consent decree or administrative order to which the applicant is subject. D. MAPS For stationary sources only, please enclose a map or a drawing showing roadways, location of plant and the nearest residents in each direction from the source. Include other structures, which may be affected.

Title V (Part 70) Permit Application From Page 3 of 6
E. AIR QUALITY EMISSIONS SUMMARY If air quality emissions are available, please complete the following table:
Actual Potential Controlled Potential Uncontrolled Pollutant (tons per year) (tons per year) (tons per year)
Particulate See Table 3-15 Sulfur Dioxide See Table 3-15 Nitrogen Oxide See Table 3-15 Carbon Monoxide See Table 3-15 Volatile Organic Compounds See Table 3-15 Hazardous Air Pollutants (if applicable) See Table 3-18
Remember that potential emissions are calculated assuming that the permitted unit is operated 24 hours per day, 7 days per week, 52 weeks per year at maximum design capacity. Attach all calculations, MSDS sheets for all products containing volatile organic compounds and/or hazardous air pollutants, and other supporting documentation. Please contact the Department if assistance is needed for calculating emissions for the permitted units such as emission factors, clarifying what potential emissions are, efficiency for control equipment, etc.
F. ADDITIONAL FORMS 1. The following forms must be completed for each piece of specific equipment at the facility and
submitted with this form:
Boiler Incinerator Kiln Dryer Miscellaneous Process Paint Booth Storage Tank
2. The following forms must be completed for each piece of specific air control equipment at the facility
and submitted with this form:
Baghouse Cyclone Electrostatic Precipitator Miscellaneous Control Thermo Oxidizer Wet Scrubber
3. A list of insignificant activities must be identified in this application. The insignificant activity form
must be completed and submitted along with this application.

Title V (Part 70) Permit Application From Page 4 of 6
G. CERTIFICATION OF COMPLIANCE I certify the following: 1. The methods such as monitoring, record keeping, reporting, and stack test performance results
described within this application shall be used to determine continuous or intermittent compliance;
2. A compliance certification document will be submitted to the Department at least annually or at other times designated by the Department for the duration of the permit;
3. The source is in compliance and will continue to demonstrate compliance with all applicable requirements, except for those designated in the attached compliance plan (if applicable); and
4. This application is submitted in accordance with the provisions of the South Dakota Codified Laws 34A-1 and Administrative Rules of South Dakota 74:36. To the best of my knowledge, after reasonable inquiry, the statements and information contained in the application and supporting documents are true, accurate, and complete. In accordance with South Dakota Codified Laws 1-40-27, I have also enclosed a completed Certification of Applicant form.
Signature:
Print Name: Date
Responsible Official
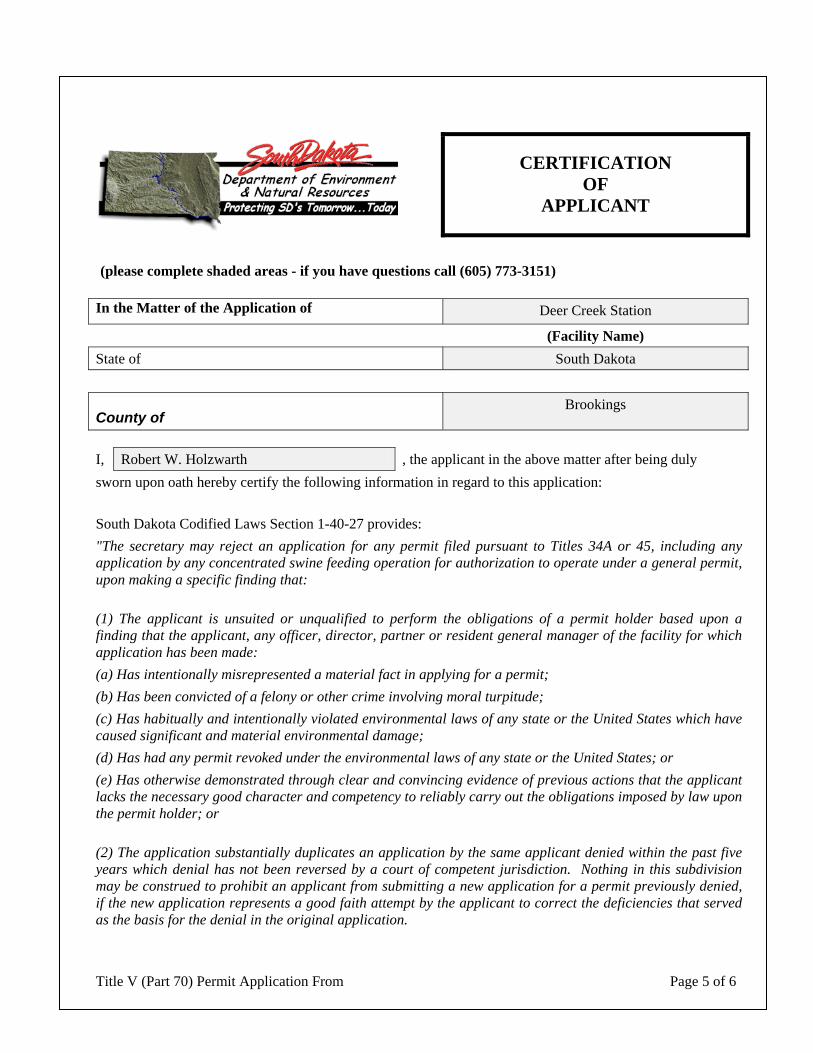
Title V (Part 70) Permit Application From Page 5 of 6
CERTIFICATION
OF APPLICANT
(please complete shaded areas - if you have questions call (605) 773-3151)
In the Matter of the Application of Deer Creek Station
(Facility Name) State of South Dakota
County of Brookings
I, Robert W. Holzwarth , the applicant in the above matter after being duly sworn upon oath hereby certify the following information in regard to this application: South Dakota Codified Laws Section 1-40-27 provides: "The secretary may reject an application for any permit filed pursuant to Titles 34A or 45, including any application by any concentrated swine feeding operation for authorization to operate under a general permit, upon making a specific finding that:
(1) The applicant is unsuited or unqualified to perform the obligations of a permit holder based upon a finding that the applicant, any officer, director, partner or resident general manager of the facility for which application has been made: (a) Has intentionally misrepresented a material fact in applying for a permit; (b) Has been convicted of a felony or other crime involving moral turpitude; (c) Has habitually and intentionally violated environmental laws of any state or the United States which have caused significant and material environmental damage; (d) Has had any permit revoked under the environmental laws of any state or the United States; or (e) Has otherwise demonstrated through clear and convincing evidence of previous actions that the applicant lacks the necessary good character and competency to reliably carry out the obligations imposed by law upon the permit holder; or (2) The application substantially duplicates an application by the same applicant denied within the past five years which denial has not been reversed by a court of competent jurisdiction. Nothing in this subdivision may be construed to prohibit an applicant from submitting a new application for a permit previously denied, if the new application represents a good faith attempt by the applicant to correct the deficiencies that served as the basis for the denial in the original application.

Title V (Part 70) Permit Application From Page 6 of 6
All applications filed pursuant to Titles 34A and 45 shall include a certification, sworn to under oath and signed by the applicant, that he is not disqualified by reason of this section from obtaining a permit. In the absence of evidence to the contrary, that certification shall constitute a prima facie showing of the suitability and qualification of the applicant. If at any point in the application review, recommendation or hearing process, the secretary finds the applicant has intentionally made any material misrepresentation of fact in regard to this certification, consideration of the application may be suspended and the application may be rejected as provided for under this section. Applications rejected pursuant to this section constitute final agency action upon that application and may be appealed to circuit court as provided for under chapter 1-26."
Pursuant to SDCL 1-40-27, I certify that I have read the forgoing provision of state law, and that I am not disqualified by reason of that provision from obtaining the permit for which application has been made.
Dated this , day of
, 20
Applicant (signature)
Subscribed and sworn before me this: Dated this , day of , 20
Notary Public (signature) My commission expires:
(SEAL)
PLEASE ATTACH SHEET DISCLOSING ALL FACTS PERTAINING TO SDCL 1-40-27 (1) (a) THROUGH (e).
ALL VIOLATIONS MUST BE DISCLOSED, BUT WILL NOT AUTOMATICALLY RESULT IN THE REJECTION OF AN APPLICATION.

Boiler Turbine or Furnace Application Form Page 1 of 2
Air Quality Permit Application Form
Boiler Turbine or Furnace
This form is to be submitted, if necessary, along with the Title V (Part 70) Operating Permit or Minor Operating Permit.
(please complete shaded areas) 1. Facility identification (i.e., Boiler #1, Unit #1, etc): CT/HRSG #1 – EP01 2. Manufacturer: TBD Manufacture date: TBD 3. Model number: F-class (or equivalent) 4. Type (i.e., steam boiler, simple cycle combustion turbine, generator, etc.) Combustion Turbine 5. Maximum designed operating rate (name plate): CT: 1713 (LHV)
Duct Burners: 615.2 (LHV) million Btus per hour heat input
or horsepower with boiler efficiency: or kilowatts with boiler efficiency:
6. Check the appropriate box(es) for primary and secondary fuels: X Natural gas Propane Distillate oil Sulfur content Weight percent Residual oil Sulfur content Weight percent Bituminous Coal Subbituminous Coal Lignite Coal
Coal sulfur content Weight percent Coal ash content Weight percent Other (please specify)
7. Has a stack test been conducted (check appropriate box)? Yes X No If a stack test has been conducted, please attach a copy of the most recent stack test report to this application. If the Department already has a copy of the most recent stack test, please specify the date of most recent stack test. Date of most recent stack test: NA Control Equipment: If applicable, types of air pollution control equipment (Examples: baghouse, cyclone, wet scrubber, electrostatic precipitator, thermal oxidizer, miscellaneous control device, etc.). Low NOx Burners and Selective Catalytic Reduction (SCR)
Please complete the appropriate air quality permit application form for each type of control equipment that controls air emissions from this operation.

Boiler Turbine or Furnace Application Form Page 2 of 2
Stack Information: If this application is a renewal, contact the air program. We may have this information. X- Coordinate or Easting: feet 696,451 meters Y- Coordinate or Northing: feet 4,918,630 meters Base Elevation of Stack: 1,850.5 feet 564.0 meters Stack Height: 150 feet 45.72 meters Exit Stack Diameter 19.0 feet 5.79 meters Exit Stack Temperature 200 degrees Fahrenheit Exit Stack Velocity and/or Flow Rate: Velocity: 62.6 feet per second 19.1 meters per second
and/or Flow Rate: 1,065,424 actual cubic feet per minute 502.8 actual cubic meters per second
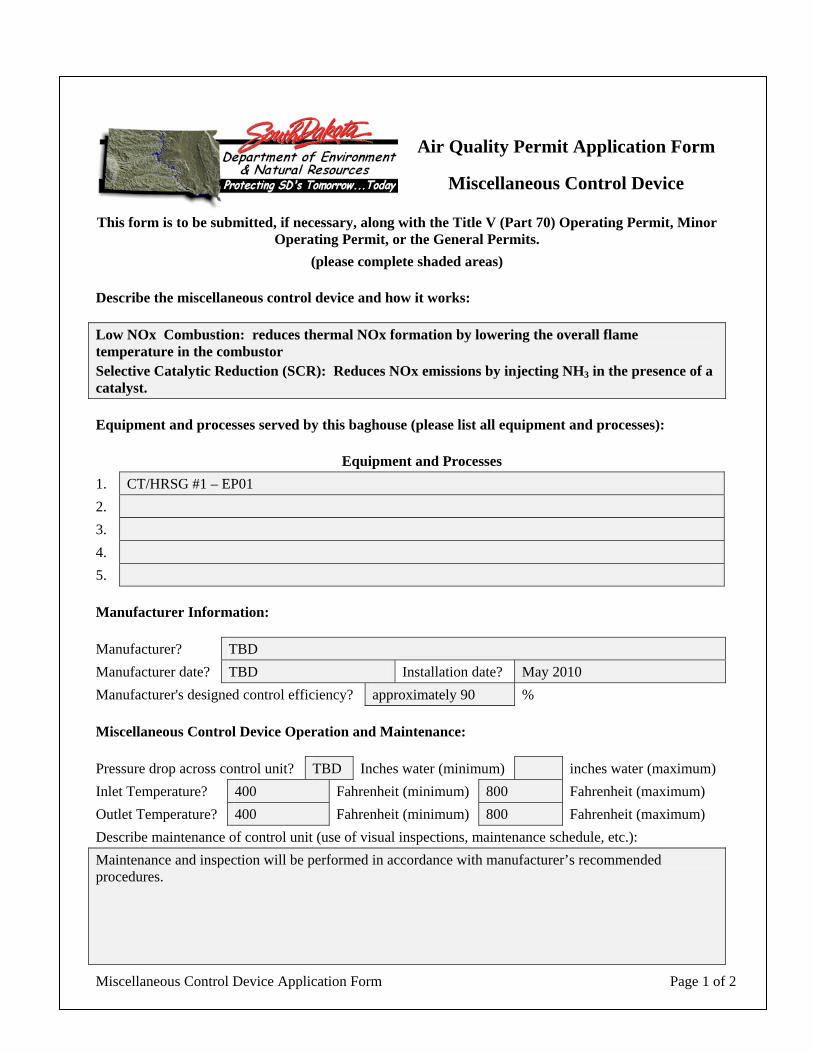
Miscellaneous Control Device Application Form Page 1 of 2
Air Quality Permit Application Form
Miscellaneous Control Device
This form is to be submitted, if necessary, along with the Title V (Part 70) Operating Permit, Minor Operating Permit, or the General Permits.
(please complete shaded areas) Describe the miscellaneous control device and how it works: Low NOx Combustion: reduces thermal NOx formation by lowering the overall flame temperature in the combustor Selective Catalytic Reduction (SCR): Reduces NOx emissions by injecting NH3 in the presence of a catalyst. Equipment and processes served by this baghouse (please list all equipment and processes): Equipment and Processes 1. CT/HRSG #1 – EP01 2. 3. 4. 5. Manufacturer Information: Manufacturer? TBD Manufacturer date? TBD Installation date? May 2010 Manufacturer's designed control efficiency? approximately 90 % Miscellaneous Control Device Operation and Maintenance: Pressure drop across control unit? TBD Inches water (minimum) inches water (maximum) Inlet Temperature? 400 Fahrenheit (minimum) 800 Fahrenheit (maximum) Outlet Temperature? 400 Fahrenheit (minimum) 800 Fahrenheit (maximum) Describe maintenance of control unit (use of visual inspections, maintenance schedule, etc.): Maintenance and inspection will be performed in accordance with manufacturer’s recommended procedures.
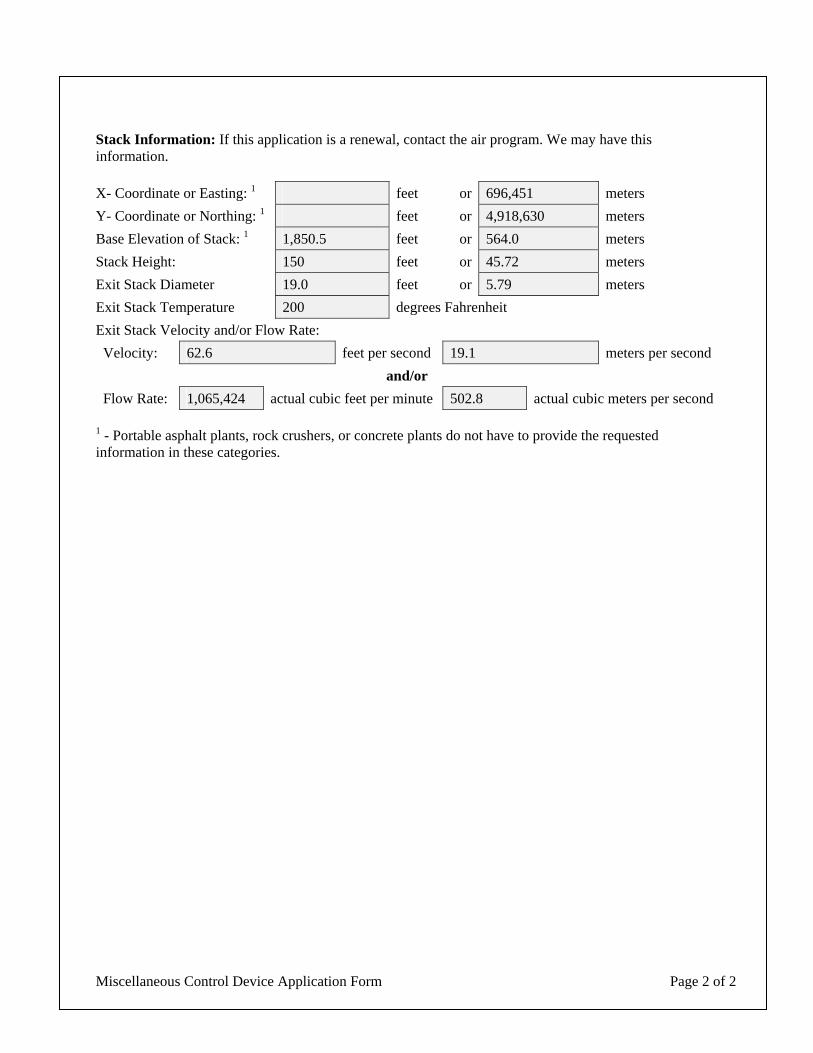
Miscellaneous Control Device Application Form Page 2 of 2
Stack Information: If this application is a renewal, contact the air program. We may have this information. X- Coordinate or Easting: 1 feet or 696,451 meters Y- Coordinate or Northing: 1 feet or 4,918,630 meters Base Elevation of Stack: 1 1,850.5 feet or 564.0 meters Stack Height: 150 feet or 45.72 meters Exit Stack Diameter 19.0 feet or 5.79 meters Exit Stack Temperature 200 degrees Fahrenheit Exit Stack Velocity and/or Flow Rate: Velocity: 62.6 feet per second 19.1 meters per second
and/or Flow Rate: 1,065,424 actual cubic feet per minute 502.8 actual cubic meters per second 1 - Portable asphalt plants, rock crushers, or concrete plants do not have to provide the requested information in these categories.

Misc Process Form Page 1 of 2
Air Quality Permit Application Form
Miscellaneous Process
This form is to be submitted, if necessary, along with the Title V (Part 70) Operating Permit or Minor Operating Permit.
(please complete shaded areas) 1. Facility identification (i.e., Boiler #1, Unit #1, etc): Emergency Diesel Generator – EP02 2. Manufacturer: TBD Manufacture date: TBD 3. Model number: TBD 4. Type (i.e., steam boiler, simple cycle combustion turbine, generator, etc.) Emergency Diesel Generator 5. Maximum designed operating rate (name plate): million Btus per hour heat input
or horsepower or 2000 kilowatts
6. Check the appropriate box(es) for primary and secondary fuels: Natural gas Propane X Distillate oil Sulfur content 0.05 Weight percent Residual oil Sulfur content Weight percent Bituminous Coal Subbituminous Coal Lignite Coal
Coal sulfur content Weight percent Coal ash content Weight percent Other (please specify)
7. Has a stack test been conducted (check appropriate box)? Yes X No If a stack test has been conducted, please attach a copy of the most recent stack test report to this application. If the Department already has a copy of the most recent stack test, please specify the date of most recent stack test. Date of most recent stack test: NA Control Equipment: If applicable, types of air pollution control equipment (Examples: baghouse, cyclone, wet scrubber, electrostatic precipitator, thermal oxidizer, miscellaneous control device, etc.). NA
Please complete the appropriate air quality permit application form for each type of control equipment that controls air emissions from this operation.
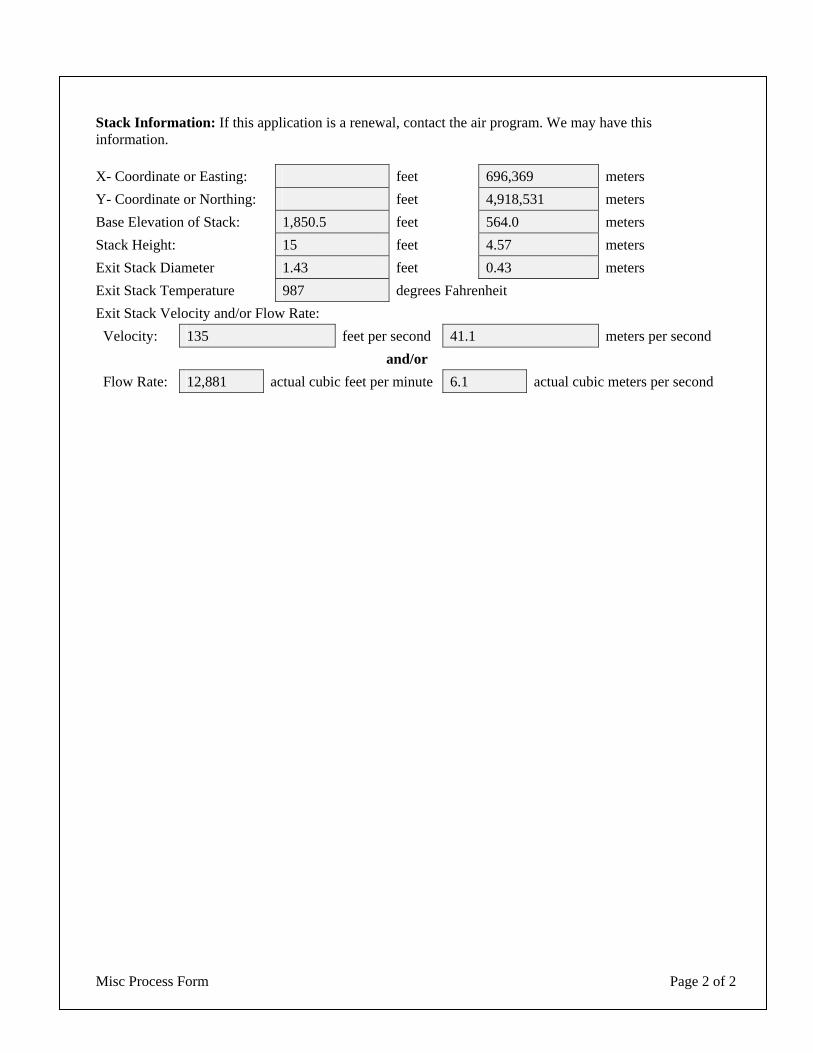
Misc Process Form Page 2 of 2
Stack Information: If this application is a renewal, contact the air program. We may have this information. X- Coordinate or Easting: feet 696,369 meters Y- Coordinate or Northing: feet 4,918,531 meters Base Elevation of Stack: 1,850.5 feet 564.0 meters Stack Height: 15 feet 4.57 meters Exit Stack Diameter 1.43 feet 0.43 meters Exit Stack Temperature 987 degrees Fahrenheit Exit Stack Velocity and/or Flow Rate: Velocity: 135 feet per second 41.1 meters per second
and/or Flow Rate: 12,881 actual cubic feet per minute 6.1 actual cubic meters per second
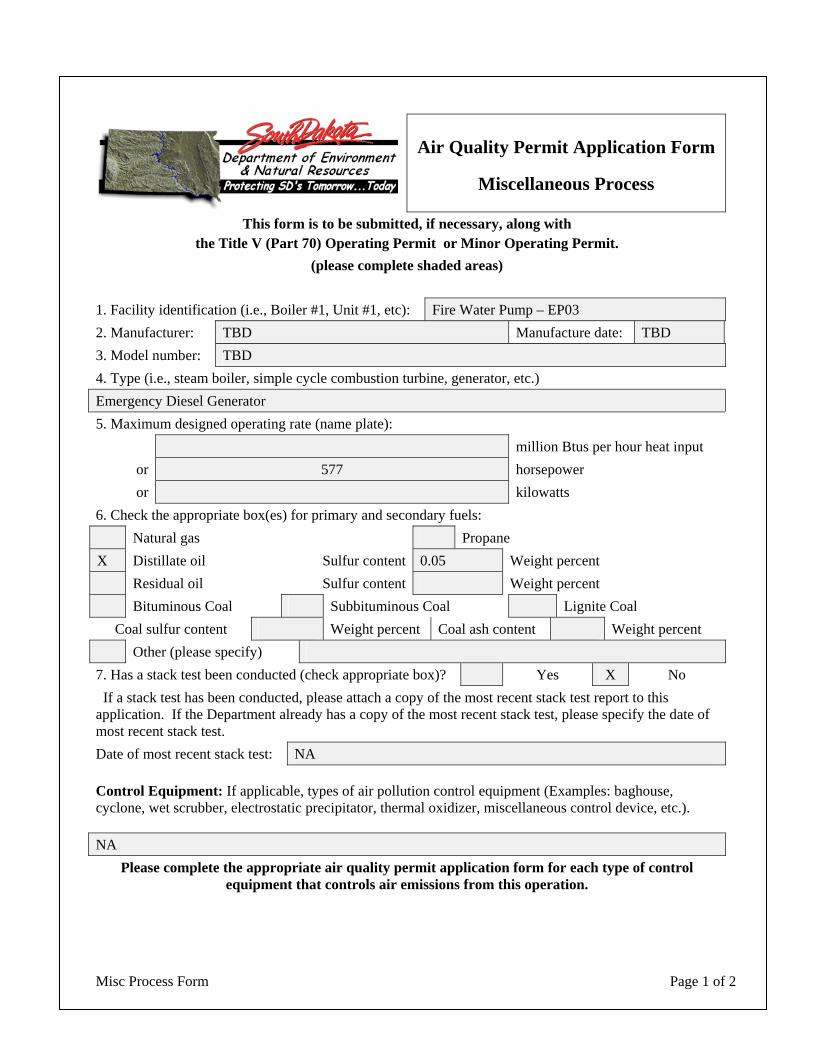
Misc Process Form Page 1 of 2
Air Quality Permit Application Form
Miscellaneous Process
This form is to be submitted, if necessary, along with the Title V (Part 70) Operating Permit or Minor Operating Permit.
(please complete shaded areas) 1. Facility identification (i.e., Boiler #1, Unit #1, etc): Fire Water Pump – EP03 2. Manufacturer: TBD Manufacture date: TBD 3. Model number: TBD 4. Type (i.e., steam boiler, simple cycle combustion turbine, generator, etc.) Emergency Diesel Generator 5. Maximum designed operating rate (name plate): million Btus per hour heat input
or 577 horsepower or kilowatts
6. Check the appropriate box(es) for primary and secondary fuels: Natural gas Propane X Distillate oil Sulfur content 0.05 Weight percent Residual oil Sulfur content Weight percent Bituminous Coal Subbituminous Coal Lignite Coal
Coal sulfur content Weight percent Coal ash content Weight percent Other (please specify)
7. Has a stack test been conducted (check appropriate box)? Yes X No If a stack test has been conducted, please attach a copy of the most recent stack test report to this application. If the Department already has a copy of the most recent stack test, please specify the date of most recent stack test. Date of most recent stack test: NA Control Equipment: If applicable, types of air pollution control equipment (Examples: baghouse, cyclone, wet scrubber, electrostatic precipitator, thermal oxidizer, miscellaneous control device, etc.). NA
Please complete the appropriate air quality permit application form for each type of control equipment that controls air emissions from this operation.

Misc Process Form Page 2 of 2
Stack Information: If this application is a renewal, contact the air program. We may have this information. X- Coordinate or Easting: feet 696,494 meters Y- Coordinate or Northing: feet 4,918,705 meters Base Elevation of Stack: 1,850.5 feet 564.0 meters Stack Height: 30 feet 9.14 meters Exit Stack Diameter 0.61 feet 0.18 meters Exit Stack Temperature 845 degrees Fahrenheit Exit Stack Velocity and/or Flow Rate: Velocity: 135 feet per second 41.1 meters per second
and/or Flow Rate: 2,339 actual cubic feet per minute 1.1 actual cubic meters per second

Misc Process Form Page 1 of 2
Air Quality Permit Application Form
Miscellaneous Process
This form is to be submitted, if necessary, along with the Title V (Part 70) Operating Permit or Minor Operating Permit.
(please complete shaded areas) 1. Facility identification (i.e., Boiler #1, Unit #1, etc): Emergency Inlet Air Heater – EP04 2. Manufacturer: TBD Manufacture date: TBD 3. Model number: TBD 4. Type (i.e., steam boiler, simple cycle combustion turbine, generator, etc.) Emergency Diesel Generator 5. Maximum designed operating rate (name plate): 25.0 million Btus per hour heat input
or horsepower or kilowatts
6. Check the appropriate box(es) for primary and secondary fuels: X Natural gas Propane Distillate oil Sulfur content Weight percent Residual oil Sulfur content Weight percent Bituminous Coal Subbituminous Coal Lignite Coal
Coal sulfur content Weight percent Coal ash content Weight percent Other (please specify)
7. Has a stack test been conducted (check appropriate box)? Yes X No If a stack test has been conducted, please attach a copy of the most recent stack test report to this application. If the Department already has a copy of the most recent stack test, please specify the date of most recent stack test. Date of most recent stack test: NA Control Equipment: If applicable, types of air pollution control equipment (Examples: baghouse, cyclone, wet scrubber, electrostatic precipitator, thermal oxidizer, miscellaneous control device, etc.). NA
Please complete the appropriate air quality permit application form for each type of control equipment that controls air emissions from this operation.

Misc Process Form Page 2 of 2
Stack Information: If this application is a renewal, contact the air program. We may have this information. X- Coordinate or Easting: feet 696,451 meters Y- Coordinate or Northing: feet 4,918,633 meters Base Elevation of Stack: 1,850.5 feet 564.0 meters Stack Height: 30 feet 9.14 meters Exit Stack Diameter 1.55 feet 0.47 meters Exit Stack Temperature 300 degrees Fahrenheit Exit Stack Velocity and/or Flow Rate: Velocity: 85 feet per second 25.9 meters per second
and/or Flow Rate: 7,605 actual cubic feet per minute 3.6 actual cubic meters per second

Storage Tanks Application Form Page 1 of 1
Air Quality Permit Application Form
Storage Tanks
This form is to be submitted, if necessary, along with the Title V (Part 70) Operating Permit or Minor Operating Permit.
(please complete shaded areas) 1. Facility identification (i.e., Tank #1, Unit #1, etc)? Emergency Diesel Generator Fuel Tank – TK01 2. Manufacturer? TBD 3. Construction date? TBD 4. Model number? TBD 5. Check appropriate box: X Aboveground Underground 6. Maximum designed storage capacity? 3000 gallons 7. Check the appropriate box for the type of liquid stored in the storage tank: X Distillate oil Residual oil Ethanol JP8 Jet Fuel
Other (please specify) 8. Maximum true vapor pressure of liquid? millimeters mercury
or 0.009 pounds per square inch absolute or kilo Pascal
9. Have plans and specifications been submitted to the Department? Yes X* No If no, please attach a copy of the plans and design specifications to the application.
10. If applicable, types of air pollution control equipment (i.e., wet scrubber, thermal oxidizer, etc.): NA
Please complete the appropriate air quality permit application form for each type of control equipment that controls air emissions from this operation.
*Plans and design specifications will be submitted to the Department to supplement the permit application when they become available.

Storage Tanks Application Form Page 1 of 1
Air Quality Permit Application Form
Storage Tanks
This form is to be submitted, if necessary, along with the Title V (Part 70) Operating Permit or Minor Operating Permit.
(please complete shaded areas) 1. Facility identification (i.e., Tank #1, Unit #1, etc)? Fire Water Pump Fuel Tank – TK02 2. Manufacturer? TBD 3. Construction date? TBD 4. Model number? TBD 5. Check appropriate box: X Aboveground Underground 6. Maximum designed storage capacity? 700 gallons 7. Check the appropriate box for the type of liquid stored in the storage tank: X Distillate oil Residual oil Ethanol JP8 Jet Fuel
Other (please specify) 8. Maximum true vapor pressure of liquid? millimeters mercury
or 0.009 pounds per square inch absolute or kilo Pascal
9. Have plans and specifications been submitted to the Department? Yes X* No If no, please attach a copy of the plans and design specifications to the application.
10. If applicable, types of air pollution control equipment (i.e., wet scrubber, thermal oxidizer, etc.): NA
Please complete the appropriate air quality permit application form for each type of control equipment that controls air emissions from this operation.
*Plans and design specifications will be submitted to the Department to supplement the permit application when they become available.

Basin Electric Power Cooperative
Deer Creek Station PSD Air Quality Construction Permit Application
Appendix B
Emission Calculations
Prepared by:
Sargent & Lundy, LLC Chicago, Illinois
May 29, 2009

Deer Creek Station PSD Air Quality Construction Permit Application
Appendix B: Emission Calculations
B-1
Appendix C – List of Tables
Table Description
B-1 CT/HRSG Emission Cases and Assumptions
B-2 CT/HRSG Emissions - Full Load Cases with and without Duct Firing
B-3 CT/HRSG Emissions – Part Load Cases
B-4 CT/HRSG Emission Summaries
B-5 Auxiliary Combustion Sources – Cases and Assumptions
B-6 Emergency Diesel Generator – Criteria Pollutant Emissions
B-7 Emergency Diesel Generator – Non-Criteria Pollutant Emissions
B-8 Diesel-Fired Fire Water Pump – Criteria Pollutant Emissions
B-9 Diesel-Fired Fire Water Pump – Non-Criteria Pollutant Emissions
B-10 Emergency Inlet Air Heater – Criteria Pollutant Emissions
B-11 Emergency Inlet Air Heater – Non-Criteria Pollutant Emissions
B-12 CT/HRSG Startup Emission Calculation – Emissions Summary
B-13 CT/HRSG Cold Startup NOx Emission Details
B-14 CT/HRSG Cold Startup CO Emission Details
B-15 CT/HRSG Cold Startup VOC Emission Details
B-16 CT/HRSG Cold Startup PM Emission Details
B-17 CT/HRSG Warm Startup NOx Emission Details
B-18 CT/HRSG Warm Startup CO Emission Details
B-19 CT/HRSG Warm Startup VOC Emission Details
B-20 CT/HRSG Warm Startup PM Emission Details
B-21 CT/HRSG Cold Startup NOx and CO Emission Details
B-22 CT/HRSG Cold Startup VOC and PM Emission Details
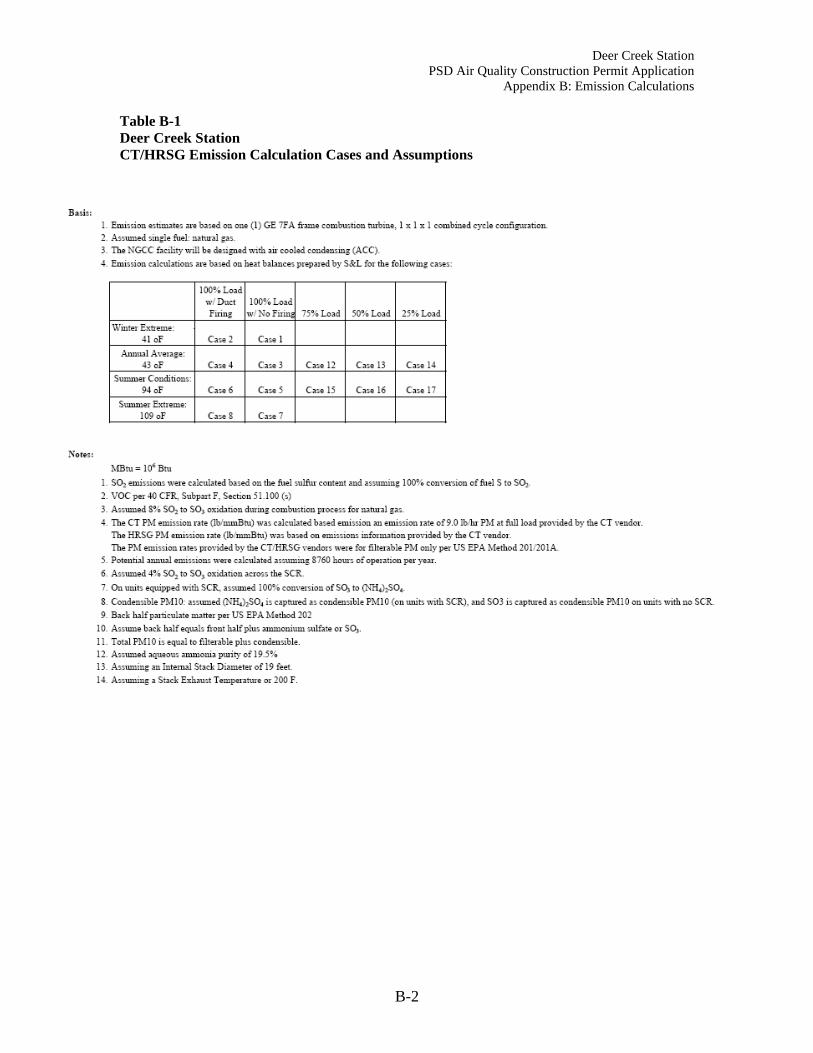
Deer Creek Station PSD Air Quality Construction Permit Application
Appendix B: Emission Calculations
B-2
Table B-1 Deer Creek Station CT/HRSG Emission Calculation Cases and Assumptions

Deer Creek Station PSD Air Quality Construction Permit Application
Appendix B: Emission Calculations
B-3
Table B-2 Deer Creek Station /HRSG Emission Calculations - Full Load Cases with and without Duct Firing

Deer Creek Station PSD Air Quality Construction Permit Application
Appendix B: Emission Calculations
B-4
Table B-2: Full Load Cases with and without Duct Firing - continued

Deer Creek Station PSD Air Quality Construction Permit Application
Appendix B: Emission Calculations
B-5
Table B-2: Full Load Cases with and without Duct Firing - continued
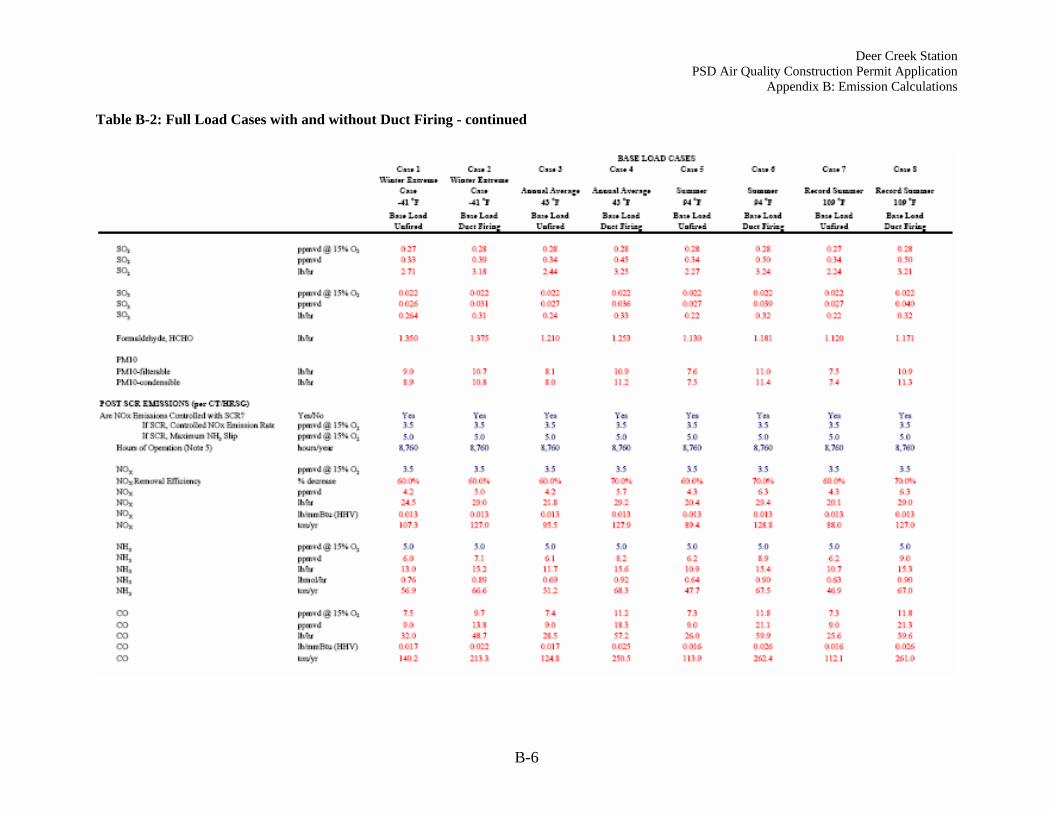
Deer Creek Station PSD Air Quality Construction Permit Application
Appendix B: Emission Calculations
B-6
Table B-2: Full Load Cases with and without Duct Firing - continued

Deer Creek Station PSD Air Quality Construction Permit Application
Appendix B: Emission Calculations
B-7
Table B-2: Full Load Cases with and without Duct Firing - continued
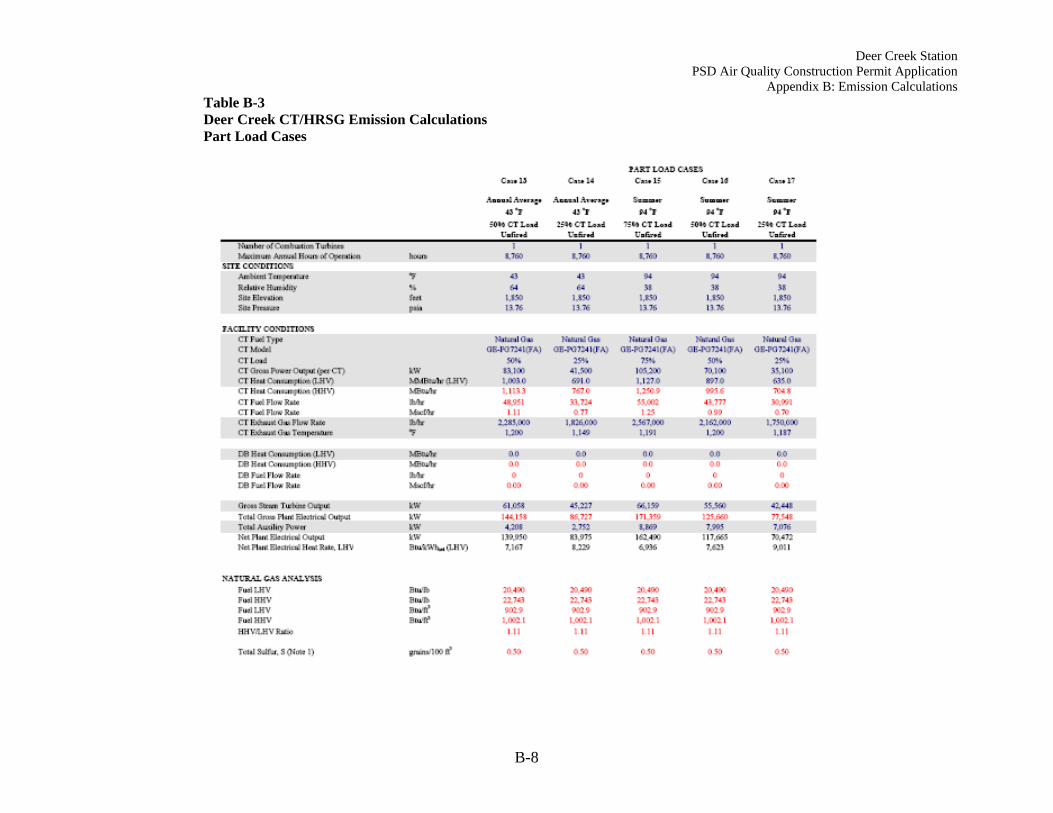
Deer Creek Station PSD Air Quality Construction Permit Application
Appendix B: Emission Calculations
B-8
Table B-3 Deer Creek CT/HRSG Emission Calculations Part Load Cases

Deer Creek Station PSD Air Quality Construction Permit Application
Appendix B: Emission Calculations
B-9
Table B-3: Part Load Cases - continued

Deer Creek Station PSD Air Quality Construction Permit Application
Appendix B: Emission Calculations
B-10
Table B-3: Part Load Cases - continued

Deer Creek Station PSD Air Quality Construction Permit Application
Appendix B: Emission Calculations
B-11
Table B-3: Part Load Cases - continued

Deer Creek Station PSD Air Quality Construction Permit Application
Appendix B: Emission Calculations
B-12
Table B-3: Part Load Cases - continued

Deer Creek Station PSD Air Quality Construction Permit Application
Appendix B: Emission Calculations
B-13
Table B-4 Deer Creek CT/HRSG Emission Calculations Emission Summaries
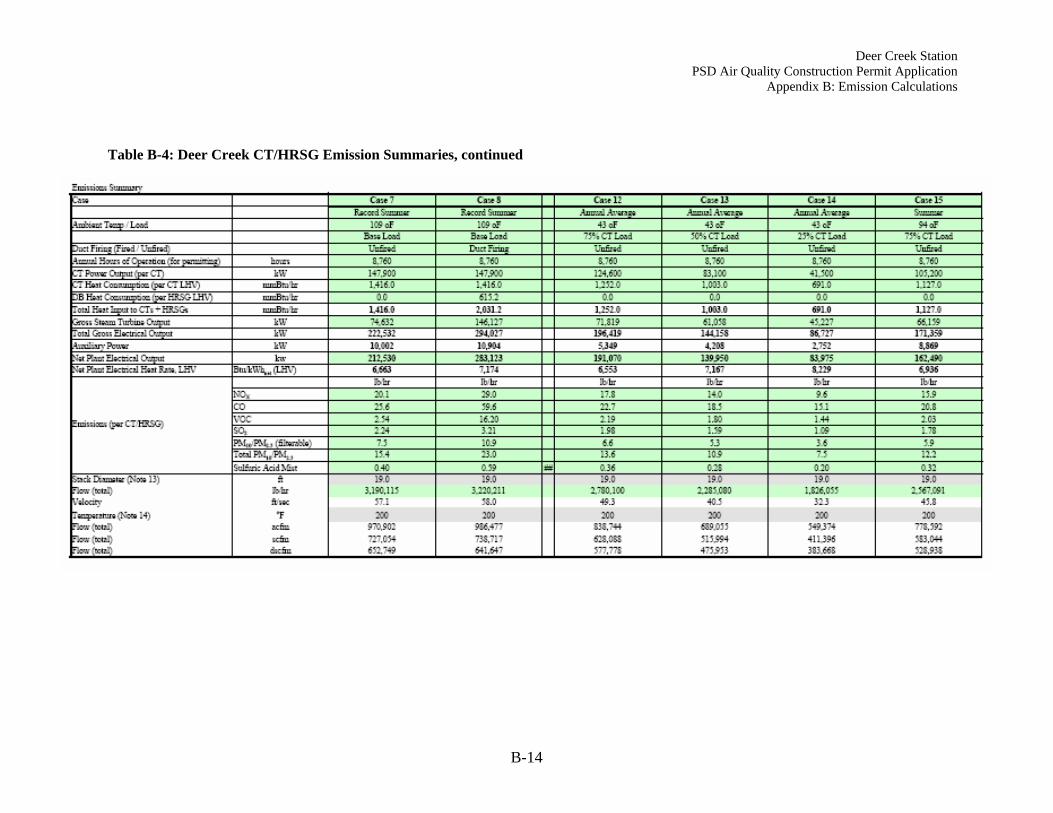
Deer Creek Station PSD Air Quality Construction Permit Application
Appendix B: Emission Calculations
B-14
Table B-4: Deer Creek CT/HRSG Emission Summaries, continued

Deer Creek Station PSD Air Quality Construction Permit Application
Appendix B: Emission Calculations
B-15
Table B-4: Deer Creek CT/HRSG Emission Summaries, continued
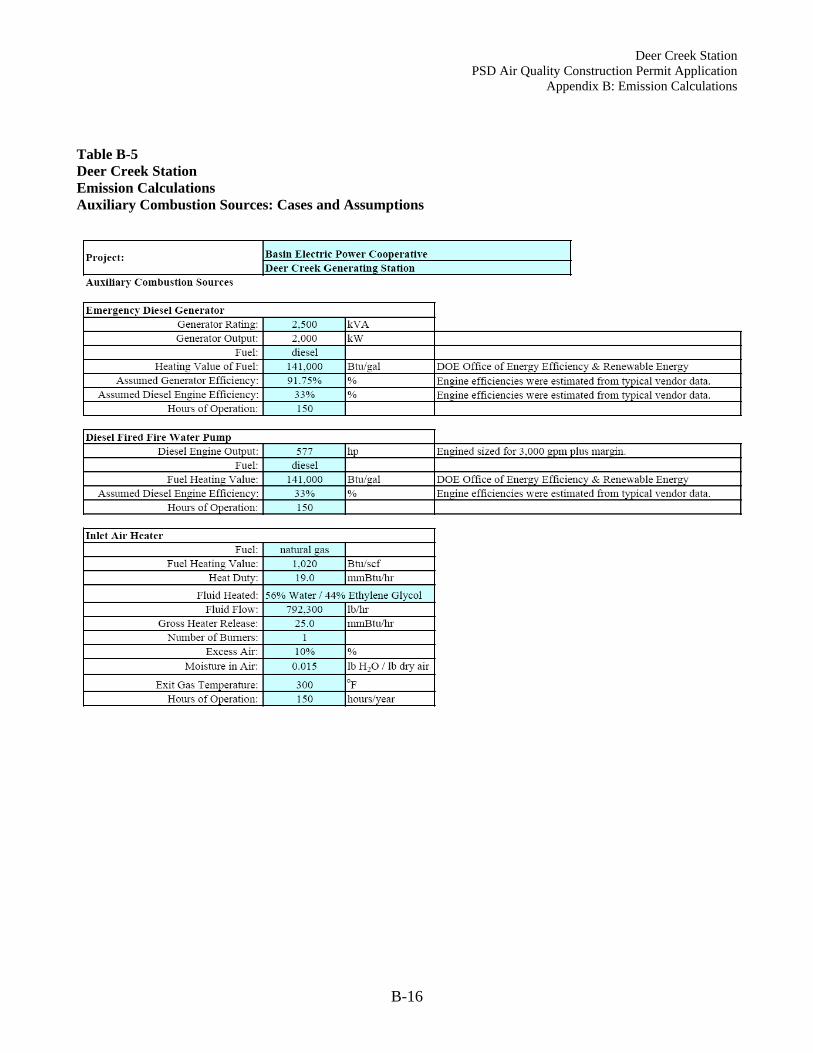
Deer Creek Station PSD Air Quality Construction Permit Application
Appendix B: Emission Calculations
B-16
Table B-5 Deer Creek Station Emission Calculations Auxiliary Combustion Sources: Cases and Assumptions
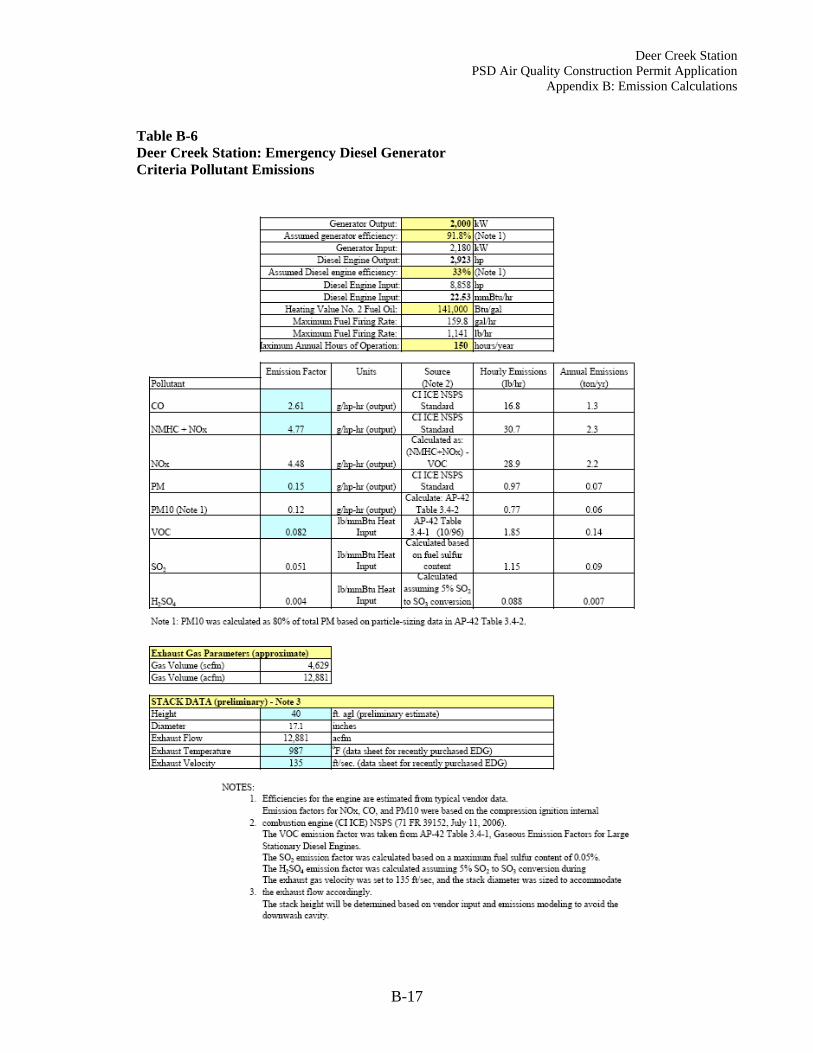
Deer Creek Station PSD Air Quality Construction Permit Application
Appendix B: Emission Calculations
B-17
Table B-6 Deer Creek Station: Emergency Diesel Generator Criteria Pollutant Emissions
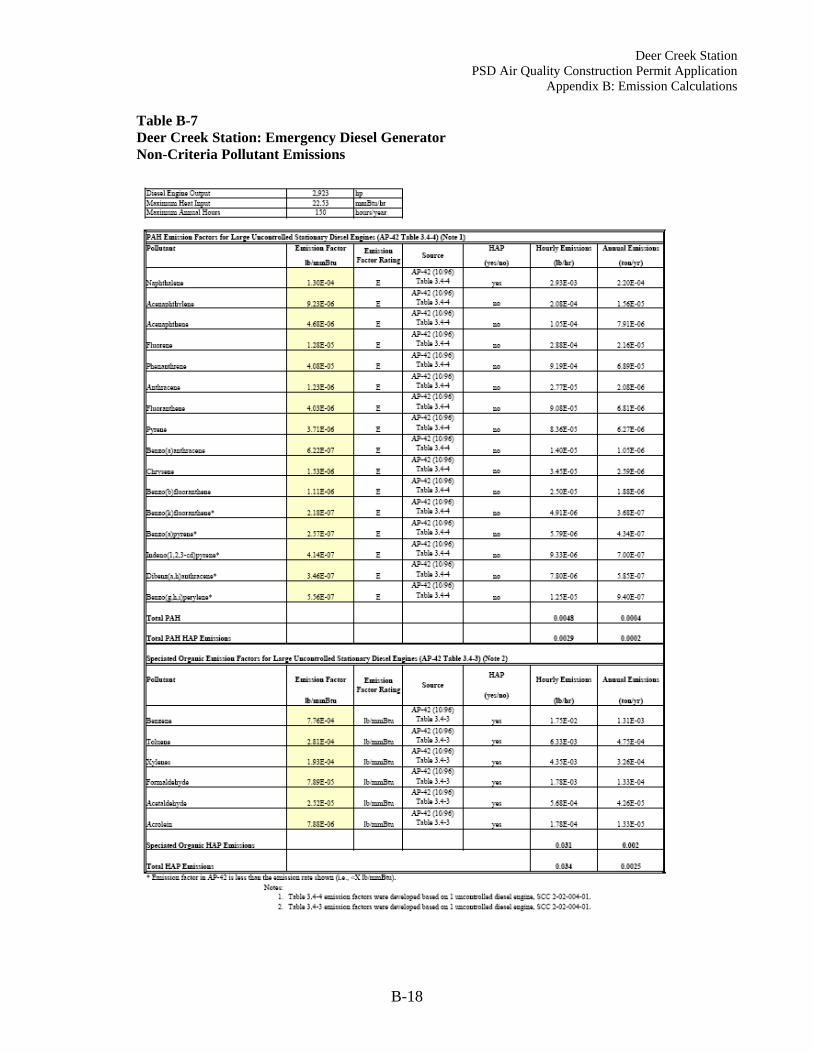
Deer Creek Station PSD Air Quality Construction Permit Application
Appendix B: Emission Calculations
B-18
Table B-7 Deer Creek Station: Emergency Diesel Generator Non-Criteria Pollutant Emissions
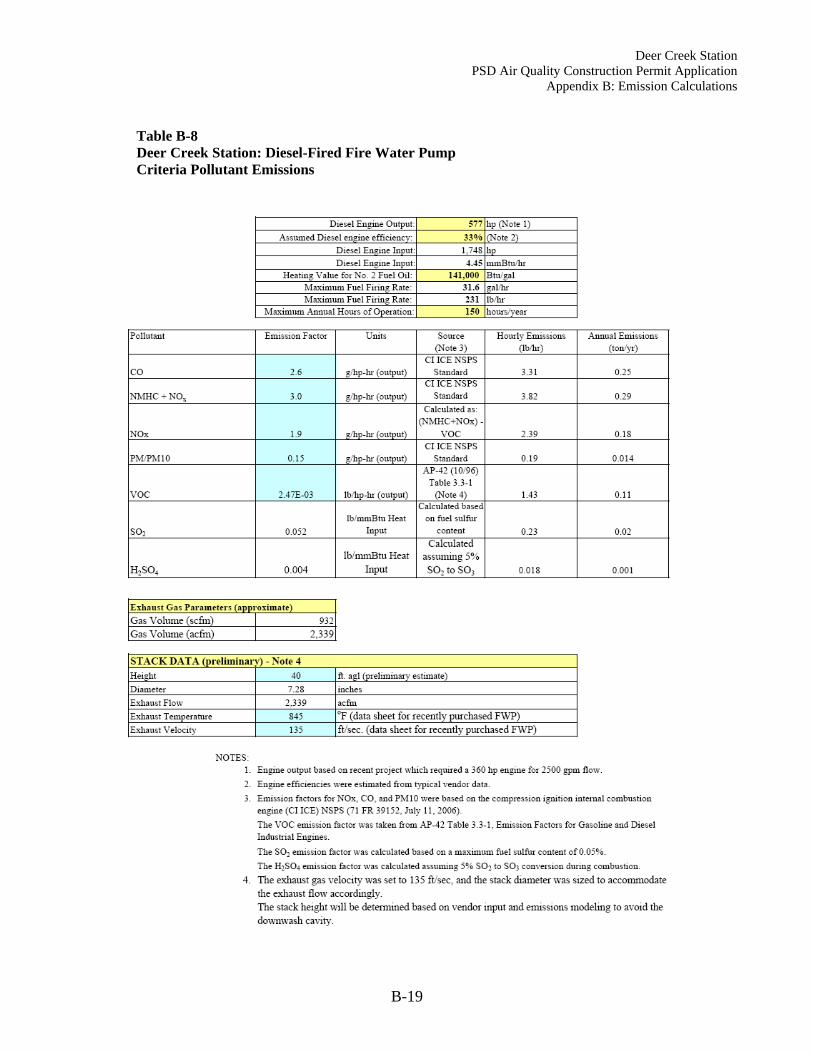
Deer Creek Station PSD Air Quality Construction Permit Application
Appendix B: Emission Calculations
B-19
Table B-8 Deer Creek Station: Diesel-Fired Fire Water Pump Criteria Pollutant Emissions
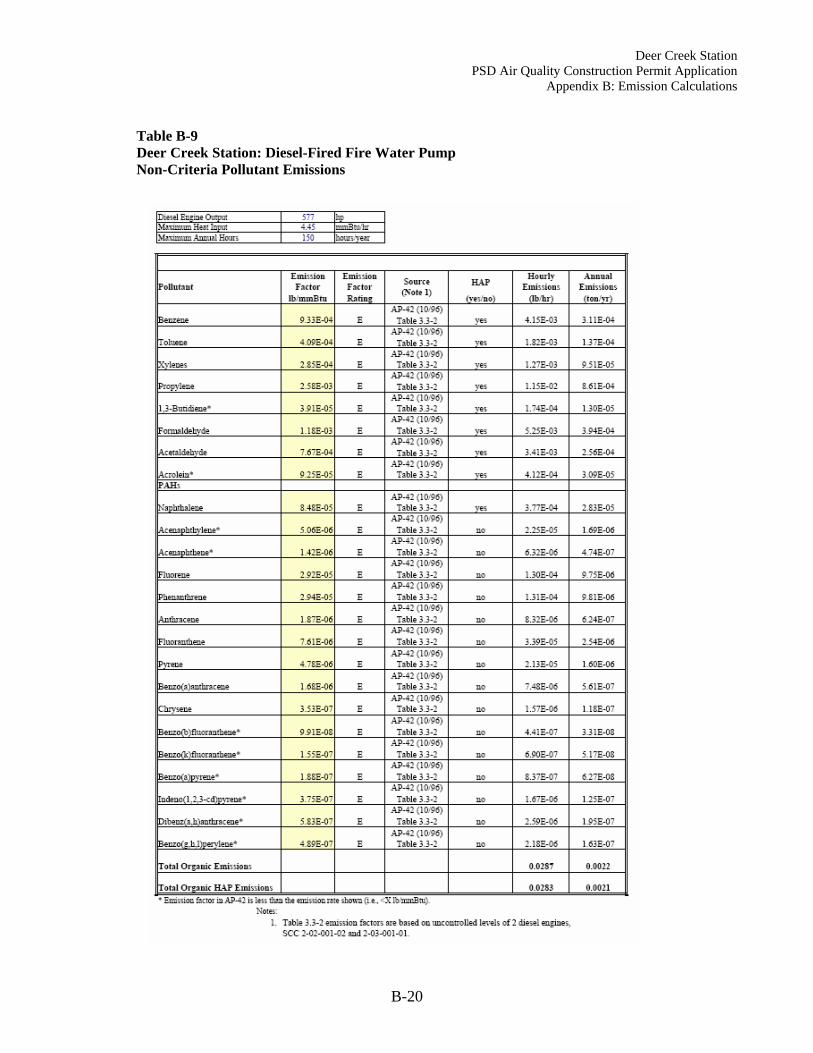
Deer Creek Station PSD Air Quality Construction Permit Application
Appendix B: Emission Calculations
B-20
Table B-9 Deer Creek Station: Diesel-Fired Fire Water Pump Non-Criteria Pollutant Emissions
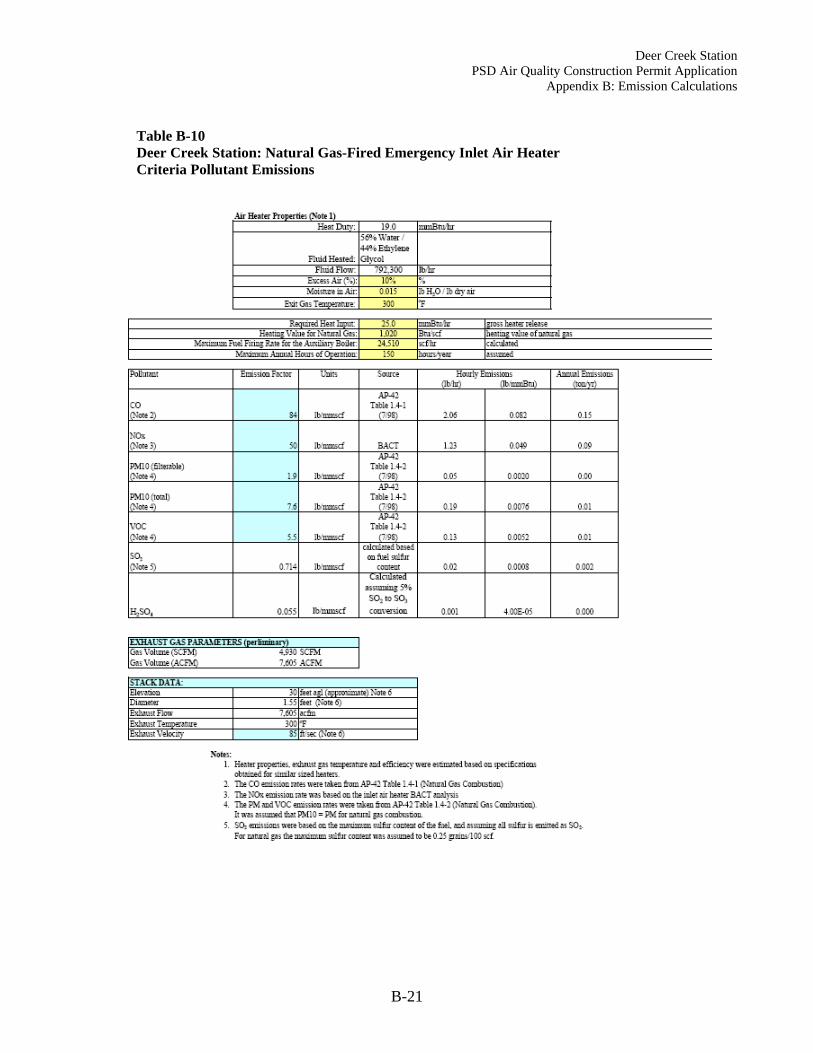
Deer Creek Station PSD Air Quality Construction Permit Application
Appendix B: Emission Calculations
B-21
Table B-10 Deer Creek Station: Natural Gas-Fired Emergency Inlet Air Heater Criteria Pollutant Emissions

Deer Creek Station PSD Air Quality Construction Permit Application
Appendix B: Emission Calculations
B-22
Table B-11 Deer Creek Station: Natural Gas-Fired Emergency Inlet Air Heater Non-Criteria Pollutant Emissions
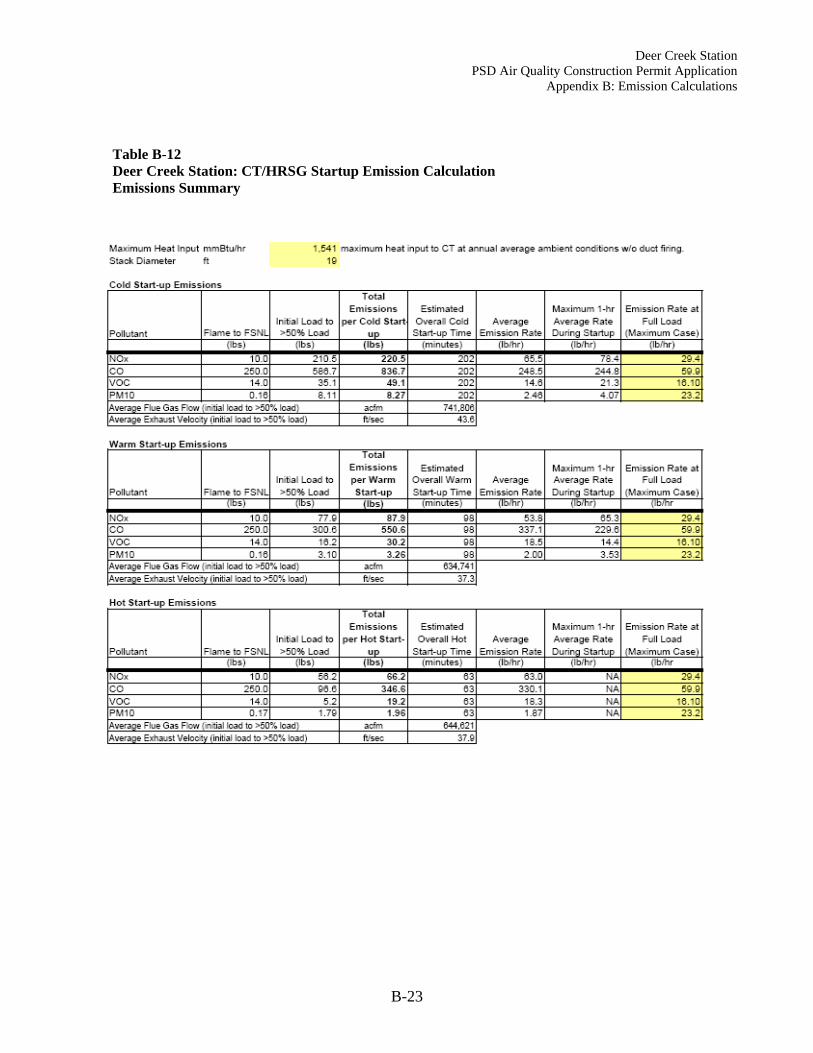
Deer Creek Station PSD Air Quality Construction Permit Application
Appendix B: Emission Calculations
B-23
Table B-12 Deer Creek Station: CT/HRSG Startup Emission Calculation Emissions Summary
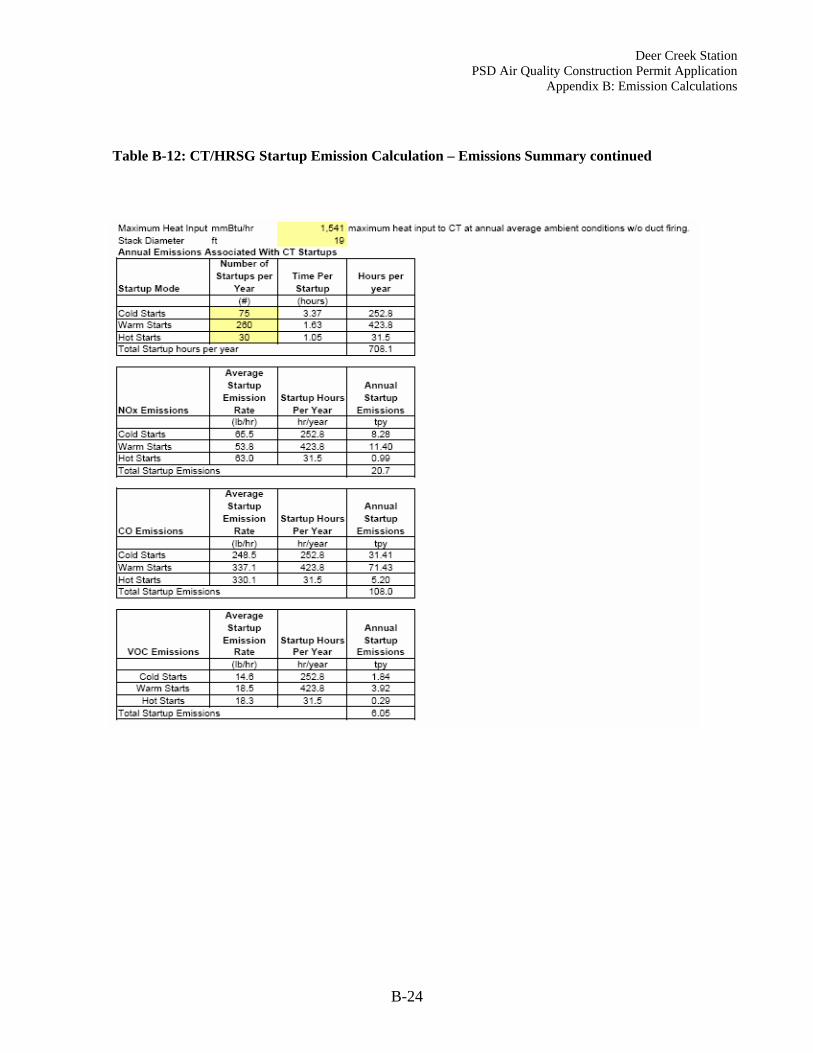
Deer Creek Station PSD Air Quality Construction Permit Application
Appendix B: Emission Calculations
B-24
Table B-12: CT/HRSG Startup Emission Calculation – Emissions Summary continued

Deer Creek Station PSD Air Quality Construction Permit Application
Appendix B: Emission Calculations
B-25
Table B-13 Deer Creek Station: CT/HRSG Cold Startup NOx Emission Details

Deer Creek Station PSD Air Quality Construction Permit Application
Appendix B: Emission Calculations
B-26
Table B-13: Cold Startup NOx Emission Details, continued
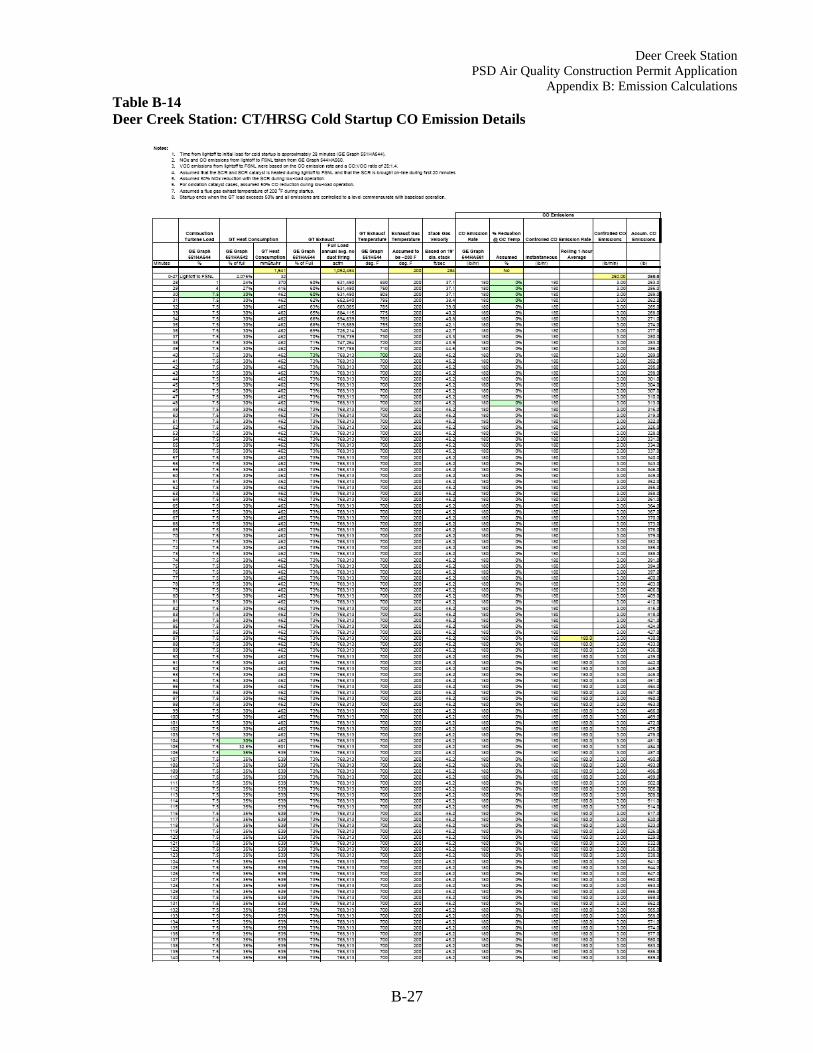
Deer Creek Station PSD Air Quality Construction Permit Application
Appendix B: Emission Calculations
B-27
Table B-14 Deer Creek Station: CT/HRSG Cold Startup CO Emission Details

Deer Creek Station PSD Air Quality Construction Permit Application
Appendix B: Emission Calculations
B-28
Table B-14: Cold Startup CO Emission Details, continued
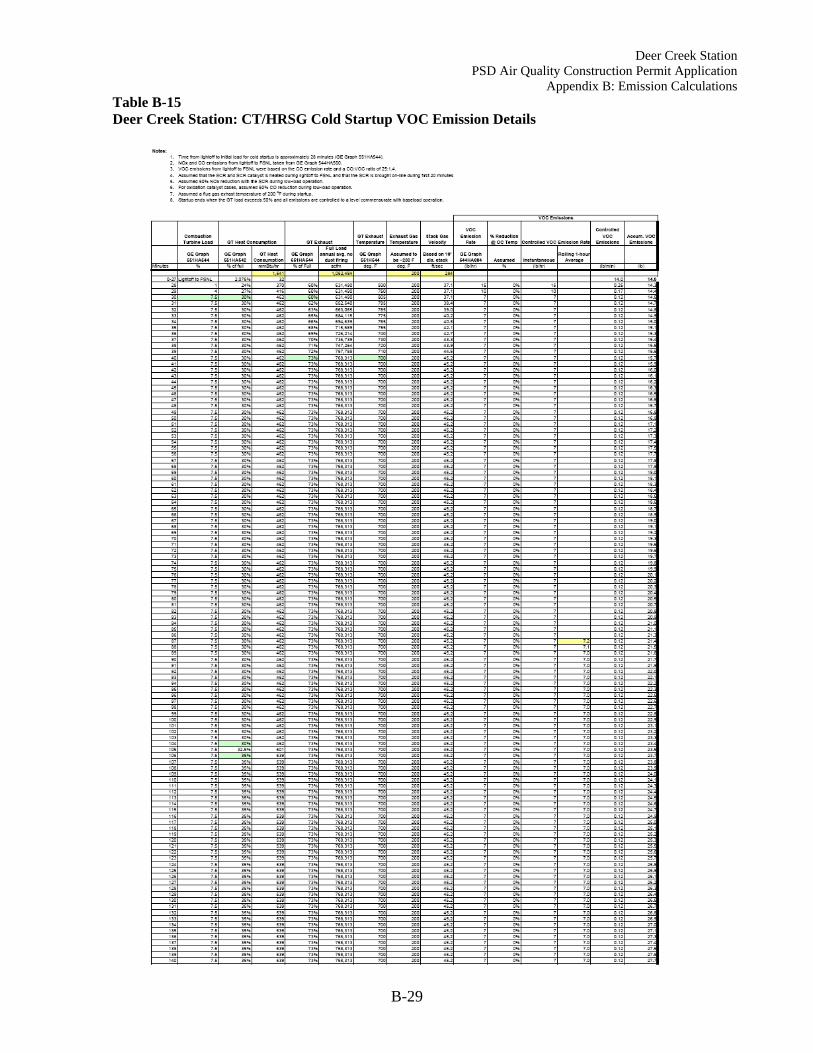
Deer Creek Station PSD Air Quality Construction Permit Application
Appendix B: Emission Calculations
B-29
Table B-15 Deer Creek Station: CT/HRSG Cold Startup VOC Emission Details

Deer Creek Station PSD Air Quality Construction Permit Application
Appendix B: Emission Calculations
B-30
Table B-15: Cold Startup VOC Emission Details, continued

Deer Creek Station PSD Air Quality Construction Permit Application
Appendix B: Emission Calculations
B-31
Table B-16 Deer Creek Station: CT/HRSG Cold Startup PM Emission Details
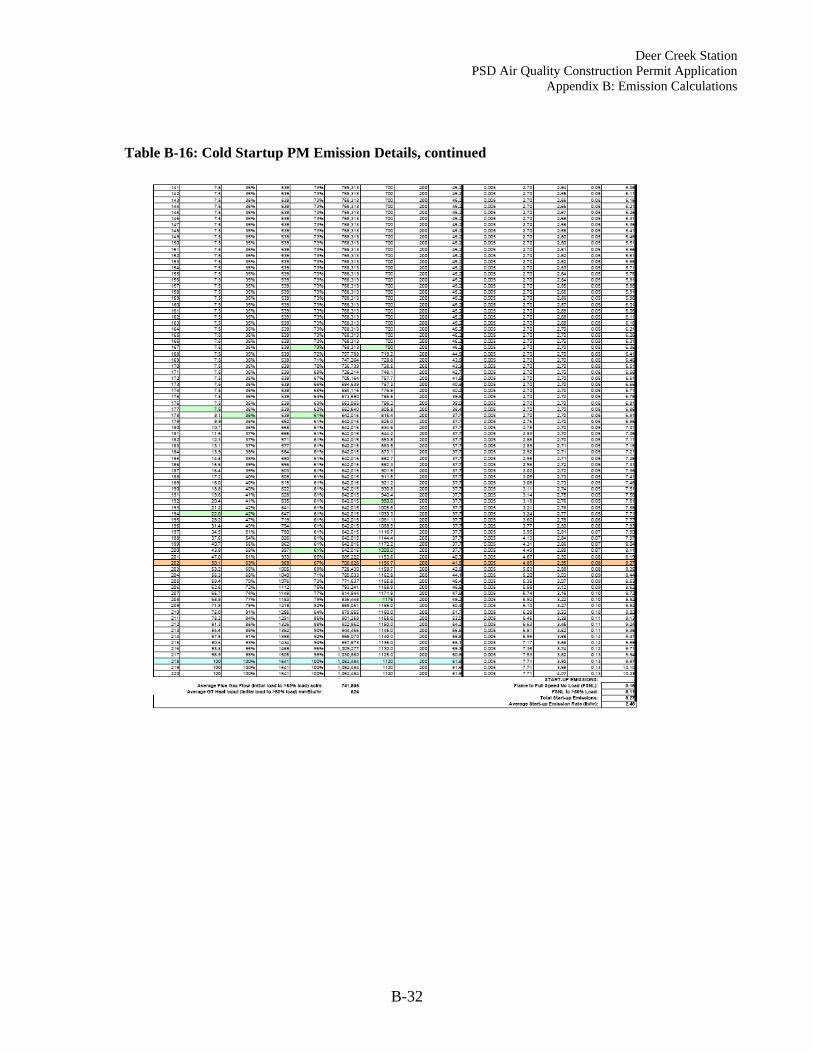
Deer Creek Station PSD Air Quality Construction Permit Application
Appendix B: Emission Calculations
B-32
Table B-16: Cold Startup PM Emission Details, continued

Deer Creek Station PSD Air Quality Construction Permit Application
Appendix B: Emission Calculations
B-33
Table B-17 Deer Creek Station: CT/HRSG Warm Startup NOx Emission Details
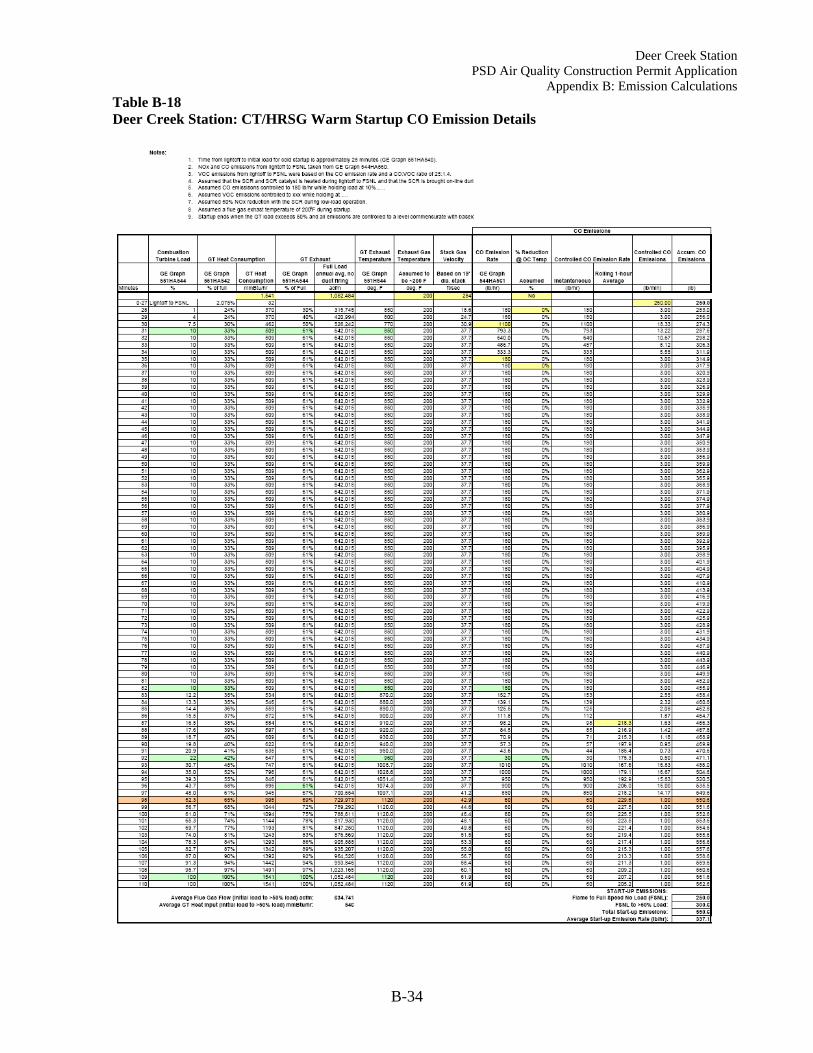
Deer Creek Station PSD Air Quality Construction Permit Application
Appendix B: Emission Calculations
B-34
Table B-18 Deer Creek Station: CT/HRSG Warm Startup CO Emission Details

Deer Creek Station PSD Air Quality Construction Permit Application
Appendix B: Emission Calculations
B-35
Table B-19 Deer Creek Station: CT/HRSG Warm Startup VOC Emission Details
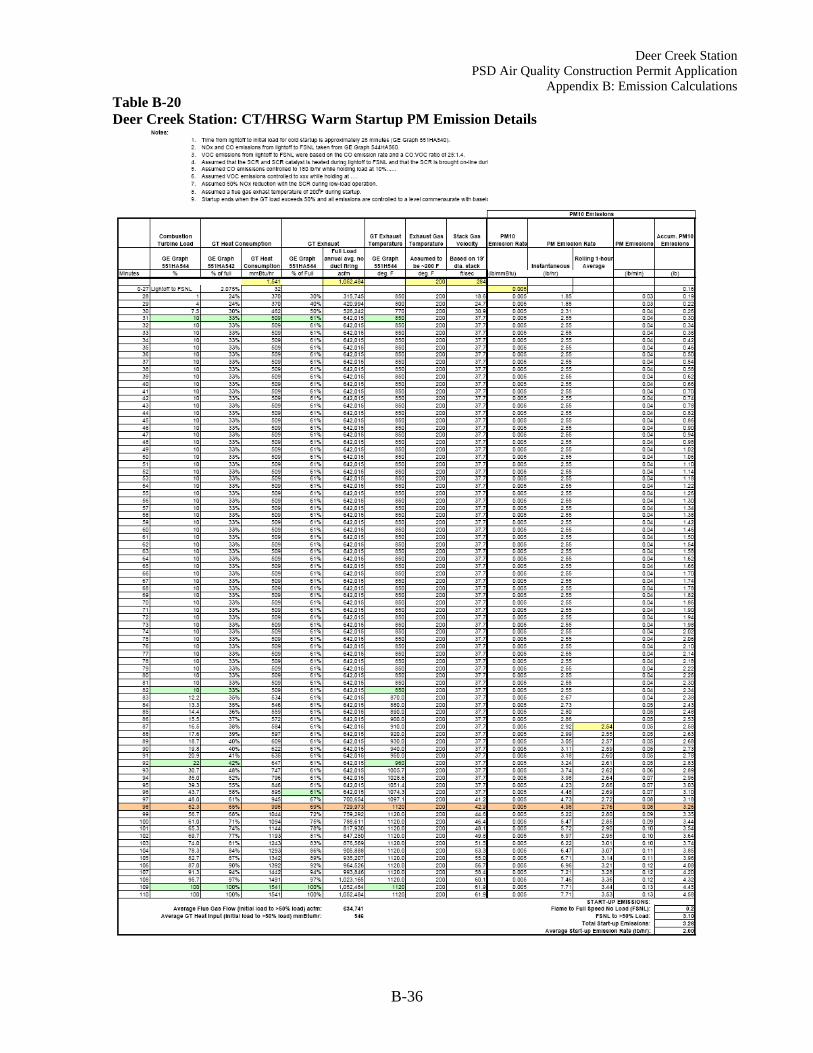
Deer Creek Station PSD Air Quality Construction Permit Application
Appendix B: Emission Calculations
B-36
Table B-20 Deer Creek Station: CT/HRSG Warm Startup PM Emission Details

Deer Creek Station PSD Air Quality Construction Permit Application
Appendix B: Emission Calculations
B-37
Table B-21 Deer Creek Station: CT/HRSG Hot Startup NOx and CO Emission Details

Deer Creek Station PSD Air Quality Construction Permit Application
Appendix B: Emission Calculations
B-38
Table B-22 Deer Creek Station: CT/HRSG Hot Startup VOC and PM Emission Details

Basin Electric Power Cooperative
Deer Creek Station PSD Air Quality Construction Permit Application
Appendix C
Best Available Control Technology Analysis
Prepared by:
Sargent & Lundy, LLC Chicago, Illinois
May 29, 2009

Basin Electric Power Cooperative Deer Creek Station Air Quality Construction Permit Application May 29, 2009 Table of Contents
Table of Contents Page i
1.0 Project Description 2.0 Best Available Control Technology (BACT)
2.1 Definition of BACT 2.2 The “Top-Down” BACT Analysis 2.3 PSD Applicability
3.0 BACT Analysis for Combustion Turbine NOx Control
3.1 Step 1: Identify Potentially Feasible NOx Control Options 3.2 Step 2: Technical Feasibility of Potential NOx Control Options
3.2.1 Combustion Controls 3.2.1.1 Water/Steam Injection 3.2.1.2 Dry Low-NOx Combustion
3.2.2 Post-Combustion NOx Controls 3.2.2.1 Selective Catalytic Reduction 3.2.2.2 SCR with Ammonia Oxidation Catalyst (Zero-Slip™) 3.2.2.3 Oxidation Catalyst with Potassium Carbonate Absorption (EMx™ formerly
SCONOx™) 3.2.2.4 Urea Injection Systems (Selective Non-Catalytic Reduction and NOxOut™) 3.2.2.5 Ammonia Injection Systems (Thermal DeNOx™) 3.2.2.6 Catalytic Combustion (Xonon™)
3.3 Step 3: Rank the Technically Feasible NOx Control Options by Effectiveness 3.4 Step 4: Evaluate the Technically Feasible NOx Control Options
3.4.1 NOx Control Technologies - Economic Impact Evaluation 3.4.2 NOx Control Technologies – Environmental Impact Evaluation 3.4.2 NOx Control Technologies – Energy Impact Evaluation
3.5 Step 5: Select BACT for NOx Control
4.0 BACT Analysis for Combustion Turbine CO Control 4.1 Step 1: Identify Potentially Feasible CO Control Options 4.2 Step 2: Technical Feasibility of Potential CO Control Options
4.2.1 Combustion Controls 4.2.2 Post-Combustion CO Controls
4.2.2.1 Oxidation Catalyst 3.2.2.2 Oxidation Catalyst with Potassium Carbonate Absorption (EMx™ formerly
SCONOx™) 3.2.2.3 Catalytic Combustion (Xonon™)
4.3 Step 3: Rank the Technically Feasible CO Control Options by Effectiveness 4.4 Step 4: Evaluate the Technically Feasible CO Control Options
4.4.1 CO Control Technologies - Economic Impact Evaluation 4.4.2 CO Control Technologies – Environmental Impact Evaluation
Basin Electric Power Cooperative Deer Creek Station Air Quality Construction Permit Application May 29, 2009 Table of Contents
Table of Contents Page ii
4.4.2 CO Control Technologies – Energy Impact Evaluation 4.5 Step 5: Select BACT for CO Control
5.0 BACT Analysis for Combustion Turbine PM Control
5.1 Step 1: Identify Potentially Feasible PM Control Options 5.2 Step 2: Technical Feasibility of Potential PM Control Options 5.3 Step 3: Rank the Technically Feasible PM Control Options by Effectiveness 5.4 Step 4: Evaluate the Technically Feasible PM Control Options
5.4.1 PM Control Technologies - Economic Impact Evaluation 5.4.2 PM Control Technologies – Environmental Impact Evaluation
5.5 Step 5: Select BACT for PM Control
6.0 BACT Analysis for the Emergency Generator, Fire Water Pump, and Emergency Inlet Air Heater
6.1 Emergency Generator and Fire Water Pump BACT Analysis 6.1.1 Diesel Engine – Baseline Emission Rates 6.1.2 Diesel Engine – Potentially Feasible Emission Control Technologies 6.1.2.1 Combustion Controls 6.1.2.2 Post-Combustion Control Technologies 6.1.2.2.1 NOx Absorption Systems 6.1.2.2.2 Catalytic Reduction Systems 6.1.2.2.3 Particulate Control Systems 6.1.3 Diesel Engine – Controlled Emission Rates 6.1.4 Post-Combustion Emission Control Cost Effectiveness Evaluation 6.1.5 Proposed Emergency Generator and Fire Water Pump BACT 6.2 Emergency Inlet Air Heater BACT Analysis 6.2.1 Emergency Inlet Air Heater – Potential Emissions 6.2.2 Emergency Inlet Air Heater – Potentially Feasible Emission Control Technologies 6.2.3 Emergency Inlet Air Heater – Controlled Emission Rates 6.2.4 Proposed Emergency Inlet Air Heater BACT
7.0 Deer Creek Station – BACT Summary Attachment A – RBLC Tables Attachment B – CT/HRSG CO Control Cost Estimates

Basin Electric Power Cooperative Deer Creek Station Air Quality Construction Permit Application May 29, 2009 Best Available Control Technology
C-1
1.0 PROJECT DESCRIPTION Basin Electric Power Cooperative (BEPC) proposes to construct a new natural gas-fired combined cycle (NGCC) electric generating facility. The new facility, to be know as the Deer Creek Station, will be located in Brookings County, South Dakota, approximately fifteen miles northeast of the town of Brookings and six miles southeast of White, South Dakota. The location of the proposed Deer Creek Station is shown in Figure 1-1. Upon completion the Deer Creek Station will include:
one F-class combustion turbine generator (CTG); one natural circulation, duct fired, heat recovery steam generator (HRSG); one reheat condensing steam turbine generator (STG); one diesel-fired emergency generator; one diesel-fired fire water pump; one natural gas-fired emergency inlet air heater; and one air cooled condenser (ACC).
The proposed electric generating facility has the potential to emit regulated pollutants in amounts above the significance levels defined in 40 CFR 52.21(b)(23). Therefore, BEPC is applying to the South Dakota Department of Environmental and Natural Resources (DENR) for a New Source Review (NSR) Prevention of Significant Deterioration (PSD) Air Quality Construction Permit. New emission sources subject to PSD review are required to control emissions of regulated NSR pollutants using the Best Available Control Technology (BACT). BACT is determined on a case-by-case basis, based on a detailed analysis of the emission control technologies available to reduce emissions from the proposed facility. This BACT Analysis has been prepared to support BEPC’s PSD air construction permit application for the Deer Creek Station. The proposed NGCC facility is being designed to provide approximately 250 MW-gross output at full load at annual average ambient conditions without supplemental duct firing, and approximately 310 MW-gross output at full load with auxiliary duct firing in the HRSG. Design output of the unit will vary depending on ambient conditions and supplemental duct firing in the HRSG. NGCC operating parameters used to form the basis of this BACT Analysis are summarized in Table 1-1.
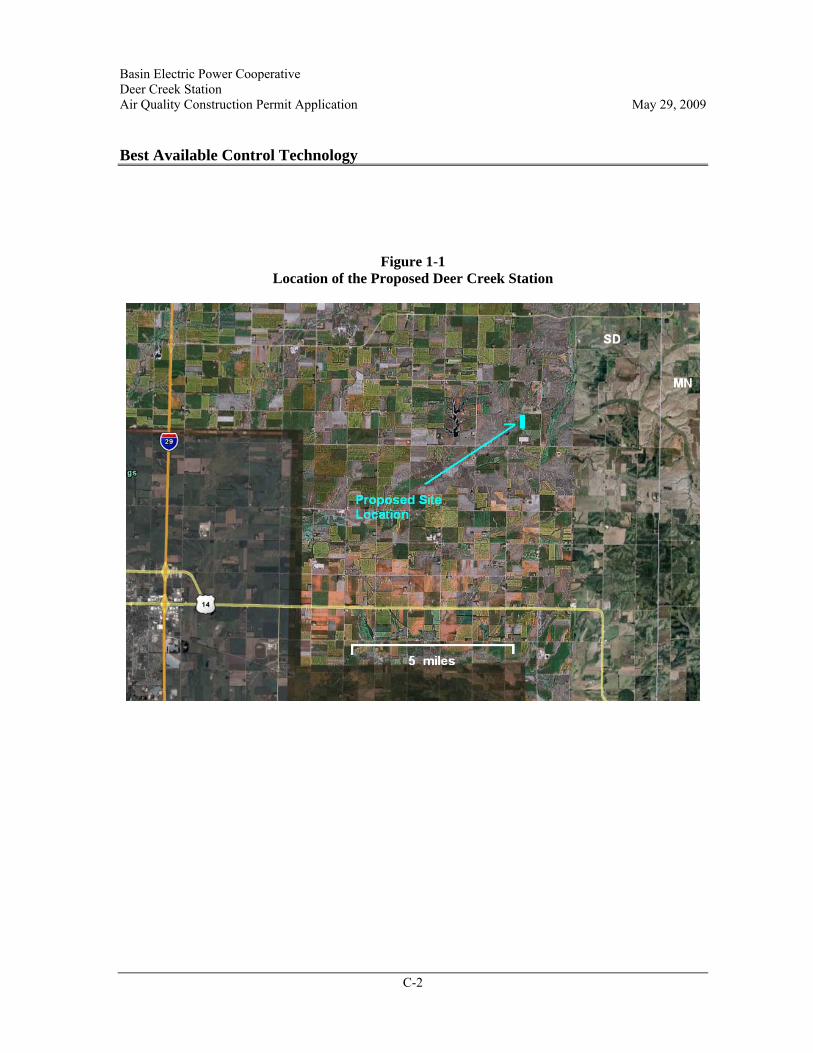
Basin Electric Power Cooperative Deer Creek Station Air Quality Construction Permit Application May 29, 2009 Best Available Control Technology
C-2
Figure 1-1 Location of the Proposed Deer Creek Station

Basin Electric Power Cooperative Deer Creek Station Air Quality Construction Permit Application May 29, 2009 Best Available Control Technology
C-3
Table 1-1
Deer Creek Station Design Parameters
Plant Performance Ambient Conditions
Winter Extreme
Conditions
Average Annual
Conditions
Average Annual
Conditions
Summer Ambient
Conditions Ambient Temperature oF -41 43 43 94 Duct Firing Yes/No No No Yes Yes Combustion Turbine Load % base load base load base load base load Heat Input to Combustion Turbine
mmBtu/hr (LHV)
1,713 1,541 1,541 1,434
Combustion Turbine Output kW (gross) 184,557 166,178 166,178 150,600 Duct Firing Heat Input mmBtu/hr
(LHV) 0.0 0.0 511 610
Steam Turbine Output kW (gross) 85,326 83,505 142,723 152,860 Gross Plant Output kW (gross) 269,883 249,683 308,901 303,460 Auxiliary Power Requirements kW 5,390 6,507 8,528 10,884 Net Plant Output kW (net) 264,493 243,176 300,373 292,576 Net Plant Heat Rate Btu/kWh
(LHV) 6,477 6,337 6,832 6,988

Basin Electric Power Cooperative Deer Creek Station Air Quality Construction Permit Application May 29, 2009 Best Available Control Technology
C-4
2.0 BEST AVAILABLE CONTROL TECHNOLOGY 2.1 Definition of BACT The requirement to conduct a BACT analysis is set forth in section 165(a)(4) of the Clean Air Act, and has been codified into federal regulations at 40 CFR 52.21(j). BACT is defined in 40 CFR 52.21(b)(12)1 as:
an emissions limitation (including a visible emission standard) based on the maximum degree of reduction for each pollutant subject to regulation under the Act which would be emitted from any proposed major stationary source or major modification which the Administrator, on a case-by-case basis, taking into account energy, environmental, and economic impacts and other costs, determines is achievable for such source or modification through application of production processes or available methods, systems, and techniques, including fuel cleaning or treatment or innovative fuel combustion techniques for control of such pollutant….
The primary guidance utilized in preparation of this BACT Analysis is U.S. EPA’s New Source Review Workshop Manual: Prevention of Significant Deterioration and Nonattainment Area Permitting, Draft, October 1990 ("NSR Manual"). The NSR Manual describes a “top-down” approach to the determination of BACT controls for new emission sources.
2.2 The “Top-Down” BACT Analysis In general, a top-down BACT Analysis involves the following steps for each pollutant:
1. Identify all potential control technologies; 2. Eliminate technically infeasible control options; 3. Rank the remaining control technologies by control effectiveness; 4. Evaluate the control technologies, starting with the most effective for: - economic impacts, - energy impacts, and - environmental impacts; 5. Select BACT
A more detailed description of each step in the BACT Analysis is provided below.
Step 1 - Identify All Control Options
1 The definition of BACT in 40 CFR 52.21(b)(12) has been incorporated by reference into the South Dakota Air Regulations at 74:36:09:02.
Basin Electric Power Cooperative Deer Creek Station Air Quality Construction Permit Application May 29, 2009 Best Available Control Technology
C-5
The first step in the BACT Analysis is to identify, for the emission unit in question, all available control options. Available control options are those air pollution control technologies with a practical potential for application to the emission unit and the regulated pollutant under evaluation. An evaluation of alternative source designs is generally outside the scope of BACT. In an effort to identify all potentially applicable emission control technologies, BEPC’s engineering consultant, Sargent & Lundy LLC (S&L) searched a broad range of information sources including, but not necessarily limited to:
- EPA's RACT/BACT/LAER Clearinghouse (RBLC) Database; - New & Emerging Environmental Technologies (NEET) Database; - EPA’s New Source Review (NSR) and Clean Air Technology Center (CATC)
websites; - Information from control technology vendors and engineering/environmental
consultants; - Federal and State NSR permits and BACT determinations for similar sources; - Recently submitted Federal and State NSR permit applications submitted for coal-fired
PC electrical generating projects; and - Technical journals, reports, newsletters and air pollution control seminars.
Step 2 - Eliminate Technically Infeasible Control Options The second step in the BACT Analysis is to review the technical feasibility of the control options identified in Step 1 with respect to source-specific and unit-specific factors. A demonstration of technical unfeasibility must be based on physical, chemical, and engineering principals, and must show that technical difficulties would preclude the successful use of the control option on the emission unit under consideration. The economics of an option are not considered in the determination of technical feasibility. Options that are technically infeasible for the intended application are eliminated from further review. Step 3 - Rank Remaining Control Technologies by Control Effectiveness All technically feasible options are ranked in order of over all control effectiveness. Control effectiveness is generally expressed as the rate that a pollutant is emitted after the control system. The most effective control option is the system that achieves the lowest emissions level.

Basin Electric Power Cooperative Deer Creek Station Air Quality Construction Permit Application May 29, 2009 Best Available Control Technology
C-6
Step 4 - Evaluate Most Effective Controls After identifying the technically feasible control options, each option, beginning with the most effective, is evaluated for economic, energy, and environmental impacts. Both beneficial and adverse impacts should be assessed and, where possible, quantified. In the event that the most effective control alternative is shown to be inappropriate due to energy, environmental, or economic impacts, the basis for this finding is documented and the next most stringent alternative evaluated. This process continues until the technology under consideration cannot be eliminated by any source-specific environmental, energy, or economic impacts.
Economic Analysis If required, the economic analysis performed as part of the BACT determination examines the cost-effectiveness of each control technology, on a dollar per ton of pollutant removed basis. Annual emissions using a particular control device are subtracted from base case emissions to calculate tons of pollutant controlled per year. The base case generally represents uncontrolled emissions or the inherent emission rate from the proposed source. Annual costs are calculated by adding annual operation and maintenance costs to the annualized capital cost of an option. Cost effectiveness ($/ton) of an option is simply the annual cost ($/yr) divided by the annual pollution controlled (ton/yr). In addition to the cost effectiveness relative to the base case, the incremental cost-effectiveness to go from one level of control to the next more stringent level of control may also be calculated to evaluate the cost effectiveness of the more stringent control. Energy Impact Analysis The energy requirements of a control technology should be examined to determine whether the use of that technology results in any significant or unusual energy penalties or benefits. Two forms of energy impacts associated with a control option can normally be quantified. First, increases in energy consumption resulting from increased heat rate may be shown as total Btu’s or fuel consumed per year, or as Btu’s per ton of pollutant controlled. Second, the installation of a particular control option may reduce the output and/or reliability of equipment. This reduction would result in loss of revenue from power sales and/or increased fuel consumption due to use of less efficient electrical and steam generation methods.

Basin Electric Power Cooperative Deer Creek Station Air Quality Construction Permit Application May 29, 2009 Best Available Control Technology
C-7
Environmental Impact Analysis The primary purpose of the environmental impact analysis is to assess collateral environmental impacts due to control of the regulated pollutant in question. Environmental impacts may include solid or hazardous waste generation, discharges of polluted water from a control device, visibility impacts, increased emissions of other criteria or non-criteria pollutants, increased water consumption, and land use impacts from waste disposal. The environmental impact analysis should be made on a consideration of site-specific circumstances.
Step 5 - Select BACT The determination of BACT for each pollutant and emissions unit is based on a review of the three impact categories and the technical factors that affect feasibility of the control alternatives under consideration.
2.3 PSD Applicability The PSD permitting regulations (Chapter 74:36:09 of the South Dakota air pollution control regulations) apply to the construction of a new major source of emissions located in an attainment or unclassified area. The proposed Deer Creek Station will be located in Brookings County. Brookings County has been designated as an attainment area (or unclassifiable) for all national ambient air quality standards. Based on potential-to-emit emission calculations, the proposed facility meets the definition of a new major source of emissions.2 Once a source is considered major, all regulated air pollutants emitted in significant emission rates (as defined in 40 CFR 52.21(b)(23)) are subject to PSD review. Among other things, PSD review requires those pollutants that will be emitted at levels greater than the significant level to be controlled using BACT. Potential emissions from the proposed facility are summarized in Table 2-1, along with the corresponding PSD significant emission rate.
2 Detailed emission calculations for each source are summarized in Section 3.0 of the Deer Creek PSD Permit Application.
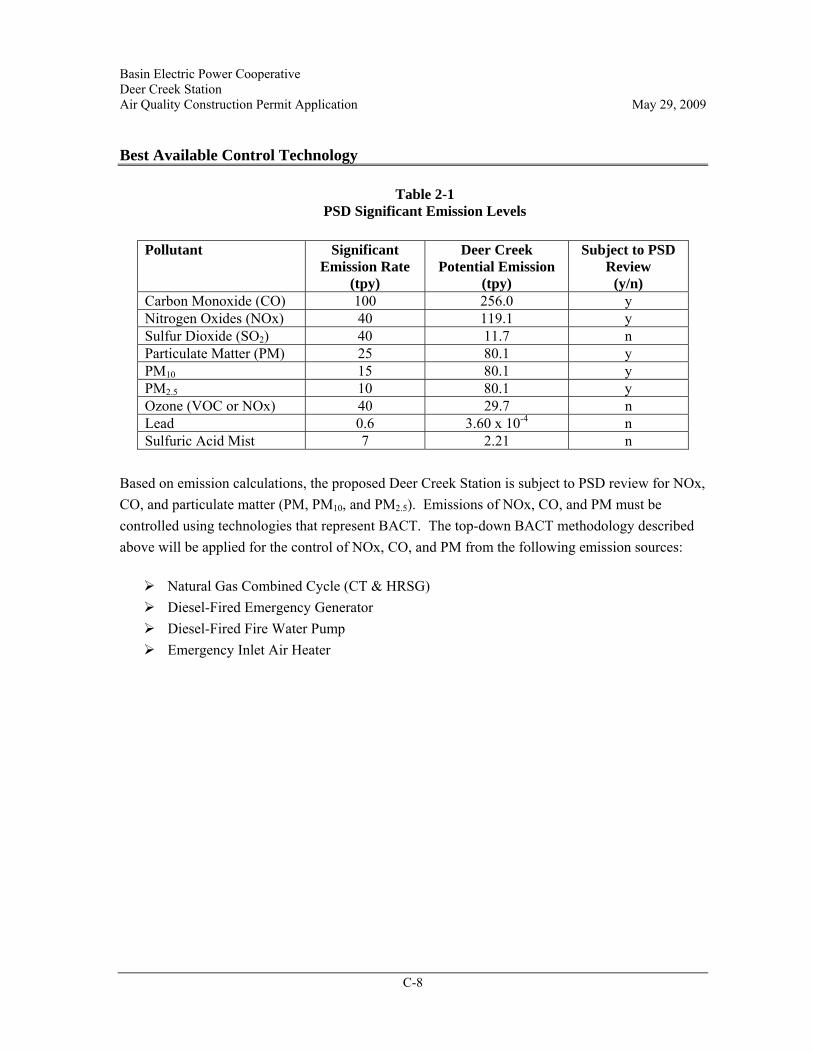
Basin Electric Power Cooperative Deer Creek Station Air Quality Construction Permit Application May 29, 2009 Best Available Control Technology
C-8
Table 2-1 PSD Significant Emission Levels
Pollutant Significant
Emission Rate (tpy)
Deer Creek Potential Emission
(tpy)
Subject to PSD Review
(y/n) Carbon Monoxide (CO) 100 256.0 y Nitrogen Oxides (NOx) 40 119.1 y Sulfur Dioxide (SO2) 40 11.7 n Particulate Matter (PM) 25 80.1 y PM10 15 80.1 y PM2.5 10 80.1 y Ozone (VOC or NOx) 40 29.7 n Lead 0.6 3.60 x 10⁻⁴ n Sulfuric Acid Mist 7 2.21 n
Based on emission calculations, the proposed Deer Creek Station is subject to PSD review for NOx, CO, and particulate matter (PM, PM10, and PM2.5). Emissions of NOx, CO, and PM must be controlled using technologies that represent BACT. The top-down BACT methodology described above will be applied for the control of NOx, CO, and PM from the following emission sources:
Natural Gas Combined Cycle (CT & HRSG) Diesel-Fired Emergency Generator Diesel-Fired Fire Water Pump Emergency Inlet Air Heater
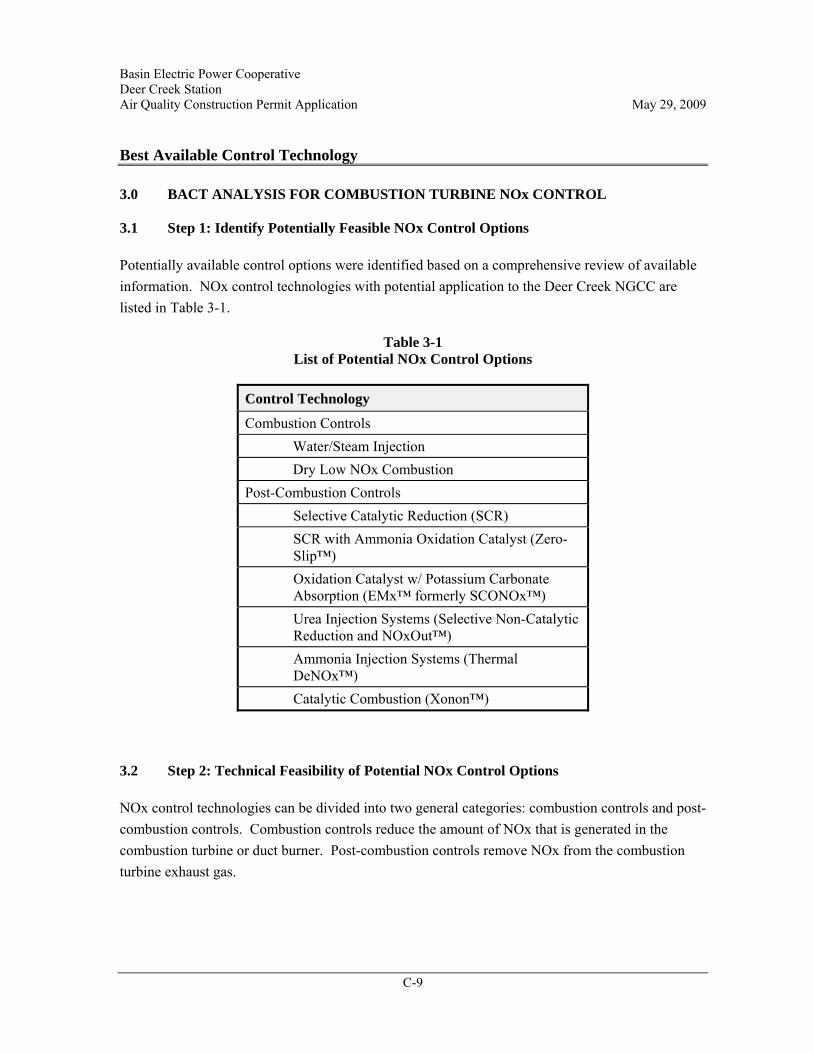
Basin Electric Power Cooperative Deer Creek Station Air Quality Construction Permit Application May 29, 2009 Best Available Control Technology
C-9
3.0 BACT ANALYSIS FOR COMBUSTION TURBINE NOx CONTROL 3.1 Step 1: Identify Potentially Feasible NOx Control Options Potentially available control options were identified based on a comprehensive review of available information. NOx control technologies with potential application to the Deer Creek NGCC are listed in Table 3-1.
Table 3-1 List of Potential NOx Control Options
Control Technology
Combustion Controls Water/Steam Injection Dry Low NOx Combustion Post-Combustion Controls
Selective Catalytic Reduction (SCR) SCR with Ammonia Oxidation Catalyst (Zero-Slip™) Oxidation Catalyst w/ Potassium Carbonate Absorption (EMx™ formerly SCONOx™) Urea Injection Systems (Selective Non-Catalytic Reduction and NOxOut™) Ammonia Injection Systems (Thermal DeNOx™) Catalytic Combustion (Xonon™)
3.2 Step 2: Technical Feasibility of Potential NOx Control Options NOx control technologies can be divided into two general categories: combustion controls and post-combustion controls. Combustion controls reduce the amount of NOx that is generated in the combustion turbine or duct burner. Post-combustion controls remove NOx from the combustion turbine exhaust gas.
Basin Electric Power Cooperative Deer Creek Station Air Quality Construction Permit Application May 29, 2009 Best Available Control Technology
C-10
3.2.1 Combustion Controls NOx formation in a natural gas-fired combustion turbine (CT) occurs by three fundamentally different mechanisms; thermal NOx, prompt NOx, and fuel NOx. Prompt NOx is formed from reactions of nitrogen molecules in the combustion air and hydrocarbon radicals from the fuel. Prompt NOx forms within the flame and is usually negligible when compared to thermal NOx. Fuel NOx is formed by the gas-phase oxidation of fuel-bound nitrogen compounds with oxygen. Its formation is dependent on fuel nitrogen content and the combustion oxygen levels. Natural gas contains negligible chemically-bound fuel nitrogen; thus, the formation of fuel NOx is also negligible when compared to thermal NOx. Essentially all NOx formed from natural gas combustion is thermal NOx. Thermal NOx is created by the thermal dissociation and subsequent reaction of nitrogen (N2) and oxygen (O2) molecules in the combustion air. The amount of thermal NOx formed is a function of the combustion chamber design and the CT operating parameters, including flame temperature, residence time at flame temperature, combustion pressure, and fuel/air ratios at the primary combustion zone. The maximum thermal NOx formation occurs at a slightly fuel-lean mixture because of excess oxygen available for reaction. The rate of thermal NOx formation is also an exponential function of the flame temperature. Uncontrolled NOx emissions from a natural gas-fired combustion turbine will be in the range of 0.32 lb/mmBtu (or approximately 90 ppmvd @ 15% O2).3
3.2.1.1 Water/Steam Injection Injection of water or steam into the high temperature zones of the combustion turbine flame is a combustion control technique that can be used to reduce the formation of thermal NOx. NOx reduction will be a function of the combustor design and the water-to-fuel ratio employed. Although water/steam injection will reduce the formation of NOx, positioning of the injection is not precise and some NOx is still created. Water or steam injection systems have demonstrated the ability to achieve controlled NOx emissions of approximately 35 ppmvd @ 15% O2, or 0.13 lb/mmBtu. In order to avoid corrosion and the formation of deposits in the turbine expansion section, thoroughly demineralized water needs to be used for either approach. Water or steam
3 See, AP-42 Table 3.1-1 Emission Factors for NOx and CO from Stationary Gas Turbines.
Basin Electric Power Cooperative Deer Creek Station Air Quality Construction Permit Application May 29, 2009 Best Available Control Technology
C-11
injection can also increase CO emissions as temperatures in the burnout zone are lowered. Water or steam injection control systems are also accompanied by an efficiency penalty in the range of 2 to 3%, but an increase in power output of 5 to 6%. The increased power output results from the increase mass flow required to maintain the turbine inlet temperatures. Finally, water/steam injection cannot be used when firing natural gas with dry-low NOx combustors. For this BACT analysis it was concluded that either water or steam injection could be used to control CT NOx formation in the Deer Creek CT, and that either combustion control system could achieve a controlled NOx emission rate of 35 ppmvd @ 15% O2 (30-day average). However, water/steam injection systems are not as effective at controlling NOx as dry-low NOx combustors, and cannot be used in conjunction with dry-low NOx combustors. Water/steam injection also reduces the efficiency of the combustion turbine, and results in increased CO emissions. Because water/steam injection control systems are not as effective at dry-low NOx combustors, water/steam injection NOx control systems will not be evaluated further in this BACT analysis. 3.2.1.2 Dry Low-NOx Combustion Excess air in lean combustion cools the flame and reduces the formation of thermal NOx. Dry low-NOx (DLN) combustion systems reduce the amount of thermal NOX formed by lowering the overall flame temperature within the CT combustor. The lower flame temperature is accomplished by premixing the fuel and air at controlled stoichiometric ratios prior to combustion. Prior to the development of premix-based DLN combustors, fuel and air were injected separately into the CT's combustor section. Oxygen in the combustion air, needed to support the combustion process, would diffuse into the flame front located at the combustor's fuel burner, and combustion occurred in a diffusion flame. The result of this approach was a range of fuel-to-air ratios over which combustion occurred and a corresponding range of flame temperatures. For DLN combustor designs, air/fuel mixing is accomplished prior to the burner where the actual combustion occurs. This design provides better control of the air-to-fuel stoichiometric ratio, lower flame temperature, reduced excess oxygen, and minimizes the potential for localized high-temperature fuel-rich pockets.
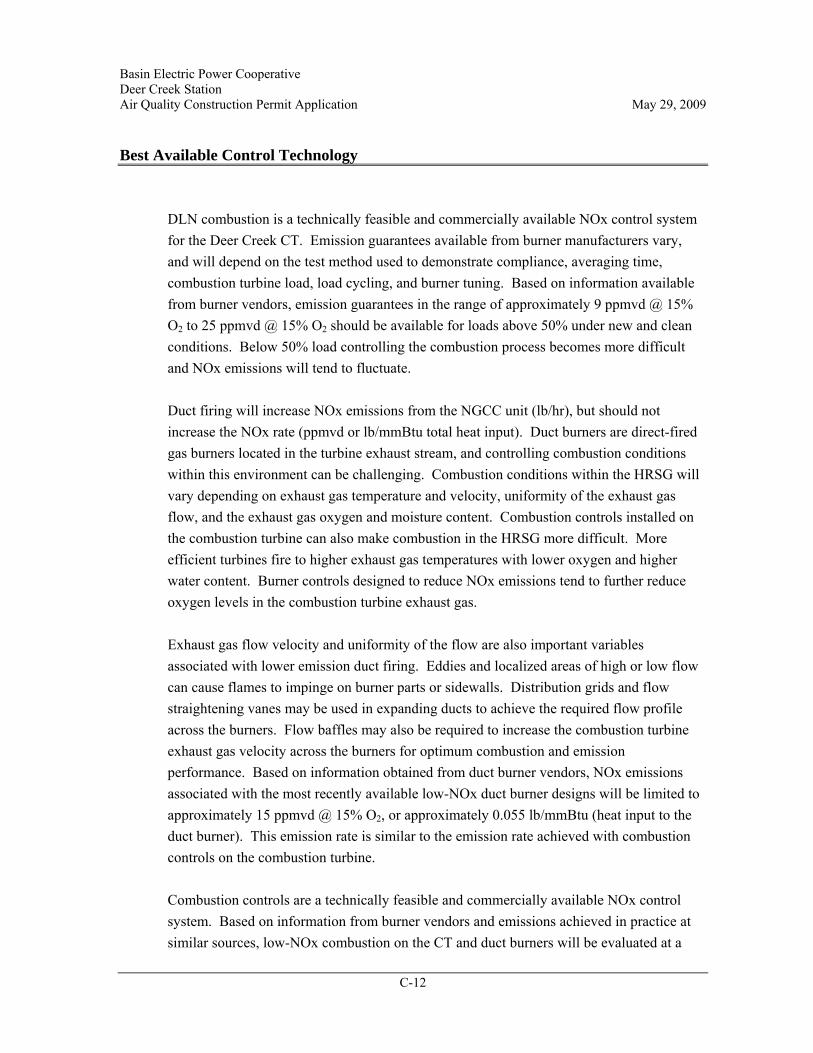
Basin Electric Power Cooperative Deer Creek Station Air Quality Construction Permit Application May 29, 2009 Best Available Control Technology
C-12
DLN combustion is a technically feasible and commercially available NOx control system for the Deer Creek CT. Emission guarantees available from burner manufacturers vary, and will depend on the test method used to demonstrate compliance, averaging time, combustion turbine load, load cycling, and burner tuning. Based on information available from burner vendors, emission guarantees in the range of approximately 9 ppmvd @ 15% O2 to 25 ppmvd @ 15% O2 should be available for loads above 50% under new and clean conditions. Below 50% load controlling the combustion process becomes more difficult and NOx emissions will tend to fluctuate. Duct firing will increase NOx emissions from the NGCC unit (lb/hr), but should not increase the NOx rate (ppmvd or lb/mmBtu total heat input). Duct burners are direct-fired gas burners located in the turbine exhaust stream, and controlling combustion conditions within this environment can be challenging. Combustion conditions within the HRSG will vary depending on exhaust gas temperature and velocity, uniformity of the exhaust gas flow, and the exhaust gas oxygen and moisture content. Combustion controls installed on the combustion turbine can also make combustion in the HRSG more difficult. More efficient turbines fire to higher exhaust gas temperatures with lower oxygen and higher water content. Burner controls designed to reduce NOx emissions tend to further reduce oxygen levels in the combustion turbine exhaust gas. Exhaust gas flow velocity and uniformity of the flow are also important variables associated with lower emission duct firing. Eddies and localized areas of high or low flow can cause flames to impinge on burner parts or sidewalls. Distribution grids and flow straightening vanes may be used in expanding ducts to achieve the required flow profile across the burners. Flow baffles may also be required to increase the combustion turbine exhaust gas velocity across the burners for optimum combustion and emission performance. Based on information obtained from duct burner vendors, NOx emissions associated with the most recently available low-NOx duct burner designs will be limited to approximately 15 ppmvd @ 15% O2, or approximately 0.055 lb/mmBtu (heat input to the duct burner). This emission rate is similar to the emission rate achieved with combustion controls on the combustion turbine. Combustion controls are a technically feasible and commercially available NOx control system. Based on information from burner vendors and emissions achieved in practice at similar sources, low-NOx combustion on the CT and duct burners will be evaluated at a

Basin Electric Power Cooperative Deer Creek Station Air Quality Construction Permit Application May 29, 2009 Best Available Control Technology
C-13
controlled NOx emission rate of 15 ppmvd @ 15% O2 (30-day average). A controlled NOx emission rate of 15 ppmvd @ 15% O2 is equivalent to an emission rate of approximately 0.055 lb/mmBtu total heat input. Achieving this emission rate on a continuous basis will require proper tuning, operation, and maintenance of the burners, while providing a reasonable margin to account for normal system fluctuations.
3.2.2 Post-Combustion NOx Controls A second general strategy to minimize NOx emissions from a natural gas-fired combined cycle unit is to reduce NOx formed in the CT/HRSG using a post-combustion control system. Potentially available post-combustion NOx control systems are evaluated below. Post-combustion control systems will be evaluated assuming the CT will be designed with dry-low NOx burner combustion controls.
3.2.2.1 Selective Catalytic Reduction Selective catalytic reduction (SCR) is a post-combustion NOx control technology. SCR reduces NOx by injecting ammonia (NH3) in the presence of a catalyst. Ammonia reacts with NOx in the presence of active catalyst and excess oxygen to form water vapor and nitrogen, as shown in the following equations:
4NH3 + 4NO + O2 → 4N2 + 6H2O 8NH3 + 4NO2 + 2O2 → 6N2 + 12H2O
The performance of an SCR system is influenced by several factors including flue gas temperature, SCR inlet NOx level, the catalyst surface area, volume and age of the catalyst, and the amount of ammonia slip that is acceptable. SCR catalysts used in combined cycle application generally consist of a noble metal (e.g., platinum), base metal oxide (e.g., vanadium oxide mixed with titanium dioxide as a substrate). Metal based catalysts are generally applied as a coating over a metal or ceramic substrate. For high temperature applications (approximately 1,100 oF), such as simple cycle combustion turbines, zeolite catalysts are available. Zeolite catalysts are typically a homogeneous material that forms both the active surface and substrate. The geometric configuration of the catalyst body is designed for maximum surface area and minimum back-pressure on the gas turbine. An ammonia injection grid is located upstream of the
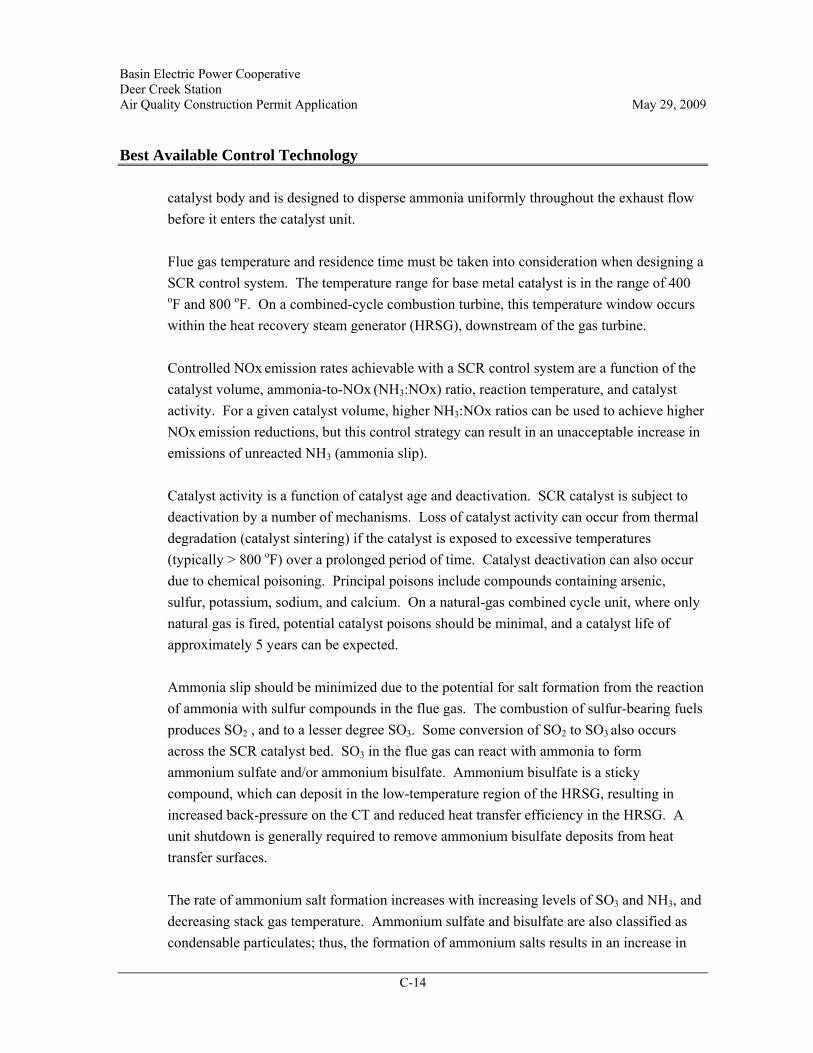
Basin Electric Power Cooperative Deer Creek Station Air Quality Construction Permit Application May 29, 2009 Best Available Control Technology
C-14
catalyst body and is designed to disperse ammonia uniformly throughout the exhaust flow before it enters the catalyst unit. Flue gas temperature and residence time must be taken into consideration when designing a SCR control system. The temperature range for base metal catalyst is in the range of 400 oF and 800 oF. On a combined-cycle combustion turbine, this temperature window occurs within the heat recovery steam generator (HRSG), downstream of the gas turbine. Controlled NOx emission rates achievable with a SCR control system are a function of the catalyst volume, ammonia-to-NOx (NH3:NOx) ratio, reaction temperature, and catalyst activity. For a given catalyst volume, higher NH3:NOx ratios can be used to achieve higher NOx emission reductions, but this control strategy can result in an unacceptable increase in emissions of unreacted NH3 (ammonia slip). Catalyst activity is a function of catalyst age and deactivation. SCR catalyst is subject to deactivation by a number of mechanisms. Loss of catalyst activity can occur from thermal degradation (catalyst sintering) if the catalyst is exposed to excessive temperatures (typically > 800 oF) over a prolonged period of time. Catalyst deactivation can also occur due to chemical poisoning. Principal poisons include compounds containing arsenic, sulfur, potassium, sodium, and calcium. On a natural-gas combined cycle unit, where only natural gas is fired, potential catalyst poisons should be minimal, and a catalyst life of approximately 5 years can be expected. Ammonia slip should be minimized due to the potential for salt formation from the reaction of ammonia with sulfur compounds in the flue gas. The combustion of sulfur-bearing fuels produces SO2 , and to a lesser degree SO3. Some conversion of SO2 to SO3 also occurs across the SCR catalyst bed. SO3 in the flue gas can react with ammonia to form ammonium sulfate and/or ammonium bisulfate. Ammonium bisulfate is a sticky compound, which can deposit in the low-temperature region of the HRSG, resulting in increased back-pressure on the CT and reduced heat transfer efficiency in the HRSG. A unit shutdown is generally required to remove ammonium bisulfate deposits from heat transfer surfaces. The rate of ammonium salt formation increases with increasing levels of SO3 and NH3, and decreasing stack gas temperature. Ammonium sulfate and bisulfate are also classified as condensable particulates; thus, the formation of ammonium salts results in an increase in

Basin Electric Power Cooperative Deer Creek Station Air Quality Construction Permit Application May 29, 2009 Best Available Control Technology
C-15
PM10 emissions. Because the Deer Creek NGCC will fire natural gas exclusively, these issues should be minimal; however, to minimize potential operating issues and to minimize ammonia and condensible particulate emissions, ammonia slip should still be maintained below a level of approximately 5 ppmvd. SCR is considered a technically feasible and commercially available NOx control technology for the Deer Creek NGCC. SCR control has been installed on natural gas-fired NGCC units, and has demonstrated the ability to effectively reduce NOx emissions. Based on a review of emission rates achieved in practice at similar sources and emission limits included in recently issued PSD permits for natural gas-fired NGCC facilities, it is concluded that an SCR control system could be designed to achieve a controlled NOx emission rate of 3.5 ppmvd @ 15% O2 (30-day average). A controlled NOx emission rate of 3.5 ppmvd @ 15% O2 should be achievable over the life of the catalyst and while maintaining acceptable ammonia slip. 3.2.2.2 SCR with Ammonia Oxidation Catalyst (Zero-Slip™) To address potential collateral environmental impacts associated with ammonia slip from SCR control, one vendor is developing a control technology designed for simultaneous control of NOx and ammonia emissions. The Zero-Slip™ system consists of a layer of conventional SCR catalyst followed by Zero-Slip™ catalyst. Ammonia, injected into the flue gas through an injection grid upstream of the SCR catalyst, flows through the SCR and Zero-Slip™ catalysts. The Zero-Slip™ catalyst consists of layers of both ammonia oxidation and denitration catalyst designed to reduce NOx emissions while achieving near zero ammonia slip, as shown in the following equations:
4NH3 + 4NO + O2 → 4N2 + 6H2O 4NH3 + 5O2 → 4N2 + 6H2O
This technology was originally developed by Mitsubishi Heavy Industries and is being jointly demonstrated by Cormetech and Mitsubishi Power Systems. This technology should be capable of achieving controlled NOx emission rates similar to those achievable with SCR. Potential advantages of this control technology, compared to other SCR control systems, include achieving low NOx emissions with lower ammonia slip. Full-scale operation of the technology on a 7.5 MW Solar Taurus turbine has
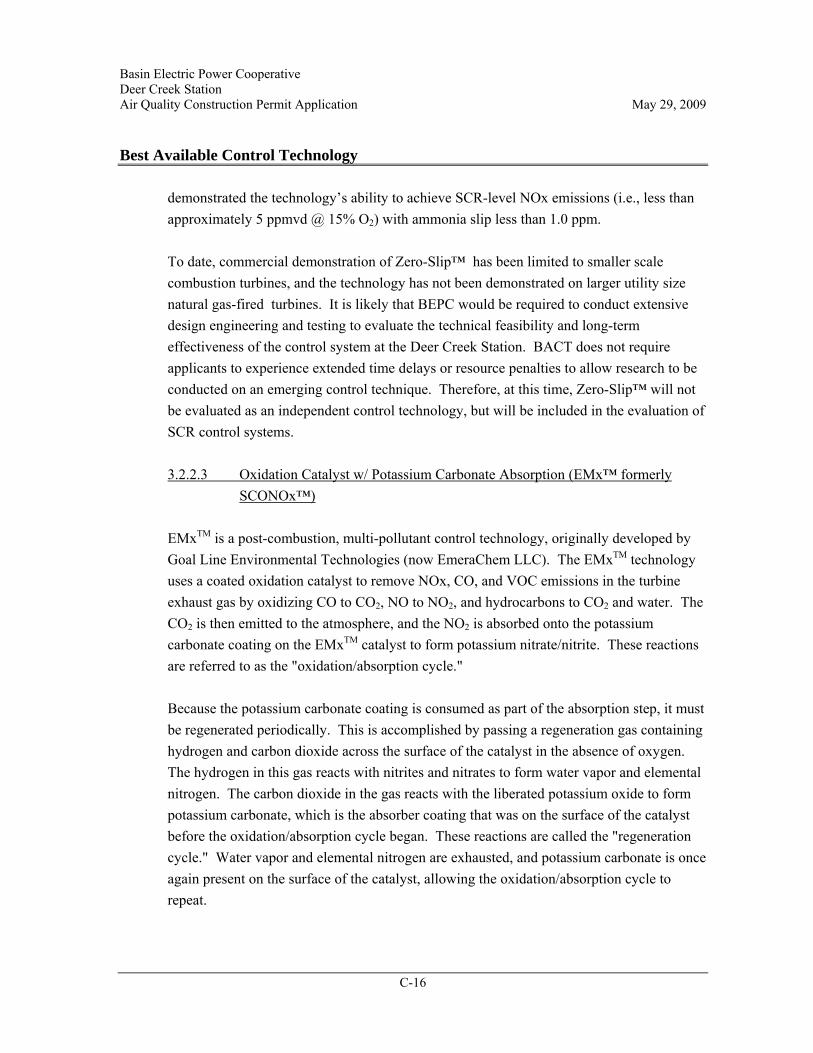
Basin Electric Power Cooperative Deer Creek Station Air Quality Construction Permit Application May 29, 2009 Best Available Control Technology
C-16
demonstrated the technology’s ability to achieve SCR-level NOx emissions (i.e., less than approximately 5 ppmvd @ 15% O2) with ammonia slip less than 1.0 ppm. To date, commercial demonstration of Zero-Slip™ has been limited to smaller scale combustion turbines, and the technology has not been demonstrated on larger utility size natural gas-fired turbines. It is likely that BEPC would be required to conduct extensive design engineering and testing to evaluate the technical feasibility and long-term effectiveness of the control system at the Deer Creek Station. BACT does not require applicants to experience extended time delays or resource penalties to allow research to be conducted on an emerging control technique. Therefore, at this time, Zero-Slip™ will not be evaluated as an independent control technology, but will be included in the evaluation of SCR control systems. 3.2.2.3 Oxidation Catalyst w/ Potassium Carbonate Absorption (EMx™ formerly
SCONOx™) EMxTM is a post-combustion, multi-pollutant control technology, originally developed by Goal Line Environmental Technologies (now EmeraChem LLC). The EMxTM technology uses a coated oxidation catalyst to remove NOx, CO, and VOC emissions in the turbine exhaust gas by oxidizing CO to CO2, NO to NO2, and hydrocarbons to CO2 and water. The CO2 is then emitted to the atmosphere, and the NO2 is absorbed onto the potassium carbonate coating on the EMxTM catalyst to form potassium nitrate/nitrite. These reactions are referred to as the "oxidation/absorption cycle." Because the potassium carbonate coating is consumed as part of the absorption step, it must be regenerated periodically. This is accomplished by passing a regeneration gas containing hydrogen and carbon dioxide across the surface of the catalyst in the absence of oxygen. The hydrogen in this gas reacts with nitrites and nitrates to form water vapor and elemental nitrogen. The carbon dioxide in the gas reacts with the liberated potassium oxide to form potassium carbonate, which is the absorber coating that was on the surface of the catalyst before the oxidation/absorption cycle began. These reactions are called the "regeneration cycle." Water vapor and elemental nitrogen are exhausted, and potassium carbonate is once again present on the surface of the catalyst, allowing the oxidation/absorption cycle to repeat.
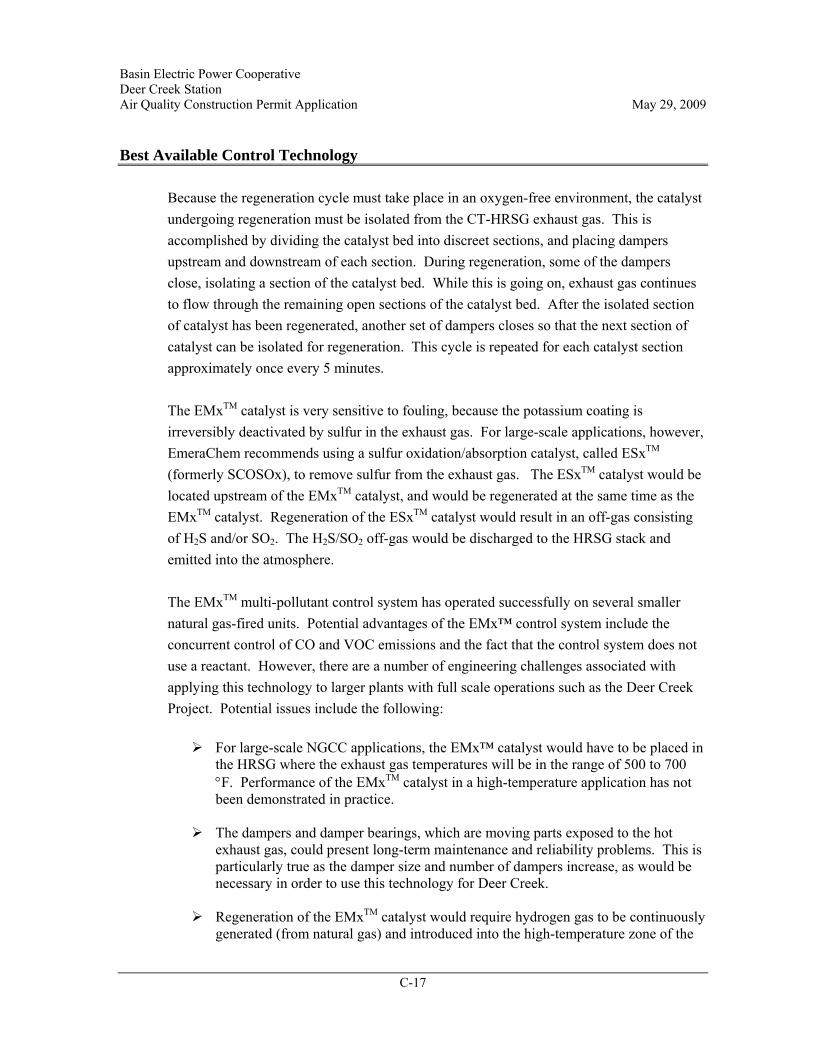
Basin Electric Power Cooperative Deer Creek Station Air Quality Construction Permit Application May 29, 2009 Best Available Control Technology
C-17
Because the regeneration cycle must take place in an oxygen-free environment, the catalyst undergoing regeneration must be isolated from the CT-HRSG exhaust gas. This is accomplished by dividing the catalyst bed into discreet sections, and placing dampers upstream and downstream of each section. During regeneration, some of the dampers close, isolating a section of the catalyst bed. While this is going on, exhaust gas continues to flow through the remaining open sections of the catalyst bed. After the isolated section of catalyst has been regenerated, another set of dampers closes so that the next section of catalyst can be isolated for regeneration. This cycle is repeated for each catalyst section approximately once every 5 minutes. The EMxTM catalyst is very sensitive to fouling, because the potassium coating is irreversibly deactivated by sulfur in the exhaust gas. For large-scale applications, however, EmeraChem recommends using a sulfur oxidation/absorption catalyst, called ESxTM
(formerly SCOSOx), to remove sulfur from the exhaust gas. The ESxTM catalyst would be located upstream of the EMxTM catalyst, and would be regenerated at the same time as the EMxTM catalyst. Regeneration of the ESxTM catalyst would result in an off-gas consisting of H2S and/or SO2. The H2S/SO2 off-gas would be discharged to the HRSG stack and emitted into the atmosphere. The EMxTM multi-pollutant control system has operated successfully on several smaller natural gas-fired units. Potential advantages of the EMx™ control system include the concurrent control of CO and VOC emissions and the fact that the control system does not use a reactant. However, there are a number of engineering challenges associated with applying this technology to larger plants with full scale operations such as the Deer Creek Project. Potential issues include the following:
For large-scale NGCC applications, the EMx™ catalyst would have to be placed in
the HRSG where the exhaust gas temperatures will be in the range of 500 to 700 °F. Performance of the EMxTM catalyst in a high-temperature application has not been demonstrated in practice.
The dampers and damper bearings, which are moving parts exposed to the hot exhaust gas, could present long-term maintenance and reliability problems. This is particularly true as the damper size and number of dampers increase, as would be necessary in order to use this technology for Deer Creek.
Regeneration of the EMxTM catalyst would require hydrogen gas to be continuously generated (from natural gas) and introduced into the high-temperature zone of the
Basin Electric Power Cooperative Deer Creek Station Air Quality Construction Permit Application May 29, 2009 Best Available Control Technology
C-18
HRSG. Because hydrogen gas is explosive, any leaks in the dampers used to isolate the catalyst for regeneration could create a serious hazard.
In addition to periodic regeneration, the EMxTM catalyst would have to be cleaned at least once per year by removing the catalyst beds from the HRSG and dipping them in a potassium carbonate solution.
The EMxTM and ESx™ processes have the potential to create additional air pollutants, such as hydrogen sulfide (H2S). Emissions of these additional pollutants have not been completely quantified.
To date, the EMx™ (SCONOx) multi-pollutant control system has not been installed and operated on a large NGCC application. It is likely that BEPC would be required to conduct extensive design engineering and testing to evaluate the technical feasibility and long-term effectiveness of the control system at the Deer Creek Station. BACT does not require applicants to experience extended time delays or resource penalties to allow research to be conducted on an emerging control technique. Therefore, at this time the EMx™ control system is not considered an available NOx control system, and will not be further evaluated in the BACT analysis. 3.2.2.4 Urea Injection Systems (Selective Non-Catalytic Reduction and NOxOut™) Selective non-catalytic reduction (SNCR) involves the direct injection of ammonia (NH3) or urea (CO(NH2)2) at flue gas temperatures of approximately 1600 - 1900 ºF. The ammonia or urea reacts with NOx in the flue gas to produce N2 and water. The NOx reduction reactions in an SNCR are driven by the thermal decomposition of ammonia or urea and the subsequent reduction of NOx. SNCR systems do not employ a catalyst to promote these reactions. Flue gas temperature at the point of reagent injection can greatly affect NOx removal efficiencies and the quantity of reactant that will pass through the SNCR unreacted (e.g., slip). At temperatures below the desired operating range, the NOx reduction reactions diminish and unreacted reactant emissions increase. Above the desired temperature range, the reactant may be oxidized to NOx resulting in low NOx reduction efficiencies.
The NOxOut™ process is a post-combustion NOx reduction method in which aqueous urea is injected into the flue gas stream. The urea reacts with NOx in the flue gas to produce N2 and water as shown below:

Basin Electric Power Cooperative Deer Creek Station Air Quality Construction Permit Application May 29, 2009 Best Available Control Technology
C-19
(NH2) 2CO + 2NO + ½O2 → 2H2O + CO2 + 2N2
The use of urea to control NOx emissions was developed under the sponsorship of the Electric Power Research Institute (EPRI). The urea-NOx reaction takes place over a narrow temperature range, below which ammonia is formed and above which NOx emission levels may actually increase. Fuel Tech’s NOxOut™ process is a urea-based SNCR process that uses mechanical modifications and chemical injection hardware to widen the effective temperature range of the reaction to between 1,600 and 1,950 oF. Based on information available from the vendor, the NOxOut™ process has been demonstrated on a 90 MW GE Frame 7EA gas turbine at a combined cycle cogeneration facility, and was able to achieve a controlled NOx emission rate of 5 ppm. Potential advantages of the system include lower slip levels (compared to other SNCR designs), no catalyst, and lower capital and operating costs (compared to SCR). Potential disadvantages of the system include ammonia emissions due to excess urea injection, ammonia reacting with SO3to form ammonium salts, and potential increase in NOx emissions if exhaust gas temperatures are too high. To date, commercial application of this system on large natural gas-fired combined cycle units has been limited. Based on a review of available literature, and engineering judgment, the NOxOut™ process is not considered a technically feasible NOx control option for the Deer Creek NGCC. NOx reduction reactions require flue gas temperatures in the range of 1,600 to 1,950 oF; however, exhaust gas temperatures from the Deer Creek combustion turbine will be in the range of 1,100 oF. Increasing the exhaust gas temperature would significantly reduce the efficiency of the combustion turbine or require additional fuel consumption and installation of a flue gas heater. Neither option is considered practical for a NGCC unit. Therefore, at this time, NOxOut™ is not considered a technically feasible NOx control option for Deer Creek, and will not be considered further in this BACT analysis. 3.2.2.5 Ammonia Injection Systems (Thermal DeNOx™) Exxon Research and Engineering Company’s Thermal DeNOx™ process utilizes an ammonia/NOx SNCR reaction to reduce NOx to nitrogen and water as shown in the following equation:
Basin Electric Power Cooperative Deer Creek Station Air Quality Construction Permit Application May 29, 2009 Best Available Control Technology
C-20
4NH3 + 4NO + O2 → 4N2 + 6H2O
Hamon Research Cottrell is licensed by Exxon-Mobil for the application of the ammonia-based Thermal DeNOx™ process. The process consists of a high-temperature selective non-catalytic reduction of NOx using ammonia as the reducing agent. This process does not use a catalyst to aid the reaction, rather temperature control is used to direct the reactions. Optimum reaction temperatures for NOx reduction are between 1,600 oF and 1,800 oF. Below the optimum temperature range, ammonia does not fully react and can be released in the flue gas. Above the optimum temperature, the following competing reaction will begin to take place, which can result in increased NOx emissions:
4H3 + 5O2 → 4O + 6H2O
To date, commercial applications of the Thermal DeNOx™ process have been limited to furnaces, heavy industrial boilers, and incinerators that consistently produce exhaust gas temperatures in the range of 1,800 oF consistently. Because exhaust gas volumes increase significantly with increased temperatures, application of the Thermal DeNOx™ process would require that flue gas handling systems be designed to handle larger high temperature flows. Similar to the NOxOut™ process, high capital and O&M costs are expected due to material requirements, additional equipment, and fuel consumption. It is likely that BEPC would be required to conduct extensive design engineering and testing to evaluate the technical feasibility and long-term effectiveness of the control system at the Deer Creek Station. BACT does not require applicants to experience extended time delays or resource penalties to allow research to be conducted on an emerging control technique. Therefore, at this time the Thermal DeNOx™ control system is not considered an available NOx control system, and will not be further evaluated in the BACT analysis. 3.2.2.6 Catalytic Combustion (Xonon™) Catalytic combustion uses a catalyst within the combustor to oxidize a lean air-to-fuel mixture rather than burning with a flame. In a catalytic combustor the air and fuel mixture oxidizes at lower temperatures, producing less NOx. One technical challenge associated with catalytic combustion has been achieving catalyst life long enough to make the combustor commercially viable.

Basin Electric Power Cooperative Deer Creek Station Air Quality Construction Permit Application May 29, 2009 Best Available Control Technology
C-21
The Xonon™ (“no NOx” spelled backwards) combustion system was originally developed by Catalytica Combustion Systems (now Catalytica Energy Systems). The Xonon™ control system works by partially burning fuel in a low temperature pre-combustor and completing the combustion in a catalytic combustor. The overall result is lower temperature partial combustion followed by flameless catalytic combustion to reduce NOx formation. To date, the system has successfully completed pilot- and full-scale testing, and has been demonstrated on a 1.5 MW Kawasaki gas turbine. However, the Xonon™ combustion system has not been demonstrated for extended periods of time on a large natural gas-fired combustion turbine. Applications of this technology have been in the 1 to 15 MW range. It is likely that BEPC would be required to conduct extensive design engineering and testing to evaluate the technical feasibility and long-term effectiveness of the control system at the Deer Creek Station. BACT does not require applicants to experience extended time delays or resource penalties to allow research to be conducted on an emerging control technique. Therefore, at this time, catalytic combustion systems (including Xonon™) are not considered available NOx control systems, and will not be further evaluated in the BACT analysis.
The results of Step 2 of the NOx BACT Analysis (technical feasibility analysis of potential NOx control technologies) are summarized in Table 3-2.

Basin Electric Power Cooperative Deer Creek Station Air Quality Construction Permit Application May 29, 2009 Best Available Control Technology
C-22
Table 3-2 Technical Feasibility of Potential NOx Control Technologies
In Service on Existing
NGCC Units Control Technology Controlled
NOx Emission Rate*
ppmvd @ 15% O2
Yes No Technically Feasible on the Deer Creek NGCC Unit?
Water/Steam Injection 35 X Yes
Dry Low NOx Combustion
15 X Yes
Selective Catalytic Reduction (SCR)
3.5 X Yes
SCR with Ammonia Oxidation Catalyst (Zero-Slip™)
NA X (limited application)
The SCR portion of the control system is considered technically feasible; however, the ammonia oxidation system has not been demonstrated in practice on a large natural gas-fired combustion turbine and is not considered commercially available for the Deer Creek NGCC unit.
Oxidation Catalyst w/ Potassium Carbonate Absorption (EMx™ formerly SCONOx™)
NA X (limited application)
This control technology has not been demonstrated on a large natural gas-fired NGCC, and, at this time, is not considered technically feasible or commercially available for the Deer Creek NGCC unit.
Urea Injection Systems (Selective Non-Catalytic Reduction and NOxOut™)
NA X (limited application)
This control technology has not been demonstrated on a large natural gas-fired NGCC, and, at this time, is not considered technically feasible or commercially available for the Deer Creek NGCC unit.
Ammonia Injection Systems (Thermal DeNOx™)
NA X (limited application)
This control technology has not been demonstrated on a large natural gas-fired NGCC, and, at this time, is not considered technically feasible or commercially available for the Deer Creek NGCC unit.
Catalytic Combustion (Xonon™)
NA X (limited application)
This control technology has not been demonstrated on a large natural gas-fired NGCC, and, at this time, is not considered technically feasible or commercially available for the Deer Creek NGCC unit.
*Emission rates included in this table represent enforceable permit limits that should be achievable under all normal operating conditions based on a 30-day rolling average period.
Basin Electric Power Cooperative Deer Creek Station Air Quality Construction Permit Application May 29, 2009 Best Available Control Technology
C-23
3.3 Step 3: Rank the Technically Feasible NOx Control Options by Effectiveness The technically feasible and commercially available NOx control technologies are listed in Table 3-3 in descending order of control efficiency.
Table 3-3 Technical Feasibility of Potential NOx Control Technologies
Technology Controlled NOx
Emission Rate (ppmvd @ 15% O2)*
Water/Steam Injection Control 35
Dry Low-NOx Combustion 15
Selective Catalytic Reduction 3.5 *NOx emission rates shown in this table represent controlled emission
rates that should be achievable based on a 30-day rolling average. 3.4 Step 4: Evaluate the Technically Feasible NOx Control Technologies
3.4.1 NOx Control Technologies – Economic Evaluation The most effective NOx control system, in terms of reduced emissions, that is considered to be technically feasible for the proposed NGCC unit consists of combustion controls and post-combustion SCR. This combination of controls should be capable of achieving the most stringent controlled NOx emission rate on an on-going long-term basis. The effectiveness of the SCR system is dependent on several site-specific system variables, including the size of the SCR (i.e., number of catalyst layers), NH3/NOx stoichiometric ratio, acceptable NH3 slip, and catalyst deactivation rate. Based on emission rates achieved in practice at similar sources, and including a reasonable margin to account for normal system fluctuations and long-term SCR operation, the combination of combustion controls and SCR should achieve a controlled NOx emission rate of 3.5 ppmvd @ 15% O2 (approximately 0.013 lb/mmBtu) on a 30-day rolling average. BEPC is proposing SCR as BACT for NOx control from the Deer Creek NGCC unit. Because BEPC is proposing to use the control technology that will achieve the most stringent NOx
Basin Electric Power Cooperative Deer Creek Station Air Quality Construction Permit Application May 29, 2009 Best Available Control Technology
C-24
control (i.e., the lowest emission rate), no economic evaluation of the alternative NOx control systems is required.4 3.4.2 NOx Control Technologies – Environmental Impacts Combustion modifications designed to decrease NOx formation (i.e., lower temperatures and less oxygen availability) also tend to increase the formation and emission of CO and VOCs. Combustion controls, including dry low-NOx burners, need to be designed to reduce the formation of NOx while maintaining CO and VOC formation at acceptable levels. Other than the NOx/CO-VOC trade-off, there are no environmental issues associated with using combustion controls to reduce NOx emissions from a natural gas-fired combustion turbine. Operation of an SCR system has certain collateral environmental consequences. First, in order to maintain low NOx emissions some excess ammonia will pass through the SCR. Ammonia slip will increase as NOx emissions are driven lower, and will tend to increase as the catalyst becomes deactivated. Ammonia slip from an SCR designed to achieve a controlled NOx emission rate of 3.5 ppmvd @ 15% O2 (30-day average) on a natural gas-fired combustion turbine is expected to be in the range of 2 ppm or less during initial operation. As the catalyst ages and becomes deactivated, ammonia slip can increase; however, the ammonia slip rate is not expected to exceed 5 ppm under normal operating conditions. Second, undesirable reactions can occur in an SCR system, including the oxidation of NH3 and SO2 and the formation of ammonium sulfate salts. A fraction of the SO2 in the flue gas (approximately 4%) will oxidize to SO3 in the presence of the SCR catalyst. SO3 can react with water to form sulfuric acid mist or with the ammonia slip to form ammonium sulfate or ammonium bisulfate. Sulfuric acid mist and ammonium sulfate are classified as condensable particulates; thus, SCR control can result in increased PM10 emissions. Although the formation of condensible particulates will increase with SCR control, natural gas is a low-sulfur fuel; therefore, the increase in condensable particulates will be minimal. Based on emission calculations, SCR at an ammonia slip of 5 ppm will increase condensible PM10 emissions by approximately 0.32 lb/hr (or potentially 1.4 tpy). This increase in condensible PM10 is not considered significant enough as to preclude the use of an SCR system to control NOx emissions.
4 See, New Sour Review Manual, page B.35.
Basin Electric Power Cooperative Deer Creek Station Air Quality Construction Permit Application May 29, 2009 Best Available Control Technology
C-25
Finally, the storage of ammonia on-site increases the risks associated with an accidental ammonia release. Depending on the type, concentration, and quantity of ammonia used, ammonia storage/handling will be subject to regulation as a hazardous substance under CERCLA, Section 313 of the Emergency Planning and Community Right-to-Know Act, Section 112(r) of the Clean Air Act, and Section 311(b)(4) of the Clean Water Act. Although there are collateral environmental issues associated with using an SCR system, the issues are not of such a magnitude as to preclude the use of an SCR system to control NOx emissions. 3.4.3 NOx Control Technologies – Energy Impacts Post-combustion SCR NOx control requires auxiliary power. Auxiliary power requirements associated with SCR include power for the ammonia handling and injection system as well as additional fan power to overcome pressure drop through SCR vessel. Based on engineering calculations, pressure drop through the SCR will be in the range of approximately 4 to 5 in. w.c. Assuming 220 kW/inch auxiliary power requirement, and a power cost of $60/MWh, auxiliary power costs for the SCR control system will be in the range of $500,000/year. Although these costs are significant, BEPC has concluded that SCR represents BACT for NOx control, and that potential economic and energy impacts are not so significant as to exclude SCR from consideration as BACT.
A summary of the Step 4 economic, environmental, and energy impact analysis is provided in Table 3-4.

Basin Electric Power Cooperative Deer Creek Station Air Quality Construction Permit Application May 29, 2009 Best Available Control Technology
C-26
Table 3-4 Summary of NOx BACT Impact Analysis
Control Technology
Controlled NOx Emission Rate*
ppmvd @ 15% O2
Annual NOx Emissions
(tpy)*
Economic Impacts: Average Cost Effectiveness
($/ton removed)
Environmental and Energy
Impacts
Water/Steam Injection Control
35 not calculated No significant collateral environmental impacts.
Dry Low-NOx Combustion
15 455.2 Combustion controls designed to minimize NOx formation (i.e., lower temperatures and less excess O2) can result in increased CO and VOC emissions.
Selective Catalytic Reduction
3.5 116.6
Not Evaluated
BEPC is proposing to use the most effective
NOx control technology as BACT;
therefore, no economic evaluation
of the alternative NOx control systems
is required.
Potential collateral environmental impacts include increased SO2 to SO3 oxidation, increased condensible particulate emissions, ammonia emissions, and ammonia storage and handling issues. The SCR control system will also require auxiliary power to run the ammonia handling and injection system and to overcome pressure drop across the SCR
* Annual emissions were calculated based on a full load combustion turbine operation at annual average ambient conditions without duct firing for approximately 5,852 hours per year, full load operation with duct firing for 2,200 hours per year, and estimated startup/shutdown emissions for approximately 708 hours per year. Detailed emission calculations are included in Appendix B of the Deer Creek PSD Permit Application.
3.5 Step 5: Select BACT for NOx Control Based on the foregoing control technology evaluation, BACT evaluations included in recently submitted PSD permit applications for similar sources, and BACT limits included in recently issued PSD permits (Attachment A), it is concluded that a combination of low-NOx combustion followed by SCR represents BACT for NOx control for the proposed Deer Creek NGCC unit. Based on emission rates achieved in practice at similar sources, and including a reasonable margin to account
Basin Electric Power Cooperative Deer Creek Station Air Quality Construction Permit Application May 29, 2009 Best Available Control Technology
C-27
for normal system fluctuations and long-term SCR operation, the combination of combustion controls and SCR should achieve a controlled NOx emission rate of 3.5 ppmvd @ 15% O2 (30-day average). A controlled NOx emission rate of 3.5 ppmvd @ 15% O2 (approximately 0.013 lb/mmBtu) should be achievable over the life of the catalyst and while maintaining acceptable ammonia slip and minimizing potential collateral environmental impacts. Achieving this emission limit will require the facility to properly operate and maintain the burners as well as the SCR control system on a continuous on-going basis.

Basin Electric Power Cooperative Deer Creek Station Air Quality Construction Permit Application May 29, 2009 Best Available Control Technology
C-28
4.0 BACT ANALYSIS FOR COMBUSTION TURBINE CO CONTROL Emissions of carbon monoxide (CO) result from incomplete fuel combustion. CO is formed from the partial oxidation of fuel carbon. Factors that influence CO formation include improper fuel-to-air ratios, inadequate fuel mixing, inadequate combustion temperatures, and reduced excess O2. Combustion turbine operation at lower loads (below approximately 50%) can also affect combustion controls and the formation of CO. In natural gas-fired combustion turbines, combustion controls designed to minimize NOx formation, including sub-stoichiometric combustion and reduced peak combustion temperatures, can increase the formation of CO. NOx control methods such as lean premix combustion, low flame temperature, and water/steam injection can increase CO. Combustors can be designed to minimize the formation of CO while reducing the peak combustion temperature and NOx emissions. 4.1 Step 1: Identify Potentially Feasible CO Control Options Potentially available control options were identified based on a comprehensive review of available information. CO control technologies with potential application to the Deer Creek NGCC are listed in Table 4-1.
Table 4-1 List of Potential CO Control Options
Control Technology
Combustion Controls Dry Low NOx Combustion Post-Combustion Controls
Oxidation Catalyst Oxidation Catalyst w/ Potassium Carbonate Absorption (EMx™ formerly SCONOx™) Catalytic Combustion (Xonon™)

Basin Electric Power Cooperative Deer Creek Station Air Quality Construction Permit Application May 29, 2009 Best Available Control Technology
C-29
4.2 Step 2: Technical Feasibility of Potential CO Control Options CO control technologies can be divided into two general categories: combustion controls and post-combustion controls. Combustion controls reduce the amount of CO generated in the combustion turbine or duct burner. Post-combustion controls remove CO from the combustion turbine exhaust gas.
4.2.1 Combustion Controls As discussed in section 3.2.1 combustion controls designed to minimize NOx formation, including lower peak combustion temperatures and less excess oxygen, tend to increase the formation of CO emissions. Burner vendors attempt to address these issues by improving fuel-air mixing and ensuring adequate residence times within the combustion zone. Improved mixing will minimize the potential for fuel-rich areas and the resulting formation of CO. Increased residence time within the combustion zone provides the oxygen needed for more complete oxidation. A properly designed and operated combustion turbine effectively functions as a thermal oxidizer. CO formation is minimized when combustion turbine temperature and excess oxygen availability are adequate for complete combustion. Minimizing CO emissions is also in the economical best interest of the combustion turbine operator because CO represents unutilized energy exiting the process. Based on information available from burner vendors, the dry-low NOx burners proposed for the Deer Creek NGCC should be able to maintain an average CO concentration of 9.0 ppmvd (approximately 7.4 ppmvd @ 15% O2) while limiting average NOx emissions to 15 ppmvd @ 15% O2. A CO concentration of 9.0 ppmvd is equivalent to an emission rate of approximately 0.017 lb/mmBtu heat input. Duct firing tends to increase CO emissions from the NGCC unit. Duct burners are direct-fired gas burners located in the turbine exhaust stream, and controlling combustion conditions within this environment can be challenging. Combustion conditions within the HRSG will vary depending on exhaust gas temperature and velocity, uniformity of the exhaust gas flow, and the exhaust gas oxygen and moisture content. Combustion controls installed on the combustion turbine can also make combustion in the HRSG more difficult. More efficient turbines fire to higher exhaust gas temperatures with lower oxygen and higher water content. Burner controls designed to reduce NOx emissions tend to further reduce oxygen levels in the combustion turbine exhaust gas.
Basin Electric Power Cooperative Deer Creek Station Air Quality Construction Permit Application May 29, 2009 Best Available Control Technology
C-30
Exhaust gas flow velocity and uniformity of the flow are also important variables associated with lower emission duct firing. Eddies and localized areas of high or low flow can cause flames to impinge on burner parts or sidewalls. Distribution grids and flow straightening vanes may be used in expanding ducts to achieve the required flow profile across the burners. Flow baffles may also be required to increase the combustion turbine exhaust gas velocity across the burners for optimum combustion and emission performance. Based on information obtained from duct burner vendors, CO emissions associated with the most recently available low-NOx duct burner designs can be limited to 0.05 lb/mmBtu (heat input to the duct burner) while maintaining NOx emissions at approximately 15 ppmvd @ 15% O2. Combustion controls are a technically feasible method of controlling CO emissions from the proposed Deer Creek combustion turbine and duct burners. Proper burner design and operation can minimize NOx emissions, while maintaining CO at acceptable levels. Based on information available from burner vendors, the dry-low NOx burners proposed for the Deer Creek NGCC should be able to maintain an average CO concentration of 9.0 ppmvd (7.4 ppmvd @ 15% O2) while limiting average NOx emissions to 15 ppmvd @ 15% O2. CO emissions associated with duct firing will be limited to 0.05 lb/mmBtu (heat input to the duct burner). Based on emission calculations at full load heat input to the boiler and maximum duct firing (annual average ambient conditions), duct firing will increase CO emissions in the exhaust from 9.0 to 18.3 ppmvd (or approximately 0.025 lb/mmBtu total heat input to the CT and duct burner).5 4.2.2 Post-Combustion CO Controls A second general strategy to minimize CO emissions from a natural gas-fired combined cycle unit is to reduce CO using post-combustion controls. Potentially available post-combustion CO control systems are evaluated below. Post-combustion control systems will be evaluated assuming the combustion turbine and duct burners are designed with low NOx combustion.
4.2.2.1 Oxidation Catalyst Catalytic oxidation systems are designed to oxidize CO to CO2. Catalytic oxidation is a post-combustion technology which reduces CO emissions without the addition of chemical
5 Detailed emission calculations are provided in Appendix B of the Deer Creek PSD Permit Application.

Basin Electric Power Cooperative Deer Creek Station Air Quality Construction Permit Application May 29, 2009 Best Available Control Technology
C-31
reagents. The oxidation catalyst, typically consisting of a noble metal, promotes the oxidation of CO at temperatures approximately 50% below the temperature required for oxidation without the catalyst. The operating temperature range for commercially available CO oxidation catalysts is between 650 and 1,150 oF. On a natural gas-fired combined cycle unit this temperature window occurs within the HRSG. On units equipped with an SCR, the oxidation catalyst system would be installed in the HRSG immediately upstream of the SCR. Oxidation catalyst efficiency varies with inlet CO concentration, inlet gas temperature, and flue gas residence time. In general, removal efficiency will increase with increased flue gas temperatures and increased catalyst bed depth. Bed depth will be limited by pressure drop across the catalyst, and by the location of the SCR within the HRSG. Catalytic oxidation systems have been installed on natural gas-fired combined cycle units, and have demonstrated the ability to effectively reduce CO emissions. In natural gas-turbine applications, catalytic oxidation systems have demonstrated the ability to achieve controlled CO emissions of 2.0 ppmvd @ 15% O2. Depending on inlet CO concentrations, oxidation catalysts have demonstrated the ability to achieve CO reduction efficiencies of approximately 70-90%. Catalytic oxidation is considered a technically feasible and commercially available CO control technology for the proposed Deer Creek NGCC. Based on information available from technology vendors, and emission rates achieved in practice at similar sources, it is concluded that a catalytic oxidation system could achieve a controlled CO emission rate of 3.3 ppmvd (or approximately 2.0 ppmvd @ 15% O2). Based on emission rates of 9.0 ppmvd (without duct firing) and 18.3 ppmvd (with duct firing) the oxidation catalyst system would have to achieve CO removal efficiencies in the range of 63-82%. 4.2.2.2 Oxidation Catalyst w/ Potassium Carbonate Absorption (EMx™ formerly
SCONOx™) The EMxTM control system is described in the NOx BACT analysis (section 3.2.2.3). EMx™ is a post-combustion, multi-pollutant control technology that uses a coated oxidation catalyst to remove NOx, CO, and VOC emissions in the turbine exhaust gas by oxidizing CO to CO2, NO to NO2, and hydrocarbons to CO2 and water. The CO2 is then emitted to the atmosphere, and the NO2 is absorbed onto the potassium carbonate coating
Basin Electric Power Cooperative Deer Creek Station Air Quality Construction Permit Application May 29, 2009 Best Available Control Technology
C-32
on the EMxTM catalyst to form potassium nitrate/nitrite. Depending on flue gas temperatures, the EMx™ oxidation catalyst should achieve CO removal efficiencies similar to those achievable with an oxidation catalyst. As discussed in section 3.2.2.2, there are several currently unresolved technical issues associated with application of the control technology on a large natural gas-fired combined cycle unit. Potential issues include:
For large-scale NGCC applications, the EMx™ catalyst would have to be placed in
the HRSG where the exhaust gas temperatures will be in the range of 500 to 700 °F. Performance of the EMxTM catalyst in a high-temperature application has not been demonstrated in practice.
The dampers and damper bearings, which are moving parts exposed to the hot exhaust gas, could present long-term maintenance and reliability problems. This is particularly true as the damper size and number of dampers increase, as would be necessary in order to use this technology for Deer Creek.
Regeneration of the EMxTM catalyst would require hydrogen gas to be continuously generated (from natural gas) and introduced into the high-temperature zone of the HRSG. Because hydrogen gas is explosive, any leaks in the dampers used to isolate the catalyst for regeneration could create a serious hazard.
In addition to periodic regeneration, the EMxTM catalyst would have to be cleaned at least once per year by removing the catalyst beds from the HRSG and dipping them in a potassium carbonate solution.
The EMxTM and ESx™ processes have the potential to create additional air pollutants, such as hydrogen sulfide (H2S). Emissions of these additional pollutants have not been completely quantified.
To date, the EMx™ (SCONOx) multi-pollutant control system has not been installed and operated on a large NGCC application. It is likely that BEPC would be required to conduct extensive design engineering and testing to evaluate the technical feasibility and long-term effectiveness of the control system at the Deer Creek Station. BACT does not require applicants to experience extended time delays or resource penalties to allow research to be conducted on an emerging control technique. Therefore, at this time the EMx™ control system is not considered an available CO control system, and will not be further evaluated in the BACT analysis.

Basin Electric Power Cooperative Deer Creek Station Air Quality Construction Permit Application May 29, 2009 Best Available Control Technology
C-33
4.2.2.3 Catalytic Combustion (Xonon™) Catalytic combustion systems are described in the NOx BACT analysis (section 3.2.2.6). Catalytic combustion uses a catalyst within the combustor to oxidize a lean air-to-fuel mixture rather than burning with a flame. In a catalytic combustor the air and fuel mixture oxidizes at lower temperatures, producing less NOx, and potentially lower CO emissions. One technical challenge associated with catalytic combustion has been achieving catalyst life long enough to make the combustor commercially viable. The Xonon™ combustion system works by partially burning fuel in a low temperature pre-combustor and completing the combustion in a catalytic combustor. The overall result is lower temperature partial combustion followed by flameless catalytic combustion to reduce CO formation. As described in section 2.3.3.6, to date, the system has successfully completed pilot- and full-scale testing, and has been demonstrated on a 1.5 MW Kawasaki gas turbine. However, the Xonon™ combustion system has not been demonstrated for extended periods of time on a large natural gas-fired combustion turbine. Applications of this technology have been in the 1 to 15 MW range. It is likely that BEPC would be required to conduct extensive design engineering and testing to evaluate the technical feasibility and long-term effectiveness of the control system at the Deer Creek Station. BACT does not require applicants to experience extended time delays or resource penalties to allow research to be conducted on an emerging control technique. Therefore, at this time, catalytic combustion systems (including Xonon™) are not considered available CO control systems, and will not be further evaluated in the BACT analysis.
The results of Step 2 of the CO BACT Analysis (technical feasibility analysis of potential CO control technologies) are summarized in Table 4-2.
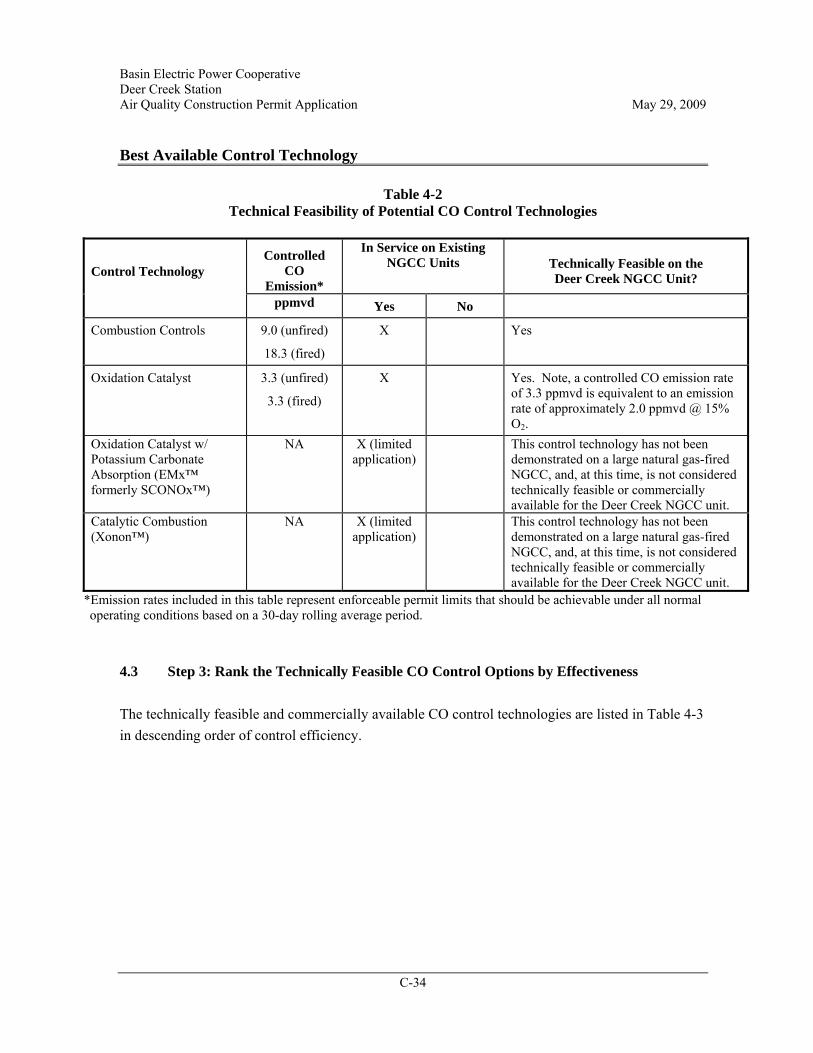
Basin Electric Power Cooperative Deer Creek Station Air Quality Construction Permit Application May 29, 2009 Best Available Control Technology
C-34
Table 4-2 Technical Feasibility of Potential CO Control Technologies
Controlled
CO Emission*
In Service on Existing NGCC Units Technically Feasible on the
Deer Creek NGCC Unit? Control Technology
ppmvd Yes No
Combustion Controls 9.0 (unfired)
18.3 (fired)
X Yes
Oxidation Catalyst 3.3 (unfired)
3.3 (fired)
X Yes. Note, a controlled CO emission rate of 3.3 ppmvd is equivalent to an emission rate of approximately 2.0 ppmvd @ 15% O2.
Oxidation Catalyst w/ Potassium Carbonate Absorption (EMx™ formerly SCONOx™)
NA X (limited application)
This control technology has not been demonstrated on a large natural gas-fired NGCC, and, at this time, is not considered technically feasible or commercially available for the Deer Creek NGCC unit.
Catalytic Combustion (Xonon™)
NA X (limited application)
This control technology has not been demonstrated on a large natural gas-fired NGCC, and, at this time, is not considered technically feasible or commercially available for the Deer Creek NGCC unit.
*Emission rates included in this table represent enforceable permit limits that should be achievable under all normal operating conditions based on a 30-day rolling average period.
4.3 Step 3: Rank the Technically Feasible CO Control Options by Effectiveness The technically feasible and commercially available CO control technologies are listed in Table 4-3 in descending order of control efficiency.

Basin Electric Power Cooperative Deer Creek Station Air Quality Construction Permit Application May 29, 2009 Best Available Control Technology
C-35
Table 4-3 Technical Feasibility of Potential CO/VOC Control Technologies
Technology
Controlled CO Emission Rate
(ppmvd)* Combustion Controls 9.0 (unfired)
18.3 (fired)
Oxidation Catalyst 3.3 (unfired) * Emission rates shown in this table represent controlled emission rates
that should be achievable based on a 30-day rolling average. 4.4 Step 4: Evaluate the Technically Feasible CO Control Technologies
4.4.1 CO Control Technologies – Economic Evaluation The most effective CO control system, in terms of reduced emissions, that is considered to be technically feasible for the proposed NGCC unit consists of combustion controls and post-combustion oxidation catalyst. This combination of controls should be capable of achieving the most stringent controlled CO emission rates on an on-going long-term basis. The effectiveness of the oxidation catalyst system is dependent on several site-specific system variables including inlet CO concentrations, the size of the oxidation catalyst system (i.e., number of catalyst layers), flue gas temperatures, and catalyst deactivation rate. The size of the oxidation catalyst will be limited by pressure drop across the catalyst bed and by the location of the proposed SCR control system. Based on emission rates achieved in practice at similar sources, and including a reasonable margin to account for normal system fluctuations and long-term system operation, the combination of combustion controls and oxidation catalyst should achieve controlled CO emission rates of 3.3 ppmvd (30-day rolling average). The second most effective CO control system is combustion controls designed to minimize CO formation while maintaining NOx at acceptable levels. Based on information available from burner vendors, the dry-low NOx burners proposed for the Deer Creek NGCC should be able to maintain an average CO concentration of 9.0 ppmvd (7.4 ppmvd @ 15% O2), while limiting average NOx emissions to 15 ppmvd @ 15% O2. CO emissions associated with duct firing will be limited to 0.05 lb/mmBtu (heat input to the duct burner). Based on emission calculations at full load heat input to the boiler and maximum duct firing, duct firing will increase CO emissions in the exhaust from 9.0 to 18.3 ppmvd.

Basin Electric Power Cooperative Deer Creek Station Air Quality Construction Permit Application May 29, 2009 Best Available Control Technology
C-36
Economic impacts associated with the potentially feasible CO control systems were evaluated in accordance with EPA guidelines in the NSR Review Manual. For the economic impact analysis, projected annual emissions (tpy) were used to evaluate average cost effectiveness (i.e., dollar per ton removed). Annual emissions (tpy) were calculated assuming: (1) full load heat input to the combustion turbine with maximum heat input to the duct burners for 2,200 hours per year; (2) full load heat input to the combustion turbine without duct firing for 5,852 hours/year; and (3) startup/shutdown emissions for the remaining 708 hours of the year. Detailed emission calculations for each operating scenario are included in Appendix B to the Deer Creek PSD Permit Application. Cost estimates were compiled from a number of data sources. In general, the cost estimating methodology followed guidance provided in the EPA Air Pollution Cost Control Manual.6 Major equipment costs were developed based on published information available from equipment vendors, equipment costs recently developed for similar projects, and cost estimates included in other recently submitted PSD permit applications. Capital costs include the equipment, material, labor, and all other direct costs needed to install the control technologies. Fixed and variable O&M costs were developed for each control system. Fixed O&M costs include operating labor, maintenance labor, maintenance material, and administrative labor. Variable O&M costs include the cost of consumable, including reagent (if applicable), by-product management, water consumption, and auxiliary power requirements. Auxiliary power requirements reflect the additional power requirements associated with operation of the control technology, including operation of larger fans to overcome pressure drop across the control system. Summarized in Table 4-4 are the expected controlled CO emission rates and annual CO mass emissions associated with each technically feasible control technology. Table 4-5 presents the capital costs and annual operating costs associated with building and operating each control system. Table 4-6 shows the average annual cost effectiveness and incremental annual cost effectiveness for each control system. A detailed summary of the cost estimates used in this BACT analysis is included in Attachment B to this BACT Analysis.
6 U.S. Environmental Protection Agency, EPA Air Pollution Cost Control Manual, 6th Ed., Publication Number EPA 452/B-02-001, January 2002.

Basin Electric Power Cooperative Deer Creek Station Air Quality Construction Permit Application May 29, 2009 Best Available Control Technology
C-37
The average annual cost effectiveness of the oxidation catalyst control system is calculated to be $3,324/ton (CO). Equipment costs, energy costs, and annual operating costs (e.g., routine catalyst replacement) all have a significant impact on the cost of the oxidation catalyst control system. Based on economic impacts, oxidation catalyst control for CO should be eliminated from consideration as BACT. Capital costs of the oxidation catalyst system (estimated at $1,133,000), as well as O&M costs (including auxiliary power and catalyst replacement costs) are both significant. Power costs, associated with additional fan power required to overcome pressure drops across the oxidation catalyst, are estimated to be $173,000/year. Catalyst replacement costs are estimated to be $137,000/year. Total annual costs associated with the oxidation catalyst system, including capital recovery are estimated to be in the range of $479,300/year. The significant increase in total annual costs coupled with the relatively small decrease in annual emissions (estimated at 144.2 tpy) results in a relatively high average cost effectiveness for the oxidation catalyst control system. Although oxidation catalyst control systems have been required for CO and VOC control on natural gas-fired combined cycle units, several recently issued PSD permits have been issues with combustion controls as BACT for CO (see, Attachment A to this BACT Analysis). Recently issued PSD permits listed in the RBLC Database requiring good combustion as BACT for CO include Arsenal Hill Power Plant (LA, 3/20/2008), Fairbault Energy Park (MN, 6/5/2007), Progress Bartow Power Plant (FL, 1/26/2007), and Northern States Power Co., Riverside Plant (MN, 5/16/2006).

Basin Electric Power Cooperative Deer Creek Station Air Quality Construction Permit Application May 29, 2009 Best Available Control Technology
C-38
Table 4-4
Annual CO Emissions
Combustion Controls
CO Emission Rate
ppmvd
CO Emissions
(lb/hr)
Hours per Year
(hr)
Total Annual Emissions
(tpy) Full Load Heat Input w/o Duct Firing 9.0 28.5 5,852 83.4
Full Load Heat Input with Duct Firing 18.3 57.2 2,200 62.9
Startup / Shutdown Emissions -- -- 708 108.0
Total Annual Emissions -- -- -- 254.3
Oxidation Catalyst
CO Emission Rate
ppmvd
CO Emissions
(lb/hr)
Hours per Year
(hr)
Total Annual Emissions
(tpy) Full Load Heat Input w/o Duct Firing 3.3 7.6 5,852 22.2
Full Load Heat Input with Duct Firing 3.3 10.3 2,200 11.3
Startup / Shutdown Emissions -- -- 708 76.6
Total Annual Emissions -- -- -- 110.1
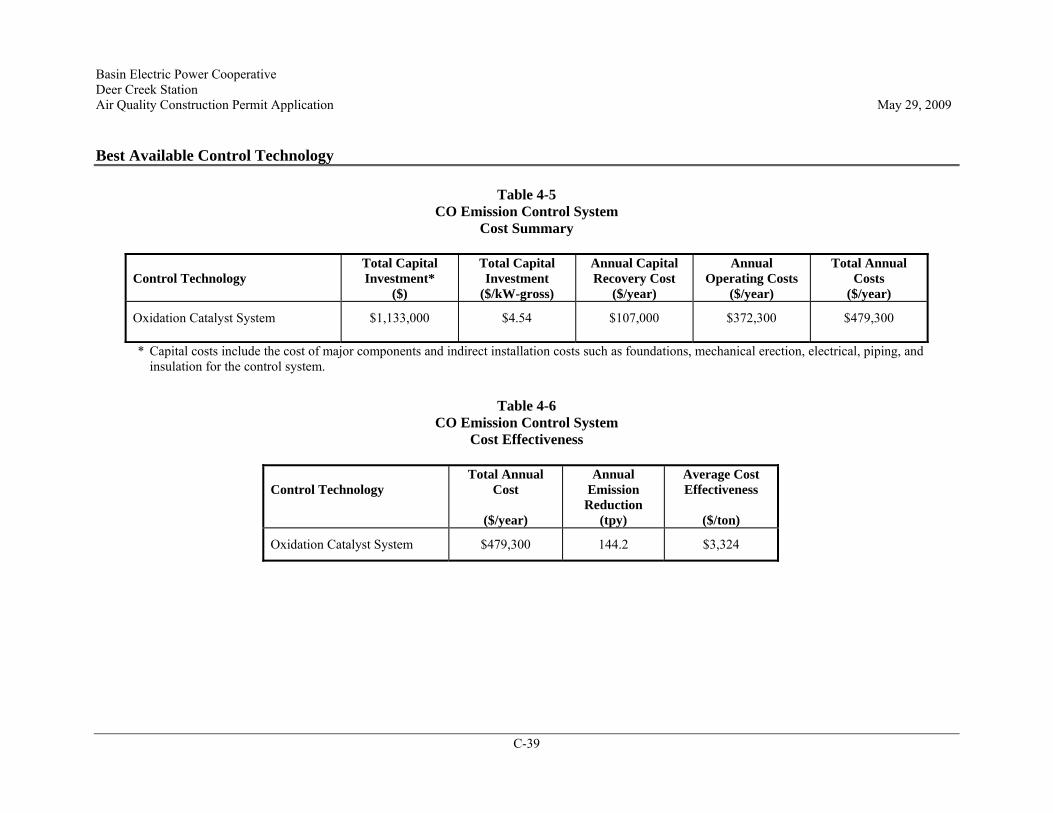
Basin Electric Power Cooperative Deer Creek Station Air Quality Construction Permit Application May 29, 2009 Best Available Control Technology
C-39
Table 4-5 CO Emission Control System
Cost Summary
Control Technology
Total Capital Investment*
($)
Total Capital Investment
($/kW-gross)
Annual Capital Recovery Cost
($/year)
Annual Operating Costs
($/year)
Total Annual Costs
($/year)
Oxidation Catalyst System $1,133,000 $4.54 $107,000 $372,300 $479,300
* Capital costs include the cost of major components and indirect installation costs such as foundations, mechanical erection, electrical, piping, and insulation for the control system.
Table 4-6
CO Emission Control System Cost Effectiveness
Control Technology
Total Annual Cost
($/year)
Annual Emission
Reduction (tpy)
Average Cost Effectiveness
($/ton)
Oxidation Catalyst System $479,300 144.2 $3,324

Basin Electric Power Cooperative Deer Creek Station Air Quality Construction Permit Application May 29, 2009 Best Available Control Technology
C-40
The RBLC Database includes limited information regarding cost effectiveness analyses conducted for NGCC CO controls. However, JEA recently submitted a PSD permit application to the Florida Department of Environmental Quality (FLDEQ) for it Greenland Energy Center (GEC). The permit application, dated 9/10/2008, was for two GE 7FA combined cycle units.7 The BACT analysis for the JEA-GEC facility estimated the cost effectiveness of CO control with an oxidation catalyst at $2,161/ton. JEA concluded that an oxidation catalyst was not BACT for CO control based on “…the economic impacts detailed in the application, as well as recent Department determinations for similar units at similar emission levels.”8 JEA cited several other combined cycle BACT determinations that did not require oxidation catalyst for CO control, including FPL Turkey Point, TECO Bayside Power Station, FMPA Treasure Coast, Progress Energy Hines Power Block 4, and FMPA Cane Island Unit 2. Another recent example is MyPower Corp’s PSD permit application for its proposed Lakeside Energy Center near Waco, Texas (submitted to the Texas Commission on Environmental Quality in December 2008. The proposed Lakeside facility includes two new natural gas-fired combined cycle units. The BACT analysis for the Lakeside Energy Center estimated the cost effectiveness of CO control with an oxidation catalyst at $1,990/ton, and conclude that “[t]his value is considered to be higher than what is considered BACT for CO emissions.”9 The most recent NGCC unit listed in the RBLC Database that identified oxidation catalyst as BACT for CO control and included a cost effectiveness value is the Plant McDonough Combined Cycle facility in Georgia (GA, 1/7/2008). That permit included a CO with an emission limit of 1.8 ppm @ 15% O2 at a cost effectiveness of $1,750/ton. Based on a review of the RBLC Database and recently submitted PSD permit applications, oxidation catalyst emission control has been required in or near ozone non-attainment areas for VOC control, and for CO control on units with a cost effectiveness less than approximately $2,000/ton. Oxidation catalyst control systems have not generally been required for CO control on units located in attainment areas. Based on the economic impact
7 A copy of the JEA-GEC permit application and BACT analysis is available at: http://www.dep.state.fl.us/Air/ permitting/construction.htm.
8 JEA-GCE BACT Analysis, page 3-29.
9 MyPower Corp., Lakeside Energy Center PSD Permit Application, page 6-6, available from TCEQ.

Basin Electric Power Cooperative Deer Creek Station Air Quality Construction Permit Application May 29, 2009 Best Available Control Technology
C-41
associated with post-combustion CO control, BEPC is eliminating oxidation catalyst from consideration as BACT. 4.4.2 CO Control Technologies – Environmental Impacts Combustion modifications designed to decrease CO formation also tend to increase the formation and emission of NOx. Combustion controls, including dry low-NOx burners, need to be designed to reduce the formation of NOx while maintaining CO at acceptable levels. Other than the NOx/CO trade-off, there are no environmental issues associated with using combustion controls to reduce CO emissions from a natural gas-fired combustion turbine. Operation of an oxidation catalyst control system has certain collateral environmental consequences. The most significant environmental impact is associated with increased condensible PM10 emissions. The oxidation catalyst also tends to oxidize flue gas SO2 to SO3. Based on information available from catalyst vendors, the SO2 to SO3 oxidation rate varies with flue gas temperatures, but will be in the range of 50% for high temperature CO catalyst. SO3 can react with water to form sulfuric acid mist, or with ammonia slip from the SCR to form ammonium sulfate and/or ammonium bisulfate. Sulfuric acid mist and ammonium sulfate are classified as condensable particulates; thus, oxidation catalyst control can result in increased PM10 emissions. Based on emission calculations (assuming 50% SO2 to SO3 oxidation across the oxidation catalyst, 5 ppm ammonia slip, and 100% conversion of ammonia to ammonium sulfate) an oxidation catalyst system located upstream of the SCR will increase condensible PM10 emissions (when not duct firing) by approximately 2.5 lb/hr (or potentially 11 tpy). Total PM10 emissions (including periods of duct firing) will increase from approximately 80 tpy to approximately 91 tpy. Although actual emission increases will likely be less (assuming ammonia slip less than 5 ppm), the potential increase in condensible PM10 emissions is significant and supports the conclusion that an oxidation catalyst control system should be excluded as BACT for CO control. 4.4.3 CO Control Technologies – Energy Impacts Post-combustion CO control with an oxidation catalyst control system requires auxiliary power. Auxiliary power requirements associated with an oxidation catalyst includes additional fan power to overcome pressure drop through system. Based on engineering

Basin Electric Power Cooperative Deer Creek Station Air Quality Construction Permit Application May 29, 2009 Best Available Control Technology
C-42
calculations, pressure drop through the oxidation catalyst will be in the range of approximately 1.5 in. w.c. Assuming 220 kW/inch auxiliary power requirement, and a power cost of $60/MWh, auxiliary power costs for the oxidation catalyst control system will be in the range of $173,000/year. This cost was included in the economic impact evaluation of the oxidation catalyst system (section 4.4.1), and contributes to the relatively high cost effectiveness value of the system for the control of CO emissions.
A summary of the Step 4 economic, environmental, and energy impact analysis is provided in Table 4-7.
Table 4-7 Summary of CO BACT Impact Analysis
Control Technology
Controlled CO Emission Rate*
ppmvd
Annual CO Emissions
(tpy)*
Economic Impacts: Average Cost Effectiveness
($/ton removed)
Environmental Impacts
Combustion Controls
9.0 (w/o duct firing)
18.3 (w/ duct firing)
254.3 -- Combustion controls designed to reduce CO emissions could result in an increase in NOx emissions.
Oxidation Catalyst 3.3 110.1 $3,324 Potential collateral environmental impacts include increased SO2 to SO3 oxidation and increased condensible particulate emissions. The oxidation catalyst system will also require auxiliary power to overcome pressure drop through the system.
* Annual emissions were calculated based on a full load combustion turbine operation at annual average ambient conditions without duct firing for approximately 5,852 hours per year, full load operation with duct firing for 2,200 hours per year, and estimated startup/shutdown emissions. Detailed emission calculations are included in Appendix B of the Deer Creek PSD Permit Application.
4.5 Step 5: Select BACT for CO Control Based on the foregoing control technology evaluation, BACT evaluations included in recently submitted PSD permit applications for similar sources, and BACT limits included in recently issued PSD permits (Attachment A), it is concluded that combustion controls represent BACT for CO control for the proposed Deer Creek NGCC unit. Post-combustion oxidation catalyst control

Basin Electric Power Cooperative Deer Creek Station Air Quality Construction Permit Application May 29, 2009 Best Available Control Technology
C-43
is being rejected as BACT based on the significant economic impact associated with the installation and operation of the control system, the limited cost effectiveness of the control system, and the collateral environmental and energy impacts. Based on emission rates achieved in practice at similar sources, and including a reasonable margin to account for normal system fluctuations and long-term operation, combustion controls should achieve a controlled CO emission rate of 9.0 ppmvd (30-day average) without duct firing and 18.3 ppmvd when duct firing. These controlled emission rates should be achievable under all normal combustion turbine operating scenarios (excluding startup and shutdown), while maintaining NOx emissions within acceptable limits. Achieving these emission limits will require the facility to properly operate, tune, and maintain the combustion turbine and duct burners on a continuous on-going basis.

Basin Electric Power Cooperative Deer Creek Station Air Quality Construction Permit Application May 29, 2009 Best Available Control Technology
C-44
5.0 BACT ANALYSIS FOR COMBUSTION TURBINE PM CONTROL Because natural gas is an inherently clean fuel, filterable PM emissions are typically low.10 Filterable emissions are generally considered to be the particles that are captured by the filter in the front-half of a Method 5 or Method 17 sampling train. Condensible particulate matter is material that is emitted in the vapor state which later condenses to from aerosol particulates. Particulate matter from natural gas combustion are usually larger molecular weight hydrocarbons that are not fully combusted, and may result from poor air/fuel mixing or maintenance problems. Total PM (including filterable and condensible fractions) from natural gas combustion are generally assumed to be less than 1.0 micrometer in size.11 For this BACT evaluation it has been assumed that all PM emitted from the CT/HRSG will be less than 2.5 micrometer in size; therefore, PM, PM10, and PM2.5 emission rates are equal. All PM emissions, including PM10 and PM2.5 will be referred to as “PM”. 5.1 Step 1: Identify Potentially Feasible PM Control Options Potentially available PM control options were identified based on a review of available information including PM emission controls identified in recently issued PSD permits for NGCC units listed in U.S.EPA’s RBLC Database (Attachment A). PM control options with potential application to the proposed Deer Creek NGCC unit include mechanical collectors, wet scrubbing systems, electrostatic precipitators (ESP), and fabric filter baghouses. 5.2 Step 2: Technical Feasibility of Potential PM Control Options Natural gas is an inherently clean fuel, and particulate emissions associated with firing natural gas will be minimal. Several particulate control systems have been designed for use on boilers firing fuels that generate significant levels of uncontrolled PM, including boilers firing coal and residual oils. The principal techniques for particulate control from these types of units include mechanical collectors, scrubbing systems, electrostatic precipitators, and fabric filter baghouses. All of these systems have been used extensively on high-particulate boilers; however, these control devices have not been used in natural gas-fired applications, as uncontrolled PM emissions associated with natural gas firing are typically below the controlled emission rates achieved with particulate 10 See, AP-42 page 1.4-3.
11 See, AP-42, Table 1.4-2, footnote c.

Basin Electric Power Cooperative Deer Creek Station Air Quality Construction Permit Application May 29, 2009 Best Available Control Technology
C-45
control systems. Due to the inherently low PM emissions associated with firing natural gas, post-combustion particulate matter control systems would have no practical application to the proposed NGCC unit. The New Source Review Manual states that “[t]echnical judgment on the part of the applicant and the review authority is to be exercised in determining whether a control alternative is applicable to the source type under consideration.”12 This determination of applicability should be made based on an examination of the physical and chemical characteristics of the pollutant-bearing gas stream and comparison to the gas stream characteristics of the source types to which the technology had been applied previously. In this case, the potential PM emissions from the NGCC unit will be significantly lower then controlled PM emission rates achieved with post-combustion control systems on units firing high-particulate fuels. Based on a comparison of flue gas characteristics and engineering judgment, it is concluded that post-combustion particulate control systems have no practical application to a combined cycle unit exclusively firing natural gas. 5.3 Step 3: Rank the Technically Feasible PM Control Options by Effectiveness The technically feasible control technologies with a practical application to control PM emissions from a natural gas-fired combined cycle unit are listed in Table 5-1 in descending order of control efficiency.
Table 5-1 Summary of Technically Feasible and Applicable
NGCC PM Control Technologies
Control Technology
Total PM Emission Rate (lb/hr)
Natural Gas Firing and Combustion Controls
18.6 (without duct firing)
23.2 (with duct firing) * PM emissions were calculated based on emissions information available from
combustion turbine and duct firing burner vendors. Detailed emission calculations are included in Appendix B to the Deer Creek PSD Permit Application.
12 U.S. EPA’s New Source Review Workshop Manual: Prevention of Significant Deterioration and Nonattainment Area Permitting, Draft, October 1990 ("NSR Manual"), page B.18.

Basin Electric Power Cooperative Deer Creek Station Air Quality Construction Permit Application May 29, 2009 Best Available Control Technology
C-46
5.4 Step 4: Evaluate the Technically Feasible PM Control Technologies
5.4.1 PM Control Technologies – Economic Evaluation There are no technically feasible and commercially available PM control technologies applicable to a natural gas-fired combined cycle unit. The inherently low particulate content of natural gas-fuel coupled with good combustion practices is the only applicable PM control strategy available. Because BEPC is proposing the only control strategy that has a practical application to the proposed NGCC unit, no cost effectiveness analysis is required. 5.4.2 PM Control Technologies – Environmental Impacts There are no significant collateral environmental issues associated with firing natural gas and using combustion controls that would exclude the technology from consideration as BACT for PM control.
5.5 Step 5: Select BACT for PM Control BEPC is proposing natural gas-firing and combustion controls as BACT for PM. Based on emissions information available from combustion turbine and duct burner vendors, BEPC is proposing a total PM (filterable + condensible) BACT emission rate of 18.6 lb/hr (approximately 0.01 lb/mmBtu) at full load without duct firing, and 23.2 lb/hr (approximately 0.01 lb/mmBtu) at full load with duct firing. These emission rates includes both filterable and condensible PM, and includes condensibles generated from operation of the SCR control system. All recently permitted NGCC units have been permitted with combustion controls as BACT for PM (see, Attachment A). Because BEPC is proposing to use the only technically feasible control strategy with a practical application to the proposed emission unit, natural gas and combustion controls should be considered BACT for PM control.

Basin Electric Power Cooperative Deer Creek Station Air Quality Construction Permit Application May 29, 2009 Best Available Control Technology
C-47
6.0 BACT ANALYSIS FOR THE EMERGENCY GENERATOR, FIRE WATER PUMP, AND EMERGENCY INLET AIR HEATER
6.1 Emergency Generator and Fire Water Pump BACT Analysis In addition to the combustion turbine and heat recovery steam generator, the Deer Creek Station will have an emergency diesel generator (EDG) and emergency fire-water pump (FWP). The EDG will supply power to the essential service motor control centers during an interruption of the electrical power supply to the site, including building heat and fuel supply systems, plant communication systems, and essential emergency lighting. The FWP provides power the fire-water pumps in the event of an emergency. Based on preliminary design calculations, the EDG will be designed to provide 2,000 kW power during emergency situations, and the FWP will be designed at 577 hp to provide water at a rate of 3,000 gpm. The diesel engines will be designed to fire low-sulfur diesel fuel. Both engines will be used only in case of an emergency and for periodic testing. Annual hours of operation are expected to be less than 100 hour/year each, however, for emissions estimating purposes it was assumed that both engines would operate a maximum of 150 hours per year. Limiting the hours of operation to 150 hours/year will reduce potential annual emissions from the diesel-fired engines by approximately 98%.
6.1.1 Diesel Engine - Baseline Emission Rates Diesel engines are classified as compression ignition (CI) internal combustion (IC) engines. In diesel-fueled CI engines, diesel fuel is injected into the combustion air after the combustion air is compression heated in the engine’s cylinder. Ignition of the fuel/air mixture is spontaneous because the combustion air temperature is above the autoignition temperature of the mixture. The resulting high-pressure products of combustion push the piston through the cylinder. Movement of the piston is converted from linear to rotary motion by a crankshaft. The primary pollutants from IC engines are NOx, hydrocarbons (HC), CO, and PM. NOx formation is directly related to high pressures and temperatures during the combustion process and to the fuel nitrogen content. The other pollutants, HC, CO, and PM are primarily the result of incomplete combustion. IC engines also have the potential to emit SO2 emissions. Potential SO2 emissions are directly related to the sulfur content of the fuel.

Basin Electric Power Cooperative Deer Creek Station Air Quality Construction Permit Application May 29, 2009 Best Available Control Technology
C-48
Table 6-1 summarizes typical emission levels from diesel-fired CI-IC engines based on data published by the U.S.EPA and the Manufactures of Emission Controls Association (MECA).
Table 6-1 Diesel-Fired Compression Ignition Engines
Emission Factors Source NOx CO PM NMHC (Note 1) AP-42 Section 3.4 Large Stationary Diesel Engines (Table 3.4-1)
10.9 g/hp-hr (uncontrolled)
5.9 g/hp-hr
(controlled-Note 2)
2.5 g/hp-hr
0.32 g/hp-hr
0.31 g/hphr
AP-42 Section 3.3 Diesel Industrial Engines <600 hp (Table 3.3-1)
14.1 g/hp-hr
3.03 g/hp-hr
1.0 g/hp-hr
1.12 g/hp-hr
MECA (Note 3) 11.6 g/hp-hr 1.0 g/hp-hr 0.25 – 0.8 g/hp-hr 0.3 g/hp-hr Note 1: NMHC refers to nonmethane hydrocarbon emissions. Note 2: Controlled NOx is by ignition timing retard. Note 3: Emission factors published by the Manufacturers of Emission Controls Association.13
6.1.2 Diesel Engine - Potentially Feasible Emission Control Technologies Emission control technology development for CI engines has primarily been directed at limiting NOx and CO emissions since they are the primary pollutants from these engines. The most common control techniques for diesel CI engines focus on modifying the combustion process to minimize NOx formation and products of incomplete combustion, including CO and HC. More recently, post-combustion absorption systems and catalytic reduction systems have become available for non-road and stationary diesel-fired CI engines. A summary of the potentially feasible combustion controls and post-combustion controls is provided below.
6.1.2.1 Combustion Controls From an emissions control perspective, the most important distinction between different IC engines is whether they are rich-burn or lean-burn.14 Rich-burn engines have an air-
13 See, “Emission Control Technology for Stationary Internal Combustion Engines,” Manufacturers of Emission Control Association, Status Report, July 1997.
14 See, AP-42 Section 3.3, page 3.3-3.
Basin Electric Power Cooperative Deer Creek Station Air Quality Construction Permit Application May 29, 2009 Best Available Control Technology
C-49
to-fuel ratio operating range that is near stoichiometric or fuel-rich of stoichiometric and as a result the exhaust gas has little or no excess oxygen. Lean-burn engines have an air-to-fuel operating range that is fuel-lean of stoichiometric; thus, exhaust from these engines is characterized by medium to high levels of O2. Diesel engines are inherently lean-burn engines. Combustion modifications developed to minimize emissions from CI engines include injection timing retard (ITR), air-to-fuel ratio, and derating.15 As described above, the injection of diesel fuel into the cylinder of a CI engine initiates the combustion process. Retarding the timing of the diesel fuel injection causes the combustion process to occur later in the power stroke when the piston is in the downward motion and combustion chamber volume is increasing. By increasing the volume, the combustion temperature and pressure are lowered, thereby lowering NOx formation. The air-to-fuel ratio can be adjusted by controlling the amount of fuel that enters each cylinder. CI engines are inherently lean-burn engines; however, by reducing the air-to-fuel ratio to near stoichiometric, combustion will occur under conditions of less excess oxygen and reduced combustion temperatures. Lower oxygen levels and combustion temperatures will reduce NOx formation. Derating involves restricting engine operation to lower than normal levels of power production for the given application. Derating reduces cylinder pressures and temperatures thereby lowering NOx formation rates. Combustion controls continue to develop for large stationary and non-road diesel engines. Combustion controls have demonstrated the ability to reduce NOx emissions from CI engines by approximately 50%. Based on AP-42 emission factors (Table 3.4-1), ITR can reduce NOx emissions from large stationary diesel-fired engines from approximately 10.9 g/hp-hr to approximately 5.9 g/hp-hr. 6.1.2.2 Post-Combustion Emission Control Technologies Post-combustion absorption systems and catalytic reduction systems are becoming available for diesel-fired stationary CI engines. A list of potentially feasible post-combustion control technologies applicable to large stationary diesel-fired CI engines is included in Table 6-2. A description of each potentially feasible technology is provided
15 See, AP-42 Section 3.4, page 3.4-3.
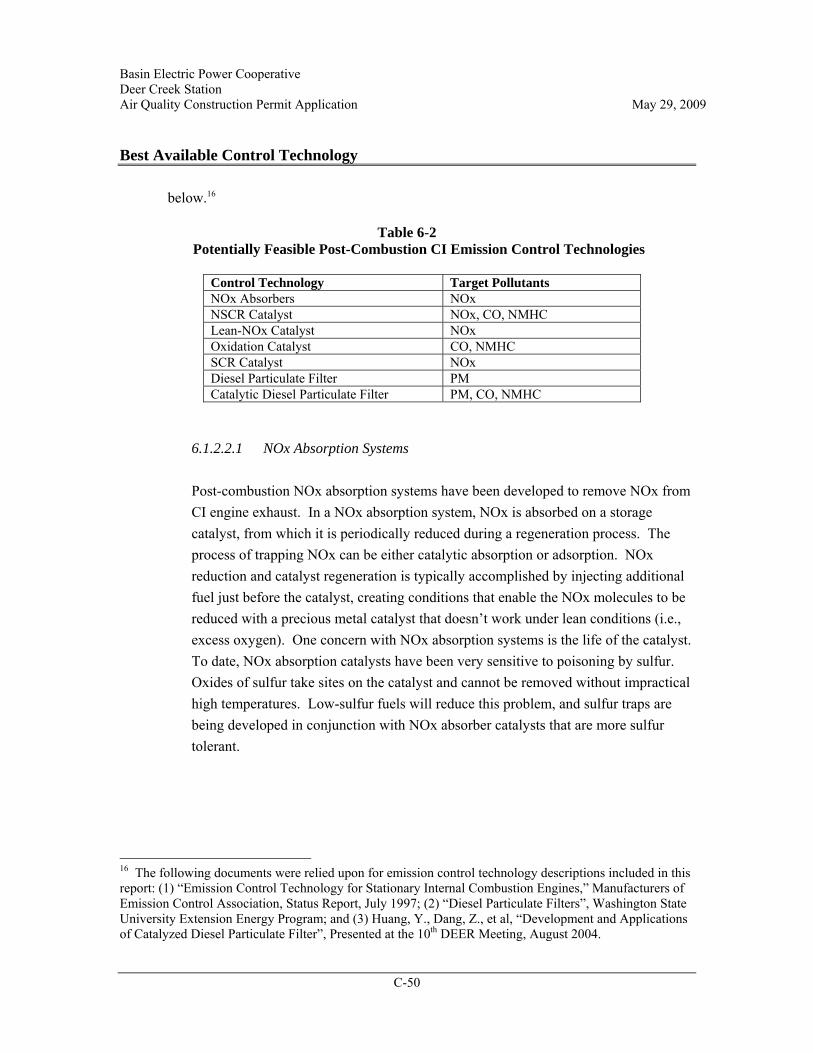
Basin Electric Power Cooperative Deer Creek Station Air Quality Construction Permit Application May 29, 2009 Best Available Control Technology
C-50
below.16
Table 6-2 Potentially Feasible Post-Combustion CI Emission Control Technologies
Control Technology Target Pollutants NOx Absorbers NOx NSCR Catalyst NOx, CO, NMHC Lean-NOx Catalyst NOx Oxidation Catalyst CO, NMHC SCR Catalyst NOx Diesel Particulate Filter PM Catalytic Diesel Particulate Filter PM, CO, NMHC
6.1.2.2.1 NOx Absorption Systems Post-combustion NOx absorption systems have been developed to remove NOx from CI engine exhaust. In a NOx absorption system, NOx is absorbed on a storage catalyst, from which it is periodically reduced during a regeneration process. The process of trapping NOx can be either catalytic absorption or adsorption. NOx reduction and catalyst regeneration is typically accomplished by injecting additional fuel just before the catalyst, creating conditions that enable the NOx molecules to be reduced with a precious metal catalyst that doesn’t work under lean conditions (i.e., excess oxygen). One concern with NOx absorption systems is the life of the catalyst. To date, NOx absorption catalysts have been very sensitive to poisoning by sulfur. Oxides of sulfur take sites on the catalyst and cannot be removed without impractical high temperatures. Low-sulfur fuels will reduce this problem, and sulfur traps are being developed in conjunction with NOx absorber catalysts that are more sulfur tolerant.
16 The following documents were relied upon for emission control technology descriptions included in this report: (1) “Emission Control Technology for Stationary Internal Combustion Engines,” Manufacturers of Emission Control Association, Status Report, July 1997; (2) “Diesel Particulate Filters”, Washington State University Extension Energy Program; and (3) Huang, Y., Dang, Z., et al, “Development and Applications of Catalyzed Diesel Particulate Filter”, Presented at the 10th DEER Meeting, August 2004.
Basin Electric Power Cooperative Deer Creek Station Air Quality Construction Permit Application May 29, 2009 Best Available Control Technology
C-51
6.1.2.2.2 Catalytic Reduction Systems Catalytic reduction systems are also being developed for CI engines. The principle behind catalysts for the control of gaseous emissions from stationary IC engines is that the catalyst creates reducing conditions at acceptable temperatures without being consumed. Catalytic emission control systems typically consist of a steel housing containing a metal or ceramic structure that acts as the catalyst substrate. Catalysts have been developed to reduce NOx, CO, and NMHC emissions to varying degrees. Nonselective catalytic reduction systems (NSCR) have been developed to gaseous emissions from rich-burn engines. NSCR systems can reduce NOx, CO, and NMHC emissions in engines that are operated stoichiometrically or fuel-rich of stoichiometric. In the presence of CO and NMHC in the engine exhaust, NSCR catalysts convert NOx to nitrogen and oxygen, CO to O2 and NMHC to CO2 and water. However, NSCR catalytic reactions require that O2 levels be kept low and that the engine be operated at fuel-rich air-to-fuel ratios. NOx conversion efficiencies drop dramatically in lean-burn engines. Lean-burn engines are characterized by an oxygen-rich exhaust, minimizing the potential for NOx reduction. Research and development has been carried out in the area of lean-NOx catalysts. Lean-NOx catalysts are designed to reduce NOx to nitrogen and water in an oxygen-rich environment. Although a relatively new technology, catalyst formulations and substructures have been developed that can reduce NOx emissions in the oxygen-rich diesel exhaust environment. However, durability of the substructures has proven to be a challenge. Development work continues with both base metal and precious metal catalysts. The injection of a small amount of reducing agent upstream of the catalyst may also improve lean-NOx catalyst performance and durability. Oxidation catalysts have been used on off-road mobile source lean-burn engines. Oxidation catalyst systems contain precious metals impregnated onto a high geometric surface area substrate and are placed in the exhaust stream. Oxidation catalysts have proven effective in controlling CO and NMHC emissions from mobile source CI engines. Oxidation catalyst systems may also reduce particulate emissions from diesel engines by oxidizing the soluble organic fraction of the particulate. Concerns with oxidation catalyst systems include catalyst life, catalyst poisoning, and regeneration of catalyst that has sintered or become deactivated.

Basin Electric Power Cooperative Deer Creek Station Air Quality Construction Permit Application May 29, 2009 Best Available Control Technology
C-52
Selective catalytic reduction (SCR) systems are being developed to control NOx emissions from stationary CI engines. SCR control systems introduce a reducing agent such as ammonia or urea into the diesel exhaust over a catalyst. The catalyst reduces the temperature needed to initiate the reaction between the reducing agent and NOx to form nitrogen and water. Both precious metal and base metal catalysts have been used in SCR systems. Base metal catalysts, typically vanadium and titanium, are used for exhaust gas temperatures between 450 oF and 800 oF. For higher temperatures (675 to 1100 oF), zeolite catalysts may be used. Concerns with SCR control systems include catalyst deactivation and poisoning. Sulfur compounds in the exhaust can poison SCR catalysts and reduce the catalyst activity. With all catalyst control systems, including SCR, oxidation, or lean-NOx catalytic controls on an IC engine, conditions exist that can reduce catalyst activity. Catalytic deactivation may result from (1) chemical poisoning, (2) masking, or (3) thermal sintering. In most cases, the reduced performance results from catalysts being masked by contaminants in the exhaust. Contaminants in diesel-fired CI exhaust include oxides of sulfur and particulates. Catalyst that has been deactivated will not be as effective at reducing the target pollutants. Spent catalysts must be properly managed to prevent improper disposal. 6.1.2.2.3 Particulate Control Systems Diesel particulate emissions are composed of a variety of liquid phase hydrocarbons, and solid phase soot (carbon). Diesel particulate filter (DPF) systems have been developed to control particulate matter emissions from stationary diesel engines. These devices generally consist of a wall-flow type filter positioned in the exhaust stream of the diesel engine. As exhaust gases pass through the system, particulates are removed and retained on the filter media. As the mass of collected particulate matter increases, exhaust gas flow through the filter may become impeded, resulting in an increased backpressure within the filter and reduced engine efficiency. When the backpressure reaches a certain level, the filter needs to be cleaned or regenerated for reuse.

Basin Electric Power Cooperative Deer Creek Station Air Quality Construction Permit Application May 29, 2009 Best Available Control Technology
C-53
Regeneration of filters has been accomplished by periodically enriching the air-to-fuel mixture. An enriched air-to-fuel mixture produces a higher exhaust gas temperature to burn off particulate matter contained in the filter. Thermal filter regeneration of diesel particulate filters typically requires temperatures above 600 oF, and may not be desirable because it can lead to uncontrolled ignition of soot and filter substrate damage. Catalytic regeneration systems have been developed to regenerate DPF collection systems at lower temperatures. Both precious metal and base metal catalysts have been used to reduce the filter regeneration temperature in catalyzed diesel particulate filter (CDPF) control systems. Catalysts reduce the temperature needed to oxidize particulate matter collected in the filter, reducing the potential for temperature overshoot and filter substrate damage. CDPF catalysts are being developed with high activity for the oxidation of CO, HC, and soot, and low activity towards O2 oxidation.
6.1.3 Diesel Engine - Controlled Emission Rates On July 11, 2006, USEPA published final requirements to reduce emissions of air pollutants from stationary CI internal combustion engines (71 FR 39152). The final Stationary Compression Ignition Internal Combustion Engine (CI ICE) New Source Performance Standard (NSPS) limits emissions of NOx, PM, SO2, CO, and HC from stationary diesel internal combustion engines. As part of the rulemaking process, USEPA evaluated the technical feasibility, effectiveness, and cost effectiveness of potentially feasible control technologies, including the control technologies described above. The final CI ICE NSPS requirements were based on the best demonstrated system of continuous emission reduction, considering costs, non-air quality health, and environmental and energy impacts. Manufactures, owners, and operators of diesel engines will be required to meet the applicable NSPS emission standards. The CI ICE NSPS rule will take effect in three increasingly stringent stages:
1. The first stage is a transition period to control emissions from diesel engines built after the rule was proposed, but before the 2007 model year. Owners/operators will comply with this regulation by purchasing an appropriate engine and by operating and maintaining the engine according to the manufacturers’ instructions.
2. Beginning in the model year 2007, engine manufacturers will be required to certify
Basin Electric Power Cooperative Deer Creek Station Air Quality Construction Permit Application May 29, 2009 Best Available Control Technology
C-54
that all new, modified, or reconstructed stationary diesel engines meet the emission levels for NOx, PM, CO, and HC that are required for the same size engine and model year for nonroad diesel engines in the categories designated as Tiers 1 through 4, with a few exceptions.
3. Beginning with 2011 model year engines, add-on controls will be required to achieve
the emission limits for non-emergency engines. Provisions of the CI ICE NSPS apply to manufacturers, owners, and operators of stationary CI internal combustion engines. CI engines include internal combustion engines that are not spark ignition engines, including diesel engines. Both the EDG and FWP are classified as stationary CI engines, and are subject to the provisions of the CI ICE NSPS. Emissions standards established in the rule depend on the engines horsepower class and mode of operation (e.g., continuous operation or emergency operation). Specific definitions applicable to the Deer Creek diesel engines include “emergency stationary internal combustion engine” and “fire pump engine”. Emergency stationary internal combustion engines include:
any stationary internal combustion engine whose operation is limited to emergency situations and required testing and maintenance. Examples include stationary ICE used to produce power for critical networks or equipment (including power supplied to portions of a facility) when electric power from the local utility (or the normal power source, if the facility runs on its own power production) is interrupted, or stationary ICE used to pump water in the case of fire or flood, etc….
Fire pump engine means an emergency stationary internal combustion engine certified to NFPA requirements that is used to provide power to pump water for fire suppression or protection. The EDG and FWP are both classified as emergency stationary internal combustion engines, and the FWP meets the definition of a fire pump engine. The NSPS includes emission standards for model year 2007 and later emergency stationary CI ICE with a maximum engine power less than or equal to 2,237 kW (3,000 hp) and a displacement of less than 10 liters per cylinder that are not fire pump engines (40 CFR 60.4202). The EDG engine proposed for the Deer Creek Station will fall into this classification of engines. The rule requires that emergency stationary CI ICE meet the Tier 2 through Tier 3 non-road CI engine emission standards, and Tier 4 non-road CI engine standards that do not require add-on control, according to the non-road diesel engine schedule

Basin Electric Power Cooperative Deer Creek Station Air Quality Construction Permit Application May 29, 2009 Best Available Control Technology
C-55
in 40 CFR 89.112 and 40 CFR 89.113. CI ICE NSPS emission standards applicable to the EDG are summarized in Table 6-3.
Table 6-3
CI ICE NSPS Emission Standards Applicable to the Deer Creek Station Emergency Diesel Generator
NOx HC NMHC +NOx CO PM kW >
560 g/kW-h g/HP-h g/kW-h g/HP-h g/kW-h g/HP-h g/kW-h g/HP-h g/kW-h g/HP-h
Tier 1 9.2 6.86 1.3 0.97 -- -- 11.4 8.50 0.54 0.40
Tier 2 -- -- -- -- 6.4 4.77 3.5 2.61 0.20 0.15
Fire pump engines are subject to the final rule beginning with the first model year that new fire pump engines in a particular horsepower class must meet standards more stringent than Tier 1 standards, which can be any model year from 2008 to 2011, depending on the horsepower of the engine (40 CFR 60.4202(d)). CI ICE NSPS emission standards applicable to the FWP are summarized in Table 6-4.
Table 6-4 CI ICE NSPS Emission Standards Applicable to the Deer Creek Station
Emergency Diesel Generator
NMHC +NOx CO PM 175 > HP < 750
g/kW-h g/HP-h g/kW-h g/HP-h g/kW-h g/HP-h
2009+ 4.0 3.0 3.5 2.6 0.20 0.15
NSPS emission standards for emergency stationary engines and fire pump engines are based on combustion controls, but will not necessarily require add-on post-combustion controls. Emergency engines require control technologies that have the highest reliability while in the standby mode and require minimal time and adjustments to bring on-line. Combustion controls represent the most reliable control strategy for engines that will not operate on a continuous basis.
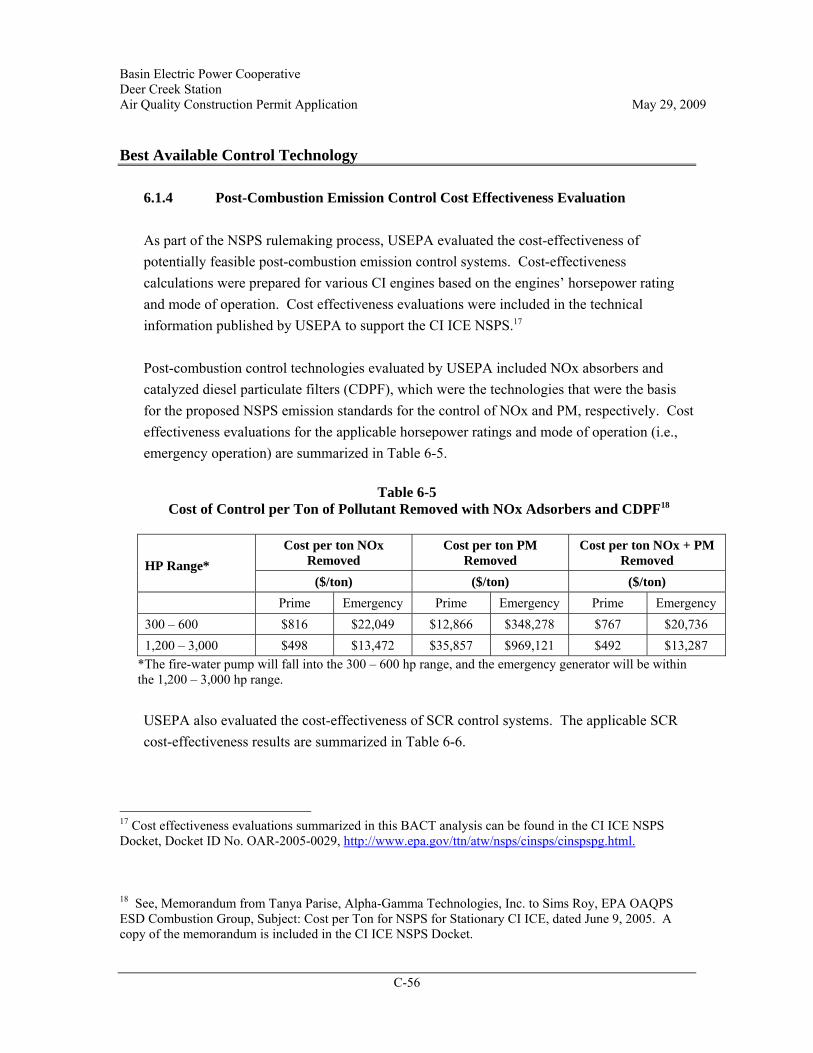
Basin Electric Power Cooperative Deer Creek Station Air Quality Construction Permit Application May 29, 2009 Best Available Control Technology
C-56
6.1.4 Post-Combustion Emission Control Cost Effectiveness Evaluation As part of the NSPS rulemaking process, USEPA evaluated the cost-effectiveness of potentially feasible post-combustion emission control systems. Cost-effectiveness calculations were prepared for various CI engines based on the engines’ horsepower rating and mode of operation. Cost effectiveness evaluations were included in the technical information published by USEPA to support the CI ICE NSPS.17 Post-combustion control technologies evaluated by USEPA included NOx absorbers and catalyzed diesel particulate filters (CDPF), which were the technologies that were the basis for the proposed NSPS emission standards for the control of NOx and PM, respectively. Cost effectiveness evaluations for the applicable horsepower ratings and mode of operation (i.e., emergency operation) are summarized in Table 6-5.
Table 6-5
Cost of Control per Ton of Pollutant Removed with NOx Adsorbers and CDPF18
Cost per ton NOx Removed
Cost per ton PM Removed
Cost per ton NOx + PM Removed
HP Range*
($/ton) ($/ton) ($/ton) Prime Emergency Prime Emergency Prime Emergency 300 – 600 $816 $22,049 $12,866 $348,278 $767 $20,736 1,200 – 3,000 $498 $13,472 $35,857 $969,121 $492 $13,287
*The fire-water pump will fall into the 300 – 600 hp range, and the emergency generator will be within the 1,200 – 3,000 hp range. USEPA also evaluated the cost-effectiveness of SCR control systems. The applicable SCR cost-effectiveness results are summarized in Table 6-6.
17 Cost effectiveness evaluations summarized in this BACT analysis can be found in the CI ICE NSPS Docket, Docket ID No. OAR-2005-0029, http://www.epa.gov/ttn/atw/nsps/cinsps/cinspspg.html.
18 See, Memorandum from Tanya Parise, Alpha-Gamma Technologies, Inc. to Sims Roy, EPA OAQPS ESD Combustion Group, Subject: Cost per Ton for NSPS for Stationary CI ICE, dated June 9, 2005. A copy of the memorandum is included in the CI ICE NSPS Docket.
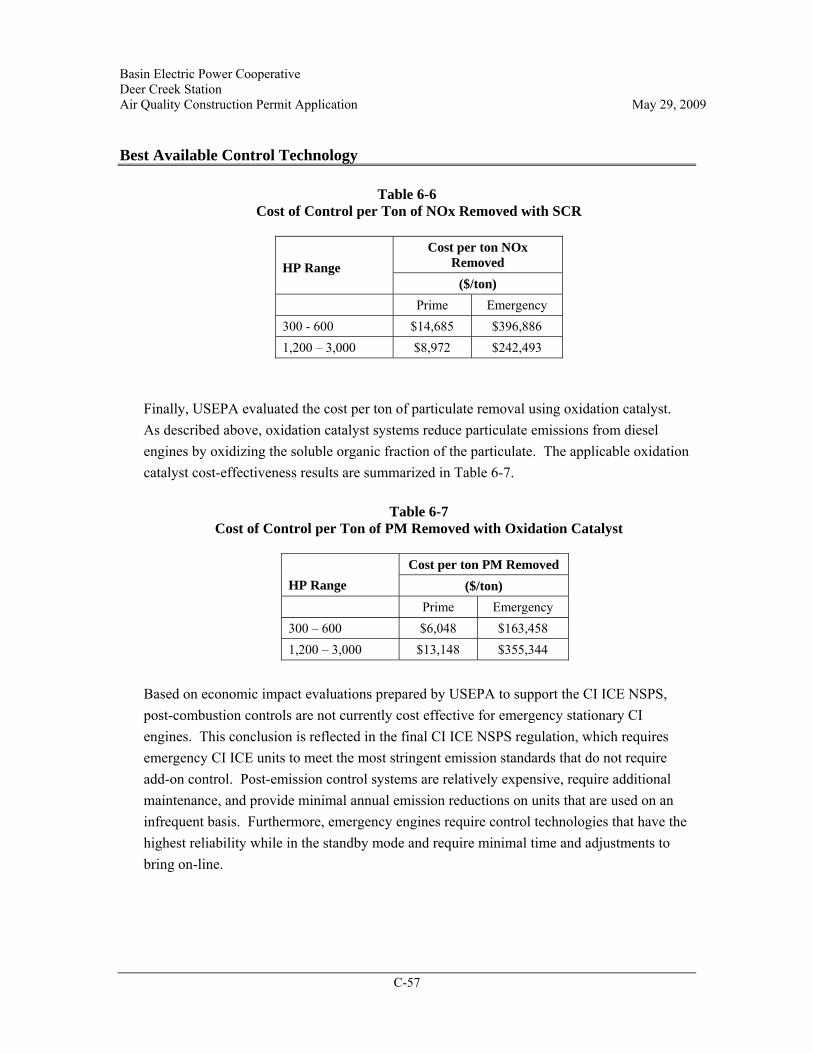
Basin Electric Power Cooperative Deer Creek Station Air Quality Construction Permit Application May 29, 2009 Best Available Control Technology
C-57
Table 6-6 Cost of Control per Ton of NOx Removed with SCR
Cost per ton NOx
Removed HP Range
($/ton) Prime Emergency 300 - 600 $14,685 $396,886 1,200 – 3,000 $8,972 $242,493
Finally, USEPA evaluated the cost per ton of particulate removal using oxidation catalyst. As described above, oxidation catalyst systems reduce particulate emissions from diesel engines by oxidizing the soluble organic fraction of the particulate. The applicable oxidation catalyst cost-effectiveness results are summarized in Table 6-7.
Table 6-7 Cost of Control per Ton of PM Removed with Oxidation Catalyst
Cost per ton PM Removed
HP Range ($/ton) Prime Emergency 300 – 600 $6,048 $163,458 1,200 – 3,000 $13,148 $355,344
Based on economic impact evaluations prepared by USEPA to support the CI ICE NSPS, post-combustion controls are not currently cost effective for emergency stationary CI engines. This conclusion is reflected in the final CI ICE NSPS regulation, which requires emergency CI ICE units to meet the most stringent emission standards that do not require add-on control. Post-emission control systems are relatively expensive, require additional maintenance, and provide minimal annual emission reductions on units that are used on an infrequent basis. Furthermore, emergency engines require control technologies that have the highest reliability while in the standby mode and require minimal time and adjustments to bring on-line.

Basin Electric Power Cooperative Deer Creek Station Air Quality Construction Permit Application May 29, 2009 Best Available Control Technology
C-58
6.1.5 Proposed Emergency Diesel Generator and Fire Water Pump BACT BEPC is proposing low sulfur diesel fuel, combustion controls, and limited annual hours of operation as BACT for the emergency diesel generator and fire water pump. BEPC will meet the applicable CI ICE NSPS emission standards. The applicable NSPS standards were based on the best demonstrated system of continuous emission reduction, considering costs, non-air quality health, and environmental and energy impacts, while taking into consideration that emergency engines require control technologies that have the highest reliability while in the standby mode and require minimal time and adjustments to bring on-line. Commercial availability of post-combustion control technologies is limited, and post-combustion control systems are not economically feasible on emergency stationary CI engines.
6.2 Emergency Inlet Air Heater BACT Analysis The Deer Creek Station will have one natural gas-fired emergency inlet air heater. The function of the heater is to preheat the combustion turbine intake air during periods of extremely cold ambient conditions (i.e., ambient temperature less than approximately -25 °F). The air heater will warm a solution of water and ethylene glycol, which will be piped to a heat exchanger placed at the CT air intake to heat the inlet air. It is anticipated that the heater will operate for approximately 10 to 20 minutes during CT startup under extreme conditions. Once the CT is up to speed, the emergency inlet air heater will be shut off and bleed heat from the compressor will be used to heat the inlet air. The heater design will be based on a maximum heat input of 25.0 mmBtu/hr to provide a heat duty of 19.0 mmBtu/hr, and designed to fire pipeline natural gas. Annual emissions from the emergency inlet air heater will be limited by limiting its hours of operation. The heater will only be used for short periods of time during extremely cold ambient conditions. For emissions estimating purposes it was assumed that during some years the inlet gas heater might need to operate as much as 150 hours. This assumption is considered conservative, because in most years the inlet air heater is expected to operate significantly less.
6.2.1 Emergency Inlet Air Heater – Potential Emissions Potential emissions associated with the combustion of natural gas include NOx, CO, particulate matter, and SO2. NOx formation generally results from the oxidation of atmospheric nitrogen contained in the inlet gas in the high-temperature post-flame region of the combustion zone. CO emissions are generally associated with incomplete combustion.

Basin Electric Power Cooperative Deer Creek Station Air Quality Construction Permit Application May 29, 2009 Best Available Control Technology
C-59
Particulate matter and SO2 emissions associated with firing natural gas will be minimal. Particulate matter from natural gas combustion are usually larger molecular weight hydrocarbons that are not fully combusted, and may result from poor air/fuel mixing or maintenance problems. SO2 emissions are directly related to the sulfur content of the fuel. Natural gas has an inherently low sulfur content. 6.2.2 Emergency Inlet Air Heater – Potentially Feasible Emission Control
Technologies NOx and CO represent the primary emissions from the inlet air heater. Emissions of both pollutants can be controlled using combustion controls. The principal mechanism of NOx formation in natural gas combustion is thermal NOx. Thermal NOx is formed when nitrogen and oxygen in the combustion air combine with one another at the high temperatures in a flame. Two significant factors influencing thermal NOx formation include flame temperature and the quantity of excess air. High excess air levels can result in increased NOx formation because the excess nitrogen and oxygen in the combustion air entering the flame will combine to form thermal NOx. Low excess air firing involves limiting the amount of excess air that is entering the combustion process. NOx formation is inhibited because less oxygen is available in the combustion zone. Limiting the amount of excess air entering a flame is accomplished through burner design. Low NOx burners (LNB)19 limit NOx formation by controlling both the stoichiometric and temperature profiles of the combustion flame in each burner flame envelope. This control is achieved with design features that regulate the aerodynamic distribution and mixing of the fuel and air, yielding reduced oxygen in the primary combustion zone, reduced flame temperature, and reduced residence time at peak combustion temperatures. The combination of these techniques produces lower NOx emissions during the combustion process. However, combustion controls designed to reduce NOx formation can adversely affect CO emissions. Combustion controls used to reduce thermal NOx (e.g., cooler flame and reduced
19 The term “LNB” is used generically in this BACT analysis, and refers to advanced low-NOx burners available from leading boiler/burner manufacturers..

Basin Electric Power Cooperative Deer Creek Station Air Quality Construction Permit Application May 29, 2009 Best Available Control Technology
C-60
O2 availability) tend to increase the formation and emission of CO. During combustion, carbon in the fuel oxidizes to form carbon dioxide (CO2). CO emissions are formed when carbon in the fuel is only partially oxidized. CO formation is minimized when the boiler temperature and excess oxygen availability are adequate for complete combustion. Proper burner design and operation can minimize CO emissions while maintaining NOx emissions at acceptable levels. Other potentially available control options were identified based on a review of available information, including emission controls required in recently issued PSD permits for natural gas-fired boilers listed in USEPA’s RBLC Database. A summary of NOx and CO emissions and emission control technologies identified in the RBLC Database for small process boilers and heaters firing natural gas (Process Type 13.310) is provided in Attachment A. All of the recently permitted natural gas-fired process heaters included in the RBLC Database were permitted with combustion controls as BACT for NOx and CO. Although post-combustion control technologies, such as selective catalytic reduction and catalytic oxidation systems, may be technically feasible to further reduce NOx and CO emissions, post-control systems have not been permitted or installed on small natural gas-fired process heaters. Based on a review of recently permitted natural gas-fired heaters, post-combustion control systems have not been required to control emissions fromf natural gas-fired heaters, and post-combustion control systems have not been demonstrated in practice on these units. Therefore, post-combustion emission control systems will not be evaluated for the emergency inlet air heater. 6.2.3 Emergency Inlet Air Heater - Controlled Emission Rates As discussed above, all of the recently permitted natural gas-fired process heaters included in the RBLC Database were permitted with combustion controls as BACT. Combustion controls will minimize the formation and emission of NOx, while maintaining CO emissions at acceptable levels. Furthermore, natural gas is an inherently clean fuel, with minimal particulate and SO2 emissions. NOx emissions listed in the RBLC Database for natural gas-fired heaters similar in size to the proposed inlet air heater (i.e., in the range of approximately 15 to 35 mmBtu/hr heat input ) have been permitted with NOx emission rates in the range of 0.045 to approximately 0.13 lb/mmBtu (see Attachment A). All of the units were permitted with combustion controls as

Basin Electric Power Cooperative Deer Creek Station Air Quality Construction Permit Application May 29, 2009 Best Available Control Technology
C-61
BACT for NOx. These controlled emission rates are similar to the AP-42 emission factor for small natural gas-fired boilers equipped with low NOx burners (50 lb/mmscf or 0.049 lb/mmBtu, AP-42 Table 1.4-1). CO emissions listed in the RBLC Database for natural gas-fired heaters similar in size to the proposed inlet air heater (i.e., in the range of approximately 15 to 35 mmBtu/hr heat input ) have been permitted with CO emission rates in the range of 0.08 to approximately 0.10 lb/mmBtu (see Attachment A). All of the units were permitted with combustion controls as BACT for CO. These controlled emission rates are similar to the AP-42 emission factor for small natural gas-fired boilers equipped with low NOx burners (84 lb/mmscf or 0.08 lb/mmBtu, AP-42 Table 1.4-1). 6.2.4 Proposed Emergency Inlet Air Heater BACT BEPC is proposing low sulfur diesel fuel, combustion controls, and limited annual hours of operation as BACT for the emergency inlet air heater. Based on a review of available information, including emission limits included in recently issued PSD permits for similar sources, BEPC is proposing the following NOx and CO BACT limits:
NOx 50 lb/mmscf (approximately 0.048 lb/mmBtu) CO 84 lb/mmscf (approximately 0.08 lb/mmBtu)

Basin Electric Power Cooperative Deer Creek Station Air Quality Construction Permit Application May 29, 2009 Best Available Control Technology
C-62
7.0 DEER CREEK STATION - BACT ANALYSIS SUMMARY
Tables 7-1 and 7-2 provide a summary of the proposed BACT emission limits, and associated control technologies, for the Deer Creek Station. Emission rates, control efficiencies, and control technologies proposed for the Deer Creek Station are consistent with the emission rates and technologies proposed for similar facilities. In addition, air quality dispersion modeling based on the proposed emission rates demonstrates that impacts from the proposed facility will be below applicable state and federal standards.
Table 7-1 Proposed CT/HRSG BACT Emission Limits and Control Technologies
Pollutant Proposed BACT Emission Limits Proposed BACT Technology
Compliance Demonstration Methodology
NOx 3.5 ppmvd @ 15% O2 (30-day rolling average)
Selective Catalytic Reduction (SCR)
NOx CEMs
CO 9.0 ppmvd (without duct firing) 18.3 ppmvd (with duct firing)
(30-day rolling averages)
Combustion Controls CO CEMs
Total PM (filterable + condensible)
18.6 lb/hr (without duct firing) 23.2 lb/hr (with duct firing) (avg. of 3 1-hour test runs)
Combustion Controls Stack Test, U.S.EPA Test Methods 201a/202 or the equivalent with Department approval.
Table 7-2 Proposed Auxiliary Combustion Sources BACT Emission Limits and Control Technologies
Source Proposed BACT Emission Limits
Proposed BACT Technology Compliance Demonstration Methodology
Emergency Diesel Generators
Compliance with the applicable CI ICE NSPS
Combustion controls, low-sulfur diesel fuel and limited hours of operation
Compliance with the applicable CI ICE NSPS
Fire Water Pump Compliance with the applicable CI ICE NSPS
Combustion controls, low-sulfur diesel fuel and limited hours of operation
Compliance with the applicable CI ICE NSPS
Emergency Inlet Air Heater
NOx: 0.048 lb/mmBtu CO: 0.08 lb/mmBtu
Combustion controls and limited hours of operation
Operation in accordance with manufacturer’s specifications

Basin Electric Power Cooperative Deer Creek Station Air Quality Construction Permit Application May 29, 2009 Best Available Control Technology
Attachment A-1
Attachment A
RACT/BACT/LAER Clearinghouse Database Search The following tables provide a summary of facilities listed in the RACT/BACT/LAER Clearinghouse (RBLC) Database. A search of the RBLC Database was conducted in May 2009. The following tables were prepared and included as part of this Attachment:
Table A-1 Natural Gas Combined Cycle NOx Emissions Table A-2 Natural Gas Combined Cycle CO Emissions Table A-3 Natural Gas Combined Cycle PM Emissions Table A-4 Small Natural Gas-Fired Process Heater NOx Emission Table A-5 Small Natural Gas-Fired Process Heater CO Emissions
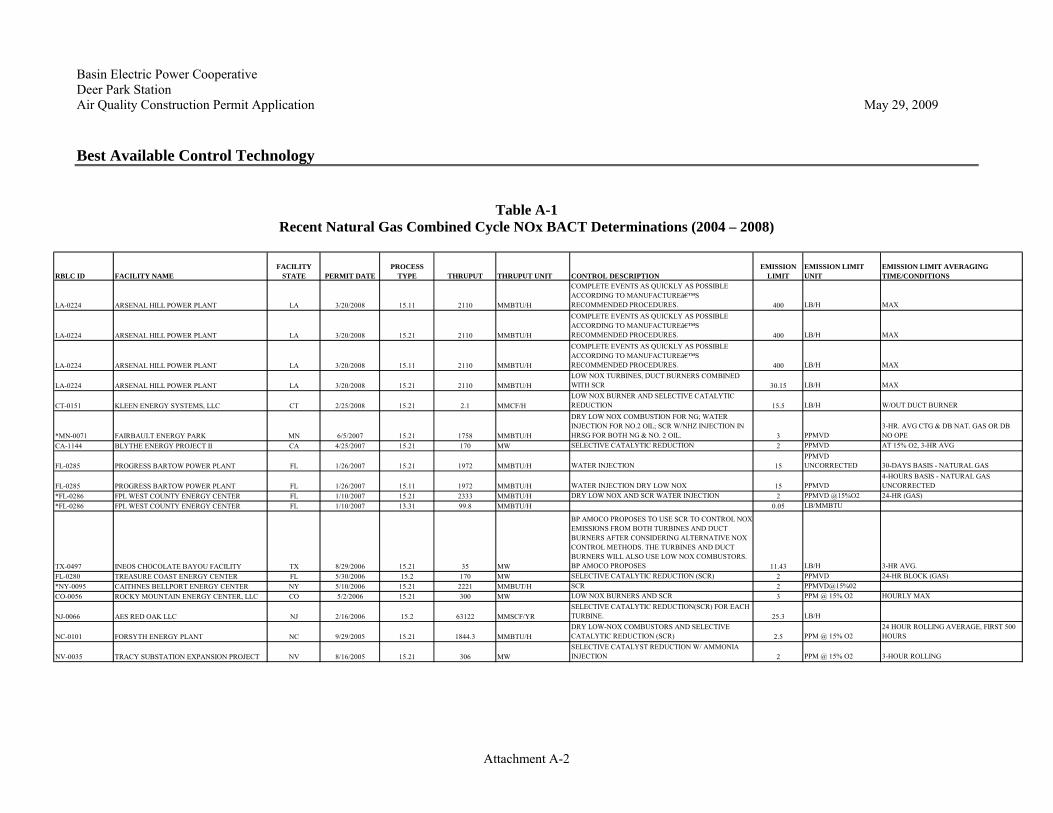
Basin Electric Power Cooperative Deer Park Station Air Quality Construction Permit Application May 29, 2009 Best Available Control Technology
Attachment A-2
Table A-1 Recent Natural Gas Combined Cycle NOx BACT Determinations (2004 – 2008)
RBLC ID FACILITY NAMEFACILITY
STATE PERMIT DATE PROCESS
TYPE THRUPUT THRUPUT UNIT CONTROL DESCRIPTION EMISSION
LIMITEMISSION LIMIT UNIT
EMISSION LIMIT AVERAGING TIME/CONDITIONS
LA-0224 ARSENAL HILL POWER PLANT LA 3/20/2008 15.11 2110 MMBTU/H
COMPLETE EVENTS AS QUICKLY AS POSSIBLE ACCORDING TO MANUFACTURE’S RECOMMENDED PROCEDURES. 400 LB/H MAX
LA-0224 ARSENAL HILL POWER PLANT LA 3/20/2008 15.21 2110 MMBTU/H
COMPLETE EVENTS AS QUICKLY AS POSSIBLE ACCORDING TO MANUFACTURE’S RECOMMENDED PROCEDURES. 400 LB/H MAX
LA-0224 ARSENAL HILL POWER PLANT LA 3/20/2008 15.11 2110 MMBTU/H
COMPLETE EVENTS AS QUICKLY AS POSSIBLE ACCORDING TO MANUFACTURE’S RECOMMENDED PROCEDURES. 400 LB/H MAX
LA-0224 ARSENAL HILL POWER PLANT LA 3/20/2008 15.21 2110 MMBTU/HLOW NOX TURBINES, DUCT BURNERS COMBINED WITH SCR 30.15 LB/H MAX
CT-0151 KLEEN ENERGY SYSTEMS, LLC CT 2/25/2008 15.21 2.1 MMCF/HLOW NOX BURNER AND SELECTIVE CATALYTIC REDUCTION 15.5 LB/H W/OUT DUCT BURNER
*MN-0071 FAIRBAULT ENERGY PARK MN 6/5/2007 15.21 1758 MMBTU/H
DRY LOW NOX COMBUSTION FOR NG; WATER INJECTION FOR NO.2 OIL; SCR W/NHZ INJECTION IN HRSG FOR BOTH NG & NO. 2 OIL. 3 PPMVD
3-HR. AVG CTG & DB NAT. GAS OR DB NO OPE
CA-1144 BLYTHE ENERGY PROJECT II CA 4/25/2007 15.21 170 MW SELECTIVE CATALYTIC REDUCTION 2 PPMVD AT 15% O2, 3-HR AVG
FL-0285 PROGRESS BARTOW POWER PLANT FL 1/26/2007 15.21 1972 MMBTU/H WATER INJECTION 15PPMVD UNCORRECTED 30-DAYS BASIS - NATURAL GAS
FL-0285 PROGRESS BARTOW POWER PLANT FL 1/26/2007 15.11 1972 MMBTU/H WATER INJECTION DRY LOW NOX 15 PPMVD4-HOURS BASIS - NATURAL GAS UNCORRECTED
*FL-0286 FPL WEST COUNTY ENERGY CENTER FL 1/10/2007 15.21 2333 MMBTU/H DRY LOW NOX AND SCR WATER INJECTION 2 PPMVD @15%O2 24-HR (GAS)*FL-0286 FPL WEST COUNTY ENERGY CENTER FL 1/10/2007 13.31 99.8 MMBTU/H 0.05 LB/MMBTU
TX-0497 INEOS CHOCOLATE BAYOU FACILITY TX 8/29/2006 15.21 35 MW
BP AMOCO PROPOSES TO USE SCR TO CONTROL NOX EMISSIONS FROM BOTH TURBINES AND DUCT BURNERS AFTER CONSIDERING ALTERNATIVE NOX CONTROL METHODS. THE TURBINES AND DUCT BURNERS WILL ALSO USE LOW NOX COMBUSTORS. BP AMOCO PROPOSES 11.43 LB/H 3-HR AVG.
FL-0280 TREASURE COAST ENERGY CENTER FL 5/30/2006 15.2 170 MW SELECTIVE CATALYTIC REDUCTION (SCR) 2 PPMVD 24-HR BLOCK (GAS)*NY-0095 CAITHNES BELLPORT ENERGY CENTER NY 5/10/2006 15.21 2221 MMBUT/H SCR 2 PPMVD@15%02CO-0056 ROCKY MOUNTAIN ENERGY CENTER, LLC CO 5/2/2006 15.21 300 MW LOW NOX BURNERS AND SCR 3 PPM @ 15% O2 HOURLY MAX
NJ-0066 AES RED OAK LLC NJ 2/16/2006 15.2 63122 MMSCF/YRSELECTIVE CATALYTIC REDUCTION(SCR) FOR EACH TURBINE. 25.3 LB/H
NC-0101 FORSYTH ENERGY PLANT NC 9/29/2005 15.21 1844.3 MMBTU/HDRY LOW-NOX COMBUSTORS AND SELECTIVE CATALYTIC REDUCTION (SCR) 2.5 PPM @ 15% O2
24 HOUR ROLLING AVERAGE, FIRST 500 HOURS
NV-0035 TRACY SUBSTATION EXPANSION PROJECT NV 8/16/2005 15.21 306 MWSELECTIVE CATALYST REDUCTION W/ AMMONIA INJECTION 2 PPM @ 15% O2 3-HOUR ROLLING
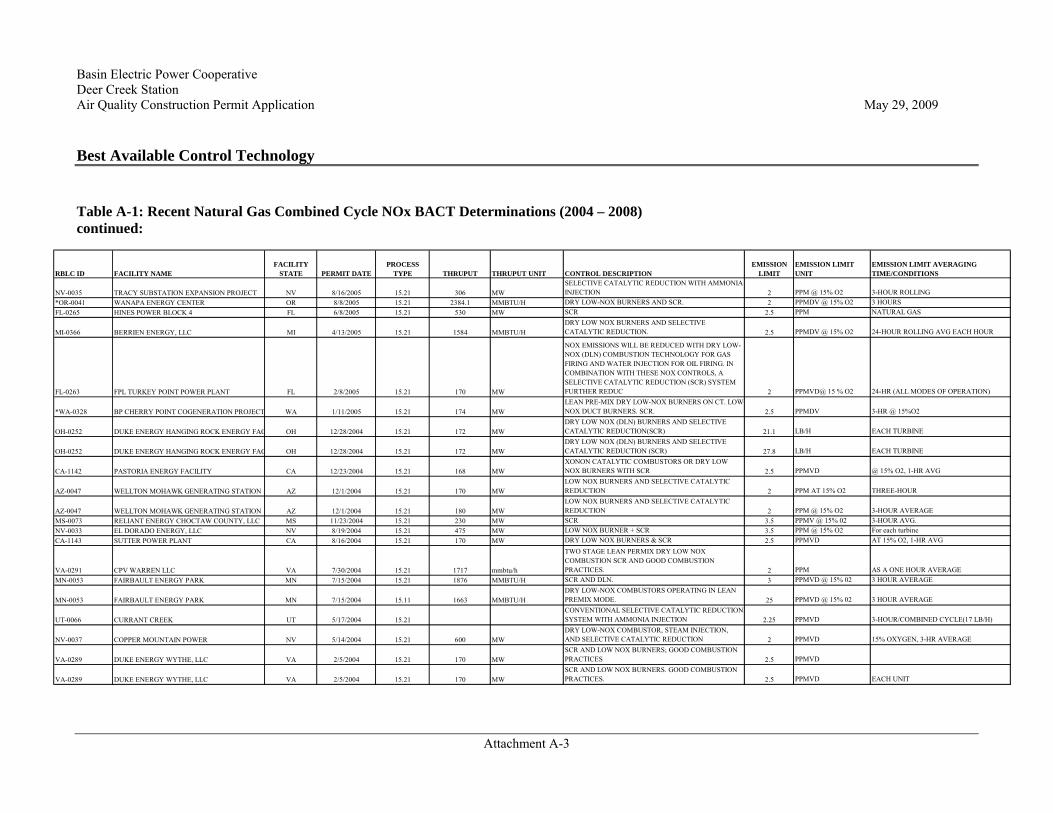
Basin Electric Power Cooperative Deer Creek Station Air Quality Construction Permit Application May 29, 2009 Best Available Control Technology
Attachment A-3
Table A-1: Recent Natural Gas Combined Cycle NOx BACT Determinations (2004 – 2008) continued:
RBLC ID FACILITY NAMEFACILITY
STATE PERMIT DATE PROCESS
TYPE THRUPUT THRUPUT UNIT CONTROL DESCRIPTION EMISSION
LIMITEMISSION LIMIT UNIT
EMISSION LIMIT AVERAGING TIME/CONDITIONS
NV-0035 TRACY SUBSTATION EXPANSION PROJECT NV 8/16/2005 15.21 306 MWSELECTIVE CATALYTIC REDUCTION WITH AMMONIA INJECTION 2 PPM @ 15% O2 3-HOUR ROLLING
*OR-0041 WANAPA ENERGY CENTER OR 8/8/2005 15.21 2384.1 MMBTU/H DRY LOW-NOX BURNERS AND SCR. 2 PPMDV @ 15% O2 3 HOURSFL-0265 HINES POWER BLOCK 4 FL 6/8/2005 15.21 530 MW SCR 2.5 PPM NATURAL GAS
MI-0366 BERRIEN ENERGY, LLC MI 4/13/2005 15.21 1584 MMBTU/HDRY LOW NOX BURNERS AND SELECTIVE CATALYTIC REDUCTION. 2.5 PPMDV @ 15% O2 24-HOUR ROLLING AVG EACH HOUR
FL-0263 FPL TURKEY POINT POWER PLANT FL 2/8/2005 15.21 170 MW
NOX EMISSIONS WILL BE REDUCED WITH DRY LOW-NOX (DLN) COMBUSTION TECHNOLOGY FOR GAS FIRING AND WATER INJECTION FOR OIL FIRING. IN COMBINATION WITH THESE NOX CONTROLS, A SELECTIVE CATALYTIC REDUCTION (SCR) SYSTEM FURTHER REDUC 2 PPMVD@ 15 % O2 24-HR (ALL MODES OF OPERATION)
*WA-0328 BP CHERRY POINT COGENERATION PROJECT WA 1/11/2005 15.21 174 MWLEAN PRE-MIX DRY LOW-NOX BURNERS ON CT. LOW-NOX DUCT BURNERS. SCR. 2.5 PPMDV 3-HR @ 15%O2
OH-0252 DUKE ENERGY HANGING ROCK ENERGY FAC OH 12/28/2004 15.21 172 MWDRY LOW NOX (DLN) BURNERS AND SELECTIVE CATALYTIC REDUCTION(SCR) 21.1 LB/H EACH TURBINE
OH-0252 DUKE ENERGY HANGING ROCK ENERGY FAC OH 12/28/2004 15.21 172 MWDRY LOW NOX (DLN) BURNERS AND SELECTIVE CATALYTIC REDUCTION (SCR) 27.8 LB/H EACH TURBINE
CA-1142 PASTORIA ENERGY FACILITY CA 12/23/2004 15.21 168 MWXONON CATALYTIC COMBUSTORS OR DRY LOW NOX BURNERS WITH SCR 2.5 PPMVD @ 15% O2, 1-HR AVG
AZ-0047 WELLTON MOHAWK GENERATING STATION AZ 12/1/2004 15.21 170 MWLOW NOX BURNERS AND SELECTIVE CATALYTIC REDUCTION 2 PPM AT 15% O2 THREE-HOUR
AZ-0047 WELLTON MOHAWK GENERATING STATION AZ 12/1/2004 15.21 180 MWLOW NOX BURNERS AND SELECTIVE CATALYTIC REDUCTION 2 PPM @ 15% O2 3-HOUR AVERAGE
MS-0073 RELIANT ENERGY CHOCTAW COUNTY, LLC MS 11/23/2004 15.21 230 MW SCR 3.5 PPMV @ 15% 02 3-HOUR AVG.NV-0033 EL DORADO ENERGY, LLC NV 8/19/2004 15.21 475 MW LOW NOX BURNER + SCR 3.5 PPM @ 15% O2 For each turbineCA-1143 SUTTER POWER PLANT CA 8/16/2004 15.21 170 MW DRY LOW NOX BURNERS & SCR 2.5 PPMVD AT 15% O2, 1-HR AVG
VA-0291 CPV WARREN LLC VA 7/30/2004 15.21 1717 mmbtu/h
TWO STAGE LEAN PERMIX DRY LOW NOX COMBUSTION SCR AND GOOD COMBUSTION PRACTICES. 2 PPM AS A ONE HOUR AVERAGE
MN-0053 FAIRBAULT ENERGY PARK MN 7/15/2004 15.21 1876 MMBTU/H SCR AND DLN. 3 PPMVD @ 15% 02 3 HOUR AVERAGE
MN-0053 FAIRBAULT ENERGY PARK MN 7/15/2004 15.11 1663 MMBTU/HDRY LOW-NOX COMBUSTORS OPERATING IN LEAN PREMIX MODE. 25 PPMVD @ 15% 02 3 HOUR AVERAGE
UT-0066 CURRANT CREEK UT 5/17/2004 15.21CONVENTIONAL SELECTIVE CATALYTIC REDUCTION SYSTEM WITH AMMONIA INJECTION 2.25 PPMVD 3-HOUR/COMBINED CYCLE(17 LB/H)
NV-0037 COPPER MOUNTAIN POWER NV 5/14/2004 15.21 600 MWDRY LOW-NOX COMBUSTOR, STEAM INJECTION, AND SELECTIVE CATALYTIC REDUCTION 2 PPMVD 15% OXYGEN, 3-HR AVERAGE
VA-0289 DUKE ENERGY WYTHE, LLC VA 2/5/2004 15.21 170 MWSCR AND LOW NOX BURNERS; GOOD COMBUSTION PRACTICES 2.5 PPMVD
VA-0289 DUKE ENERGY WYTHE, LLC VA 2/5/2004 15.21 170 MWSCR AND LOW NOX BURNERS. GOOD COMBUSTION PRACTICES. 2.5 PPMVD EACH UNIT
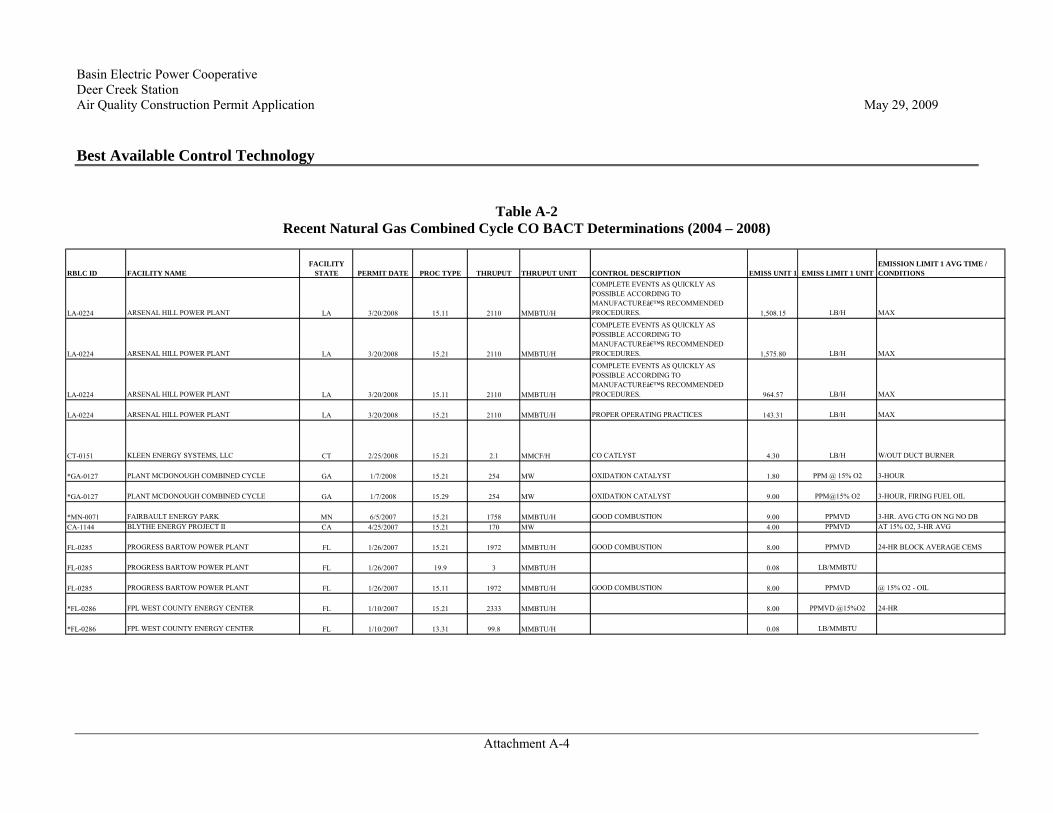
Basin Electric Power Cooperative Deer Creek Station Air Quality Construction Permit Application May 29, 2009 Best Available Control Technology
Attachment A-4
Table A-2
Recent Natural Gas Combined Cycle CO BACT Determinations (2004 – 2008)
RBLC ID FACILITY NAME FACILITY
STATE PERMIT DATE PROC TYPE THRUPUT THRUPUT UNIT CONTROL DESCRIPTION EMISS UNIT 1 EMISS LIMIT 1 UNITEMISSION LIMIT 1 AVG TIME / CONDITIONS
LA-0224 ARSENAL HILL POWER PLANT LA 3/20/2008 15.11 2110 MMBTU/H
COMPLETE EVENTS AS QUICKLY AS POSSIBLE ACCORDING TO MANUFACTURE’S RECOMMENDED PROCEDURES. 1,508.15 LB/H MAX
LA-0224 ARSENAL HILL POWER PLANT LA 3/20/2008 15.21 2110 MMBTU/H
COMPLETE EVENTS AS QUICKLY AS POSSIBLE ACCORDING TO MANUFACTURE’S RECOMMENDED PROCEDURES. 1,575.80 LB/H MAX
LA-0224 ARSENAL HILL POWER PLANT LA 3/20/2008 15.11 2110 MMBTU/H
COMPLETE EVENTS AS QUICKLY AS POSSIBLE ACCORDING TO MANUFACTURE’S RECOMMENDED PROCEDURES. 964.57 LB/H MAX
LA-0224 ARSENAL HILL POWER PLANT LA 3/20/2008 15.21 2110 MMBTU/H PROPER OPERATING PRACTICES 143.31 LB/H MAX
CT-0151 KLEEN ENERGY SYSTEMS, LLC CT 2/25/2008 15.21 2.1 MMCF/H CO CATLYST 4.30 LB/H W/OUT DUCT BURNER
*GA-0127 PLANT MCDONOUGH COMBINED CYCLE GA 1/7/2008 15.21 254 MW OXIDATION CATALYST 1.80 PPM @ 15% O2 3-HOUR
*GA-0127 PLANT MCDONOUGH COMBINED CYCLE GA 1/7/2008 15.29 254 MW OXIDATION CATALYST 9.00 PPM@15% O2 3-HOUR, FIRING FUEL OIL
*MN-0071 FAIRBAULT ENERGY PARK MN 6/5/2007 15.21 1758 MMBTU/H GOOD COMBUSTION 9.00 PPMVD 3-HR. AVG CTG ON NG NO DBCA-1144 BLYTHE ENERGY PROJECT II CA 4/25/2007 15.21 170 MW 4.00 PPMVD AT 15% O2, 3-HR AVG
FL-0285 PROGRESS BARTOW POWER PLANT FL 1/26/2007 15.21 1972 MMBTU/H GOOD COMBUSTION 8.00 PPMVD 24-HR BLOCK AVERAGE CEMS
FL-0285 PROGRESS BARTOW POWER PLANT FL 1/26/2007 19.9 3 MMBTU/H 0.08 LB/MMBTU
FL-0285 PROGRESS BARTOW POWER PLANT FL 1/26/2007 15.11 1972 MMBTU/H GOOD COMBUSTION 8.00 PPMVD @ 15% O2 - OIL
*FL-0286 FPL WEST COUNTY ENERGY CENTER FL 1/10/2007 15.21 2333 MMBTU/H 8.00 PPMVD @15%O2 24-HR
*FL-0286 FPL WEST COUNTY ENERGY CENTER FL 1/10/2007 13.31 99.8 MMBTU/H 0.08 LB/MMBTU

Basin Electric Power Cooperative Deer Creek Station Air Quality Construction Permit Application May 29, 2009 Best Available Control Technology
Attachment A-5
Table A-2: Recent Natural Gas Combined Cycle CO BACT Determinations (2004 – 2008) continued:
RBLC ID FACILITY NAME FACILITY
STATE PERMIT DATE PROC TYPE THRUPUT THRUPUT UNIT CONTROL DESCRIPTION EMISS UNIT 1 EMISS LIMIT 1 UNITEMISSION LIMIT 1 AVG TIME / CONDITIONS
TX-0497 INEOS CHOCOLATE BAYOU FACILITY TX 8/29/2006 15.21 35 MW
BP AMOCO PROPOSES PROPER COMBUSTION CONTROL AS BACT FOR CO AND VOC EMISSIONS FROM THE TURBINES AND DUCT BURNERS. CO EMISSIONS FROM EACH TURBINE WILL NOT EXCEED 15 PPMVD AT 85% TO 100% OF BASE LOAD. CO EMISSIONS FROM EACH TU 66.81 LB/H
FL-0280 TREASURE COAST ENERGY CENTER FL 5/30/2006 15.2 170 MW GOOD COMBUSTION 6.00 PPM 12-MONTH ROLLING
MN-0066NORTHERN STATES POWER CO. DBA XCEL ENERGY - RIVERSIDE PLANT MN 5/16/2006 15.21 1885 mmbtu/h GOOD COMBUSTION PRACTICES 10.00 PPMVD @ 15% O2 3-HR BLOCK
*NY-0095 CAITHNES BELLPORT ENERGY CENTER NY 5/10/2006 15.21 2221 MMBUT/H OXIDATION CATALYST 2.00 PPMVD@15%02
CO-0056 ROCKY MOUNTAIN ENERGY CENTER, LLC CO 5/2/2006 15.21 300 MWUSE GOOD COMBUSTION CONTROL PRACTICES AND CATALISTIC OXIDATION. 3.00 PPM @ 15% O2
NJ-0066 AES RED OAK LLC NJ 2/16/2006 15.2 63122 MMSCF/YR OXIDATION CATALYST FOR EACH TURBINE. 20.69 LB/H
NC-0101 FORSYTH ENERGY PLANT NC 9/29/2005 15.21 1844.3 MMBTU/HGOOD COMBUSTION PRACTICES AND EFFICIENT PROCESS DESIGN 25.90 PPM @ 15% O2 3-hr avg
NC-0101 FORSYTH ENERGY PLANT NC 9/29/2005 15.21 1844.3 MMBTU/HGOOD COMBUSTION PRACTICES AND EFFICIENT PROCESS DESIGN. 11.60 PPM @ 15% O2 3-hour average
NV-0035 TRACY SUBSTATION EXPANSION PROJECT NV 8/16/2005 15.21 306 MW OXIDATION CATALYST 3.50 PPM @ 15% O2 3-HOUR ROLLING
NV-0035 TRACY SUBSTATION EXPANSION PROJECT NV 8/16/2005 15.21 306 MW OXIDATION CATALYST SYSTEM 3.50 PPM @ 15% O2 3-HOUR ROLLING
MN-0060 HIGH BRIDGE GENERATING PLANT MN 8/12/2005 15.21 330 MEGAWATTS GOOD COMBUSTION PRACTICES 10.00 PPM @ 15% O2 TURBINE W/O DUCT-BURNER
*OR-0041 WANAPA ENERGY CENTER OR 8/8/2005 15.21 2384.1 MMBTU/H OXIDATION CATALYST. 2.00 PPMDV @ 15% O2 3 HOURSFL-0265 HINES POWER BLOCK 4 FL 6/8/2005 15.21 530 MW GOOD COMBUSTION 8.00 PPM NATURAL GAS
MI-0366 BERRIEN ENERGY, LLC MI 4/13/2005 15.21 1584 MMBTU/H CATALYTIC OXIDATION. 2.00 PPMDV @ 15% O2 3-HOUR BLOCK

Basin Electric Power Cooperative Deer Creek Station Air Quality Construction Permit Application May 29, 2009 Best Available Control Technology
Attachment A-6
Table A-2: Recent Natural Gas Combined Cycle CO BACT Determinations (2004 – 2008) continued:
RBLC ID FACILITY NAME FACILITY
STATE PERMIT DATE PROC TYPE THRUPUT THRUPUT UNIT CONTROL DESCRIPTION EMISS UNIT 1 EMISS LIMIT 1 UNITEMISSION LIMIT 1 AVG TIME / CONDITIONS
FL-0263 FPL TURKEY POINT POWER PLANT FL 2/8/2005 15.21 170 MW
CO WILL BE MINIMIZED BY THE EFFICIENT COMBUSTION OF NATURAL GAS AND DISTILLATE OIL AT HIGH TEMPERATURES 8.00 PPMVD @ 15 % O2
24-HR AVG. TIME (CT & DUCT BURNER )
*WA-0328 BP CHERRY POINT COGENERATION PROJECT WA 1/11/2005 15.21 174 MWLEAN PRE-MIX CT BURNER & OXIDATION CATALYST 2.00 PPMDV 3-HR @ 15%O2
OH-0252DUKE ENERGY HANGING ROCK ENERGY FACILITY OH 12/28/2004 15.21 172 MW 25.70 LB/H EACH TURBINE
OH-0252DUKE ENERGY HANGING ROCK ENERGY FACILITY OH 12/28/2004 15.21 172 MW 50.30 LB/H EACH TURBINE
CA-1142 PASTORIA ENERGY FACILITY CA 12/23/2004 15.21 168 MWXONON CATALYTIC COMBUSTORS OR DRY LOW NOX BURNERS & SCR 6.00 PPMVD @ 15% O2, 3-HR ROLLING AVG
AZ-0047 WELLTON MOHAWK GENERATING STATION AZ 12/1/2004 15.21 170 MW OXIDATION CATALYST 3.00 PPM @ 15% O2 3-HOUR AVERAGE
AZ-0047 WELLTON MOHAWK GENERATING STATION AZ 12/1/2004 15.21 180 MW OXIDATION CATALYST 3.00 PPM @ 15% O2 3-HOUR AVERAGE
MS-0073 RELIANT ENERGY CHOCTAW COUNTY, LLC MS 11/23/2004 15.21 230 MW SCR 18.36 PPMV @ 1`5% 02 3-HOUR AVG.
MD-0032 DICKERSON MD 11/5/2004 15.11 196 MW OXIDATION CATALYST 84.20 LB/H3HR AVG FIRING NG W/O DB IN SIMP CYCLE
MD-0032 DICKERSON MD 11/5/2004 15.21 196 MW OXIDATION CATALYST 8.40 LB/H3HR AVG FIRING NG W/O DB IN COMB. CYCLE
MD-0032 DICKERSON MD 11/5/2004 15.21 196 MW OXIDATION CATALYST 7.60 LB/H3-HR AVG FIRING NG W/DB IN COMB CYCLE
NV-0033 EL DORADO ENERGY, LLC NV 8/19/2004 15.21 475 MW OXIDATION CATALYST 2.60 PPM @ 15% O2 For each CTGCA-1143 SUTTER POWER PLANT CA 8/16/2004 15.21 170 MW OXIDATION CATALYST SYSEM 4.00 PPMVD AT 15% O2, 3-HR AVG
VA-0291 CPV WARREN LLC VA 7/30/2004 15.21 1717 mmbtu/hOXIDATION CATALYST. GOOD COMBUSTION PRACTICES. 1.30 PPMVD W/O POWER AUGMENTATION

Basin Electric Power Cooperative Deer Creek Station Air Quality Construction Permit Application May 29, 2009 Best Available Control Technology
Attachment A-7
Table A-2: Recent Natural Gas Combined Cycle CO BACT Determinations (2004 – 2008) continued:
RBLC ID FACILITY NAME FACILITY
STATE PERMIT DATE PROC TYPE THRUPUT THRUPUT UNIT CONTROL DESCRIPTION EMISS UNIT 1 EMISS LIMIT 1 UNITEMISSION LIMIT 1 AVG TIME / CONDITIONS
VA-0291 CPV WARREN LLC VA 7/30/2004 15.21 1717 mmbtu/hOXIDATION CATALYST, AND GOOD COMBUSTION PRACTICES. 1.80 PPMVD
POWER AUGMENTATION DUCT BURNING
MN-0053 FAIRBAULT ENERGY PARK MN 7/15/2004 15.21 1876 MMBTU/H GOOD COMBUSTION PRACTICES. 10.00 PPMVD @ 15% O2 3 HOUR AVERAGE
MN-0053 FAIRBAULT ENERGY PARK MN 7/15/2004 15.11 1663 MMBTU/H GOOD COMBUSTION PRACTICES. 10.00 PPMVD @ 15% 02 3 HOUR AVERAGE
UT-0066 CURRANT CREEK UT 5/17/2004 15.21OXIDATINO CATALYST FOR COMBINED CYCLE MODE OF OPERATION 3.00 PPMVD
3-HOUR/COMBINED CYCLE(11.6 LB/H)
NV-0037 COPPER MOUNTAIN POWER NV 5/14/2004 15.21 600 MWGOOD COMBUSTOR DESIGN AND AN OXIDATION CATALYST 3.00 PPMVD
15% OXYGEN, THREE-HOUR AVERAGE
VA-0289 DUKE ENERGY WYTHE, LLC VA 2/5/2004 15.21 170 MW GOOD COMBUSTION PRACTICES 14.60 PPMVD
VA-0289 DUKE ENERGY WYTHE, LLC VA 2/5/2004 15.21 170 MW GOOD COMBUSTION PRACTICES. 9.00 PPMVD
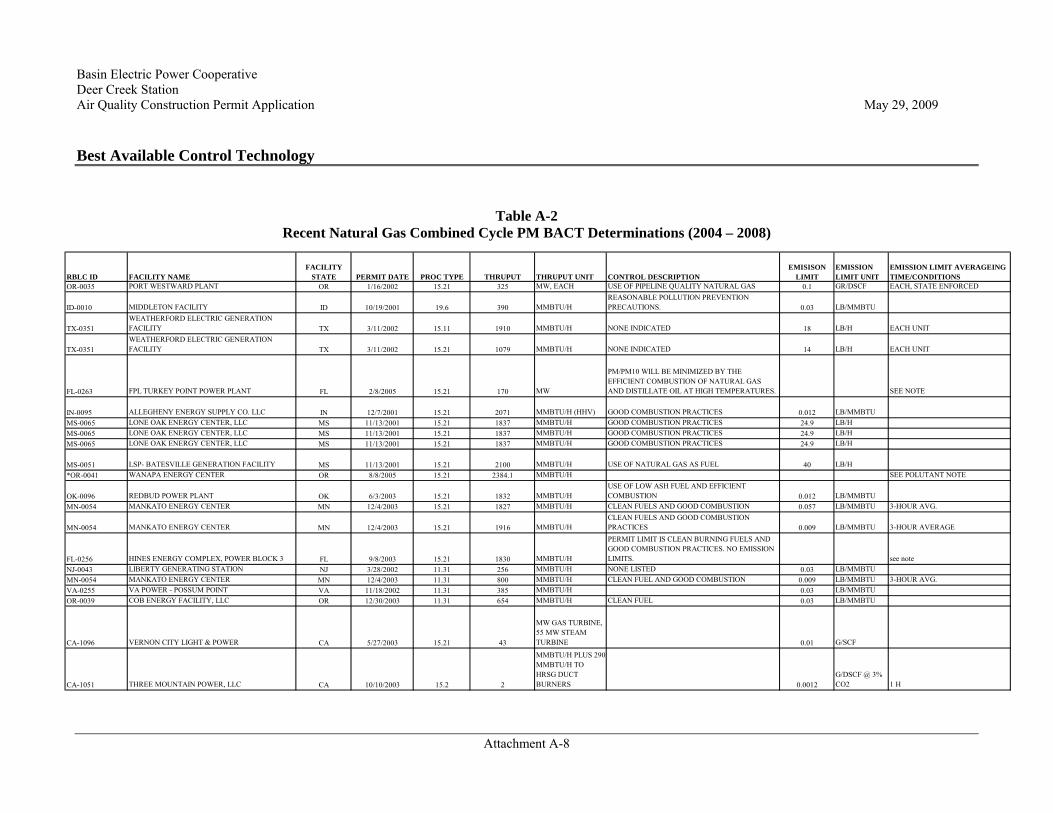
Basin Electric Power Cooperative Deer Creek Station Air Quality Construction Permit Application May 29, 2009 Best Available Control Technology
Attachment A-8
Table A-2
Recent Natural Gas Combined Cycle PM BACT Determinations (2004 – 2008)
RBLC ID FACILITY NAMEFACILITY
STATE PERMIT DATE PROC TYPE THRUPUT THRUPUT UNIT CONTROL DESCRIPTIONEMISISON
LIMITEMISSION LIMIT UNIT
EMISSION LIMIT AVERAGEING TIME/CONDITIONS
OR-0035 PORT WESTWARD PLANT OR 1/16/2002 15.21 325 MW, EACH USE OF PIPELINE QUALITY NATURAL GAS 0.1 GR/DSCF EACH, STATE ENFORCED
ID-0010 MIDDLETON FACILITY ID 10/19/2001 19.6 390 MMBTU/HREASONABLE POLLUTION PREVENTION PRECAUTIONS. 0.03 LB/MMBTU
TX-0351WEATHERFORD ELECTRIC GENERATION FACILITY TX 3/11/2002 15.11 1910 MMBTU/H NONE INDICATED 18 LB/H EACH UNIT
TX-0351WEATHERFORD ELECTRIC GENERATION FACILITY TX 3/11/2002 15.21 1079 MMBTU/H NONE INDICATED 14 LB/H EACH UNIT
FL-0263 FPL TURKEY POINT POWER PLANT FL 2/8/2005 15.21 170 MW
PM/PM10 WILL BE MINIMIZED BY THE EFFICIENT COMBUSTION OF NATURAL GAS AND DISTILLATE OIL AT HIGH TEMPERATURES. SEE NOTE
IN-0095 ALLEGHENY ENERGY SUPPLY CO. LLC IN 12/7/2001 15.21 2071 MMBTU/H (HHV) GOOD COMBUSTION PRACTICES 0.012 LB/MMBTUMS-0065 LONE OAK ENERGY CENTER, LLC MS 11/13/2001 15.21 1837 MMBTU/H GOOD COMBUSTION PRACTICES 24.9 LB/HMS-0065 LONE OAK ENERGY CENTER, LLC MS 11/13/2001 15.21 1837 MMBTU/H GOOD COMBUSTION PRACTICES 24.9 LB/HMS-0065 LONE OAK ENERGY CENTER, LLC MS 11/13/2001 15.21 1837 MMBTU/H GOOD COMBUSTION PRACTICES 24.9 LB/H
MS-0051 LSP- BATESVILLE GENERATION FACILITY MS 11/13/2001 15.21 2100 MMBTU/H USE OF NATURAL GAS AS FUEL 40 LB/H*OR-0041 WANAPA ENERGY CENTER OR 8/8/2005 15.21 2384.1 MMBTU/H SEE POLUTANT NOTE
OK-0096 REDBUD POWER PLANT OK 6/3/2003 15.21 1832 MMBTU/HUSE OF LOW ASH FUEL AND EFFICIENT COMBUSTION 0.012 LB/MMBTU
MN-0054 MANKATO ENERGY CENTER MN 12/4/2003 15.21 1827 MMBTU/H CLEAN FUELS AND GOOD COMBUSTION 0.057 LB/MMBTU 3-HOUR AVG.
MN-0054 MANKATO ENERGY CENTER MN 12/4/2003 15.21 1916 MMBTU/HCLEAN FUELS AND GOOD COMBUSTION PRACTICES 0.009 LB/MMBTU 3-HOUR AVERAGE
FL-0256 HINES ENERGY COMPLEX, POWER BLOCK 3 FL 9/8/2003 15.21 1830 MMBTU/H
PERMIT LIMIT IS CLEAN BURNING FUELS AND GOOD COMBUSTION PRACTICES. NO EMISSION LIMITS. see note
NJ-0043 LIBERTY GENERATING STATION NJ 3/28/2002 11.31 256 MMBTU/H NONE LISTED 0.03 LB/MMBTUMN-0054 MANKATO ENERGY CENTER MN 12/4/2003 11.31 800 MMBTU/H CLEAN FUEL AND GOOD COMBUSTION 0.009 LB/MMBTU 3-HOUR AVG.VA-0255 VA POWER - POSSUM POINT VA 11/18/2002 11.31 385 MMBTU/H 0.03 LB/MMBTUOR-0039 COB ENERGY FACILITY, LLC OR 12/30/2003 11.31 654 MMBTU/H CLEAN FUEL 0.03 LB/MMBTU
CA-1096 VERNON CITY LIGHT & POWER CA 5/27/2003 15.21 43
MW GAS TURBINE, 55 MW STEAM TURBINE 0.01 G/SCF
CA-1051 THREE MOUNTAIN POWER, LLC CA 10/10/2003 15.2 2
MMBTU/H PLUS 290 MMBTU/H TO HRSG DUCT BURNERS 0.0012
G/DSCF @ 3% CO2 1 H

Basin Electric Power Cooperative Deer Creek Station Air Quality Construction Permit Application May 29, 2009 Best Available Control Technology
Attachment A-9
Table A-3: Recent Natural Gas Combined Cycle PM BACT Determinations (2004 – 2008) continued:
RBLC ID FACILITY NAMEFACILITY
STATE PERMIT DATE PROC TYPE THRUPUT THRUPUT UNIT CONTROL DESCRIPTIONEMISISON
LIMITEMISSION LIMIT UNIT
EMISSION LIMIT AVERAGEING TIME/CONDITIONS
CA-1097 MAGNOLIA POWER PROJECT, SCPPA CA 5/27/2003 15.21 181
NET MW (GAS TURBINE W/STEAM INJECTION) 0.01 G/SCF
MS-0059 PIKE GENERATION FACILITY MS 9/24/2002 15.21 2168 MMBTU/HLOW ASH FUEL AND GOOD COMBUSTION PRACTICES 44.2 LB/H
MS-0059 PIKE GENERATION FACILITY MS 9/24/2002 15.21 2168 MMBTU/HLOW ASH FUEL AND GOOD COMBUSTION PRACTICES 44.2 LB/H
MS-0059 PIKE GENERATION FACILITY MS 9/24/2002 15.21 2168 MMBTU/HLOW ASH FUEL AND GOOD COMBUSTION PRACTICES 44.2 LB/H
MS-0059 PIKE GENERATION FACILITY MS 9/24/2002 15.21 2168 MMBTU/HLOW ASH FUEL AND GOOD COMBUSTION PRACTICES 44.2 LB/H
IA-0062 EMERY GENERATING STATION IA 12/20/2002 15.2 170 MW LOW ASH FUEL, NG 0.0072 LB/MMBTU natural gasFL-0247 TECO BAYSIDE POWER STATION FL 1/8/2002 15.21 170 MW FUEL SPECIFICATIONS, GAS ONLY. see noteNE-0017 BEATRICE POWER STATION NE 5/29/2003 15.21 80 MW 10.8 LB/H
GA-0102WANSLEY COMBINED CYCLE ENERGY FACILITY GA 1/15/2002 15.21 167 MW
GOOD COMBUSTION PRACTICE, LOW SULFUR FUEL 0.011 LB/MMBTU LHV BASIS
GA-0101 MURRAY ENERGY FACILITY GA 10/23/2002 15.21 173 MW GOOD COMBUSTION PRACTICE, CLEAN FUEL 25 LB/H
VA-0260 HENRY COUNTY POWER VA 11/21/2002 15.21 171 MW GOOD COMBUSTION DESIGN AND CLEAN FUEL 25.3 LB/H each unit
VA-0260 HENRY COUNTY POWER VA 11/21/2002 15.21 171 MWGOOD COMBUSTION AND DESIGN. CLEAN BURNING FUEL. 0.014 LB/MMBTU @ 70%
VA-0287 JAMES CITY ENERGY PARK VA 12/1/2003 15.21 1973 MMBTU/H GOOD COMBUSTION/DESIGN AND CLEAN FUEL 18 LB/H each
MN-0053 FAIRBAULT ENERGY PARK MN 7/15/2004 15.21 1876 MMBTU/HCLEAN FUEL AND GOOD COMBUSTION PRACTICES. 0.01 LB/MMBTU 3 HOUR AVERAGE

Basin Electric Power Cooperative Deer Creek Station Air Quality Construction Permit Application May 29, 2009 Best Available Control Technology
Attachment A-10
Table A-4 Natural Gas-Fired Process Heater (<100 mmBtu/hr) RBLC NOx Permit Limit Summary (2004 to present)
RBLC ID FACILITY NAME STATE PROCESS NAMEPROCESS
TYPE THRUPUT THRUPUT UNIT CONTROL DESCRIPTIONEMISSION
LIMITEMISSION LIMIT
UNITEMISSION LIMIT AVERAGING TIME
AK-0062 BADAMI DEVELOPMENT FACILITY AK NATCO TEG REBOILER 13.31 1.34 MMBTU/HCONVENTIONAL BURNER TECHNOLOGY 0.08 LB/MMBTU
AK-0062 BADAMI DEVELOPMENT FACILITY AK NATCO PRODUCTION HEATER 13.31 34 MMBTU/HLOW NOX BURNERS / FLUE GAS RECIRCULATION 0.095 LB/MMBTU
CO-0058 CHEYENNE STATION CO HEATERS 13.31 45 MMBTU/H LOW NOX BURNERS 0.035 LB/MMBTU 1-HR AVERAGE
GA-0105MCINTOSH COMBINED CYCLE FACILITY GA FUEL GAS HEATER 13.31 5 MMBTU/H 99 PPM @ 15% O2
GA-0107 TALBOT ENERGY FACILITY GA FUEL GAS PREHEATERS, (3) 13.31 5 MMBTU/H DRY LOW NOX BURNERS 30 PPM @ 15% O2
GA-0130KIA MOTORS MANUFACTURING GEORGIA GA BOILERS AND HEATERS 13.31
LOW NOX BURNERS ON BOILER BURNERS 30 PPM @ 3%O2 BOILERS
IA-0062 EMERY GENERATING STATION IA GAS HEATER, (2) 13.31 16.4 MMBTU/H DLN 0.049 LB/MMBTU IA-0063 WISDOM GENERATION STATION IA HEATER , NATURAL GAS 13.31 5.38 MMBTU/H DLN 0.095 LB/MMBTU IA-0064 ROQUETTE AMERICA IA DEW POINT HEATER 13.31 1.6 MMBTU/H GOOD COMBUSTION PRACTICES 0.15 LB/MMBTU IA-0068 EMERY GENERATING STATION IA GAS HEATER 13.31 9 MMBTU/H DLN 0.049 LB/MMBTU
IN-0116PSEG LAWRENCEBURG ENERGY CO., INC. IN HEATER, STARTUP GAS, NATURAL GAS 13.31 2.4 MMBTU/H 0.14 LB/MMBTU
LA-0192 CRESCENT CITY POWER LA FUEL GAS HEATERS (3) 13.31 19 MMBTU/HLOW NOX BURNERS AND GOOD COMBUSTION PRACTICES 1.81 LB/H HOURLY MAXIMUM
LA-0203 OAKDALE OSB PLANT LA AUXILIARY THERMAL OIL HEATER 13.31 66.5 MMBTU/HUSE OF NATURAL GAS AS FUEL AND GOOD COMBUSTION PRACTICES 7.82 LB/H HOURLY MAXIMUM
MD-0035 DOMINION MD VAPORIZATION HEATER 13.31 ULNB 0.012 LB/MMBTU MD-0035 DOMINION MD EMERGENCY VENT HEATER 13.31 LNB 0.036 LB/MMBTU 3-HOUR AVERAGE
MD-0036 DOMINION MD FUEL GAS PROCESS HEATER 13.31DRY LNB AND GOOD COMBUSTION PRACTICES 17 PPMVD 3-HOUR AVERAGE
MD-0036 DOMINION MD FUEL GAS PROCESS HEATER 13.31GOOD COMBUSTION PRACTICES AND DRY LNB 17 PPMVD 3-HOUR AVERAGE
MD-0040 CPV ST CHARLES MD HEATER 13.31 1.7 MMBTU/H 0.1 LB/MMBTU
MN-0070 MINNESOTA STEEL INDUSTRIES, LLC MN SMALL BOILERS & HEATERS(<100 MMBTU/H) 13.31 99 MMBTU/H 0.0035 LB/MMBTU 3 HOUR AVERAGE NE-0043 NATUREWORKS, LLC NE HOT OIL HEATER 13.31 75 MMBTU/H LOW-NOX BURNERS & FGR SEE NOTE
NJ-0062CONSOLIDATE EDISON DEVELOPMENT (CED) NJ FUEL GAS HEATERS (3 UNITS) 13.31 4.62 MMBTU/H LOW NOX -COMBUSTOR 0.17 LB/H
NV-0047 NELLIS AIR FORCE BASE NV BOILERS/HEATERS - NATURAL GAS-FIRED 13.31LOW-NOX BURNER AND FLUE GAS RECIRCULATION 0.03 LB/MMBTU
OH-0264 NORTON ENERGY STORAGE, LLC OH FUEL SUPPLY HEATERS (9) 13.31 11.45 MMBTU/H 1.076 LB/H OH-0264 NORTON ENERGY STORAGE, LLC OH RECUPERATOR PRE-HEATERS (9) 13.31 12.84 MMBTU/H 1.207 LB/H
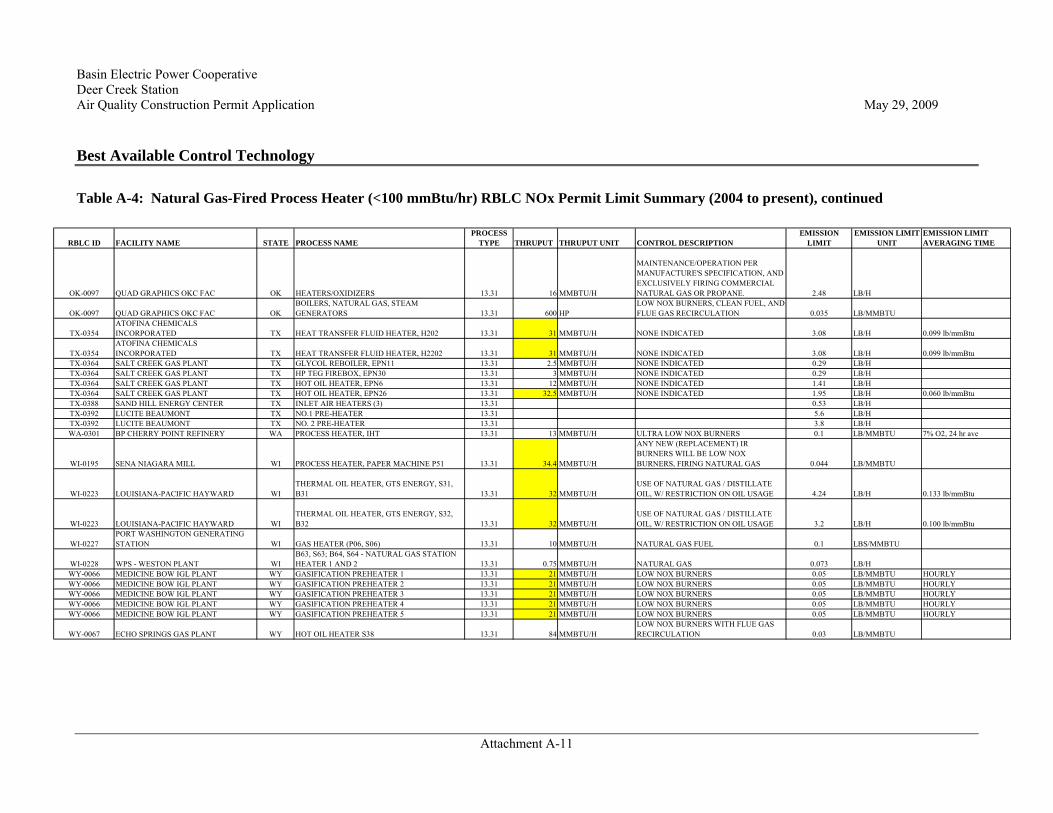
Basin Electric Power Cooperative Deer Creek Station Air Quality Construction Permit Application May 29, 2009 Best Available Control Technology
Attachment A-11
Table A-4: Natural Gas-Fired Process Heater (<100 mmBtu/hr) RBLC NOx Permit Limit Summary (2004 to present), continued
RBLC ID FACILITY NAME STATE PROCESS NAMEPROCESS
TYPE THRUPUT THRUPUT UNIT CONTROL DESCRIPTIONEMISSION
LIMITEMISSION LIMIT
UNITEMISSION LIMIT AVERAGING TIME
OK-0097 QUAD GRAPHICS OKC FAC OK HEATERS/OXIDIZERS 13.31 16 MMBTU/H
MAINTENANCE/OPERATION PER MANUFACTURE'S SPECIFICATION, AND EXCLUSIVELY FIRING COMMERCIAL NATURAL GAS OR PROPANE. 2.48 LB/H
OK-0097 QUAD GRAPHICS OKC FAC OKBOILERS, NATURAL GAS, STEAM GENERATORS 13.31 600 HP
LOW NOX BURNERS, CLEAN FUEL, AND FLUE GAS RECIRCULATION 0.035 LB/MMBTU
TX-0354ATOFINA CHEMICALS INCORPORATED TX HEAT TRANSFER FLUID HEATER, H202 13.31 31 MMBTU/H NONE INDICATED 3.08 LB/H 0.099 lb/mmBtu
TX-0354ATOFINA CHEMICALS INCORPORATED TX HEAT TRANSFER FLUID HEATER, H2202 13.31 31 MMBTU/H NONE INDICATED 3.08 LB/H 0.099 lb/mmBtu
TX-0364 SALT CREEK GAS PLANT TX GLYCOL REBOILER, EPN11 13.31 2.5 MMBTU/H NONE INDICATED 0.29 LB/H TX-0364 SALT CREEK GAS PLANT TX HP TEG FIREBOX, EPN30 13.31 3 MMBTU/H NONE INDICATED 0.29 LB/H TX-0364 SALT CREEK GAS PLANT TX HOT OIL HEATER, EPN6 13.31 12 MMBTU/H NONE INDICATED 1.41 LB/H TX-0364 SALT CREEK GAS PLANT TX HOT OIL HEATER, EPN26 13.31 32.5 MMBTU/H NONE INDICATED 1.95 LB/H 0.060 lb/mmBtuTX-0388 SAND HILL ENERGY CENTER TX INLET AIR HEATERS (3) 13.31 0.53 LB/H TX-0392 LUCITE BEAUMONT TX NO.1 PRE-HEATER 13.31 5.6 LB/H TX-0392 LUCITE BEAUMONT TX NO. 2 PRE-HEATER 13.31 3.8 LB/H WA-0301 BP CHERRY POINT REFINERY WA PROCESS HEATER, IHT 13.31 13 MMBTU/H ULTRA LOW NOX BURNERS 0.1 LB/MMBTU 7% O2, 24 hr ave
WI-0195 SENA NIAGARA MILL WI PROCESS HEATER, PAPER MACHINE P51 13.31 34.4 MMBTU/H
ANY NEW (REPLACEMENT) IR BURNERS WILL BE LOW NOX BURNERS, FIRING NATURAL GAS 0.044 LB/MMBTU
WI-0223 LOUISIANA-PACIFIC HAYWARD WITHERMAL OIL HEATER, GTS ENERGY, S31, B31 13.31 32 MMBTU/H
USE OF NATURAL GAS / DISTILLATE OIL, W/ RESTRICTION ON OIL USAGE 4.24 LB/H 0.133 lb/mmBtu
WI-0223 LOUISIANA-PACIFIC HAYWARD WITHERMAL OIL HEATER, GTS ENERGY, S32, B32 13.31 32 MMBTU/H
USE OF NATURAL GAS / DISTILLATE OIL, W/ RESTRICTION ON OIL USAGE 3.2 LB/H 0.100 lb/mmBtu
WI-0227PORT WASHINGTON GENERATING STATION WI GAS HEATER (P06, S06) 13.31 10 MMBTU/H NATURAL GAS FUEL 0.1 LBS/MMBTU
WI-0228 WPS - WESTON PLANT WIB63, S63; B64, S64 - NATURAL GAS STATION HEATER 1 AND 2 13.31 0.75 MMBTU/H NATURAL GAS 0.073 LB/H
WY-0066 MEDICINE BOW IGL PLANT WY GASIFICATION PREHEATER 1 13.31 21 MMBTU/H LOW NOX BURNERS 0.05 LB/MMBTU HOURLY WY-0066 MEDICINE BOW IGL PLANT WY GASIFICATION PREHEATER 2 13.31 21 MMBTU/H LOW NOX BURNERS 0.05 LB/MMBTU HOURLY WY-0066 MEDICINE BOW IGL PLANT WY GASIFICATION PREHEATER 3 13.31 21 MMBTU/H LOW NOX BURNERS 0.05 LB/MMBTU HOURLY WY-0066 MEDICINE BOW IGL PLANT WY GASIFICATION PREHEATER 4 13.31 21 MMBTU/H LOW NOX BURNERS 0.05 LB/MMBTU HOURLY WY-0066 MEDICINE BOW IGL PLANT WY GASIFICATION PREHEATER 5 13.31 21 MMBTU/H LOW NOX BURNERS 0.05 LB/MMBTU HOURLY
WY-0067 ECHO SPRINGS GAS PLANT WY HOT OIL HEATER S38 13.31 84 MMBTU/HLOW NOX BURNERS WITH FLUE GAS RECIRCULATION 0.03 LB/MMBTU

Basin Electric Power Cooperative Deer Creek Station Air Quality Construction Permit Application May 29, 2009 Best Available Control Technology
Attachment A-12
Table A-5 Natural Gas-Fired Process Heater (<100 mmBtu/hr) RBLC CO Permit Limit Summary (2004 to present)
RBLC ID FACILITY NAME STATE PROCESS NAMEPROCESS
TYPE THRUPUT THRUPUT UNIT CONTROL DESCRIPTIONEMISSION
LIMITEMISSION LIMIT
UNITEMISSION LIMIT AVERAGING TIME
AK-0062 BADAMI DEVELOPMENT FACILITY AK NATCO TEG REBOILER 13.31 1.34 MMBTU/H GOOD OPERATIONAL PRACTICES 0.15 LB/MMBTU AK-0062 BADAMI DEVELOPMENT FACILITY AK NATCO MISCIBLE INJECTION HEATER 13.31 14.87 MMBTU/H GOOD OPERATIONAL PRACTICES 0.12 LB/MMBTU AK-0062 BADAMI DEVELOPMENT FACILITY AK NATCO PRODUCTION HEATER 13.31 34 MMBTU/H GOOD OPERATIONAL PRACTICES 0.10 LB/MMBTU CO-0058 CHEYENNE STATION CO HEATERS 13.31 45 MMBTU/H GOOD COMBUSTION PRACTICES 0.037 LB/MMBTU 1-HR AVERAGE
GA-0105 MCINTOSH COMBINED CYCLE FACILITY GA FUEL GAS HEATER 13.31 5 MMBTU/H 37 PPM @ 15% O2 GA-0107 TALBOT ENERGY FACILITY GA FUEL GAS PREHEATERS, (3) 13.31 5 MMBTU/H GOOD COMBUSTION PRACTICE 0.022 LB/MMBTU IA-0062 EMERY GENERATING STATION IA GAS HEATER, (2) 13.31 16.4 MMBTU/H 0.082 LB/MMBTU IA-0068 EMERY GENERATING STATION IA GAS HEATER 13.31 9 MMBTU/H GOOD COMBUSTION PRACTICES 0.082 LB/MMBTU LA-0192 CRESCENT CITY POWER LA FUEL GAS HEATERS (3) 13.31 19 MMBTU/H GOOD COMBUSTION PRACTICES 1.52 LB/H HOURLY AVERAGE
LA-0193 STYRENE MONOMER PLANT LA REGENERATION GAS HEATER HS-2102 13.31 14.4 MMBTU/H
GOOD COMBUSTION PRACTICES - GOOD EQUIPMENT DESIGN, USE OF GASEOUS FUELS FOR GOOD MIXING, AND PROPER COMBUSTION TECHNIQUES 1.2 LB/H HOURLY MAXIMUM
LA-0193 STYRENE MONOMER PLANT LAPEB RECOVERY COLUMN HEATER HS-2105 13.31 25.2 MMBTU/H
GOOD COMBUSTION PRACTICES - GOOD EQUIPMENT DESIGN, USE OF GASEOUS FUELS FOR GOOD MIXING, AND PROPER COMBUSTION TECHNIQUES 2.1 LB/H HOURLY MAXIMUM
LA-0203 OAKDALE OSB PLANT LA AUXILIARY THERMAL OIL HEATER 13.31 66.5 MMBTU/HUSE OF NATURAL GAS AS FUEL AND GOOD COMBUSTION PRACTICES 6.57 LB/H HOURLY MAXIMUM
MD-0035 DOMINION MD VAPORIZATION HEATER 13.31
EACH VAPORIZATION HEATER SHALL ONLY USE NATURAL GAS FOR FUEL AND SHALL USE GOOD COMBUSTION OPERATING PRACTICES 0.03 LB/MMBTU
MD-0036 DOMINION MD FUEL GAS PROCESS HEATER 13.31 GOOD COMBUSTION PRACTICES 143 PPMVD MD-0040 CPV ST CHARLES MD HEATER 13.31 1.7 MMBTU/H 0.08 LB/MMBTU
MN-0070 MINNESOTA STEEL INDUSTRIES, LLC MNSMALL BOILERS & HEATERS(<100 MMBTU/H) 13.31 99 MMBTU/H 0.08 LB/MMBTU 1 HOUR AVERAGE
NE-0026 NUCOR STEEL DIVISION NE NNII BILET POST-HEATER 13.31 6.8 MMBTU/H 0.0084 LB/MMBTU NE-0026 NUCOR STEEL DIVISION NE NNII REHEAT FURNACE 13.31 143 MMBTU/H 0.066 LB/MMBTU NE-0043 NATUREWORKS, LLC NE HOT OIL HEATER 13.31 75 MMBTU/H GOOD COMBUSTION PRACTICES SEE NOTE
NJ-0062CONSOLIDATE EDISON DEVELOPMENT (CED) NJ FUEL GAS HEATERS (3 UNITS) 13.31 4.62 MMBTU/H GOOD COMBUSTION PRACTICE 0.69 LB/H
NV-0047 NELLIS AIR FORCE BASE NVBOILERS/HEATERS - NATURAL GAS-FIRED 13.31 FLUE GAS RECIRCULATION 0.037 LB/MMBTU
OH-0264 NORTON ENERGY STORAGE, LLC OH FUEL SUPPLY HEATERS (9) 13.31 11.45 MMBTU/H 0.96 LB/H OH-0264 NORTON ENERGY STORAGE, LLC OH RECUPERATOR PRE-HEATERS (9) 13.31 12.84 MMBTU/H 0.514 LB/H
TX-0354 ATOFINA CHEMICALS INCORPORATED TX HEAT TRANSFER FLUID HEATER, H202 13.31 31 MMBTU/H NONE INDICATED 2.59 LB/H 0.084 lb/mmBtu
TX-0354 ATOFINA CHEMICALS INCORPORATED TX HEAT TRANSFER FLUID HEATER, H2202 13.31 31 MMBTU/H NONE INDICATED 2.59 LB/H 0.084 lb/mmBtuTX-0364 SALT CREEK GAS PLANT TX GLYCOL REBOILER, EPN11 13.31 2.5 MMBTU/H NONE INDICATED 0.25 LB/H TX-0364 SALT CREEK GAS PLANT TX HP TEG FIREBOX, EPN30 13.31 3 MMBTU/H NONE INDICATED 0.25 LB/H TX-0364 SALT CREEK GAS PLANT TX HOT OIL HEATER, EPN6 13.31 12 MMBTU/H NONE INDICATED 1.19 LB/H
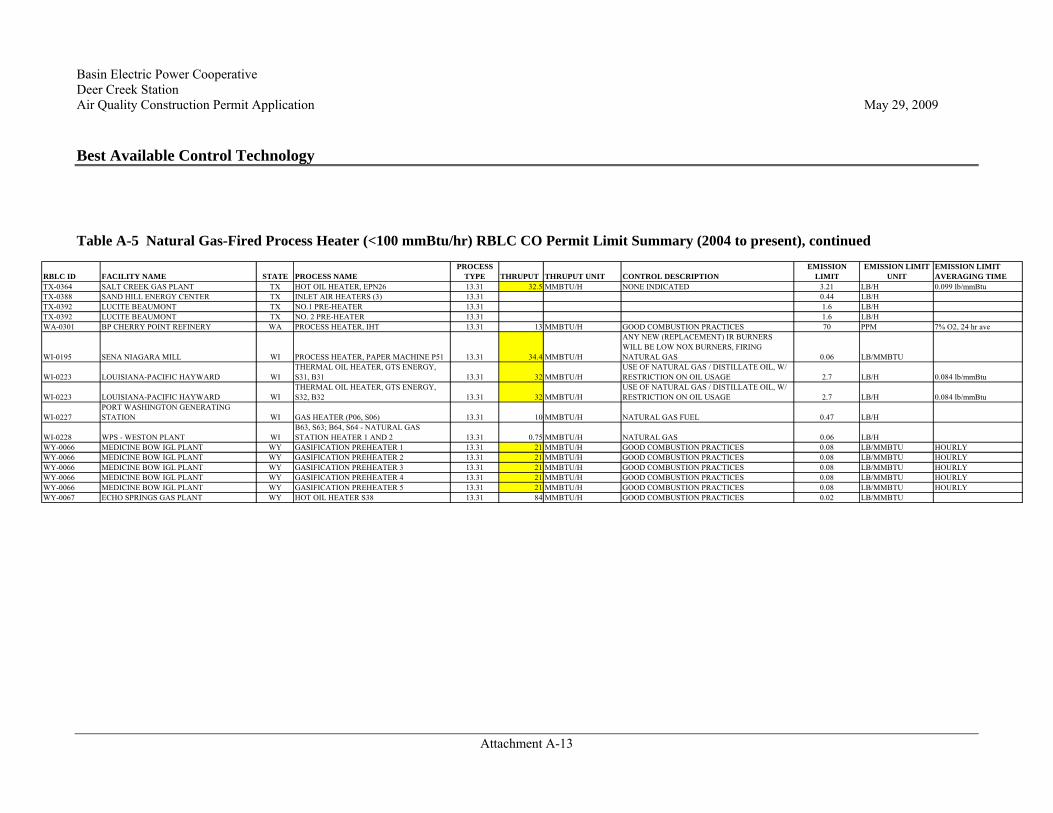
Basin Electric Power Cooperative Deer Creek Station Air Quality Construction Permit Application May 29, 2009 Best Available Control Technology
Attachment A-13
Table A-5 Natural Gas-Fired Process Heater (<100 mmBtu/hr) RBLC CO Permit Limit Summary (2004 to present), continued
RBLC ID FACILITY NAME STATE PROCESS NAMEPROCESS
TYPE THRUPUT THRUPUT UNIT CONTROL DESCRIPTIONEMISSION
LIMITEMISSION LIMIT
UNITEMISSION LIMIT AVERAGING TIME
TX-0364 SALT CREEK GAS PLANT TX HOT OIL HEATER, EPN26 13.31 32.5 MMBTU/H NONE INDICATED 3.21 LB/H 0.099 lb/mmBtuTX-0388 SAND HILL ENERGY CENTER TX INLET AIR HEATERS (3) 13.31 0.44 LB/H TX-0392 LUCITE BEAUMONT TX NO.1 PRE-HEATER 13.31 1.6 LB/H TX-0392 LUCITE BEAUMONT TX NO. 2 PRE-HEATER 13.31 1.6 LB/H WA-0301 BP CHERRY POINT REFINERY WA PROCESS HEATER, IHT 13.31 13 MMBTU/H GOOD COMBUSTION PRACTICES 70 PPM 7% O2, 24 hr ave
WI-0195 SENA NIAGARA MILL WI PROCESS HEATER, PAPER MACHINE P51 13.31 34.4 MMBTU/H
ANY NEW (REPLACEMENT) IR BURNERS WILL BE LOW NOX BURNERS, FIRING NATURAL GAS 0.06 LB/MMBTU
WI-0223 LOUISIANA-PACIFIC HAYWARD WITHERMAL OIL HEATER, GTS ENERGY, S31, B31 13.31 32 MMBTU/H
USE OF NATURAL GAS / DISTILLATE OIL, W/ RESTRICTION ON OIL USAGE 2.7 LB/H 0.084 lb/mmBtu
WI-0223 LOUISIANA-PACIFIC HAYWARD WITHERMAL OIL HEATER, GTS ENERGY, S32, B32 13.31 32 MMBTU/H
USE OF NATURAL GAS / DISTILLATE OIL, W/ RESTRICTION ON OIL USAGE 2.7 LB/H 0.084 lb/mmBtu
WI-0227PORT WASHINGTON GENERATING STATION WI GAS HEATER (P06, S06) 13.31 10 MMBTU/H NATURAL GAS FUEL 0.47 LB/H
WI-0228 WPS - WESTON PLANT WIB63, S63; B64, S64 - NATURAL GAS STATION HEATER 1 AND 2 13.31 0.75 MMBTU/H NATURAL GAS 0.06 LB/H
WY-0066 MEDICINE BOW IGL PLANT WY GASIFICATION PREHEATER 1 13.31 21 MMBTU/H GOOD COMBUSTION PRACTICES 0.08 LB/MMBTU HOURLY WY-0066 MEDICINE BOW IGL PLANT WY GASIFICATION PREHEATER 2 13.31 21 MMBTU/H GOOD COMBUSTION PRACTICES 0.08 LB/MMBTU HOURLY WY-0066 MEDICINE BOW IGL PLANT WY GASIFICATION PREHEATER 3 13.31 21 MMBTU/H GOOD COMBUSTION PRACTICES 0.08 LB/MMBTU HOURLY WY-0066 MEDICINE BOW IGL PLANT WY GASIFICATION PREHEATER 4 13.31 21 MMBTU/H GOOD COMBUSTION PRACTICES 0.08 LB/MMBTU HOURLY WY-0066 MEDICINE BOW IGL PLANT WY GASIFICATION PREHEATER 5 13.31 21 MMBTU/H GOOD COMBUSTION PRACTICES 0.08 LB/MMBTU HOURLY WY-0067 ECHO SPRINGS GAS PLANT WY HOT OIL HEATER S38 13.31 84 MMBTU/H GOOD COMBUSTION PRACTICES 0.02 LB/MMBTU

Basin Electric Power Cooperative Deer Creek Station Air Quality Construction Permit Application May 29, 2009 Best Available Control Technology
Attachment B-1
Attachment B
Natural Gas-Fired Combined Cycle Post-Combustion CO Control Technology Cost Evaluation Estimated capital costs and annual O&M costs associated with the CO oxidation catalyst control system are provided below:

Basin Electric Power Cooperative Deer Creek Station Air Quality Construction Permit Application May 29, 2009 Best Available Control Technology
Attachment B-2
Basin Electric Power CooperativeDeer Creek Generating StationCapital Cost Worksheet
Deer Creek Unit 1
Case Units
1 x 1 x 1 NGCC (250 MW-gross
without Duct Firing)Gross Plant Output (MW-gross) MW-gross 249.683Net Plant Output (MW-net) MW-net 243.1760Maximum Heat Input (mmBtu/hr) mmBtu/hr (HHV) 1,710.4Combustion Turbine Exhaust Gas Flow Rate lb/hr 3,489,000Baseline CO Emission Rate (lb/mmBtu) lb/mmBtu 0.0167Capacity Factor Used for Cost Estimates (%) % 100%Capital Cost Recovery Factor Equipment Life years 20Pretax marginal rate of return on private investment. % 7%
Deer Creek Unit 1Cost Basis (Year) 2008 Baseline CO Emission Rate lb/mmBtu 0.0167 Controlled CO Emission Rate (annual average) lb/mmBtu 0.0044
CO Catalyst System - Total Direct Capital Costs (TDCC). Includes frame, seals, instrumentation, initial catalyst, sales tax, freight, and direct installation costs (supports, handling & erection, electrical, piping, insulation, painting, etc.). $ $785,000 810$
per lb/sec CT Exhaust Gas Flow Rate (Based on oxidation catalyst system cost estimates developed for similar sized natural gas-fired combined cycle units and vendor cost estimates).
Indirect Capital Costs General Facilities $ $39,000 5% Engineering and Home Office Fees $ $79,000 10% Process Contingency $ $39,000 5% Startup and Performance Tests $ $24,000 3% Total Indirect Installation Costs $ $181,000 Project Contingency $ $145,000 15%Total Plant Cost $ $1,111,000 Preproduction Costs $ $22,000 2%Total Capital Investment (TCI) $ $1,133,000
$/kW-gross $4.54
For the cost effectiveness evaluation, used CT performance at full load heat input at average annual ambient conditions without duct firing.
Notes
Calculated as percent of Total Direct Capital Costs. Based on OAQPS Capital Cost Factors for an SCR system (Section 4, Chapter 2), and assuming that the same factors would apply for an Oxidation Catalyst system.
Capital Cost Estimates were based on published cost data available from control technolgoy vendors, cost estimates recently prepared for similiar projects, and cost estimates included in other recently submitted PSD permit applications for large NGCC units.
Option 1: Oxidation Catalyst Control System
Baseline CO emisison rate with combustion controls (DLNB)Assumed 100% capacity factor at full load heat input without duct firing.Assumed 20 year life of oxidation catalyst system.Assumed 7% pretak marginal rate of return.

Basin Electric Power Cooperative Deer Creek Station Air Quality Construction Permit Application May 29, 2009 Best Available Control Technology
Attachment B-3
Deer Creek NGCCINPUT
Gross Plant Output (MW-gross) 249.683Net Plant Output (MW-net) 243.176Maximum Heat Input (mmBtu/hr) 1,710.4Combustion Turbine Exhaust Gas Flow Rate (lb/hr) 3,489,000Baseline NOx Emission Rate (lb/mmBtu) 0.0167Post Low Nox Burner Emission Rate (lb/mmBtu) 0.0044Capacity Factor used of Cost Estimates (%) 100%Capital Cost Recovery Factor Equipment Life 20Pretax marginal rate of return on private investment. 7%
CAPITAL COSTS Basis
Total Capital Investment (TCI) $1,133,000Total Capital Investment ($/kW - gross) $4.54
Capital Recovery Factor = i(1+ i)n / (1 + i)n - 1 0.0944EPA Air Pollution Control Cost Manual 6th Ed., Section 1, Chapter 2, page 2-21.
Annualized Capital Costs (Capital Recover Factor x Total Capital Investment) $107,000
OPERATING & MAINTENANCE COSTS Basis
Variable Direct Annual CostsReagent Cost $0 NA
0.225$ 5
1.560$
Total Variable O&M Cost $310,000
Semi-Variable Direct Annual Costs
Additional Operators per shift 0.0 0Assumed 0 additional operating or supervisory labor needed for the oxidation catalyst system.
Operating Labor $0 33.50$ 3 shift/day, 365 days/year @ $33.50/hour (salary + benefits) which is equal to an annual operator salary of $70,000/year.
Supervision $0 15% Assumed supervisory labor would equal 15% of operating labor.
Maintenance Labor and Materials $17,000 1.50%Assumed 1.5% of TCI based on OAQPS cost factor for SCR (Section 4, Chapter 2, page 2-45)
Total Direct Annual Costs $17,000
Indirect Annual Operating CostProperty Taxes $11,300 1%Insurance $11,300 1%Administration $22,700 2% Total Indirect Operating Cost $45,300
Total Annual Operating & Maintenance Cost $372,300
TOTAL ANNUAL COSTAnnualized Capital Cost $107,000Annual Operating & Maintenance Cost $372,300 Total Annual Cost $479,300
Annual Catalyst Replacement Cost $137,000
Auxiliary Power Cost $173,000
Calcualted as percentage of total capital investment (TCI). EPA Air Pollution Control Cost Manual 6th Ed., Section 1, Chapter 2, page 2-34.
TCR includes the Purchased Equipment Cost, Installation Costs, and Indirect Capital Costs such as engineering, contractor fees, and contingency.
Based on catalyst system replacement cost of $0.225/lb/hr-flue gas flow, 5 year catalyst life, and future worth factor (OAQPS).Based on 1.5 in. pressure drop across the Oxidation Catalyst, 220 kW/in. auxiliary power requirement, and $60/MWh power cost.

Basin Electric Power Cooperative Deer Creek Station Air Quality Construction Permit Application May 29, 2009 Best Available Control Technology
Attachment B-4
Basin Electric Power CooperativeDeer Creek Generating StationCO CONTROL SUMMARY
Annual Emission Summary
NGCC Operating Modeppmvd @ 15%
O2 lb/hr hours/year tpyFull Load CT w/o Duct Firing 7.4 28.5 5,850 83.4Full Load CT with Duct Firing 11.2 57.2 2,200 62.9Startup/Shutdown CO Emissions 708 108Total Annual CO Emissions 8,758 254.3
NGCC Operating Modeppmvd @ 15%
O2 lb/hr hours/year tpyFull Load CT w/o Duct Firing 2.0 7.6 5,850 22.2Full Load CT with Duct Firing 2.0 10.3 2,200 11.3Startup/Shutdown CO Emissions 708 76.6Total Annual CO Emissions 110.1
Control TechnologyExpected Emissions
Expected Emissions Reduction
Total Capital Requirement
Annual Capital Recovery Cost
Total Annual Operating Costs Total Annual Costs
Average Cost Effectiveness
Option (ton/year) (ton/year) ($) ($/year) ($/year) ($) ($/ton)
Baseline Emissions (with Dry Low-NOx Burners) 254.3 NA
1 Oxidation Catalyst
110.1 144.2 $1,133,000 $107,000 $372,300 $479,300 $3,324
Controlled CO Emissions (Oxidation Catalyst)
Baseline CO Emissions

Basin Electric Power Cooperative
Deer Creek Station PSD Air Quality Construction Permit Application
Appendix D
Class II Air Dispersion Modeling Results
Prepared by:
Sargent & Lundy, LLC
Chicago, Illinois
May 29, 2009

Deer Creek Station Class II Air Dispersion Modeling Results
May 29, 2009
D-1
Table of Contents
1 Introduction ........................................................................................................................ 2 2 Project Description ............................................................................................................. 2 3 Project Location ................................................................................................................. 2 4 Facility Equipment ............................................................................................................. 2 4.1 Combustion Turbine/HRSG ............................................................................................... 3 4.2 Natural Gas-Fired Emergency Inlet Air Heater.................................................................. 4 4.3 Air-Cooled Condenser........................................................................................................ 4 4.4 Emergency Generator and Fire Water Pump...................................................................... 4 5 Model Selection and Input ................................................................................................. 4 5.1 Model Selection.................................................................................................................. 4 5.2 Meteorological Data Selection ........................................................................................... 5 5.3 Model Setup and Application............................................................................................. 5 5.3.1 AERMAP....................................................................................................................... 5 5.3.2 AERMET ....................................................................................................................... 5 5.3.3 AERSURFACE.............................................................................................................. 6 5.4 Receptors ............................................................................................................................ 6 5.5 Good Engineering Practice (GEP) Stack Height Analysis ................................................. 6 5.6 Pollutants Subject to Review.............................................................................................. 7 5.7 Pollutant-specific Considerations....................................................................................... 7 5.7.1 NOx ................................................................................................................................ 7 5.7.2 PM10/PM2.5 ..................................................................................................................... 7 5.8 Emission Points .................................................................................................................. 7 5.9 Load conditions and equipment operating schedules ......................................................... 7 5.9.1 Combustion Turbine/HRSG........................................................................................... 7 5.9.2 Emergency Inlet Air Heater ........................................................................................... 8 5.9.3 Emergency Generator and Fire Water Pump ................................................................. 9 6 Class II Air Dispersion Modeling Methodology ................................................................ 9 6.1 Class II Air Dispersion Modeling Process ......................................................................... 9 6.2 Significant Impacts Analysis and Results ........................................................................ 10 6.3 AERMOD Input and Output Files.................................................................................... 10 7 Class I Impacts ................................................................................................................. 11 8 References ........................................................................................................................ 12
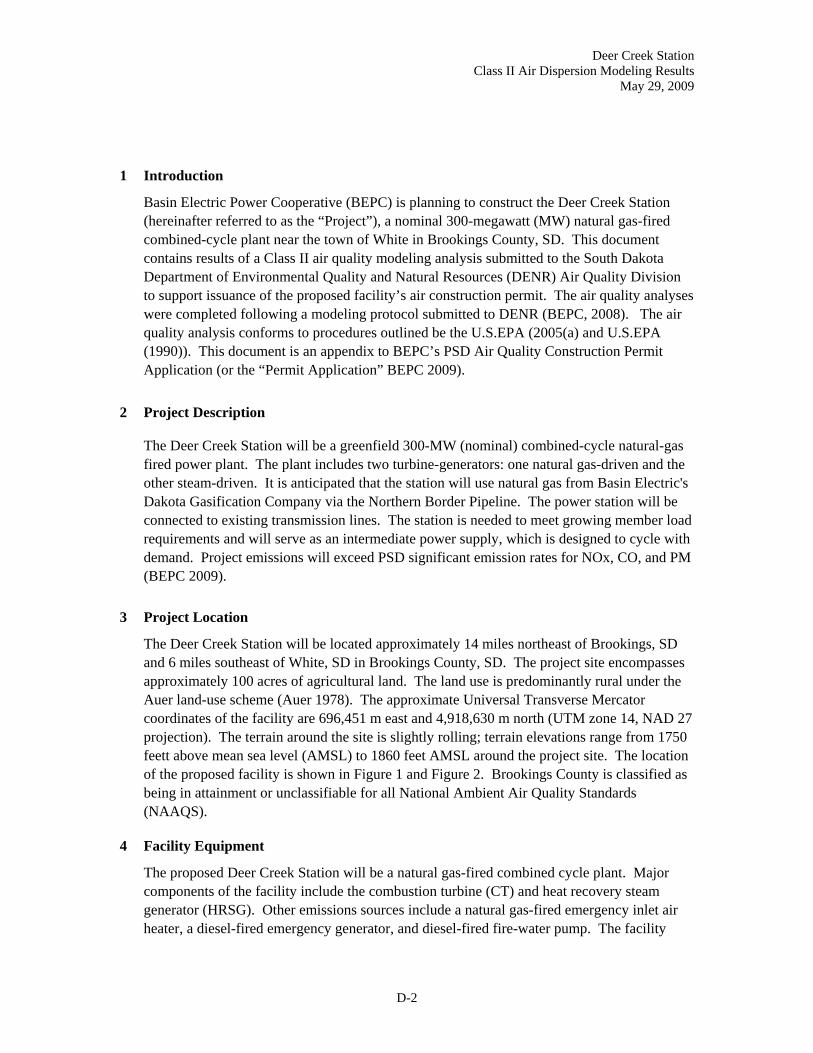
Deer Creek Station Class II Air Dispersion Modeling Results
May 29, 2009
D-2
1 Introduction
Basin Electric Power Cooperative (BEPC) is planning to construct the Deer Creek Station (hereinafter referred to as the “Project”), a nominal 300-megawatt (MW) natural gas-fired combined-cycle plant near the town of White in Brookings County, SD. This document contains results of a Class II air quality modeling analysis submitted to the South Dakota Department of Environmental Quality and Natural Resources (DENR) Air Quality Division to support issuance of the proposed facility’s air construction permit. The air quality analyses were completed following a modeling protocol submitted to DENR (BEPC, 2008). The air quality analysis conforms to procedures outlined be the U.S.EPA (2005(a) and U.S.EPA (1990)). This document is an appendix to BEPC’s PSD Air Quality Construction Permit Application (or the “Permit Application” BEPC 2009).
2 Project Description
The Deer Creek Station will be a greenfield 300-MW (nominal) combined-cycle natural-gas fired power plant. The plant includes two turbine-generators: one natural gas-driven and the other steam-driven. It is anticipated that the station will use natural gas from Basin Electric's Dakota Gasification Company via the Northern Border Pipeline. The power station will be connected to existing transmission lines. The station is needed to meet growing member load requirements and will serve as an intermediate power supply, which is designed to cycle with demand. Project emissions will exceed PSD significant emission rates for NOx, CO, and PM (BEPC 2009).
3 Project Location
The Deer Creek Station will be located approximately 14 miles northeast of Brookings, SD and 6 miles southeast of White, SD in Brookings County, SD. The project site encompasses approximately 100 acres of agricultural land. The land use is predominantly rural under the Auer land-use scheme (Auer 1978). The approximate Universal Transverse Mercator coordinates of the facility are 696,451 m east and 4,918,630 m north (UTM zone 14, NAD 27 projection). The terrain around the site is slightly rolling; terrain elevations range from 1750 feett above mean sea level (AMSL) to 1860 feet AMSL around the project site. The location of the proposed facility is shown in Figure 1 and Figure 2. Brookings County is classified as being in attainment or unclassifiable for all National Ambient Air Quality Standards (NAAQS).
4 Facility Equipment
The proposed Deer Creek Station will be a natural gas-fired combined cycle plant. Major components of the facility include the combustion turbine (CT) and heat recovery steam generator (HRSG). Other emissions sources include a natural gas-fired emergency inlet air heater, a diesel-fired emergency generator, and diesel-fired fire-water pump. The facility

Deer Creek Station Class II Air Dispersion Modeling Results
May 29, 2009
D-3
layout, including the location of proposed emission sources, is shown in Figure 3. An elevation view of the CT/HRSG is shown in Figure 4.
4.1 Combustion Turbine/HRSG
The Deer Creek project will include one F-class (or equivalent) natural gas-fired combustion turbine and HRSG. In a gas turbine, large volumes of air are compressed and injected with natural gas into a combustion chamber. Combustion turbine emissions are controlled with low-NOx burners and best combustion practices. The proposed CT includes an air compressor section, advanced natural gas combustion section, power turbine, and electric generator. Ambient air is drawn through an inlet air filter on the CT and compressed in a multiple-stage axial flow compressor. Compressed air and natural-gas are mixed and combusted in the CT combustion chamber. Based on the Best Available Control Technology (BACT) analysis prepared for the proposed facility (BEPC 2009), dry low-NOx combustors will be used to minimize NOx formation during combustion. The HRSG will utilize hot combustion gases exiting the combustion turbine to produce steam. The HRSG will be equipped with natural gas-fired duct burners to generate additional steam during periods of peak electricity demand. Steam from the HRSG is used to drive a single steam turbine connected to an electrical generator. Exhaust gas from the HRSG passes through a Selective Catalytic Reduction (SCR) control system for additional NOx control prior to being discharged to the atmosphere through a single 150-foot stack.
The CT is designed to produce a nominal 166 MW of gross electrical power at full load and an average annual ambient temperature of 43 °F. Due to the dependence of air density (and mass of inflow combustion air) on temperature, CT power output decreases slightly as the ambient air temperature increases, and output increases as ambient air temperature decreases. The combustion turbine power output at full load will be range from approximately 150 MW at a summer temperature of 94 °F, to approximately 180 MW at a winter extreme temperature of -41 °F.
The HRSG used for the Deer Creek Station will be equipped with natural gas-fired duct burners. Heat input to the duct burners will depend on steam requirements and ambient conditions. Steam from the HRSG will drive a single steam turbine-generator with a nominal power output of 143 MW with duct firing and 84 MW without duct firing at the average annual ambient temperature of 43 °F. Steam turbine exhaust will be directed to an air cooled condenser, and the condensate will be re-used. Operating parameters for the CT/HRSG at base load and three ambient air temperatures (93 °F, 43 °F and -41 °F) and with/without supplemental duct firing are provided in BEPC (2009). The CT/HRSG is cycled to follow changes in demand for electricity. Start-up emissions from the CT/HRSG are highly dependent upon how long the unit has been shut down. Start-ups are characterized as “cold”, “warm”, or “hot” depending upon the length of time that the CT/HRSG has been shut down. Start-up emissions are described in BEPC
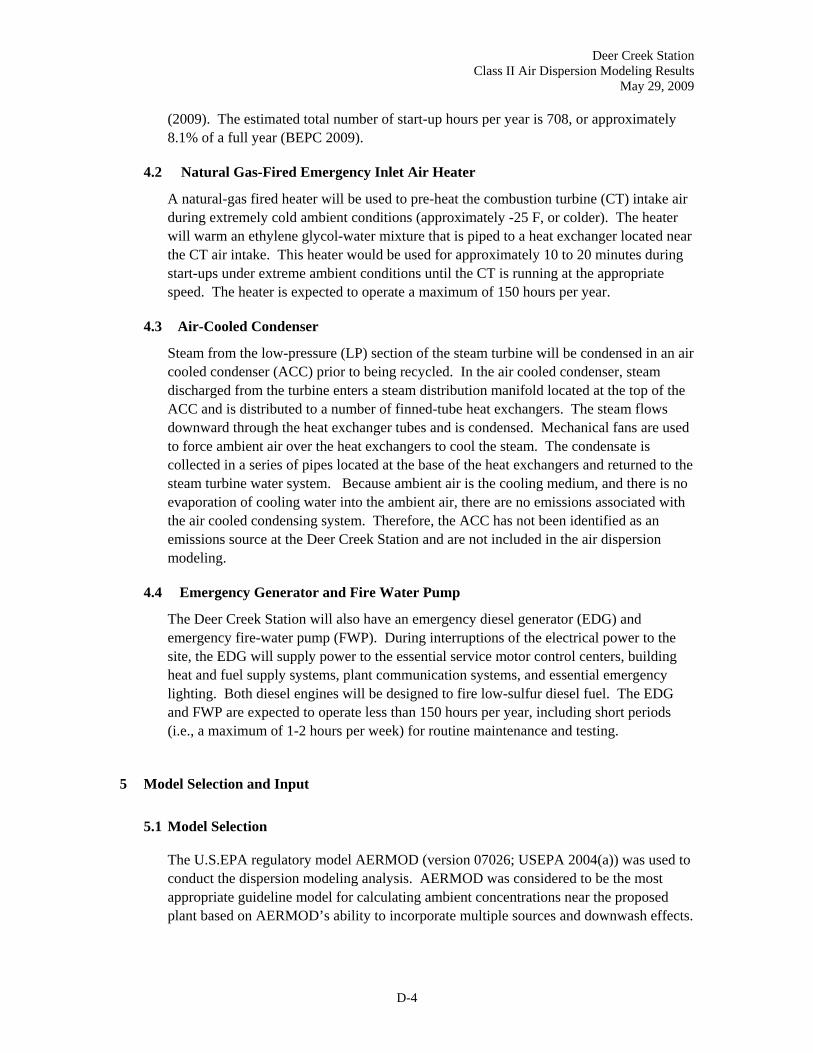
Deer Creek Station Class II Air Dispersion Modeling Results
May 29, 2009
D-4
(2009). The estimated total number of start-up hours per year is 708, or approximately 8.1% of a full year (BEPC 2009).
4.2 Natural Gas-Fired Emergency Inlet Air Heater
A natural-gas fired heater will be used to pre-heat the combustion turbine (CT) intake air during extremely cold ambient conditions (approximately -25 F, or colder). The heater will warm an ethylene glycol-water mixture that is piped to a heat exchanger located near the CT air intake. This heater would be used for approximately 10 to 20 minutes during start-ups under extreme ambient conditions until the CT is running at the appropriate speed. The heater is expected to operate a maximum of 150 hours per year.
4.3 Air-Cooled Condenser
Steam from the low-pressure (LP) section of the steam turbine will be condensed in an air cooled condenser (ACC) prior to being recycled. In the air cooled condenser, steam discharged from the turbine enters a steam distribution manifold located at the top of the ACC and is distributed to a number of finned-tube heat exchangers. The steam flows downward through the heat exchanger tubes and is condensed. Mechanical fans are used to force ambient air over the heat exchangers to cool the steam. The condensate is collected in a series of pipes located at the base of the heat exchangers and returned to the steam turbine water system. Because ambient air is the cooling medium, and there is no evaporation of cooling water into the ambient air, there are no emissions associated with the air cooled condensing system. Therefore, the ACC has not been identified as an emissions source at the Deer Creek Station and are not included in the air dispersion modeling.
4.4 Emergency Generator and Fire Water Pump
The Deer Creek Station will also have an emergency diesel generator (EDG) and emergency fire-water pump (FWP). During interruptions of the electrical power to the site, the EDG will supply power to the essential service motor control centers, building heat and fuel supply systems, plant communication systems, and essential emergency lighting. Both diesel engines will be designed to fire low-sulfur diesel fuel. The EDG and FWP are expected to operate less than 150 hours per year, including short periods (i.e., a maximum of 1-2 hours per week) for routine maintenance and testing.
5 Model Selection and Input
5.1 Model Selection
The U.S.EPA regulatory model AERMOD (version 07026; USEPA 2004(a)) was used to conduct the dispersion modeling analysis. AERMOD was considered to be the most appropriate guideline model for calculating ambient concentrations near the proposed plant based on AERMOD’s ability to incorporate multiple sources and downwash effects.

Deer Creek Station Class II Air Dispersion Modeling Results
May 29, 2009
D-5
AERMOD input files were assembled with standard text editors and the Version 6.1.0 of Lakes Environmental MS-Windows ISC-AERMOD-View© program. The interface was used for checking consistency among input files, managing AERMOD simulations and executing the AERMOD codes.
5.2 Meteorological Data Selection
Five-year (2000-2004) sequential hourly surface data from the Huron, SD Regional airport (WBAN #14936) were processed into AERMOD-compatible surface and profile data files by DENR. The Huron Regional airport is located approximately 80 miles (128 km) due west of the proposed facility in a similar rural setting and in the same climatic zone as the site (Trewartha 1961) so these data are representative of the meteorological conditions experienced at the project site. The station elevation of Huron (390.4 m above mean sea level) was used in AERMOD. The anemometer height at Huron for the 2000-2004 period of record is 10 m (NRCS, 2008) which was used in AERMET meteorological data processing (section 5.3.2). A wind rose from Huron, SD is shown in Figure 5.
Corresponding upper-air data were taken from Aberdeen, SD (WBAN #14929), which is located approximately 120 miles (193 km) northwest of the project location. The Aberdeen, SD upper-air station is considered to be the closest and most representative upper-air station.
5.3 Model Setup and Application
The AERMOD system consists of three main modules: the AERMOD air dispersion module; the AERMET meteorological data pre-processor; and the AERMAP terrain data pre-processor. The U.S.EPA recently released the AERSURFACE program (USEPA 2008 (a)) which prepares required land-use information inputs for AERMET. The application of each of these programs is discussed below.
5.3.1 AERMAP
The AERMAP terrain data pre-processor (version 09040; USEPA 2003) extracted receptor elevation data from 7.5-minute USGS Digital Elevation Model (DEM) files (USGS 2008(a)). AERMAP produced receptor heights and related parameters that were input into AERMOD via the ISC-AERMOD-View© interface. Receptor elevations were based on North American Datum 1927 (NAD27). The highest receptor was specified in AERMAP’s hill-height algorithm. The grade elevations near the facility, as determined from the DEM files, were within approximately one meter of actual grade elevations.
5.3.2 AERMET
AERMOD uses boundary-layer parameters based on estimates of the surface albedo, Bowen ratio and surface roughness length (USEPA 2005(b)). DENR used the AERMET meteorological data pre-processor version 06341 (USEPA 2004(b)) to develop

Deer Creek Station Class II Air Dispersion Modeling Results
May 29, 2009
D-6
meteorological input data for AERMOD. The surface data came from Huron, SD and upper-air data came from Aberdeen, SD (section 5.2). AERMET produces AERMOD-compatible surface (*.sfc) and profile (*.pfl) text files. The surface and profile files were be concatenated into a single pair of input files for convenience.
5.3.3 AERSURFACE
DENR used the USEPA AERSURFACE program (version 08009; USEPA 2008(a)) to determine the surface albedo, Bowen ratio and surface roughness length from land use information. This information was used in the AERMET processor described above. Land use information was taken from the U.S. Geological Survey (USGS) and EPA National Land Cover Data (NLCD) data set (USGS 2008(b)).
5.4 Receptors
The air quality analysis used a nested receptor grid and a fenceline which were consistent with specifications in the air dispersion modeling protocol (BEPC 2008). It was necessary to slightly adjust the extent of the innermost nested grids to ensure that the maximum impacts were resolved with the 50-m or 100-m grids. The fenceline separated the on-site portion of the air shed from ambient air. The fenceline was defined using a 50-meter receptor spacing. Receptors enclosed by the fenceline were not included in the ambient air quality analysis.
The innermost (first) nested grid extended to approximately 800 meters from the fenceline in all directions. This grid had a 50-meter spacing. The second grid extended from approximately 800 m to 2,700 m from the fenceline and had a 100-meter spacing. The third grid extended from approximately 2,700 m to 5,200 m from the fenceline and had a 500-m receptor spacing. The outermost grid extended from 5,200-10,000 m from the fenceline and had a 1,000-m receptor spacing. The receptors are shown in Figure 6 and Figure 7. The fence line is shown in Figure 8. The resulting grid had 6,285 receptors. Receptor elevations from AERMAP (section 5.3.1) were input into AERMOD and checked using the MS-Windows ISC-AERMOD View© program.
5.5 Good Engineering Practice (GEP) Stack Height Analysis
A Good Engineering Practice (GEP) stack height analysis was conducted to include building wake effects in AERMOD. The EPA’s BPIP-PRIME program (USEPA 2004(a); USEPA 1997) (version 04274) was used to conduct the analysis in accordance with USEPA (1985). BPIP-PRIME requires structure dimensions and locations from facility site general arrangement (GA) drawings. Heights of the structures included in the BPIP analysis are listed in Table 1. The locations of these structures are shown in Figure 8 and Figure 9. A 3-D rendering of the structures from BPIP-PRIME is shown in Figure 10. Output from BPIP-PRIME was input into AERMOD input files for dispersion analysis with the MS-Windows ISC-AERMOD View© program.
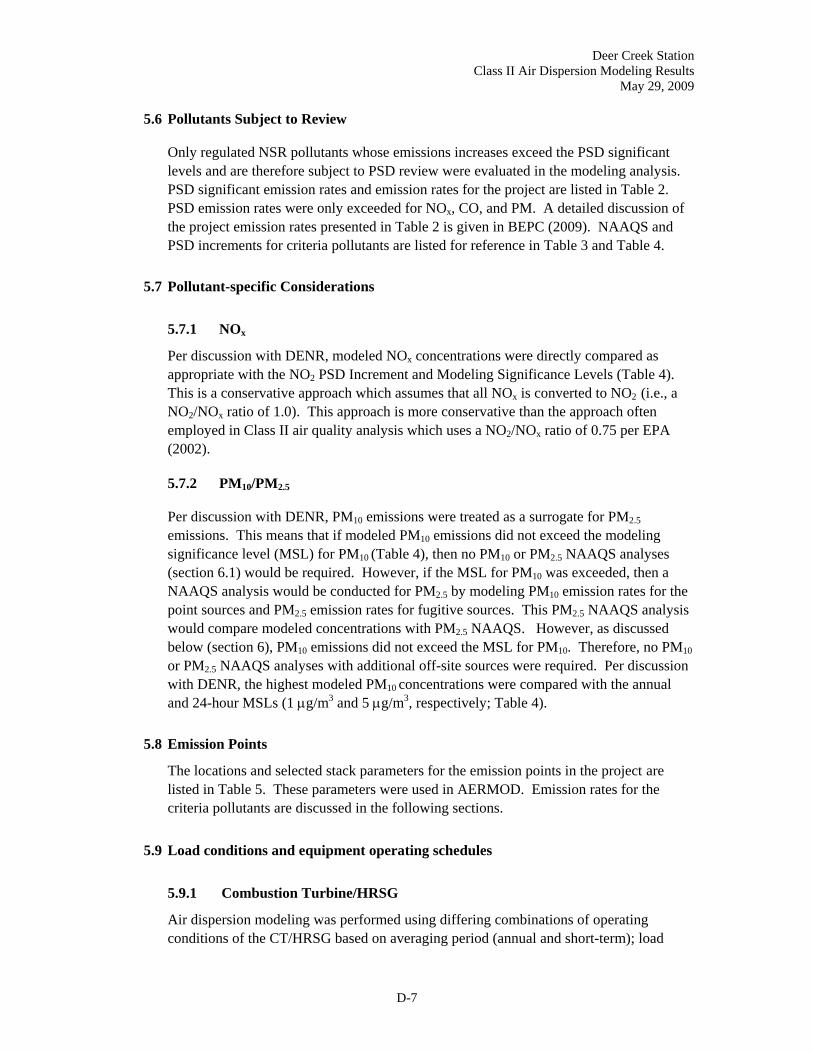
Deer Creek Station Class II Air Dispersion Modeling Results
May 29, 2009
D-7
5.6 Pollutants Subject to Review
Only regulated NSR pollutants whose emissions increases exceed the PSD significant levels and are therefore subject to PSD review were evaluated in the modeling analysis. PSD significant emission rates and emission rates for the project are listed in Table 2. PSD emission rates were only exceeded for NOx, CO, and PM. A detailed discussion of the project emission rates presented in Table 2 is given in BEPC (2009). NAAQS and PSD increments for criteria pollutants are listed for reference in Table 3 and Table 4.
5.7 Pollutant-specific Considerations
5.7.1 NOx
Per discussion with DENR, modeled NOx concentrations were directly compared as appropriate with the NO2 PSD Increment and Modeling Significance Levels (Table 4). This is a conservative approach which assumes that all NOx is converted to NO2 (i.e., a NO2/NOx ratio of 1.0). This approach is more conservative than the approach often employed in Class II air quality analysis which uses a NO2/NOx ratio of 0.75 per EPA (2002).
5.7.2 PM10/PM2.5
Per discussion with DENR, PM10 emissions were treated as a surrogate for PM2.5 emissions. This means that if modeled PM10 emissions did not exceed the modeling significance level (MSL) for PM10 (Table 4), then no PM10 or PM2.5 NAAQS analyses (section 6.1) would be required. However, if the MSL for PM10 was exceeded, then a NAAQS analysis would be conducted for PM2.5 by modeling PM10 emission rates for the point sources and PM2.5 emission rates for fugitive sources. This PM2.5 NAAQS analysis would compare modeled concentrations with PM2.5 NAAQS. However, as discussed below (section 6), PM10 emissions did not exceed the MSL for PM10. Therefore, no PM10 or PM2.5 NAAQS analyses with additional off-site sources were required. Per discussion with DENR, the highest modeled PM10 concentrations were compared with the annual and 24-hour MSLs (1 μg/m3 and 5 μg/m3, respectively; Table 4).
5.8 Emission Points
The locations and selected stack parameters for the emission points in the project are listed in Table 5. These parameters were used in AERMOD. Emission rates for the criteria pollutants are discussed in the following sections.
5.9 Load conditions and equipment operating schedules
5.9.1 Combustion Turbine/HRSG
Air dispersion modeling was performed using differing combinations of operating conditions of the CT/HRSG based on averaging period (annual and short-term); load
Deer Creek Station Class II Air Dispersion Modeling Results
May 29, 2009
D-8
condition (25%, 50%, 75% and 100%) and atmospheric temperature (annual average of 43 °F; winter temperature of -41 °F; and summer temperature of 94 °F). The use of augmented (duct) firing was also evaluated for the 100% load conditions. This produced a combination of 17 load conditions for analyzing emissions with AERMOD. Three additional start-up conditions (hot, warm and cold start ups) were also modeled, for a total of 20 conditions. These conditions are summarized in Table 6. The corresponding maximum hourly emission rates for the CT/HRSG are shown in Table 7. Emission rates for the CT/HRSG are described in BEPC (2009).
Modeling NOX emissions from CT/HRSG start-up sequences over annual averaging periods
NOx only has a single (annual) averaging period and NAAQS (Table 3). Per discussion with DENR, modeling of NOx emissions from start-up sequences considered NOx emissions from full-load operations rather than elevated NOx emission rates that occur during the short start-up sequences. Since the unit would not operate continuously, averaging periods that include a start-up and shutdown sequence would also include extended periods without NOx emissions. As a result, the actual average NOx emission rate calculated over a period spanning a shutdown through start-up is significantly less than normal, full-load emission rates. Because impacts from NOx emissions are only considered over an annual averaging period, modeling results based on full-load operations over a year would be conservative and over-estimate annually-averaged impacts of NOx emissions from start-ups.
Modeling PM and CO emissions from CT/HRSG start-up sequences over short averaging periods
To conservatively estimate impacts over short (24-hour, or less) averaging periods, the maximum hourly emission rates for cold, warm and hot start-ups were used to model PM and CO emission rates for short-term (24-, 8- and 1-hour) averaging periods. The maximum hourly emission rates for start-ups are shown in Table 8.
5.9.2 Emergency Inlet Air Heater
The inlet heater is expected to operate for short periods (approximately 10-20 minutes) during start-ups and only during extremely cold (approximately -25 F, or colder) ambient conditions. The unit is expected to operate less than 150 hours per year. For purposes of modeling dispersion over annual averaging periods, the maximum hourly emission rates were multiplied by 0.0171 (0.0171 = 150/8760) to simulate a maximum expected 150 hours of annual operation. Emission rates for the emergency inlet air heater are listed in Table 9.
The exhaust stack for the emergency inlet air heater would be located adjacent to the CT/HRSG (Figure 9) and is expected to be affected by building downwash from the
Deer Creek Station Class II Air Dispersion Modeling Results
May 29, 2009
D-9
CT/HRSG and other structures. The stack from the heater has a rain cap. Per modeling guidance (USEPA 2007), the actual stack diameter, stack height and exit temperature (Table 9) were used, but the exit velocity was set to 0.001 m/s for modeling purposes.
5.9.3 Emergency Generator and Fire Water Pump
The facility will also have an emergency diesel generator (EDG) and fire-water pump (FWP). The EDG will supply power during an interruption of the electrical power supply to the site. The EDG and FWP are expected to operate less than 150 hours per year, including 1-2 hours, or less, per week for maintenance and testing. Maximum hourly emission rates for the EDG and FWP from BEPC (2009) are listed in Table 10. For purposes of air dispersion modeling, the maximum hourly emission rates for the EDG and FWP were multiplied by 0.0833 (0.0833 = 2/24) to simulate a maximum expected operating time of two hours for routine testing in 24-hour averaging periods modeled in AERMOD. For annual averaging periods, the maximum hourly emission rates were multiplied by 0.0171 (0.0171 = 150/8760) to simulate a maximum expected 150 hours of operation annually. The maximum hourly emission rates were used for the shortest averaging periods (8- and 1-hr averaging periods for CO emissions). The resulting emission rates for EDG and FWP used in AERMOD are listed in Table 10. To produce conservative results, emissions from the EDG and FWP were included in all modeled load conditions.
6 Class II Air Dispersion Modeling Methodology
6.1 Class II Air Dispersion Modeling Process
Class II air dispersion modeling is conducted in two phases. The initial phase consists of a significant impacts analysis which compares the maximum impacts of a project with modeling significance levels (MSLs) (Table 4) for pollutants whose emissions exceeds PSD significance rates. BEPC anticipates that it will exceed PSD significant emission rates for NOx, CO, and PM (Table 2). Depending upon the outcome of the initial phase, a second (refined) phase may follow which consists of PSD increment and NAAQS analyses that include emissions from sources at the proposed facility and surrounding facilities. In the significant impacts analysis, the maximum modeled impacts under various load conditions are determined for each pollutant whose potential to emit exceeds the corresponding PSD significant emission rate. The load conditions, pollutants, averaging periods and stack exit velocities and emission rates used in AERMOD are compiled from preceding tables in Table 11. The modeled concentrations for a number of load scenarios are compared with pollutant-and averaging-period specific MSLs to determine significant impact areas.

Deer Creek Station Class II Air Dispersion Modeling Results
May 29, 2009
D-10
In the second phase of Class II air dispersion modeling, pollutants whose impacts exceed the MSLs in the first phase are modeled using project-related sources, off-site sources and background concentrations. The resulting concentrations are compared with the NAAQS and PSD increments (Table 3 and Table 4) to demonstrate compliance.
6.2 Significant Impacts Analysis and Results
The maximum ambient air concentrations from AERMOD are listed in Table 12 through Table 16. The locations of the maximum concentrations for each pollutant are plotted for reference in Figure 11. The maximum concentrations were recorded within approximately 500 m of the fence line (or, on the fenceline). Since the innermost grid and fence line had a 50-meter resolution (section 5.4) the maximum concentrations were adequately resolved.
The highest modeled concentration for each pollutant and respective averaging period in Table 12 through Table 16 is identified in Table 17. For the significant impacts analysis, these concentrations are compared with their respective MSL. Table 17 shows that each maximum predicted concentration is below its respective MSL. Therefore, the proposed project will have insignificant impacts on the ambient air quality. Since the modeled maximum impacts are below their respective MSL, additional air quality modeling that compares impacts with NAAQS and PSD Increments (section 6.1) was not required.
Table 17 also compares the highest ambient air concentration for each pollutant with its respective de minimus monitoring exemption level. This table shows that maximum predicted ambient air concentration would remain below the de minimus monitoring exemption levels. Therefore, pre-construction monitoring would not be required for the project.
A separate comparative analysis of modeled PM2.5 impacts with the NAAQS is provided for informational purposes only and does not include cumulative impacts that would be part of a formal PSD analysis since a PSD analysis was not required, as discussed above. For comparison with the PM2.5 NAAQS, the maximum modeled 24-hour PM impact was added to a background PM2.5 concentration. A background concentration recorded near City Hall in Brookings, SD was used. This PM2.5 concentrations is likely higher that the actual background PM concentration expected in an isolated, rural area around the project site. The results are shown in Table 18. This table shows that the maximum modeled PM concentrations were below the PM2.5 NAAQS.
6.3 AERMOD Input and Output Files
The AERMOD input and output files are listed for reference in Table 19. Digital copies of the files are contained in an attachment.

Deer Creek Station Class II Air Dispersion Modeling Results
May 29, 2009
D-11
7 Class I Impacts
There are no Class I areas located within 400 km of the proposed facility. The closest Class I area is the Badlands National Park located in southwestern South Dakota, approximately 420 km (260 miles) to the west-southwest of the facility. No air quality impacts are expected from the proposed facility given the great distance.
Deer Creek Station Class II Air Dispersion Modeling Results
May 29, 2009
D-12
8 References
Auer, A.H. Jr., "Correlation of Land Use and Cover with Meteorological Anomalies", Journal of Applied Meteorology, Vol. 17, pp. 636-643, Published by American Meteorological Society, Boston, Mass., May 1978. Natural Resources Conservation Service (NRCS), U.S. Department of Agriculture “Anemometer heights.” Available online from: http://www.wcc.nrcs.usda.gov/climate/windrose.html. Web site accessed in July 2008. Basin Electric Power Cooperative. “Deer Creek Generating Facility Air Dispersion Modeling Protocol.” October, 2008. Basin Electric Power Cooperative. “Basin Electric Power Cooperative Deer Creek Station PSD Air quality Construction Permit Application.” 2009. South Dakota Department of Environment & Natural Resources (DENR). “South Dakota Ambient Air Monitoring Annual Network Plan 2007.” Available online from: http://www.state.sd.us/denr/denr.html 83 pp. Trewartha, G.T. “The Earth’s Problem Climates.” University of Wisconsin Press, 1961. U.S. Environmental Protection Agency (USEPA). “Guideline for Determination of Good Engineering Practice Stack Height (Technical Support Document for the Stack Height Regulations)”. Report EPA-450/4-80-023R. June 7, 1985. Available on-line from: http://www.epa.gov/scram001/guidance/guide/gep.pdf U.S. Environmental Protection Agency (USEPA), "Prevention of Significant Deterioration Workshop Manual, Prevention of Significant Deterioration and Nonattainment Area Permitting", Draft October 1990, Office of Air Quality Planning and Standards, Research Triangle Park, N.C., 1990. U.S. Environmental Protection Agency (USEPA), "Workbook for Plume Visual Impact Screening and Analysis (Revised)”, EPA-454/R-92-023, Office of Air Quality Planning and Standards, Research Triangle Park, N.C., October 1992.
U.S. Environmental Protection Agency (USEPA), “Addendum to ISC3 User’s Guide, the Prime Plume Rise and Building Downwash Model”, Earth Tech, Inc. and Electric Power Research Institute (EPRI), November, 1997. Available online from: http://www.epa.gov/scram001/7thconf/iscprime/useguide.pdf U.S. Environmental Protection Agency (USEPA), Memorandum from Daniel DeRoeck to Richard Daye, "Use of the Ambient Ratio Method for Modeling Significant Ambient Impacts of NO2", March 2002. U.S. Environmental Protection Agency (USEPA), "Revised Draft User’s Guide for the Aermod Terrain Preprocessor (Aermap)”, April 2003.

Deer Creek Station Class II Air Dispersion Modeling Results
May 29, 2009
D-13
U.S. Environmental Protection Agency (USEPA), "User’s Guide for the AMS/EPA Regulatory Model – AERMOD”, EPA-454/B-03-001, September 2004(a). U.S. Environmental Protection Agency (USEPA), "User’s Guide for the Aermod Meteorological Preprocessor (Aermet)”, EPA-454/B03-002, November 2004(b). U.S. Environmental Protection Agency (USEPA), "Appendix W to 40 CFR Part 51 - Guideline on Air Quality Models", 2005(a). U.S. Environmental Protection Agency (USEPA), “AERMOD Implementation Guide”. September, 27 2005. Available on-line from: http://www.epa.gov/scram001/7thconf/aermod/aermod_implmtn_guide.pdf. 2005(b). U.S. Environmental Protection Agency (USEPA), “AERMOD Implementation Guide” AERMOD Implementation Workgroup. October 19, 2007. U.S. Environmental Protection Agency (USEPA), “AERSURFACE User’s Guide.” EPA-454/B-08-001. http://www.epa.gov/scram001/7thconf/aermod/aersurface_userguide.pdf. January 2008. 2008(a). U.S. Environmental Protection Agency (USEPA). Technology Transfer Network (TTN) Air Quality System (AQS). Data for Roberts County, SD monitor. Web site accessed in July, 2008. 2008(b). U.S. Geological Survey (USGS), “1:24,000 Scale Digital Elevation Models (DEM)” Available online from: http://www.webgis.com/. 2008(a). U.S. Geological Survey (USGS) and USEPA, Multi-resolution Land Characterization (MRLC) Consortium. “National Land Cover Data”. MRLC Regional Land Cover Characterization Project of the USGS EROS Data Center (EDC), Sioux Falls, SD. Version 10-11-2000. Data available on-line from: http://www.webgis.com/. 2008(b).

Deer Creek Station Class II Air Dispersion Modeling Results
May 29, 2009
D-14
Figures and Tables
Figure 1. General location of the proposed Deer Creek Station.

Deer Creek Station Class II Air Dispersion Modeling Results
May 29, 2009
D-15
Figure 2. Specific location of the proposed Deer Creek Station.
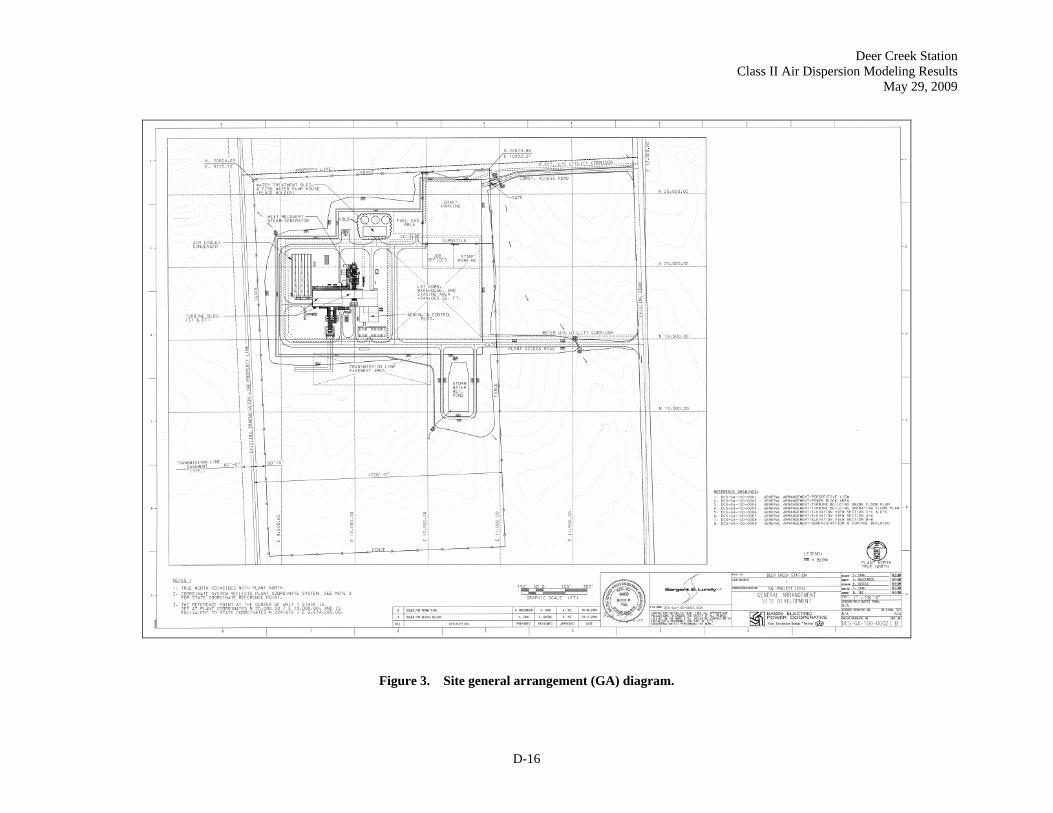
Deer Creek Station Class II Air Dispersion Modeling Results
May 29, 2009
D-16
Figure 3. Site general arrangement (GA) diagram.

Deer Creek Station Class II Air Dispersion Modeling Results
May 29, 2009
D-17
Figure 4. Elevation view of combustion turbine and HRSG.
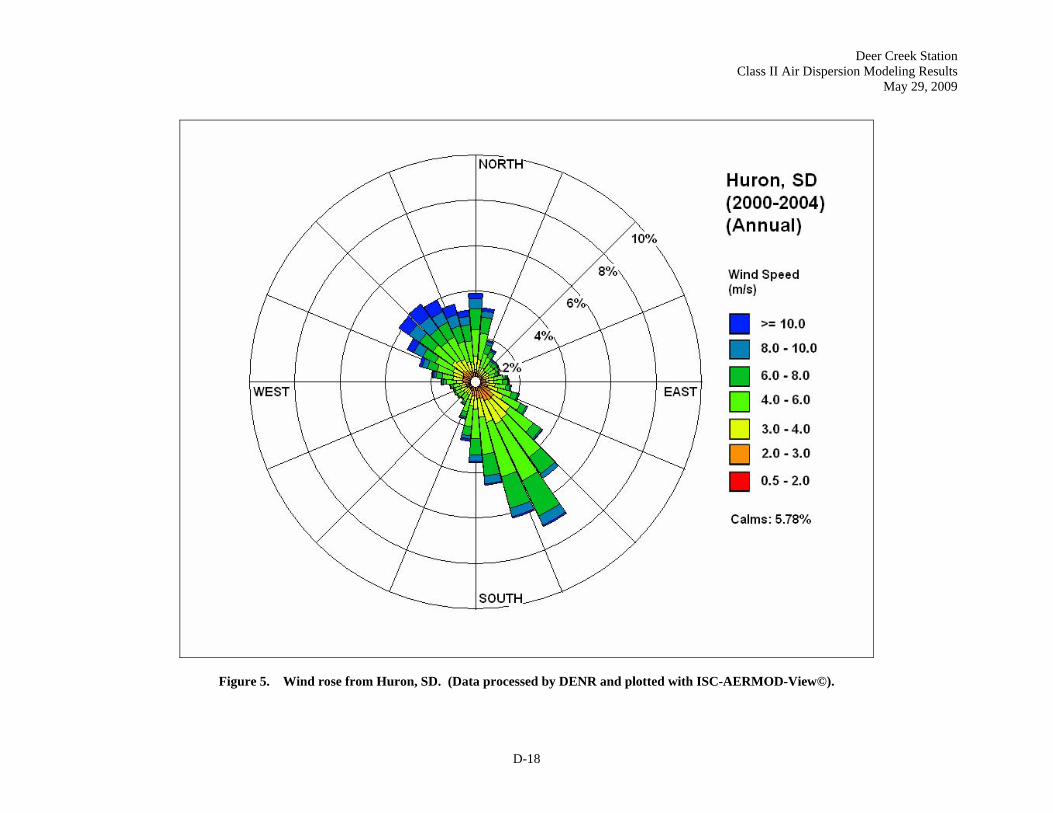
Deer Creek Station Class II Air Dispersion Modeling Results
May 29, 2009
D-18
Figure 5. Wind rose from Huron, SD. (Data processed by DENR and plotted with ISC-AERMOD-View©).

Deer Creek Generating Station Class II Air Dispersion Modeling Results
May 29, 2009
D-19
Figure 6. AERMOD receptor grid (outlined in white) and surrounding region looking north. (From AERMOD-ISC View© and Google-Earth map projection).
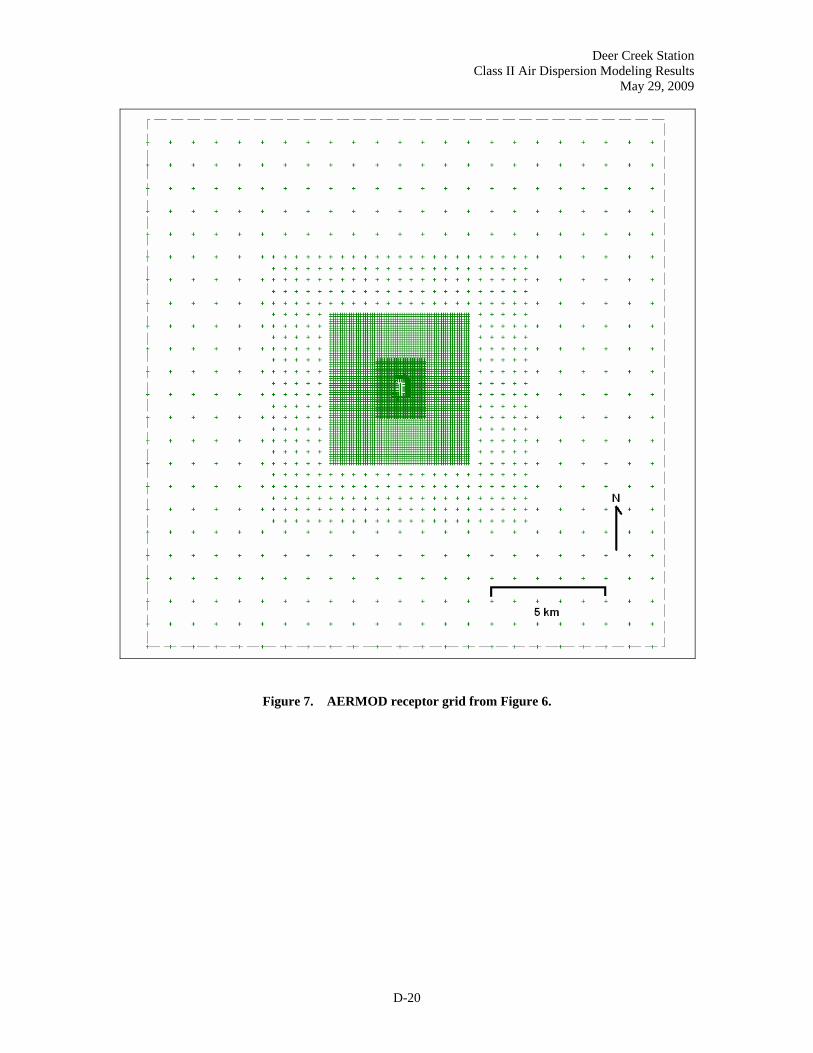
Deer Creek Station Class II Air Dispersion Modeling Results
May 29, 2009
D-20
Figure 7. AERMOD receptor grid from Figure 6.

Deer Creek Station Class II Air Dispersion Modeling Results
May 29, 2009
D-21
Figure 8. Plan view showing facility fence line, prominent structures included in BPIP-PRIME
(blue) and sources (red).

Deer Creek Station Class II Air Dispersion Modeling Results
May 29, 2009
D-22
Figure 9. Close-up plan view from Figure 8 showing structures (blue) and point sources (red).

Deer Creek Station Class II Air Dispersion Modeling Results
May 29, 2009
D-23
Figure 10. 3-D rendering of structures (blue) and point sources (red) from Figure 9, looking due north. White “+” signs represent discrete receptors shown in Figure 6 and Figure 7. The
HRSG/CT stack is in red. (Output from AERMOD-ISC View© transformed to a Google-Earth map projection).
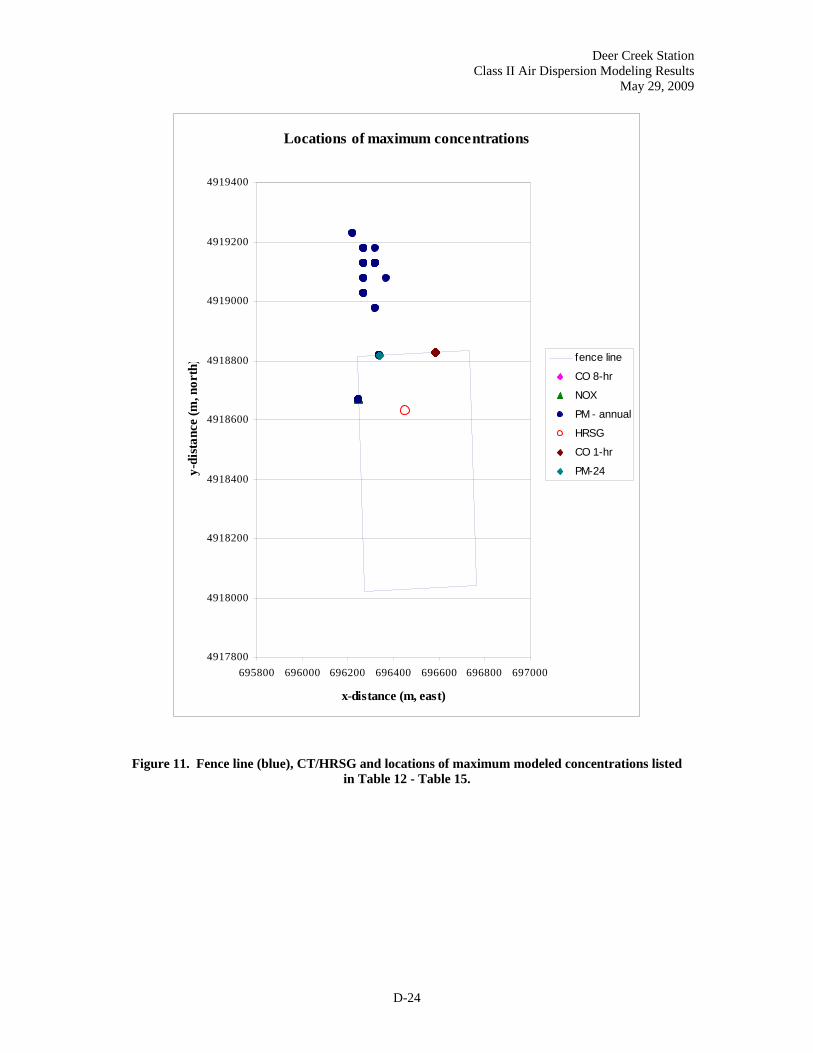
Deer Creek Station Class II Air Dispersion Modeling Results
May 29, 2009
D-24
Locations of maximum concentrations
4917800
4918000
4918200
4918400
4918600
4918800
4919000
4919200
4919400
695800 696000 696200 696400 696600 696800 697000
x-distance (m, east)
y-di
stan
ce (m
, nor
th) fence line
CO 8-hr
NOX
PM - annual
HRSG
CO 1-hr
PM-24
Figure 11. Fence line (blue), CT/HRSG and locations of maximum modeled concentrations listed in Table 12 - Table 15.
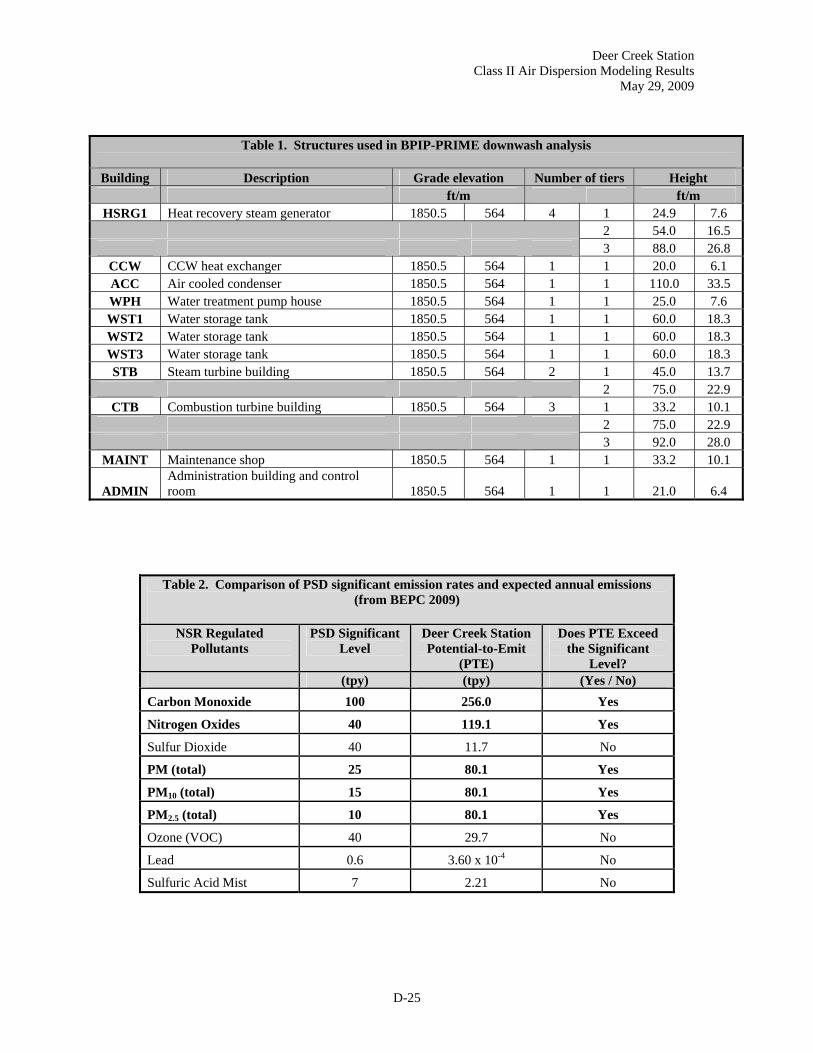
Deer Creek Station Class II Air Dispersion Modeling Results
May 29, 2009
D-25
Table 1. Structures used in BPIP-PRIME downwash analysis
Building Description Grade elevation Number of tiers Height
ft/m ft/m HSRG1 Heat recovery steam generator 1850.5 564 4 1 24.9 7.6
2 54.0 16.5 3 88.0 26.8
CCW CCW heat exchanger 1850.5 564 1 1 20.0 6.1 ACC Air cooled condenser 1850.5 564 1 1 110.0 33.5 WPH Water treatment pump house 1850.5 564 1 1 25.0 7.6 WST1 Water storage tank 1850.5 564 1 1 60.0 18.3 WST2 Water storage tank 1850.5 564 1 1 60.0 18.3 WST3 Water storage tank 1850.5 564 1 1 60.0 18.3 STB Steam turbine building 1850.5 564 2 1 45.0 13.7
2 75.0 22.9 CTB Combustion turbine building 1850.5 564 3 1 33.2 10.1
2 75.0 22.9 3 92.0 28.0
MAINT Maintenance shop 1850.5 564 1 1 33.2 10.1
ADMIN Administration building and control room 1850.5 564 1 1 21.0 6.4
Table 2. Comparison of PSD significant emission rates and expected annual emissions
(from BEPC 2009)
NSR Regulated Pollutants
PSD Significant Level
Deer Creek Station Potential-to-Emit
(PTE)
Does PTE Exceed the Significant
Level? (tpy) (tpy) (Yes / No) Carbon Monoxide 100 256.0 Yes
Nitrogen Oxides 40 119.1 Yes
Sulfur Dioxide 40 11.7 No
PM (total) 25 80.1 Yes
PM10 (total) 15 80.1 Yes
PM2.5 (total) 10 80.1 Yes
Ozone (VOC) 40 29.7 No
Lead 0.6 3.60 x 10⁻⁴ No
Sulfuric Acid Mist 7 2.21 No
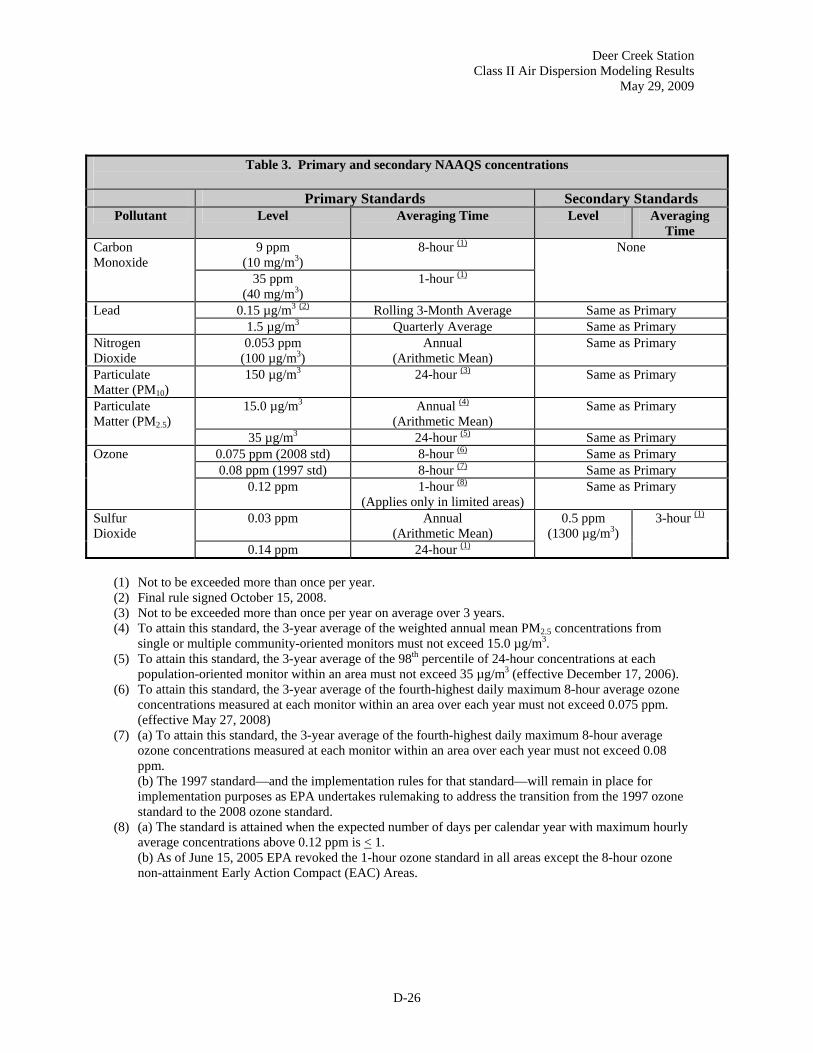
Deer Creek Station Class II Air Dispersion Modeling Results
May 29, 2009
D-26
Table 3. Primary and secondary NAAQS concentrations
Primary Standards Secondary Standards Pollutant Level Averaging Time Level Averaging
Time 9 ppm
(10 mg/m3) 8-hour (1) Carbon
Monoxide 35 ppm
(40 mg/m3) 1-hour (1)
None
0.15 µg/m3 (2) Rolling 3-Month Average Same as Primary Lead 1.5 µg/m3 Quarterly Average Same as Primary
Nitrogen Dioxide
0.053 ppm (100 µg/m3)
Annual (Arithmetic Mean)
Same as Primary
Particulate Matter (PM10)
150 µg/m3 24-hour (3) Same as Primary
15.0 µg/m3 Annual (4) (Arithmetic Mean)
Same as Primary Particulate Matter (PM2.5)
35 µg/m3 24-hour (5) Same as Primary 0.075 ppm (2008 std) 8-hour (6) Same as Primary 0.08 ppm (1997 std) 8-hour (7) Same as Primary
Ozone
0.12 ppm 1-hour (8) (Applies only in limited areas)
Same as Primary
0.03 ppm Annual (Arithmetic Mean)
Sulfur Dioxide
0.14 ppm 24-hour (1)
0.5 ppm (1300 µg/m3)
3-hour (1)
(1) Not to be exceeded more than once per year. (2) Final rule signed October 15, 2008. (3) Not to be exceeded more than once per year on average over 3 years. (4) To attain this standard, the 3-year average of the weighted annual mean PM2.5 concentrations from
single or multiple community-oriented monitors must not exceed 15.0 µg/m3. (5) To attain this standard, the 3-year average of the 98th percentile of 24-hour concentrations at each
population-oriented monitor within an area must not exceed 35 µg/m3 (effective December 17, 2006). (6) To attain this standard, the 3-year average of the fourth-highest daily maximum 8-hour average ozone
concentrations measured at each monitor within an area over each year must not exceed 0.075 ppm. (effective May 27, 2008)
(7) (a) To attain this standard, the 3-year average of the fourth-highest daily maximum 8-hour average ozone concentrations measured at each monitor within an area over each year must not exceed 0.08 ppm. (b) The 1997 standard—and the implementation rules for that standard—will remain in place for implementation purposes as EPA undertakes rulemaking to address the transition from the 1997 ozone standard to the 2008 ozone standard.
(8) (a) The standard is attained when the expected number of days per calendar year with maximum hourly average concentrations above 0.12 ppm is < 1. (b) As of June 15, 2005 EPA revoked the 1-hour ozone standard in all areas except the 8-hour ozone non-attainment Early Action Compact (EAC) Areas.

Deer Creek Station Class II Air Dispersion Modeling Results
May 29, 2009
D-27
Table 4. Allowable PSD Increments and Modeling Significance Levels (μg/m3) PSD Increments Modeling
Significance Levels
Pollutant Averaging Time
Class I Class II Class II Annual Arithmetic Mean
4 17 1 PM10
24-hour Maximum 8 30 5 Annual Arithmetic Mean
2 20 1
24-hour Maximum 5 91 5
SO2
3-hour Maximum 25 512 25 8-hour Maximum NA NA 500 CO 1-hour Maximum NA NA 2,000
NOx Annual Arithmetic Mean
2.5 25 1
NA = Not applicable – no standard exists for this pollutant and averaging time. Source: 40 CFR 52.21, 40 CFR 51.165
Table 5. Stack parameters for the CT/HRSG, emergency generator and fire water pump
UTM (E) UTM (N)
Source (AERMOD source name)
(UTM zone 14, NAD 27 )
Grade elevation (ft/m)
Stack height (ft/m)
Stack diameter
(ft/m)
Stack temp. (deg. F/K)
CT/HRSG (HRSG1) 696,451.0 4,918,630.0 1850.5 564.03 150 45.72 19.00 5.79 200 366.48Air Inlet Heater (HEAT1) 696451.0 4918633.0 1850.5 564.03 30 9.14 1.55 0.47 300 422.04Emergency generator (EGEN1) 696,368.7 4918530.5 1850.5 564.03 15 4.57 1.43 0.43 850 727.59Fire water pump (FWP1) 696494.0 4918705.4 1850.5 564.03 30 9.14 0.61 0.18 850 727.59

Deer Creek Generating Station Class II Air Dispersion Modeling Results
May 29, 2009
D-28
Table 6. Load conditions for the CT/HRSG
Modeling scenario Purpose Averaging period
Temperature (F) Load Duct-firing
1 Maximum annual average emissions Annual 43 100% On 2 Maximum annual average emissions Annual 43 100% Off 3 Maximum annual average emissions Annual 43 75% Off 4 Maximum annual average emissions Annual 43 50% Off 5 Maximum annual average emissions Annual 43 25% Off 6 Maximum short-term emissions Short-term1 43 100% On 7 Maximum short-term emissions Short-term 94 100% On 8 Maximum short-term emissions Short-term -41 100% On 9 Maximum short-term emissions Short-term 43 100% Off
10 Maximum short-term emissions Short-term 94 100% Off 11 Maximum short-term emissions Short-term -41 100% Off 12 Maximum short-term emissions Short-term 43 75% Off 13 Maximum short-term emissions Short-term 94 75% Off 14 Maximum short-term emissions Short-term 43 50% Off 15 Maximum short-term emissions Short-term 94 50% Off 16 Maximum short-term emissions Short-term 43 25% Off 17 Maximum short-term emissions Short-term 94 25% Off 18 Start-up (cold) Short-term, annual 43 Start-up Start-up 19 Start-up (warm) Short-term, annual 43 Start-up Start-up 20 Start-up (hot) Short-term, annual 43 Start-up Start-up
1 “Short-term” averaging periods refer to 24-, 8- and 1-hr averaging periods in this analysis.
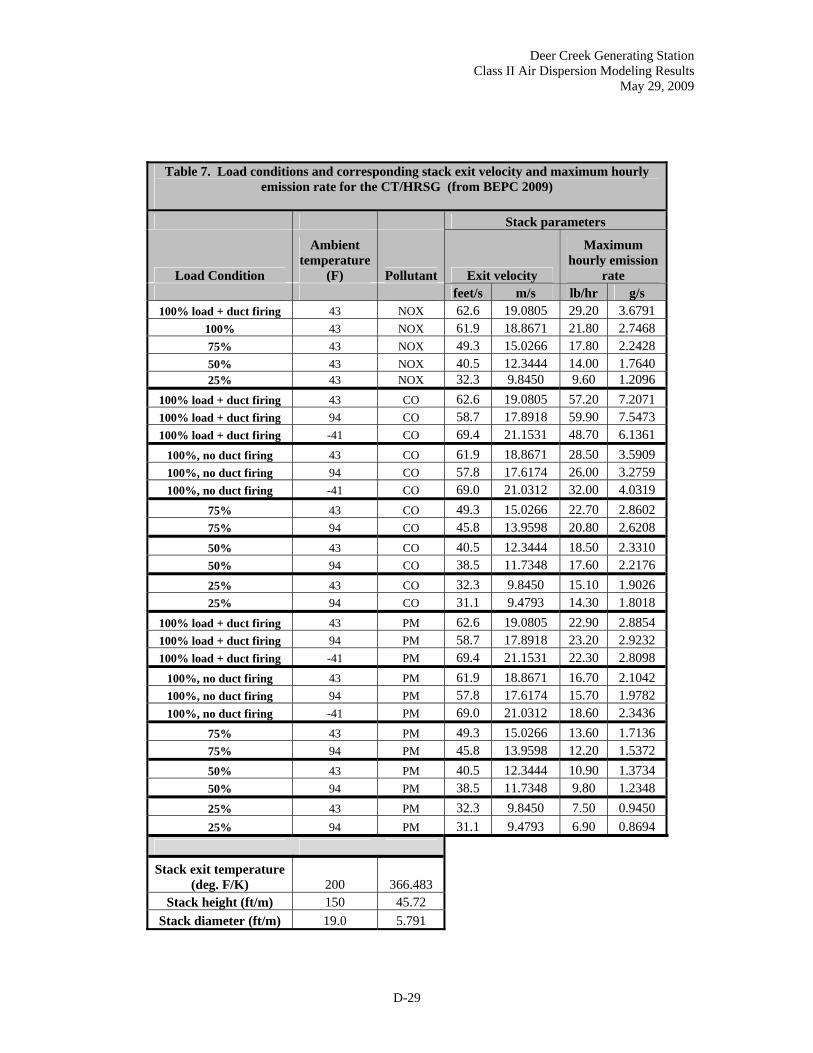
Deer Creek Generating Station Class II Air Dispersion Modeling Results
May 29, 2009
D-29
Table 7. Load conditions and corresponding stack exit velocity and maximum hourly
emission rate for the CT/HRSG (from BEPC 2009)
Stack parameters
Load Condition
Ambient temperature
(F) Pollutant Exit velocity
Maximum hourly emission
rate feet/s m/s lb/hr g/s
100% load + duct firing 43 NOX 62.6 19.0805 29.20 3.6791 100% 43 NOX 61.9 18.8671 21.80 2.7468 75% 43 NOX 49.3 15.0266 17.80 2.2428 50% 43 NOX 40.5 12.3444 14.00 1.7640 25% 43 NOX 32.3 9.8450 9.60 1.2096
100% load + duct firing 43 CO 62.6 19.0805 57.20 7.2071 100% load + duct firing 94 CO 58.7 17.8918 59.90 7.5473 100% load + duct firing -41 CO 69.4 21.1531 48.70 6.1361
100%, no duct firing 43 CO 61.9 18.8671 28.50 3.5909 100%, no duct firing 94 CO 57.8 17.6174 26.00 3.2759 100%, no duct firing -41 CO 69.0 21.0312 32.00 4.0319
75% 43 CO 49.3 15.0266 22.70 2.8602 75% 94 CO 45.8 13.9598 20.80 2.6208 50% 43 CO 40.5 12.3444 18.50 2.3310 50% 94 CO 38.5 11.7348 17.60 2.2176 25% 43 CO 32.3 9.8450 15.10 1.9026 25% 94 CO 31.1 9.4793 14.30 1.8018
100% load + duct firing 43 PM 62.6 19.0805 22.90 2.8854 100% load + duct firing 94 PM 58.7 17.8918 23.20 2.9232 100% load + duct firing -41 PM 69.4 21.1531 22.30 2.8098
100%, no duct firing 43 PM 61.9 18.8671 16.70 2.1042 100%, no duct firing 94 PM 57.8 17.6174 15.70 1.9782 100%, no duct firing -41 PM 69.0 21.0312 18.60 2.3436
75% 43 PM 49.3 15.0266 13.60 1.7136 75% 94 PM 45.8 13.9598 12.20 1.5372 50% 43 PM 40.5 12.3444 10.90 1.3734 50% 94 PM 38.5 11.7348 9.80 1.2348 25% 43 PM 32.3 9.8450 7.50 0.9450 25% 94 PM 31.1 9.4793 6.90 0.8694
Stack exit temperature
(deg. F/K) 200 366.483 Stack height (ft/m) 150 45.72
Stack diameter (ft/m) 19.0 5.791

Deer Creek Station Class II Air Dispersion Modeling Results
May 29, 2009
D-30
Table 8. Start-up maximum hourly emissions from the CT/HRSG (from BEPC 2009)
"Cold" start-up emissions
Total emissions (lbs)
Start up time (min)
Start up time (hr)
Emission rate (lb/hr)
Emission rate (g/s)
Pollutant CO 836.7 202 3.37 248.5 31.3136 NOX 221.6 202 3.37 65.5 8.2934 PM10 8.27 202 3.37 2.46 0.3095 Average exit velocity (ft/s, m/s) 43.6 13.2893
"Warm" start-up emissions
Total emissions (lbs)
Start up time (min)
Start up time (hr)
Emission rate (lb/hr)
Emission rate (g/s)
Pollutant CO 550.6 98 1.63 337.1 42.4741 NOX 87.9 98 1.63 53.8 6.7807 PM10 3.26 98 1.63 2.0 0.2515 Average exit velocity (ft/s, m/s) 37.3 11.369
"Hot" start-up emissions
Total emissions (lbs)
Start up time (min)
Start up time (hr)
Emission rate (lb/hr)
Emission rate (g/s)
Pollutant CO 346.60 63 1.05 330.1 41.5913 NOX 66.20 63 1.05 63.0 7.9439 PM10 1.96 63 1.05 1.87 0.2352 Average exit velocity (ft/s, m/s) 37.9 11.5519
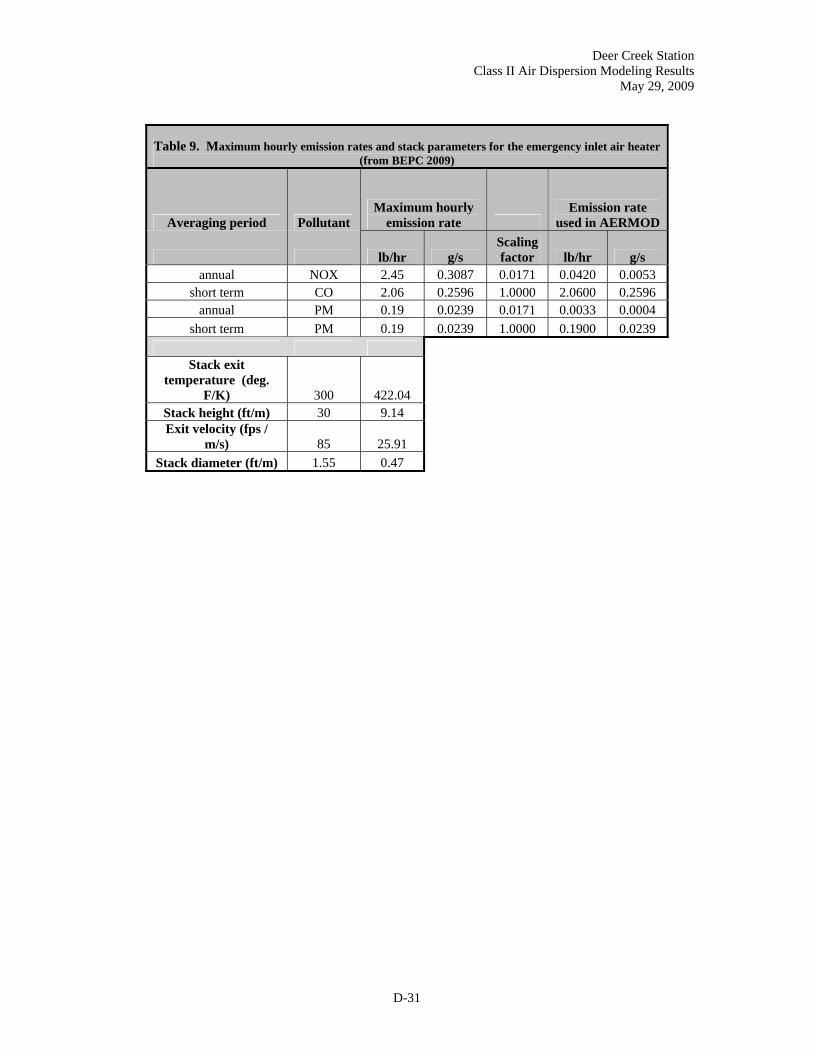
Deer Creek Station Class II Air Dispersion Modeling Results
May 29, 2009
D-31
Table 9. Maximum hourly emission rates and stack parameters for the emergency inlet air heater (from BEPC 2009)
Averaging period Pollutant Maximum hourly
emission rate Emission rate
used in AERMOD
lb/hr g/s Scaling factor lb/hr g/s
annual NOX 2.45 0.3087 0.0171 0.0420 0.0053 short term CO 2.06 0.2596 1.0000 2.0600 0.2596
annual PM 0.19 0.0239 0.0171 0.0033 0.0004 short term PM 0.19 0.0239 1.0000 0.1900 0.0239
Stack exit
temperature (deg. F/K) 300 422.04
Stack height (ft/m) 30 9.14 Exit velocity (fps /
m/s) 85 25.91 Stack diameter (ft/m) 1.55 0.47
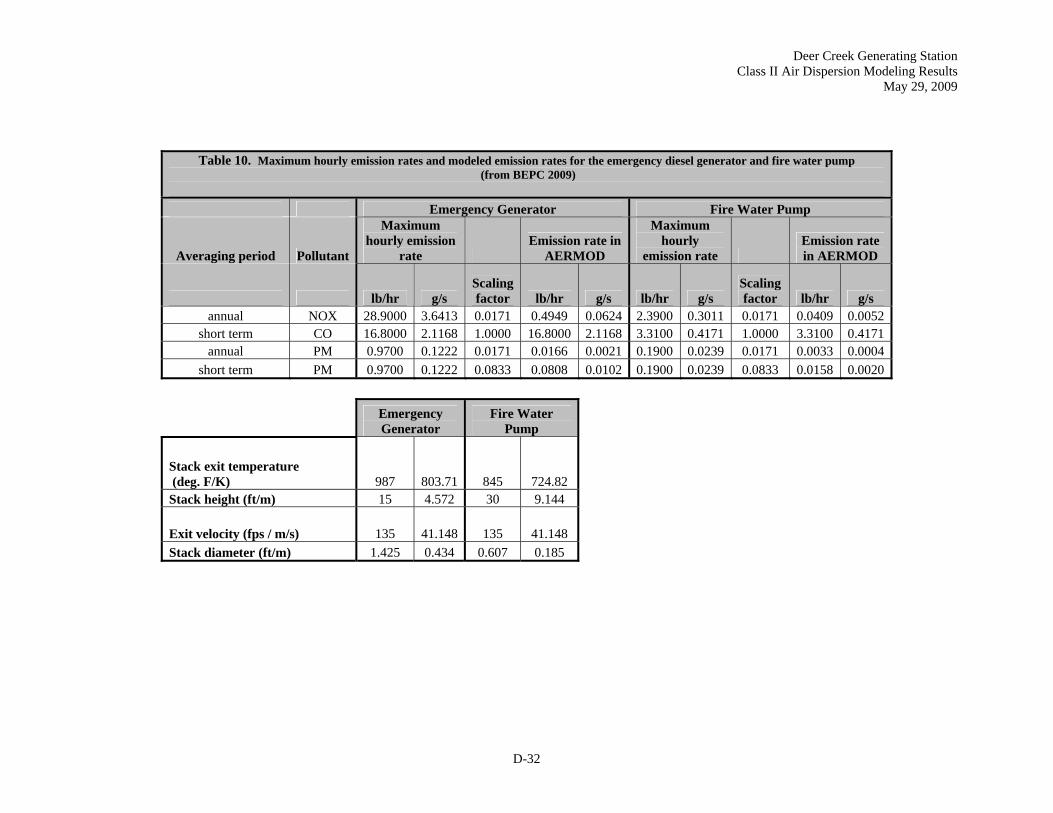
Deer Creek Generating Station Class II Air Dispersion Modeling Results
May 29, 2009
D-32
Table 10. Maximum hourly emission rates and modeled emission rates for the emergency diesel generator and fire water pump (from BEPC 2009)
Emergency Generator Fire Water Pump
Averaging period Pollutant
Maximum hourly emission
rate Emission rate in
AERMOD
Maximum hourly
emission rate Emission rate in AERMOD
lb/hr g/s Scaling factor lb/hr g/s lb/hr g/s
Scaling factor lb/hr g/s
annual NOX 28.9000 3.6413 0.0171 0.4949 0.0624 2.3900 0.3011 0.0171 0.0409 0.0052short term CO 16.8000 2.1168 1.0000 16.8000 2.1168 3.3100 0.4171 1.0000 3.3100 0.4171
annual PM 0.9700 0.1222 0.0171 0.0166 0.0021 0.1900 0.0239 0.0171 0.0033 0.0004short term PM 0.9700 0.1222 0.0833 0.0808 0.0102 0.1900 0.0239 0.0833 0.0158 0.0020
Emergency Generator
Fire Water Pump
Stack exit temperature (deg. F/K) 987 803.71 845 724.82 Stack height (ft/m) 15 4.572 30 9.144
Exit velocity (fps / m/s) 135 41.148 135 41.148 Stack diameter (ft/m) 1.425 0.434 0.607 0.185

Deer Creek Station Class II Air Dispersion Modeling Results
May 29, 2009
D-33
Table 11. Modeled emission rates used in AERMOD
CT/HRSG Air Inlet Heater Emergency Diesel
Generator Fire Water Pump
CT/HRSG Load condition
AERMOD averaging
period Temp.
(F) Pollutantexit
velocity emission
rate exit
velocity emission
rate exit
velocity emission
rate exit
velocity emission
rate
AERMOD input files
(*.adi) m/s g/s m/s g/s m/s g/s m/s g/s
100% load + duct firing annual 43 NOX 19.0805 3.6791 0.0010 0.0053 41.148 0.0624 41.148 0.0052 aa10nxx 100% annual 43 NOX 18.8671 2.7468 0.0010 0.0053 41.148 0.0624 41.148 0.0052 aa10nxxu 75% annual 43 NOX 15.0266 2.2428 0.0010 0.0053 41.148 0.0624 41.148 0.0052 aa75nxx 50% annual 43 NOX 12.3444 1.7640 0.0010 0.0053 41.148 0.0624 41.148 0.0052 aa50nxx 25% annual 43 NOX 9.8450 1.2096 0.0010 0.0053 41.148 0.0624 41.148 0.0052 aa25nxx
100% load + duct firing short term 43 CO 19.0805 7.2071 0.0010 0.2596 41.148 2.1168 41.148 0.4171 sa10call 100% load + duct firing short term 94 CO 17.8918 7.5473 0.0010 0.2596 41.148 2.1168 41.148 0.4171 ss10call 100% load + duct firing short term -41 CO 21.1531 6.1361 0.0010 0.2596 41.148 2.1168 41.148 0.4171 sn10call
100%, no duct firing short term 43 CO 18.8671 3.5909 0.0010 0.2596 41.148 2.1168 41.148 0.4171 sa10callu 100%, no duct firing short term 94 CO 17.6174 3.2759 0.0010 0.2596 41.148 2.1168 41.148 0.4171 ss10callu 100%, no duct firing short term -41 CO 21.0312 4.0319 0.0010 0.2596 41.148 2.1168 41.148 0.4171 sn10callu
75% short term 43 CO 15.0266 2.8602 0.0010 0.2596 41.148 2.1168 41.148 0.4171 sa75call 75% short term 94 CO 13.9598 2.6208 0.0010 0.2596 41.148 2.1168 41.148 0.4171 ss75call 50% short term 43 CO 12.3444 2.3310 0.0010 0.2596 41.148 2.1168 41.148 0.4171 sa50call 50% short term 94 CO 11.7348 2.2176 0.0010 0.2596 41.148 2.1168 41.148 0.4171 ss50call 25% short term 43 CO 9.8450 1.9026 0.0010 0.2596 41.148 2.1168 41.148 0.4171 sa25call 25% short term 94 CO 9.4793 1.8018 0.0010 0.2596 41.148 2.1168 41.148 0.4171 ss25call
cold start-up short term 43 CO 13.2893 31.3136 0.0010 0.2596 41.148 2.1168 41.148 0.4171 scSTcall warm start-up short term 43 CO 11.3690 42.4741 0.0010 0.2596 41.148 2.1168 41.148 0.4171 swSTcall
hot start-up short term 43 CO 11.5519 41.5913 0.0010 0.2596 41.148 2.1168 41.148 0.4171 shSTcall
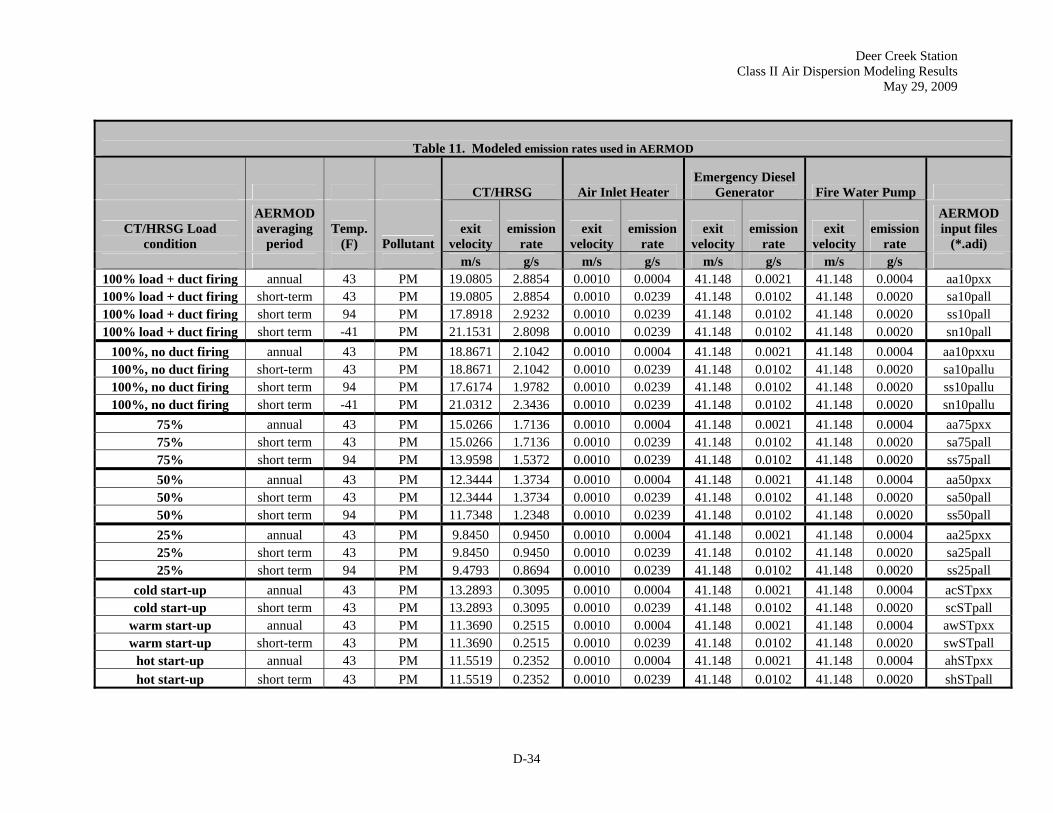
Deer Creek Station Class II Air Dispersion Modeling Results
May 29, 2009
D-34
Table 11. Modeled emission rates used in AERMOD
CT/HRSG Air Inlet Heater Emergency Diesel
Generator Fire Water Pump
CT/HRSG Load condition
AERMOD averaging
period Temp.
(F) Pollutantexit
velocity emission
rate exit
velocity emission
rate exit
velocity emission
rate exit
velocity emission
rate
AERMOD input files
(*.adi) m/s g/s m/s g/s m/s g/s m/s g/s
100% load + duct firing annual 43 PM 19.0805 2.8854 0.0010 0.0004 41.148 0.0021 41.148 0.0004 aa10pxx 100% load + duct firing short-term 43 PM 19.0805 2.8854 0.0010 0.0239 41.148 0.0102 41.148 0.0020 sa10pall 100% load + duct firing short term 94 PM 17.8918 2.9232 0.0010 0.0239 41.148 0.0102 41.148 0.0020 ss10pall 100% load + duct firing short term -41 PM 21.1531 2.8098 0.0010 0.0239 41.148 0.0102 41.148 0.0020 sn10pall
100%, no duct firing annual 43 PM 18.8671 2.1042 0.0010 0.0004 41.148 0.0021 41.148 0.0004 aa10pxxu 100%, no duct firing short-term 43 PM 18.8671 2.1042 0.0010 0.0239 41.148 0.0102 41.148 0.0020 sa10pallu 100%, no duct firing short term 94 PM 17.6174 1.9782 0.0010 0.0239 41.148 0.0102 41.148 0.0020 ss10pallu 100%, no duct firing short term -41 PM 21.0312 2.3436 0.0010 0.0239 41.148 0.0102 41.148 0.0020 sn10pallu
75% annual 43 PM 15.0266 1.7136 0.0010 0.0004 41.148 0.0021 41.148 0.0004 aa75pxx 75% short term 43 PM 15.0266 1.7136 0.0010 0.0239 41.148 0.0102 41.148 0.0020 sa75pall 75% short term 94 PM 13.9598 1.5372 0.0010 0.0239 41.148 0.0102 41.148 0.0020 ss75pall 50% annual 43 PM 12.3444 1.3734 0.0010 0.0004 41.148 0.0021 41.148 0.0004 aa50pxx 50% short term 43 PM 12.3444 1.3734 0.0010 0.0239 41.148 0.0102 41.148 0.0020 sa50pall 50% short term 94 PM 11.7348 1.2348 0.0010 0.0239 41.148 0.0102 41.148 0.0020 ss50pall 25% annual 43 PM 9.8450 0.9450 0.0010 0.0004 41.148 0.0021 41.148 0.0004 aa25pxx 25% short term 43 PM 9.8450 0.9450 0.0010 0.0239 41.148 0.0102 41.148 0.0020 sa25pall 25% short term 94 PM 9.4793 0.8694 0.0010 0.0239 41.148 0.0102 41.148 0.0020 ss25pall
cold start-up annual 43 PM 13.2893 0.3095 0.0010 0.0004 41.148 0.0021 41.148 0.0004 acSTpxx cold start-up short term 43 PM 13.2893 0.3095 0.0010 0.0239 41.148 0.0102 41.148 0.0020 scSTpall
warm start-up annual 43 PM 11.3690 0.2515 0.0010 0.0004 41.148 0.0021 41.148 0.0004 awSTpxx warm start-up short-term 43 PM 11.3690 0.2515 0.0010 0.0239 41.148 0.0102 41.148 0.0020 swSTpall
hot start-up annual 43 PM 11.5519 0.2352 0.0010 0.0004 41.148 0.0021 41.148 0.0004 ahSTpxx hot start-up short term 43 PM 11.5519 0.2352 0.0010 0.0239 41.148 0.0102 41.148 0.0020 shSTpall

Deer Creek Generating Station Class II Air Dispersion Modeling Results
May 29, 2009
D-35
Table 12. Results from AERMOD NOx significant impacts analysis
Load Condition Averaging
Period Temperature
(F) Pollutant
Maximum annual (2000) concentration
(μg/m3)
Location of maximum concentration
(eastings/northings)
Maximum annual (2001) concentration
(μg /m3)
Location of maximum concentration
(eastings/northings)
AERMOD (*.adi)
input files (xx=year)
100% load + duct firing annual 43 NOX 0.7078 696247.69 4918666.00 0.5458 696247.69 4918666.00 aa10nxx 100% annual 43 NOX 0.7057 696247.69 4918666.00 0.5438 696247.69 4918666.00 aa10nxxu 75% annual 43 NOX 0.7077 696247.69 4918666.00 0.5461 696247.69 4918666.00 aa75nxx 50% annual 43 NOX 0.7092 696247.69 4918666.00 0.5490 696247.69 4918666.00 aa50nxx 25% annual 43 NOX 0.7104 696247.69 4918666.00 0.5505 696247.69 4918666.00 aa25nxx
Load Condition Averaging
Period Temperature
(F) Pollutant
Maximum annual (2002) concentration
(μg /m3)
Location of maximum concentration
(eastings/northings)
Maximum annual (2003) concentration
(μg /m3)
Location of maximum concentration
(eastings/northings)
AERMOD (*.adi)
input files (xx=year)
100% load + duct firing annual 43 NOX 0.5215 696247.69 4918666.00 0.6495 696247.69 4918666.00 aa10nxx 100% annual 43 NOX 0.5196 696247.69 4918666.00 0.6479 696247.69 4918666.00 aa10nxxu 75% annual 43 NOX 0.5205 696247.69 4918666.00 0.6491 696247.69 4918666.00 aa75nxx 50% annual 43 NOX 0.5221 696247.69 4918666.00 0.6502 696247.69 4918666.00 aa50nxx 25% annual 43 NOX 0.5236 696247.69 4918666.00 0.6509 696247.69 4918666.00 aa25nxx
Load Condition Averaging
Period Temperature
(F) Pollutant
Maximum annual (2004) concentration
(μg /m3)
Location of maximum concentration
(eastings/northings)
AERMOD (*.adi)
input files (xx=year)
100% load + duct firing annual 43 NOX 0.6592 696247.69 4918666.00 aa10nxx 100% annual 43 NOX 0.6572 696247.69 4918666.00 aa10nxxu 75% annual 43 NOX 0.6580 696247.69 4918666.00 aa75nxx 50% annual 43 NOX 0.6588 696247.69 4918666.00 aa50nxx 25% annual 43 NOX 0.6596 696247.69 4918666.00 aa25nxx
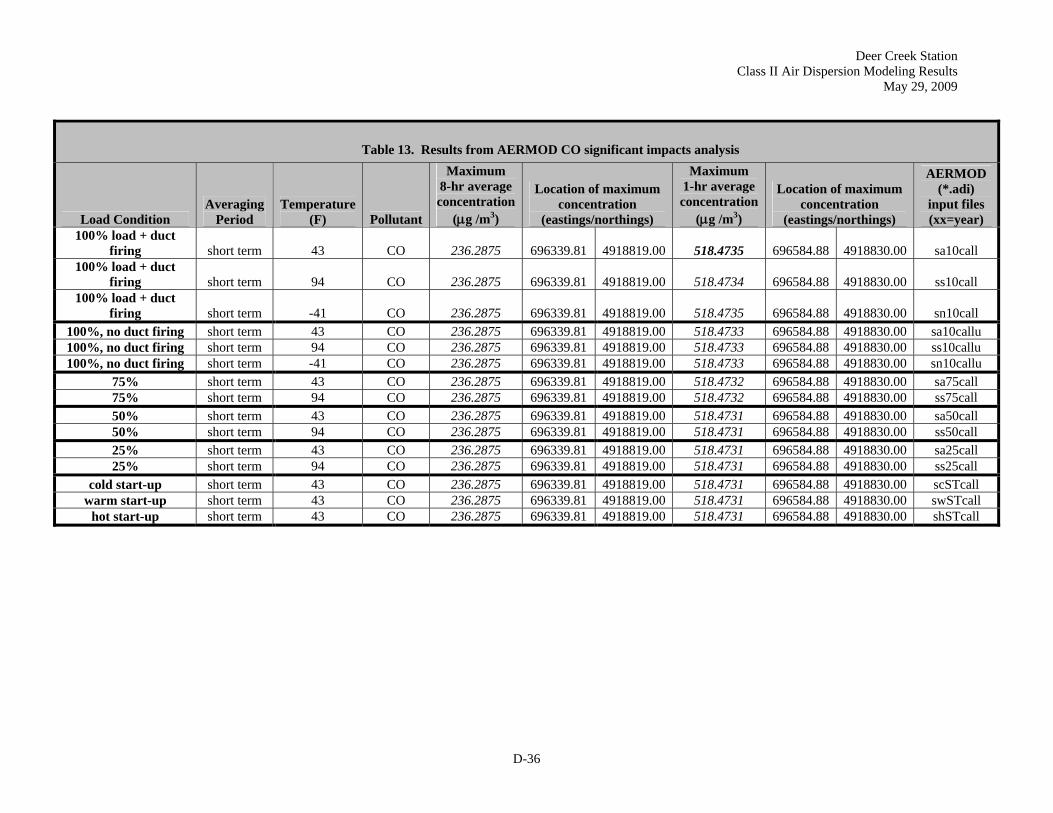
Deer Creek Station Class II Air Dispersion Modeling Results
May 29, 2009
D-36
Table 13. Results from AERMOD CO significant impacts analysis
Load Condition Averaging
Period Temperature
(F) Pollutant
Maximum 8-hr average concentration
(μg /m3)
Location of maximum concentration
(eastings/northings)
Maximum 1-hr average concentration
(μg /m3)
Location of maximum concentration
(eastings/northings)
AERMOD (*.adi)
input files (xx=year)
100% load + duct firing short term 43 CO 236.2875 696339.81 4918819.00 518.4735 696584.88 4918830.00 sa10call
100% load + duct firing short term 94 CO 236.2875 696339.81 4918819.00 518.4734 696584.88 4918830.00 ss10call
100% load + duct firing short term -41 CO 236.2875 696339.81 4918819.00 518.4735 696584.88 4918830.00 sn10call
100%, no duct firing short term 43 CO 236.2875 696339.81 4918819.00 518.4733 696584.88 4918830.00 sa10callu 100%, no duct firing short term 94 CO 236.2875 696339.81 4918819.00 518.4733 696584.88 4918830.00 ss10callu 100%, no duct firing short term -41 CO 236.2875 696339.81 4918819.00 518.4733 696584.88 4918830.00 sn10callu
75% short term 43 CO 236.2875 696339.81 4918819.00 518.4732 696584.88 4918830.00 sa75call 75% short term 94 CO 236.2875 696339.81 4918819.00 518.4732 696584.88 4918830.00 ss75call 50% short term 43 CO 236.2875 696339.81 4918819.00 518.4731 696584.88 4918830.00 sa50call 50% short term 94 CO 236.2875 696339.81 4918819.00 518.4731 696584.88 4918830.00 ss50call 25% short term 43 CO 236.2875 696339.81 4918819.00 518.4731 696584.88 4918830.00 sa25call 25% short term 94 CO 236.2875 696339.81 4918819.00 518.4731 696584.88 4918830.00 ss25call
cold start-up short term 43 CO 236.2875 696339.81 4918819.00 518.4731 696584.88 4918830.00 scSTcall warm start-up short term 43 CO 236.2875 696339.81 4918819.00 518.4731 696584.88 4918830.00 swSTcall
hot start-up short term 43 CO 236.2875 696339.81 4918819.00 518.4731 696584.88 4918830.00 shSTcall

Deer Creek Station Class II Air Dispersion Modeling Results
May 29, 2009
D-37
Table 14. Results from AERMOD PM significant impacts analysis
Load Condition Averaging
Period Temperature
(F) Pollutant
Maximum average
concentration (μg /m3)
Location of maximum concentration
(eastings/northings)
AERMOD (*.adi)
input files (xx=year)
100% load + duct firing 24-hr 43 PM 3.56632 696339.81 4918819.00 sa10pall
100% load + duct firing 24-hr 94 PM 3.56648 696339.81 4918819.00 ss10pall
100% load + duct firing 24-hr -41 PM 3.56609 696339.81 4918819.00 sn10pall 100% 24-hr 43 PM 3.56581 696339.81 4918819.00 sa10pallu 100% 24-hr 94 PM 3.56582 696339.81 4918819.00 ss10pallu 100% 24-hr -41 PM 3.56581 696339.81 4918819.00 sn10pallu 75% 24-hr 43 PM 3.56588 696339.81 4918819.00 sa75pall 75% 24-hr 94 PM 3.56585 696339.81 4918819.00 ss75pall 50% 24-hr 43 PM 3.57049 696339.81 4918819.00 sa50pall 50% 24-hr 94 PM 3.56958 696339.81 4918819.00 ss50pall 25% 24-hr 43 PM 3.56962 696339.81 4918819.00 sa25pall 25% 24-hr 94 PM 3.56929 696339.81 4918819.00 ss25pall
cold start-up 24-hr 43 PM 3.56524 696339.81 4918819.00 scSTpall warm start-up 24-hr 43 PM 3.56575 696339.81 4918819.00 swSTpall
hot start-up 24-hr 43 PM 3.56559 696339.81 4918819.00 shSTpall
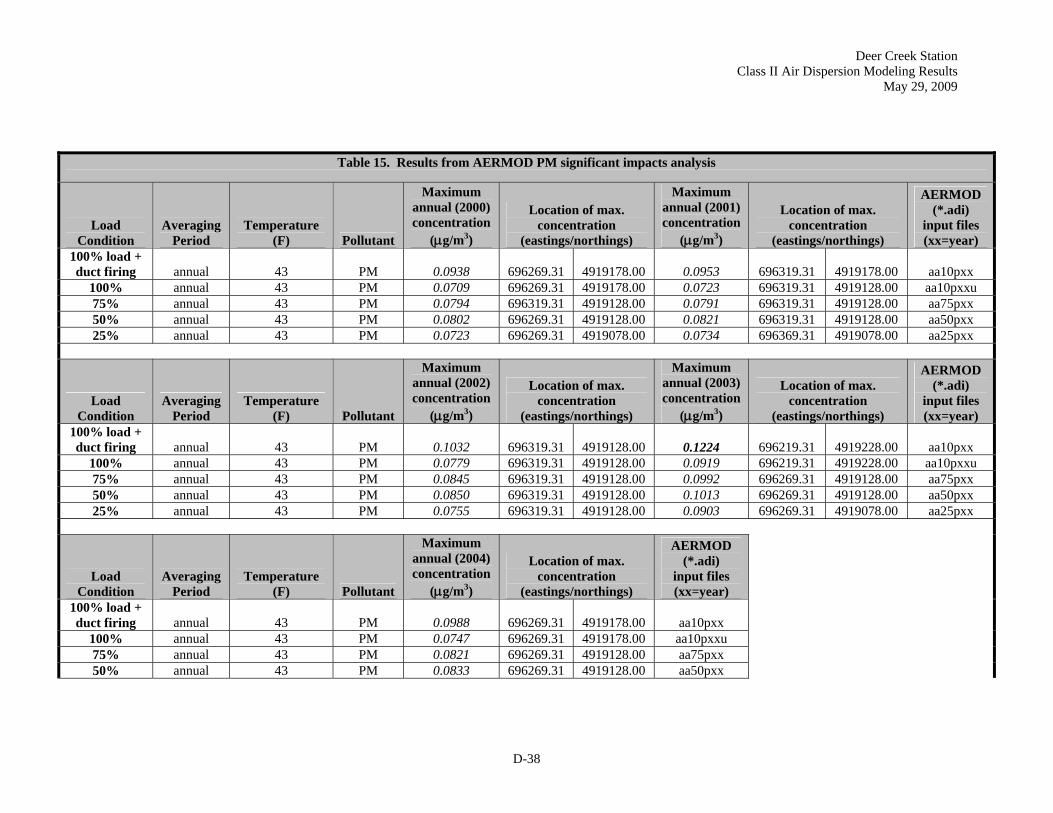
Deer Creek Station Class II Air Dispersion Modeling Results
May 29, 2009
D-38
Table 15. Results from AERMOD PM significant impacts analysis
Load Condition
Averaging Period
Temperature (F) Pollutant
Maximum annual (2000) concentration
(μg/m3)
Location of max. concentration
(eastings/northings)
Maximum annual (2001) concentration
(μg/m3)
Location of max. concentration
(eastings/northings)
AERMOD (*.adi)
input files (xx=year)
100% load + duct firing annual 43 PM 0.0938 696269.31 4919178.00 0.0953 696319.31 4919178.00 aa10pxx
100% annual 43 PM 0.0709 696269.31 4919178.00 0.0723 696319.31 4919128.00 aa10pxxu 75% annual 43 PM 0.0794 696319.31 4919128.00 0.0791 696319.31 4919128.00 aa75pxx 50% annual 43 PM 0.0802 696269.31 4919128.00 0.0821 696319.31 4919128.00 aa50pxx 25% annual 43 PM 0.0723 696269.31 4919078.00 0.0734 696369.31 4919078.00 aa25pxx
Load Condition
Averaging Period
Temperature (F) Pollutant
Maximum annual (2002) concentration
(μg/m3)
Location of max. concentration
(eastings/northings)
Maximum annual (2003) concentration
(μg/m3)
Location of max. concentration
(eastings/northings)
AERMOD (*.adi)
input files (xx=year)
100% load + duct firing annual 43 PM 0.1032 696319.31 4919128.00 0.1224 696219.31 4919228.00 aa10pxx
100% annual 43 PM 0.0779 696319.31 4919128.00 0.0919 696219.31 4919228.00 aa10pxxu 75% annual 43 PM 0.0845 696319.31 4919128.00 0.0992 696269.31 4919128.00 aa75pxx 50% annual 43 PM 0.0850 696319.31 4919128.00 0.1013 696269.31 4919128.00 aa50pxx 25% annual 43 PM 0.0755 696319.31 4919128.00 0.0903 696269.31 4919078.00 aa25pxx
Load Condition
Averaging Period
Temperature (F) Pollutant
Maximum annual (2004) concentration
(μg/m3)
Location of max. concentration
(eastings/northings)
AERMOD (*.adi)
input files (xx=year)
100% load + duct firing annual 43 PM 0.0988 696269.31 4919178.00 aa10pxx
100% annual 43 PM 0.0747 696269.31 4919178.00 aa10pxxu 75% annual 43 PM 0.0821 696269.31 4919128.00 aa75pxx 50% annual 43 PM 0.0833 696269.31 4919128.00 aa50pxx

Deer Creek Station Class II Air Dispersion Modeling Results
May 29, 2009
D-39
25% annual 43 PM 0.0744 696269.31 4919078.00 aa25pxx Table 16. Results from AERMOD PM significant impacts analysis (annual averaging period)
Load Condition Averaging
Period Temperature
(F) Pollutant
Maximum (2000)
concentration (ug/m3)
Location of max. concentration
(eastings/northings)
Maximum (2001)
concentration (ug/m3)
Location of max. concentration
(eastings/northings)
AERMOD (*.adi) file
name (xx=year)
cold start-up annual 43 PM 0.0270 696247.69 4918666.00 0.0240 696339.81 4918819.00 acSTpxx warm start-up annual 43 PM 0.0272 696247.69 4918666.00 0.0241 696339.81 4918819.00 awSTpxx
hot start-up annual 43 PM 0.0271 696247.69 4918666.00 0.0239 696339.81 4918819.00 ahSTpxx
Load Condition Averaging
Period Temperature
(F) Pollutant
Maximum (2002)
concentration (ug/m3)
Location of max. concentration
(eastings/northings)
Maximum (2003)
concentration (ug/m3)
Location of max. concentration
(eastings/northings)
AERMOD (*.adi) file
name (xx=year)
cold start-up annual 43 PM 0.0237 696269.31 4919028.00 0.0277 696269.31 4919028.00 acSTpxx warm start-up annual 43 PM 0.0237 696319.31 4918978.00 0.0276 696269.31 4919028.00 awSTpxx
hot start-up annual 43 PM 0.0226 696319.31 4918978.00 0.0261 696269.31 4919028.00 ahSTpxx
Load Condition Averaging
Period Temperature
(F) Pollutant
Maximum (2004)
concentration (ug/m3)
Location of max. concentration
(eastings/northings)
AERMOD (*.adi) file
name (xx=year)
cold start-up annual 43 PM 0.0249 696247.69 4918666.00 acSTpxx warm start-up annual 43 PM 0.0250 696247.69 4918666.00 awSTpxx
hot start-up annual 43 PM 0.0249 696247.69 4918666.00 ahSTpxx

Deer Creek Generating Station Class II Air Dispersion Modeling Results
May 29, 2009
D-40
Table 17. Comparison of maximum modeled impacts with modeling significance levels and De minimus
monitoring exemption levels Pollutant Averaging
period Maximum modeled impact (μg/m3) (from Table 12-Table 16)
Modeling significance levels (MSL) (μg/m3) (from Table 4)
Maximum modeled impact (% MSL)
De minimus monitoring exemption (μg/m3)
Maximum modeled impact (% De minimus concentration)
1-hour 518.4735 2,000 25.92% CO 8-hour 236.2875 500 47.26% 575 41.09%
NOx Annual 0.7104 1 71.04% 14 5.07% 24-hr 3.5705 5 71.41% 10 35.70% PM10 Annual 0.1224 1 12.24%
Table 18. Comparison of maximum modeled PM concentrations with PM2.5 NAAQS
PM 2.5 NAAQS (μg/m3)
Maximum modeled impact as (% of PM 2.5 NAAQS)
Pollutant Averaging period
Maximum modeled impact (μg/m3)
Background concentration(μg/m3) (Note 2)
Maximum total impact (μg/m3)
24-hr 3.5705
(Note 3) 23 26.6 35 75.92%
PM2.5 Annual 0.1224
(Note 4) 9.7 9.8 15 65.48%
2 These background concentrations were recorded by monitor #46-011-0002 at the City Hall in Brookings, SD. The 24-hour background value is the 98th percentile reading listed in DENR (2007; Table 6.1). The annual value is the maximum recorded annual value in DENR (2007; Figure 6-3). 3 Maximum modeled 24-hour average concentration during 2000-2004. 4 Maximum modeled annual concentration during 2000-2004.

Deer Creek Station Class II Air Dispersion Modeling Results
May 29, 2009
D-41
Table 19. AERMOD system input and output files
Scenario description Pollutant Averaging Period
Input/ output files (*.adi/.out) (xx=00, 01, 02, 03, 04)
7.5 min. Digital Elevation Map (DEM) and other files
100% load + duct firing NOX annual aa10nxx Astoria 100% NOX annual aa10nxxu Aurora 75% NOX annual aa75nxx Arco 50% NOX annual aa50nxx Brookings 25% NOX annual aa25nxx Brookings NE
100% load + duct firing CO short-term sa10call Canby SE
100% load + duct firing CO short-term ss10call Elkton
100% load + duct firing CO short-term sn10call Estelline SE
100%, no duct firing CO short-term sa10callu Flandreau NE 100%, no duct firing CO short-term ss10callu Flandreau NW 100%, no duct firing CO short-term sn10callu Hendricks
75% CO short-term sa75call Lake Benton NE 75% CO short-term ss75call Lake Benton NW 50% CO short-term sa50call Lake Benton SW 50% CO short-term ss50call Lake Benton 25% CO short-term sa25call Medary 25% CO short-term ss25call Porter SW
cold start-up CO short-term scSTcall Ruthton NW warm start-up CO short-term swSTcall Toronto
hot start-up CO short-term shSTcall Tyler 100% load + duct
firing PM annual aa10pxx Verdi 100% load + duct
firing PM short-term sa10pall White NE 100% load + duct
firing PM short-term ss10pall White SE 100% load + duct
firing PM short-term sn10pall White 100%, no duct firing PM annual aa10pxxu 100%, no duct firing PM short-term sa10pallu 100%, no duct firing PM short-term ss10pallu 100%, no duct firing PM short-term sn10pallu
75% PM annual aa75pxx 75% PM short-term sa75pall 75% PM short-term ss75pall 50% PM annual aa50pxx 50% PM short-term sa50pall 50% PM short-term ss50pall

Deer Creek Station Class II Air Dispersion Modeling Results
May 29, 2009
D-42
Table 19. AERMOD system input and output files
Scenario description Pollutant Averaging Period
Input/ output files (*.adi/.out) (xx=00, 01, 02, 03, 04)
7.5 min. Digital Elevation Map (DEM) and other files
25% PM annual aa25pxx Meteorological input data 25% PM short-term sa25pall HON_ABR.SFC 25% PM short-term ss25pall HON_ABR.PFL
cold start-up PM annual acSTpxx cold start-up PM short-term scSTpall
warm start-up PM annual awSTpxx warm start-up PM short-term swSTpall BPIP files
hot start-up PM annual ahSTpxx Deer_Creek.bpi hot start-up PM short-term shSTpall Deer_Creek.pro
