appendix a: mbk engineers technical ... kern fan gw...2018/02/23 · project, 2030 future condition...
TRANSCRIPT

Public Benefit Ratio Appeal of
Water Storage Investment Program Public Benefit Ratio Review for
The Kern Fan Groundwater Storage Project
APPENDIX A:
MBK ENGINEERS TECHNICAL MEMORANDUM
Analysis of Kern Fan Groundwater Storage Project for Water Storage Investment Program
FEBRUARY 23, 2018
1
T E C H N I C A L M E M O R A N D U M DATE: February 23, 2018 TO: Paul Weghorst, Fiona Sanchez, and Natalie Palacio of Irvine Ranch Water District PREPARED BY: Lee Bergfeld, P.E., and Shankar Parvathinathan, P.E., of MBK Engineers SUBJECT: Analysis of Kern Fan Groundwater Storage Project for Water
Storage Investment Program
Introduction This technical memorandum presents information on the numerical modeling analysis for the Kern Fan Groundwater Storage Project (Project) in support of a grant application for the Water Storage Investment Program (WSIP). The Project will recharge and store up to 100,000 acre-feet (af) of water from the Sacramento-San Joaquin Delta (Delta), when available. The Project will provide both public and non-public benefits by storing additional water in the aquifers that underlie the Kern River Fan in wet years, and by extracting water in dry years, to provide both ecosystem and water supply benefits. This technical memorandum has been updated to address comments from California Water Commission (CWC) staff after their public benefit ratio review. CWC staff comments are included in the CWC’s February 1, 2018 letter.
Project Operations Overview The Project will operate by recharging and storing water supplied by the State Water Project (SWP) from the Delta, under the Article 21 Program. Article 21 water is available, in accordance with long-term Water Supply Contracts, for State Water Contractors that have signed the Monterey Amendment. Article 21 water is available when there is water in excess of SWP needs. This typically occurs in wet years when precipitation and runoff in the Delta watershed exceed long-term averages. Article 21 water will be delivered to the Project utilizing available capacity in the California Aqueduct and the Cross Valley Canal. The Project includes 400 cubic feet per second (cfs) of dedicated conveyance capacity to move water in either direction between the Project spreading basins and the Cross Valley Canal.
The Project also includes approximately 1,200 acres of spreading basins, with a recharge rate of approximately 13,000 to 26,000 af per month, depending on antecedent conditions, and an extraction capacity of 45,000 af per year. Project storage capacity will be split between
Water Resources Flood Control Water Rights

2
accounts for public benefits (25,000 af), Irvine Ranch Water District (IRWD) (37,500 af) and Rosedale-Rio Bravo Water Storage District (Rosedale) (37,500 af). Water will be stored in the Project based on the percent of capacity dedicated to each account, i.e., 37.5% to IRWD, 37.5% to Rosedale, and 25% to public benefits.
The Project will be operated to provide both public and non-public benefits. An overview of operations to provide each type of benefit is provided in the following sections.
Operations for Public Benefits
Water can be withdrawn from the Project to provide multiple benefits. The Project can be integrated with Oroville Reservoir operations because water stored in the Project can be extracted and delivered to the California Aqueduct to meet a portion of SWP Table A demands that would otherwise be met with water released from Oroville Reservoir and exported from the Delta at Banks Pumping Plant. An operational agreement with the Department of Water Resources (DWR) will allow the Project to integrate with Oroville operations to provide public benefits.
Under the operational agreement, DWR will release short-term pulse flows (Ecosystem Pulse) from Oroville, in April or May, to improve habitat conditions for rearing, downstream migration of spring and fall-run Chinook, and benefits to other fish species. Ecosystem Pulses are expected to improve conditions in the Feather River, downstream of Oroville Dam, and the Sacramento River, from the confluence with the Feather River through the Delta. DWR will make Ecosystem Pulses when water is available in the Project’s public benefits account. The magnitude and duration of the Ecosystem Pulse will be determined based on the volume of water available in the Project and the expected fisheries benefit. The Project will target making Ecosystem Pulses in drier years when Oroville Reservoir will not make flood control releases.
After making an Ecosystem Pulse, water in storage in Oroville Reservoir will be lower by the volume of the pulse. However, the Project will be providing water to meet SWP demands in the export service area, thereby providing a means to “recover” storage in Oroville. Oroville storage will recover by reducing releases to support demands in the export service area, typically in the July through September period. Under this operation, Oroville carryover storage at the end of September is expected to be essentially the same as without the Project.
Figure 1 illustrates the Project’s effects on Oroville Reservoir storage and flows in the Feather River for an example year, from April through September.

3
Figure 1. Example of Project Public Benefits through Integration with Oroville Reservoir
Once it is determined that an Ecosystem Pulse will be made, the Project will begin extracting water from the public benefits account for delivery back to the California Aqueduct and SWP Table A contractors. This will likely begin shortly before or after the Ecosystem Pulse is released from Oroville. Water extracted from the Project will replace SWP water that would otherwise be provided from San Luis Reservoir. Therefore, water provided by the Project can essentially be stored in the SWP portion of San Luis Reservoir and will increase storage in San Luis compared to a without-project condition. SWP storage in San Luis will also be affected by a reduction in Banks pumping expected to occur when Oroville release is reduced for a short period in the July through September period. Immediately following this period of reduced Banks pumping, SWP storage in San Luis may be lower than under a without-project condition. Project extraction will continue until the volume of Ecosystem Pulse has been extracted and SWP San Luis storage has returned to the same level as it would have originally been, absent the Project.
Figure 2 illustrates the potential start and end dates for Project extraction from the Public Benefits account, and the Project’s effects on storage in SWP San Luis and Banks pumping for an example year, from April through November.
1,500
2,000
2,500
3,000
3,500
4,000
1,000
2,000
3,000
4,000
5,000
6,000
7,000
8,000
9,000
1-Apr 1-May 1-Jun 1-Jul 1-Aug 1-Sep
Oro
ville
Sto
rage
(1,0
00 a
cre-
feet
)
Feat
her R
iver
Flo
w (c
fs)
Feather River: No Project Feather River: With Project Storage: No Project Storage: With Project
Ecosystem Pulse Flow
Reduced Oroville Releasefor Delta Export
No Change in Oroville Carryover Storage

4
Figure 2. Example of Effect of Project Operations on SWP San Luis Reservoir and Banks Pumping
Operations for Non-Public Benefits
Water stored in accounts for IRWD and Rosedale provides a water supply benefit for these two agencies. These deliveries would be made on behalf of IRWD as a landowner in Dudley Ridge Water District (DRWD) and Rosedale as a sub-unit of the Kern County Water agency. IRWD will physically extract water from the Project for delivery during years of reduced available supply from other sources in their supply portfolio; these may include years of below average SWP Table A allocations. Rosedale will manage water stored in the Project account as another source in their water supply portfolio.
Analytical Approach The analytical approach involves the use of CalSim II model results to depict the without-Project (Baseline) scenario. The CalSim II model simulates operations of Central Valley Project (CVP) and SWP in order to meet existing environmental and regulatory requirements, contract obligations, and other system requirements. The operation of the Project is then simulated in a spreadsheet model that layers the Project onto the Baseline operation of the CVP and SWP as simulated in CalSim II. The spreadsheet model simulates the with-Project scenario. The Project benefits and effects are then determined and quantified by comparison of the with-Project and without-Project scenarios.
200
300
400
500
600
700
800
900
1,000
0
1,000
2,000
3,000
4,000
5,000
6,000
7,000
8,000
1-Apr 1-May 1-Jun 1-Jul 1-Aug 1-Sep 1-Oct 1-Nov
SWP
San
Luis
Stor
age
(1,0
00 a
cre-
feet
)
Bank
s Pum
ping
Pla
nt (c
fs)
Banks Pumping: No Project Banks Pumping: With Project Storage: No Project Storage: With Project
Project Extraction Begins& Stored in San Luis
Reduced Oroville Releasefor Delta Export
Project Extraction EndsNo Change in SWP San Luis

5
The Baseline scenario for this analysis is the WSIP 2030 CalSim II model dated November 2, 2016, and available from the WSIP website. This model simulation is described as a without-project, 2030 future condition with projected climate and sea-level conditions for a thirty-year period centered at 2030. The Project scenario is simulated using a spreadsheet operations model which operates on a monthly time-step similar to CalSim II for the period October 1921 through September 2003 and utilizes CalSim II baseline depiction of CVP/SWP operations.
Study Area
While the project is located in Kern County, effects of the Project extend to the Delta for the source of water and upstream on the Feather River for ecosystem benefits. Additionally, water supply developed by the Project may be delivered within the SWP service area.
The Project is expected to affect the following locations:
1. Delta outflows 2. SWP Delta exports 3. Flows in Feather and Sacramento rivers and inflows to Delta 4. Storage in Lake Oroville 5. Storage in San Luis Reservoir 6. Water supplies for IRWD, DRWD, and Rosedale
Spreadsheet Model Assumptions
The spreadsheet model calculates the water supply available to the Project as additional Article 21 available from the Delta. The CalSim II Baseline simulation include existing Article 21 demands and deliveries. The spreadsheet model simulates the additional Article 21 demand of the Project and the associated increase in SWP Delta exports. Additional Article 21 deliveries to the Project are simulated when there is:
a. Available surplus in the Delta in excess of the existing regulatory requirements and demands
b. Available export capacity at Banks Pumping Plant c. The SWP portion of San Luis Reservoir is full in the Baseline
The spreadsheet model simulates the additional Article 21 export from the Delta at times when there is available capacity in the California Aqueduct to convey the water to the Project and recharge the water based on Project recharge capacity. There is an estimated conveyance loss of 3 percent between the Delta and the Project.
Water is simulated as stored in the Project in each of the three accounts: public or ecosystem, IRWD, and Rosedale. Water stored in each account is subject to a loss percentage of 10% for Rosedale, 12.5% for ecosystem, and 15% for IRWD. These losses include an estimated 6% loss for evaporation. Project recharge rates are simulated as a function of recharge in preceding months based on information provided by IRWD (Figure 3).

6
Figure 3. Project Recharge Rate
Water is extracted from the Project to provide both public and non-public benefits. Public benefits are achieved when the volume of water stored in the public benefits or ecosystem account is adequate to provide an Ecosystem Pulse flow of sufficient magnitude to create benefits. A volume of 18 thousand acre-feet (TAF), or 300 cfs for a period of one month, was assumed in the spreadsheet model as the threshold to create ecosystem benefits. Additionally, this volume is increased by Delta carriage1 water costs that are saved in the year the Ecosystem Pulse is released. The reduced carriage water costs are a benefit of the Project, because Project water was exported during periods of Delta surplus with no carriage water cost and stored in the export service area. The spreadsheet model assumes 20 percent carriage water and the 3 percent conveyance loss can be saved when extracting water from the Project for delivery within the export service area instead of meeting those demands from Oroville Reservoir.
The spreadsheet model simulates water is extracted from the Project for water supply benefits to Rosedale and IRWD based on SWP Table A allocations, with more water extracted when Table A allocations are lower.
Available Water Supply This section presents a summary of available Article 21 water supply for the Project. Figure 4 shows a summary of available Article 21 supply by water year type (Sacramento Valley Year Type Index) at the Project based on WSIP 2030 CalSim II modeling results. This available supply
1 Carriage water is defined as marginal export costs, or the extra water needed to carry a unit of water across the Delta to the CVP and SWP pumping plants in the South Delta while maintaining a constant salinity. Or more practically, when the exports are increased by one unit, the Sacramento flow is increased by one unit plus the amount of carriage water to maintain a constant Delta salinity. In other words, carriage is the water cost of Delta exports when salinity standards are controlling.
0
0.1
0.2
0.3
0.4
0.5
0.6
0.7
0.8
0 1 2 3 4 5 6 7 8 9 10 11 12
Rech
arge
Rat
e (F
t/Da
y)
Months of Recharge

7
is calculated by considering constraints on available Banks pumping capacity, conveyance capacities in the California Aqueduct, and capacity to convey water from the California Aqueduct to the Project, and conveyance losses.
On an average annual basis, available Article 21 supply at the project diversion from the California Aqueduct is 8 TAF with most of the supply available during Wet years. There is no Article 21 supply during Dry and Critical years. Figure 5 shows a summary of Article 21 supply by month. March shows the greatest supply of Article 21 followed by February. Article 21 is mostly available between December and May, with no supply available during the reminder of the year. Figure 6 shows available supply on an annual basis. As stated earlier, most of the water supply is available during Wet years and in a few Above Normal and Below Normal years. There is no water supply for the Project during Dry and Critical years.
Figure 4. Available Article 21 Supply at Project by Sacramento Valley Water Year Type
Figure 5. Average Monthly Available Article 21 Supply at Project
17
12
5
0 0
8
0
2
4
6
8
10
12
14
16
18
20
Wet AboveNormal
BelowNormal
Dry Critical All
Artic
le 2
1 Su
pply
at P
roje
ct
(1,0
00 a
cre-
feet
/yea
r)
Sacramento Valley Water Year Type
012345678
Oct Nov Dec Jan Feb Mar Apr May Jun Jul Aug Sep
Artic
le 2
1 Su
pply
at P
roje
ct
(1,0
00 a
cre-
feet
/yea
r)
Wet Above Normal Below Normal Dry Critical All
8
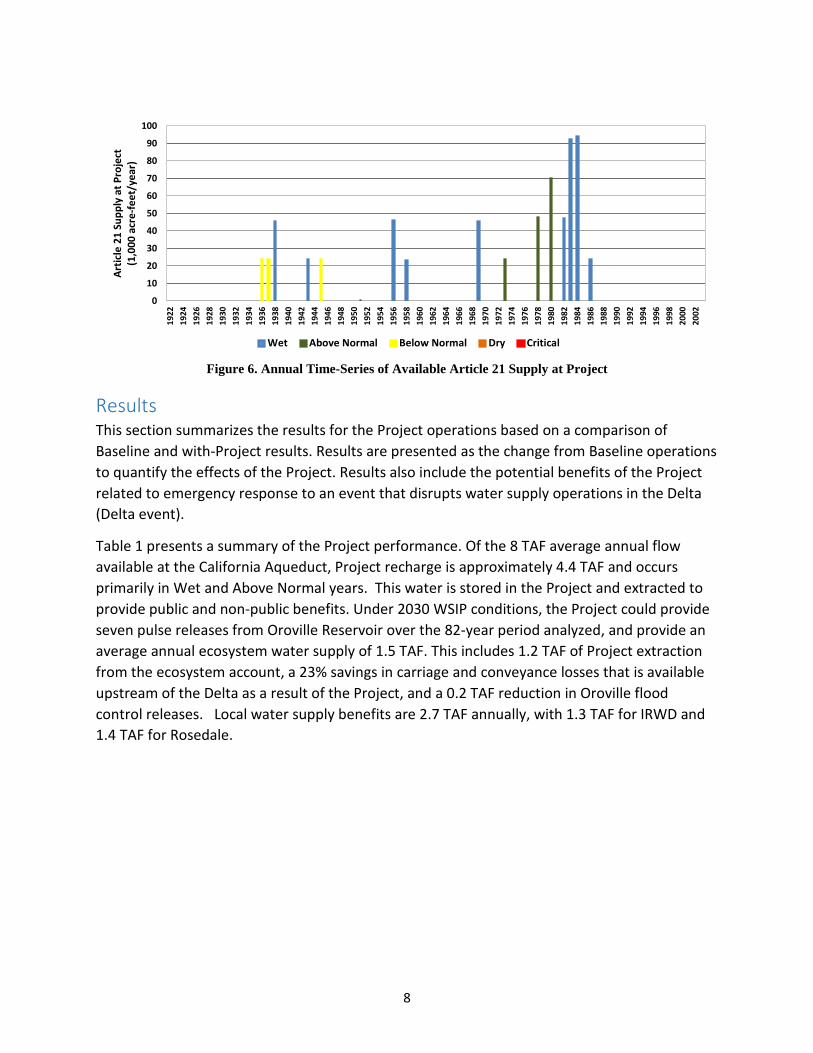
Figure 6. Annual Time-Series of Available Article 21 Supply at Project
Results This section summarizes the results for the Project operations based on a comparison of Baseline and with-Project results. Results are presented as the change from Baseline operations to quantify the effects of the Project. Results also include the potential benefits of the Project related to emergency response to an event that disrupts water supply operations in the Delta (Delta event).
Table 1 presents a summary of the Project performance. Of the 8 TAF average annual flow available at the California Aqueduct, Project recharge is approximately 4.4 TAF and occurs primarily in Wet and Above Normal years. This water is stored in the Project and extracted to provide public and non-public benefits. Under 2030 WSIP conditions, the Project could provide seven pulse releases from Oroville Reservoir over the 82-year period analyzed, and provide an average annual ecosystem water supply of 1.5 TAF. This includes 1.2 TAF of Project extraction from the ecosystem account, a 23% savings in carriage and conveyance losses that is available upstream of the Delta as a result of the Project, and a 0.2 TAF reduction in Oroville flood control releases. Local water supply benefits are 2.7 TAF annually, with 1.3 TAF for IRWD and 1.4 TAF for Rosedale.
0
10
20
30
40
50
60
70
80
90
100
1922
1924
1926
1928
1930
1932
1934
1936
1938
1940
1942
1944
1946
1948
1950
1952
1954
1956
1958
1960
1962
1964
1966
1968
1970
1972
1974
1976
1978
1980
1982
1984
1986
1988
1990
1992
1994
1996
1998
2000
2002
Artic
le 2
1 Su
pply
at P
roje
ct
(1,0
00 a
cre-
feet
/yea
r)
Wet Above Normal Below Normal Dry Critical

9
Table 1. Summary of the Project Performance
Year Type Project
Recharge (TAF)
Number of Pulses (Years)
Ecosystem Water Supply (TAF)
IRWD Water Supply (TAF)
Rosedale Water Supply (TAF)
Wet 7 0 0 0 0
Above Normal 9 0 0 1 0
Below Normal 5 0 0 1 0
Dry 0 5 5 2 4
Critical 0 2 3 4 4
All Years 4.4 7 1.5 1.3 1.4
Figure 7 shows the frequency of the Ecosystem Pulses by water year type. As noted earlier, the pulses are made during Dry and Critical years when Feather River flows are lower and pulses may create a higher potential for benefits to the ecosystem.
0
1
2
3
4
5
6
Oct Nov Dec Jan Feb Mar Apr May Jun Jul Aug Sep
Oro
ville
Pul
se R
elea
se
(1,0
00 a
cre-
feet
/Yea
r)
Sacramento Valley Water Year Type
Wet Above Normal Below Normal Dry Critical

10
Figure 8 shows an average pulse flow rate by month. In this analysis, April was selected as the month for Ecosystem Pulses. The operations could be modified to provide Ecosystem Pulses in May, under actual operations.
Figure 7. Frequency of Ecosystem Pulses
Figure 8. Pulse Release Volume
0 0 0
5
2
7
0
1
2
3
4
5
6
7
8
Wet AboveNormal
BelowNormal
Dry Critical All Years
Oro
ville
Pul
se R
elea
se F
requ
ency
Sacramento Valley Water Year Type
0
1
2
3
4
5
6
Oct Nov Dec Jan Feb Mar Apr May Jun Jul Aug Sep
Oro
ville
Pul
se R
elea
se
(1,0
00 a
cre-
feet
/Yea
r)
Sacramento Valley Water Year Type
Wet Above Normal Below Normal Dry Critical

11
Figure 9 shows changes in Oroville Reservoir releases with the Project. Flows in the Feather River are higher under the Project conditions during April when Ecosystem Pulses are made from Oroville. The release of Ecosystem Pulses results in lower Oroville storage under the Project conditions after making Ecosystem Pulse releases. Storage in Oroville would be recovered in later months by reducing releases from Oroville when Feather River flows are in excess of the minimum instream flow requirements and Oroville is releasing water to support SWP Delta exports. Oroville Reservoir is typically releasing water to support Delta exports in the July through September period. Oroville releases are reduced in this period to compensate for the Ecosystem Pulses resulting in lower Feather River flows under the Project conditions to recover the volume of the Ecosystem Pulse. Analysis in the spreadsheet model attempts to recover the Ecosystem Pulse volume in Oroville in the same year as when the pulse is made, such that Oroville carryover storage is not affected. In actual operations, it may be possible to develop an operational plan that would pre-deliver water into Oroville in other years, such that Oroville storage is increased, as compared to Baseline, prior to making the Ecosystem Pulse release.
Figure 9 also shows a reduction in Oroville Reservoir releases in February. In most years, the reduction of Oroville Reservoir release occurs in July following release of Ecosystem Pulse in April, with the exception of in 1976. In 1976, the Ecosystem Pulses are made in April and Oroville storage remains lower under the Project conditions until the next available opportunity to refill the reservoir, which comes in February of 1978, when the reservoir releases are reduced to compensate for Ecosystem Pulses released in April 1976. Thus, Oroville Reservoir releases are lower in February 1978 under the Project conditions, as compared to the Baseline. Simulated changes in Oroville release are expected to create the same change in Feather River flows below Oroville and Sacramento River flow from the confluence with the Feather into the Delta.

12
Figure 9. Change in Oroville Releases
An important consideration in evaluation of the pulse flow operation is whether Table A allocations to project participants are adequate to offset the volume of the Feather River pulse flow. The spreadsheet model ensures that pulse flows are not released when Table A allocations to project participants are not adequate to provide the needed offset in Table A deliveries. Additionally, Project extraction capacity must be available to extract water to offset Table A deliveries in years when pulse flows are released. Therefore, less water is extracted for water supply benefits to Rosedale and IRWD when Table A allocations are above the threshold for pulse flows, and more water is extracted for water supply when Table A allocations are not adequate to support a pulse flow. While the total volume of the pulse flow is 18 TAF, the volume of the pulse flow includes the avoided losses for moving Table A water from Oroville to Kern County. As described above, the spreadsheet model includes Delta carriage water losses of 20% and conveyance losses of 3%. Therefore, 23% of the pulse flow volume is avoided losses and the remaining 13,860 acre-feet is offset Table A delivery in Kern County.
Project participants have contracts for a maximum Table A volume of 41,350 acre-feet for Dudley Ridge Water District and 29,900 acre-feet for Rosedale-Rio Bravo Water Storage District, for a maximum volume at 100% Table A allocation of 71,250 acre-feet. Therefore, the minimum Table A allocation needed to offset 13,860 acre-feet is approximately 20% (13,860 of Table A offset divided by 71,250 of Table A contract). The following table shows the year of the simulated pulse flow, the final Table A allocation from the WSIP 2030 CalSim II model, and the volume of Table A water allocated to project participants.
-80
-60
-40
-20
0
20
40
60
80
100
Oct Nov Dec Jan Feb Mar Apr May Jun Jul Aug Sep
Aver
age
Chan
ge in
Oro
ville
Rel
ease
(c
fs)
Wet Above Normal Below Normal Dry Critical

13
Table 2. Pulse Flow Years and SWP Table A Supplies
Pulse Flow Year
Table A Offset
Volume (TAF)
SWP Table A Allocation
(% Contract)
Project Participant
Table A Allocation
(TAF)
1939 13.9 100% 71.3
1944 13.9 29% 20.7
1960 13.9 55% 39.3
1976 13.9 71% 50.7
1981 13.9 81% 57.4
1985 13.9 79% 56.4
1988 13.9 23% 16.6
Results in Table 2 show that project participants would be allocated more than the 13,860 acre-feet of Table A offset needed to support the associated pulse flow volume in each year.
Figure 10 shows changes in Delta outflows under the Project conditions. Delta outflows are greater during April of Dry and Critical years under the Project condition when Oroville is making Ecosystem Pulses. Ecosystem Pulses in April and May of Dry and Critical years are expected to increase Delta outflow because Delta exports are typically constrained in these months by regulatory requirements such as San Joaquin River inflow-to-export ratio or Old and Middle River flow requirements. Delta outflows can be lower in January through May of Below Normal and wetter years when Delta outflow is diminished either due to capture of Article 21 surplus water for the Project or due to a reduction in Oroville releases. Figure 11 presents a similar plot, showing change in SWP Delta exports under the Project conditions. SWP Delta exports are typically greater under Project conditions, as surplus flows are captured at the export pumps and delivered to the Project. SWP Delta exports show a reduction in Dry and Critical years as compared to the Baseline due to a reduction in Oroville releases.

14
Figure 10. Change in Delta Outflow
Figure 11. Change in SWP Delta Exports
Figure 12 shows end of October storage in the Project by water year type. On an average annual basis, Project storage is 38 TAF at the end of October. Project storage varies significantly by year type, from 54 TAF in Wet years to 11 TAF in Critical years. Higher storage in Wet years is expected, as it corresponds to periods where Article 21 water is available. Project storage during a Dry or Critical year is water carried over from previous years. Overall, Project storage is
-100-80-60-40-20
020406080
100
Oct Nov Dec Jan Feb Mar Apr May Jun Jul Aug Sep
Aver
age
Chan
ge in
Del
ta O
utflo
w
(cfs
)
Wet Above Normal Below Normal Dry Critical
-60
-40
-20
0
20
40
60
80
100
Oct Nov Dec Jan Feb Mar Apr May Jun Jul Aug Sep
Aver
age
Chan
ge in
Exp
orts
(cfs
)
Wet Above Normal Below Normal Dry Critical

15
dependent on water supply, demand, and operations. Project storage at the end of October may be an indication of potential water available as an emergency supply for IRWD, Rosedale, or for other purposes.
Figure 12. End of October Project Groundwater Storage
Emergency Response Benefits
The WSIP technical guidance document provides directions for analysis of emergency response benefits of potential Projects. WSIP technical guidance states that for an event in the Delta that disrupts water supply operations (Delta event), applicants should assume a single event that occurs 30 years into the Project operation period. Applicants must also show how the emergency response operation affects the Project’s normal operations and benefits in years following the event.
The Project can provide emergency response benefits by storing water south of the Delta that can be extracted and made available after a Delta event. The probability of water being stored in the Project in any year is one measure of potential emergency response benefit. Figure 13 shows the probability of exceedance for the end of October Project storage in the combined three accounts. A marker at approximately 23.5 TAF, corresponding to an exceedance probability of approximately 55 percent, shows the simulated Project storage 30 years into the Project operation period.
54
33
43
32
11
38
0
10
20
30
40
50
60
70
80
Wet AboveNormal
BelowNormal
Dry Critical All YearsEnd
of O
ctob
er G
roun
dwat
er S
tora
ge
(1,0
00 a
cre-
feet
)
Sacramento Valley Water Year Type

16
Figure 13. Probability of Exceedance for End of October Project Groundwater Storage
As illustrated in Figure 13, Project storage is 23.5 TAF 30 years into the Project operation period. Water in storage in each account is 8.5 TAF in the ecosystem account, 7.9 TAF in the IRWD account, and 7.2 TAF in the Rosedale account. In response to a Delta event at this time, it is assumed the entire 23.5 TAF could be available for emergency response benefits over a period of approximately six months using the Project extraction capacity of 3.8 TAF per month.
The effect of emergency response operations on the Project performance was evaluated by simulating extraction of 23.5 TAF at 30 years into the Project operation and then comparing the results for Project operations without the emergency response operations. There is a marginal reduction in water supply benefits to IRWD and Rosedale by approximately 0.1 TAF/year, but results reported in Table 1 reflect the extraction of water for emergency response.
Uncertainty Analyses This section presents uncertainty analyses related to potential future (WSIP 2070) climate change, including Project performance during critical droughts, and the California WaterFix. Uncertainty analyses were performed using the same technical approach as analysis at the future 2030 level wherein a CalSim II baseline was used to represent the without-project scenario and serve as an input to the spreadsheet model to simulate the with-project scenario. The spreadsheet model has the capability to post-process CalSim II model results for
0
20
40
60
80
100
120
0% 10% 20% 30% 40% 50% 60% 70% 80% 90% 100%
End-
of-O
ctob
er G
roun
dwat
er S
tora
ge(1
,000
acr
e-fe
et)
Probability of Exceedance
Storage 30 years into Project operations
17
simulations that include California WaterFix to determine availability of additional Article 21 for the Project.
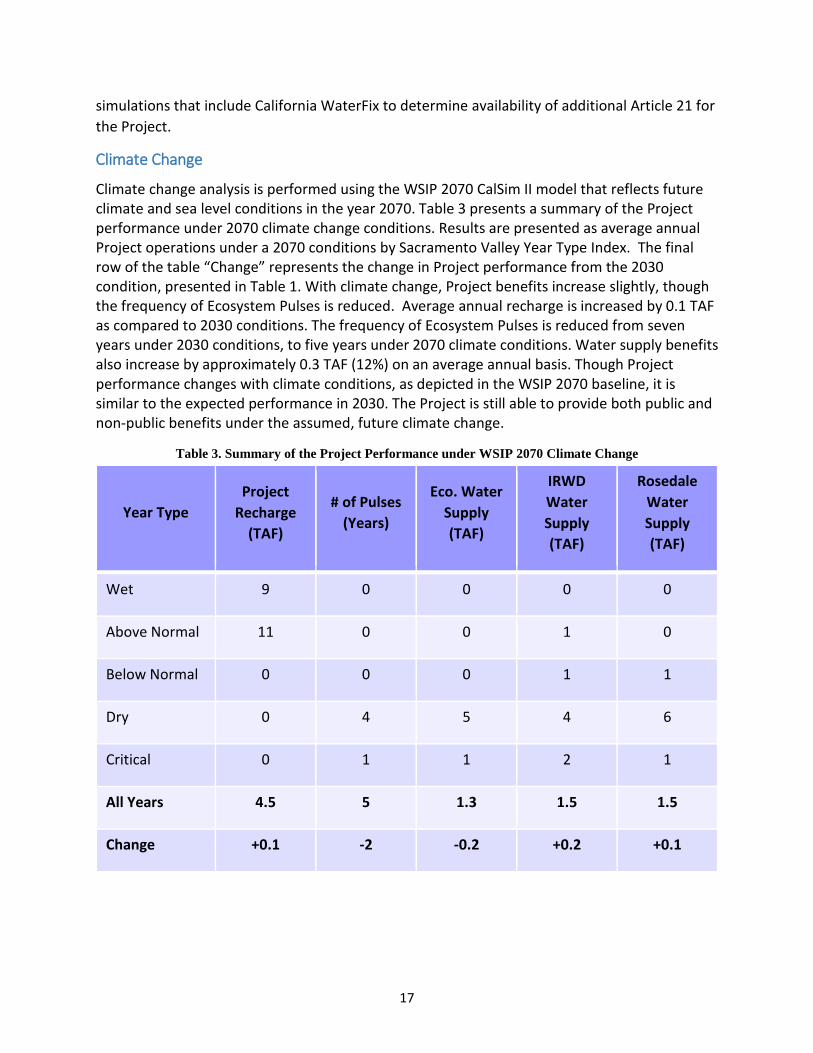
Climate Change
Climate change analysis is performed using the WSIP 2070 CalSim II model that reflects future climate and sea level conditions in the year 2070. Table 3 presents a summary of the Project performance under 2070 climate change conditions. Results are presented as average annual Project operations under a 2070 conditions by Sacramento Valley Year Type Index. The final row of the table “Change” represents the change in Project performance from the 2030 condition, presented in Table 1. With climate change, Project benefits increase slightly, though the frequency of Ecosystem Pulses is reduced. Average annual recharge is increased by 0.1 TAF as compared to 2030 conditions. The frequency of Ecosystem Pulses is reduced from seven years under 2030 conditions, to five years under 2070 climate conditions. Water supply benefits also increase by approximately 0.3 TAF (12%) on an average annual basis. Though Project performance changes with climate conditions, as depicted in the WSIP 2070 baseline, it is similar to the expected performance in 2030. The Project is still able to provide both public and non-public benefits under the assumed, future climate change.
Table 3. Summary of the Project Performance under WSIP 2070 Climate Change
Year Type Project
Recharge (TAF)
# of Pulses (Years)
Eco. Water Supply (TAF)
IRWD Water Supply (TAF)
Rosedale Water Supply (TAF)
Wet 9 0 0 0 0
Above Normal 11 0 0 1 0
Below Normal 0 0 0 1 1
Dry 0 4 5 4 6
Critical 0 1 1 2 1
All Years 4.5 5 1.3 1.5 1.5
Change +0.1 -2 -0.2 +0.2 +0.1
18
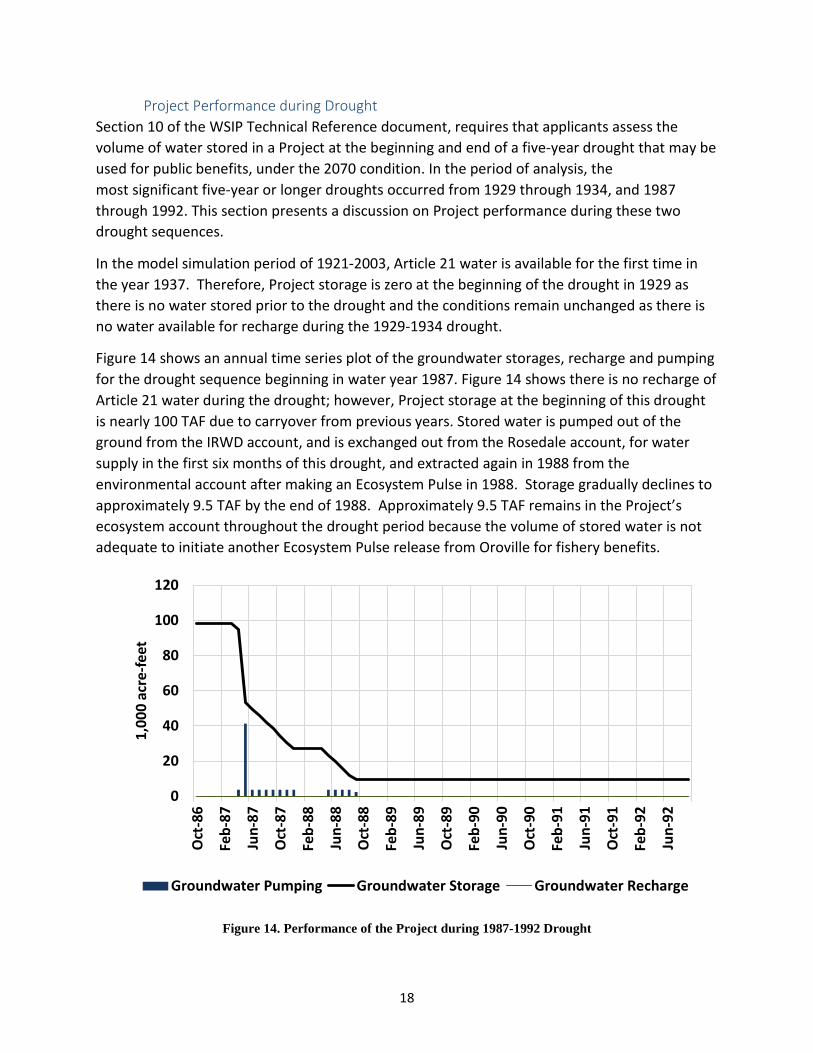
Project Performance during Drought Section 10 of the WSIP Technical Reference document, requires that applicants assess the volume of water stored in a Project at the beginning and end of a five-year drought that may be used for public benefits, under the 2070 condition. In the period of analysis, the most significant five-year or longer droughts occurred from 1929 through 1934, and 1987 through 1992. This section presents a discussion on Project performance during these two drought sequences.
In the model simulation period of 1921-2003, Article 21 water is available for the first time in the year 1937. Therefore, Project storage is zero at the beginning of the drought in 1929 as there is no water stored prior to the drought and the conditions remain unchanged as there is no water available for recharge during the 1929-1934 drought.
Figure 14 shows an annual time series plot of the groundwater storages, recharge and pumping for the drought sequence beginning in water year 1987. Figure 14 shows there is no recharge of Article 21 water during the drought; however, Project storage at the beginning of this drought is nearly 100 TAF due to carryover from previous years. Stored water is pumped out of the ground from the IRWD account, and is exchanged out from the Rosedale account, for water supply in the first six months of this drought, and extracted again in 1988 from the environmental account after making an Ecosystem Pulse in 1988. Storage gradually declines to approximately 9.5 TAF by the end of 1988. Approximately 9.5 TAF remains in the Project’s ecosystem account throughout the drought period because the volume of stored water is not adequate to initiate another Ecosystem Pulse release from Oroville for fishery benefits.
Figure 14. Performance of the Project during 1987-1992 Drought
0
20
40
60
80
100
120
Oct
-86
Feb-
87
Jun-
87
Oct
-87
Feb-
88
Jun-
88
Oct
-88
Feb-
89
Jun-
89
Oct
-89
Feb-
90
Jun-
90
Oct
-90
Feb-
91
Jun-
91
Oct
-91
Feb-
92
Jun-
92
1,00
0 ac
re-fe
et
Groundwater Pumping Groundwater Storage Groundwater Recharge

19
Figure 15 shows a comparison of recharge and pumping for the three different Project accounts for this six-year period. During this drought, there is pumping of water from the environmental account to support an Ecosystem Pulse release from Oroville in 1988. After the pulse release and pumping, approximately 9.5 TAF of stored water is available for public benefits during this drought sequence. Additionally, the Project provided an average of 12.4 TAF of water supply benefits to IRWD and Rosedale over the six-year drought.
Figure 15. Annual Summary of the Project Yield during 1987-1992 Drought
The Project provides emergency supply, public benefits for both a Delta outage emergency and prolonged drought. Table 4 is a summary of these public benefits.
Table 4: Summary of Emergency Supply Public Benefits
Emergency Public Benefit
(TAF)
Delta Outage 23.5
Drought 9.5
California WaterFix
This section summarizes results from the sensitivity analysis performed to assess Project performance with California WaterFix (CWF). For this analysis, CalSim II models developed by
0.0 0.0 0.0 0.0
2.3
6.2 6.2
14.6
0.0
2.0
4.0
6.0
8.0
10.0
12.0
14.0
16.0
Env IRWD RR Total
1,00
0 ac
re-fe
et
Recharge Pumping
20
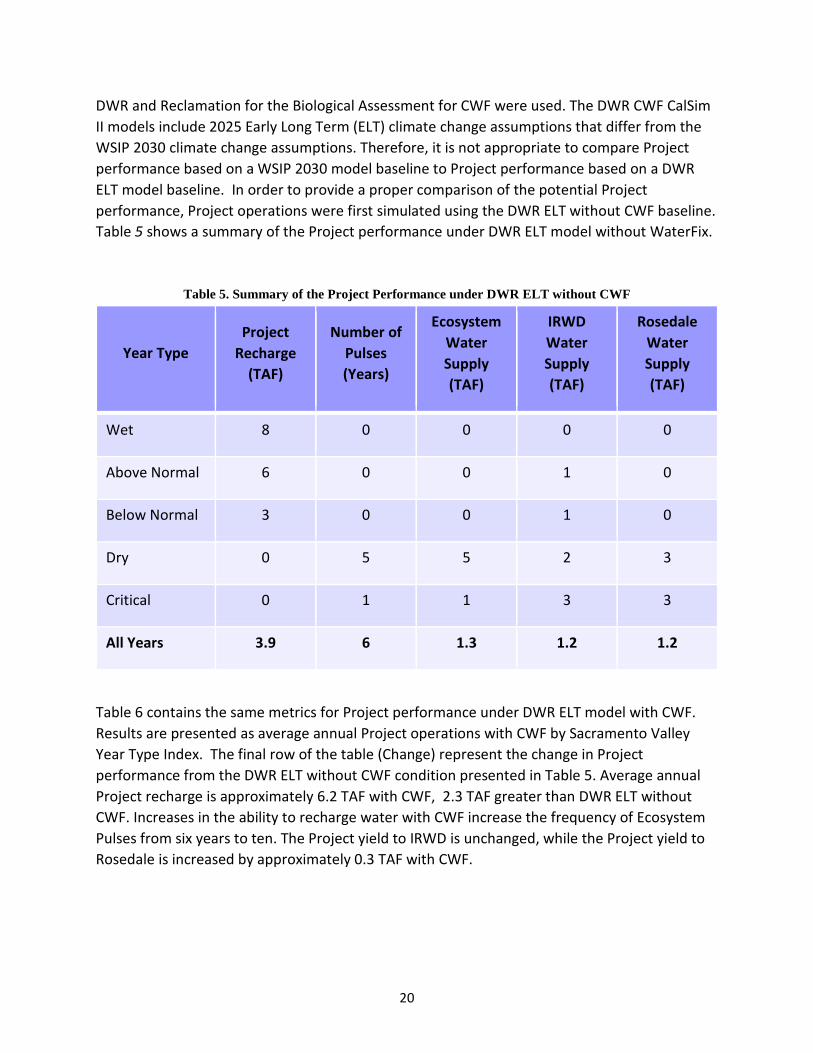
DWR and Reclamation for the Biological Assessment for CWF were used. The DWR CWF CalSim II models include 2025 Early Long Term (ELT) climate change assumptions that differ from the WSIP 2030 climate change assumptions. Therefore, it is not appropriate to compare Project performance based on a WSIP 2030 model baseline to Project performance based on a DWR ELT model baseline. In order to provide a proper comparison of the potential Project performance, Project operations were first simulated using the DWR ELT without CWF baseline. Table 5 shows a summary of the Project performance under DWR ELT model without WaterFix.
Table 5. Summary of the Project Performance under DWR ELT without CWF
Year Type Project
Recharge (TAF)
Number of Pulses (Years)
Ecosystem Water Supply (TAF)
IRWD Water Supply (TAF)
Rosedale Water Supply (TAF)
Wet 8 0 0 0 0
Above Normal 6 0 0 1 0
Below Normal 3 0 0 1 0
Dry 0 5 5 2 3
Critical 0 1 1 3 3
All Years 3.9 6 1.3 1.2 1.2
Table 6 contains the same metrics for Project performance under DWR ELT model with CWF. Results are presented as average annual Project operations with CWF by Sacramento Valley Year Type Index. The final row of the table (Change) represent the change in Project performance from the DWR ELT without CWF condition presented in Table 5. Average annual Project recharge is approximately 6.2 TAF with CWF, 2.3 TAF greater than DWR ELT without CWF. Increases in the ability to recharge water with CWF increase the frequency of Ecosystem Pulses from six years to ten. The Project yield to IRWD is unchanged, while the Project yield to Rosedale is increased by approximately 0.3 TAF with CWF.

21
Table 6. Summary of the Project Performance under DWR ELT with CWF
Year Type Project
Recharge (TAF)
Number of Pulses (Years)
Ecosystem Water Supply (TAF)
IRWD Water Supply (TAF)
Rosedale Water Supply (TAF)
Wet 12 0 0 0 0
Above Normal 10 0 0 1 0
Below Normal 6 0 0 0 0
Dry 0 8 8 2 4
Critical 0 2 3 3 4
All Years 6.2 10 2.2 1.2 1.5
Change +2.3 +4 +0.9 0.0 +0.3