appendix a gaussian beam propagationstudentsrepo.um.edu.my/3837/8/chapter_7_appendices.pdf ·...
TRANSCRIPT
204
Appendix A
Gaussian Beam Propagation
In general, the light emitted from the laser can be approximated by assuming
that the laser beam has an ideal Gaussian intensity profile, which corresponds to the
theoretical TEM00 mode. In TEM00 mode, the beam coupled from a laser begins as a
perfect plane wave with a Gaussian transverse irradiance profile as shown in Fig. B.1.
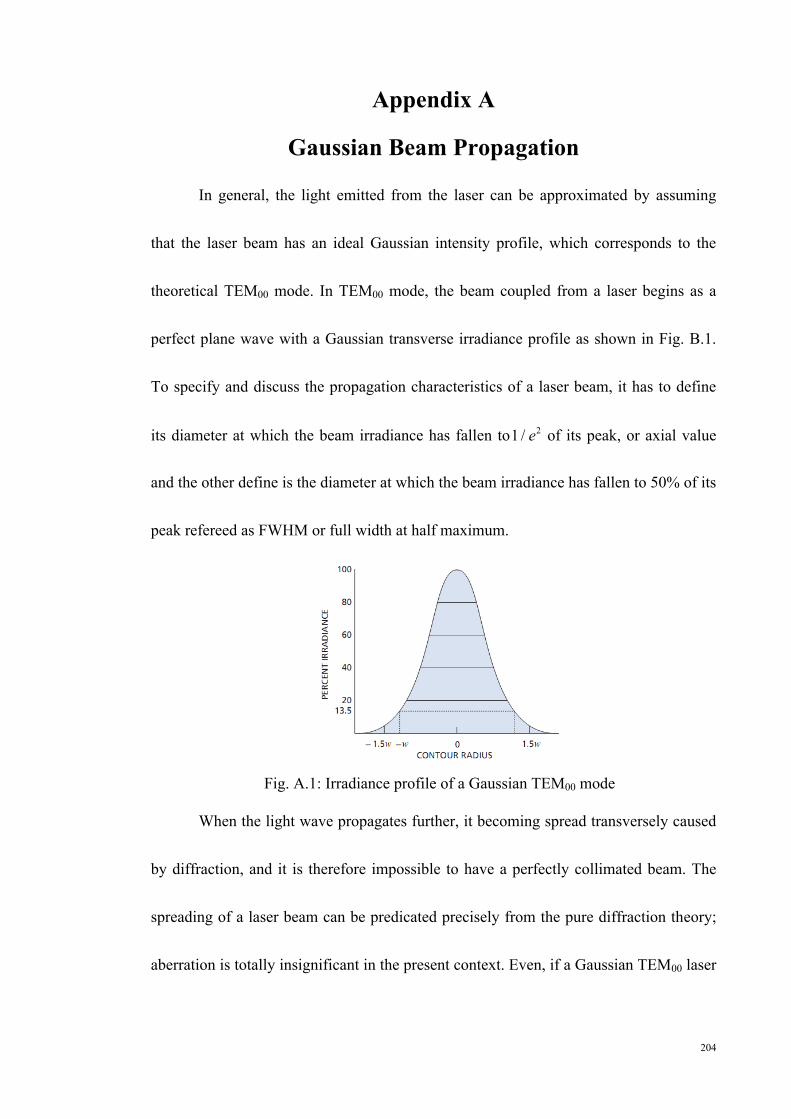
To specify and discuss the propagation characteristics of a laser beam, it has to define
its diameter at which the beam irradiance has fallen to 21 / e of its peak, or axial value
and the other define is the diameter at which the beam irradiance has fallen to 50% of its
peak refereed as FWHM or full width at half maximum.
Fig. A.1: Irradiance profile of a Gaussian TEM00 mode
When the light wave propagates further, it becoming spread transversely caused
by diffraction, and it is therefore impossible to have a perfectly collimated beam. The
spreading of a laser beam can be predicated precisely from the pure diffraction theory;
aberration is totally insignificant in the present context. Even, if a Gaussian TEM00 laser

205
beam wavefront was perfect flat at some plane; it can quickly acquire curvature and
begin spreading in accordance with
220( ) 1 wR z z
z
(A-1)
and
1/22
0 20
( ) 1 zw z ww
(A-2)
where z is the distance propagated from the plane where the wavefront is flat, is the
wavelength of light, w0 is the radius of the 21 / e irradiance contour at the plane where
the wavefront is flat, ( )w z is the radius of the 21 / e contour after the wave has
propagated a distance a, and ( )R z is the wavefront radius of curvature after propagating
a distance z. ( )R z is infinite at z=0, passes through a minimum at some finite z, and
rises again towards infinity as z is further increased, asymptotically approaching the
value of z itself. The plane z=0 marks the location of a Gaussian waist, or a place where
the wavefront is flat and w0 is called the beam waist radius.
Fig. A.2: Diameter of a Gaussian beam
The irradiance distribution of the Gaussian TEM00 beam, namely,
206
2 2 2 22 / 2 /0 2
2( ) r w r wPI r I e ew
(A-3)
where ( )w w z and P is the total power in the beam, is the same at all cross section of
the beam. Simultaneously, as ( )R z asymptotically approaches z for large z, ( )w z
asymptotically approaches the value
0
( ) zw zw
(A-4)
wherez is presumed to be much larger than 0 /w so that the 21 / e irradiance contours
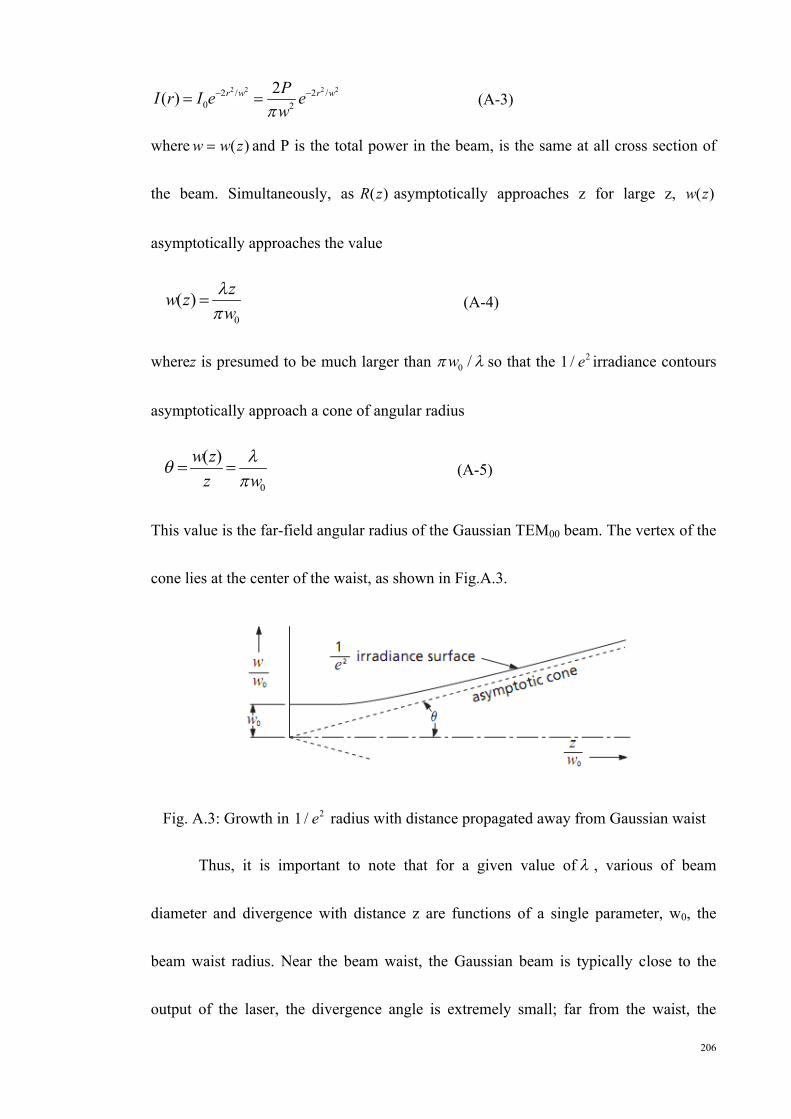
asymptotically approach a cone of angular radius
0
( )w zz w
(A-5)
This value is the far-field angular radius of the Gaussian TEM00 beam. The vertex of the
cone lies at the center of the waist, as shown in Fig.A.3.
Fig. A.3: Growth in 21 / e radius with distance propagated away from Gaussian waist
Thus, it is important to note that for a given value of , various of beam
diameter and divergence with distance z are functions of a single parameter, w0, the
beam waist radius. Near the beam waist, the Gaussian beam is typically close to the
output of the laser, the divergence angle is extremely small; far from the waist, the
207
divergence angle approaches the asymptotic limit described above. The Raleigh range
zR defined as the distance over which the beam radius spreads by a factor of 2 , is
given by, 20
Rwz
(A-6)
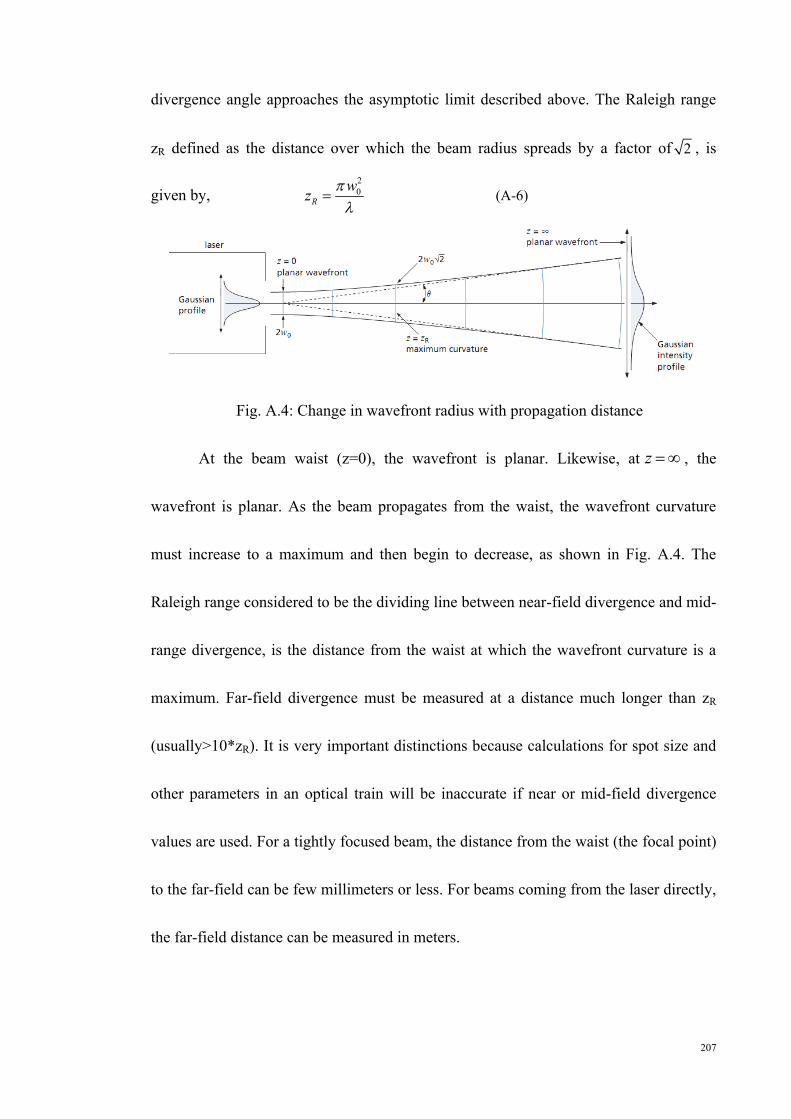
Fig. A.4: Change in wavefront radius with propagation distance
At the beam waist (z=0), the wavefront is planar. Likewise, at z , the
wavefront is planar. As the beam propagates from the waist, the wavefront curvature
must increase to a maximum and then begin to decrease, as shown in Fig. A.4. The
Raleigh range considered to be the dividing line between near-field divergence and mid-
range divergence, is the distance from the waist at which the wavefront curvature is a
maximum. Far-field divergence must be measured at a distance much longer than zR
(usually>10*zR). It is very important distinctions because calculations for spot size and
other parameters in an optical train will be inaccurate if near or mid-field divergence
values are used. For a tightly focused beam, the distance from the waist (the focal point)
to the far-field can be few millimeters or less. For beams coming from the laser directly,
the far-field distance can be measured in meters.
208
Normally, one has a fixed value for w0 and uses the expression Eq. (A-2) to
calculate the w(z) for an input value of z. However, one can also using this equation to
see how final beam radius varies with starting beams radius at a fixed distance z.
References
[1]. A. Siegman, Laser (Sausalito, CA: University Science Books, (1986).
[2]. S. A. Self, “Focusing of spherical Gaussian beams,” Appl. Opt. 22, 5, 658, (1983).
[3]. H. Sun, “thin lens equation fir a real laser beam with weak lens aperture truncation,”
Opt. eng. 37, (1998).
[4]. R. J. Freiberg, A. S. Halsted, “Propagaties of low order transverse modes in argon
ion lasers,” Appl. Opt. 8, 355-362, (1963).
[5]. M. Born, E. Wolf, “Principle of optics” Seventh edition, (Cambridge, UK, 1999)
209
Appendix B
List of Published Papers
1. H. Z. Yang, S. W. Harun and H. Ahmad, "Fiber Optic Displacement and Liquid
Refractive Index Sensors with Two Asymmetrical Inclined Fibers" Sensor and
Transducer, September, (2009), Vol.108, pp.80-88.
2. K. S. Lim, S. W. Harun, H. Z. Yang, K. Dimyati, H. Ahmad, "Analytical and
experimental studies on asymmetric bundle fiber displacement sensors" J. of
Modern Optics, October (2009), Vol. 56, pp.1838-1842.
3. S. W. Harun, H. Z. Yang, M. Yasin, H. Ahmad, “Theoretical and experimental
study on the fiber optic displacement sensor with two receiving fibers" Microwave
and Optic technology Letters, Vol.52, pp.373-375, (2009).
4. H. Z. Yang, S. W. Harun, H. Ahmad, “Displacement sensing with two asymmetrical
inclined fibers”, Microwave and Optical Technology Letters, Vol. 52 Issue
6, pp. 1271 – 1274, (2010).
5. H. Z. Yang, K. S. Lim, S. W. Harun, H. Ahmad, “Enhanced bundle fiber
displacement sensor based on concave mirror” Sensors and Actuators A, 162, 8-12,
(2010).
6. S. W. Harun, M. Yasin, H. Z. Yang, Kusminarto, Karyono and H. Ahmad,
“Estimation of Metal Surface Roughness Using Fiber Optic Displacement Sensor”
210
Laser Physics, Vol. 20, pp.1-6, (2010).
7. S.W. Harun, H.Z. Yang, H. Ahmad, "Theoretical and experimental studies on liquid
refractive index sensor based on bundle fiber", Sensor Review, Vol. 31 Iss: 2,
pp.173 – 177, (2011).
8. H.Z. Yang, S.W. Harun, H. Ahmad, "Theoretical and experimental studies on
concave mirror-based fiber optic displacement sensor", Sensor Review, Vol. 31 Iss:
1, pp.65 – 69, (2011).
9. M. Yasin, S.W. Harun, H.Z. Yang, H. Ahma, “Fiber optic displacement sensor for
measurement of glucose concentration in distilled water,” Optoelectronics and
Advanced Materials-Rapid Comm. Vol. 4, Issue 8, (2010).
10. Yang, H. Z., Harun, S. W., Arof, H. and Ahmad, H., “Environment-independent liquid level
sensing based on fiber-optic displacement sensors”. Microwave and Optical Technology
Letters, 53: 2451–2453, (2011).
E
Ha
b
a
ARRAA
KFCF
1
fetiicwbTdedHbph
birtbt
M
0d
Sensors and Actuators A 162 (2010) 8–12
Contents lists available at ScienceDirect
Sensors and Actuators A: Physical
journa l homepage: www.e lsev ier .com/ locate /sna
nhanced bundle fiber displacement sensor based on concave mirror
.Z. Yanga, K.S. Lima, S.W. Haruna,b,∗, K. Dimyatib, H. Ahmada
Photonics Research Center, University of Malaya, 50603 Kuala Lumpur, MalaysiaDepartment of Electrical Engineering, University of Malaya, 50603 Kuala Lumpur, Malaysia
r t i c l e i n f o
rticle history:eceived 21 February 2010
a b s t r a c t
Fiber optic displacement sensor (FODS) is proposed using a concave mirror for enhanced flexibility insensitivity selection and linear range. The effect of focal length and diameter of the concave mirror on the
eceived in revised form 18 May 2010ccepted 18 May 2010vailable online 15 June 2010
eywords:iber optics displacement sensors
displacement response is investigated. The experimental and theoretical results show that the seconddip of the displacement response is located at distance equivalent to twice of focal length. For the thirdslopes and above, the sensitivity and the linear range of the sensor are strongly dependent on the focallength and diameter of the mirror. A good agreement between the theory and experimental results areshown. The measurement range as far as 26 mm can be achieved by using a 12 mm focal length concave
oncave mirroriber optic sensors
mirror.
. Introduction
Fiber optic displacement sensors (FODSs) are widely employedor the measurement of strain, pressure, vibration, temperature,tc., primarily due to their compactness, light weight, high sensi-ivity and immunity to a hostile environment. They can be classifiednto intensity-based and interferometry-based sensors [1,2]. Fornterferometry-based FODS, two optical waves with different opti-al paths are combined to generate interference fringes; one opticalave, the measurement wave is modulated by the displacement to
e measured and the other optical wave, the reference wave, is not.he change in the displacement, therefore, alters the optical pathifference between two waves resulting in a shift in the interfer-nce fringe pattern. As a result, the displacement change can beeduced from the measured fringe shift with ultra-high precision.owever, this technique requires complicated instruments and isandwidth limited. In comparison, an intensity-based FODS is sim-le to construct, uses less expensive components, and can have veryigh bandwidth [3].
Optical bundle fiber is typically used as a probe for intensity-ased FODS. The amount of the light collected by the bundle fiber
s directly correlated to the displacement between the fiber and the
eflective surface. The geometry structure of the bundle fiber affectshe transfer function and sensitivity of the FODS. The relationshipetween the blind region and peak position of the transfer functiono the inclination angle and gap spacing between the transmit-∗ Corresponding author at: Department of Electrical Engineering, University ofalaya, 50603 Kuala Lumpur, Malaysia.
E-mail address: [email protected] (S.W. Harun).
924-4247/$ – see front matter © 2010 Elsevier B.V. All rights reserved.oi:10.1016/j.sna.2010.05.029
© 2010 Elsevier B.V. All rights reserved.
ting core and receiving core have been intensively investigated andreported in many literatures [4,5]. On the other hand, some studieshave shown that the type of reflective mirror in the configurationmay have a crucial influence to the performance of the sensor. In theperformance comparison between reflective mirrors with metallicand non-metallic surface, the metallic surface mirror has exhib-ited a greater sensitivity due to its spectacular reflection [6]. In thispaper, a new intensity-based FODS is proposed and demonstratedusing a bundle fiber as a probe and a concave reflective mirror as atarget. A simulation model is presented and verified by an exper-imental measurement. The effect of focal length and diameter ofthe concave mirror on the performance of the FODS is also inves-tigated. The proposed sensor has a longer dynamic range, which isvery important in many applications such as in the meso-roboticsfield to undertake nano-positioning task on a wide stroke [7].
2. Theoretical simulation
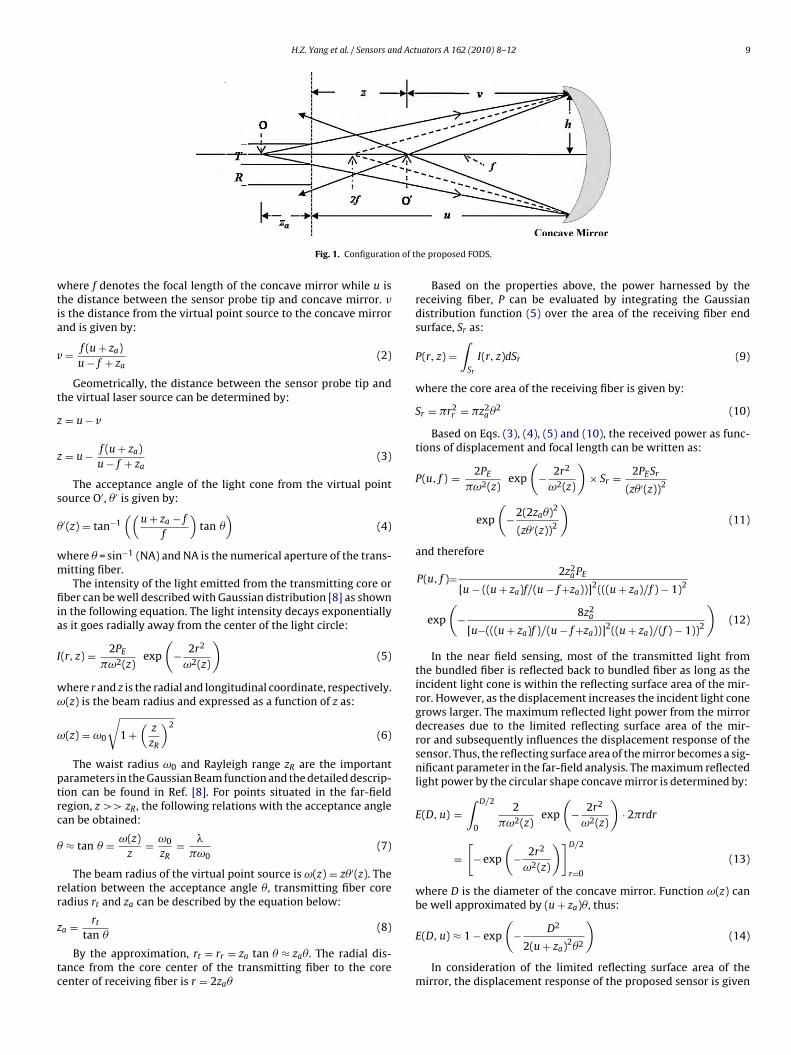
The configuration of the proposed FODS which consists of a pairtype bundle fiber and a concave mirror is shown in Fig. 1. As shownin the figure, the longitudinal axis of the transmitting fiber core isco-axis with the normal axis of concave mirror. The original lasersource emitting point O is situated in the transmitting fiber andat a distance of za from the fiber surface end. After the reflectionin the concave mirror, the reflected laser source is concentratedat point O′ and virtually becomes another emitting point source.
Based on the spherical mirror equation, some important relationsare determined as follows:1u + za
+ 1v
= 1f
(1)
H.Z. Yang et al. / Sensors and Actuators A 162 (2010) 8–12 9
n of t
wtia
v
t
z
z
s
�
wm
fiia
I
wω
ω
ptrc
�
rr
z
tc
Fig. 1. Configuratio
here f denotes the focal length of the concave mirror while u ishe distance between the sensor probe tip and concave mirror. �s the distance from the virtual point source to the concave mirrornd is given by:
= f (u + za)u − f + za
(2)
Geometrically, the distance between the sensor probe tip andhe virtual laser source can be determined by:
= u − v
= u − f (u + za)u − f + za
(3)
The acceptance angle of the light cone from the virtual pointource O′, �′ is given by:
′(z) = tan−1((
u + za − f
f
)tan �
)(4)
here � = sin−1 (NA) and NA is the numerical aperture of the trans-itting fiber.The intensity of the light emitted from the transmitting core or
ber can be well described with Gaussian distribution [8] as shownn the following equation. The light intensity decays exponentiallys it goes radially away from the center of the light circle:
(r, z) = 2PE
�ω2(z)exp
(− 2r2
ω2(z)
)(5)
here r and z is the radial and longitudinal coordinate, respectively.(z) is the beam radius and expressed as a function of z as:
(z) = ω0
√1 +
(z
zR
)2(6)
The waist radius ω0 and Rayleigh range zR are the importantarameters in the Gaussian Beam function and the detailed descrip-ion can be found in Ref. [8]. For points situated in the far-fieldegion, z >> zR, the following relations with the acceptance anglean be obtained:
≈ tan � = ω(z)z
= ω0
zR= �
�ω0(7)
The beam radius of the virtual point source is ω(z) = z�′(z). Theelation between the acceptance angle �, transmitting fiber coreadius rt and za can be described by the equation below:
a = rt
tan �(8)
By the approximation, rt = rr = za tan � ≈ za�. The radial dis-ance from the core center of the transmitting fiber to the coreenter of receiving fiber is r = 2za�
he proposed FODS.
Based on the properties above, the power harnessed by thereceiving fiber, P can be evaluated by integrating the Gaussiandistribution function (5) over the area of the receiving fiber endsurface, Sr as:
P(r, z) =∫
Sr
I(r, z)dSr (9)
where the core area of the receiving fiber is given by:
Sr = �r2r = �z2
a �2 (10)
Based on Eqs. (3), (4), (5) and (10), the received power as func-tions of displacement and focal length can be written as:
P(u, f ) = 2PE
�ω2(z)exp
(− 2r2
ω2(z)
)× Sr = 2PESr
(z�′(z))2
exp
(−2(2za�)2
(z�′(z))2
)(11)
and therefore
P(u, f )= 2z2a PE
[u − ((u + za)f/(u − f +za))]2(((u + za)/f ) − 1)2
exp
(− 8z2
a
[u−(((u + za)f )/(u − f +za))]2((u + za)/(f ) − 1))2
)(12)
In the near field sensing, most of the transmitted light fromthe bundled fiber is reflected back to bundled fiber as long as theincident light cone is within the reflecting surface area of the mir-ror. However, as the displacement increases the incident light conegrows larger. The maximum reflected light power from the mirrordecreases due to the limited reflecting surface area of the mir-ror and subsequently influences the displacement response of thesensor. Thus, the reflecting surface area of the mirror becomes a sig-nificant parameter in the far-field analysis. The maximum reflectedlight power by the circular shape concave mirror is determined by:
E(D, u) =∫ D/2
0
2�ω2(z)
exp
(− 2r2
ω2(z)
)· 2�rdr
=[− exp
(− 2r2
ω2(z)
)]D/2
r=0
(13)
where D is the diameter of the concave mirror. Function ω(z) canbe well approximated by (u + za)�, thus:( )
E(D, u) ≈ 1 − exp − D22(u + za)2�2(14)
In consideration of the limited reflecting surface area of themirror, the displacement response of the proposed sensor is given

10 H.Z. Yang et al. / Sensors and Actuators A 162 (2010) 8–12
placement sensor with a concave mirror as the object.
b
P
wl
3
pisatrvafioaccDwpiobioucisa
4
ltidm
response of the proposed sensor shares the similar characteristicwith the flat mirror FODS. As the sensor probe displaces further,the displacement response of the concave mirror FODS deviatesfrom the displacement response of flat mirror FODS. Interestingly,
Fig. 2. Experimental set-up for the fiber optic dis
y:
rm(u) = P(u, f ) × E(D, u) (15)
hich is governed by two important parameters, namely focalength f and the diameter of the circular concave mirror D.
. Simulation and experiment
The theoretical model of the sensor is simulated using a MATLABrogram. The theoretical results are then compared with the exper-
mental one. Fig. 2 shows the experimental set-up used to test theensor. The light from a He–Ne laser (� = 594 nm) is coupled intotransmitting core and is emitted at the end of the bundle fiber
o the concave mirror. The reflected light is then collected by theeceiving core and transmitted to the silicon detector. The laser pro-ides an average output power 3.0 mW, beam diameter 0.75 mmnd beam divergence 0.92 mRads. The multimode plastic bundleber consists of two cores with a length of 2 m and core radiusf 0.25 mm. The external chopper is used to modulate the laser atfrequency of 200 Hz before it is launched into the transmitting
ore. The concave mirror is fixed in a translation stage, which isontrolled by a NewFocus Picomotor to multi-axial displacement.isplacement measurement is implemented in the y-axis directionhile the other two axis’s provide accurate alignment of the fiberrobe and ensure that the longitudinal axis of the transmitting fiber
s co-axis with the normal axis which is also located at the centerf the concave mirror. Silicon detector measures the received lighty the receiving fiber and converts it into electrical signal which
s then denoised using the lock-in amplifier. The concave mirrorsf four different focal lengths, 6 mm, 8 mm, 10 mm and 12 mm aresed in this experiment and theoretical analysis. The effect of con-ave mirror diameter which represents the mirror aperture areas also investigated. Four different diameter values are used in theimulation and experiment; 12 mm, 16 mm, 20 mm and 24 mm forfixed focal length of 10 mm.
. Results and discussions
The basic principle of flat mirror based FODS can be found in the
iterature [4] and the essence of the following discussion focuses onhe basic principle of concave mirror based FODS and its character-stic comparison with flat mirror FODS. Fig. 3 depicts two differentisplacement responses of FODS based on flat mirror and concaveirror. Due to two distinctive optical properties of the two mirrors,Fig. 3. The experimental results for displacement responses of flat mirror and con-cave mirror with 2f = 12 mm.
two different characteristic curves are observed in the experiments.In the near displacement sensing range (0–4 mm), the displacement
Fig. 4. Displacement of sensor probe against distance of virtual point source.
H.Z. Yang et al. / Sensors and Actuators A 162 (2010) 8–12 11
F (b) 8 m
twb
tmdIctt
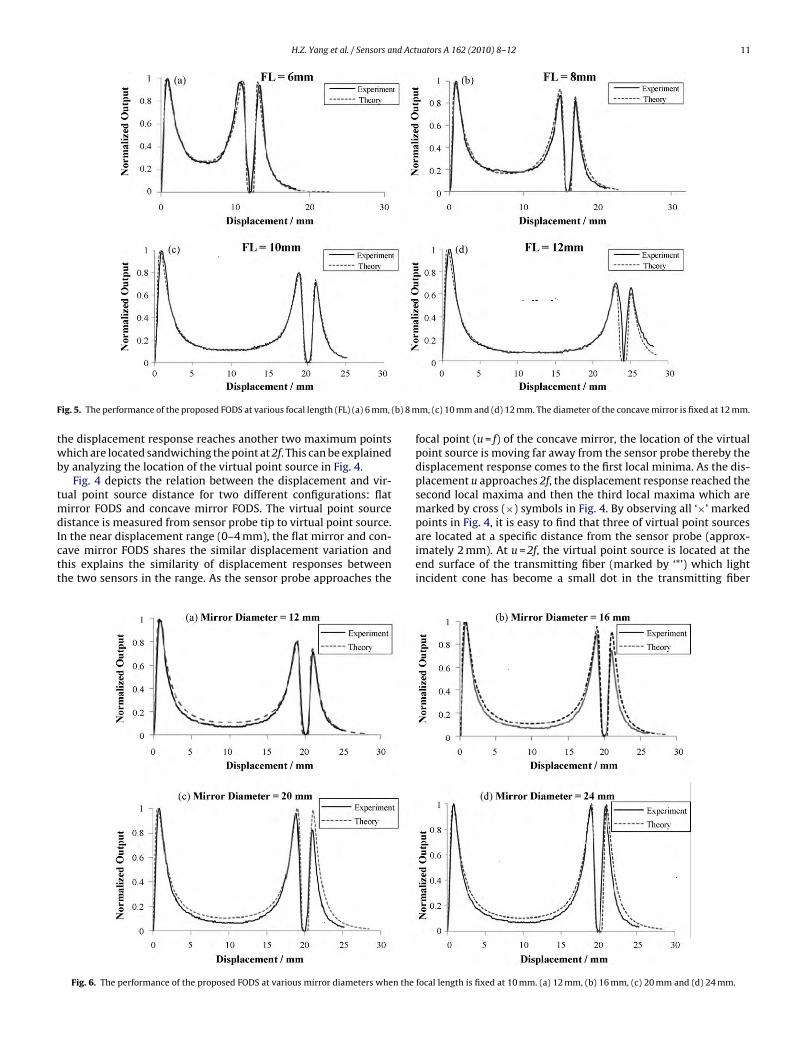
ig. 5. The performance of the proposed FODS at various focal length (FL) (a) 6 mm,
he displacement response reaches another two maximum pointshich are located sandwiching the point at 2f. This can be explained
y analyzing the location of the virtual point source in Fig. 4.Fig. 4 depicts the relation between the displacement and vir-
ual point source distance for two different configurations: flatirror FODS and concave mirror FODS. The virtual point source
istance is measured from sensor probe tip to virtual point source.
n the near displacement range (0–4 mm), the flat mirror and con-ave mirror FODS shares the similar displacement variation andhis explains the similarity of displacement responses betweenhe two sensors in the range. As the sensor probe approaches theFig. 6. The performance of the proposed FODS at various mirror diameters when the
m, (c) 10 mm and (d) 12 mm. The diameter of the concave mirror is fixed at 12 mm.
focal point (u = f) of the concave mirror, the location of the virtualpoint source is moving far away from the sensor probe thereby thedisplacement response comes to the first local minima. As the dis-placement u approaches 2f, the displacement response reached thesecond local maxima and then the third local maxima which aremarked by cross (×) symbols in Fig. 4. By observing all ‘×’ markedpoints in Fig. 4, it is easy to find that three of virtual point sources
are located at a specific distance from the sensor probe (approx-imately 2 mm). At u = 2f, the virtual point source is located at theend surface of the transmitting fiber (marked by ‘*’) which lightincident cone has become a small dot in the transmitting fiberfocal length is fixed at 10 mm. (a) 12 mm, (b) 16 mm, (c) 20 mm and (d) 24 mm.

1 d Act
cfi
rtiafurtadmftcii
trtpttrbtrdssfl
5
AogtmTs
[
[
[
[
[
[
[
[
2 H.Z. Yang et al. / Sensors an
ore center and no light power can be collected by the receivingber.
Fig. 5 compares the theoretical and experimental displacementesponses at various diameters of the concave mirror. As shown inhe figure, the experimental curve is well agreed with the theoret-cal curve. There are six linear slopes in the displacement responsend four of them are located in the vicinity of u = 2f which is aunction of the concave mirror focal length as depicted in the fig-re. This property enables flexible sensing based on displacementange of interest by properly choosing the desired focal length. Inhe observation, it is found that the received powers at secondnd third peaks of the displacement response decrease over theisplacement as predicted in Eq. (14). As shown in Fig. 5(d), theeasurement range as far as 26 mm is achieved by using a 12 mm
ocal length concave mirror. As the target is not flat, some por-ions of the experimental curves do not match with the theoreticalurve as shown in Fig. 5. This is attributed to the probe end whichs not exactly aligned to the concave center during experimentalmplementation.
Fig. 6(a)–(d) illustrates the influence of the mirror diame-er (representation of mirror aperture area) to the displacementesponse of the proposed FODS. The larger is the mirror diameter,he nearer is the power of the second and third peaks to normalizedower of 1. As shown in the figure, the first and second slopes ofhe FODS are not influenced by the mirror diameter. However, thehird and the following slopes are strongly influenced by the mir-or diameter. For instance, the linear range of the third slope cane improved by reducing the diameter. These results show thathe proposed FODS offers a flexible sensing based on displacementange of interest by properly choosing the desired focal length andiameter of the mirror. In addition, the design for the proposedensor is not restricted by the trade-off between linear range andensitivity which is often encountered in the design of conventionalat mirror based FODS.
. Conclusion
A concave mirror based FODS is proposed and demonstrated.mathematical model is developed based on spherical properties
f the concave mirror and the simulated results are found to be in
ood agreement with the experimental results. The study indicateshat the focal length and the reflective aperture area of the mirrorake significant influence to the displacement response curves.he displacement response curve has six slopes with the first twolopes show a similar characteristic with the conventional flat mir-
uators A 162 (2010) 8–12
ror based FODS. The other four slopes are located in the surroundingof u = 2f which indicates the feasibility of selecting linear range ofinterest based on the concave mirror focal length and diameter.The measurement range as far as 26 mm can be achieved by usinga 12 mm focal length concave mirror.
References
1] P.K. Rastogi, Optical Measurement Techniques and Applications, Artech House,Inc., Boston, London, 1997.
2] D.W. Kim, Y. Zhang, K.L. Cooper, A. Wang, In-fiber reflection mode interferom-eter based on a long-period grating for external refractive-index measurement,Applied Optics 44 (26) (2005) 5368–5373.
3] P.B. Buchade, A.D. Shaligram, Simulation and experimental studies of inclinedtwo fiber displacement sensor, Sensor and Actuators A 128 (2006) 312–316.
4] S.W. Harun, H.Z. Yang, M. Yasin, H. Ahmad, Theoretical and experimental studyon the fiber optic displacement sensor with two receiving fibers, Microwave andOptic Technology Letters 52 (2009) 373–375.
5] H.Z. Yang, S.W. Harun, H. Ahmad, Fiber optic displacement and liquid refractiveindex sensors with two asymmetrical inclined fibers, Sensor and Transducer 108(2009) 80–88.
6] K.S. Lim, S.W. Harun, H.Z. Yang, K. Dimyati, H. Ahmad, Analytical and experimen-tal studies on asymmetric bundle fiber displacement sensors, Journal of ModernOptics 56 (2009) 1838–1842.
7] C. Prelle, F. Lamarque, P. Revel, Reflective optical sensor for long-range and highresolution displacements, Sensor and Actuators A 127 (2006) 139–146.
8] H.M. Cao, Y.P. Chen, Z.D. Zhou, G. Zhang, Theoretical and experimental studyon the optical fiber bundle displacement sensors, Sensor and Actuators A 136(2007) 580–587.
Biographies
Yang Hang Zhou was born in Xi’an City, China, on September 22, 1981. He receivedthe B.S. degree in telecommunication engineering from Air Force Engineering Uni-versity, China in 2005, and the M.Eng in telecommunication engineering fromUniversity of Malaya, Malaysia in 2009. He is currently working towards the Ph.D.degree at University of Malaya. His current research interest is in fiber optic sensor.
Lim Kok Sing obtained his B.Eng degree from University of Malaya in 2008. Cur-rently, he is pursuing his Ph.D. in fiber optic technology at Physics Department,University of Malaya, Malaysia.
Sulaiman Wadi Harun received the B.E. degree in electrical and electronics systemengineering from Nagaoka University of Technology, Japan in 1996, and M.Sc. andPh.D. degrees in physics from University of Malaya in 2001 and 2004, respectively.Currently, he is an associate professor at the Faculty of Engineering, University ofMalaya. His research interests include fiber optic active and passive devices.
Kaharudin Dimyati obtained his Ph.D. from the University of Wales Swansea (U.K.)
in 1996. He is a professor in Department of Electrical Engineering, University ofMalaya.Harith Ahmad received the Ph.D. degree in laser technology from the Universityof Wales Swansea (U.K.) in 1983. He is a professor at the Department of Physics,University of Malaya. He is also a fellow member of Malaysian Academic of Science.

PLEASE SCROLL DOWN FOR ARTICLE
This article was downloaded by: [Hong Kong University of Science & Tech]On: 4 January 2011Access details: Access Details: [subscription number 907916909]Publisher Taylor & FrancisInforma Ltd Registered in England and Wales Registered Number: 1072954 Registered office: Mortimer House, 37-41 Mortimer Street, London W1T 3JH, UK
Journal of Modern OpticsPublication details, including instructions for authors and subscription information:http://www.informaworld.com/smpp/title~content=t713191304
Analytical and experimental studies on asymmetric bundle fiberdisplacement sensorsK. S. Lima; S. W. Harunab; H. Z. Yanga; K. Dimyatib; H. Ahmada
a Department of Physics, Faculty of Science, University of Malaya, Kuala Lumpur, Malaysia b
Department of Electrical Engineering, Faculty of Engineering, University of Malaya, Kuala Lumpur,Malaysia
First published on: 26 October 2009
To cite this Article Lim, K. S. , Harun, S. W. , Yang, H. Z. , Dimyati, K. and Ahmad, H.(2009) 'Analytical and experimentalstudies on asymmetric bundle fiber displacement sensors', Journal of Modern Optics, 56: 17, 1838 — 1842, First publishedon: 26 October 2009 (iFirst)To link to this Article: DOI: 10.1080/09500340903366009URL: http://dx.doi.org/10.1080/09500340903366009
Full terms and conditions of use: http://www.informaworld.com/terms-and-conditions-of-access.pdf
This article may be used for research, teaching and private study purposes. Any substantial orsystematic reproduction, re-distribution, re-selling, loan or sub-licensing, systematic supply ordistribution in any form to anyone is expressly forbidden.
The publisher does not give any warranty express or implied or make any representation that the contentswill be complete or accurate or up to date. The accuracy of any instructions, formulae and drug dosesshould be independently verified with primary sources. The publisher shall not be liable for any loss,actions, claims, proceedings, demand or costs or damages whatsoever or howsoever caused arising directlyor indirectly in connection with or arising out of the use of this material.
Journal of Modern OpticsVol. 56, No. 17, 10 October 2009, 1838–1842
Analytical and experimental studies on asymmetric bundle fiber displacement sensors
K.S. Lima, S.W. Haruna,b*, H.Z. Yanga, K. Dimyatib and H. Ahmada
aDepartment of Physics, Faculty of Science, University of Malaya, Lembah Pantai 50603,Kuala Lumpur, Malaysia; bDepartment of Electrical Engineering, Faculty of Engineering,
University of Malaya, Lembah Pantai 50603, Kuala Lumpur, Malaysia
(Received 30 June 2009; final version received 24 September 2009)
A fiber-optic displacement sensor (FODS) is theoretically and experimentally studied using an asymmetricalbundled fiber. The bundled fiber consists of two parallel fibers with different core radial ratios (CRRs) to achievedifferent sensitivity and dynamic range for displacement measurements. Both analytical modeling andexperimental observations show that the linear range and sensitivity can be adjusted by controlling the CRRbetween transmitting and receiving fibers. This increases the flexibility of the sensor, which can be used for precisenon-contact sensing applications.
Keywords: fiber-optic displacement sensor; bundled multimode fiber; asymmetric bundle fiber sensor
1. Introduction
Multimode plastic fiber plays an important role for the
transmission and processing of the optical signal in
communication and sensor applications. This fiber has
a large core size with a relatively high numerical
aperture, which is suitable for the signal coupling and
receiving of reflected light from a target in sensor
applications [1,2]. Based on the merits mentioned,
multimode plastic fiber is found to be perfectly suited
for optical displacement sensing applications. For this
application, a two-fiber probe is normally used in
conjunction with an intensity modulation technique.
This type of sensor provides a promising solution for
displacement measurement in terms of a wide dynamic
range, with high potential for ultra-precise non-contact
sensing. It also provides flexibility for incorporating
the optical sensors permanently into composite struc-
tures for monitoring purposes [3].In most of the fiber-optical displacement sensors
[4–12], the radii of the transmitting and receiving fibers
are often made the same for the convenience of
analytical study and experiments. However, there is a
lack of research work on displacement sensors using
bundled fibers with different core radii. In this paper, a
mathematical model of a displacement sensor using
asymmetrical bundled fibers is developed. Some
simulations were carried out based on the mathemat-
ical model and experimental results were also obtained
to validate the MATLAB simulated results. The effects
of different core radial ratios (CRRs) on the dynamic
range, sensitivity and illumination area of bundledfibers are analyzed and discussed.
2. Modeling of the asymmetric bundle fiber
displacement sensor
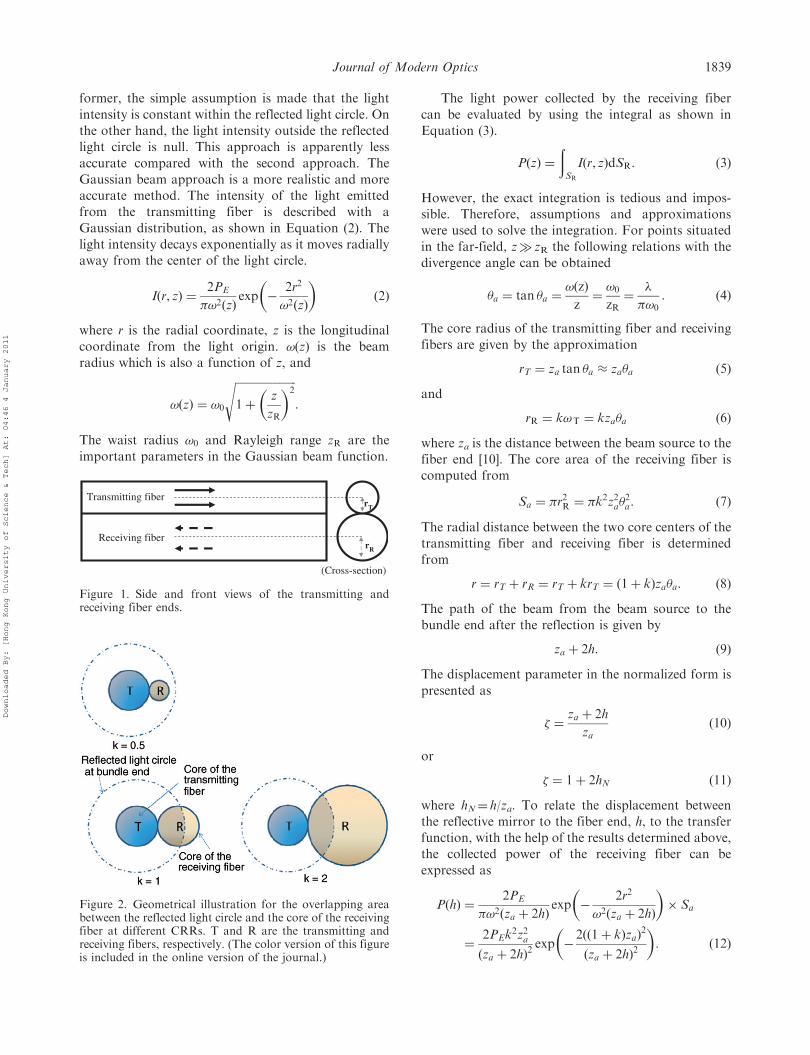
The proposed fiber-optic displacement sensor (FODS)consists of transmitting and receiving fibers as well as areflecting mirror. Both fibers are of different coreradius and are bundled together in parallel, as shownin Figure 1. Let rT and rR denote the core radius of thetransmitting fiber and the core radius of the receivingfiber. The core radial ratio, CRR is the ratio of thetransmitting fiber core radius and the receiving fibercore radius, as given below:
CRR, k ¼rRrT: ð1Þ
Figure 2 shows the geometric illustration of theoverlapping area between the reflected light circle andthe core of the receiving fiber at different CRRs. Basedon this figure, with the same core radius of thetransmitting fiber; the reflected light power collectedby the receiving fiber increases with the increasing coreradius of the receiving fiber. The larger the receivingfiber core radius and core area, the larger fraction ofreflected light can be collected by the receiving fiber. Ina previous report [10], two major approaches wereintroduced for theoretical analysis, namely the geo-metrical and Gaussian beam approaches. For the
*Corresponding author. Email: [email protected]
ISSN 0950–0340 print/ISSN 1362–3044 online
� 2009 Taylor & Francis
DOI: 10.1080/09500340903366009
http://www.informaworld.com
Downloaded By: [Hong Kong University of Science & Tech] At: 04:46 4 January 2011
former, the simple assumption is made that the light
intensity is constant within the reflected light circle. On
the other hand, the light intensity outside the reflected
light circle is null. This approach is apparently less
accurate compared with the second approach. The
Gaussian beam approach is a more realistic and more
accurate method. The intensity of the light emitted
from the transmitting fiber is described with a
Gaussian distribution, as shown in Equation (2). The
light intensity decays exponentially as it moves radially
away from the center of the light circle.
Iðr, zÞ ¼2PE
�!2ðzÞexp �
2r2
!2ðzÞ
� �ð2Þ
where r is the radial coordinate, z is the longitudinal
coordinate from the light origin. !ðzÞ is the beam
radius which is also a function of z, and
!ðzÞ ¼ !0
ffiffiffiffiffiffiffiffiffiffiffiffiffiffiffiffiffiffiffiffiffiffi1þ
z
zR
� �2s
:
The waist radius !0 and Rayleigh range zR are the
important parameters in the Gaussian beam function.
The light power collected by the receiving fiber
can be evaluated by using the integral as shown in
Equation (3).
PðzÞ ¼
ðSR
Iðr, zÞdSR: ð3Þ
However, the exact integration is tedious and impos-
sible. Therefore, assumptions and approximations
were used to solve the integration. For points situated
in the far-field, z� zR the following relations with the
divergence angle can be obtained
�a ¼ tan �a ¼!ðzÞ
z¼!0
zR¼
�
�!0: ð4Þ
The core radius of the transmitting fiber and receiving
fibers are given by the approximation
rT ¼ za tan �a � za�a ð5Þ
and
rR ¼ k!T ¼ kza�a ð6Þ
where za is the distance between the beam source to the
fiber end [10]. The core area of the receiving fiber is
computed from
Sa ¼ �r2R ¼ �k
2z2a�2a: ð7Þ
The radial distance between the two core centers of the
transmitting fiber and receiving fiber is determined
from
r ¼ rT þ rR ¼ rT þ krT ¼ ð1þ kÞza�a: ð8Þ
The path of the beam from the beam source to the
bundle end after the reflection is given by
za þ 2h: ð9Þ
The displacement parameter in the normalized form is
presented as
� ¼za þ 2h
zað10Þ
or
� ¼ 1þ 2hN ð11Þ
where hN¼ h/za. To relate the displacement between
the reflective mirror to the fiber end, h, to the transfer
function, with the help of the results determined above,
the collected power of the receiving fiber can be
expressed as
PðhÞ ¼2PE
�!2ðza þ 2hÞexp �
2r2
!2ðza þ 2hÞ
� �� Sa
¼2PEk
2z2aðza þ 2hÞ2
exp �2ðð1þ kÞzaÞ
2
ðza þ 2hÞ2
� �: ð12Þ
Figure 2. Geometrical illustration for the overlapping areabetween the reflected light circle and the core of the receivingfiber at different CRRs. T and R are the transmitting andreceiving fibers, respectively. (The color version of this figureis included in the online version of the journal.)
Transmitting fiber
Receiving fiber
(Cross-section)
rT
rR
Figure 1. Side and front views of the transmitting andreceiving fiber ends.
Journal of Modern Optics 1839
Downloaded By: [Hong Kong University of Science & Tech] At: 04:46 4 January 2011

By substituting Equation (10) into this equation, weobtain
Pð�Þ ¼2PEk
2
�2exp �
2ð1þ kÞ2
�2
� �: ð13Þ
The maximum received power is achieved whenP0ð�Þ ¼ 0, and this leads to
�max ¼ffiffiffi2pð1þ kÞ: ð14Þ
Based on the above equations, the maximum h isgiven by
hmax ¼
ffiffiffi2p
kþffiffiffi2p� 1
2: ð15Þ
The maximum power is given by
Pmax ¼ Pðffiffiffi2pð1þ kÞÞ ¼
k2PE
ðkþ 1Þ2expð�1Þ: ð16Þ
In the normalized form, Equation (10) is rewritten as
PNð�Þ ¼Pð�Þ
Pmax¼
2ðkþ 1Þ2
�2exp 1�
2ð1þ kÞ2
�2
� �: ð17Þ
In the analysis, the theoretical model of the FODsensor is modeled based on the similar parameters usedin the experiment: the wavelength of the laser source�¼ 594 nm, the transmitting fiber core radiusrR¼ 0.5mm and numerical aperture value NA¼ 0.4.Based on the same parameters, four analytical modelswere simulated for k¼ 0.5, 1, 2 and 3, which werebased on the available fiber core radius combinationsin the experiments.
3. Experiment
Figure 3 shows the experimental set-up for the FODSusing the bundled fiber with different core radii. Theasymmetrical bundled fiber is constructed by pairingtwo different plastic fibers with the core radii of either
0.25mm or 0.50mm or 0.75mm. Owing to the limitedselections of core diameters, six combinations wereselected for the experiments: ½k, rT, rR� ¼ [0.5, 0.5mm,0.25mm], [1.0, 0.5mm, 0.5mm], [2.0, 0.25mm, 0.5mm]and [3.0, 0.25mm, 0.75mm]. k is the core radial ratio.The light source is emitted from a source of 594 nmwavelength, yellow HeNe laser and modulated usinga chopper spinning at a frequency of 200Hz. Themodulated light beam is then launched into one of thefibers in 2m long bundled plastic fiber – the transmit-ting fiber. The fiber probe is placed perpendicularly tothe reflecting mirror.
The light beam emitted from the transmitting fiberis reflected by the flat mirror and the receiving fibercollects the reflected light. A precise displacementreference between the bundle end and the reflectingmirror is imperative for the experiment. Therefore, aNew Focus 9061 motorized stage, driven by apicomotor, is used to change the displacement of thereflecting mirror from the fiber probe. Each incremen-tal step in the displacement is made identical andaccurate. The collected light power in the receivingfiber is converted by a silicon detector into electricalpower. Lastly, the electrical signal is filtered by a lock-in amplifier and recorded in the computer.
4. Results and discussion
In both the theoretical and experimental analysis, theresults are processed and displayed in the normalizedforms in which the output power is normalized by themaximum output power and the displacement isnormalized by the parameter za. This makes theoutput function a dimensionless function and elim-inates the dependency of the FODS output function onthe fiber core radius and divergence angle. Figures 4and 5 show the analytical and experimental results,
Figure 4. The experimental result of proposed FODS modelat different CRRs or k values. (The color version of thisfigure is included in the online version of the journal.)
Chopper
Object mirror
RS232
HeNe laser
Modulator
Lock-Inamplifier
Silicon detector
PC
Figure 3. Experiment set-up.
1840 K.S. Lim et al.
Downloaded By: [Hong Kong University of Science & Tech] At: 04:46 4 January 2011
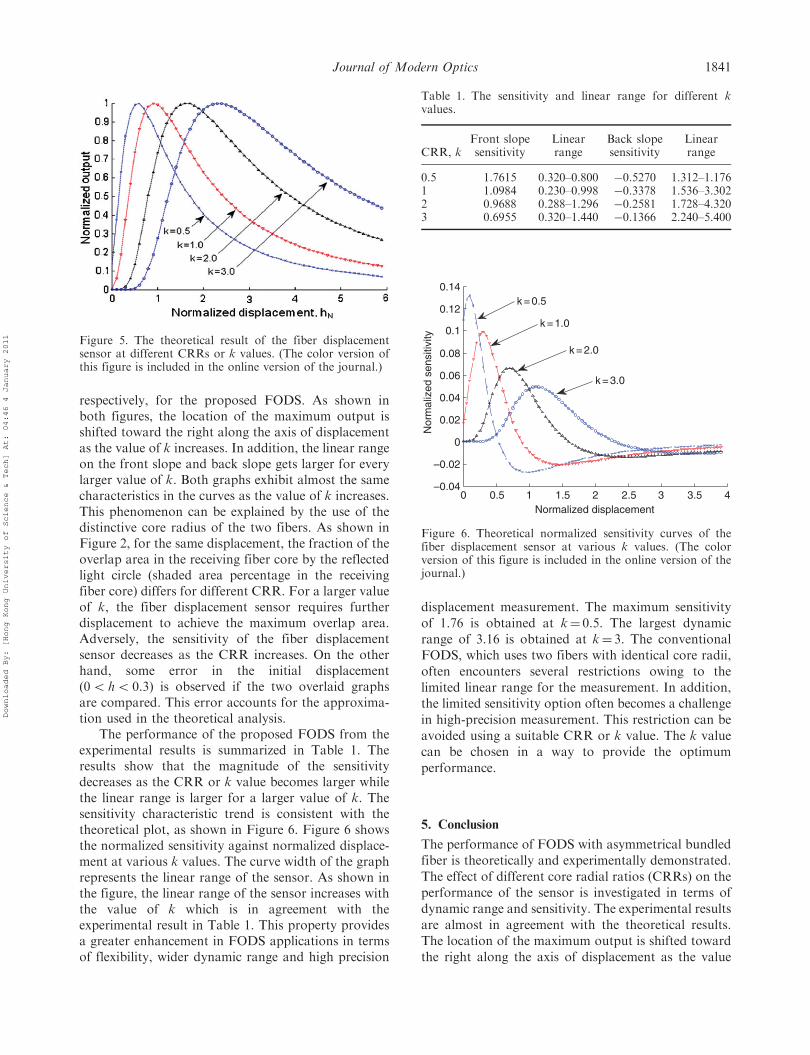
respectively, for the proposed FODS. As shown inboth figures, the location of the maximum output isshifted toward the right along the axis of displacementas the value of k increases. In addition, the linear rangeon the front slope and back slope gets larger for everylarger value of k. Both graphs exhibit almost the samecharacteristics in the curves as the value of k increases.This phenomenon can be explained by the use of thedistinctive core radius of the two fibers. As shown inFigure 2, for the same displacement, the fraction of theoverlap area in the receiving fiber core by the reflectedlight circle (shaded area percentage in the receivingfiber core) differs for different CRR. For a larger valueof k, the fiber displacement sensor requires furtherdisplacement to achieve the maximum overlap area.Adversely, the sensitivity of the fiber displacementsensor decreases as the CRR increases. On the otherhand, some error in the initial displacement(05 h5 0.3) is observed if the two overlaid graphsare compared. This error accounts for the approxima-tion used in the theoretical analysis.
The performance of the proposed FODS from theexperimental results is summarized in Table 1. Theresults show that the magnitude of the sensitivitydecreases as the CRR or k value becomes larger whilethe linear range is larger for a larger value of k. Thesensitivity characteristic trend is consistent with thetheoretical plot, as shown in Figure 6. Figure 6 showsthe normalized sensitivity against normalized displace-ment at various k values. The curve width of the graphrepresents the linear range of the sensor. As shown inthe figure, the linear range of the sensor increases withthe value of k which is in agreement with theexperimental result in Table 1. This property providesa greater enhancement in FODS applications in termsof flexibility, wider dynamic range and high precision
displacement measurement. The maximum sensitivityof 1.76 is obtained at k¼ 0.5. The largest dynamicrange of 3.16 is obtained at k¼ 3. The conventionalFODS, which uses two fibers with identical core radii,often encounters several restrictions owing to thelimited linear range for the measurement. In addition,the limited sensitivity option often becomes a challengein high-precision measurement. This restriction can beavoided using a suitable CRR or k value. The k valuecan be chosen in a way to provide the optimumperformance.
5. Conclusion
The performance of FODS with asymmetrical bundledfiber is theoretically and experimentally demonstrated.The effect of different core radial ratios (CRRs) on theperformance of the sensor is investigated in terms ofdynamic range and sensitivity. The experimental resultsare almost in agreement with the theoretical results.The location of the maximum output is shifted towardthe right along the axis of displacement as the value
0 0.5 1 1.5 2 2.5 3 3.5 4–0.04
–0.02
0
0.02
0.04
0.06
0.08
0.1
0.12
0.14
Normalized displacement
Nor
mal
ized
sen
sitiv
ity
k = 2.0
k = 1.0
k = 0.5
k = 3.0
Figure 6. Theoretical normalized sensitivity curves of thefiber displacement sensor at various k values. (The colorversion of this figure is included in the online version of thejournal.)
Figure 5. The theoretical result of the fiber displacementsensor at different CRRs or k values. (The color version ofthis figure is included in the online version of the journal.)
Table 1. The sensitivity and linear range for different kvalues.
CRR, kFront slopesensitivity
Linearrange
Back slopesensitivity
Linearrange
0.5 1.7615 0.320–0.800 �0.5270 1.312–1.1761 1.0984 0.230–0.998 �0.3378 1.536–3.3022 0.9688 0.288–1.296 �0.2581 1.728–4.3203 0.6955 0.320–1.440 �0.1366 2.240–5.400
Journal of Modern Optics 1841
Downloaded By: [Hong Kong University of Science & Tech] At: 04:46 4 January 2011

of k increases. In addition, the linear range for bothfront and back slopes increases with the value of k.
References
[1] Nalwa, S. Polymer Optical Fibres; American Scientific
Publishers: California, 2004.[2] Kulkarini, V.K.; Lalasangi, A.S.; Pattanashetti, I.I.;
Raikar, U.S. J. Optoelectron. Adv. Mat. 2006, 8,1610–1612.
[3] Spooncer, R.C.; Butler, C.; Jones, B.E. Opt. Eng. 1992,31, 1632–1637.
[4] Murphy, M.M.; Jones, G.R. Pure Appl. Opt. 1994, 3,
361–369.
[5] Wang, D.-X.; Karim, M.A.; Li, Y. Opt. Eng. 1997, 36,838–842.
[6] Ko, W.H.; Chang, K.-M.; Hwang, G.-J. Sensor Actuat.A – Phys. 1995, 49, 51–55.
[7] Bock, W.J.; Nawrocka, M.S.; Urbanczyk, W. IEEETrans. Instrum. Meas. 2001, 50, 1085–1088.
[8] Elasar, J.; Selmic, S.; Tomic, M.; Prokin, M. J. Opt. A:Pure Appl. Opt. 2002, 4, 347–355.
[9] Oiwa, T.; Nishitani, H. Meas. Sci. Technol. 2004, 15,
84–90.[10] Faria, J.B. IEEE T. Instrum. Meas. 1998, 47, 742–747.[11] Cao, H.; Chen, Y.; Zhou, Z.; Zhang, G. Sensor Actuat
A – Phys. 2007, 136, 580–587.[12] Buchade, P.B.; Shaligram, A.D. Sensor Actuat. A –
Phys. 2006, 128, 312–316.
1842 K.S. Lim et al.
Downloaded By: [Hong Kong University of Science & Tech] At: 04:46 4 January 2011
Research article
Theoretical and experimental studies on liquidrefractive index sensor based on bundle fiber
S.W. Harun
Department of Electrical Engineering, University of Malaya, Kuala Lumpur, Malaysia, and
H.Z. Yang and H. AhmadPhysics Department, University of Malaya, Kuala Lumpur, Malaysia
AbstractPurpose – The purpose of this paper is to investigate, theoretically and experimentally the performance of liquid refractive index sensor (LRIS).Design/methodology/approach – The proposed LRIS is based on the intensity modulation and a bundle fiber. The mathematical model is used tostudy the effect of inclination angle on performance of the sensor.Findings – The theoretical result shows that the highest sensitivity can be achieved by using a probe inclined with angle 208 which is almost 13 timeshigher than that of 08 inclination. In the experiment, three different liquids: isopropyl alcohol, water and methanol are used to investigate the sensorresponse. Both theoretical and experimental results show that the peak power and the location of the displacement curve changes with refractiveindex. The sensitivities are obtained at 0.11/mm and 0.04/mm for the sensors with 108 and 08 inclination angles, respectively.Originality/value – In this paper, a simple LRIS is proposed using a bundle fiber as a probe at various inclination angles.
Keywords Fiber optic sensors, Refraction
Paper type Research paper
1. Introduction
Fiber-optic displacement sensors (FODSs) havebeen intensively
studied and experimented due to their many desirable
advantages such as small size, high sensitivity, immunity of
electromagnetic interference and safety for hazardous or
explosive environment (Rastogi, 1997). This sensor consists of
two pieces of fibers, one set connected to a light source and
termed the transmitting fiber, and the other set connected to a
photo detector (photodiode) and known as the receiving fiber.
Both fibers are bundled into a common probe. The FODS has
the capability to measure physical quantities such as the
displacement, vibration, strain, pressure, etc. (Lim et al., 2009;
Yasin et al., 2009, 2007; Suhadolnik et al., 1995). However, the
use of this sensor for detection of environmental refractive
index changehas not been fully explored.Refractive index sensor
is important for biological and chemical applications since a
number of substances can be detected throughmeasurements of
the refractive index. For the liquid refractive index sensor
(LRIS), an intensity modulation is normally used in conjunction
with multimode plastic fiber because of its many advantages
such as non-contact sensing. The use of the multimode plastic
fiber provides an efficient signal coupling as well as being
able to receive the maximum reflected light from a target
(Nath et al., 2008).A FODS-based refractive index measurement using a bundle
fiber was first introduced by Suhadolnik et al. (1995). Later on
Chaudhari and Shaligram (2002) reported on the study of LRIS
at various types of optical sources. In our earlier work, a FODS
was proposed based on two asymmetrical fibers for liquid
refractive indexmeasurement (Yang et al., 2009). In this paper, a
new LRIS is proposed and demonstrated using a pair type of
bundle at various inclination angles. A mathematical model is
developed to investigate the performance of the sensor with
different inclination angles. An experiment is also carried out to
investigate the sensor performance at various liquid materials.
2. Mathematical model
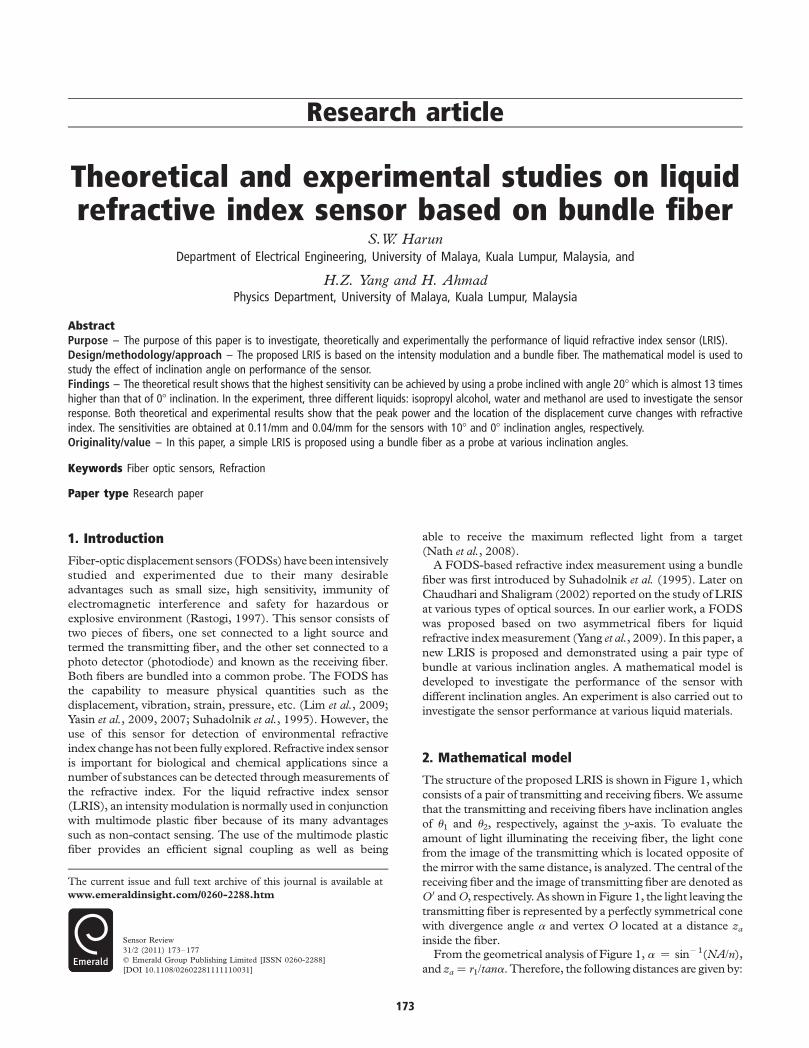
The structure of the proposed LRIS is shown in Figure 1, which
consists of a pair of transmitting and receiving fibers. We assume
that the transmitting and receiving fibers have inclination angles
of u1 and u2, respectively, against the y-axis. To evaluate the
amount of light illuminating the receiving fiber, the light cone
from the image of the transmitting which is located opposite of
themirror with the same distance, is analyzed. The central of the
receiving fiber and the image of transmitting fiber are denoted as
O0 andO, respectively. As shown inFigure 1, the light leaving the
transmitting fiber is represented by a perfectly symmetrical cone
with divergence angle a and vertex O located at a distance zainside the fiber.From the geometrical analysis of Figure 1, a ¼ sin21(NA/n),
and za ¼ r1/tana. Therefore, the following distances are given by:
The current issue and full text archive of this journal is available at
www.emeraldinsight.com/0260-2288.htm
Sensor Review
31/2 (2011) 173–177
q Emerald Group Publishing Limited [ISSN 0260-2288]
[DOI 10.1108/02602281111110031]
173
AB ¼ffiffiffiffiffiffiffiffiffiffiffiffiffiffiffiffiffiz2a þ r2d1
qsin tan21 rd1
za
� �2
p
2þ u1
� �ð1Þ
O0C ¼ 4rd1sinu1 þ 2x2 AB2 rd2sinu2 ð2Þ
OA ¼ffiffiffiffiffiffiffiffiffiffiffiffiffiffiffiffiffiz2a þ r2d1
qcos tan21 rd1
za
� �2
p
2þ u1
� �ð3Þ
OC ¼ OAþ rd2cos u2 ð4Þ
OO 0 ¼ffiffiffiffiffiffiffiffiffiffiffiffiffiffiffiffiffiffiffiffiffiffiffiffiffiffiffiO 0C2 þOC2
pð5Þ
where the NA is numerical aperture of transmitting fiber, n is
refractive index of liquid, r1 and r2 are the core radius of
transmitting fiber and receiving fiber while the rd1 and rd2 are the
radius of transmitting fiber and receiving fiber, respectively, and
the x is the displacement between the sensor probe tip and
reflector mirror.Also from the geometrical analysis, the acceptance angle b
of the light cone from the virtual point source O, is given by:
bðzÞ ¼ tan21 O 0C
OC
� �2
p
2þ u1 ð6Þ
The intensity of the light emitted from the transmitting fiber
can be well described with Gaussian distribution (Lim et al.,
2009) and is given by:
Iðr; zÞ ¼ 2PE
pv2ðzÞ exp 22r2
v2ðzÞ
� �ð7Þ
where PE is the emitted power from the light source, r is the
radial coordinate and z is the longitudinal coordinate. vðzÞ isthe beam radius and expressed as a function of z,
vðzÞ ¼ v0
ffiffiffiffiffiffiffiffiffiffiffiffiffiffiffiffiffiffiffiffiffiffiffiffiffi1þ ðz=zRÞ2
q. The waist radius v0 and Rayleigh
range zR are the important parameters in the Gaussian beam
function and the detailed description can be found in Lim et al.(2009). Equation (7) shows that the light intensity decays
exponentially as it goes radially away from the center of the
light circle. The radial coordinate r of equation (7) can be
determined by:
r ¼ OO 0sinb ð8Þ
The longitudinal coordinate is the distance between the
sensor probe tip and the virtual laser source point O and it
can be determined:
z ¼ OO 0cosb ð9Þ
For points situated in the far field z .. zR, the beam radius of
the virtual point source can be derived as (Kleiza and Verkelis,
2007):
vðzÞ < za ð10Þ
By the approximation:
r1 ¼ zatana < zaa ð11Þ
Based on the properties above, the power harnessed by the
receiving fiber, P can be evaluated by integrating the Gaussian
distribution function of equation (7) over the area of the of
receiving fiber end surface, Sr:
Pðr; zÞ ¼ZSr
Iðr; zÞdSr ð12Þ
where the core area of the receiving fiber is:
Sr ¼ pr21 ¼ pz2aa2 ð13Þ
By combining and substituting equations (8), (9), (10) and (13)
into the equation (12), finally theproposedLRIS response canbe
summarized as:
P ðz;rÞ ¼2PE
pv2ðzÞ exp 22r2
v2ðzÞ
� �£ Sr
¼ 2z2aPE
z2exp
2r2
z2a2
� �ð14Þ
This equation shows that the liquid refractive index response of
sensor is a function of displacement x and refractive index n of
surrounding medium while sensor probe is design of inclination
angles of u1 and u2. Therefore, based on equation (14), the
proposed LRIS can be used to detect the liquid refractive index
where the sensor probe is immersed by the measurement liquid.
Table I shows the list of all variables used in this section and its
definition.
3. Simulation and experiment
The mathematical model of the proposed LRIS is simulated by
MATLAB programming. In the simulation, the wavelength of
the laser source l and numerical aperture NA is set at 594 nm
and 0.32, respectively. The fiber core radius r1 and r2 are set at0.25 and 0.5mm while the fiber diameters rd1 and rd2 are set at0.5 and 0.75mm, respectively. Figure 2 shows the experimental
setup, which consists of a 594 nm yellow He-Ne laser source
and a bundled fiber probe. The emitted light source has
Figure 1 Structure of sensor probe
y-axis
Receiving fiberTransmittingfiber
r1
r2
x
θ2
θ1
B’C’
O’A’
Mirror
Image oftransmitting fiber
A
COB
βα
Theoretical and experimental studies on LRIS based on bundle fiber
S.W. Harun, H.Z. Yang and H. Ahmad
Sensor Review
Volume 31 · Number 2 · 2011 · 173–177
174
an average output power of 3.0mW, beamdiameter of 0.75mm
and beam divergence 0.92 of mRads. The external chopper isused to modulate the light at a frequency of 200Hz before it islaunched into the transmitting fiber. The transmitting fiber
transfers the modulated light to a reflective mirror while thereceiving fiber collects the reflected light, which is then
transferred to the detector. The sensor probe is mounted on thestage controlled by NewFocus Picomotor for the displacement
measurement. Silicon detector is used to measure the receivedlight and converts it into electrical signal which is then denoised
using a lock-in amplifier. During the measurement, the roomtemperature is maintained at 288C to avoid the change of liquid
refractive index.
4. Results and discussions
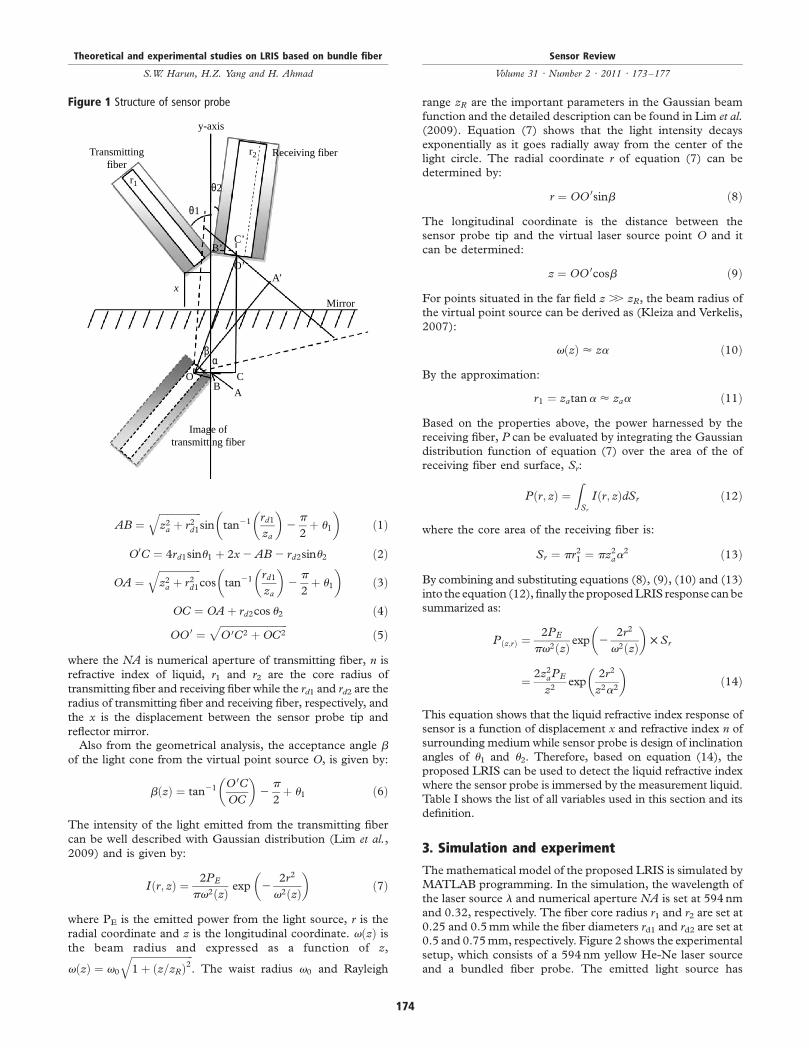
Figure 3 shows the sensor responses at different probe
inclination angles u1 and u2 for three different refractiveindices of 1, 1.3 and 1.6. In the simulation, the probe is inclined
with the same angles of 08, 108 and 208, the outputs powers arenormalized into 1 and unit of the displacement is mm. Figure 3
shows three different sensor responses, which were group basedon the three different inclination angles. As seen in Figure 3, it
was found that the inclination angles u1 and u2 reasonably affectthe displacement curves profile and output power. The highest
output power is almost ten times of the lowest output power.The vertical dash lines are located in the displacements of 1.1,
2.0 and 3.4mm corresponding to the sensor probe inclinationangles of 208, 108 and 08, respectively. Comparing those
positions, the sensor responses have the biggest output power
differentiation when the refractive index is increased from 1.0to 1.6. The sensor output is also observed to be increased
almost linearly with the refractive index of the medium.As shown in Figure 3, the performance of the LRIS improves
with an increase of the inclination angles. The larger theinclination angles of u1 and u2, the better the performance of
liquid refractive index response.Inset of Figure 3 shows the maximum normalized output of
the sensor as a function of refractive index for various
inclination angles. The normalized outputs were taken at thesensor probe position of 1.1, 2.0 and 3.4mm for inclination
angles of 208, 108 and 08, respectively, which is indicated byvertical dash lines in Figure 3. It was found that the sensitivities
of the sensor increase with the increment of probe inclinationangle. As shown in the inset of Figure 3, the highest sensitivity
of 0.8235 is achieved by the use of probe with inclination angleof 208 which is almost 13 times higher than that in zeroinclination. Figure 4 shows the simulation curves of the LRIS at
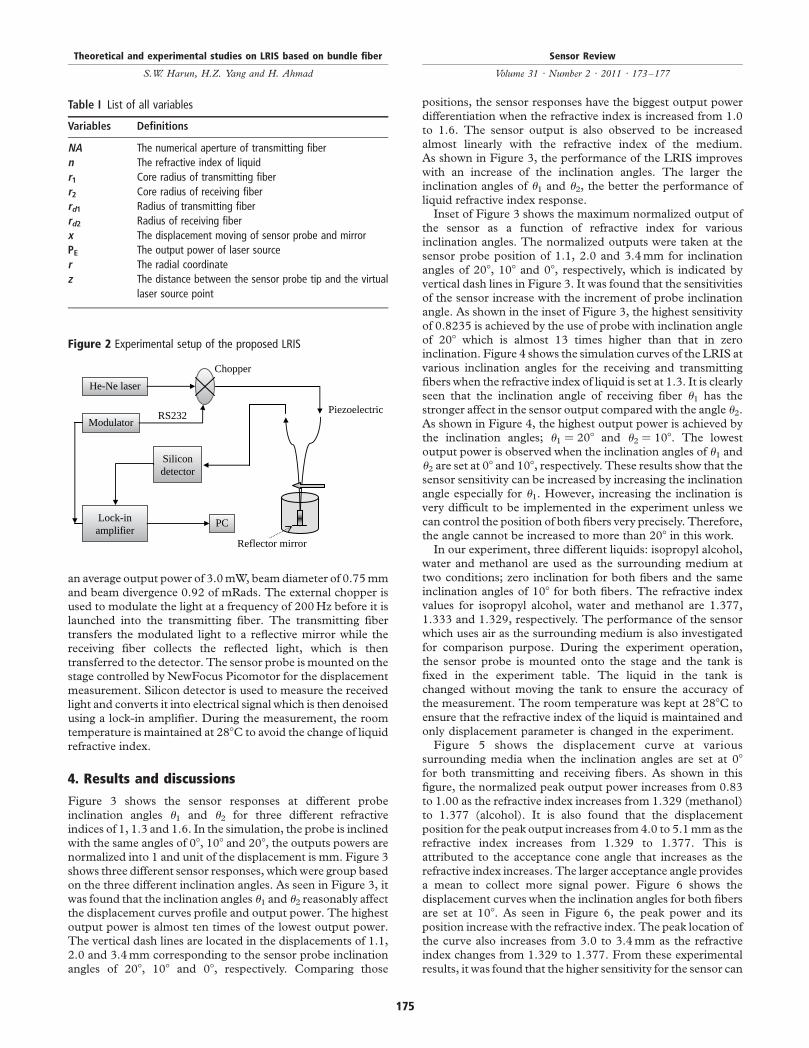
various inclination angles for the receiving and transmittingfibers when the refractive index of liquid is set at 1.3. It is clearly
seen that the inclination angle of receiving fiber u1 has thestronger affect in the sensor output compared with the angle u2.
As shown in Figure 4, the highest output power is achieved bythe inclination angles; u1 ¼ 208 and u2 ¼ 108. The lowest
output power is observed when the inclination angles of u1 andu2 are set at 08 and 108, respectively. These results show that thesensor sensitivity can be increased by increasing the inclination
angle especially for u1. However, increasing the inclination isvery difficult to be implemented in the experiment unless we
can control the position of both fibers very precisely. Therefore,the angle cannot be increased to more than 208 in this work.In our experiment, three different liquids: isopropyl alcohol,
water and methanol are used as the surrounding medium at
two conditions; zero inclination for both fibers and the sameinclination angles of 108 for both fibers. The refractive indexvalues for isopropyl alcohol, water and methanol are 1.377,
1.333 and 1.329, respectively. The performance of the sensorwhich uses air as the surrounding medium is also investigated
for comparison purpose. During the experiment operation,the sensor probe is mounted onto the stage and the tank is
fixed in the experiment table. The liquid in the tank ischanged without moving the tank to ensure the accuracy ofthe measurement. The room temperature was kept at 288C to
ensure that the refractive index of the liquid is maintained andonly displacement parameter is changed in the experiment.Figure 5 shows the displacement curve at various
surrounding media when the inclination angles are set at 08
for both transmitting and receiving fibers. As shown in thisfigure, the normalized peak output power increases from 0.83
to 1.00 as the refractive index increases from 1.329 (methanol)to 1.377 (alcohol). It is also found that the displacement
position for the peak output increases from 4.0 to 5.1mm as therefractive index increases from 1.329 to 1.377. This isattributed to the acceptance cone angle that increases as the
refractive index increases. The larger acceptance angle providesa mean to collect more signal power. Figure 6 shows the
displacement curves when the inclination angles for both fibersare set at 108. As seen in Figure 6, the peak power and its
position increase with the refractive index. The peak location ofthe curve also increases from 3.0 to 3.4mm as the refractiveindex changes from 1.329 to 1.377. From these experimental
results, it was found that the higher sensitivity for the sensor can
Figure 2 Experimental setup of the proposed LRIS
Chopper
PiezoelectricRS232
Reflector mirror
He-Ne laser
Modulator
Lock-inamplifier
Silicondetector
PC
Table I List of all variables
Variables Definitions
NA The numerical aperture of transmitting fiber
n The refractive index of liquid
r1 Core radius of transmitting fiber
r2 Core radius of receiving fiber
rd1 Radius of transmitting fiber
rd2 Radius of receiving fiber
x The displacement moving of sensor probe and mirror
PE The output power of laser source
r The radial coordinate
z The distance between the sensor probe tip and the virtual
laser source point
Theoretical and experimental studies on LRIS based on bundle fiber
S.W. Harun, H.Z. Yang and H. Ahmad
Sensor Review
Volume 31 · Number 2 · 2011 · 173–177
175
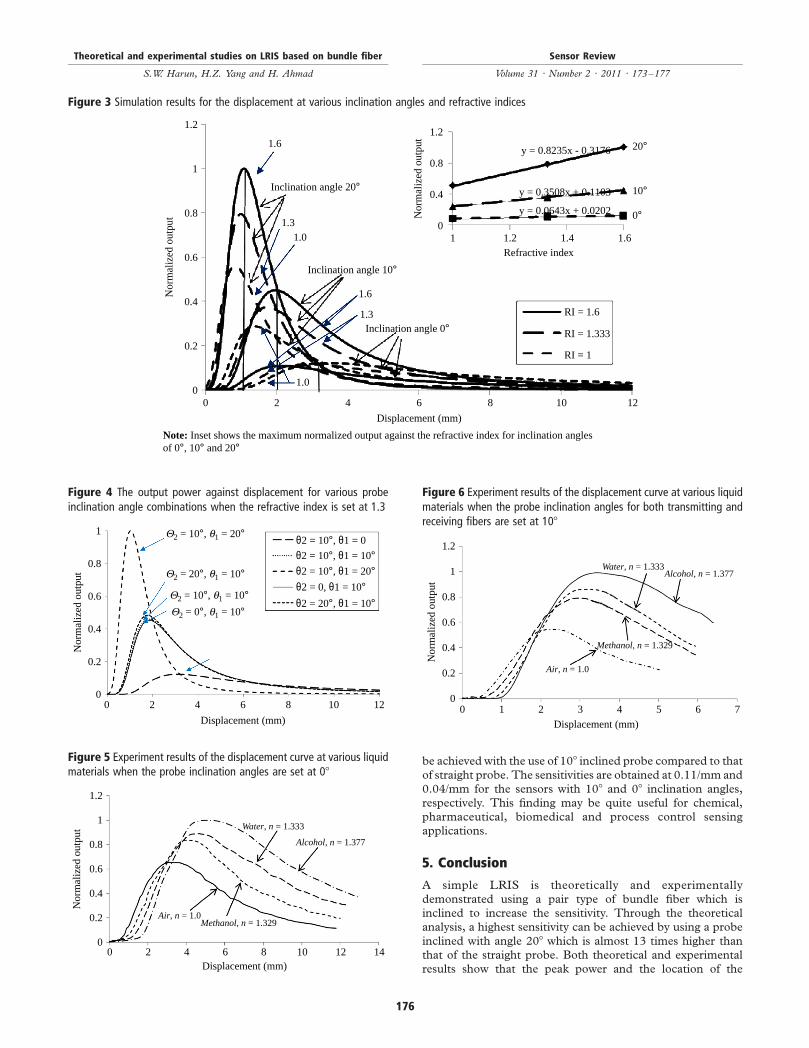
be achieved with the use of 108 inclined probe compared to that
of straight probe. The sensitivities are obtained at 0.11/mm and0.04/mm for the sensors with 108 and 08 inclination angles,respectively. This finding may be quite useful for chemical,pharmaceutical, biomedical and process control sensingapplications.
5. Conclusion
A simple LRIS is theoretically and experimentallydemonstrated using a pair type of bundle fiber which isinclined to increase the sensitivity. Through the theoreticalanalysis, a highest sensitivity can be achieved by using a probe
inclined with angle 208 which is almost 13 times higher thanthat of the straight probe. Both theoretical and experimentalresults show that the peak power and the location of the
Figure 3 Simulation results for the displacement at various inclination angles and refractive indices
1.2
1
0.8
0.6
0.4
0.2
00 2 4 6
Displacement (mm)
1.6
Inclination angle 20°
20°
10°
0°
Inclination angle 10°
Inclination angle 0°RI = 1.6
1.2
Nor
mal
ized
out
put
0.8
0.4
01 1.2
y = 0.8235x - 0.3176
y = 0.3508x + 0.1103
y = 0.0643x + 0.0202
Refractive index1.4 1.6
RI = 1.333
RI = 1
1.31.0
1.6
1.3
1.0
8 10 12
Nor
mal
ized
out
put
Note: Inset shows the maximum normalized output against the refractive index for inclination anglesof 0°, 10° and 20°
Figure 4 The output power against displacement for various probeinclination angle combinations when the refractive index is set at 1.3
1
0.8
0.6
Nor
mal
ized
out
put
0.4
0.2
00 2 4 6
Displacement (mm)
Q2 = 10°, q1 = 20° θ2 = 10°, θ1 = 0
θ2 = 0, θ1 = 10°θ2 = 10°, θ1 = 20°θ2 = 10°, θ1 = 10°
θ2 = 20°, θ1 = 10°
Q2 = 20°, q1 = 10°
Q2 = 10°, q1 = 10°Q2 = 0°, q1 = 10°
8 10 12
Figure 5 Experiment results of the displacement curve at various liquidmaterials when the probe inclination angles are set at 08
1.2
1
0.8
Nor
mal
ized
out
put
0.6
0.4
0.2
00 2 4 6
Displacement (mm)
Air, n = 1.0Methanol, n = 1.329
Alcohol, n = 1.377
Water, n = 1.333
8 10 12 14
Figure 6 Experiment results of the displacement curve at various liquidmaterials when the probe inclination angles for both transmitting andreceiving fibers are set at 108
1.2
1
0.8
Nor
mal
ized
out
put
0.6
0.4
0.2
00 1 3 52 4 6
Displacement (mm)
Air, n = 1.0
Methanol, n = 1.329
Alcohol, n = 1.377Water, n = 1.333
7
Theoretical and experimental studies on LRIS based on bundle fiber
S.W. Harun, H.Z. Yang and H. Ahmad
Sensor Review
Volume 31 · Number 2 · 2011 · 173–177
176
displacement curve changes with refractive index. It was alsofound experimentally that the sensitivity of the sensor with 108inclination of probe arrangement shows a higher sensitivitycompared to that of the use of straight probe. The sensitivitiesare obtained at 0.11/mm and 0.04/mm for the sensors with108 and 08 inclination angles, respectively.
References
Chaudhari, A.L. and Shaligram, A.D. (2002), “Multi-wavelength optical fiber liquid refracto-metry based onintensity modulation”, Sensor and Actuators A: Physical,Vol. 100 Nos 2/3, pp. 160-4.
Kleiza, V. and Verkelis, J. (2007), “Some advanced fiber-opticamplitude modulated reflection displacement and refractiveindex sensors”, Nonlinear Analysis: Modelling and Control,Vol. 12 No. 2, pp. 213-25.
Lim, K.S., Harun, S.W., Yang, H.Z., Dimyati, K. andAhmad, H. (2009), “Analytical and experimental studies onasymmetric bundle fiber displacement sensors”, J. ModernOptics, Vol. 56 No. 17, pp. 1838-42.
Nath, P., Singh, H.K., Datta, P. and Sarma, K.C. (2008),“All-fiber optic sensor for measurement of liquid refractive
index”, Sensor and Actuators A: Physical, Vol. 148 No. 1,pp. 16-18.
Rastogi, P.K. (1997), Optical Measurement Techniques andApplications, Artech House, Boston, MA.
Suhadolnik, A., Babnik, A. and Mozina, J. (1995), “Opticalfiber reflection refractometer”, Sensor and Actuators B:Chemical, Vol. 29, pp. 428-32.
Yang, H.Z., Harun, S.W. and Ahmad, H. (2009), “Fiber opticdisplacement and liquid refractive index sensors with twoasymmetrical inclined fibers”, Sensors and TransducersJournal, Vol. 108 No. 9, pp. 80-8.
Yasin, M., Harun, S.W., Abdul-Rashid, H.A., Kusminarto, K.and Ahmad, H. (2007), “The performance of a fiber opticdisplacement sensor for different types of probes andtargets”, Laser Physics Letters, Vol. 5 No. 1, pp. 55-8.
Yasin, M., Harun, S.W., Kusminarto, K., Zaidan, A.H.,Thambiratnam, K. and Ahmad, H. (2009), “Design andoperation of a concentric-fiber displacement sensor”, Fiberand Intergrated Optics, Vol. 28 No. 4, pp. 301-9.
Corresponding author
S.W. Harun can be contacted at: [email protected]
Theoretical and experimental studies on LRIS based on bundle fiber
S.W. Harun, H.Z. Yang and H. Ahmad
Sensor Review
Volume 31 · Number 2 · 2011 · 173–177
177
To purchase reprints of this article please e-mail: [email protected]
Or visit our web site for further details: www.emeraldinsight.com/reprints

Research article
Theoretical and experimental studieson concave mirror-based fiber optic
displacement sensorH.Z. Yang
Photonics Research Center, University of Malaya, Kuala Lumpur, Malaysia
S.W. HarunPhotonics Research Center, University of Malaya, Kuala Lumpur, Malaysia and
Department of Electrical Engineering, University of Malaya, Kuala Lumpur, Malaysia, and
H. AhmadPhotonics Research Center, University of Malaya, Kuala Lumpur, Malaysia
AbstractPurpose – The purpose of this paper is to investigate, theoretically and experimentally, a concave mirror-based fiber optic displacement sensorperformance for three-axes directional measurements.Design/methodology/approach – Mathematical model is constructed based on spherical mirror properties of the concave mirror and the simulatedresult is found to be in good agreement with the experimental results.Findings – Both theoretical and experimental results show that the focal length and radius of the concave mirror make significant influence to thedisplacement response. In the x-axes measurement, six linear slopes are obtained with four of them are located in the vicinity of the position, two timesof the focal length. The maximum measurement range of about 20 mm is obtained using a focal length of 10 mm. In the y- and z-axes displacementmeasurements, the linear range increases as the diameter of concave mirror increases. The longest linear range of 8 mm is achieved at mirror radius of10 mm.Originality/value – This is the first demonstration of three axes directional displacement measurements using a concave mirror as a target
Keywords Fiber optic sensors, Mathematical modelling, Simulation
Paper type Research paper
1. Introduction
In general, there are two types of fiber optic displacement sensors(FODS); namely interferometry- and intensity modulation-based FODS. FODS are employed to control the distance,vibration and position, etc. in monitoring systems. Theinterferometry-based FODS are operated by combining twodifferent path light waves where one is the measurement waveand the other is the reference wave to generate interferencefringes that are used to measure the position shift (Rastogi,
1997). The interferometry-based displacement sensor canprovide ultrahigh precision displacement control; however, itrequires complicated instruments and therefore incurs high costalong with having limited bandwidth in comparison to intensitymodulation-based FODS. The intensity modulation-based
FODSs on the other hand are capable of using low-cost
components to achieve high bandwidth and ultrahigh precision
displacement control (Muephy and Coursolle, 1990; Golnabi,
2000;Harun et al., 2009;Lim et al., 2009).MostFODSs employ
a multimode plastic optic fiber as a probe and a flat mirror as a
reflective target, and a detector is used tomeasure the intensity of
the reflected light (which the amount is a function of
displacement). Work on FODS systems currently focus on
improving the performance of the FODS such as enhancing the
dynamic range and increasing sensitivity using a variety of sensor
probe, reflector and laser source arrangements (Golnabi and
Azimi, 2008;Huang andTata, 2008;Cao et al., 2007).However,
for potential industry applications, there is a requirement for
multi-axes displacement sensing in the vibration, position and
strain monitoring system (Sagrario and Mead, 1998). This
presents a problem as conventional FODSs are normally
designed to measure the displacement in one axes; it is
shrivelled for other two axes.Recently, a new FODS was proposed using a pair type of
bundle fiber as a probe and a concave mirror as a target to
provide at least six elective sensitivities and linear ranges
(Yang et al., 2009; Harun et al., 2009, 2011). The theoretical
analysis has shown that the performance of sensor is affected
The current issue and full text archive of this journal is available at
www.emeraldinsight.com/0260-2288.htm
Sensor Review
31/1 (2011) 65–69
q Emerald Group Publishing Limited [ISSN 0260-2288]
[DOI 10.1108/02602281111099107]
65
by many parameters such as focal length and diameter
of concave mirror. In this paper, the concave mirror-based
FODS is analysed further to demonstrate three-dimensional
measurement in order to meet the industrial demand for
themulti-axes displacement sensor.The operational principles,
mathematical analysis, software simulation and experiment
setup for the proposed sensor are described in this paper.
2. Operational principle and theoretical analysis
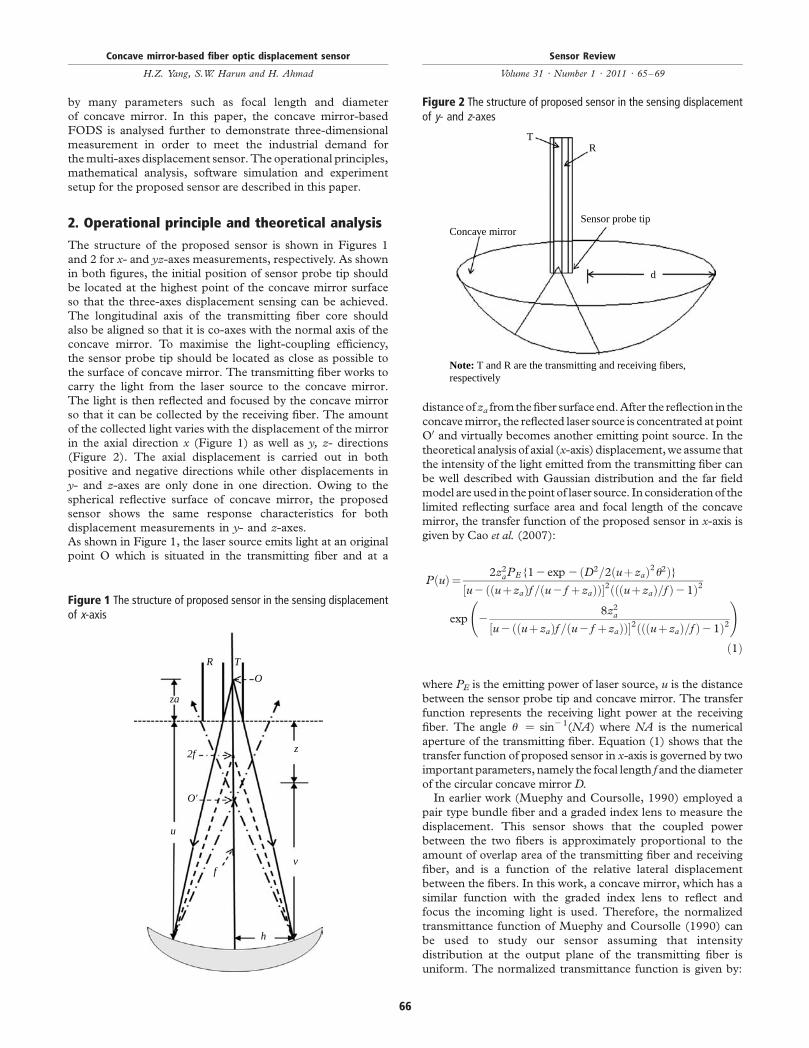
The structure of the proposed sensor is shown in Figures 1
and 2 for x- and yz-axes measurements, respectively. As shown
in both figures, the initial position of sensor probe tip should
be located at the highest point of the concave mirror surface
so that the three-axes displacement sensing can be achieved.
The longitudinal axis of the transmitting fiber core should
also be aligned so that it is co-axes with the normal axis of the
concave mirror. To maximise the light-coupling efficiency,
the sensor probe tip should be located as close as possible to
the surface of concave mirror. The transmitting fiber works to
carry the light from the laser source to the concave mirror.
The light is then reflected and focused by the concave mirror
so that it can be collected by the receiving fiber. The amount
of the collected light varies with the displacement of the mirror
in the axial direction x (Figure 1) as well as y, z- directions
(Figure 2). The axial displacement is carried out in both
positive and negative directions while other displacements in
y- and z-axes are only done in one direction. Owing to the
spherical reflective surface of concave mirror, the proposed
sensor shows the same response characteristics for both
displacement measurements in y- and z-axes.As shown in Figure 1, the laser source emits light at an original
point O which is situated in the transmitting fiber and at a
distanceofza fromthefiber surface end.After the reflection in the
concavemirror, the reflected laser source is concentrated at point
O0 and virtually becomes another emitting point source. In the
theoretical analysis of axial (x-axis) displacement,we assume that
the intensity of the light emitted from the transmitting fiber can
be well described with Gaussian distribution and the far field
model areused in thepoint of laser source. Inconsiderationof the
limited reflecting surface area and focal length of the concave
mirror, the transfer function of the proposed sensor in x-axis is
given by Cao et al. (2007):
PðuÞ¼ 2z2aPE{12exp2 ðD2=2ðuþzaÞ2u2Þ}½u2 ððuþzaÞf =ðu2 f þzaÞÞ�2ðððuþzaÞ=f Þ21Þ2
exp 28z2a
½u2 ððuþzaÞf =ðu2 f þzaÞÞ�2ðððuþzaÞ=f Þ21Þ2
!
ð1Þ
where PE is the emitting power of laser source, u is the distance
between the sensor probe tip and concave mirror. The transfer
function represents the receiving light power at the receiving
fiber. The angle u ¼ sin21(NA) where NA is the numerical
aperture of the transmitting fiber. Equation (1) shows that the
transfer function of proposed sensor in x-axis is governed by two
important parameters, namely the focal length f and the diameter
of the circular concave mirror D.In earlier work (Muephy and Coursolle, 1990) employed a
pair type bundle fiber and a graded index lens to measure the
displacement. This sensor shows that the coupled power
between the two fibers is approximately proportional to the
amount of overlap area of the transmitting fiber and receiving
fiber, and is a function of the relative lateral displacement
between the fibers. In this work, a concave mirror, which has a
similar function with the graded index lens to reflect and
focus the incoming light is used. Therefore, the normalized
transmittance function of Muephy and Coursolle (1990) can
be used to study our sensor assuming that intensity
distribution at the output plane of the transmitting fiber is
uniform. The normalized transmittance function is given by:
Figure 1 The structure of proposed sensor in the sensing displacementof x-axis
R T
O
za
2f z
O'
u
vf
h
Figure 2 The structure of proposed sensor in the sensing displacementof y- and z-axes
Sensor probe tip
Note: T and R are the transmitting and receiving fibers,respectively
Concave mirror
TR
d
Concave mirror-based fiber optic displacement sensor
H.Z. Yang, S.W. Harun and H. Ahmad
Sensor Review
Volume 31 · Number 1 · 2011 · 65–69
66

TðdÞ ¼ 2
pcos21 2d
rd
� �2
2d
rd
� �12
2d
rd
� �2" #1=28<
:9=; ð2Þ
where d is concave mirror displacement in y- or z- directions,rd is the diameter of fiber core. It describes the coupled power
between the transmitting and receiving fiber, which is strongly
depended on the overlap area.
3. Experiment setup
Figure 3 shows the experimental setup of the proposed sensor
for three-dimensional measurements. It consists of a He-Ne
laser, an external chopper, a pair type of bundle fiber, a concave
mirror and a silicon detector. The light source operates at
wavelength of 594 nm with an average output power of
3.0mW, beam diameter of 0.75mm and beam divergence of
0.92mRads. The chopper is used to modulate the light at a
frequencyof 200Hzbefore launched into the transmitting fiber.
A concave mirror is located at the output end of transmitting
fiber to reflect and focus the transmitted light into a receiving
fiber which is bundled together with the transmitting fiber.
The receiving fiber routes the light into the photo detector
which converts the light power into voltage. A lock-in amplifier
is connected with the chopper and photo detector to act as a
data-acquisition system and functions to match the phase
between the modulation light and modulator chopper and
removes the noise generated by laser source, photo detector and
amplifier (Huang and Tata, 2008).One of the major difficulties encountered during
the experiment is the alignment of sensor probe and
concave mirror as discussed in earlier section. The sensor
probe should be vertically aligned with the focal point of the
concave mirror. A translation stage is used in the experiment
to provide multi-axial displacement control for alignment.
The displacement measurement of x-axis is implemented by
fixing the other two axes and ensuring that the longitudinal
axis of the transmitting fiber is co-axis with the normal axis
which is also located at the center of the concave mirror.
In the displacement measurement for the y- and z-axes, thesensor probe alignment in x-axis is fixed as shown in Figure 2.
The mathematical model of the sensor is simulated using
MATLAB programming. The following parameters are used
in the calculations; the wavelength of the laser source
l ¼ 594nm, numerical aperture value NA ¼ 0.35 and fibercore radius of 0.25mm. The performances of the sensor areinvestigated for different focal length and concave mirrordiameters. The focal length and diameter is varied from6-10mm and 12-20mm, respectively.
4. Results and discussions
Figures 4 and 5 show the experimental and theoreticaldisplacement results of the FODS in x- and y-axes,respectively. The theoretical results are obtained by fitting oftheoretical analysis in equations (1) and (2). In the experimentand calculation, the pair-type bundle fiber with core diameterof 0.5mm is used while the focal length, radius and heightof concave mirror are fixed at 6, 6 and 1.5mm, respectively.The positive and negative portions in Figure 4 show thesituation where sensor probe is moving farer and closer,respectively, towards the concave mirror. As shown in Figure 4,there are six linear slopes in the displacement response andfour of them are located in the vicinity of u ¼ 2f which is afunction of the concave mirror focal length as described inequation (1). The results comparison made in Figure 5 arenormalized in both displacement and output power. Fromequation (2), the displacement is normalized by 2u/rd. In thissensor, the probe is located as close as possible to the horizontalsurface of concavemirror which results in the receiving fiber notbeing able to collect the reflected light as the sensor probe ismoving to the fringe of concave mirror. Thus, there is a blind
Figure 4 The results comparison of theoretical and experiment in x-axis
–1.6 3.4 8.4 13.4
Displacement (mm)
x-axis
Theory
1.2
1
0.8
0.6
0.4
0.2
0
Nor
mal
ized
out
put
Figure 3 Experimental setup for the proposed FODS with a concavemirror
He-Ne laser
Modulator
Silicondetector
Lock-inamplifier
RS232PC
Picoelectric motor
Concave mirror
Chopper
Figure 5 The results comparison of theoretical and experiment in y-axis
0 0.2 0.4 0.80.6 0.10 0.12
Normalized displacement
y-axis
Theory
1.2
1
0.8
0.6
0.4
0.2
0
Nor
mal
ized
out
put
Concave mirror-based fiber optic displacement sensor
H.Z. Yang, S.W. Harun and H. Ahmad
Sensor Review
Volume 31 · Number 1 · 2011 · 65–69
67
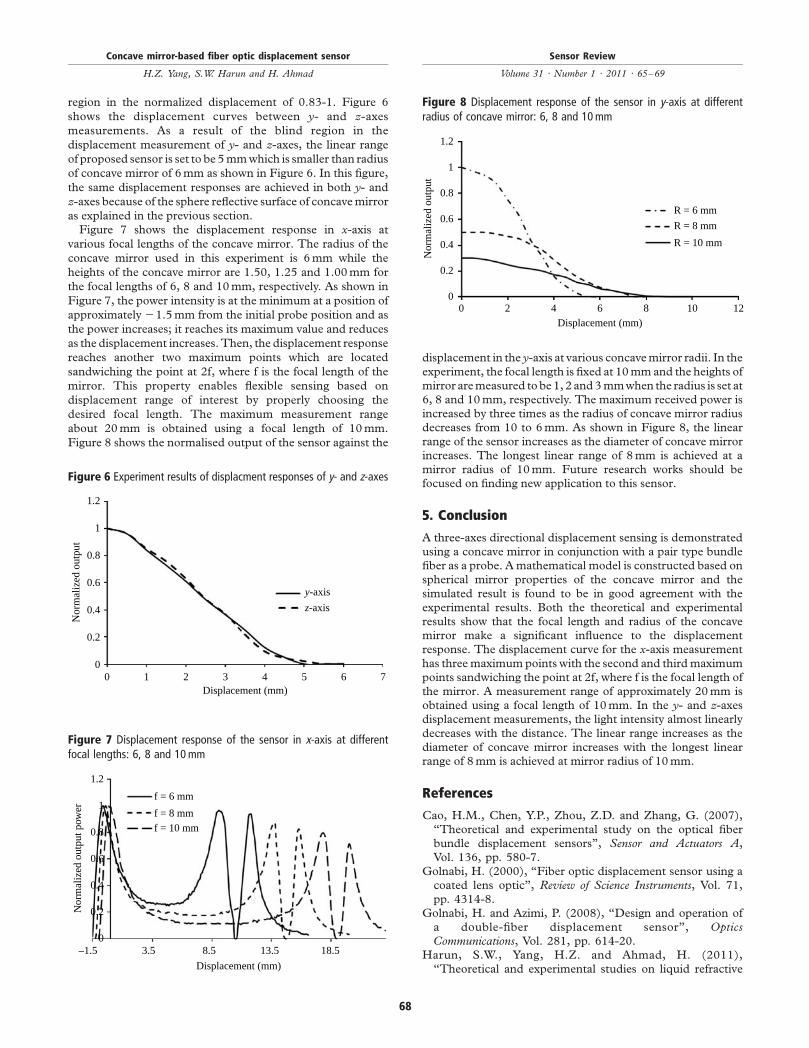
region in the normalized displacement of 0.83-1. Figure 6
shows the displacement curves between y- and z-axes
measurements. As a result of the blind region in the
displacement measurement of y- and z-axes, the linear range
of proposed sensor is set to be 5mmwhich is smaller than radius
of concave mirror of 6mm as shown in Figure 6. In this figure,
the same displacement responses are achieved in both y- and
z-axes because of the sphere reflective surface of concavemirror
as explained in the previous section.Figure 7 shows the displacement response in x-axis at
various focal lengths of the concave mirror. The radius of the
concave mirror used in this experiment is 6mm while the
heights of the concave mirror are 1.50, 1.25 and 1.00mm for
the focal lengths of 6, 8 and 10mm, respectively. As shown in
Figure 7, the power intensity is at the minimum at a position of
approximately 21.5mm from the initial probe position and as
the power increases; it reaches its maximum value and reduces
as the displacement increases. Then, the displacement response
reaches another two maximum points which are located
sandwiching the point at 2f, where f is the focal length of the
mirror. This property enables flexible sensing based on
displacement range of interest by properly choosing the
desired focal length. The maximum measurement range
about 20mm is obtained using a focal length of 10mm.
Figure 8 shows the normalised output of the sensor against the
displacement in the y-axis at various concavemirror radii. In the
experiment, the focal length is fixed at 10mmand the heights ofmirror aremeasured tobe1, 2 and3mmwhen the radius is set at6, 8 and 10mm, respectively. The maximum received power isincreased by three times as the radius of concave mirror radiusdecreases from 10 to 6mm. As shown in Figure 8, the linear
range of the sensor increases as the diameter of concave mirrorincreases. The longest linear range of 8mm is achieved at amirror radius of 10mm. Future research works should befocused on finding new application to this sensor.
5. Conclusion
A three-axes directional displacement sensing is demonstratedusing a concave mirror in conjunction with a pair type bundlefiber as a probe. Amathematical model is constructed based onspherical mirror properties of the concave mirror and the
simulated result is found to be in good agreement with theexperimental results. Both the theoretical and experimentalresults show that the focal length and radius of the concavemirror make a significant influence to the displacementresponse. The displacement curve for the x-axis measurement
has threemaximumpoints with the second and thirdmaximumpoints sandwiching the point at 2f, where f is the focal length ofthe mirror. A measurement range of approximately 20mm isobtained using a focal length of 10mm. In the y- and z-axesdisplacement measurements, the light intensity almost linearly
decreases with the distance. The linear range increases as thediameter of concave mirror increases with the longest linearrange of 8mm is achieved at mirror radius of 10mm.
References
Cao, H.M., Chen, Y.P., Zhou, Z.D. and Zhang, G. (2007),“Theoretical and experimental study on the optical fiberbundle displacement sensors”, Sensor and Actuators A,Vol. 136, pp. 580-7.
Golnabi, H. (2000), “Fiber optic displacement sensor using acoated lens optic”, Review of Science Instruments, Vol. 71,pp. 4314-8.
Golnabi, H. and Azimi, P. (2008), “Design and operation ofa double-fiber displacement sensor”, OpticsCommunications, Vol. 281, pp. 614-20.
Harun, S.W., Yang, H.Z. and Ahmad, H. (2011),“Theoretical and experimental studies on liquid refractive
Figure 6 Experiment results of displacment responses of y- and z-axes
0 1 2 3 4 5 6 7Displacement (mm)
y-axis
z-axis
1.2
1
0.8
0.6
0.4
0.2
0
Nor
mal
ized
out
put
Figure 7 Displacement response of the sensor in x-axis at differentfocal lengths: 6, 8 and 10 mm
–1.5 3.5 8.5 18.513.5
Displacement (mm)
f = 6 mm
f = 8 mmf = 10 mm
1.2
1
0.8
0.6
0.4
0.2
0
Nor
mal
ized
out
put p
ower
Figure 8 Displacement response of the sensor in y-axis at differentradius of concave mirror: 6, 8 and 10 mm
0 2 4 6 8 10 12Displacement (mm)
R = 6 mm
R = 8 mm
R = 10 mm
1.2
1
0.8
0.6
0.4
0.2
0
Nor
mal
ized
out
put
Concave mirror-based fiber optic displacement sensor
H.Z. Yang, S.W. Harun and H. Ahmad
Sensor Review
Volume 31 · Number 1 · 2011 · 65–69
68
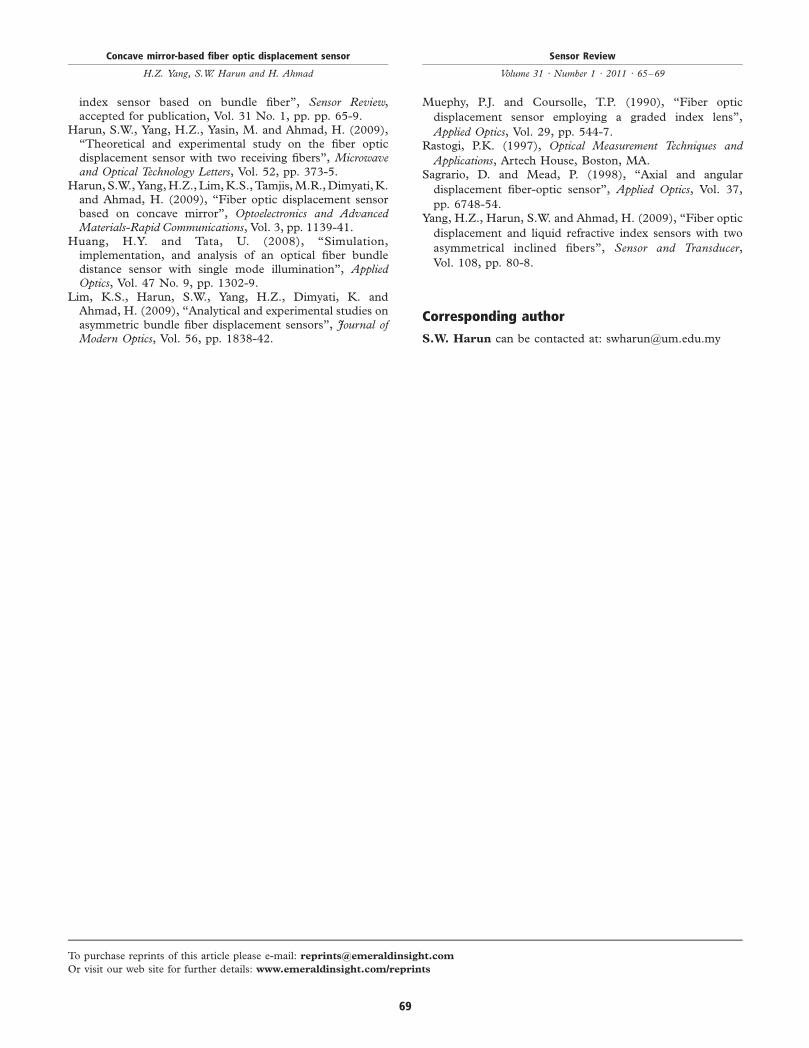
index sensor based on bundle fiber”, Sensor Review,accepted for publication, Vol. 31 No. 1, pp. pp. 65-9.
Harun, S.W., Yang, H.Z., Yasin, M. and Ahmad, H. (2009),“Theoretical and experimental study on the fiber opticdisplacement sensor with two receiving fibers”, Microwaveand Optical Technology Letters, Vol. 52, pp. 373-5.
Harun, S.W.,Yang,H.Z., Lim,K.S.,Tamjis,M.R.,Dimyati,K.and Ahmad, H. (2009), “Fiber optic displacement sensorbased on concave mirror”, Optoelectronics and AdvancedMaterials-Rapid Communications, Vol. 3, pp. 1139-41.
Huang, H.Y. and Tata, U. (2008), “Simulation,implementation, and analysis of an optical fiber bundledistance sensor with single mode illumination”, AppliedOptics, Vol. 47 No. 9, pp. 1302-9.
Lim, K.S., Harun, S.W., Yang, H.Z., Dimyati, K. andAhmad, H. (2009), “Analytical and experimental studies onasymmetric bundle fiber displacement sensors”, Journal ofModern Optics, Vol. 56, pp. 1838-42.
Muephy, P.J. and Coursolle, T.P. (1990), “Fiber optic
displacement sensor employing a graded index lens”,
Applied Optics, Vol. 29, pp. 544-7.Rastogi, P.K. (1997), Optical Measurement Techniques and
Applications, Artech House, Boston, MA.Sagrario, D. and Mead, P. (1998), “Axial and angular
displacement fiber-optic sensor”, Applied Optics, Vol. 37,
pp. 6748-54.Yang, H.Z., Harun, S.W. and Ahmad, H. (2009), “Fiber optic
displacement and liquid refractive index sensors with two
asymmetrical inclined fibers”, Sensor and Transducer,
Vol. 108, pp. 80-8.
Corresponding author
S.W. Harun can be contacted at: [email protected]
Concave mirror-based fiber optic displacement sensor
H.Z. Yang, S.W. Harun and H. Ahmad
Sensor Review
Volume 31 · Number 1 · 2011 · 65–69
69
To purchase reprints of this article please e-mail: [email protected]
Or visit our web site for further details: www.emeraldinsight.com/reprints
Sensors & Transducers Journal, Vol. 108, Issue 9, September 2009, pp. 80-88
80
SSSeeennnsssooorrrsss &&& TTTrrraaannnsssddduuuccceeerrrsss
ISSN 1726-5479© 2009 by IFSA
http://www.sensorsportal.com
Fiber Optic Displacement and Liquid Refractive Index Sensors with Two Asymmetrical Inclined Fibers
1H. Z. Yang, 2S. W. Harun and 1H. Ahmad
1Photonics Research Center, University of Malaya 50603 Kuala Lumpur, Malaysia 2Dept. of Electrical Engineering, University of Malaya, 50603 Kuala Lumpur, Malaysia
E-mail: [email protected]
Received: 22 June 2009 /Accepted: 21 September 2009 /Published: 28 September 2009 Abstract: Fiber optic displacement sensor (FODS) with two asymmetrical inclined fibers is studied theoretically and experimentally. A liquid refractive index sensor (LRIS) is then demonstrated using the similar sensor set-up. The theoretical result of the FODS is in good agreement with the experimental result, verifying the feasibility of our theoretical model. The performance of FODS is strongly depended on core radius and diameter of fibers used as well as inclination angle of two asymmetrical fiber core. The maximum sensitivities of 0.2752, 0.3759 and 0.7286 mV/µm are obtained at inclination angles of 10°, 20° and 30°, respectively. Meanwhile, the maximum linear ranges of 10.4 mm, 7 mm and 3 mm are obtained at inclination angles of 10°, 20° and 30°, respectively. The proposed LRIS produces the highest output different for increase in refractive index at displacement of 3.3 mm. At this distance, the output intensity increases almost linearly as a function of refractive index of the medium. Copyright © 2009 IFSA. Keywords: Fiber-optic displacement sensor, Liquid refractive index sensor, Fiber-optic sensor 1. Introduction Intensity modulation is one of the important methods that is normally used for displacement measurement in conjunction with multimode fiber. The fiber optic displacement sensor (FODS) has inherited many advantages such as virtues of simplicity, reliability and low cost [1]. To date, many works have been reported on the intensity modulation based FODS [2-5], which the probe consists of a pair of fibers used for transmitting and receiving the light. For instance, Buchade, et. al. [4] presented a FODS using two fibers inclined with a same angular angle and reported the sensitivity was enhanced compared with the conventional sensor with parallel bundled fibers. It also reported that the
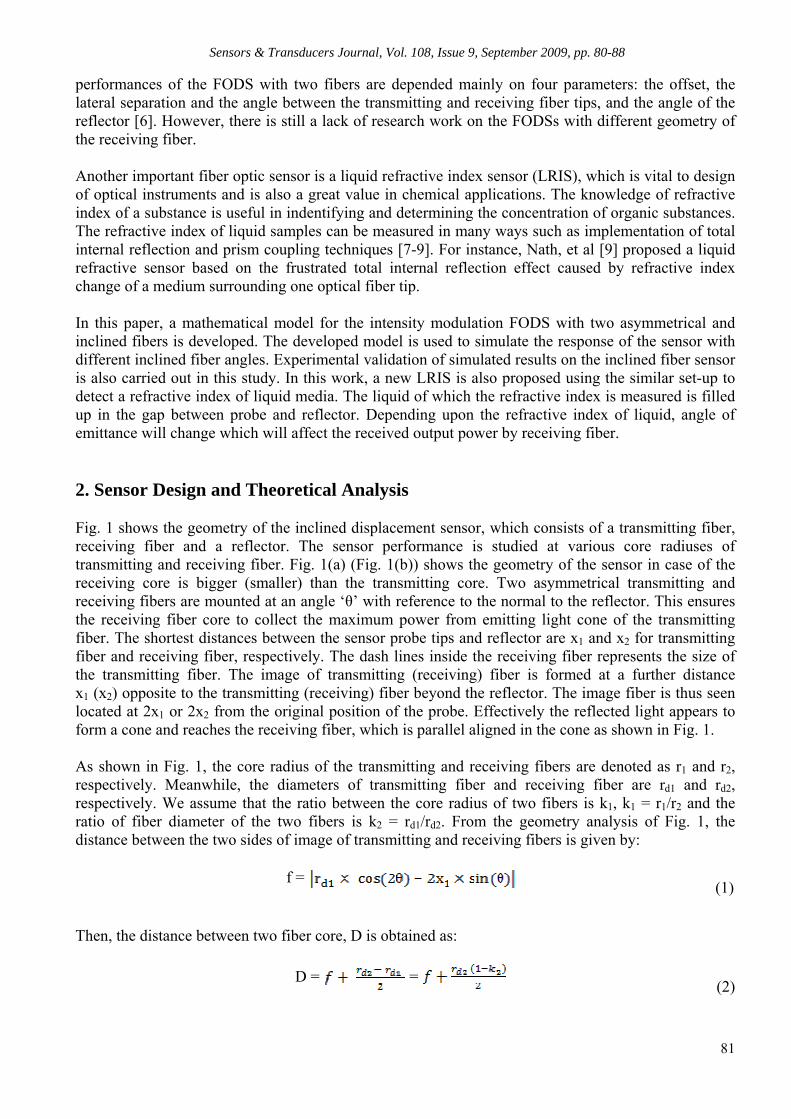
Sensors & Transducers Journal, Vol. 108, Issue 9, September 2009, pp. 80-88
81
performances of the FODS with two fibers are depended mainly on four parameters: the offset, the lateral separation and the angle between the transmitting and receiving fiber tips, and the angle of the reflector [6]. However, there is still a lack of research work on the FODSs with different geometry of the receiving fiber. Another important fiber optic sensor is a liquid refractive index sensor (LRIS), which is vital to design of optical instruments and is also a great value in chemical applications. The knowledge of refractive index of a substance is useful in indentifying and determining the concentration of organic substances. The refractive index of liquid samples can be measured in many ways such as implementation of total internal reflection and prism coupling techniques [7-9]. For instance, Nath, et al [9] proposed a liquid refractive sensor based on the frustrated total internal reflection effect caused by refractive index change of a medium surrounding one optical fiber tip. In this paper, a mathematical model for the intensity modulation FODS with two asymmetrical and inclined fibers is developed. The developed model is used to simulate the response of the sensor with different inclined fiber angles. Experimental validation of simulated results on the inclined fiber sensor is also carried out in this study. In this work, a new LRIS is also proposed using the similar set-up to detect a refractive index of liquid media. The liquid of which the refractive index is measured is filled up in the gap between probe and reflector. Depending upon the refractive index of liquid, angle of emittance will change which will affect the received output power by receiving fiber. 2. Sensor Design and Theoretical Analysis Fig. 1 shows the geometry of the inclined displacement sensor, which consists of a transmitting fiber, receiving fiber and a reflector. The sensor performance is studied at various core radiuses of transmitting and receiving fiber. Fig. 1(a) (Fig. 1(b)) shows the geometry of the sensor in case of the receiving core is bigger (smaller) than the transmitting core. Two asymmetrical transmitting and receiving fibers are mounted at an angle ‘θ’ with reference to the normal to the reflector. This ensures the receiving fiber core to collect the maximum power from emitting light cone of the transmitting fiber. The shortest distances between the sensor probe tips and reflector are x1 and x2 for transmitting fiber and receiving fiber, respectively. The dash lines inside the receiving fiber represents the size of the transmitting fiber. The image of transmitting (receiving) fiber is formed at a further distance x1 (x2) opposite to the transmitting (receiving) fiber beyond the reflector. The image fiber is thus seen located at 2x1 or 2x2 from the original position of the probe. Effectively the reflected light appears to form a cone and reaches the receiving fiber, which is parallel aligned in the cone as shown in Fig. 1. As shown in Fig. 1, the core radius of the transmitting and receiving fibers are denoted as r1 and r2, respectively. Meanwhile, the diameters of transmitting fiber and receiving fiber are rd1 and rd2, respectively. We assume that the ratio between the core radius of two fibers is k1, k1 = r1/r2 and the ratio of fiber diameter of the two fibers is k2 = rd1/rd2. From the geometry analysis of Fig. 1, the distance between the two sides of image of transmitting and receiving fibers is given by: f = (1)
Then, the distance between two fiber core, D is obtained as: D = = (2)
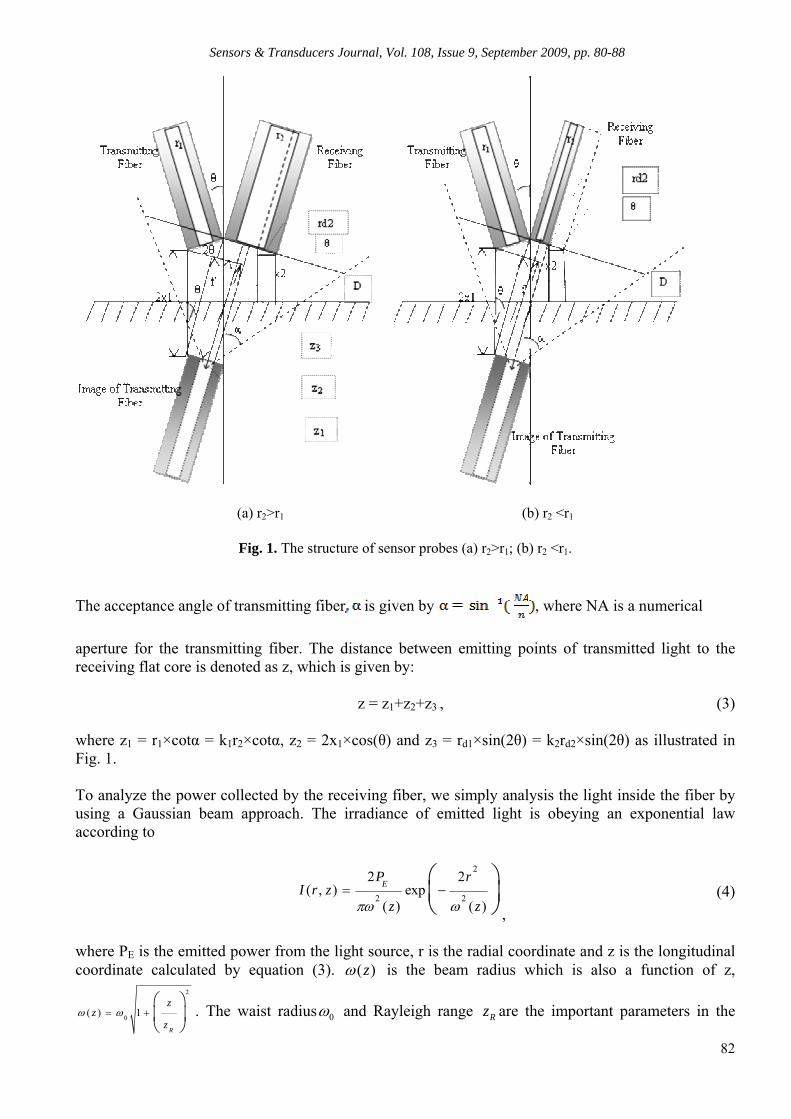
Sensors & Transducers Journal, Vol. 108, Issue 9, September 2009, pp. 80-88
82
(a) r2>r1 (b) r2 <r1
Fig. 1. The structure of sensor probes (a) r2>r1; (b) r2 <r1. The acceptance angle of transmitting fiber is given by , where NA is a numerical
aperture for the transmitting fiber. The distance between emitting points of transmitted light to the receiving flat core is denoted as z, which is given by: z = z1+z2+z3 , (3) where z1 = r1×cotα = k1r2×cotα, z2 = 2x1×cos(θ) and z3 = rd1×sin(2θ) = k2rd2×sin(2θ) as illustrated in Fig. 1. To analyze the power collected by the receiving fiber, we simply analysis the light inside the fiber by using a Gaussian beam approach. The irradiance of emitted light is obeying an exponential law according to 2
2 2
2 2( , ) exp
( ) ( )
EP rI r z
z zπω ω= −
⎛ ⎞⎜ ⎟⎝ ⎠ ,
(4)
where PE is the emitted power from the light source, r is the radial coordinate and z is the longitudinal coordinate calculated by equation (3). ( )zω is the beam radius which is also a function of z,
2
0( ) 1R
zz
zω ω= +
⎛ ⎞⎜ ⎟⎝ ⎠
. The waist radius 0ω and Rayleigh range Rz are the important parameters in the

Sensors & Transducers Journal, Vol. 108, Issue 9, September 2009, pp. 80-88
83
Gaussian Beam function. The optical power received by the receiving fiber can be evaluated by integrating the irradiance, I over the surface area of the receiving fiber end,
(5)
To simulate conveniently, the Equation (5) can be described in other expressions;
(6)
The P(k1,k2, z) is the power collected by the receiving fiber corresponding the parameters k1 and k2. The radial coordinate r is expressed by in Cartesian coordinate system. Fig. 2 illustrates the overlap area of the reflected light area and the core of the receiving fiber. The overlap area is zero at x2 = 0 (Fig. 1(a)) or x1 = 0 (Fig. 1(b)) and at a very small displacement (blind area) where the jacket of the two fibers blocks the reflected light. As the displacement is increased further, the overlap area increases and thus increases the total power collected by the receiving core. The total power is maxima when the reflected light cone covers the entire receiving core area. After that, the received optical power starts to decay exponentially as the displacement continues to increase. The received optical power is strongly dependent on the core size of the receiving fiber. At inclination angle of 2θ between the transmitting and receiving fibers, the distance x1 between the sensor probe tip and reflector is given by [4] (7)
From the geometrical analysis of Fig. 1, the distance x2 is obtained as; x2 = x1- rd3sinθ for rd1< rd2 (Fig. 1 (a)) or x2 = x1+ rd3sinθ for rd1≥ rd2 (Fig. 1(b)) where rd3 = rd2 - rd1. Therefore, the distance between sensor probe tip and reflector mirror can be summarized as; ( rd1> rd2 )
( rd1= rd2 )
( rd1< rd2 ) (8)
(a) rd1< rd2
(b) rd1= rd2
(c) rd1> rd2
Fig. 2. Overlap area view (a) rd1< rd2; (b) rd1= rd2; (c) rd1> rd2.

Sensors & Transducers Journal, Vol. 108, Issue 9, September 2009, pp. 80-88
84
3. Simulation and Experiment The proposed sensor is simulated by using a MATLAB programming. To simplify the analysis, the k1 values of 0.5, 0.667, 1, 1.5 and 2 are used. The k2 value is set based on the availability of the fiber in our laboratory. In this simulation, the k2 values of 0.5, 1 and 2 are used. The wavelength of the laser source λ is set at 594 nm. The numerical aperture values NA1 = 0.27, NA2 = 0.32 and NA3 = 0.4 are used for the core radius of 0.25 mm, 0.5 mm and 0.75 mm, respectively. To verify the simulated results the FODS is constructed by mounting the transmitting and receiving fibers on the plastic board at angle θ with reference to the normal of the reflector. Separate samples with various fiber diameters and core radius are prepared for angle θ = 10o, 20o and 30o. Light from 594 nm He-Ne laser is modulated by an external chopper at frequency of 200 Hz and launched into the transmitting fiber. The light has an average output power of 3.0 mW, beam diameter of 0.75 mm and beam divergence of 0.92 mrads. The length of transmitting and receiving fiber length is approximately 2 m. The transmitting fiber radiates the modulated light from the light source to the target mirror, while the displacement of sensor probe tip between mirror is controlled by a piezoelectric & driver. The reflective light from target mirror, which is mounted in the bottom of tank, is collected by the receiving fiber whose carries the light into the silicon detector. A lock-in amplifier is connected with the detector to reduce the dc drift voltage due to an ambient light. The initial experiment is carried out by varying the inclination angle between the fibers. The liquid of which the refractive index is measured is filled up in the tank for the LRIS application. The experiment setup of the FODS and LRIS is shown in Figure 3.
Fig. 3. Experiment setup of the FODS and LRIS.
4. Result and Discussion Fig. 4 compares the experimental and theoretical plots of the normalized output collected against normalized displacement between probe and reflector with air medium in between. In this study, the ratios k1, k2, and angle θ are set at 0.667, 0.5, 10° respectively. As shown in the figure, the theoretical curve is in good agreement with the experimental curve, verifying the feasibility of our theoretical model. It is also observed that up to 0.3 (0.5) of separation distance for experimental (theoretical)
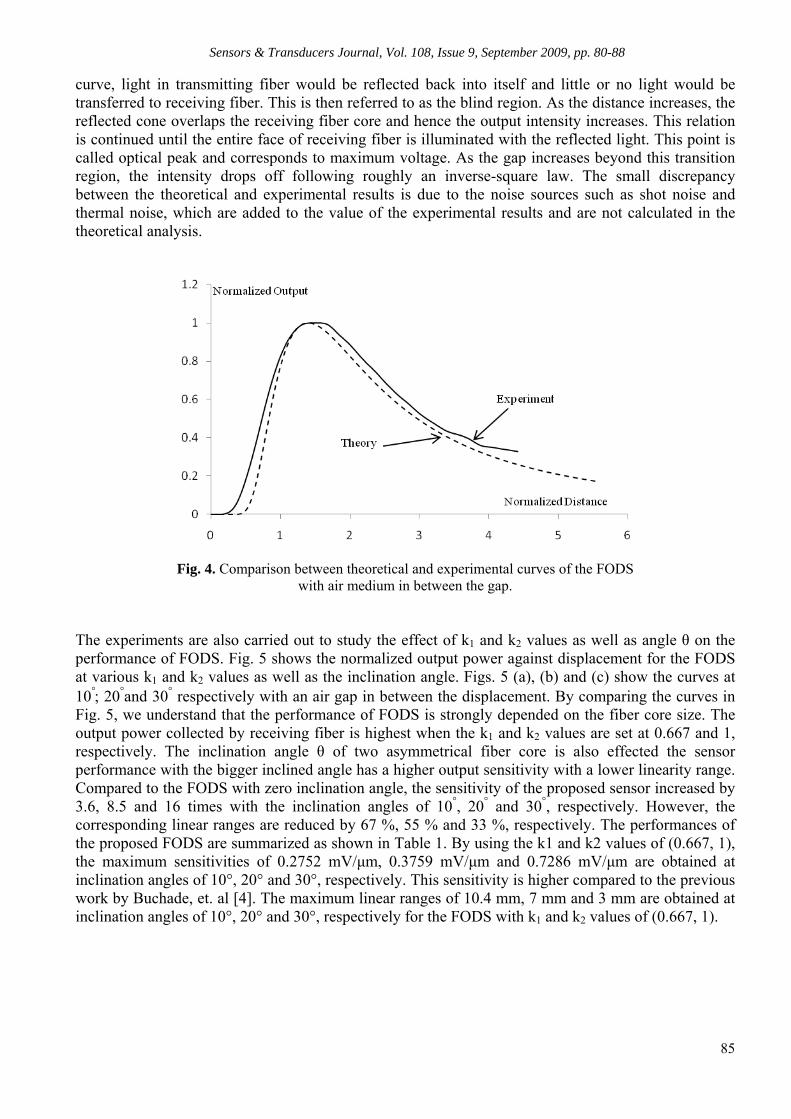
Sensors & Transducers Journal, Vol. 108, Issue 9, September 2009, pp. 80-88
85
curve, light in transmitting fiber would be reflected back into itself and little or no light would be transferred to receiving fiber. This is then referred to as the blind region. As the distance increases, the reflected cone overlaps the receiving fiber core and hence the output intensity increases. This relation is continued until the entire face of receiving fiber is illuminated with the reflected light. This point is called optical peak and corresponds to maximum voltage. As the gap increases beyond this transition region, the intensity drops off following roughly an inverse-square law. The small discrepancy between the theoretical and experimental results is due to the noise sources such as shot noise and thermal noise, which are added to the value of the experimental results and are not calculated in the theoretical analysis.
Fig. 4. Comparison between theoretical and experimental curves of the FODS with air medium in between the gap.
The experiments are also carried out to study the effect of k1 and k2 values as well as angle θ on the performance of FODS. Fig. 5 shows the normalized output power against displacement for the FODS at various k1 and k2 values as well as the inclination angle. Figs. 5 (a), (b) and (c) show the curves at 10°; 20°and 30° respectively with an air gap in between the displacement. By comparing the curves in Fig. 5, we understand that the performance of FODS is strongly depended on the fiber core size. The output power collected by receiving fiber is highest when the k1 and k2 values are set at 0.667 and 1, respectively. The inclination angle θ of two asymmetrical fiber core is also effected the sensor performance with the bigger inclined angle has a higher output sensitivity with a lower linearity range. Compared to the FODS with zero inclination angle, the sensitivity of the proposed sensor increased by 3.6, 8.5 and 16 times with the inclination angles of 10°, 20° and 30°, respectively. However, the corresponding linear ranges are reduced by 67 %, 55 % and 33 %, respectively. The performances of the proposed FODS are summarized as shown in Table 1. By using the k1 and k2 values of (0.667, 1), the maximum sensitivities of 0.2752 mV/µm, 0.3759 mV/µm and 0.7286 mV/µm are obtained at inclination angles of 10°, 20° and 30°, respectively. This sensitivity is higher compared to the previous work by Buchade, et. al [4]. The maximum linear ranges of 10.4 mm, 7 mm and 3 mm are obtained at inclination angles of 10°, 20° and 30°, respectively for the FODS with k1 and k2 values of (0.667, 1).

Sensors & Transducers Journal, Vol. 108, Issue 9, September 2009, pp. 80-88
86
(a) at 10° angle
(a) at 20° angle
(c) at 30° angle
Fig. 5. The normalized output power against displacement for the FODS at various k1 and k2 values with different inclination angles (a) 10°; (b) 20° and (c) 30°.
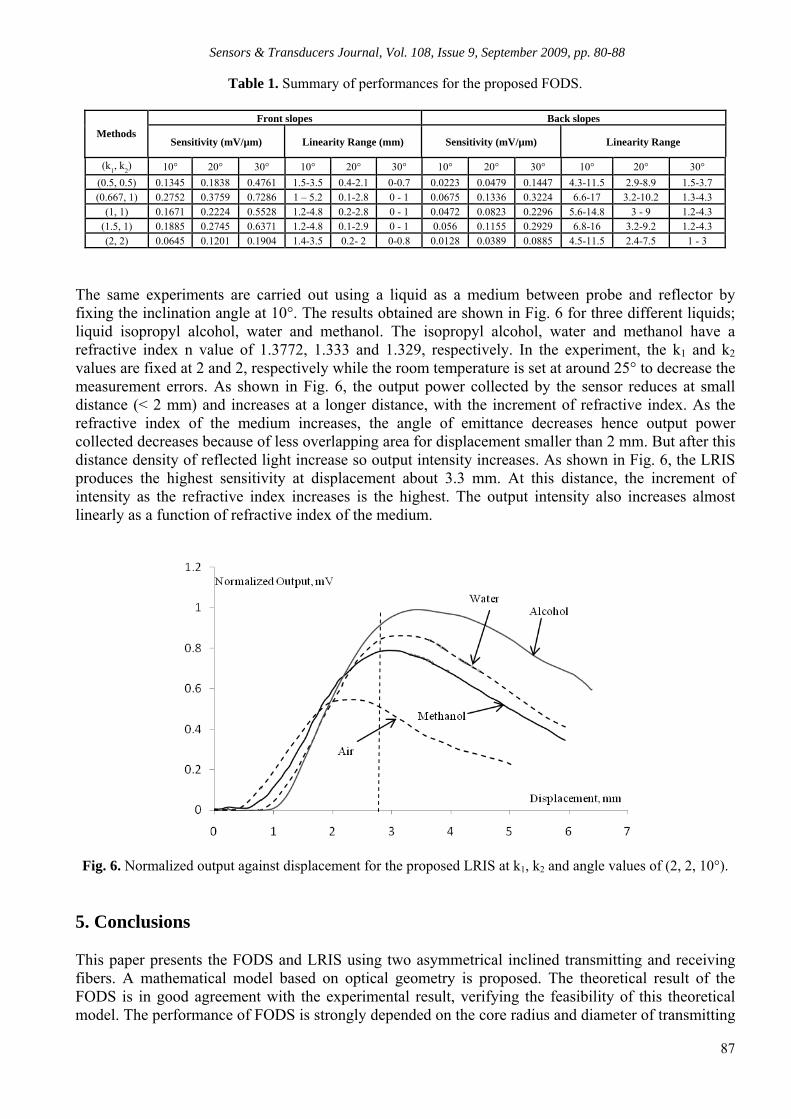
Sensors & Transducers Journal, Vol. 108, Issue 9, September 2009, pp. 80-88
87
Table 1. Summary of performances for the proposed FODS.
Front slopes Back slopes Methods
Sensitivity (mV/µm) Linearity Range (mm) Sensitivity (mV/µm) Linearity Range (k1, k2) 10° 20° 30° 10° 20° 30° 10° 20° 30° 10° 20° 30°
(0.5, 0.5) 0.1345 0.1838 0.4761 1.5-3.5 0.4-2.1 0-0.7 0.0223 0.0479 0.1447 4.3-11.5 2.9-8.9 1.5-3.7(0.667, 1) 0.2752 0.3759 0.7286 1 – 5.2 0.1-2.8 0 - 1 0.0675 0.1336 0.3224 6.6-17 3.2-10.2 1.3-4.3
(1, 1) 0.1671 0.2224 0.5528 1.2-4.8 0.2-2.8 0 - 1 0.0472 0.0823 0.2296 5.6-14.8 3 - 9 1.2-4.3(1.5, 1) 0.1885 0.2745 0.6371 1.2-4.8 0.1-2.9 0 - 1 0.056 0.1155 0.2929 6.8-16 3.2-9.2 1.2-4.3(2, 2) 0.0645 0.1201 0.1904 1.4-3.5 0.2- 2 0-0.8 0.0128 0.0389 0.0885 4.5-11.5 2.4-7.5 1 - 3
The same experiments are carried out using a liquid as a medium between probe and reflector by fixing the inclination angle at 10°. The results obtained are shown in Fig. 6 for three different liquids; liquid isopropyl alcohol, water and methanol. The isopropyl alcohol, water and methanol have a refractive index n value of 1.3772, 1.333 and 1.329, respectively. In the experiment, the k1 and k2 values are fixed at 2 and 2, respectively while the room temperature is set at around 25° to decrease the measurement errors. As shown in Fig. 6, the output power collected by the sensor reduces at small distance (< 2 mm) and increases at a longer distance, with the increment of refractive index. As the refractive index of the medium increases, the angle of emittance decreases hence output power collected decreases because of less overlapping area for displacement smaller than 2 mm. But after this distance density of reflected light increase so output intensity increases. As shown in Fig. 6, the LRIS produces the highest sensitivity at displacement about 3.3 mm. At this distance, the increment of intensity as the refractive index increases is the highest. The output intensity also increases almost linearly as a function of refractive index of the medium.
Fig. 6. Normalized output against displacement for the proposed LRIS at k1, k2 and angle values of (2, 2, 10°).
5. Conclusions This paper presents the FODS and LRIS using two asymmetrical inclined transmitting and receiving fibers. A mathematical model based on optical geometry is proposed. The theoretical result of the FODS is in good agreement with the experimental result, verifying the feasibility of this theoretical model. The performance of FODS is strongly depended on the core radius and diameter of transmitting
Sensors & Transducers Journal, Vol. 108, Issue 9, September 2009, pp. 80-88
88
and receiving fibers as well as the inclination angle. The maximum sensitivities of 0.2752 mV/µm, 0.3759 mV/µm and 0.7286 mV/µm are obtained at inclination angles of 10°, 20° and 30°, respectively for the proposed FODS. Meanwhile, the maximum linear ranges of 10.4 mm, 7 mm and 3mm are obtained at inclination angles of 10°, 20° and 30°, respectively. For the LRIS, the output intensity increases almost linearly as a function of refractive index of the medium at displacement angle of 3.3 mm. References [1]. P. K. Rastogi, Optical Measurement Techniques and Applications, Artech House, Inc., Boston, London,
1997. [2]. J. B. Faria, A theoretical analysis of the bifurcated fiber bundle displacement sensor, IEEE Transactions on
instrumentation and measurement, Vol. 47, 1998, pp. 742-747. [3]. H. M. Cao, Y. P. Chen, Z. D. Zhou, G. Zhang, Theoretical and experimental study on the optical fiber
bundle displacement sensors, Sensor and Actuators A, Vol. 136, 2007, pp. 580-587. [4]. P. B. Buchade and A. D. Shaligram, Simulation and experimental studies of inclined two fiber
displacement sensor, Sensor and Actuators A, Vol. 128, 2006, pp. 312- 316. [5]. P. B. Buchade and A. D. Shaligram, Influence of fiber geometry on the performance of two-fiber
displacement sensor, Sensor and Actuators A, Vol. 136, 2007, pp. 199- 204. [6]. F. E. Utou, J. Gryzagoridis and B. Sun, Parameters affecting the performance of fiber optic displacement
sensors, Smart Mater. Struct., Vol. 15, 2006, pp. 154-157. [7]. B. E. Nottingk, Instrumentation Reference Book, 2nd Edition, Butterworths, London, 1995. [8]. V. Kleizal and J. Verkelis, Some Advanced Fiber-Optic Amplitude Modulated Reflection Displacement
and Refractive Index Sensors, Nonlinear Analysis: Modeling and Control, Vol. 12, No. 2, 2007, pp. 213–225.
[9]. P. Nath, H. K. Singh, P. Datta and K. C. Sarma, All-fiber optic sensor for measurement of liquid refractive index, Sensor and Actuators A, Vol. 148, 2008, pp. 16-18.
___________________ 2009 Copyright ©, International Frequency Sensor Association (IFSA). All rights reserved. (http://www.sensorsportal.com)