appendix a – engineering methodology, environmental ... · pdf filecore capacity transit...
TRANSCRIPT
Core Capacity Transit Study Page A1 of A25
Appendix A – Engineering Methodology,Environmental Engineering, and Permitting
Introduction Methodology
This appendix presents the details of the engineering analyses completed to prepare theTechnical Memorandum. Alignment engineering, environmental engineering, tunnelingengineering, and geotechnical engineering disciplines provided input to the analysis of landingsand corridors. The engineering analyses examined the locations of landings for the fivecategories of rail geometry, geotechnical conditions, environmental risks, constructability risks,and construction impacts. That table was presented in the main text. Then, the analysesfocused on selected horizontal and vertical alignments within the corridors to examine potentialfatal flaws with a San Francisco Bay (Bay) crossing.
This appendix presents the regional setting for the study, then our compilation and commentaryon geotechnical data and the regulatory environment. It then presents details associated withthe two considered tunnel technologies, immersed tube tunnel (ITT) and mined tunnel.
Study AreaSince the scope of the initial engineering studies is only related to a new transbay tunnel,stakeholder agencies were limited to Bay Area Rapid Transit (BART) and regional and state railproviders.
The study area considered in this memo is limited to crossings of the Bay and approximatelyone block inland on each side of the Bay. The vicinity of the study area is shown on Figure A1.In San Francisco, landing sites from Fisherman’s Wharf to Pier 70 were considered. In the EastBay, landing sites from Emeryville to Alameda Island were considered. The onshore alignmentcomponent of each landing was checked for its viability considering existing development andplanned transit lines, but the development of onshore alignments is beyond the scope of thistask.
As presented in the main text of this memorandum, landings SF-1 through SF-11 were definedfor San Francisco. In the East Bay, landings EMY-1, OAK-1 through OAK-3, and ALA-A throughALA-C were defined. North, central, and south corridors were defined to group the potentiallandings. Alignments BART 1 through BART 4, Rail 1, and BART & Rail Combined were definedconnecting the most promising landings. The engineering used to select the promising landingsand examine the alignments is described in this Appendix.

Core Capacity Transit Study Page A2 of A25
Figure A1. Study area comprises the shorelines of San Francisco and Oakland/Alameda and pointsbetween.
Core Capacity Transit Study Page A3 of A25
Environmental and Engineering Overview Rail Geometry Constraints on Landings
Rail and BART alignments have been considered. Horizontal and vertical alignment geometriesare introduced in the main text of this memorandum. The cross sections showing the verticalalignments are included at the end of this appendix.
A2.1.1 Rail
It is assumed that any new rail connection across the Bay must tie into the Transbay TransitCenter (TTC) and/or 4th and King Streets. A transbay connection that ties in south of theDowntown Extension (DTX) would have major limitations on service and operational scenarios.This assumption constrains a rail crossing landing to north of Mission Creek and south of theTTC.
A2.1.2 BART
BART is generally considered to land in San Francisco and run predominantly East-West alongroadway corridors, although many landings could also accommodate North-South orientedalignments as noted.
BART running north-south through downtown San Francisco allows a possible connection onthe waterfront near Pier 23; however, this location would only practically serve a connection onthe East Bay in Emeryville or Berkeley. A north-south alternative can serve 3rd Street viaLanding SF-6, but this corridor is heavily constrained by the Mission Rock development to thesouth, historic 3rd Street Bridge, and AT&T Park piles to the east.
Environmental SettingThe following sections identify select agencies through which permits will likely be necessary.Engagement early on in the project planning can reduce the risk of permitting delays. Thissection introduces some of the requirements and risks associated with the major permittingprocess that would be required for a crossing. Details associated with permitting of the ITToption or the mined tunnel option are discussed in those respective sections. Our discussion ofthe permitting details assumes that a full environmental impact study and report will be procuredfor the potential alignments as design advances.
The Dredged Material Management Office (DMMO) would have the most involvement in an ITToption. The ITT would require permitting through the DMMO, which is a joint program of severalstakeholder agencies. The DMMO requirements, concerns with large-scale dredging operationsin the Bay, and sediment quality (hazardous materials) are discussed in the ITT section of thisappendix. Onshore in San Francisco, the Maher Ordinance would likely be a consideration forany excavation for tunnel boring machine retrieval pit or transition structure. Maher zones areshown in Figure A2 below indicating the widespread coverage of fill in eastern San Francisco.While excavations in these areas is commonplace, they typically encounter materials thatrequire disposal and handling as potentially hazardous material.
Although not a part of the DMMO, other stakeholders would likely include the Cities of SanFrancisco, Oakland, and Alameda. These stakeholders would likely have other permitrequirements such as grading permits, building permits, etc., all of which would have associatedfees.

Core Capacity Transit Study Page A4 of A25
A2.2.1 Maher Zone Requirements for San Francisco Landings
In 1986, the San Francisco Board of Supervisors adopted an ordinance to address concernsassociated with the exposure of workers and the general public to hazardous materials aftercontaminated soil was discovered during several construction projects in San Francisco. Theseprojects were mainly located in areas that were previously coves or shoreline that had beenfilled to create new land or used for disposal of earthquake debris after the 1906 Earthquake.Former Supervisor Bill Maher took the lead on preparing a bill to address the issue and thus, theMaher Ordinance (formally Article 20 of the San Francisco Public Works Code and now,Article 22A of the San Francisco Health Code) came to existence.
The ordinance was developed to assess the potential for the presence of hazardous levels ofcontaminants in the fill material beneath a proposed development and if concentrations of thesecontaminants presented a potential risk to workers or the general public. Additionally, testingrequired under the ordinance addresses the issue of material quality relative to California Codeof Regulations, Title 22 waste disposal requirements, as elevated concentrations of metals andother organic compounds often require material for disposal be classified as hazardous wasteunder Title 22.
Properties with potential subsurface chemical contamination that require a grading or buildingpermit are likely to be regulated under Article 22A of the San Francisco Health Code andArticle 106A.3.4.2 of the San Francisco Building Code. The Maher Ordinance requires soil andgroundwater analysis for a specified list of organic and inorganic chemical constituents andcovers areas with: 1) Current or historical industrial use or zoning: 2) Areas within 100 feet ofcurrent or historical underground tanks: 3) Filled former Bay, marsh, or creek areas and:4) Areas within 150 feet of a current or former elevated highway. Sites and areas covered perthe Maher Ordinance are shown on Figure A2as shaded areas.
San Francisco Public Health (SFPH) implements the Maher Program jointly with San FranciscoPlanning (SFP) and the San Francisco Building Inspection (SFBI). Efforts are made to maintaincommunication among the San Francisco agencies. SFP and/or SFBI perform an initialenvironmental review or permit review of projects submitted to that department. If applicable,SFP or SFBI requires a project proponent to contact SFPH and enter in the Maher OrdinanceProgram. SFPH copies SFBI and the SFP on review letters. A project proponent may also applyto the Maher Program directly by submitting the Maher Program application and fee to theSFPH.
Properties with known or potential chemical contamination outside the current Maher area maybe administratively added to Maher or SFPH may oversee the project per the San FranciscoVoluntary Remedial Action Program.
The San Francisco Voluntary Remedial Action Program is authorized per State authority in theCalifornia Health and Safety Code Sections 101480-101490. Health and Safety Code Sections101480 through 101483 establish a cleanup oversight program which allows a local healthagency to supervise the remedial action taken at a site, set up cleanup goals at a site, and issuea letter or other document that certifies that the cleanup goals have been met.
All of the potential landings on the San Francisco side of the study will be subject to governanceunder Article 22A.
Implementing the Maher Ordinance can be expensive as the required analyses prescribed inthe Article are numerous and expensive. Additionally, the results of the Article 22A study mayreveal high material disposal costs based on the degree of material impact from contaminantsand the potential for the classification of the material as hazardous waste under state or federallaw for disposal purposes.

Core Capacity Transit Study Page A5 of A25
Figure A2. Maher zones in San Francisco – areas where fill soils contain potentially contaminatedmaterials.
Core Capacity Transit Study Page A6 of A25
Geotechnical and Geological SettingThe history of infrastructure in the Bay Area is closely tied to the challenging geotechnicalconditions. Compressible clays, reclaimed land constructed without compaction, and regularseismic activity mean that a wealth of geotechnical studies are available for San Francisco andAlameda counties. For this study, we have avoided detailed evaluation of ground conditions andinstead employed some key references that provide approximate conditions of the stratigraphyof the Bay and the near-shore margins. The information included in the following documentswas used to develop the geotechnical and geological discussions in this memorandum:
Harding Lawson Associates (HLA) and others’ Liquefaction Study: North Beach,Embarcadero Waterfront, South Beach, and Upper Mission Creek Area, San Francisco,California (1992)
Hitchcock and Helley’s Characterization of Subsurface Sediments, Southern San FranciscoBay Area (2003)
documents prepared for Caltrans by Earth Mechanics, Inc. and Fugro for the San Francisco-Oakland Bay Bridge East Span Seismic Safety Project
documents prepared for the original transbay tube by Parsons, Brinkerhoff, Quade, andDouglas (1965)
Bruce E. Ross’s Pleistocene History of San Francisco Bay along the Southern Crossing(1977)
regional geology maps prepared for the USGS
Note that this list is not exhaustive. Many additional geotechnical documents were reviewed inthe course of compiling this study and are included as references at the end of thismemorandum.
The Bay Area is prone to earthquake shaking from several active tectonic faults (San Andreas,Hayward-Rodgers Creek, and others); however, as defined by the Alquist-Priolo maps, none ofthese directly cross the study area, defined as the area between the potential landing points ofthe corridors on each side of the Bay. The potential for severe ground shaking is of concern andcontributes to the qualitative evaluation of potential corridors and landing areas. Seismic slopeinstability of dredged or natural slopes, lateral spreading of reclaimed land, and liquefactionhave the largest potential to affect the study area. Site-specific studies of these phenomena arebeyond the scope of this study, but the slopes and strata of concern are illustrated in Figure A3below from the 1965 geotechnical study for the existing transbay tube.

Core Capacity Transit Study Page A7 of A25
Figure A3. Interpreted Geotechnical Cross Sections of the Existing Transbay Tube Alignment across SanFrancisco Bay (from Parsons Brinkerhoff Quade and Douglas 1965).
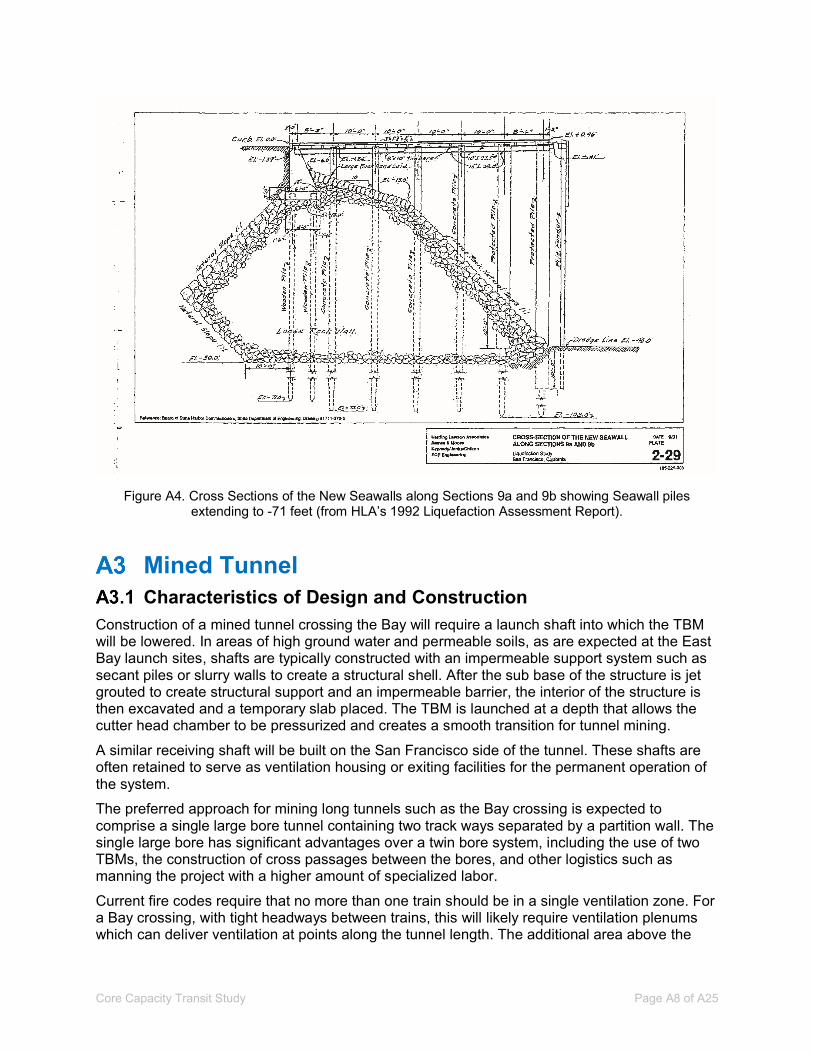
Existing geotechnical infrastructure should also be noted for its information relevant to proposedcorridors and landings. According to the report by HLA, the San Francisco Seawall (Seawall)was built between 1874 and 1924. It extends 2-1/3 miles from Fisherman’s Wharf to Pier 50 andfacilitated the infilling of eastern San Francisco. The Seawall generally comprises a rock-fillembankment constructed in a 45-foot-deep dredged channel, through which piles were driven tosupport a concrete quay wall. A sketch of Section 9a and 9b of the Seawall, constructed alongthe Embarcadero approximately between Howard Street and Main Street has been providedfrom HLA’s report as Figure A4. It indicates the piles are tipped at 71 feet below mean sea level.These may be of concern to alignment options that will pass under or through the Seawall.
Core Capacity Transit Study Page A8 of A25
Figure A4. Cross Sections of the New Seawalls along Sections 9a and 9b showing Seawall pilesextending to -71 feet (from HLA’s 1992 Liquefaction Assessment Report).
Mined Tunnel Characteristics of Design and Construction
Construction of a mined tunnel crossing the Bay will require a launch shaft into which the TBMwill be lowered. In areas of high ground water and permeable soils, as are expected at the EastBay launch sites, shafts are typically constructed with an impermeable support system such assecant piles or slurry walls to create a structural shell. After the sub base of the structure is jetgrouted to create structural support and an impermeable barrier, the interior of the structure isthen excavated and a temporary slab placed. The TBM is launched at a depth that allows thecutter head chamber to be pressurized and creates a smooth transition for tunnel mining.
A similar receiving shaft will be built on the San Francisco side of the tunnel. These shafts areoften retained to serve as ventilation housing or exiting facilities for the permanent operation ofthe system.
The preferred approach for mining long tunnels such as the Bay crossing is expected tocomprise a single large bore tunnel containing two track ways separated by a partition wall. Thesingle large bore has significant advantages over a twin bore system, including the use of twoTBMs, the construction of cross passages between the bores, and other logistics such asmanning the project with a higher amount of specialized labor.
Current fire codes require that no more than one train should be in a single ventilation zone. Fora Bay crossing, with tight headways between trains, this will likely require ventilation plenumswhich can deliver ventilation at points along the tunnel length. The additional area above the
Core Capacity Transit Study Page A9 of A25
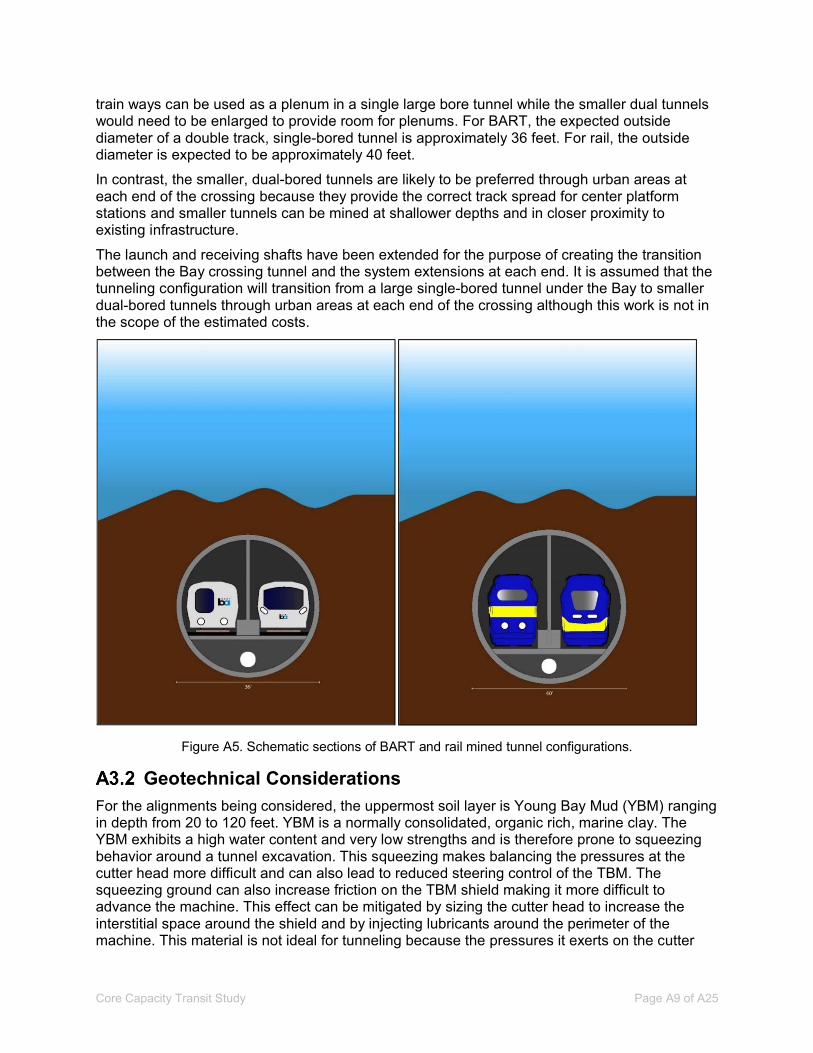
train ways can be used as a plenum in a single large bore tunnel while the smaller dual tunnelswould need to be enlarged to provide room for plenums. For BART, the expected outsidediameter of a double track, single-bored tunnel is approximately 36 feet. For rail, the outsidediameter is expected to be approximately 40 feet.
In contrast, the smaller, dual-bored tunnels are likely to be preferred through urban areas ateach end of the crossing because they provide the correct track spread for center platformstations and smaller tunnels can be mined at shallower depths and in closer proximity toexisting infrastructure.
The launch and receiving shafts have been extended for the purpose of creating the transitionbetween the Bay crossing tunnel and the system extensions at each end. It is assumed that thetunneling configuration will transition from a large single-bored tunnel under the Bay to smallerdual-bored tunnels through urban areas at each end of the crossing although this work is not inthe scope of the estimated costs.
Figure A5. Schematic sections of BART and rail mined tunnel configurations.
Geotechnical ConsiderationsFor the alignments being considered, the uppermost soil layer is Young Bay Mud (YBM) rangingin depth from 20 to 120 feet. YBM is a normally consolidated, organic rich, marine clay. TheYBM exhibits a high water content and very low strengths and is therefore prone to squeezingbehavior around a tunnel excavation. This squeezing makes balancing the pressures at thecutter head more difficult and can also lead to reduced steering control of the TBM. Thesqueezing ground can also increase friction on the TBM shield making it more difficult toadvance the machine. This effect can be mitigated by sizing the cutter head to increase theinterstitial space around the shield and by injecting lubricants around the perimeter of themachine. This material is not ideal for tunneling because the pressures it exerts on the cutter
Core Capacity Transit Study Page A10 of A25
head are highly variable. The vertical alignments have been set with a minimum cover ofapproximately two tunnel diameters to avoid it to the extent possible.
Very generally, underlying the YBM is Old Bay Clay (OBC), associated with older marine andalluvial deposition. This layer is over-consolidated with significantly higher undrained shearstrengths than the YBM. The stratigraphy underlying the YBM toward the east side of the Baytransitions from marine deposited clays to alluvial sands and clays that are typically dense andstiff. In most near-shore areas, fill soils have been placed to reclaim areas or raise gradesabove the shoreline mud flats. Fill soils generally are considered potentially liquefiable, arepotentially contaminated from previous site uses, and are of varying consistency. The YBMunderlies the fill in many areas. The older alluvial deposits and OBC are conducive to tunnelmining because the material is relatively homogeneous, firm, and exhibits low to moderateabrasion which is important for long tunnels where maintenance of the wearing surface can bedifficult. The schematic alignments shown in the attachments indicate tunnels constructed in theOBC layer or generally soil below the YBM.
Environmental Risks and PermittingThe launch and retrieval pits would require construction permits on-land, but typical operationswill not require engagement of permitting through the DMMO. The mining spoils would requireoffhaul and disposal, though the volume of excavated material is smaller for a mined tunnel thanan immersed tube. A maintenance and emergency rescue plan would be required should atunnel boring machine require extraordinary maintenance or repair while beneath the Bay. Thatplan would likely be coordinated with the DMMO and other stakeholders.
ConstructabilitySite access and nearby laydown areas are important to an efficient mining effort. The East Baylaunch locations appear to provide adequate area for construction operations. Alameda Island isnot ideal for off haul and tunnel liner segment delivery by road since trucks would have to passthrough residential areas and cross a bridge or tunnel for highway access. Barge access maybe preferable for moving materials and nearby sites appear to have the potential to serve asloading docks for this project.
Risks for construction and likely mitigations include the following:
high water inflow rates for the permeable sands at the East Bay launch sites
jet grouting of the granular material to reduce permeability
cutter head wear during mining requiring maintenance access to the cutter head chamber
select pre-determined locations favorable to maintenance
unanticipated ground conditions under the Bay
perform extensive geotechnical investigations for the alignment
man-made obstacles such as piles and sunken ships near the San Francisco landing area
coffer dams near the San Francisco shoreline could be used to access and clearobstructions
Core Capacity Transit Study Page A11 of A25
Immersed Tube Tunnel Characteristics of Design and Construction
This study considered ITTs carrying the following:
two BART tracks
two heavy rail tracks
two BART plus two rail tracks for a total of four tracks
In each case, the same construction process would be followed.
A trench would be dredged in the Bay floor to receive the tunnel. This would be approximately35 feet deep with side slopes of 1:1.5 – 1:3 (vertical:horizontal) depending on local conditions.The Bay floor is composed of soft mud, so the dredging process would not require excavation ofrock. Dredged material would be loaded onto barges for disposal offsite. A bedding layer 3 to5 feet deep would be applied to the bottom of the trench to support the tunnel segments.
Concurrently with the dredging operation, tunnel segments would be constructed in acasting/fabrication yard. For the purpose of this study, it has been assumed that concrete wouldbe used for the tunnel segments, but steel would also be considered. Joints between segmentswould have to be designed to ensure any predicted movement could be accommodated. Aftercasting watertight bulkheads are installed at both ends of each segment. Once the segmentsare ready for floating, the casting yard is flooded and the segments floated. The yard should belocated close to the shore, preferably close to deep water.
The segments would then be floated into position assisted by barges. The buoyancy would beadjusted by ballast and the segments be lowered into position within the dredged trench andplaced against the previous segment. The segments are pulled together with the aid of jacksand the water pressure acting on the free end helps to push the segment together resulting in awatertight seal. The water trapped between the bulkheads is then pumped out.
Engineering fill would be placed to the sides of the tunnel to provide lateral support and lock thetunnel in place. Finally backfill material would be placed over the tunnel to protect the tunnel andto prevent uplift.
Tunnel LayoutSeparate tubes would be provided for each track with dimensions to accommodate theoperating requirements of each operator’s rolling stock. BART tubes would be sized inaccordance with BART Facilities Standards and rail tubes in accordance with the DTX designcriteria.
A longitudinal ventilation system would likely be most efficient in dealing with smoke from largefires; however, this would limit the number of trains within each ventilation zone, potentiallyimpacting headways and operational efficiency. A point extract system with motorized dampersin the tunnels would allow the two dampers flanking the incident to be opened to contain smokebetween the open dampers.
A utility corridor could be provided within the envelope of the tunnel allowing any ancillaryequipment or utilities to be carried in addition to the running tubes.

Core Capacity Transit Study Page A12 of A25
A4.2.1 Two track
A two-track tunnel would have an external dimension of approximately 48 feet wide withseparate tubes for each track. A utility and tunnel ventilation plenum would be provided betweenthe running tubes. Doors would be provided at regular intervals to allow egress of passengersfrom one tunnel to the other in case of emergency evacuation.
For BART the height from top of rail to tunnel roof would be 13 feet. A width of 16.5 feet for eachbox would be provided which includes an allowance for a walkway on the inside of the tracksadjacent to the dividing wall. External dimensions of the tube would be approximately 40 feetwide by 23 feet tall.
For rail tracks the height from top of rail to tunnel roof would be 21 feet. A width of 17.5 feet foreach box would be provided which includes an allowance for a walkway on the inside of thetracks adjacent to the dividing wall. External dimensions of the tube would be approximately40 feet wide by 31 feet tall.
Figure A6. Two-track immersed tube construction schematic.
A4.2.2 Four track
A four-track tunnel would have an external dimension of approximately 57 feet wide withseparate tubes for each track. A utility and tunnel ventilation plenum would be provided betweenthe rail running tubes and above the BART running tubes. Doors would be provided at regularintervals to allow egress of passengers from one tunnel to the other in case of emergencyevacuation.
For BART the height from top of rail to tunnel roof would be 13 feet and for rail the height wouldbe 21.5 feet. Widths equivalent to the tunnels described above would be provided. Externaldimensions of the tube would be 80 feet wide by 31 feet tall.

Core Capacity Transit Study Page A13 of A25
Figure A7. Four-track immersed tube construction schematic.
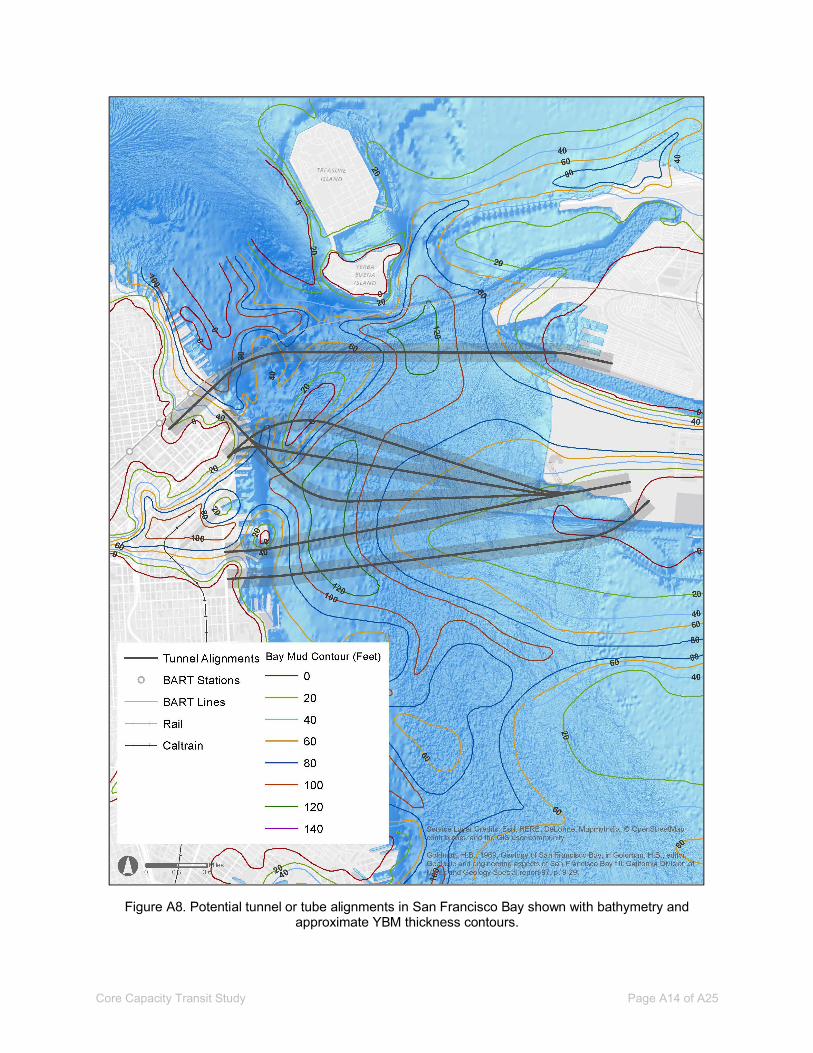
Geotechnical ConsiderationsAs discussed for the mined tunnel options, generally the Bay soil stratigraphy includes YBMoverlying OBC or alluvial sands. The topography of the Bay floor generally slopes toward SanFrancisco to depths on the order of 75 feet below the water surface. The YBM thickness canvary from 0 to 20 feet thick near Alameda to over 120 feet thick near San Francisco. As a result,any immersed tube would be dredged in YBM and in some areas, into its underlying strata. Asshown in Figure A8 below, the YBM near the Alameda Naval Air Station (NAS) is on the order of20 feet thick, meaning the trench dredging for the immersed tube would extend into theunderlying, relatively dense, Merritt Sands deposit.
Core Capacity Transit Study Page A14 of A25
Figure A8. Potential tunnel or tube alignments in San Francisco Bay shown with bathymetry andapproximate YBM thickness contours.
Core Capacity Transit Study Page A15 of A25
The natural grades of the near-shore Bay are sufficient to develop a seismically-induced lateralspreading condition where thicknesses of fill material have been placed to reclaim land. Thisincludes areas of Alameda and Mission Bay in San Francisco. Much of this fill was placedhydraulically or otherwise with little compactive effort and could be graded zonally, resulting inpockets of liquefaction and differential strains. The resulting instability could affect transitionstructures and immersed tubes, and require ground improvement mitigation. Generally, themined tunnel option would be less susceptible to damage associated with lateral spreading orshallow slope instability.
In some areas of the Bay, the YBM has been dredged to form steep slopes, such as forshipping channels or existing ports and wharf facilities. These facilities and the existing BARTTransbay Tube have been evaluated by others for performance during seismic conditions, but anew cut or modification of the TBM topography should consider these existing facilities.
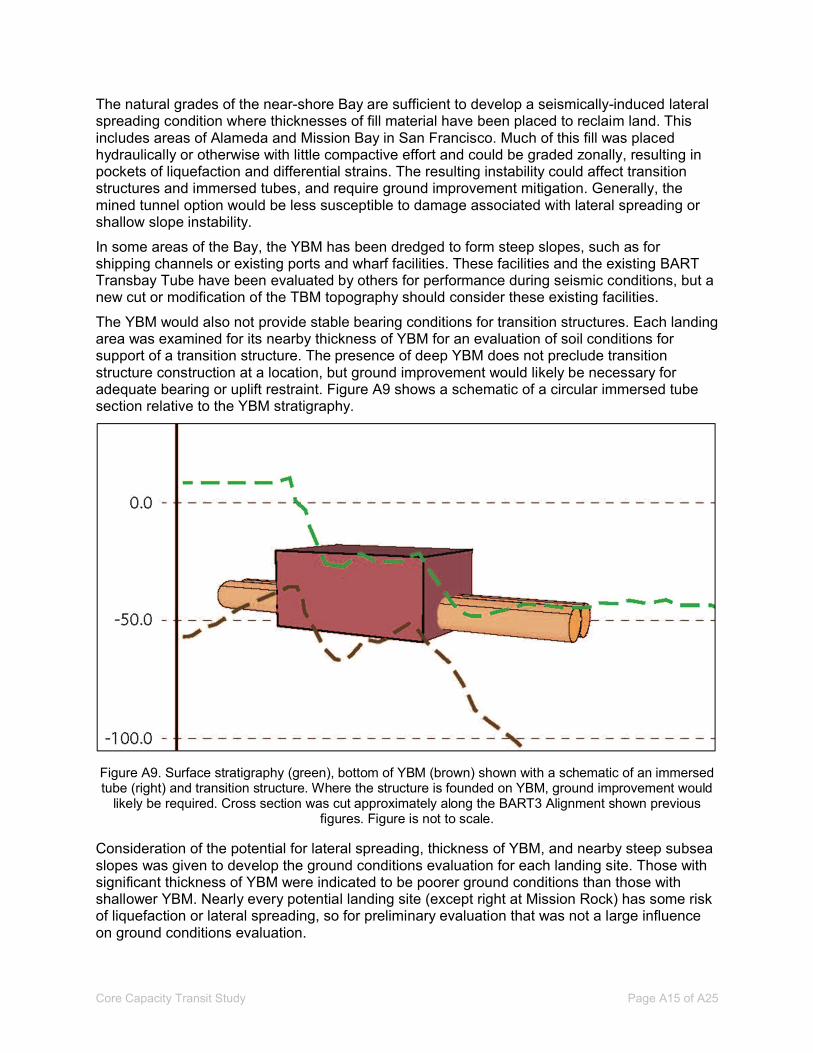
The YBM would also not provide stable bearing conditions for transition structures. Each landingarea was examined for its nearby thickness of YBM for an evaluation of soil conditions forsupport of a transition structure. The presence of deep YBM does not preclude transitionstructure construction at a location, but ground improvement would likely be necessary foradequate bearing or uplift restraint. Figure A9 shows a schematic of a circular immersed tubesection relative to the YBM stratigraphy.
Figure A9. Surface stratigraphy (green), bottom of YBM (brown) shown with a schematic of an immersedtube (right) and transition structure. Where the structure is founded on YBM, ground improvement would
likely be required. Cross section was cut approximately along the BART3 Alignment shown previousfigures. Figure is not to scale.
Consideration of the potential for lateral spreading, thickness of YBM, and nearby steep subseaslopes was given to develop the ground conditions evaluation for each landing site. Those withsignificant thickness of YBM were indicated to be poorer ground conditions than those withshallower YBM. Nearly every potential landing site (except right at Mission Rock) has some riskof liquefaction or lateral spreading, so for preliminary evaluation that was not a large influenceon ground conditions evaluation.

Core Capacity Transit Study Page A16 of A25
Environmental Risks and PermittingThe environmental risks and permitting associated with large-scale dredging in the Bay wouldrequire significant investment of time procuring the permits (on the order of 2 years).Environmental risks include the potential for encountering contaminated soils, or unexpectedstratigraphy. These risks would be managed by extensive subsurface investigation prior tocompletion of design, but are not well constrained at this early stage.
Disposal of the dredged material is a significant cost. The YBM cannot be easily reused as fillfor other projects, and would require drying before offhaul to a landfill. Ongoing conventionaldredging operations for Bay Area port facilities disposes of the dredged material in smaller,more manageable volumes. For a large-scale operation such as the immersed tubeconstruction, dredged materials will likely require offhaul to a deep ocean disposal siteapproximately 55 miles offshore, which increases costs.
A4.4.1 DMMO Stakeholder Requirements
The Dredged Material Management Office (DMMO) was founded through the Long TermManagement Strategy for the Placement of Dredged Material in the San Francisco Bay Regionprogram, the DMMO is a joint program comprising the following member agencies:
U.S. Army Corps of Engineers, San Francisco District (USACE);
The U.S. Environmental Protection Agency, Region IX (US EPA);
The California Environmental Protection Agency (Cal EPA) San Francisco Bay RegionalWater Quality Control Board (RWQCB);
The San Francisco Bay Conservation and Development Commission (BCDC); and
The California State Lands Commission (SLC).
Although not member agencies, the California Department of Fish and Wildlife (CDFW)(formerly California Department of Fish and Game, U.S. Fish and Wildlife Service (USFWS),and the National Marine Fisheries Service (NMFS) participate in the DMMO and the ProjectCoordination Meetings as commenting resources agencies.
The permitting process for a project of this magnitude to be constructed in the San FranciscoBay would likely take a minimum of two years to complete and possibly longer. The processwould require the applicant to prepare a single permit application for submission through theDMMO. The DMMO would then schedule an inter-agency meeting that would likely include thefollowing agencies:
USACE
BCDC
RWQCB
US EPA
CDFW
USFWS
NMFS
United States Coast Guard (USCG)
San Francisco Bar Pilots

Core Capacity Transit Study Page A17 of A25
Individual agency permits would be issued by RWQCB (Water Quality Certification), BCDC(Major Permit), and CDFW (Streambed Alteration Permit). Given the magnitude of the project itis anticipated that a full Environmental Impact Statement document would be required tosupport project approval and the permitting process. This would include all of the special studiesrequired to support permitting and consultation through the DMMO. This is anticipated to be acostly process and will likely require a minimum of two years to complete.
Construction Mitigation Monitoring
As a condition of permit there would likely be several construction mitigation measures thatwould have to be followed for both dredging and construction. These would likely includemeasures to mitigate the mobilization of suspended sediments away from the working areas(construction of silt fences) and water quality monitoring which may include total suspendedsolids, turbidity, etc. If mitigation monitoring indicates mitigation measures are ineffective atmitigating potential impacts, construction may have to cease and mitigation measures may haveto be revised. This could have cost and schedule implications for the project.
Eel Grass
Eelgrass is an important part of the San Francisco Bay aquatic system as a habitat forcommercially important and endangered fish as well as other aquatic fauna. Eelgrass provideswater cleansing through filtration action and helps stabilize sediment in the San Francisco Baythrough root action.
Dredging as well as other near-shore development activities have affected the eelgrass habitatsand as such, these habitat areas have been identified as areas of concern for impact. In 2014,the National Oceanic and Atmospheric Administration and the National Marine Fisheries Servicedeveloped the California Eelgrass Mitigation Policy and Implementing Guidelines that provideguidance for impact minimization which may include mitigation measures such as limitingturbidity, light reduction, and sediment loading as well as seeding or transplanting in the case ofunavoidable impacts or takes. As a condition of permit, regulatory agencies will typically requirepre- and post-project surveys to identify the presence of eelgrass at or in the vicinity of a projectarea in order to mitigate potential impacts to the eelgrass ecosystem.
A4.4.2 Endangered Species Act - Section 7 Consultation
The Endangered Species Act (ESA) directs all federal agencies to work to conserveendangered and threatened species and to use their authorities to further the purposes of theAct. Section 7 of the Act, called "Interagency Cooperation," is the mechanism by which federalagencies ensure the actions they take, including those they fund or authorize, do not jeopardizethe existence of any listed species.
Under Section 7, federal agencies must consult with the U.S. Fish and Wildlife Service(USFWS) when any action the agency carries out, funds, or authorizes (such as through apermit) may affect a listed endangered or threatened species. This process usually begins as aninformal consultation. A federal agency, in the early stages of project planning, approaches theUSFWS and requests informal consultation. Discussions between the two agencies may includewhat types of listed species may occur in the proposed action area and what effect theproposed action may have on those species.
If after discussions with the USFWS the agency determines that the proposed action is not likelyto affect any listed species in the project area and if the USFWS concurs, the informalconsultation is complete and the proposed project moves ahead. If it appears that the agency’saction may affect a listed species, that agency may then prepare a biological assessment toassist in its determination of the project’s effect on a species.

Core Capacity Transit Study Page A18 of A25
When a federal agency determines, through a biological assessment or other review, that itsaction is likely to adversely affect a listed species, the agency submits to the USFWS a requestfor formal consultation. During formal consultation, the USFWS and the agency shareinformation about the proposed project and the species likely to be affected. Formal consultationmay last up to 90 days, after which the USFWS will prepare a biological opinion on whether theproposed activity will jeopardize the continued existence of a listed species. The USFWS has 45days after completion of formal consultation to write the opinion.
In making a determination on whether an action will result in jeopardy, the USFWS begins bylooking at the current status of the species or "baseline." Added to the baseline are the variouseffects — direct, indirect, interrelated, and interdependent — of the proposed federal action. TheUSFWS also examines the cumulative effects of other non-federal actions that may occur in theaction area, including state, tribal, local, or private activities that are reasonably certain to occurin the project area.
The USFWS’s analysis is then measured against the definition of jeopardy. Under the ESA,jeopardy occurs when an action is reasonably expected, directly or indirectly, to diminish aspecies’ numbers, reproduction, or distribution so that the likelihood of survival and recovery inthe wild is appreciably reduced.
When the USFWS makes a jeopardy determination, it also provides the consulting federalagency with reasonable and prudent alternative actions. These alternatives are often developedwith input and assistance from the federal agency. Alternatives must:
be consistent with the purpose of the proposed project;
be consistent with the federal agency’s legal authority and jurisdiction;
be economically and technically feasible; and
in the Service’s opinion, avoid jeopardy.
In some cases, the USFWS finds that an action may adversely affect a species, but notjeopardize its continued existence. When this happens, the USFWS prepares an incidental takestatement for the proposed project. Under most circumstances, the ESA prohibits take, which isdefined as harming (which includes killing) or harassing a listed species. Incidental take — takethat results from an action but is not the purpose of the action — may be allowed when theUSFWS approves it through an incidental take statement. The statement includes the amount orextent of anticipated take due to the action, reasonable and prudent measures to minimize thetake, and terms and conditions that must be observed when implementing those measures.
After the USFWS issues its biological opinion, the federal agency then decides how to proceed.With an opinion that determines adverse effects, the agency can adopt the reasonable andprudent measures outlined in an incidental take statement and proceed with the project. If theUSFWS makes a jeopardy determination the federal agency has several options:
implement one of the reasonable and prudent alternatives
modify the proposed project and consult again with the Service
decide not to undertake (or fund, or authorize) the project
disagree with the opinion and proceed
apply for an exemption
A federal agency may apply for an exemption if it believes it cannot comply with therequirements of the biological opinion. The application is considered by the Endangered

Core Capacity Transit Study Page A19 of A25
Species Committee, comprised of Cabinet-level members from various federal agencies andadministered by the Interior Department’s Assistant Secretary for Policy, Management, andBudget. To be considered by the Committee for an exemption, a federal agency must havecarried out the consultation in good faith and made a reasonable effort to develop and considermodifications or alternatives to the proposed action. It must also have conducted any requiredbiological assessment and refrained from making any irreversible or irretrievable commitment ofresources to the project during consultation.
The Section 7 Consultation could be a time-consuming process depending on the availability ofrequired endangered species study information and whether that data exists at the time of theconsultation or if it needs to be generated to support the consultation.
Sediment QualityA4.5.1 Available Data over Study Area
As part of the Core Capacity Study, The CCTS team identified the following potential sources ofsediment data:
Dredge Material Management Office (DMMO)
San Francisco Bay Regional Monitoring Program
Port of San Francisco Maintenance Dredging Sampling and Analysis Reports (SARs)
Port of Oakland Maintenance Dredging SARs
San Francisco District United States Army Corps of Engineers’ Federal ChannelMaintenance Dredging SARs
Based on a review of the information contained in the DMMO database and discussions withDMMO staff, there is limited sediment data available for areas of San Francisco Bay that areoutside of active dredging projects (i.e., the data is specific and was generated to supportspecific dredging projects).
A4.5.2 Data Gaps
As part of the permit process the project will have to develop its own Dredging SAR for theselected alignment(s) of the immersed tube. This will require the collection and analysis ofrepresentative sediment samples over the width and length of the proposed submersed tubealignment to assess sediment quality so a determination of the proposed sediment managementmethod can be developed.
Dredge Material Disposal OptionsA4.6.1 In-Bay Disposal
In-Bay disposal of sediments occurs at four designated aquatic disposal sites locatedthroughout the San Francisco Bay. These include the Alcatraz Island Disposal Site, the SanPablo Bay Disposal Site, the Carquinez Strait Disposal Site, and the Suisun Bay Disposal Site.The LTMS Management Plan adopted in 2001 stipulated the reduction of in-Bay disposal usinga series of reductions taking place over four, three year “step-down” periods ending in 2012.Beginning in 2013 the disposal of sediments at in-Bay locations is limited to 1.25 million cubicyards per year, a 48 percent decrease over the annual pre-2000 in-Bay disposal volume.
Core Capacity Transit Study Page A20 of A25
A4.6.2 Beneficial Reuse
Sediment dredged from San Francisco Bay may be beneficially reused for a variety of purposessuch as wetland creation, levee maintenance, or construction fill. Substantial capacity forbeneficial reuse still exists, but the distance of beneficial reuse sites from the majority of thedredging activity and the need for dredging projects to provide offloading equipment at certainsites remain challenges in providing economical reuse options. Existing beneficial reuse sitesinclude the Montezuma Wetlands Restoration Project (regulated by Water Board OrderNo. R2-2012-0089), the Cullinan Ranch Restoration Project (regulated by Board OrderNo. R2-2010-0108), and Winter Island levee maintenance. At their own discretion, dredgingcontractors or the project sponsors may propose to use other permitted upland locations. Allnecessary environmental documentation must be completed for a site prior to it receiving anydredged material.
A4.6.3 Deep Ocean Disposal Site
Ocean disposal for Bay-dredged material occurs at the San Francisco Deep Ocean DisposalSite, approximately 55 miles (48 nautical miles) west of the Golden Gate and thus beyond thethree nautical mile offshore limit of Water Board jurisdiction. Under the federal MarineProtection, Research, and Sanctuary Act, the EPA must concur with disposal at the SanFrancisco Deep Ocean Disposal Site.
A4.6.4 Landfill Disposal
In some extreme cases sediment sampling and analysis in near shore areas has indicated thatdredged sediments are not suitable for in-Bay disposal, beneficial reuse, or deep oceandisposal due to high concentrations of chemical contaminants (e.g., coal tar waste [dense non-aqueous phase liquid] from former manufactured gas plants) present in the sediment. In thesecases the sediments, if dredged, may have to be processed for disposal in a landfill. Thistypically requires a certain amount of dewatering and drying of the sediments in order to allowfor landfilling. This can add significantly to the already expensive cost of landfill disposal.
A4.6.5 Landfill Use (Alternative Daily Cover)
Another potential beneficial use of dredged sediment is for use as alternative daily cover foractive landfills that must cover the burial face of the landfill daily. However, as with the landfillingoption, the material is required to be dried to a certain degree for use thus making this a morecostly disposal option.
Constructability and Cost ConsiderationsA4.7.1 Construction and Staging
The critical activities in the construction of an ITT would be dredging in the Bay and thecasting/fabrication of the tunnel elements. A large yard would be required, likely in Alameda,with good access for material delivery. Road access through Alameda Island is limited andwould require construction traffic to go through residential neighborhoods. Barge access couldbe utilized for some deliveries.
The yard would require a large, flat area that could be flooded to allow the floating of tunnelsegment and gates to allow access to the Bay once floated. This would likely be constructedwithin the footprint of the existing island to avoid additional construction within the Bay.
Alternately, the fabrication yard could be in other areas of the West Coast or overseasdepending on final construction cost considerations.
Core Capacity Transit Study Page A21 of A25
Approximately 3 to 4 m cubic yards of dredging would be required for the two-track BARToption. This is approximately equivalent to the volume of material dredged within the Bay in asingle year. The dredged material would be disposed of either on land in existing sites ordumped greater than 50 miles out to sea. In either case the dredged material would be removedby water rather than by road. A proportion of the dredged material would be classified ascontaminated. This would require disposal in certified facilities and would attract a considerablyhigher disposal cost. For analysis purposes, it has been assumed that 15% of excavatedmaterial would be contaminated.
Each of the ITT alignments would require a crossing of the Trans Bay Cable, a high voltage DCsubmarine cable buried approximately 6 feet below the Bay floor. The cable, owned bySteelRiver Infrastructure Partners, was constructed in 2010. The cable could be spliced andpotentially relocated to accommodate an ITT crossing. This would have to be carefully plannedto minimize the impacts of down time and compensation would be payable to the owners and/oroperators.
A4.7.2 Cost Variations
Based on the general assumptions stated in this section, a two-track immersed tube tunnelwould cost approximately 40% more for BART and 60% more for conventional rail, than theequivalent 2-track mined tunnel. A 4-track ITT crossing containing 2- tracks of BART serviceand 2-tracks of rail service in the same structure would cost approximately 15% less than twoseparate ITT structures and 30% more than 2 separate, 2-track mined tunnels.
These cost differentials only consider the core bay crossing tunnels and landing/transitionstructures that would be associated with tunnel construction. On-shore tunnel extensions andnew stations will have different relative cost profiles based on construction methodology.
Limitations and References Limitations
This study did not examine some significant aspects of the future construction environment.These factors include:
Climate change/sea level rise: Local predictions range, but regional agencies seem to beconsidering average estimates on the order of 11 inches by 2050 and nearly 3 feet by 2100.Station/guideway entrances, vent structures, and equipment would all need to be designedto accommodate these levels plus any additional factors due to increased storm activity.There are studies by SPUR and others in progress now looking at protection schemes forMission Bay and Mission Creek specifically. The Central and Southern Embarcadero is alsoparticularly vulnerable to sea level rise. Alameda Point has similar vulnerabilities, but thesecould be mitigated thought proper design.
San Francisco Sewall: The condition of the seawall running from Pier 43 to Pier 50 is beingassessed by the Port and targeted improvement measures are being proposed. Tunnelingunder this structure would need to be analyzed to ensure that activities would not underminethe rock dyke core or other components. It is assumed that these issues could be overcomewith proper design.
Mission Bay Development Coordination: Continues development in Mission Bay, includingthe proposed mixed use developments of Mission Rock, the Warrior Arena, and Pier 70,

Core Capacity Transit Study Page A22 of A25
which are all in various stages of approval and funding. The ability to plan some of thefoundation, street, and coastal design elements in these major developments could vastlyimprove the future viability of rail transit service in the corridors.
San Francisco Public Utilities Commission Central Bayside Tunnel: The possible plannednew tunnel on Indiana Street or other corridors could impact the corridors and viability.
DTX/Railyards Study: The ongoing DTX and Railyards Study by the CCSF will be completedin 2016 and may inform future project and corridor planning decisions, especially as relatedto DTX and rail service to 4th and King/Townsend and TTC. New development opportunitiesassociated with some of the options being studied could also change the value capture ofcertain BART alignments through Mission Bay or south SOMA.
Reference StandardsThe guiding standards used for BART and heavy rail geometric design are BART FacilitiesStandards (BFS) version 3.0 and the DTX Design Criteria produced for TTC version 1.0.
The DTX standard generally represents a combination of Caltrain and CHSR standards, withthe most onerous condition being assumed in each case. For comparison, Caltrain and CHSRstandards were also reviewed to ensure applicability.
Critical CriteriaKey geometric criteria from the reference standards are listed in Table A1.
Criteria BART DTX
Horizontal Radius Minimum 1,000 feet 1,070 feet
Absolute Minimum N/A 650 feet*
Gradient Maximum 3.0% 1.0%
Absolute Maximum 4.0% 2.0%
Superelevation Maximum 6 inches 3 inches
Absolute Maximum 8 ¼ inches 4 inches
UnbalanceSuperelevation
Maximum 2.75 inches 3 inches
Absolute Maximum 4.5 inches 4 inchesTable A1: Key Geometric criteria
* An absolute minimum radius of 500 feet is stated in version 1.0 of the DTX Design Criteria, butin future work an absolute minimum radius of 650 feet was used. 650 feet was assumed for thecurrent study.
ReferencesAllstate Geotechnical Services. June 1986. Geotechnical Investigation, Southeast Outfall
System Modifications, San Francisco, California.
Arup. [May 2005]. [ARUP_DTX_Borings].
Arup. [February 2009]. [Proposed_DTX_Loop].
Core Capacity Transit Study Page A23 of A25
Arup. [September 2015]. [Tunnel_Alignments_dgn_Polyline].
Arup. [August 2015]. [Landing_Areas].
Bruce E. Ross. June 1977. The Pleistocene History of San Francisco Bay along SouthernCrossing.
California Department of Conservation. California Geological Survey (Alquist-Priolo EarthquakeFault Zoning Act). http://www.conservation.ca.gov/cgs/codes/prc/Pages/chap-7-5.aspx.
California Department of Conservation. California Geological Survey (Regulatory Maps).http://www.quake.ca.gov/gmaps/WH/regulatorymaps.htm.
California Department of Transportation. Caltrans GIS Data (BART Routes and Stations;accessed June 18, 2015). http://www.dot.ca.gov/hq/tsip/gis/datalibrary/#Rail.
California Department of Transportation. Caltrans GIS Data (California Rail Network; accessedJune 18, 2015). http://www.dot.ca.gov/hq/tsip/gis/datalibrary/#Rail.
California Geological Survey. Association of Bay Area Governments Resilience Program(Liquefaction Zones; accessed June 26, 2015). http://resilience.abag.ca.gov/open-data/.
California Geological Survey. Association of Bay Area Governments Resilience Program (Flood– 100 & 500 year; accessed June 26, 2015). http://resilience.abag.ca.gov/open-data/.
California Geological Survey. Association of Bay Area Governments Resilience Program(Liquefaction Susceptibility; accessed June 26, 2015).http://resilience.abag.ca.gov/open-data/.
Christopher S. Hitchcock and Edward J. Helley. August 2003. Bay Mud Thickness in ContourFeet, Characterization of Subsurface Sediments, Southern San Francisco Bay Area.
Christopher S. Hitchcock and Edward J. Helley. August 2003. Characterization of SubsurfaceSediments, Southern San Francisco Bay Area.
Christopher S. Hitchcock and Edward J. Helley. August 2003. Ground Investigation Plan,Characterization of Subsurface Sediments, Southern San Francisco Bay Area.
City and County of San Francisco Planning Department. SF Open Data (accessed August 18,2015). https://data.sfgov.org/Energy-and-Environment/Maher-Map/qpt9-eisc.
City of Oakland. April 2001. Oakland Army Base Utility Study Geotechnical Review.
Fugro – Earth Mechanics. June 1999. Information Handout Structures Chapter for the PileInstallation Demonstration Project San Francisco-Oakland Bay Bridge East SpanSeismic Safety Project.
Harding Lawson Associates, Dames & Moore, Kennedy/Jenks/Chilton, EQE Engineering. FinalReport: Liquefaction Study – North Beach, Embarcadero Waterfront, South Beach, andUpper Mission Creek Area, San Francisco, California. Prepared for the City and Countyof San Francisco Department of Public Works. January 1992.
Core Capacity Transit Study Page A24 of A25
J. David Rogers and Ralph B. Peck. Engineering Geology of the Bay Area Rapid Transit(BART) System, 1964-75 (Geotechnical Exploration).http://sonic.net/~mly/www.geolith.com/bart/#geo.
National Oceanic and Atmospheric Administration. United States Coast Survey (accessedJune 19, 2015). http://www.nauticalcharts.noaa.gov/pdfcharts/.
Parsons Brinckerhoff Quade & Douglas. August 1965. Geologic Cross Section along the BARTTransbay Tunnel, Engineering Geology of the Bay Area Rapid Transit (BART) System.
The Port of San Francisco. August 2014. Exhibit A - Seawall Map, Historic Piers with SeawallSections; Earthquake Vulnerability Study of the Northern Waterfront Seawall.
The Port of San Francisco. August 2014. Exhibit B - Seawall Map, Current Piers & OriginalShoreline; Earthquake Vulnerability Study of the Northern Waterfront Seawall.
The Port of San Francisco. August 2014. Exhibit C - Seawall Section at Bulkhead Building,Earthquake Vulnerability Study of the Northern Waterfront Seawall.
The Port of San Francisco. August 2014. Exhibit D – San Francisco Seawall: History,Performance, and Future Challenges; Earthquake Vulnerability Study of the NorthernWaterfront Seawall.
The Port of San Francisco. August 2014. Exhibit E – Liquefaction Study, EarthquakeVulnerability Study of the Northern Waterfront Seawall.
R.S. van Oorsouw. June 2010. Behaviour of Segment Joints in Immersed Tunnels underSeismic Loading.
R.W. Graymer. 2000. Geologic Map and Map Database of the Oakland Metropolitan Area,Alameda, Contra Costa, and San Francisco Counties, California.
State of California. February 2003. Oakland West Quadrangle Official Map, Seismic HazardZones.
State of California. January 1982. Oakland West Revised Official Map, Special Studies Zones.
United States Army Corps of Engineers Dredged Material Management Office. 2013. FederalNavigation Projects and Dredged Material Placement Sites, Dredging and Placement ofDredged Material in San Francisco Bay.
United States Fish and Wildlife Service. National Wetlands Inventory (accessed June 18, 2015).http://www.fws.gov/wetlands/data/State-Downloads.html.
United States Geological Survey. California Geologic Map Data (CAfaults_dd; accessed June 9,2015). http://mrdata.usgs.gov/geology/state/state.php?state=CA.
United States Geological Survey. California Geologic Map Data (CAgeol_dd; accessed June 9,2015). http://mrdata.usgs.gov/geology/state/state.php?state=CA.
United States Geological Survey. Map of Thickness of Young San Francisco Bay Mud, PacificCoastal & Marine Science Center (accessed July 9, 2015).http://walrus.wr.usgs.gov/coastal_processes/sfbaycoastalsys/mudthick.html.
Core Capacity Transit Study Page A25 of A25
United States Geological Survey. Pacific Coastal & Marine Science Center (Map Thickness ofYoung San Francisco Bay Mud; accessed July 9, 2015).http://walrus.wr.usgs.gov/coastal_processes/sfbaycoastalsys/mudthick.html.
United States Geological Survey. The National Map Viewer (Ned19_topobathy_2010; accessedJune 25, 2015). http://viewer.nationalmap.gov/viewer/.