appendix a: ecohydraulics of the orange riverwis.orasecom.org/content/study/giz/support to the...
TRANSCRIPT

APPENDIX A: ECOHYDRAULICS OF THE ORANGE RIVER
AL Birkhead Streamflow Solutions CC
12 Bluegum Avenue, Gonubie, East London [email protected]
WP 5: Assessment of Environmental Flow requirements
Rivers for Africa Volume 3: EFR - APPENDIX A Deliverable 12 November 2010 Page A-1
ABBREVIATIONS AND ACRONYMS
ADP Acoustic Doppler Profiler EFR/s Environmental Flow Requirement/s FSL Full Supply Level Max. Maximum Meas. Measured Min. Minimum MS Microsoft NA Not Applicable PD Present Day prep. preparation REC Recommended Ecological Category Sc Scenario WL Water level

WP 5: Assessment of Environmental Flow requirements
Rivers for Africa Volume 3: EFR - APPENDIX A Deliverable 12 November 2010 Page A-2
ACKNOWLEDGEMENTS
The contributions to site selection and data collection by James Mackenzie (Mackenzie Ecological and Development Services), Ahmed Desai and Delana Louw (Rivers for Africa eFlows Consulting), Mark Rountree (Fluvius Environmental), Rob Palmer (Nepid Consultants) and Piet Kotze (Clean Stream Biological Services).

WP 5: Assessment of Environmental Flow requirements
Rivers for Africa Volume 3: EFR - APPENDIX A Deliverable 12 November 2010 Page A-3
TABLE OF CONTENTS
ABBREVIATIONS AND ACRONYMS ............................................................................................... 1 ACKNOWLEDGEMENTS ................................................................................................................. 2 TABLE OF CONTENTS .................................................................................................................... 3 OBJECTIVES .................................................................................................................................... 5 A1 ECOHYDRAULIC INFORMATION FOR ENVIRONMENTAL WATER ASSESSMENT
ALONG THE ORANGE RIVER ............................................................................................. 6 A1.3.1 Cross-sectional profiles ......................................................................................... 9 A1.3.2 Lookup tables ........................................................................................................ 9 A1.3.3 Molopo Wetland ..................................................................................................... 9
A2 REFERENCES .................................................................................................................... 17
LIST OF FIGURES
|Figure A1 Top: discharge gauged at D7H008 (Zeekoebaart), and bottom: stage recorded at
EFR Site 2. ..................................................................................................................... 8 Figure A2 Top: discharge gauged at D7H014 (Neusberg), and bottom: stage recorded at
EFR Site 3. ..................................................................................................................... 8 Figure A3 Top: discharge gauged at D8H003 (Vioolsdrif), and bottom: stage recorded at
EFR Site 4. ..................................................................................................................... 9 Figure A4 Cross-sectional profile at Site EFR 2 on the lower Orange River, showing the
water levels (WL) surveyed on 17 October and 31 May 2010, as well as the position of geomorphological and vegetation markers (numeric markers). .................. 11
Figure A5 Cross-sectional profile at Site EFR 3 on the lower Orange River, showing the water levels (WL) surveyed on 29 May, 17 March and 13 April 2010, as well as the position of geomorphological and vegetation markers (numeric markers). Water levels inferred from flood strand lines (FL) are also indicated (224/FL = February 2010). ............................................................................................................ 11
Figure A6 Cross-sectional profile at Site EFR 4 on the lower Orange River, showing the water levels (WL) surveyed on 17 October and 31 May 2010, as well as the position of geomorphological and vegetation markers (numeric markers). .................. 12
Figure A7 Cross-sectional profile at Site EFR 5 on the upper Caledon River, showing the water levels (WL) surveyed on 22 June and 8 February 2010, as well as the position of geomorphological (G) and vegetation (V) markers. .................................... 12
Figure A8 Cross-sectional profile at Site EFR 6 on the lower Caledon River, showing the water levels (WL) surveyed on 23 June and 10 February, and inferred from the 27 January 2010 strand line. The position of vegetation (V) markers are also indicated. ...................................................................................................................... 13
Figure A9 Cross-sectional profile A at Site EFR 7 on the Kraai River, showing the water levels (WL) surveyed on 24 June and 4 August 2010, as well as the position of vegetation (V) markers. ................................................................................................ 13
Figure A10 Cross-sectional profile B at Site EFR 7 on the Kraai River, showing the water levels (WL) surveyed on 24 June and 4 August 2010. ................................................. 14

WP 5: Assessment of Environmental Flow requirements
Rivers for Africa Volume 3: EFR - APPENDIX A Deliverable 12 November 2010 Page A-4
Figure A11 Cross-sectional profile B at Site EFR 8 on the Molopo Wetland, showing the water level (WL) surveyed on 21 April 2010, as well as the position of vegetation markers. ....................................................................................................................... 14
Figure A12 Cross-sectional profile C at Site EFR 8 on the Molopo Wetland, showing the water level (WL) surveyed on 21 April 2010 (backup from the downstream impoundment), as well as the position of vegetation markers. ..................................... 15
Figure A13 Cross-sectional profile D at Site EFR 8 on the Molopo Wetland, showing the water level (WL) surveyed on 21 April 2010 (backup from the downstream impoundment), as well as the position of vegetation markers. ..................................... 15
LIST OF TABLES
Table A1 Hydraulic data surveyed at EFR sites along the Orange River System ......................... 7 Table A2 Confidence ratings for the hydraulic characterisations ................................................. 16

WP 5: Assessment of Environmental Flow requirements
Rivers for Africa Volume 3: EFR - APPENDIX A Deliverable 12 November 2010 Page A-5
OBJECTIVES
The objectives of the ecohydraulic component of this study are to provide geomorphologically and ecologically relevant hydraulic information (data collection, analysis and results) for assessing the Environmental Flow Requirements (EFRs) at six river sites: two sites along the Caledon River, one site along the Kraai River and three sites along the lower Orange River. A further site was located in the wetland downstream of the Molopo Eye.

WP 5: Assessment of Environmental Flow requirements
Rivers for Africa Volume 3: EFR - APPENDIX A Deliverable 12 November 2010 Page A-6
A1 ECOHYDRAULIC INFORMATION FOR ENVIRONMENTAL WATER ASSESSMENT ALONG THE ORANGE RIVER
The application of holistic methods for ecological flow determination (refer to Tharme, 1996) requires environmental flow requirements to be expressed as discharge rates (including its temporal characteristics) through assessments of the presence of suitable habitat for certain biota at different flows. The interface between the way in which flow requirements are assessed and expressed is through the results of hydraulic measurements, analyses and modelling at sites along rivers. The primary product of these hydraulic analyses are relationships between discharge and the following determinants, which have been found over the course of numerous flow assessments, to be the most useful: depth (maximum and average), velocity (average), wetted perimeter, and width of the water surface. The discharge-depth (or rating) relationship is fundamental to hydraulic analysis, and is generally derived from a combination of measured and synthesized data (refer to Rowlston et al. (2000), Birkhead (1999), Jordanova et al. (2004), Hirschowitz et al. (2007) and Birkhead (in press) for descriptions of procedures for deriving hydraulic information for use in EFRs in South Africa). Once the rating relationship for a river section has been developed, the relationships between discharge and the other hydraulic parameters (listed above) may readily be computed using the cross-sectional geometry, and are generally provided in tabular format using look-up tables (refer to Section A2.3). The cross-sectional profile plots and look-up tables comprise the “standard hydraulic data” used in EFR determinations in South Africa. Ecologists use these standard hydraulic data with the aid of site assessments and photographs to determine the quantity and quality of hydraulic habitat at different flows. Substantial experience and interpretation are required to provide assessments of site-based and reach-based biological habitats using cross-sectional surveys and the results of one-dimensional hydraulic analyses (biological habitat refers to the integration of the different components defining habitat (e.g. hydraulic, substrate and cover attributes for fish)). Procedures have therefore been developed for using standard hydraulic information as the basis for quantifying hydraulic habitat for fish (refer to Hirchowitz et al. (2007) and Birkhead (2010) for an explanation of the method). The method allows the assessment of abundance of different flow classes to be applied more consistently in EFRs, and has been used in this study.
A1.1 DATA COLLECTION
The measured discharge and flow depth data are provided in Table A1, together with the dates when the data were collected.

WP 5: Assessment of Environmental Flow requirements
Rivers for Africa Volume 3: EFR - APPENDIX A Deliverable 12 November 2010 Page A-7
Table A1 Hydraulic data surveyed at EFR sites along the Orange River System
River Site no. Cross-
section no. Date
DischargeQ (m3/s)
Max. flow depthy (m)
Stage AMSL z (m)
Orange
2 A 31/05/10 110 - 1151 3.57 NA 01/06/10 991, 123ADP 3.51 NA
16/03/10 1391 3.67 NA
3 A 29/05/10 110ADP 3.60 NA
17/03/10 2522 4.10 NA
4 A 26/05/10 713, 79ADP 1.85 NA
15/12/09 1793 2.39 NA
Caledon 5 A 22/06/10 0.24 0.35 NA
08/02/10 2.0 0.54 NA
Caledon 6 A 23/06/10 7.7 1.22 NA
10/02/10 60 1.98 NA
Kraai 7
A
24/06/10 4.7 0.59 NA
10/07/10 3.1 0.55 NA
04/08/10 2.3 0.50 NA
B
24/06/10 4.7 0.36 NA
10/07/10 3.1 0.30 NA
04/08/10 2.3 0.28 NA
Molopo 8
A 21/04/10 0.15 0.64 NA
B 21/04/10 0.15 0.56 NA
C 20/04/10 0.15 1.57 NA
D 20/04/10 0.15 2.25 NA 1D7H008 (Zeekoebaart) 2D7H014 (Neusberg) 3D8H003 (Vioolsdrif) ADP - Acoustic Doppler Profiler NA – Not Applicable (local datums used)
Automatic stage recorders were installed at EFR Sites 2, 3 and 4 along the lower Orange River to augment the rating data in Table A1. Stage measurements were correlated with discharges from local DWA gauges (refer to Table A1), and these data are plotted in Figures A1 to A3.

WP 5: Assessment of Environmental Flow requirements
Rivers for Africa Volume 3: EFR - APPENDIX A Deliverable 12 November 2010 Page A-8
Dis
cha
rge
(m
3/s
)
0
100
200
300
400
500
600
700
800
28 11 25 9 23
Mar2010 Apr2010 May2010
Sta
ge
(cm
)
0
40
80
120
160
200
D7H008 DISCHARGE EFR SITE 2 RECORDER STAGE
|Figure A1 Top: discharge gauged at D7H008 (Zeekoebaart), and bottom: stage recorded at EFR Site 2.
Dis
cha
rge
(m
3/s
)
0
100
200
300
400
500
600
700
800
28 11 25 9 23
Mar2010 Apr2010 May2010
Sta
ge
(cm
)
50
100
150
200
250
300
350
D7H014 DISCHARGE EFR SITE 3 RECORDER STAGE
Figure A2 Top: discharge gauged at D7H014 (Neusberg), and bottom: stage recorded at EFR Site 3.

WP 5: Assessment of Environmental Flow requirements
Rivers for Africa Volume 3: EFR - APPENDIX A Deliverable 12 November 2010 Page A-9
Dis
cha
rge
(m
3/s
)
0
500
1000
1500
2000
2500
3000
3500
Jan Feb Mar Apr May
2009 2010
Sta
ge
(cm
)
100
200
300
400
500
600
700
800
900
D8H003 DISCHARGE EFR SITE 4 RECORDER STAGE
Figure A3 Top: discharge gauged at D8H003 (Vioolsdrif), and bottom: stage recorded at EFR Site 4.
A1.2 MODELLING
Predicted resistance coefficients, energy slopes and modelled rating relationships are archived electronically for the river sites (1 to 7) and included in the EFR ecohydraulics database (Birkhead et al., in prep.).
A1.3 RESULTS
A1.3.1 Cross-sectional profiles
Refer to Figures A4 - A13.
A1.3.2 Lookup tables
Lookup tables (hydraulic variables and flow-classes) are archived electronically in MS Excel.
A1.3.3 Molopo Wetland
The section of the Molopo Wetland considered in this study extends approx. 1.66km from the diversion/gauging weirs (D4H014 & D4H030) to the second downstream road crossing. This (second) road crossing consists of an elevated roadway (approx. 2.5m) with eight 205mm diameter pipes positioned below the road surface. It therefore acts as a substantial impoundment, backing up the water level over an upstream distance of approx. 1.2km. Three (bank-to-bank) cross-sections (refer to Figures A5-A7) were surveyed in the section upstream of the impoundment at distances of approx. 500m (D), 800m (C) and 1200m (B). A further road crossing exists approx. 230m downstream of the gauging weir (i.e. 1.43km upstream of the second road crossing). A left bank cross-section (A) was surveyed between the weir and the first road crossing (dense reeds prevented a complete bank-to-bank survey). The first road crossing incorporates a rectangular culvert (width: 1.65m (upstream) to 0.61m (downstream)).

WP 5: Assessment of Environmental Flow requirements
Rivers for Africa Volume 3: EFR - APPENDIX A Deliverable 12 November 2010 Page A-10
At the time of the survey, the discharge into the wetland (after the diversion to Mafekeng) was 0.15m3/s. The maximum measured flow depths at cross-sections A to D were 0.64m, 0.56m, 1.57m and 2.25m, respectively. In addition, the maximum depths in the wetland upstream and downstream of the first road crossing were 0.43m and 0.49m respectively. Consequently, the average depth at this discharge for unimpounded areas of the wetland is estimated at approx. 0.50m (the survey indicates that cross-sections C and D are within the backup area). The average depth at cross-section B at this flow was approx. 0.15m. This average depth at cross-section C (though currently backed-up), corresponds to a maximum depth of 0.43m - supporting the above approx. maximum depth value of 0.50m at 0.15m3/s. At average depths of 0.15m at cross-sections B and C (and 0.15m3/s), the average velocities range from approx. 0.02m/s to 0.09m/s. Estimates of changes in discharge corresponding to (reasonably small) changes in depth can be made by assuming that average velocities remain invariant (a general characteristic of flow through dense reed stands). For a 0.1m increase and reduction in (maximum) depth, the corresponding discharges are approx. 0.28m3/s and 0.070m3/s (using the channel geometry for cross-sections B and C). A number of hydraulically-related scenarios were devised for the Molopo Wetland: the first of these (Scenario 1) considers a reduction in water level of 1.2m at the (second) downstream road crossing such that the backup extends upstream to cross-section C; for the second scenario (2) the backup extends to cross-section D (a reduction by 2.2m); Scenario 3 assess no substantial backup from the road crossing; a reduction in the discharge to 0.075m3/s is considered in Scenario 4 (increased abstractions to Mafekeng), with the existing impoundment remaining in place. For Scenarios 1 - 3, the flows in the wetland remain unchanged from present day conditions. Note that under present day conditions, the backup extends to approx. cross-section B. The confidence ratings in the hydraulic characterisations for these scenarios are provided in Table A.5 (provided separately for impounded and unimpounded areas of the wetland).

WP 5: Assessment of Environmental Flow requirements
Rivers for Africa Volume 3: EFR - APPENDIX A Deliverable 12 November 2010 Page A-11
1
2
345
68121516181921
25262730333435373839401 234
5678
910111213141516
17181920212223
24252627
28
293031
323334
3536373839
40
41
0.0
2.0
4.0
6.0
8.0
10.0
12.0
14.0
-100 0 100 200 300 400
Ele
vatio
n a
bo
ve b
ed
(m)
Distance across channel (m)
Profile Veg. & geomorph. WL 17Oct10 WL 31May10
Figure A4 Cross-sectional profile at Site EFR 2 on the lower Orange River, showing the water levels (WL) surveyed on 17 October and 31 May 2010, as well as the position of geomorphological and vegetation markers (numeric markers).
12
34
567
89
10
11/FL
12
1314
15161718192021
22
210215
218221
224/FL
226228
0.0
2.0
4.0
6.0
8.0
10.0
12.0
14.0
16.0
18.0
-150 -100 -50 0 50 100 150 200 250
Ele
vatio
n a
bo
ve b
ed
(m)
Distance across channel (m)
Profile Veg. & geomorph. WL 29May10 WL 17Mar10 WL 13Apr10
Figure A5 Cross-sectional profile at Site EFR 3 on the lower Orange River, showing the water levels (WL) surveyed on 29 May, 17 March and 13 April 2010, as well as the position of geomorphological and vegetation markers (numeric markers). Water levels inferred from flood strand lines (FL) are also indicated (224/FL = February 2010).

WP 5: Assessment of Environmental Flow requirements
Rivers for Africa Volume 3: EFR - APPENDIX A Deliverable 12 November 2010 Page A-12
48495051
5354 82100120121176177178
190192
195
196
197
198
199/FL
205
206207208
209
210211212
213
214215216
0.0
1.0
2.0
3.0
4.0
5.0
6.0
7.0
8.0
9.0
-50 0 50 100 150 200 250 300
Ele
vatio
n a
bo
ve b
ed
(m)
Distance across channel (m)
Profile Veg. & geomorph. WL 26May10 WL 15Dec09 WL 6Mar10
Figure A6 Cross-sectional profile at Site EFR 4 on the lower Orange River, showing the water levels (WL) surveyed on 17 October and 31 May 2010, as well as the position of geomorphological and vegetation markers (numeric markers).
G1
G2
V1
V2V3
V4V5
V6V7V8V9V10
V11V12V13
0.0
1.0
2.0
3.0
4.0
5.0
6.0
7.0
-60 -50 -40 -30 -20 -10 0 10
Ele
vatio
n a
bo
ve b
ed
(m)
Distance across channel (m)
Profile Veg. & geomorph. WL 22June10 WL 8Feb10
Figure A7 Cross-sectional profile at Site EFR 5 on the upper Caledon River, showing the water levels (WL) surveyed on 22 June and 8 February 2010, as well as the position of geomorphological (G) and vegetation (V) markers.

WP 5: Assessment of Environmental Flow requirements
Rivers for Africa Volume 3: EFR - APPENDIX A Deliverable 12 November 2010 Page A-13
V2
V3
V4V5
V6 V7 V8V9
V10
V11 V12V13V14V15
V16
V17
V18V19
V20V21V22V23
0.0
2.0
4.0
6.0
8.0
10.0
12.0
14.0
-100 -50 0 50 100 150
Ele
vatio
n a
bo
ve b
ed
(m)
Distance across channel (m)
Profile Veg. & geomorph. WL 23June10 WL 10Feb10 WL 27Jan10
Figure A8 Cross-sectional profile at Site EFR 6 on the lower Caledon River, showing the water levels (WL) surveyed on 23 June and 10 February, and inferred from the 27 January 2010 strand line. The position of vegetation (V) markers are also indicated.
V1
V2V3
V4V5
V6
V7V8V9V10V11V12
V13V14
V15V16
V17
V18
V19
0.0
2.0
4.0
6.0
8.0
10.0
12.0
14.0
-60 -40 -20 0 20 40 60 80 100
Ele
vatio
n a
bo
ve b
ed
(m)
Distance across channel (m)
Profile Veg. & geomorph. WL 24June10 WL 4Aug10
Figure A9 Cross-sectional profile A at Site EFR 7 on the Kraai River, showing the water levels (WL) surveyed on 24 June and 4 August 2010, as well as the position of vegetation (V) markers.

WP 5: Assessment of Environmental Flow requirements
Rivers for Africa Volume 3: EFR - APPENDIX A Deliverable 12 November 2010 Page A-14
0.0
0.2
0.4
0.6
0.8
1.0
1.2
1.4
1.6
-10 0 10 20 30 40 50
Ele
vatio
n a
bo
ve b
ed
(m)
Distance across channel (m)
Profile WL 24June10 WL 4Aug10
Figure A10 Cross-sectional profile B at Site EFR 7 on the Kraai River, showing the water levels (WL) surveyed on 24 June and 4 August 2010.
1
2
3
45
WL/67 8
9 WL/10 1112
13
14
15
95.5
96.0
96.5
97.0
97.5
98.0
98.5
0 50 100 150 200 250
Ele
vatio
n a
bo
ve d
atu
m (m
)
Distance across channel (m)
Profile WL 21Apr10 Veg.
Figure A11 Cross-sectional profile B at Site EFR 8 on the Molopo Wetland, showing the water level (WL) surveyed on 21 April 2010, as well as the position of vegetation markers.

WP 5: Assessment of Environmental Flow requirements
Rivers for Africa Volume 3: EFR - APPENDIX A Deliverable 12 November 2010 Page A-15
1
2
34WL5
67 8
91011 12
13
1415
WL/16
17
18
94.0
94.5
95.0
95.5
96.0
96.5
97.0
97.5
98.0
98.5
99.0
0 50 100 150 200 250
Ele
vatio
n a
bo
ve d
atu
m (m
)
Distance across channel (m)
Profile WL 20Apr10 Veg.
Figure A12 Cross-sectional profile C at Site EFR 8 on the Molopo Wetland, showing the water level (WL) surveyed on 21 April 2010 (backup from the downstream impoundment), as well as the position of vegetation markers.
1
WL/2
34 56
78 9 1011
12 13
14
93.5
94.0
94.5
95.0
95.5
96.0
96.5
97.0
97.5
50 100 150 200 250 300 350
Ele
vatio
n a
bo
ve d
atu
m (m
)
Distance across channel (m)
Profile WL 20Apr10 Veg.
Figure A13 Cross-sectional profile D at Site EFR 8 on the Molopo Wetland, showing the water level (WL) surveyed on 21 April 2010 (backup from the downstream impoundment), as well as the position of vegetation markers.
WP 5: Assessment of Environmental Flow requirements
Rivers for Africa Volume 3: EFR - APPENDIX A Deliverable 12 November 2010 Page A-16
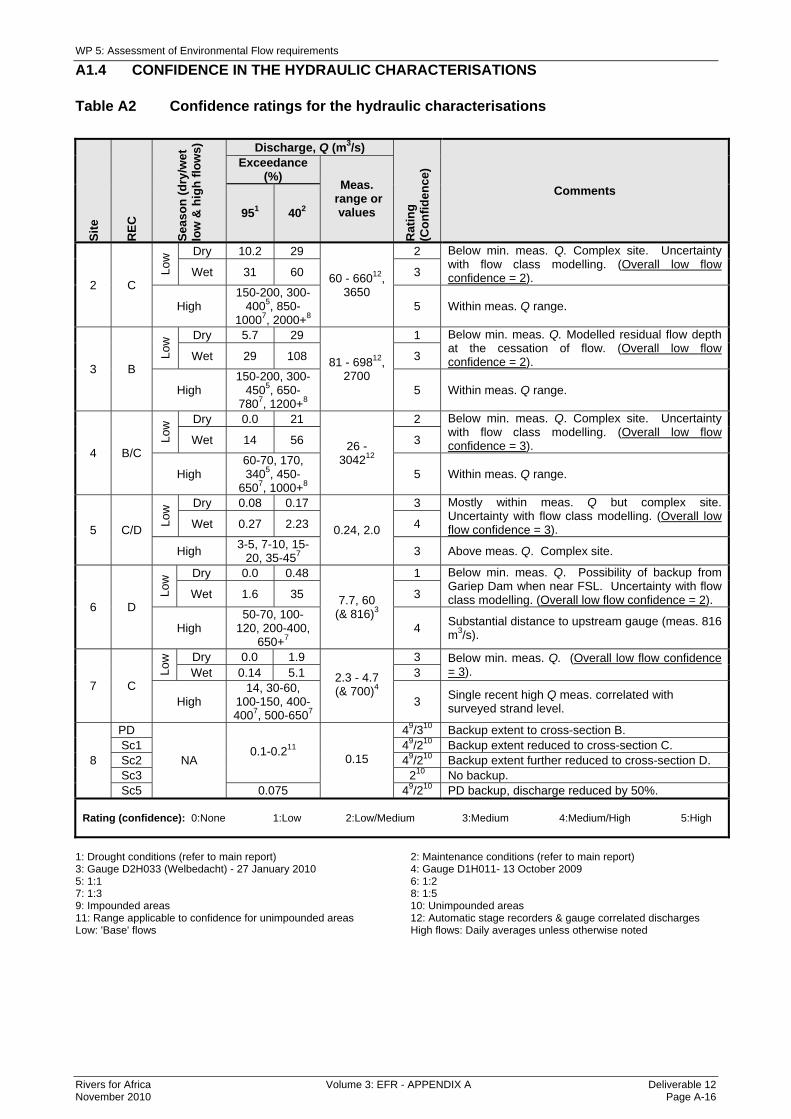
A1.4 CONFIDENCE IN THE HYDRAULIC CHARACTERISATIONS
Table A2 Confidence ratings for the hydraulic characterisations
1: Drought conditions (refer to main report) 2: Maintenance conditions (refer to main report) 3: Gauge D2H033 (Welbedacht) - 27 January 2010 4: Gauge D1H011- 13 October 2009 5: 1:1 6: 1:2 7: 1:3 8: 1:5 9: Impounded areas 10: Unimpounded areas 11: Range applicable to confidence for unimpounded areas 12: Automatic stage recorders & gauge correlated discharges Low: 'Base' flows High flows: Daily averages unless otherwise noted
Sit
e
RE
C
Sea
son
(d
ry/w
et
low
& h
igh
flo
ws)
Discharge, Q (m3/s)
Rat
ing
(C
on
fid
ence
)
Comments
Exceedance (%)
Meas. range or
values 951 402
2 C
Low
Dry 10.2 29
60 - 66012, 3650
2 Below min. meas. Q. Complex site. Uncertainty with flow class modelling. (Overall low flow confidence = 2). Wet 31 60 3
High 150-200, 300-
4005, 850-10007, 2000+8
5 Within meas. Q range.
3 B
Low
Dry 5.7 29
81 - 69812, 2700
1 Below min. meas. Q. Modelled residual flow depth at the cessation of flow. (Overall low flow confidence = 2). Wet 29 108 3
High 150-200, 300-
4505, 650-7807, 1200+8
5 Within meas. Q range.
4 B/C
Low
Dry 0.0 21
26 - 304212
2 Below min. meas. Q. Complex site. Uncertainty with flow class modelling. (Overall low flow confidence = 3). Wet 14 56 3
High 60-70, 170, 3405, 450-
6507, 1000+8 5 Within meas. Q range.
5 C/D
Low
Dry 0.08 0.17
0.24, 2.0
3 Mostly within meas. Q but complex site. Uncertainty with flow class modelling. (Overall low flow confidence = 3). Wet 0.27 2.23 4
High 3-5, 7-10, 15-
20, 35-457 3 Above meas. Q. Complex site.
6 D
Low
Dry 0.0 0.48
7.7, 60 (& 816)3
1 Below min. meas. Q. Possibility of backup from Gariep Dam when near FSL. Uncertainty with flow class modelling. (Overall low flow confidence = 2). Wet 1.6 35 3
High 50-70, 100-
120, 200-400, 650+7
4 Substantial distance to upstream gauge (meas. 816 m3/s).
7 C
Low
Dry 0.0 1.9
2.3 - 4.7 (& 700)4
3 Below min. meas. Q. (Overall low flow confidence = 3). Wet 0.14 5.1 3
High 14, 30-60,
100-150, 400-4007, 500-6507
3 Single recent high Q meas. correlated with surveyed strand level.
8
PD
NA 0.1-0.211
0.15
49/310 Backup extent to cross-section B. Sc1 49/210 Backup extent reduced to cross-section C. Sc2 49/210 Backup extent further reduced to cross-section D. Sc3 210 No backup. Sc5 0.075 49/210 PD backup, discharge reduced by 50%.
Rating (confidence): 0:None 1:Low 2:Low/Medium 3:Medium 4:Medium/High 5:High
Intermediate Reserve Determination study for the Mokolo River System (WMA1)
Rivers for Africa Volume 3: EFR - APPENDIX A Deliverable 12 November 2010 Page A-17
A2 REFERENCES
Birkhead, A.L. 1999. The procedure for generating hydraulic data for the Intermediate and Comprehensive Ecological Reserve (Quantity), Appendix R17. Water Resource Protection Policy Implementation, Resource Directed Measures for protection of Water Resources, Volume 3: River Ecosystems (Version 1.0). http://www.dwaf.gov.za/documents.asp Birkhead, A.L. (2010). The role of Ecohydraulics in the South African Ecological Reserve. In: Ecohydraulics for South African Rivers, James, C.S. and King, J.M. (eds), Water Research Commission report no. TT K5/1767/1, Pretoria, South Africa. Birkhead, A.L., Desai, A. and Louw, M.D. (In prep.) Synthesis of hydraulic information collected over the past decade in Southern Africa to inform Environmental Flow Requirements. WRC Project K8/795/2. Hirschowitz, P.M., Birkhead, A.L. and James, C.S. 2007. Hydraulic modelling for ecological studies for South African Rivers. WRC Report No. 1508/1/07, Water Research Commission, Pretoria. 250pp. http://www.wrc.org.za/publications/reports_htm Jordanova, A.A., Birkhead, A.L., James, C.S., and Kleynhans, C.L. 2004. Hydraulics for determination of the ecological Reserve for rivers. Report to the Water Research Commission on the project “Hydraulic analyses for the determination of the ecological Reserve for rivers”. WRC Report no. 1174/0/1. Rowlston, B., Jordanova, A.A. and Birkhead A.L. 2000. Hydraulics In: Environmental flow assessment for rivers: Manual for the Building Block Methodology, King, J.M., Tharme, R.E. and de Villiers, M.S., (eds), Water Research Commission report No.TT 131/00, Pretoria, South Africa. Tharme, R. E. 1996. Review of international methodologies for the quantification of the instream flow requirements of rivers. Water law review. Final report for policy development. Commissioned by the Department of Water Affairs and Forestry, Pretoria. Freshwater Research Unit, University of Cape Town, Cape Town. 116pp.