appendix a: atc-25 project participants · appendix a: atc-25 project participants ... b.9.3...
TRANSCRIPT

Appendix A: ATC-25 Project Participants
APPLIED TECHNOLOGY COUNCIL
Mr. Christopher Rojahn (Principal Investigator)Applied Technology Council555 Twin Dolphin Drive, Suite 270Redwood City, California 94065
Dr. Gerard Pardoen (Board Contact)Dept of Civil Engineering, 101 ICEFUniversity of CaliforniaIrvine, California 92717
FEDERAL EMERGENCY MANAGEMENT AGENCY
Mr. Kenneth Sullivan '(Project Officer)Federal Emergency Management Agency500 C Street, S.W.Washington, DC 20472
SUBCONTRACTOR
EQE, Inc.Dr. Charles Scawthorn, Principal-in-ChargeDr. Mahmoud Khater, Principal Research Engineer595 Market Street, 18th FloorSan Francisco, California 94105
EXPERT TECHNICAL ADVISORY GROUP
Mr. Lloyd CluffConsulting Geologist33 Mountain SpringSan Francisco, California
Mr. James D. Cooper(Federal Highway Administration)116 Nort h Johnson RoadSterling, Virginia 22170
Mr. Holly CornellCH2M Hill, P.O. Box 428Corvallis, Oregon 97339
Mr.-John W. FossBell Communications Research Inc.435 South Street, #1A334Morristown, New Jersey 07960
Mr. James H. GatesCalifornia Dept. of TransportationP.0. Box 942874Sacramento, California 94274
Mr. Neal HardmanCali£ Office of Statewide HealthPlanning and Development
1600 9th StreetSacramento, California 95814
Mr. Jeremy IsenbergWeidlinger Associates4410 El Camino Real, Suite 110Los Altos, California 94022
Prof. Anne S. KiremidjianDept. of Civil EngineeringStanford UniversityStanford, California 94305
Mr. Le Val LundConsulting Engineer3245 Lowry RoadLos Angeles, California 90027
Mr. Peter McDonough144 Whitesides StreetLayton, Utah 84041
Appendix A: Project ParticipantsATC-25. 193
Dr. Dennis K. OstromConsulting Engineer16430 Sultus StreetCanyon Country, Calif. 91351
Dr. Michael ReichleCalif. Division of Mines & Geology630 Bercut DriveSacramento, Calif. 95814
Dr. J. Carl SteppElectric Power Research Inst.3412 Hillview AvenuePalo Alto, Calif. 94303
Mr. Domenic ZigantNaval Facilities Engineering CommandCode 402, P. 0. Box 727San Bruno, California 94066
Prof. Anshel J. SchiffDept. of Civil EngineeringStanford UniversityStanford, California 94305
194 Appendix A: Project Participants ATC-25194 Appendix A: Project Participants ATC-25

Appendix B: Lifeline Vulnerability Functions
Table of Contents
Page
--- ~~1 %R1 T-TicrhwavB 11 Itinr Rrdias.. 1IQw
B.1.2 Tunnels.............................................B.1.3 Conventional Bridges.....................B.1.4 Freeways/Mighways.........................B 1 T nr-Al nsd
B.2 Railw ay...........................................................B.2.1 Bridges...........................................B .2.2 Tunnels..............................................B.2.3 Tracks/Roadbeds............................R 9 4 TerminqI Sttinns
---- -- -- -- -- ----- - - -.................. 197
.................. 200.. 203
......... 208
......... 211
........ 21591A
B.3 Air Transportation.B.3.1 Terminals.B P 2 Rnvnwavq and 7':h-iwvs. ..
......... 218
......... 218991i
B.4 Sea/Water Transportation.........................IB.4.1 Ports/Cargo Handling Equipment.Rd9 ThndandL iWtwernvra
......... . M
......... 223996
B.5 Electrical.........................................................B.5.1 Fossil-fuel Power Plants.................R 59 T2 vlreiertrir Pnwer P1ants
......... 229
........ 229
B.5.3 Transmission Lines ..........................B.5A Transmission Substations................P 5-5 Tlistrihutinn Tines
........ 235
........ 2389.49
B.5.6 Distribution Substations .................B.6 Water Supply.................................................
B. 6 1 Transmisinn AnneTncfq -
........ 243......... 243
245.. 5B.6.2 Pumping Stations .............................B.6.3 Storage Reservoirs...........................R 64 Trefmentf PInts
........ 248
......... 251955
B.6.5 Terminal Reservoirs/Tanks.B.6.6 Trunk Lines .B.6.7 Wells.
PR 7 Saqnibty Sevwer
3.7.1 Mains .B.7.2 Pumping Stations.B.7.3 Treatment Plants .
B.8 Natural Gas.B.8.1 Transmission Lines.P R 9 Cnrnnressnr Stahtnn .
......... 260
......... 262
......... 266
........ 268.
........ 271
........ 274
........ 277
........ 277.. n
B.8.3 Distribution Mains..B.9 Petroleum Fuels.
B.9.1 Oil Fields.B.9.2 Refineries.B.9.3 Transmission Pipelines.3.9.4 Distribution Storage Tanks.
B.10 Emergency Service.iRfll TMelnth Cre
........ 283
......... Z
........ 286
......... . 2
........ 291
........ 294
........ 295.. 05
B.1,0.2 Emergency Response Services.0 . 0IG
AT 5Appendix B: Lifeline Vulnerability Functions
.......................................................................
............................................................................ <§.6.............et..........a. .......
.........................................................................................-
.................................................................................
.................................................................................
.................................................................................
.................................................................................
.................................................................................
.................................................................................
.................................................................................
.............................................. ..................................
..................................................................................
..................................................................................................................................................................
................................................................................
I................................................................................
I................................................................................I....................... ........................................................
................................................................................
................................................................................
................................................................................
................................................................................
...............................................................................
................................................................................
................................................................................
................................................................................
.................................................................................
................................................................................ I
....................... a .........................................................
.................................................................................
.................................................................................
.................................................................................
.................................................................................
........................................................................................ -1 �
----------------- ---I)nQ
............................... " F , sL T
_ _ _ _ _, _ _ _4, _ _- .-.- >';'s1Qt Llj::
, u ..f
. .mr
. r A-_ILL TT J 1H LIL = L q IL T
.. fi .LJUL.LlZ 1 T ;.I L 1
_v.s - sy-lOlLA s W ,s r_ _ _, _ . .._ _
._ . so,.s v _ssv
.. . 1voX. .' i sH_ . _ _ _ a
. *.Kr. 1 s v.L.Ls:L; I 1Ws ._ _ _
_ _ ,
.. ,.vU]UZ]L8X s .,sU >s
. | W. JL v 1 '@u1sU \_
..............
---- ------ --
_ _ _
---
X,2.. E
2S,.. wq
ATC-25i 195

Included in this appendix. are vulnerabilityfunctions used to describe the expected orassumed earthquake performancecharacteristics of lifelines as well as the timerequired to restore damaged facilities to theirpre-earthquake capacity, or usability. Functionshave been developed for all lifelines inventoriedfor this project, for lifelines estimated by proxy,and for other important lifelines not availablefor inclusion in the project inventory. Themethodology used to calculate the quantitativerelationships for direct damage and residualcapacity are described in Chapter 3.
The vulnerability function for each lifelineconsists of the following components:
* General information, which consists of(1) a description of the structure and itsmain components, (2) typical seismicdamage in qualitative terms, and (3)seismically resistant design characteristicsfor the facility and its components inparticular. This information has beenincluded to define the assumedcharacteristics and expectedperformance of each facility and tomake the functions more widelyapplicable (i.e., applicable for otherinvestigations by other researchers).
* Direct damage information, whichconsists of (1) a description of its basis interms of structure type and quality ofconstruction (degree of seismicresistance), (2) default estimates of thequality of construction forpresentconditions, (3) default estimates of thequality of construction for upgradedconditions, and (4) time-to-restorationcurves.
B.1 Highway
B. 1.I Major Bridges
1. General
Description: Major bridges include allhighway system bridges with individual spansover 500 feet. Steel bridges of this typeinclude suspension, cable-stayed, or truss.Reinforced concrete arch or prestressedconcrete segmental bridges are alsocommon. The main components include the
bridge piers and supporting foundation(commonly piers, piles, or caissons) and thesuperstructure including the bridge deck,girders, stringers, truss members, and cables.Approaches may consist of conventionalhighway bridge construction and/orabutments.
Typical Seismic Damage: Major bridges aretypically well- engineered structuresdesigned for lateral loading (seismic loadingwas not typically considered until the 1970s).In most cases, damage will be limited toground and structural failures at bridgeapproaches. However, major ground failuresincluding liquefaction and submarinelandsliding could lead to significant damageto bridge foundations and superstructures.
Earthquake-resistant Design: Seismicallyresistant design practices include dynamicanalysis, which takes soil-structureinteraction into account. Foundationsshould be designed and detailed towithstand any soil failures that are expecteddue to unstable site conditions.
2. Direct Damage
Basis: Damage curves for highway systemmajor bridges are based on ATC-13 data forFC 30, major bridges (greater than 500-footspans). Standard construction is assumed torepresent typical California major bridgesunder present conditions (i.e., a compositeof older non-seismically designed bridges aswell as modern bridges designed for site-specific seismic loads).
Present Conditions: In the absence of dataon the type of construction, age, etc., thefollowing factors were used to modify themean curves, under present conditions:
NEHRP Map AreaCalifornia 7California 3-6Non-California 7Puget Sound 5All other areas
MMIIntensity
Shift0
+1+1+1+2
The modified motion-damage curves formajor bridges are shown in Figure B-1.
Appendix B: Lifeline Vulnerability Functions ATC-25196

Bridge
VII Vill IXModified Mercalli Intensity (MMI)
Figure B-1 Damage percent by intensity for major bridges.
Upgraded Conditions: For areas where it Heavyappears cost-effective to improve facilities, and urassume on a preliminary basis that upgrades tunnelresult in a beneficial intensity shift of one chang4unit (i.e., -1), relative to the above present matericonditions.
TypiaTime-to-restoration: The time-to- experirestoration data assigned to SF 25a, major by perbridges for highway systems, are assumed to Iandsliapply to all major bridges. By combining sufferthese data with the damage curves for FC grouni30, the time-to-restoration curves shown in portalFigures B-2 through B-4 were derived for been ithe various NEHRP Map Areas. inters(
constrB3.2 Tunnels Dama.
limite(1. General
SeismDescription: In general, tunnels may pass have rthrough alluvium or rock, or may be of cut Conseand cover construction. Tunnels may be designlined or unlined, and may be at any depth providbelow the ground surface. Tunnel lengths strengmay range from less than 100 feet to several traditimiles. Lining materials include brick and bends,both reinforced and unreinforced concrete. constr
y timbers and wood lagging (groutedigrouted) may also be used to supportwalls and ceilings. Tunnels may
F in shape and/or constructionial over their lengths.
ii Seismic Damage: Tunnels mayence severe damage in areas affectedmanent ground movements caused byIdes or surface fault rupture, but rarelysignificant internal damage fromI shaking alone. Landslides at tunnels can cause blockage. Damage hasioted at tunnel weak spots such asctions; bends, or changes in shape,
uction materials, or soil conditions.ge to lined tunnels has typically beenI to cracked lining.
ically Resistant Design: Lined tunnelsperforned better than unlined tunnels.quently, general Seismically resistant* practices for tunnels includeling reinforced concrete lining;thening areas that have beenonally weak such as intersections,, and changes in shape and inuction materials; and siting tunnels to
Appendix B: Lifeline Vulnerability Functions
D=1118
a
0)
C
D=YI)' X
Major
ATC-25 197

Br i dge
- 5a 1.00 30
67B
9
10
mlajort .00
a b0.217 0.7950.215 0.7800.142 0.434
-0.204 0.831-0.103 0.015
R b * days a
DAYS: 30 60 90 120 150 180 210 240Elapsed Time in Days
Residual capacity for major bridges (NEHRP California 7).
H=100x
.5coa
( R= ex
.c
C).Lr-
p
DAYS: 30 68 90
Bridgen-r a an -n
- L34 I [lo J
/ MH~~~~~~~~~~~~~~~~~~1
7 _8 -9 -1
/ ~ ~~ to -1Ja =
/ : R =~~~
I I I I I I
1.
Z70 300 330 365
t ajorI"E
a0.2150 142
0.2040 .103B .248
b
0.7808.4340 .0310.8150.006
b * days a
I I I
120 150 180 210 240 270 300 330
Elapsed Time in Days365
Residual capacity for major bridges (NEHRP Map Area 3-6, Non-California 7, and PugetSound 5).
Appendix B: Lifeline Vulnerability Functions
R=t00y
.5
C-)
-(A)C)
n- n. I i F
Figure B-2
Figure B-3
l
19w8 ATC-25

Bridge
a b8.142 8.432,ZB4 8.318.1EJ 0.815
.24H8 0.086
-0.421 8.B03
* ay
8E 90 128 15 186 218 248 2?8 381 330 365Elapsed Time in Days
Figure B-4 Residual capacity for major bridges (Al other areas).
eliminate fault crossings. Slope stability atportals should be evaluated and stabilizationundertaken if necessary.
2. Direct Damage
Basis: Damage curves for highway tunnelsare based on ATC-13 data for FC! 38,tunnels passing through alluvium '(seeFigure B-5). Tunnels passing throughalluvium are less vulnerable than cut-and-cover tunnels, and more vulnerable thantunnels passing through rock; they werechosen as representative of all existingtunnels. If inventory data identify tunnels, ascut-and-cover or passing through rock, thenuse FC 40 or 39, respectively, in lieu of FC38.
Standard construction is assumed torepresent typical California highway tunnelsunder present conditions (i.e., a compositeof older and more modern tunnels). Onlyminimal regional variation in constructionquality is assumed.
Present Conditions: In the absence of dataon the type of lining, age, etc., use thefollowing factors to modify the mean curves,under present conditions.:
NEHRP Map AreaCalifornia 7California 3-6Non-California 7Puget Sound 5All other areas
MMIIntensity
Shift'0+O
+1
Upgraded Conditions: For areas where itappears cost-effective to improve facilities,assume on a preliminary basis that upgradesresult in a beneficial intensity shift of oneunit (i.e., -1), relative to the above presentconditions.
Time-to-restoration: The Social Functionclass time-to-restoration data assigned to SF25b, tunnel for highway system, are assumedto apply to all tunnels. By combining thesedata with the damage curves for FC 38, thetime-to-restoration curves shown in Figures
Appendix B: Lifeline Vulnerability Functions
R= FEZ
.5
M
0
D5(0
R= xBAYs: 30
hajor
199ATC-25

Tunnel (Highway)
VII VIII IXModified Mercalli Intensity (MMI)
Figure B-5 Damage percent by intensity for I
B-6 and B-7 were derived for the variousNEHRP Map Areas.
B.1.3 Conventional Bridges
1. General
Description: Conventional bridges in thehighway system include all bridges withspans less than 500 feet. Construction mayinclude simple spans (single or multiple) aswell as continuous/monolithic spans. Bridgesmay be straight or skewed, fixed, moveable(draw bridge, or rotating, etc.), or floating.Reinforced concrete is the most commonconstruction material while steel, masonry,and wood construction are common at watercrossings. Typical foundation systemsinclude abutments, spread footings, batteredand vertical pile groups, single-columndrilled piers, and pile bent foundations.Bents may consist of single or multiplecolumns, or a pier wall. The superstructuretypically comprises girders and deck slabs.Fixed (translation prevented, rotationpermitted) and expansion (translation androtation permitted) bearings of various types
highway tunnels.
are used for girder support to accommodatetemperature and shrinkage movements.Shear keys are typically used to resisttransverse loads at abutments. Abutmentfills are mobilized during an earthquake asthe bridge moves into the fill (longitudinaldirection), causing passive soil pressures tooccur on the abutment wall.
Typical Seismic Damage: The mostvulnerable components of a bridge includesupport bearings, abutments, piers, footings,and foundations. A common deficiency isthat unrestrained expansion joints are notequipped to handle large relativedisplacements (inadequate support length),and simple bridge spans fall. Skewed bridgesin particular have performed poorly in pastearthquakes because they respond partly inrotation, resulting in an unequal distributionof forces to bearings and supports. Rockerbearings have proven most vulnerable.Roller bearings generally remain stable inearthquakes, except they may becomemisaligned and horizontally displaced.Elastomeric bearing pads are relativelystable although they have been known to
Appendix B: Lifeline Vulnerability Functions
D=108Y
,Sa D=S&;ECO
VI
Other
P.S.5 X
200 ATC-25

Tunnel (Highway)2sb 1.t0 3B t.0
M III a.
6 0.3447 0.2408 0.2049 0.131e 10.953
R * das + a
60 90 120 150 IBB 218Elapsed Time in Days
240 Z7 38 330 365
Residual capacity for highway tunnels (NEHRP Map Area: California 3-6, California 7,Non-California 7 and Puget Sound 5).
Tunnel (Highway)25h, 1.B 38
MI678910
L
9.24B0.204B. 183
;0. 953
_0.039
11 .456
8 .2120.189
0.819
R = * days +- a.
I 7 I I f a i i I-
60 90 128 150 198 210 240' 278 308 330 365
Elapsed Time in Days
Figure B-7 Residual capacity for highway tunnels (All other areas).
Appendix B: Lifeline Vulnerability Functions
-o
coO R= SE0
._
Go
b
0.8398.456la.2128.1890.036
DAYS: 30
Figure B-6
R=1007
R= SEz
w
m
ce}I
R.= O; L LDAYS: 30
l ; i l l l l l
I I I -
R= efl , I g ,~~~~~~~~~~~~~~~~~~~~~~~5; 5; 5;
2iEm
201ATC-25

"walk out" under severe shaking. Failure ofbackfill near abutments is common and canlead to tilting, horizontal movement orsettlement of abutments, spreading andsettlement of fills, and failure of foundationmembers. Abutment damage rarely leads tobridge collapse. Liquefaction of saturatedsoils in river channels and floodplains andsubsequent loss of support have causedmany bridge failures in past earthquakes.Pounding of adjacent, simply supportedspans can cause bearing damage andcracking of the girders and deck slab. Piershave failed primarily because of insufficienttransverse confining steel, and inadequatelongitudinal steel splices and embedmentinto the foundation. Bridge superstructureshave not exhibited any particularweaknesses other than being dislodged fromtheir bearings.
Seismically Resistant Design: Bridgebehavior during an earthquake can be verycomplex. Unlike buildings, which generallyare connected to a single foundationthrough the diaphragm action of the baseslab, bridges have multiple supports withvarying foundation and stiffnesscharacteristics. In addition, longitudinalforces are resisted by the abutments througha combination of passive backwall pressuresand-foundation embedment when the bridgemoves toward an abutment, but by only theabutment foundation as the bridge movesaway from an abutment. Significantmovement must occur at bearings beforegirders impact abutments and bear againstthem, further complicating the response. Toaccurately assess the dynamic response of allbut the simplest bridges, a three-dimensional dynamic analysis should beperformed. Special care is required fordesign of hinges for continuous bridges.Restraint for spans or adequate bearinglengths to accommodate motions are themost effective way to mitigate damage.Damage in foundation systems is hard todetect, so bridge foundations should bedesigned to resist earthquake forceselastically. In order to prevent damage topiers, proper confinement, splices, andembedment into the foundation should beprovided. Similarly, sufficient steel should beprovided in footings. Loads resisted bybridges may be reduced through use of
energy absorption features including ductilecolumns, lead-filled elastomeric bearings,and restrainers. Foundation failure can beprevented by ensuring sufficient bearingcapacity, proper foundation embedment,and sufficient consolidation of soil behindretaining structures.
2. Direct Damage
Basis: Damage curves for highway systemconventional bridges are based on ATC-13data for FC 24, multiple simple spans, andFC 25, continuous/monolithic bridges(includes single-span bridges). Highwaysystem conventional bridges in Californialocated within NEHRP Map Area 7 haveeither been constructed after 1971 or havebeen recently analyzed or are in the processof being seismically retrofitted, or both.These bridges are assumed to be bestrepresented by a damage factor half of FC25, continuous/monolithic (see Figure B-8).The conventional bridges located outsideCalifornia NEHRP Map Area 7 areassumed to be a combination of 50%multiple simple spans (FC 24) and 50%continuous/monolithic construction (FC 25)(see attached figure). If inventory dataidentify bridges as simple span, orcontinuous/monolithic, then use theappropriate ATC-13 data in lieu of theabove.
Standard construction is assumed torepresent typical California bridges under
- present conditions (i.e., a composite of olderand more modern bridges).
Present Conditions: In the absence of dataon the type of spans, age, or implementationof seismic retrofit, etc., the following factorswere used to modify the mean curves, underpresent conditions:
NEHRP Map Area
California 7California 3-6Non-CaliforniaPuget Sound 5All other areas
MM/Intensity
Shifta FC24 FC25
NA NA*+1 +1
7 +1 +10 +1+3 +3
* Special case, damage half of FC 25
202 Appendix B: Lifeline Vulnerability Functions ATC-25

Conventional
a
00)E virco
2~~~~~~~0eC~~~~
Modified Mercalli Intensity (MMI)
Figure B-8 Damage percent by intensity for conventional major bridges.
Upgraded Conditions: For areas. where itappears cost-effective to improve facilities,assume on a preliminary basis that upgradesresult in an beneficial intensity shift of oneunit (i.e., -), relative to the above presentconditions.
Time-to-restoration: The time-to-restoration data assigned to SF 25c,conventional bridges for the highway system,are assumed to apply to all bridges withspans shorter than 504 feet. By combiningthese data with the damage data from FC25, the attached time-to-restoration curvesfor conventional bridges within CaliforniaNEHRP Map Area 7 were derived. Bycombining the time-to-restoration data forSF 25c with the damage curves derived byusing the data for FC 24 and 25, the time-to-restoration curves shown in Figures B-9through B-11 were derived for the variousNEHRP Map Areas.
B-1.4 Freeways/Highways
1. General
Description: Freeways/highways includesurban and rural freeways (divided arterialhighway with full control of access), dividedhighways, and highways. Freeway/highwayincludes roadways, embankments, signs, andlights. Roadways include pavement, base,and subbase. Pavement types may be eitherportland cement concrete or asphalticconcrete. Base and subbase materialsinclude aggregate, cement treatedaggregate, and lime-stabilized, bituminous,and soil cement bases. Embankmrents may ormay not include retaining walls.
Typical Seismic Damage: Roadway damagecan result from failure of the roadbed orfailure of an embankment adjacent to theroad. Roadbed damage can take the form ofsoil slumping under the pavement, andsettling, cracking, or heaving of pavement.Embankment failure may occur incombination with liquefaction, slope failure,or failure of retaining walls. Such damage ismanifested by misalignment, cracking of theroadway surface, local uplift or subsidence,or buckling or blockage of the roadway.Sloping margins of fills where compaction is
ATC-25 Appendix B: Lifeline Vulnerability Functions 203
Br i dge
203ATC-25 Appendix B: Lifeline Vulnerability Functions

Canventiona 1
30 60 90 120 150 1B0 210 240 270 300 330 365Elapsed Time in Days
Figure B-9 Residual capacity for conventional bridges (NEHRP California 7).
BrZ!
idge ConventionalSc 1.00 25 0.0
24 S
aL 6 0.017 0 .0607 0.00 0.8308 0.010 0.8
f -0.:16 0.02
Rb * days a
DAYS: 30 60 90 120 150 180 210 240 270 300 330 365Elapsed Time in Days
Figure B-10 Residual capacity for conventional bridges (NEHRP Map Area 3-6, Non-California 7, andPuget Sound 5).
Appendix B: Lifeline Vulnerability Functions
Hz 10Hz
>10.
-°- R= Sex:
(na)
R= DAYS:
I1111 a b16 0.297 0.9077 0.272 0,7598 0 .096 0.0499 0 .874 0 . 021
10 -0.894 0.004
R =b *days + a
I I I I I I
H=1WZ
: ,
a)
C(I,
Cc
R= 0e
. l l l l l l
Bridge
z= nz I i i i - T , i i i i II
204 ATC-25

Conventicual
60 9B 12 15 180 210
Elapsed Time in Days241 ZYS S6 Jbb
Residual capacity for conventional bridges (All other areas).
commonly poor are particularly vulnerableto slope failure. Dropped overpass spans caneffectively halt traffic on otherwiseundamaged freeways/highways.
Seismically Resistant Design: Seismicallyresistant design practices include propergradation and compaction of existing soils aswell as bases and subbases. Roadway cutsand fills should be constructed as low as,practicable and natural slopes abuttinghighways should be examined for failurepotential.
2. Direct Damage
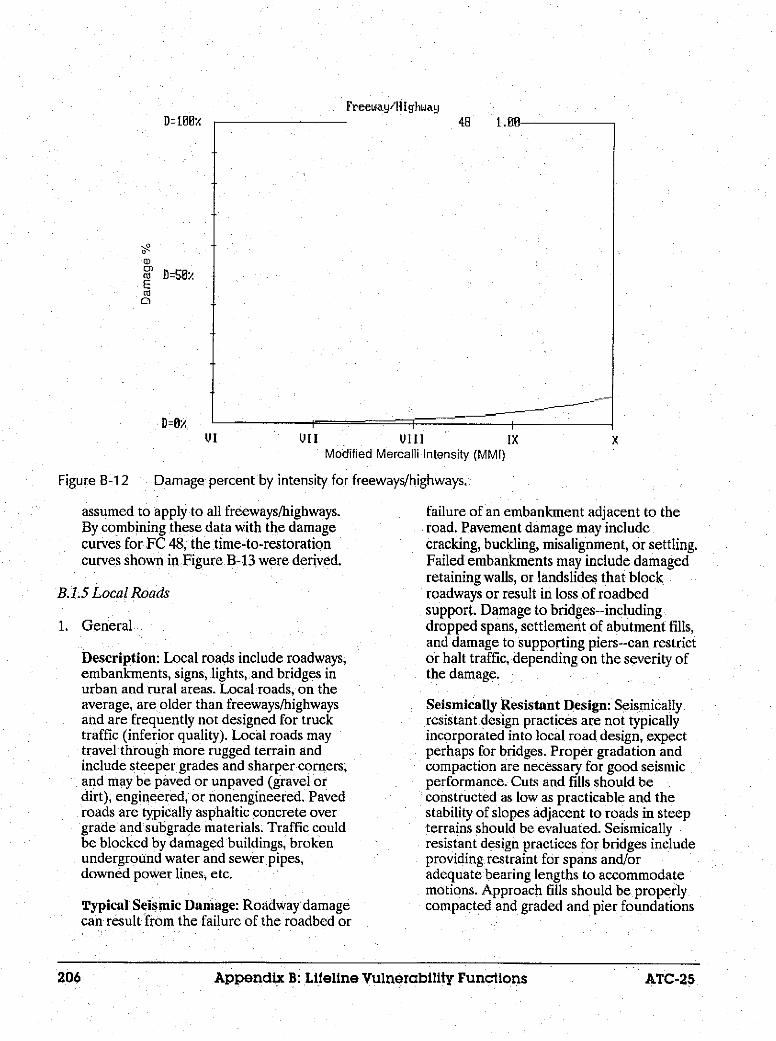
Basis: Damage curves for freeways/highwaysare based on ATC-13 data for FC 48,highways (see Figure B-12). Standardconstruction is assumed to represent typicalCalifornia freeways/highways under presentconditions (i.e., a composite of older andmore modern freeways/highways). It isassumed that no regional variation inconstruction quality exists.
Present Conditions: In the absence of dataon the type of construction, age,surrounding terrain, truck usage, etc., thefollowing factors were used to modify themean curves, under present conditions: -
NEHRP Man AreaCalifornia 7California 3-6Non-California 7Puget Sound 5All other areas
MMIIntensity
Shift3Th-
010
Upgraded Conditions: It is not anticipatedthat it will be cost-effective to upgradefacilities for the sole purpose of improvingseismic performance, except perhaps in veryisolated areas where supporting soils and/oradjacent embankments are unstable. Theeffect on overall facility performance inearthquakes will be minimal, and nointensity shifts are recommended.
Time-to-restoration: The time-to-restoration data assigned to SF 25d,freeways and conventional highways, are
205Appendix B: Lifeline Vulnerability Functions
_5c-
_0
-Dcocc
R= Z
R= ex
DAYS: 31
Figure B-1 1
Bridage
-
ATC-25
Freeway/Il ighway
VII Vi: l lxModified Mercalli Intensity (MMI)
Figure B-1 2 Damage percent by intensity for freeways/highways.
assumed to apply to all freeways/highways.By combining these data with the damagecurves for FC 48, the time-to-restorationcurves shown in Figure B-13 were derived.
B.1.5 Local Roads
1. General
Description: Local roads include roadways,embankments, signs, lights, and bridges inurban and rural areas. Localroads, on theaverage, are older than freeways/highwaysand are frequently not designed for trucktraffic (inferior quality). Local roads maytravel through more rugged terrain andinclude steeper grades and sharper corners,and may be paved or unpaved (gravel ordirt), engineered, or nonengineered. Pavedroads are typically asphaltic concrete overgrade and subgrade materials. Traffic couldbe blocked by damaged buildings, brokenunderground water and sewer pipes,downed power lines, etc.
Typical Seismic Damage: Roadway damagecan result from the failure of the roadbed or
failure of an embankment adjacent to theroad. Pavement damage may includecracking, buckling, misalignment, or settling.Failed embankments may include damagedretaining walls, or landslides that blockroadways or result in loss of roadbedsupport. Damage to bridges--includingdropped spans, settlement of abutment fills,and damage to supporting piers--can restrictor halt traffic, depending on the severity ofthe damage.
Seismically Resistant Design: Seismicallyresistant design practices are not typicallyincorporated into local road design, expectperhaps for bridges. Proper gradation andcompaction are necessary for good seismicperformance. Cuts and fills should beconstructed as low as practicable and thestability of slopes adjacent to roads in steepterrains should be evaluated. Seismicallyresistant design practices for bridges includeproviding restraint for spans and/oradequate bearing lengths to accommodatemotions. Approach fills should be properlycompacted and graded and pier foundations
206 Appendix B: Lifeline Vulnerability Functions ATC-25
.40 4 Oa,to I.Mi
a,0)EW
VI X
206 Appendix B: Lifeline Vulnerability Functions ATC-25
'reeuag/Highuay25& 1.0 48
nMIh789
to
1.08
0. 130
8 .H
E .824
e .024
b
1.3938.171O.V738.2853
0.032
R = * days a
I I I I I
68 90 126 158 188 218 240 272
Elapsed Time in Days380 330 36
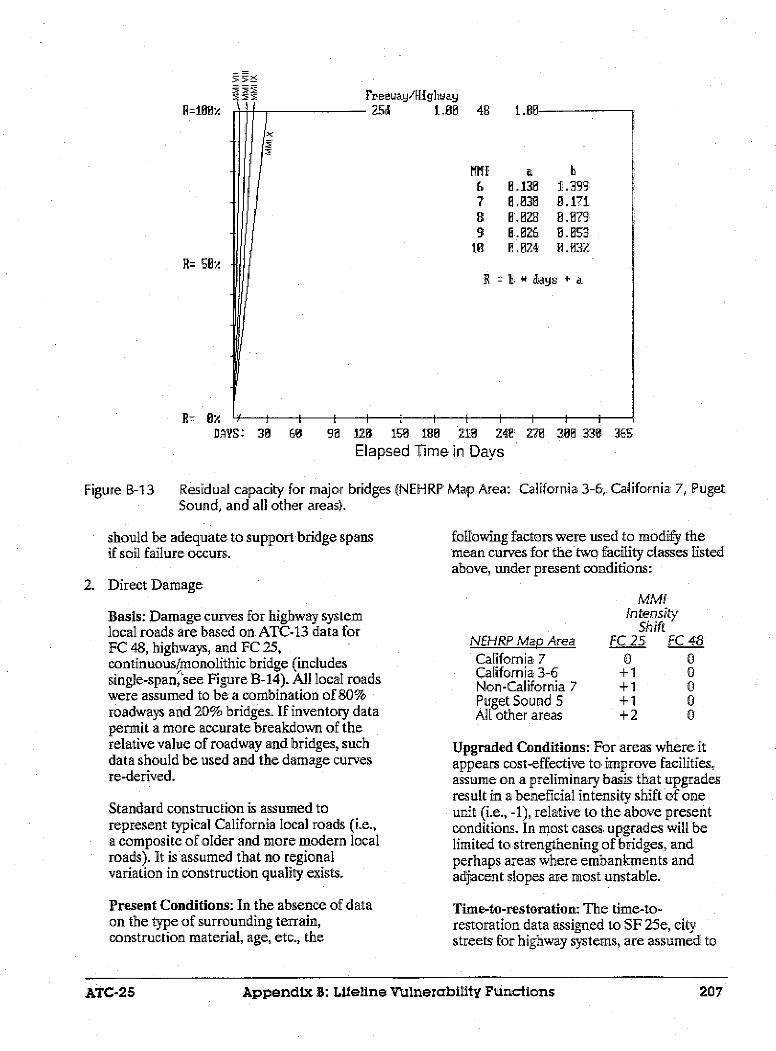
Residual capacity for major bridges (NEHRP Map Area: California 3-6, California 7, PugetSound, and all other areas).
- should be adequate to support bridge spansif soil failure occurs.
2. Direct Damage
following factors were used to modify themean curves for the two facility classes listedabove, under present conditions:
Basis: Damage curves for highway systemlocal roads are based on ATC-13 data forFC 48, highways, and FC 25,continuous/monolithic bridge (includessingle-span,'see Figure B-14). All local roads,were assumed to be a combination of 80%roadways and 20% bridges. If inventory datapermit a more accurate breakdown of therelative value of roadway and bridges, suchdata should be used and the damage curvesre-derived.
Standard construction is assumed torepresent typical California local roads (i.e.,a composite of older and more modern localroads). It is assumed that no regionalvariation in construction quality exists.
Present Conditions: In the absence of dataon the type of surrounding terrain,construction material, age, etc., the
NEHRP Map AreaCalifornia 7California 3-6Non-California 7Puget Sound 5All other areas
MMIIntensity
ShiftFC25 FC48
o 0+1 0+1 0+1 0+2 0
Upgraded Conditions: For areas where itappears cost-effective to improve facilities,assume on a preliminary basis that upgradesresult in a beneficial intensity shift of oneunit (i.e., -1), relative to the above presentconditions. In most cases. upgrades will belimited to strengthening of bridges, andperhaps, areas where embanluments andadjacent slopes are most unstable.
Time-to-restoration: The time-to-restoration data assigned to SF 25e, citystreets for highway systems, are assumed to
ATC-25 Appendix B: Lifeline Vulnerability Functions 207
55Žx
=100
R= 5;
DfAYS: 36
Figure B-13
R7 Oz: 4 I
ATC-25 Appendix B: Lifeline Vulnerability Functions 207

4b t.WJ25 0.20
Other
: ' ~~~~~~/:R/
/ : CA 3-6< NonCA7
f~~~~.. -:
- .; ~~~~~~CA7 7
- : 1 iModified Mercalli Intensity (MMI)
Ix
Damage percent by intensityfor local roads.
apply to all local roads. By combining thesedata with the damage curves derived usingthe data for FC 25 and 48, the time-to-restoration curves shown in Figures B-15through B-17 were derived.
B.2 Railway
B.2.1 Bridges
1. General
Description: In general, railway bridges maybe steel, concrete, wood or masonryconstruction, and their spans may be anylength. Included are open and ballastedtrestles, drawbridges, and fixed bridges.Bridge components include a bridge deck,stringers and girder, ballast, rails and ties,truss members, piers, abutments, piles, andcaissons. Railroads sometimes share majorbridges with highways (suspension bridges),but most railway bridges are older andsimpler than highway bridges. Bridges thatcross streams or narrow drainage passagestypically have simple-span deck plate girdersor beams. Longer spans use simple trusses
supported on piers. Only a few of the morerecently constructed bridges havecontinuous structural members.
Typical Seismic Damage: The major causeof damage to trestles is displacement ofunconsolidated sediments on which thesubstructures are supported, resulting inmovement of pile-supported piers andabutments. Resulting superstructuredamage has consisted of compressed decksand stringers, as well as collapsed spans.Shifting of the piers and abutments mayshear anchor bolts. Girders can also shift ontheir piers. Failures of approaches or fillmaterial behind abutments can result inbridge closure. Movable bridges are morevulnerable than fixed bridges; slightmovement of piers supporting drawbridgescan result in binding so that they cannot beopened without repairs. Movable spanrailroads are subject to misalignments, andextended closures-are required for repairs.
Seismically Resistant Design: Seismicallyresistant design practice should includeproper siting considerations and details to
208 Appendix B: Lifeline Vulnerability Functions ATC-25
Local Roads
D=100v
80
a)' D=S07.E(an
' D=6/.
UI
Figure B-1 4
V11l X
C ram n n[z t
Appendix -B: Lifeline Vulnerabilityviinations .ATC�_25208

L
R =b *das + a
90 128 150 188 218 Z48 Z?
Elapsed Time in Days38 330 365
Residual capacity for local roads NEHRP California 7).
H= z 1' 3 I
DAYS' 3a 68
Local oads- e 1.03 4d Ul.b
Zs 8.28
MII
678.9
to
a-0. 253
-a.242-8.141-W.0to
7.85501 .4640.1030.843H.O21
R = * +dys a
1 1 1 a II I I a E
98 128 158 188 218Elapsed Time in Days
248 27 3 330 365
Figure B-t 6 Residual capacity for local roads (NEHRP Map Area 3-6, Non-California 7, and PugetSound 5).
Appendix B: Lifeline Vulnerability Functions
Local PkLds- 25e B i .130
5 ,0.20
R= 5B7
-5
0
-3ru
a)
R=
a-1. 808
-0 160-B. 166
-B .180-0. iii
b
'T. 125
'B. 140
B. B98. B2B
30 6
Figure B-1 5
R=1BWA
5.1
;) E- soy
r1
DAYS:I I C
sn. n ns
i . I I
209VATC-25
Local Roads-- are lf
I I I
90 120 150 180 210Elapsed Time in Days
4ff n fa
I I I i
240 270 300 338 365
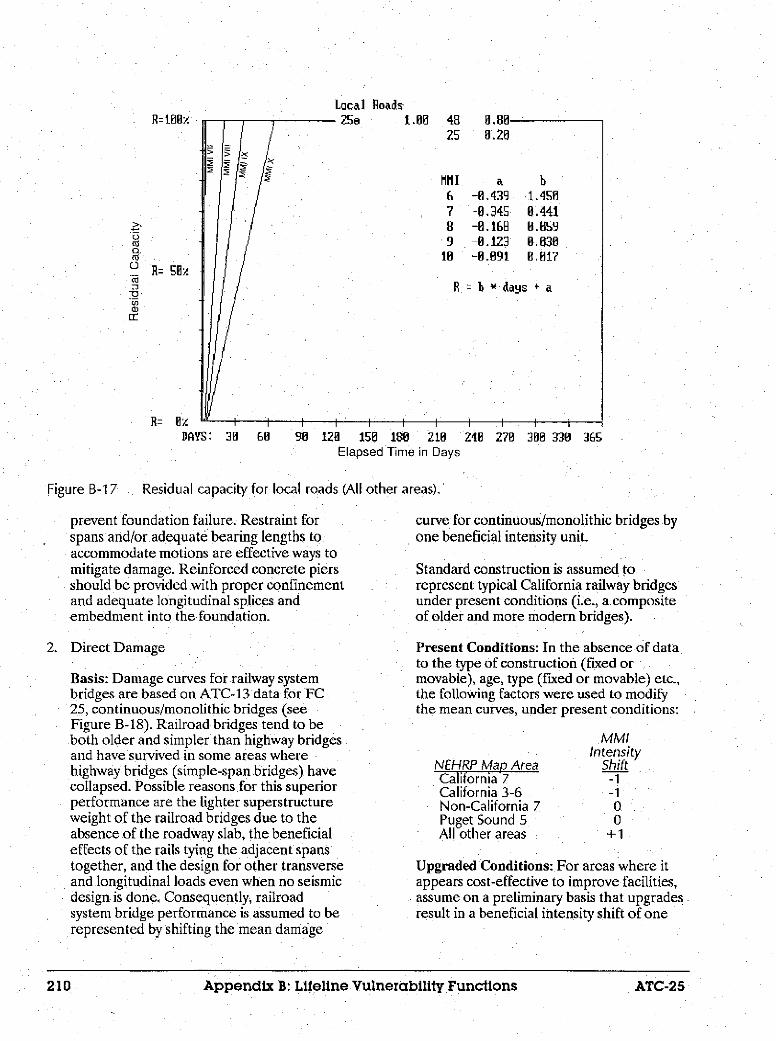
Figure B-1 7 Residual capacity for local roads (All other areas).'
prevent foundation failure. Restraint forspans and/or adequate bearing lengths toaccommodate motions are effective ways tomitigate damage. Reinforced concrete piersshould be provided with proper confinementand adequate longitudinal splices andembedment into the foundation.
2. Direct Damage
Basis: Damage curves for railway systembridges are based on ATC-13 data for FC.25, continuous/monolithic bridges (seeFigure B-18). Railroad bridges tend to beboth older and simpler than highway bridgesand have survived in some areas wherehighway bridges (simple-span bridges) havecollapsed. Possible reasons for this superiorperformance are the lighter superstructureweight of the railroad bridges due to theabsence of the roadway slab, the beneficialeffects of the rails tying the adjacent spanstogether, and the design for other transverseand longitudinal loads even when no seismicdesign is done, Consequently, railroadsystem bridge performance is assumed to berepresented by shifting the mean damage
curve for continuous/monolithic bridges byone beneficial intensity unit.
Standard construction is assumed torepresent typical California railway bridgesunder present conditions (i.e., a compositeof older and more modem bridges).
Present Conditions: In the absence of datato the type of construction (fixed ormovable), age, type (fixed or movable) etc.,the following factors were used to modifythe mean curves, under present conditions:
NEHRP Map AreaCaliornia 7California 3-6Non-California 7Puget Sound 5All other areas
MMIIntensity
Shift-1-100
+1
Upgraded Conditions: For areas where it appears cost-effective to improve facilities,assume on a preliminary basis that upgradesresult in a beneficial intensity shift of one
Appendix B: Lifeline Vulnerability Functions
R=0ofl
.5
CU° R= 57a_,
R= x
f1UI.OU25 0.28
MlII a b
6 -0.439 1.9507 -8.345 0.441B -0.168 0.0599 -8.123 0.838
10 -0.091 0.017
R = b * days + a
DAYS: 30 60
210 ATC-25

a)
ra D=90ME
VI
Other
Non-CA 7CA PS3
CA 7
Modified Mercalli ntensity (Mlii)
Damage percent by intensity for railway bridges.
unit (i.e., -1), relative to the above presentconditions.
Time-to-restoration: The time-to-restoration data assigned to SF 26a, railwaybridges, are assumed to apply to all railwaybridges. By combining these data with thedamage curves for FC 25, the time-to-restoration curves shown in Figures. B-19through B-21 were derived.
B.2.2 Tunnels
1. General
Description: In general, tunnels may passthrough alluvium or rock, or may be of cut-and-cover construction Tunnels may belined or unlined, and may be at any depthbelow the ground surface. Tunnel lengthsmay range from less than 100 feet to severalmiles. Lining materials include brick,reinforced and unreinforced concrete, andsteel. Heavy timbers and wood lagging(grouted and ungrouted) may also be usedto support tunnel walls and ceilings. Tunnels
may change in shape and/or constructionmaterial over their lengths.
Typical Seismic Damage: Tunnels mayexperience severe damage in areas affectedby permanent ground m ovements due tolandslides or surface fault rupture, but rarelysuffer significant internal damage fromground shaking alone. Landslides at tunnelsportals can cause blockage. Damage hasbeen noted at tunnel weak spots such asintersections; bends; or changes in shape,construction materials, or soil conditions.Damage to lined tunnels has typically beenlimited to cracked lining.
Seismically Resistant Design: Lined tunnelshave performed better than unlined tunnels.Consequently, general Seismically resistantdesign practices for tunnels, includeproviding reinforced concrete lining;strengthening areas that have beentraditionally weak such as intersections,bends, changes in shape and in constructionmaterials; and siting tunnels to eliminatefault crossings. Slope stability at portals
Appendix B: Lifeline Vulnerabiliy Functions
Bridge (Railway)25 .O0
Figure B-1 8
X
ATCC-25 211

Bridge (Railway)4 GO Ra 4 O
30 60 90 120 150 180 210 240 Z7 308 330 365Elapsed Time in Days
Residual capacity for railway bridges (NEHRP California 7).
Bridge (Railway)1.00 25
90 120 150 180 210Elapsed Time in Days
4 01
i~ ~~ I'M Ir
Figure B-20 Residual capacity for railway bridges (NEHRP Map Area 3-6, Non-California 7, and PugetSound 5).
Appendix B: Lifeline Vulnerability Functions T
R=100;x
,.
CZC)
a)
Q
coa)rc
H= 5%
-. Dd
1111 a b
7 -0.8 1.4518 -8.189: 1.1929 -0.878 0.069
16 -0.065 0.0Z9
R = b * days a
itI I I I I I� I I0 - .
n- V.DAYS:
Figure B-19
h=100,
: >s
a._
coC_CU
0 R=Se--a)Er
R= e LDAYS:
H111 a b6 -0.208 1.4517 -0. 9 1. i1928 -0.078 0.0699 -8.065 0.829
16 -8.023 0.005
H = b * days + a
3 630 60
| l l
,
if I I I I I I I
1 ,v."u-
I I � I - - i
oun oqn ona ono Sf cJOU JJU J=
ATC-25. I - 1 I,212.

lilf a b- . 183 1.192
7 -. 87, 8.8&9B -E.865 8. M29 -E.823 E.BE5
10 -0.012 0. 04
= da9s + &
R= flyDAYS: 3 68 98 128 158 188 218 249 Z78 30 338 365
Elapsed Time in Days
Figure B-21 Residual capacity for railway bridges (All other areas).
should be evaluated and stabilizationundertaken if necessary.
factors were used to modify the meancurves, under present conditions:
2. Direct Damage
Basis: Damage curves for railway tunnelsare based on ATC-1¶3 data for FC 38,tunnels passing through alluvium (seeFigure B-22). Tunnels passing throughalluvium are less vulnerable than cut-and-cover tunnels, and more vulnerable thantunnels passing through rock; they werechosen as representative of all existingtunnels. If inventory data identify tunnels ascut-and-cover or passing through rock, thenuse ATC-13 FC 40 or 39, respectively, inlieu of FC 38.
Standard construction is assumed torepresent typical California railroad tunnelsunder present conditions (Le., a compositeof older and more modem tunnels). Onlyminimal regional variation in constructionquality is assumed.
Present Conditions: In the absence of datato the type of lining, age, etc., the following
NFHRP Map AreaCalifornia 7California 3-6Non-California 7Puget Sound 5All other areas
mm[Intensity
Sh ift 00001
Upgraded Conditions: For areas where itappears cost-effective to improve facilities,assume on a preliminary basis that upgrades.result in a beneficial intensity shift of oneunit (i.e., -1), relative to the above presentconditions.
Time-to-restoration: The time-to-restoration data assigned to SF 26b, railroad
- system tunnels, are assumed to apply to alltunnels. By combining these data with thedamage curves for FC 38, the time-to-restoration curves shown in Figures B-23and B-24 were derived.
Appendix B: Lifeline Vulnerability Functions
R=180Z
-50-Ca00
-D
.0
R= SE
-
... . t
ATC-25 � 213

Tunnel (Railway))O- 4 MA4
:~~~ :
OtheCA 7
1 1 Kl~~~~nn-r.A 7
Vill ix P.S.5 XModified Mercalli Intensity (MMI)
Damage percent by intensity for railway tunnels.
_
R=1Ovv
Ca'
aCZ'
na)cc
R= 0XDAYS: 30 60 90 120 150 180 210 240 ZI 38 JJU zbb
Elapsed Time in Days
Residual capacity for railway tunnels (NEHRP Map Area: California 3-6, California 7,Non-California 7, and Puget Sound 5).
214 Appendix B: Lifeline Vulnerability Functions ATC�25L
D=1800
CD0)
ECa0
VI
Figure B-22
VII
38 1.00
MHI a b6 0.344 0.8397 i0, 248 0.456B 0.284 0.2129 8.183 0.109
10 0.053 8.036
R = b * days + a
Figure B-23
I
D=SOY.
My)
Appendix B: Lifeline Vulnerability Functions ATC-25-214

Tunnel fRnilwvavI
10 38 i
MMI
27 8.2B 81.9 2.2
ie -E.
R b *
S
68 9U 120 158 10 218Elapsed Time in Days
248 278 300 338 365
Figure B-24 Residual capacity for railway tunnels (All other areas).
B.23 Tracks/Roadheds
I. General
Description: In general, track/roadbed inthe railway system includes ties, rail, ballastor roadbed, embankments, and switches.Ties may be wood or prestressed concrete.Rail is exclusively steel and is periodicallyfastened to ties with spikes and/or steel clips.Roadbed typically includes importedaggregate on prepared subgrade.
Typical Seismic Damage: The mostfrequent source of damage to track/roadbedis settlement or slumping of embankinents.Landslides can block or displace tracks.Settlement or liquefaction of roadbeds inalluvial areas is also a source of damage.Only in extreme cases are rails and roadbedsdamaged by shaking alone.
Seismically Resistant Design: Seismicdesign practice includes providing specialattention to the potential for failure ofslopes adjacent to the tracks; cut slopes andfills are particularly susceptible. The
potential for track failure can be reduced byproperly grading and compacting importedtrack bed materials and by keeping cuts andfills as low as practicable. Track alignmentsmust be precise and the track clear of debrisfor train operations.
2. Direct Damage
Basis: Damage curves for railroad systemtracks/roadbeds are based on ATC-13 datafor FC 47, railroads (see Figure B-25).Standard construction is assumed torepresent typical California tracks/roadbeds(i.e., a composite of older and more moderntracks/roadbeds). Age may not be asimportant a factor for tracks/roadbeds as it isfor other facilities, because the compaction*of soils in poor grounds through usage mayimprove their behavior significantly. Onlyminimal regional variation in constructionquality is assumed.
Present Conditions: In the absence of datato the type of material, age, etc., thefollowing factors were used to modifr themean curves, under present conditions:
Appendix B: Lifeline Vulnerability Functions
5 M
0
a0Eo
C,
C R 5;
R= x
DAYs: 30
3
P1
3
11
I
2-15A.TC-25

Track/Roadbed
47 i -A0
M i I IXModified.Mercalli Intensity (MMI)
Figure B-25 Damage percent by intensity.for.tracks/roadbeds.
MMI DescIntensity or snr
NEHRP Map Area Shift may I
California 7 0 fromCalifornia 3-6 0 bNon-California 7 0 bealPuget Sound 5 incluAll other areas 0 well
comE
Upgraded Conditions: It is not anticipated Limitthat it will be cost-effective to retrofit termifacilities for the sole purpose of improvingseismic performance, except perhaps in very Typilisolated areas where the slopes and soils are termiunstable. The effect on overall facility expelperformance in earthquakes will be minimal, dameand no intensity shifts are recommended. crack
total
Time-to-restoration: The time-to- anch,restoration data assigned to SF 26c, railways, expeare assumed to apply to all tracks/roadbeds. pipinBy combining these data with the damage the scurves for FC 47, the time-to-restoration shakicurves shown in Figure B-26 were derived.
Seis]
B.2.4 Terninal Stations resistall bi
1. General seisn
ription: Terminal stations may be largeWaIl. The structure housing the stationgenerally be any type of constructionsteel frame to unreinforced masonryng walls. The terminal station typicallydes switching and control equipment, asis electrical and mechanical equipmentnonly found in commercial buildings.
ted lengths of rails are also included ininal stations.
cal Seismic Damage: In general,inal stations in railway systems mayrience generic building and equipmentage. Building damage may range fromks in walls and frames to partial andcollapse. Unanchored or improperlyored equipment may-slide or topple,riencing damage or causing attachedig and conduit to fail. Rail damage inwitching yard will occur due to severeing or ground failure only.
nically Resistant Design: SeismicallyLant design practice includes, performingjilding design in accordance withiic provisions of national or local
Appendix B: Lifeline Vulnerability Functions
ID=10v
g" D=90YE0
uu/.s
VI I I
ATC-25216
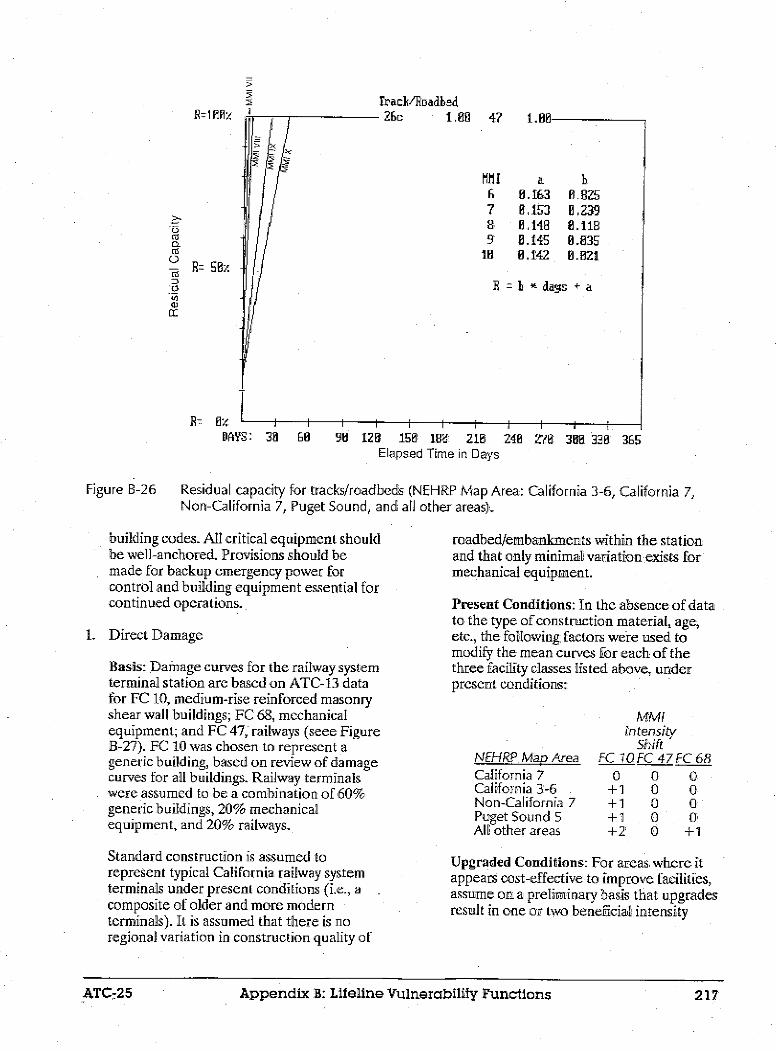
Track/Roadbed- 26k 1.80
I
R =I * days + a
DAYS: 38 88 90 120 150 188 2101 240 278 388 338 365Elapsed Time in Days
Residual capacity for tracks/roadbeds (NEHRP Map Area: California 3-6, California 7,Non-California 7, Puget Sound, and all other areas).
building codes. All critical equipment shouldbe well-anchored. Provisions should bemade for backup emergency power forcontrol and building equipment essential forcontinued operations..
1. Direct Damage
Basis: Damage curves for the railway systemterminal station are based on ATC-13 datafor FC 10, medium-rise reinforced masonryshear wall buildings; FC 68, mechanicalequipment; and FC 47, railways seee FigureB-27). FC 10 was chosen to represent ageneric building, based on review of damagecurves for all buildings. Railway terminalswere assumed to be a combination of 60%generic buildings, 20% mechanicalequipment, and 20% railways.
roadbed/embankments within the stationand that only minimal variation exists formechanical equipment.
Present Conditions: In the absence of datato the type of construction material, age,etc., the following factors were used tomodify the mean curves for each of thethree facility classes listed above, underpresent conditions:
NEHRP Map AreaCalifornia 7California 3-6Non-California 7Puget Sound 5All other areas
MM!Intensity
ShiftFC OFC 47FC 68
0 0 0+1 0 0+1 0 0+1 0 0+2 0 +1
Standard construction is assumed torepresent typical California railway systemterminals under present conditions (i.e., acomposite of older and more modernterminals). It is assumed that there is noregional variation in construction quality of
Upgraded Conditions: For areas, where itappears cost-effective to improve facilities,assume on a preliminary basis that upgradesresult in one or two beneficial intensity
Appendix B: Lifeline Vulnerability Functions
>
4 ani:4 Il.sDUR-IF10
_
CL06
c) R= 58x. _:3412
in
a0.163El 1530.1488.145a.142
b0.S5
.s239'M. 10.8350.021
Figure B-26
| l lRz O/ I j I i
ATC-25 217

Terninal Station
80
a)
EcE0
VI VII
1
Other
Vill IxModified Mercalli Intensity (MMI)
Damage percent by intensity for railway terminal stations.
shifts (i.e., -1 or -2), relative to the abovepresent conditions.
Time-to-restoration: The time-to-restoration data assigned to SF 26d, terminalstations for railway systems, are assumed toapply to all terminal stations. By combiningthese data with the damage curves derivedusing the data for FC 10, 47, and 68, thetime-to-restoration curves shown in FiguresB-28 through B-30 were derived.
B.3 Air Transportation
B.3.1 Terminals
1. General
Description: In general, air transportationterminals include terminal buildings, controltowers, hangars, and other miscellaneousstructures (including parking garages andcrash houses). These structures may beconstructed of virtually any buildingmaterial, although control towers aretypically reinforced concrete shear wallbuildings and hangars are either steel or
wood long-span structures. Equipment at airterminals ranges from sophisticated control,gate, and x-ray equipment to typicalelectrical and mechanical equipment foundin commercial buildings. Airplane refuelingis accomplished by either on-site or off-sitefuel tanks and underground pipelines.
Typical Seismic Damage: Damage mayinclude generic building and equipmentdamage. Building damage may range frombroken windows and cracks in walls andframes to partial and total collapse.Unanchored or improperly anchoredequipment may slide or topple, experiencingdamage or causing attached piping andconduit to fail. The source of this damagecan be ground shaking or soil failure, asmany airports are located in low-lyingalluvial regions. Gate. equipment maybecome misaligned and inoperable. Fueltanks and fuel lines may rupture orexperience damage, reducing or eliminatingrefueling capacity. Tank damage mayinclude wall buckling, settlement, rupturedpiping, or loss of contents, or even collapse.Such collapses could lead to fires and
218 Appendix B: Lifeline Vulnerability Functions ATC-25
Figure B-27
X
Appendix B: Lifeline Vulnerability Functions ATC-25218

Termial Station- 26d LOB
ii
to 1.
HI
6 0.27 8.2B E.1
3 1.1E 0.
R = *
68 90 128 158 182 212
Elapsed Time in Days248 270 3 330 365
Residual capacity for railway terminal stations (NEHRP California 7).
rerminaI Station1.82 1 1.82
MI
7
10
a2.222O. 1418. I68 .8138H.H&M
B * days a
92 120 152 182 218Elapsed Time in Days
240 272 300 330 365
Residual capacity for railway terminal' stations (NEHRP Map Area 3-6, Non-California 7,and Puget Sound 5).
Appendix B: Lifeline Vulnerability Functions 219
-5O:Luw
-o(n
E
DAYS: 0
Figure B-28
-U0-C-aw
-oU'n
QcfE
R= 07
bH. 1321
O.H19
. I H.. 21
DAYS 38
Figure B-29
60
I - - -f - - - 4 - - -; I I
I ' 1 1l l
R= ;e, & , , b
- ---- F -jI I~~~~~~~~~
ATC-25

R=t11Bi/
._
(a
-Ca
U)a)EC
U- MU
DAYS: 3 60 90
Terminal Station
120 150 IBO 210
Elapsed Time in Days240 270 30 330 365
Figure B-30 Residual capacity for railway termii
explosions. Damage to ground access andegress routes may seriously affectoperations. Airports in low-lying areas maybe subject to damage due to flooding ortsunamis.
Seismically Resistant Design: Buildingdesign should be performed in accordancewith seismic provisions of building codes.Control-tower design should receive specialattention based on its importance and thefact that the geometry of the tower makes itprone to earthquake damage. Enhanceddesign criteria (e.g., a higher importancefactor) may be appropriate for controltowers. All critical equipment should beanchored. Provisions should be made forbackup emergency power for controlequipment and landing lights.
2. Direct Damage
Basis: Damage curves for air transportationsystem terminals are based on ATC-13 datafor FC 10, mid-rise reinforced masonryshear wall buildings; FC 43, on-ground liquidstorage tanks; and FC 91, long-span
nal stations (All other areas).
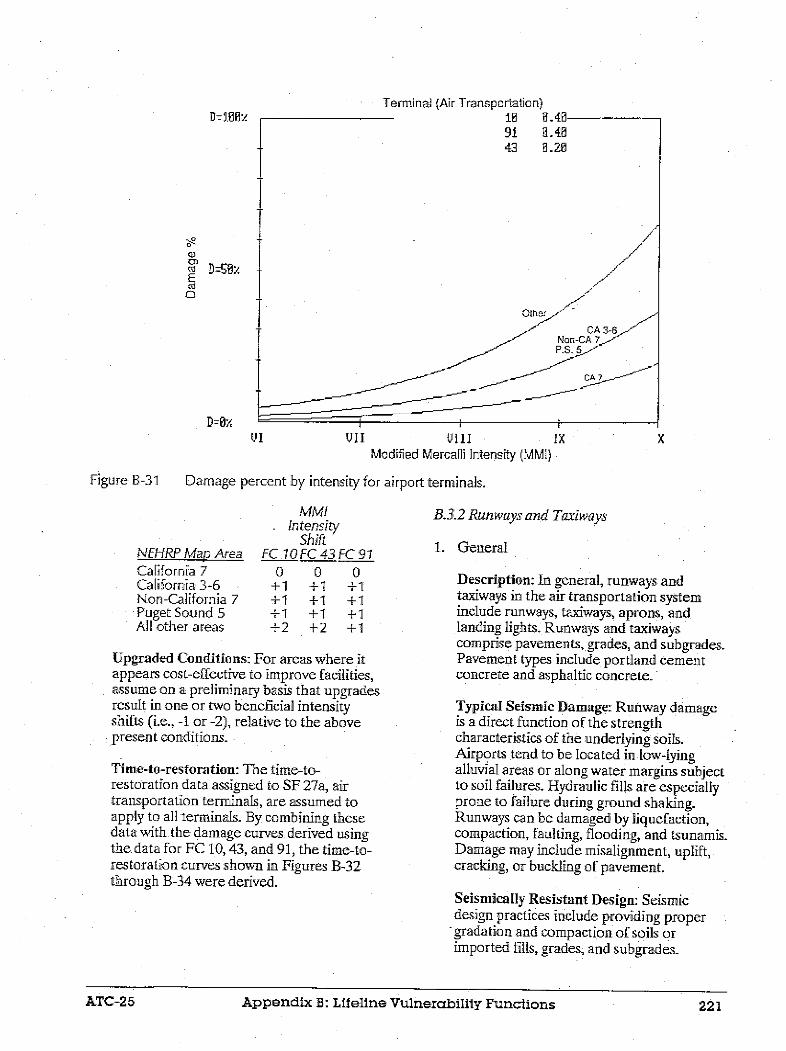
structures (see Figure B-31). FC 10 waschosen to represent a generic building,based on review of damage curves for allbuildings. Air transportation systemterminals are assumed to be a combinationof 40% generic buildings, 40% long-spanstructures, and 20% on-ground liquidstorage tanks.
Standard construction is assumed torepresent typical California air terminalsunder present conditions (i.e., a compositeof older and more modern terminals). Onlyminimal regional variation in constructionquality of long-span structures is assumed, asdesign wind and seismic loads may becomparable.
Present Conditions: In the absence of dataon the type of construction, age, etc., thefollowing factors were used to modify themean curves for each of the three facilityclasses listed above, under presentconditions:
ATC-25Appendix B: Lifeline Vulnerability Functions
10 1.00
1MI a b6 0.141 00357 0.187 8.819B 0.08 0.8109 1.860 8.886
10 11. 52 e.005
H =b * days a
I I
-
I - . I
220
R=
1 , , ,
Terminal
91 8.4<43 0.20
Other A/
VII Vil IX XModified Mercalli Intensity (MM[)
Damage percent by intensity for airport terminals.
MMI. In tensity
ShiftFC 10 FC 43 FC 91
0 0 0+1 +1 +1+1 +1 +1+1 +1 +1+2 +2 +1
Upgraded Conditions: For areas where itappears cost-effective to improve facilities,assume on a preliminary basis that upgradesresult in one or two beneficial intensityshifts (i.e., -1 or -2), relative to the abovepresent conditions.
Time-to-restoration: The time-to-restoration data assigned to SF 27a, airtransportation terminals, are assumed toapply to all terminals. By combining thesedata with the damage curves derived usingthe data for FC 10; 43, and 91, the time-to-restoration curves shown in Figures B-32through B-34 were derived
B.3.2 Runwaysand Taxiways
1. General
Description: In general, runways andtaxiways in the air transportation systeminclude runways, taxiways, aprons, andlanding lights. Runways and taxiwayscomprise pavements, grades, and subgrades.Pavement types include portland cementconcrete and asphaltic concrete.
Typical Seismic Damage: Runway damageis a direct function of the strengthcharacteristics of the underlying soils.Airports tend to be located in low-lyingalluvial areas or along water margins subjectto soil failures. Hydraulic fills are especiallyprone to failure during ground shaking.Runways can be damaged by liquefaction,compaction, faulting, flooding, and tsunamis.Damage may include misalignment, uplift,cracking, or buckling of pavement.
Seismically Resistant Design: Seismicdesign practices include providing proper
- gradation and compaction of soils orimported fills, grades, and subgrades-
ATC-25 Appendix B: Lifeline Vulnerabilijy Functions 221
Dz=IUz
CD0,
co Dz=9tY
co
Dz=OxHI
Figure B-31
NEHRP Map AreaCalifornia 7California 3-6Non-California 7Puget Sound 5All other areas
ATC-25 Appendix B: Lifeline Vulnerability Functions 21

Terminal (Air Transportation)27a 1.00 10 H.41
91 0.4043 8.20
a b0.010 11.2620,848 3.864
-0.004 0.206-8.10 0. 056-8.012 :.013
Mi,16
7B9.
10
R = b * days + a
I I I I II I
120 15 180 216 240Elapsed Time in Days
270 300 338 365
Figure B-32 Residual capacity for airport terinals (NEHRP California 7).
Terminal (Air Transportation)- a fa 4 0 A a
2, a IL~ M U y ~ s91 .4643 8.20
/MNtH a b
" 6 0.040 3.8647 -0.004 0.2068 -0.010 0. 056
9 -0.612 0.01318 -0.006 0.004
- U L .1. -
I I I I
9 60 128 156 180 210 240 276 300 338. 365
Elapsed Time in Days
* Residual capacity for airport terminals (NEHRP Map Area 3-6, Non-California 7, and
Puget Sound 5). I
Appendix B: Lifeline Vulnerability Functions A
R=10v
0-a(
'a
a)cc
R= W*e- S: I8DAYS: 30
6 r60 90
�Iflt3/.
C,.0aCO
0 R=
.'a
r
n- B..
DAY"
I / /
i' 3: 30 60
Figure B-33
222
° R=
I
t
H=1JU
n - U - "ayl, - a
, , r , . . . . .. . . . . . . . .
� ATC-25

R=20;y
coCu
C,
R= ODAYS: 3 68 90 128 I58! 180 218 2
Elapsed Time n Days
Figure B-34 Residual capacity for airport terminals All other areas
2. Direct Damage
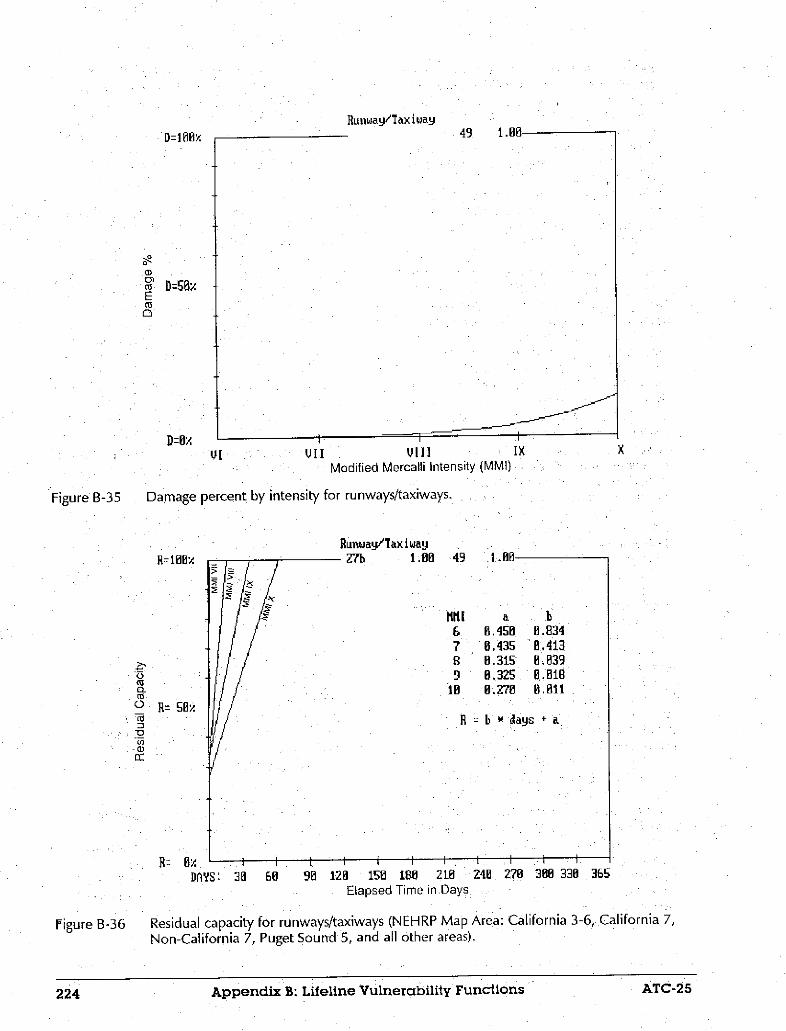
Basis: Damage curves for air transportationsystem runways and taxiways are based onATC-13 data for FC 49, runways, (see FigureB-35). Standard construction is assumed torepresent typical California runways andtaxiways under present conditions (ie., acomposite of older and more modernrunways).
Present Conditions: In the absence of dataon the type of soils, material, age, etc., thefollowing factors were used to modify themean curves, under present conditions:
HfRP Map AreaCalifornia'7California 3-6Non-California 7Puget Sound 5All other areas
Mm/IntensityShift
0,0000
Upgraded Conditions: For areas where itappears cost-effective to improve facilities,assume on a preliminary basis that upgrades
40 278 308 330 365
result in a beneficial intensity shift of oneunit (e., -1), relative to the above presentconditions.
Time-to-restoration: The time-to-restoration data assigned to SF 27b, runwaysand taxiways, are assumed to apply for allrunways and taxiways. By combining thesedata with the damage curves for FC 49, thetime-to-restoration curves shown in FigureB-36 were derived.
B.4 Sea/Water Transportation
B.4.1 PortslCargo Handling Equipment
1. General
Description: In general, portslcargohandling equipment comprise buildings(predominantly warehouses), waterfrontstructures, cargo handling equipment, pavedaprons, conveyors, scales, tanks, silos,pipelines, railroad terminals, and supportservices. Building type varies, with steelframe being a common construction type. Waterfront structures include quay walls,
ATC-25 AppendIx 3: Lifeline Vulnerability Functions - 223AT, C-25 Appendix B: Lifelfine Vulnerability Fu- nations 223
Runwaylaxiwa-9 Il I RS nO
VII Vill IXModified Mercalli Intensity (MMI)
Damage percent by intensity for runways/taxiways.
Runwal/Tax iway49 .1.00
MtII a b
6 0.458 0.8347 0.435 0.4138 H.315 0 .0399 0.325 0.818
10 0.270 0.011
R b dags + a
60 90 120 150 180 210 240 270 300 330 365
Elapsed Time in Days,
Residual capacity for runways/taxiways (NEHRP Map Area: California 3-6, California 7,
Non-California 7, Puget Sound 5, and all other areas).
ATC-25Appendix B: Lifeline Vulnerability Functions
D100HY
ao.Oa)M D=90:/ECa :
D=0f
VI
Figure B-35
X
.
Co
:0
U)'a).
R= ex
DAYS 30
Figure B-36
I
224
,if, i.UU
I

sheet-pile bulkheads, and pile-supportedpiers. Quay walls are essentially waterfrontmasonry or caisson walls with earth fillsbehind them. Piers are commonly wood orconcrete construction and often includebatter piles to resist lateral transverse loads.Cargo handling equipment for loading andunloading ships includes cranes forcontainers, bulk loaders for bulk goods, andpumps for fuels. Additional handlingequipment is used for transporting goodsthroughout port areas.
Typical Seismic Damage: By far the mostsignificant source of earthquake-induceddamage to port and harbor facilities hasbeen pore-water pressure buildup in thesaturated cohesionless soils that prevail atthese facilities. This pressure buildup canlead to application of excessive lateralpressures to quay walls by backfill materials,liquefaction, and massive submarine sliding.Buildings in port areas are subject to genericdamage due to shaking, as well as damagecaused by loss of bearing or lateralmovement of foundation soils. Pastearthquakes have caused substantial lateralsliding, deformation, and tilting of quay wallsand sheet-pile bulkheads. Block-type quaywalls are vulnerable to earthquake-inducedsliding between layers of blocks. Thisdamage has often been accompanied byextensive settlement and cracking of pavedaprons. The principal failure mode of sheet-pile bulkheads has been insufficient anchorresistance, primarily because the anchorswere installed at shallow depths, wherebackfill is most susceptible to a loss ofstrength due to pore-water pressure buildupand liquefaction. Insufficient distancebetween the anchor and the bulkhead wallcan aso lead to failure. Pile-supporteddocks typically perform well, unless soilfailures such as major submarine landslidesoccur. In such cases, piers have undergoneextensive sliding and buckling and yieldingof pile supports. Batter piles have damagedpier pile caps and decking because of theirlarge lateral stiffness. Cranes can be derailedor overturn by shaking or soil failures.Toppling cranes can damage adjacentstructures or other facilities. Misalignedcrane rails can damage wheel assemblies andimmobilize cranes. Tanks containing fuelmay rupture and spill their contents into the
water, presenting fire hazards. Pipelinesfrom storage tanks to docks may be rupturedwhere they cross areas of structurally poorground in the vicinity of docks. Failure ofaccess roads and railway tracks can severelylimit port operations. Port facilities,especially on the West Coast, are alsosubject to tsunami hazard.
Seismically Resistant Design: At locationswhere earthquakes occur relativelyfrequently it is the current Seismicallyresistant design practice to use seismicfactors included in local building codes forthe design of port structures. However, pastearthquakes have indicated that seismiccoefficients used for design are of secondaryimportance compared to the potential forliquefaction of the site soil materials. Quaywall and sheet-pile bulkhead performancecould be enhanced by replacing weak soilswith dense soils, or designing thesestructures to withstand the combination ofearthquake-induced dynamic waterpressures and pressures due to liquefied lls.Pier behavior in earthquakes has been goodprimarily because they are designed for largehorizontal berthing and live loads, andbecause they are not subject to the lateralsoil pressures of the type applied to quaywalls and bulkheads. However, effects onbearing capacity, and lateral resistance ofpiles due to liquefaction and induced slopeinstability should also be considered.
2. Direct Damage
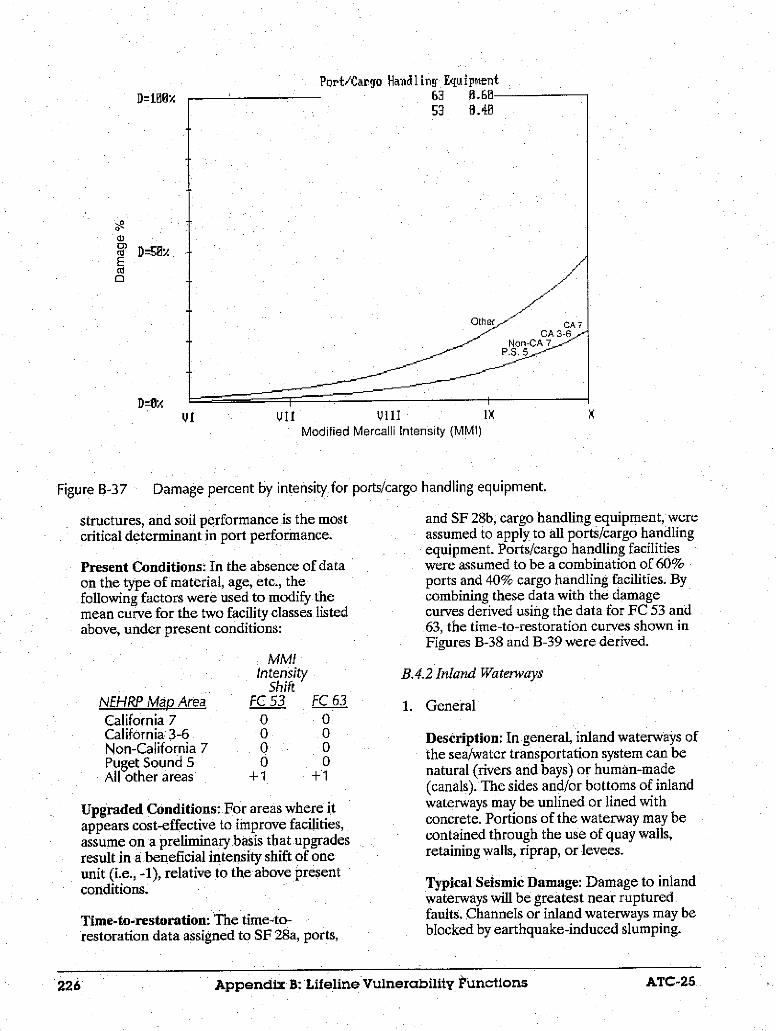
Basis: Damage curves for ports/cargohandling equipment in the sea/watertransportation system are based on ATC-13data for FC 53, cranes, and FC 63,waterfront structures (see figure B-37).Ports/cargo handling equipment wereassumed to be a combination of 60%waterfront structures and 40% cranes.
Standard construction is assumed torepresent typical California ports/cargohandling equipment under presentconditions (ie., a composite of older andmore modern ports/cargo handlingequipment). Only minimal regional variationin construction quality is assumed, as seismicdesign is performed only for selected port
Appendix B: Lifeline Vulnerability FunctionsATC-25 225
Port/Cargo Handling Equipment
VI VIl Vll IxModified Mercalli Intensity (MMI)
Damage percent by intensity for ports/cargo handling equipment.
structures, and soil performance is the mostcritical determinant in port performance.
Present Conditions: In the absence of dataon the type of material, age, etc., thefollowing factors were used to modify themean curve for the two facility classes listedabove, under present conditions:
NEHRP Map AreaCalifornia 7California 3-6Non-California 7Puget Sound 5All other areas
MM!Intensity
ShiftFC 53 FC 63
o 0o 0o 0o 0
+1 +1
Upgraded Conditions: For areas where itappears cost-effective to improve facilities,assume on a preliminary basis that upgradesresult in a beneficial intensity shift of oneunit (i.e., -1), relative to the above presentconditions.
Time-to-restoration: The time-to-restoration data assigned to SF 28a, ports,
and SF 28b, cargo handling equipment, wereassumed to apply to all ports/cargo handlingequipment. Ports/cargo handling facilitieswere assumed to be a combination of 60%ports and 40% cargo handling facilities. Bycombining these data with the damagecurves derived using the data for FC 53 and63, the time-to-restoration curves shown inFigures B-38 and B-39 were derived.
B.4.2 Inland Waterways
1. General
Description: In general, inland waterways ofthe sea/water transportation system can benatural (rivers and bays) or human-made(canals). The sides and/or bottoms of inlandwaterways may be unlined or lined withconcrete. Portions of the waterway may becontained through the use of quay walls,retaining walls, riprap, or levees.
Typical Seismic Damage: Damage to inlandwaterways will be greatest near rupturedfaults. Channels or inland waterways may beblocked by earthquake-induced slumping.
226 Appendix B: Lifeline Vulnerability Functions ATC-25
D=180Y
co D=5S&c:0
D=ax
Figure B-37
X
Appendix B: Lifeline Vulnerability functions ATC-25226

Port/Cargor 2Ba
20b
l1HIi6
7a9
to
ait
a
3
I
3
3
b8. 1183
8 8130B 88
lays + a
38 68 90 128 15O 188 218Elapsed Time in Days
240 27 3080 330 365
Residual capacity for ports/cargo handling equipment (NEHRP Map Area: California 3-6,California 7, Non-Cafifornia 7, and Puget Sound 5).
Pot/Cargo Handlinq Equipmentco a aUD u Uu
53 '3.40
MIl a6 W 3067 0.206GB 8.248
9 8.16010 0826
b
8 8
O0228.8,138.8870.805
R = * days +.a
S 128 1S 188 218Elapsed Time in Days
240 27 3 330
Figure B-39 Residual capacity for ports/cargo handling equipment All other areas).
ATC-25 Appendix B: Lifeline Vulnerability Functions 227
RE=108,
0UM
Ca
a)o:
R= v
Figure B-38
R= SE
R= /
DAYS: 3 68 365
DRYS:I Ir
I
ATC:-25 Appendix B: Lifeline Vulnerability.Functions 227

Inlania Uaterway61 1.00
Other-- ~CA 7
CA 3-6Non-CA 7
trll VII i P
I VI[ Vill IX X
Modified Mercalli Intensity (MMI)
Figure B-40 Damage percent by intensity for inland waterways.
Quay walls, retaining walls, or levees can be Standdamaged or collapse. Deep channels typicadredged in soft mud are subject to prese.earthquake-induced slides that can limit the naturedraft of ships that can pass. Channels lined waterwith unreinforced concrete are susceptible variatto damage due to differential grounddisplacement. Loss of lining containment Presecan lead to erosion of soil beneath lining. on theWaterways can be blocked by fallen bridges follovand are made impassable by spilled fuel or underchemicals from tanks or facilities adjacent tothe waterway.
Seismically Resistant Design: Seismicallyresistant design practices include providing Cwalls of waterways with slopes appropriate Cfor the embankment materials used, and/or pdesigning quay walls and retaining walls to Alrestrain soils in the event of soil failure.
2. Direct Damage appegassurr
Basis: Damage curves for inland waterways resultin the sea/water transportation system are unit (based on ATC-13 data for FC 61, canals condi(see Figure B-40).
Timerestoi
ard construction is assumed to presental California inland waterways undernt conditions (i.e., a composite ofal as well as new and old human-madeways). It is assumed that the regionalion in construction quality is minimal.
nt Conditions: In the absence of datae type of lining, age, etc., use thewing factors to modify the mean curve,r present conditions:
MMIIntensity
EtHJRP Map Area Shiftalifornia 7 0alifornia 3-6 0on-California 7 0uget Sound 5 01i other areas +1
aded Conditions: For areas where itirs cost-effective to improve facilities,ie on a preliminary basis that upgradesin a beneficial intensity shift of one
i.e., -1), relative to the above presenttions.
-to-restoration: The time-to-ration data assigned to SF 35b, levees
Appendix B: Lifeline Vulnerability Functions
D1=100V
0
C)0)
EC]
D=50O
D=O/
ATC-25228
V

Inlrn4 lJateruay61
Km 6789
I'D
4 nI .fOU
aL
0. 245E ,3698. 958. 112.0.238
b8.1272.8108.899
8.054
B b * days * a
90 128 158 108 210 248
- Elapsed Time in Days27C 388 330 365
Residual capacity for inland waterways (NEHRP Map Area: California 3-6, California 7,Non-California 7, and Puget Sound 5).
in flood control systems, are assumed toapply to all inland waterways. By combiningthese data with the damage curves for FC61, the time-to-restoration curves shown inFigures B-41 and B-42 were derived.
B.5 Electrical
B.5.1 Fossil-fu el Power Plants
1. General
Description: In general, fossil-fuel powerplants can be fueled by either coal or oil.Structures at fossil-fuel power plants arecommonly medium-rise steel braced frames.A generation building typically comprisesturbine, boiler, and fan areas. The turbine-generators are typically supported onreinforced concrete pedestals that areseismically isolated from the generationbuilding. Boiler feed pumps are usuallylocated below the turbine-generators. Theboiler area typically includes the boilers(which are usually suspended from thesupport structures), steam drums, coal silos,
conveyors, de-aerators, heaters, andassociated equipment and piping. The fanarea houses the air preheaters as well as theforced-draft fans and related duct work.Other components include instrumentationand control systems, water and fuel storagetanks, stacks, cooling towers, bothunderground and above ground piping,cable trays, switchgear and motor controlcenters, fuel handling and water treatmentfacilities, water intake and discharge, andcranes. Associated switchyards step upvoltage and include transformers and circuitbreakers.
Typical Seismic Damage: Damage to steelstructures at power plants in pastearthquakes has usually been limited tooverstressed connections or buckled braces.Turbine pedestals may pound against thesurrounding fldor of the generation buildingand damage the turbine-generators. Boilersmay sway and impact the support structure,causing damage to the expansion guides andpossibly the internal tubes of the boiler.Structural damage to older timber cooling
Appendix B: Lifeline Vulnerability Functions
5 3
R=t8ffX
-o
U)2 B= 07:[)
m9
RW; OxDAYS: 30 60
Figure B-41
l l l ll I I
ATC-25 229

MtIl a b
6 0.369 0.0187 0.9S5 0.099B 0.112 0.0549 8.230 8.616
18 8.268 0.004
R = b * days a
SR= LDAYS: 30
I 1 I I i I I 1
68 90 120 158 180 218 240 Z70 300 330Elapsed Time in Days
Residual capacity for inland waterways (All other areas).
towers may occur due to deterioration andweakening of the structures with age. Fanblades and gearboxes in cooling towers havebeen damaged attributable to impact withfan housing. Water and fuel tanks mayexperience buckled walls, ruptured attachedpiping, stretched anchor bolts, or collapse.Piping attached to unanchored equipmentor subjected to differential movement ofanchor points or corrosion may lose itspressure integrity. Coal conveyors canbecome misaligned, and coal bins withoutproper seismic design may be severelydamaged. Unrestrained batteries may topplefrom racks, and equipment supported onvibration isolators may fall off supports andrupture attached piping. In the switchyard,improperly anchored transformers may slideand topple, stretching and breaking attachedelectrical connections and/or ceramics.
Seismically Resistant Design: Seismicallyresistant design practices include, as aminimum, designing all structures to satisfythe seismic requirements of the applicablelocal or national building code. In addition,well-designed seismic ties should be
provided between the boiler and thegeneration building to prevent pounding; allequipment should be anchored; sufficientclearance and restraints on piping runsshould be provided to prevent interactionwith equipment and other piping; and pipingshould be made-flexible to accommodaterelative movement of structures andequipment to which it is attached. Generousclearances between adjacent equipmentshould be provided to prevent interaction.Sufficient joints between the turbinepedestal and the generation building arerequired to prevent pounding. Maintenanceprograms for some systems, including woodtimber cooling towers, piping transportingcorrosive materials, and steel tanks, shouldbe established so that these components arenot in a weakened condition when anearthquake strikes. An emergency powersource consisting of well-braced batteriesand well-anchored emergency generators isnecessary to permit restart without powerfrom the outside grid. Heavy equipment andstacks should be anchored with long boltsanchored deep into the foundation to allowfor ductile yielding of the full anchor bolt
Appendix B: Lifeline Vulnerability Functions
Ca,aCa
Ax R 5x
-Z). zanW(jr
Figure B-42
365l l l l l l
i
J. . . A. ._ .. A.
4 4 q no 1.R- 100x/
230 ATC-25

Fassi -Fuel Pouer Plamt13 adzf
69 0.5866 .3
Other C'~~> CACA 7
VIII IXModified Mercalli Intensity (MMI)
Figure B-43 Darnage percent by intensity for fossil-fuel power plants.
length in extreme seismic load conditions.Expansion anchor installation proceduresshould be subject to strict quality control.
2. Direct Damage
Basis: Damage curves for fossil-fuel powerplants in the electrical system are based onATC-13 data for FC 13, m edium-rise steelbraced-frame buildings; FC 66, electricalequipment, and FC 68, mechanicalequipment (see Figure B-43). Fossil-fuelpower plants are assumed to be acombination of 20% mid-rise steel braced-frame structures, 30% electrical equipment,and 50% mechanical equipment. Over theyears power plants have been designed usingseismic provisions that equal or exceedthose used for conventional construction.Consequently, the beneficial intensity shiftsindicated below are assumed appropriate.
Standard construction is assumed torepresent typical California fossil-fuel plants(and geothermal power plants) underpresent conditions (i.e., a composite of olderand more modern plants). Only minimal
regional variation in construction quality ofmechanical equipment is assumed, asoperational loads frequently govern overseismic requirements.
Present Conditions: In the absence of dataon the construction type, age, etc., thefollowing factors were used to modify themean curves for each of the three facilityclasses listed above, under presentconditions:
NEHRP Map AreaCalifornia 7California 3-6Non-California 7Puget Sound 5All other areas
MMIntensity
ShiftFC 13 C 66FC 68
-1 -1 -110 0 010 0 0
0 o 01 1 0
Upgraded Conditions: For areas where itappears cost-effective to improve facilities,assume on a preliminary basis that upgradesresult in a beneficial intensity shift of oneunit (i.e., -1) relative to the above presentconditions.
Appendix B: Lifeline Vulnerability Functions
-4 no-,Li- LruiA
0-
0DI)
VI WII
-6
XI - - ____ I I
ATC-25 21

Fossil-Fuel Power Plant
.
Q0-_0
a)Cr
In_ -.
- YS T
DAYS: 30
Z-ja H.711 136666
Ml
.20
0.580.30
a b
7 0.871 03178 0.828 0.0829 -8.805 0.836
10 -0.038 O.817
H = b days a
I I I I I
68 98 120 158 180 218 240
Elapsed Time in Days
Figure B-44 Residual capacity for fossil-fuel power plants (EHRP California 7).
Time-to-restoration: The time-to-restoration data assigned to SF 29a,electrical generating facilities, are assumedto apply to all fossil- fuel power plants. Bycombining these data with the damagecurves derived using data for FC 13, 66, and68, the time-to-restoration curves shown inFigures B-44 through B-46 were derived.
B.5.2 Hydroelectric Power Plants
1. General
Description: In general, hydroelectric powerplants consist of a dam and associatedequipment including water-driven turbines,a control house and control equipment, anda substation with transformers and otherswitching equipment. The dam may beearthfill, rockfill, or concrete and mayinclude canals, penstocks, spillways, conduit,tunnels, and intake structures. Gantrycranes are frequently located on top of theconcrete dams. Equipment inside the damtypically includes turbines, pumps, piping,switchgear, and emergency diesels.
Typical Seismic Damage: Hydroelectricpowerhouses and dams are more likely to beseriously damaged by rock falls andlandslides than by ground shaking. Whenslides do occur, turbines may be damaged ifrocks or soils enter the intakes. Penstocksand canals can also be damaged by slides.Intakes have been damaged by thecombination of inertial and hydrodynamicforces. Most engineered dams haveperformed well in past earthquakes,although dams constructed using fills of fine-grain cohesionless material haveexperienced failures. Equipment in powerplants typically performs well in earthquakesunless unanchored. In such cases theequipment may slide or topple andexperience substantial damage.Unrestrained batteries have toppled fromracks. Piping may impact equipment andstructures and damage insulation. Pipingattached to unrestrained equipment mayrupture due to equipment movement. Thecontrol house may experience genericbuilding damage ranging from droppedceiling tiles and cracks in walls and frames topartial and total collapse. Substation
232 Appendix B: Lifeline Vulnerability Functions ATC-25
2 7 8 l3 8 8 3 3 8Z70 30 330 365
U- UPSno as.
232 Appendix B: Lifeline Vulnerability Functions ATC-25

Fossil-Fuel Power Plantfl Sl 712 Jf [
11
7
3g
13
0.20
0.30
a8.0718. BZ
-13 . BBS-1 .830
-1.071
b
0.317a . 'Boz0. B36
8. B171.0.99
R *days + a
l l l l~~~I
98 120 150 150 2L1. 240 278
Elapsed Time n Days
300 338 36S
Residual capacity for fossil-fuel power plants (NEHRP Map Area: California 3-6, Non-California 7, and Puget Sound 5).
Fossil-Fuel Power10.7B
Plant13
,60
MI6
7
9'1
0.203.5aB.30
aM .034
B. 613-0.021-0.054-M. 081
bB. 111
B 023
MU01
.00
R b * days + a
90 120 150 I1B 210
Elapsed Time in Days240 278 300 338 365
Figure B-46 Residual capacity for fossil-fuel power plants (All other areas).
ATC-25 Appendfx B: Lifeline Vulnerability Functions 233
_5
co
O_2ra( R= S07
C0
R= 0;,DYS: 30 60
Figure B-45
.5c-C
-o
a)Er
R= sox
R= MxDAYS: 30 60
315
I I . .
I I I~~~ I I I I
Appendix B: Lifeline Vulnerability Functions 233ATC-25

Hgdraelectric Pwer Plant
Other
Vii Vill IX
Modified Mercalli Intensity (MMI)
Figure B-47 Damage percent by intensity for hydroelectric power stations.
equipment, and ceramics in particular, are other critical systems function with turbinevulnerable to damage. Higher-voltage trip and loss of power from the outside grid.ceramics tend to experience the mostdamage. 2. Direct Damage
Seismically Resistant Design: Seismically Basis: Damage curves for hydroelectricresistant design practices for earthfill dams power plants in the electrical system areinclude providing ample freeboard, based on ATC-13 data for FC 35, concretemechanically compacting soils, and using dams; FC 36, earthfill or rockfill dams; andwide cores and transition zones constructed FC 68, mechanical equipment (see Figureof material resistant to cracking. Generally, B-47). Hydroelectric power plants arereducing slopes of earthfill dams can reduce assumed to be a combination of 35%vulnerability. Thorough foundation concrete dams, 35% earthfill or rockfillexploration and treatment are important. dams, and 30% mechanical equipment. OverDynamic analyses can be used to determine the years power plants have been designedthe liquefaction or settlement potential of using seismic provisions that equal or exceedembankments and foundations, and the those used for conventional construction.cracking potential of concrete dams and Consequently, the beneficial intensity shiftsdam appurtenances. All buildings should be indicated below for mechanical equipmentdesigned, as a minimum, to satisfy the Bare assumed appropriate.seismic requirements of a national or localbuilding code. All equipment should be Standard construction is assumed toanchored and generous clearances between represent typical California hydroelectricadjacent equipment provided to prevent power plants under present conditions (i.e.,interaction. An emergency power source a composite of older and more modernconsisting of well-braced batteries and well- plants). Only minimal regional variation inanchored emergency generators is necessary construction quality is assumed forto ensure that control systems, lighting, and mechanical equipment, as operational loads
Appendix B: Lifeline Vulnerability Functions
D=100
ECH0
VI X
ATC-25234

0 =03
. _(aCegc-
tJ R= 587
(a_
M- In A- C.
"C,
DAYS 38 60 90 128 158 1B 218 248 278 388 330Elapsed Time in Days
Figure B-48 Residual capacity for fossil-fuel power plants (NEHRP California 7).
frequently govern over seismicrequirements.
Present Conditions: In the absence of dataon the type of material, age, etc., thefollowing factors were used to modify themean curves for each of the three facilityclasses listed above, under presentconditions:
Time-to-restoration: The time-to-restoration data assigned to SF 29a,generating facilities, and SF 30c, storagereservoirs, are assumed to apply to allhydroelectric power plants. By combiningthese data with the damage curves derivedusing the data for FC 35, 36, and 68, thetime-to-restoration curves shown in FiguresB-48 through B-50 were derived.
NEHRP Map AreaCalifornia 7California 3-6Non-California 7Puget Sound 5All other areas
MMIntensity
ShiftFC 35 FC 36 FC 68
0 0 -1+1 +1 0+1 +1 0+1 +1 0+2 +2 0
Upgraded Conditions: For areas where itappears cost-effective to improve facilities,assume on a preliminary basis that upgradesresult in a beneficial intensity shift of oneunit (i.e., -), relative to the above presentconditions-
B.5.3 Transmission Lines
1. General
Description: In general, transmission linesmay be underground or above ground(supported by towers). Towers are usuallysteel and carry several circuits at highvoltages (64 kV or higher). Each circuitconsists of three conductors, one for eachphase. Towers are, provided with reinforcedconcrete footings and may be supported onpiles. Most transmission systems are ac, butsome long-distance lines are dc. The dcsystems require convertor stations at eachend of the line.
A -Appendix B: Lifeline Vulnerability Functions
38
a b
17? BAK42
165 -8.. lis
8 0.839
134 0.820
* days + a
365
l l
.
l
235ATC-25
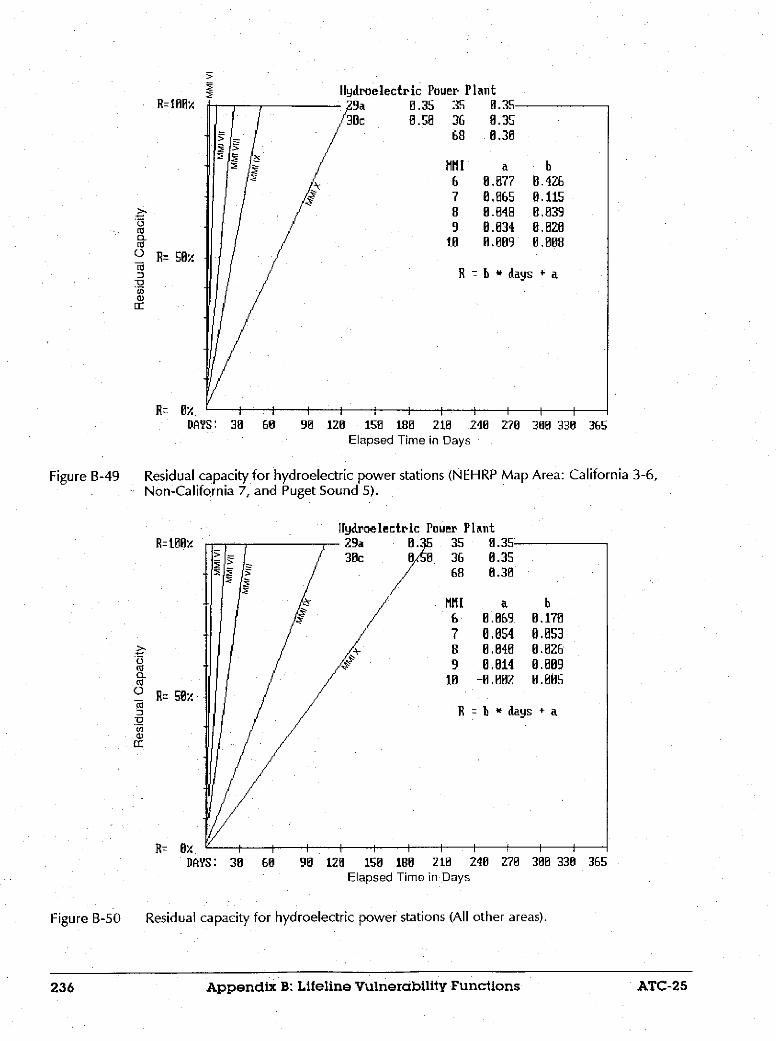
C.
o R= y
-aCC0)
H= B/ y
DAYS:
*.35.30
MIl67B
910
a. 77,065048
.34,09
b
0. 426
0.1150.H390 .0200.008
* days a
I - i I i I I i i I
30 60 90 120 158 188 210 Z40 Z70 30 330
Elapsed Time in Days365
Residual capacity for hydroelectric power stations (NEHRP Map Area: California 3-6,- Non-California 7, and Puget Sound 5).
Hydroelectric Pauer PlanttR=t1o8
Co
a
(:)*0a)
= A Y : 3 IDAYS: 30 60
36 0.3568 0.30
MII
6
7B9
to
a0.06908 854
8.0400.814
-0.002
b
0.1700.8530. H26
0.8090.005
R = b * days + a
I I I II I I
90 120 150 18 210 248 270 30 330Elapsed Time in Days
365
Figure B-50 Residual capacity for hydroelectric power stations (All other areas).
Appendix B: Lifeline Vulnerability Functions
Figure B-49
l l l l l l l l | l a
1 s
ATC-25236

Transmission Lines (Electrical)S6 1.B
1IJl VIII IX
Modified Mercalli Intensity (MMI)
Damage percent by intensity for electric transmission lines.
Typical Seismic Damage: Transmissiontowers and the lines they support areprincipally subject to damage throughsecondary effects such as landslides, androck falls, liquefaction, and other groundfailures. This is also true for theunderground lines. It is possible that theconductors supported by towers can slapagainst each other and bum down. Ceramicsused on transmission towers typicallyperform well in earthquakes because theyare in compression rather than in tension orbending. Fault slippage is unlikely todamage underground lines, (unless the linecrosses the fault fracture) becausetransmission lines have a thick-wall, welded-steel pipe jacket.
Seismically Resistant Design: Seismic loadsdo not generally have much influence on thedesign of transmission lines and towers. Thetowers are designed to, withstand heavy windand ice loads, as well as loads due to brokenwires. The primary Seismically resistantconcern is siting towers and conductors inlocations where soils are stable, or providingspecial foundations designed to surviveeffects of soil failure.
1. Direct Damage
Basis: Damage curves for transmission linesin the electrical system are based on ATC-13data for FC 56, major electrical transmissionline towers (over 100 feet tall, see Figure B-51). Standard construction is assumed torepresent typical California transmissionlines and towers under present conditions(i.e., a composite of older and more moderntowers). It is assumed that no regionalvariation in construction quality exists, asseismic loads are relatively unimportant inthe design of transmission towers.
Present Conditions: In the absence of dataon the type of tower, age, etc., the followingfactors were used to modify the meancurves, under present conditions:
NEHRP Map AreaCalifornia 7California 3-6Non-California 7Puget Sound 5All other areas
MMIIntensity
Shift0
U
ATC-25 Appendix B: Lifeline Vulnerability Functions 237
DztIOO
S0aCCW
C
DwOxVI
Figure B-51
X
237ATFC-25 Appendix B: Lifeline Vulnerability Functions,
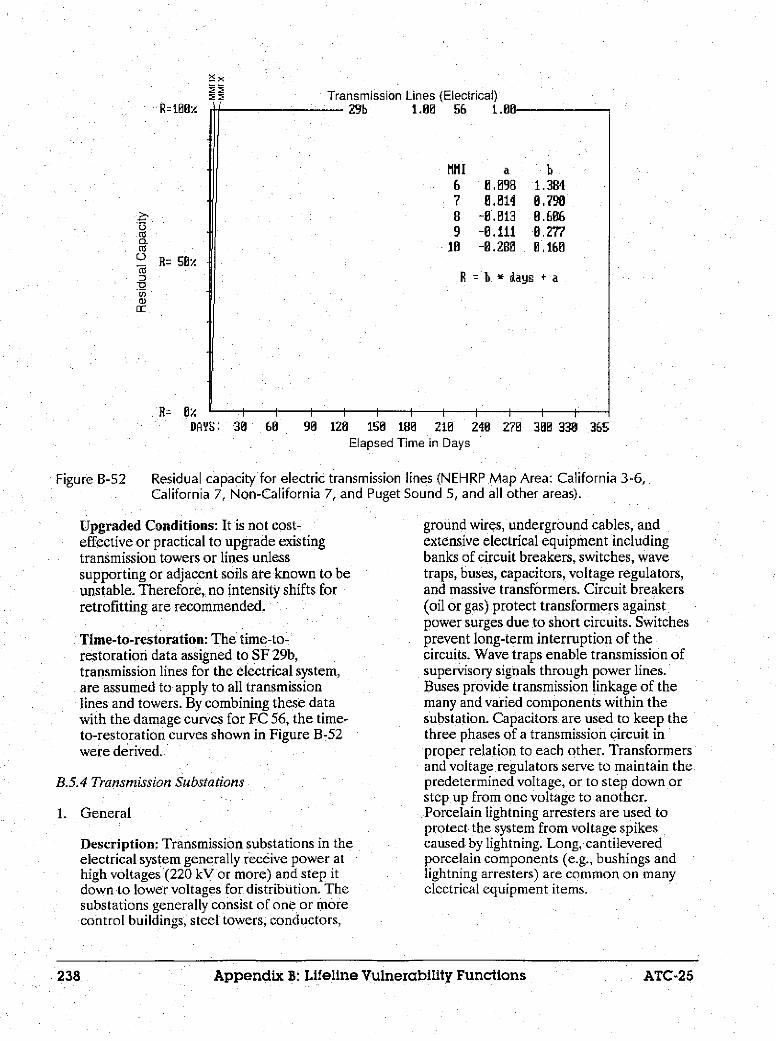
Transmission Lines (Electrical).,OL I GM Ct 4 IRR
M1111 a
6 0.8987 0.814B -0.013
9 -0 .11110 -0. 280
b1.3840.7900.6060,2770. 168
H = b * days a
| I I I 90 120 150 188 210
Elapsed Time in Days
I I I I
240 270 308 330 365
Residual capacity for electric transmission lines (NEHRP Map Area: California 3-6,California 7, Non-California 7, and Puget Sound 5, and all other areas).
Upgraded Conditions: It is not cost-effective or practical to upgrade existingtransmission towers or lines unlesssupporting or adjacent soils are known to beunstable. Therefore, no intensity shifts forretrofitting are recommended.
Time-to-restoration: The time-to-restoration data assigned to SF 29b,transmission lines for the electrical system,are assumed to apply to all transmissionlines and towers. By combining these datawith the damage curves for FC 56, the time-to-restoration curves shown in Figure B-52were derived.
B.5.4 Transmission Substations
1. General
Description: Transmission substations in theelectrical system generally receive power athigh voltages (220 kV or more) and step itdown to lower voltages for distribution. Thesubstations generally consist of one or morecontrol buildings, steel towers, conductors,
ground wires, underground cables, andextensive electrical equipment includingbanks of circuit breakers, switches, wavetraps, buses, capacitors, voltage regulators,and massive transformers. Circuit breakers(oil or gas) protect transformers against.power surges due to short circuits. Switchesprevent long-term interruption of thecircuits. Wave traps enable transmission ofsupervisory signals through power lines.Buses provide transmission linkage of themany and varied components within thesubstation. Capacitors are used to keep thethree phases of a transmission circuit inproper relation to each other. Transformersand voltage regulators serve to maintain thepredetermined voltage, or to step down orstep up from one voltage to another.Porcelain lightning arresters are used toprotect the system from voltage spikescaused by lightning. Long, cantileveredporcelain components (e.g., bushings andlightning arresters) are common on manyelectrical equipment items.
Appendix B: Lifeline Vulnerability Functions
R- 100
ia0:3.nU)
a:
1- Ut
DAYS: 60
Figure B-52
xx:; H
I-v -. .U - U L ._
D a.,H= "/
238 ATC-25

Typical Seismic Damage: Control buildingsare subject to generic building damageranging from dropped suspended ceilingsand cracks in walls and frames to partial andtotal collapse. Unanchored or improperlyanchored control equipment may slide ortopple, experiencing damage or causingattached piping and conduit to fail. In theyard, steel towers are typically damaged onlyby soil failures. Porcelain bushings,insulators, and lightning arresters are brittleand vulnerable to shaking and are frequentlydamaged. Transformers are large, heavypieces of equipment that are frequentlyunanchored or inadequately anchored.Transformers may shift, tear the attachedconduit, break bushings, damage radiators,and spill oil. Transformers in oldersubstations that are mounted on railsfrequently have fallen off their rails unlessstrongly anchored. Other top-heavy piecesof electrical equipment can topple or slidewhen inadequately anchored, damagingconnections. Frequently, inadequate slack inconductors or rigid bus bars result inporcelain damage resulting from differentialmotion.
Seismically Resistant Design: Porcelain isused extensively in ways that make itsusceptible to damage (bending andtension). Recent developments includinggas-insulated substations and installationdetails that base isolate, reinforce, or adddamping, may reduce the problem in thefuture. Seismically resistant design practiceincludes the use of damping devices forporcelain; proper anchorage for equipment(avoid the use of friction clips); provision ofconductor slack between equipment in thesubstation; use of breakaway connectors toreduce loads on porcelain bushings andinsulators; and replacement of singlecantilever-type insulator supports with thosehaving multiple supports. Transformerradiators that cantilever from the body oftransformer can be braced. Adequatespacing between equipment can reduce thelikelihood of secondary damage resultingfrom adjacent equipment falling. Controlbuildings and enclosed control equipmentshould be designed to satisfy the seismicrequirements of the local or nationalbuilding code, as a minimum.
2. Direct Damage
Basis: Damage curves for transmissionsubstations for the electrical system arebased on ATC-13 data for FC 66, electricalequipment (see Figure B-53). High-voltageporcelain insulators, bushings, and supportsare vulnerable to damage, even when theporcelain components have been designedand qualified to enhanced seismic criteria.Consequently, the detrimental intensity shiftindicated below is assumed appropriate.
Standard construction is assumed torepresent typical California transmissionsubstations under present conditions (e., acomposite of older non-seismically designedsubstations as well as more modernsubstations designed to enhanced seismicrequirements).
Present Conditions: In the absence of dataon the type of equipment, substationvoltage, age, etc., the following factors wereused to modify the mean curves, underpresent conditions:
NEHRP Map AreaCalifornia 7California 3-6Non-California 7Puget Sound 5All other areas
MM!.intensity
Shift+1+2+2+2+3
Upgraded Conditions: For areas where itappears cost-effective to improve facilities,assume on a preliminary basis that upgradesresult in a beneficial intensity shift of oneunit (i.e., -1), relative to the above presentconditions.
Time-to-restoration: The time-to-restoration data assigned to SF 29c,transmission substations, are assumed toapply to all transmission substations inCalifornia. For transmission substations inother areas, response planning is not ascomplete, and the restoration time isassumed to be 1.5 times longer. Bycombining these data with the modifieddamage curves for FC 66, the time-to-restoration curves shown in Figures B-54through B-56 were derived.
Appendix B: Lifeline Vulnerability FunctionsATC-25 239

D=108x
813
wD=Sox
Eco0
Dlix
transnission Substation
IVI VII Vill Ix
'Modified Mercalli Intensity (MMI)
Figure B-53 Damage percent by intensity for electric transmission substations.
U- en.,.ii- LUu r.
: tf
:-5.a0-
co
R= sez
R= OXL,DAYss
transnission Substation00_ 4 aa 11 I .n
- i~ 1.un nb i.nn3-
I I I I I I i
: 30 60 90 120 150 180 218 248 Z71Elapsed Time in Days
' 300 330
x
365
Residual capacity for electric transmission substations (NEHRP California 7).
Appendix B: Lifeline Vulnerability Functions ATC-25
Mlil a b6 0.126 0.0927 0.101 0,030B H.882 0.0199 8.67 0.01O
18 8.858 0.009
R b *days a
Figure B-54
l
1
Transmission Substation
240

Transnission Substation1 n r r I n
98 128 158 188 218
Elapsed Time in Days240 278 308 338 365
Residual capacity for electric transmission substations NEHRP Map Area: California 3-6,Non-California 7 and Puget Sound 5).
Transmission Substation1.08 68
MKIl
6
7
9
1.02
Ia
8.86?
8.8588.8
b
8.819.012
E.289
8.887
R b * days + a
9 128 I58 188 218
Elapsed Time in Day,
I I I I
248 278 308 330 365
Figure B-56 Residual capacity for electric transmission substations (All other areas).
Appendix B: Liteline Vulnerability Functions
14=100v
.=Zz
C.a
O R= S/z_r£~0
Cd,0corD
R= z
MM a b6 8.101 0.03B7 8.802 0.0198 8.867 8.8129 8.8;52 0.00918 H.844 0.007
R =b days + a
DAYS: 38
Figure B-55
G8
:CsCL
-a
EG
n- O., I
- :. 3
DAYTS: 8EII
l l l l l l
M= "-> .
J 1 .V[!I UU g sULI'
I I I l
A+TC-25 241

Distribution Lines
ViI U111
Modified Mercalli Intensity (MMI)
Figure B-57 Damage percent by intensity for electric distribution lines.
B.S.S Distribution Lines
1. General
Description: In general, distribution linesmay be underground or above groundsupported by towers or poles. Towers areusually steel, and poles are usually treatedwood. Towers are provided with concretefootings, and poles may have footings ormay be embedded directly into the ground.Transformers on poles may be supported onplatforms or anchored directly to poles.Distribution lines typically operate at lowervoltages (64 kV or less).
Typical Seismic Damage: Unanchored pole-mounted transformers may be knockeddown and some will burn. Towers and polesare generally undamaged except bysecondary effects such as landslides,liquefaction, and other ground failures.Conductor lines swinging together can causeburnouts and/or start fires. Settlement ofsoils with respect to manholes cansometimes cause underground line routedthrough the manhole to fail.
Seismically Resistant Design: Seismic loadsdo not generally have much influence on thedesign of distribution lines and towers. Thetowers are typically designed to withstandwind loads. The primary concern is sitingtowers and poles where soils are stable toprevent foundation failures.
2. Direct Damage
Basis: Damage curves for distribution linesin the electrical system are based on ATC-13data for FC 55, conventional electricaltransmission line towers (less than 100 feettall, see Figure B-57). In general, lessconservative design criteria are used fordistribution lines than for lines in thetransmission system.
Standard construction is assumed torepresent typical California distributionlines, towers, and poles, under presentconditions (i.e., a composite of older andmore modern lines and towers). Onlyminimal regional variation in theconstruction quality is assumed.
Present Conditions: In the absence of dataon the type of tower/pole or conductor, age,
Appendix B: Lifeline Vulnerability Functions
s5 1.af0DzI100v
0 =80
axCY)
E
D=O/VI
Other
CA 7
- CA3-6- Non-CA 7-
P.S.5ix X
ATC-25242

_5aco
(3
(/2C,mr
R= z
istribution Lines!9L 1.80 55
DAYS:I I i -
G0 98 128 158 188 210Elapsed Time in Days
4 an
I I , - ,
248 278 380 338 365
Residual capacity for electric distribution lines (NEHRP Map Area: California 3-6,California 7, Non-California 7, and Puget Sound 5).
etc., the following factors were used to modifythe mean curves, under present conditions:
NEHRP Map AreaCalifornia 7California 3-6Non-California 7Puget Sound 5All other areas
MMIIntensit
Shift0000
+1
Upgraded Conditions: It is not cost-effective or practical to upgrade existingtransmission towers, unless supporting oradjacent soils are known to be unstable.Therefore, no intensity shifts for upgradingare recommended.
Time-to-restoration: The time-to-restoration data assigned to SF 29d,distribution lines, are assumed to apply to alldistribution lines. By combining these datawith the damage curves for FC 55, the time-to-restoration curves shown in Fiugres B-58and B-59 were derived.
B.516 Distribution Substations
1. General
Description: Distribution substations in theelectrical system generally receive power atlow voltages (64 kV or less) and step it downto lower voltages for distribution to users.The substations generally consist of onesmall control building, steel towers,conductors, ground wires, and electricalequipment including circuit breakers,switches, wave traps, buses, capacitors,voltage regulators, and transformers.
Typical Seismic Damage: Control buildingsare subject to generic building damageranging from cracks in walls and frames topartial and total collapse. Unanchored orimproperly anchored control equipmentmay slide or topple, experiencing damage orcausing attached conduit to fail- In the yard,steel towers are typically damaged only bysoil failures. Porcelain bushings, insulators,and lightning arresters are brittle andvulnerable to shaking and are frequently
Appendix B: Lifeline Vulnerability Functions
lil a. bS 8.448 1.3757 0.445 e.8828 .443 8. 599 8.432 8.174
10 8.393 0.08
R = 3 * Jays + a
Figure B-58
l l l l l l l
1.v.alu
ATC-25 243

R= 100
8488x
co
0-
° R= SexiaC5W(U
Rz _
H= 1
listribution Lines29d 1.08 55
4 a
I I I I~~~~~~~~~~~~~~~
AYS: 30 68
Figure B-59 Residual capacity for electric distrit
damaged. Transformers are large, heavypieces of equipment that are frequentlyunanchored or inadequately anchored.Transformers may shift, tear the attachedconduit, break bushings, damage radiators,and spill oil. Transformers in oldersubstations that are mounted on railsfrequently have fallen off their rails unlessstrongly anchored. Other top-heavy piecesof electrical equipment can topple or slidewhen inadequately anchored, damagingconnections. Frequently, inadequate slack inconductors or rigid bus bars result inporcelain damage resulting from differentialmotion.
Seismically Resistant Design: Porcelain indistribution substation is susceptible todamage but is less vulnerable than porcelainin transmission substations by virtue of itsshorter cantilever lengths. Seismicallyresistant design practices include the use ofinstallation details that base isolate,reinforce, or add damping devices to theporcelain. Proper anchorage details shouldbe used for all yard equipment. Breakawayconnectors for porcelain; replacement of
98 120 150 188 218 240 Z78 300 338 365
Elapsed Time in Days
)ution lines (All other areas).
single cantilever-type insulator supportswith those having multiple supports; andprovision of adequate slack in conductorsand bus bars connecting components thatmay experience differential movement willsignificantly reduce seismic vulnerability.
2. Direct Damage
Basis: Damage curves for distributionsubstations for the electrical system arebased on ATC-13 data for FC 66, electricalequipment (see Figure B-60). It is believedthat this facility class best approximates theexpected performance of distributionsubstations.
Standard construction is assumed torepresent typical California distributionsubstations under present conditions (i.e., acomposite of older non-seismically designedsubstations as well as more modernsubstations designed to enhanced seismicrequirements).
Present Conditions: In the absence of dataon the type of equipment, substation
Appendix B: Lifeline Vulnerability Functions A
MtlI a b6 0.445 8.80Z7 0.443 8.5898 0.432 8.1749 B.393 0.8DB
10 0.297 0.847
H = b * days a
.. "u-
I I I i -I I I I . . . . . . .
ATC-25� �.'. I244
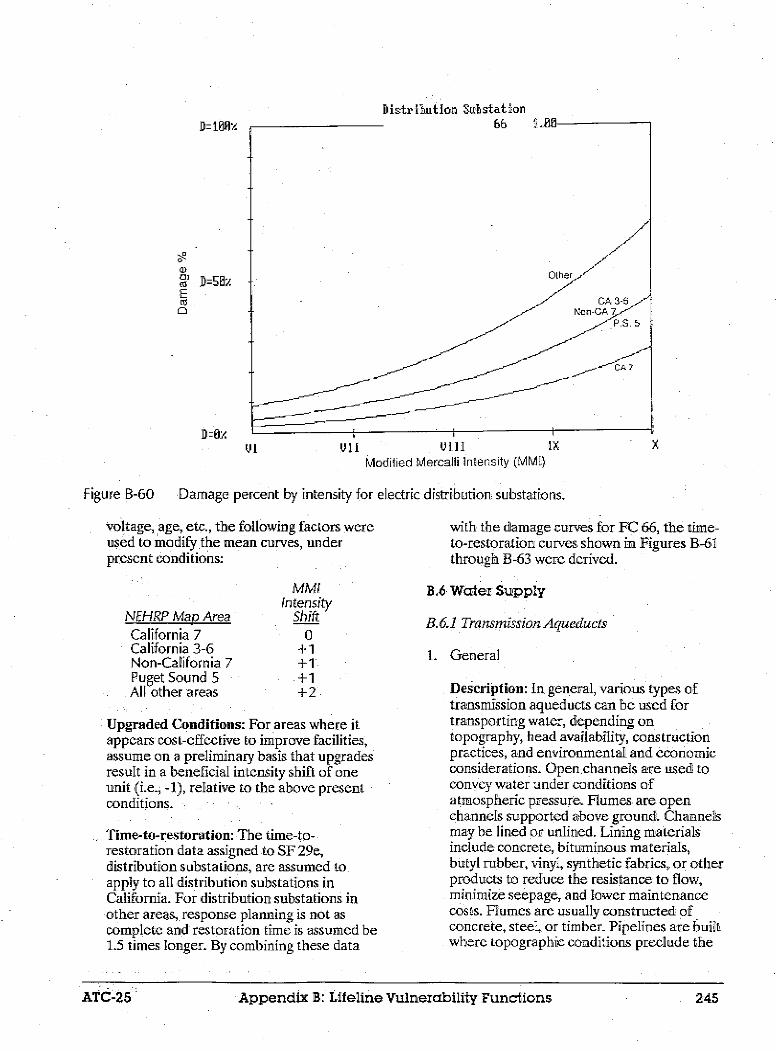
Distribution Sstation
ViI VIII IxModified Mercalli ntensity (MMI)
Figure B-60 Damage percent by intensity for
voltage, age, etc., the following factors wereused to modify the mean curves, underpresent conditions:
Mm/Intensity
NEHRP Map Area ShiftCalifornia 7 0California 3-6 +1Non-California 7 +1Puget Sound 5 +1All other areas +2
Upgraded Conditions: For areas where itappears cost-effective to improve facilities,assume on a preliminary basis that upgradesresult in a beneficial intensity shift of oneunit (i.e., -1), relative to the above presentconditions.
Time-to-restoration: The time-to-restoration data assigned to SF 29e,distribution substations, are assumed toapply to all distribution substations inCalifornia. For distribution substations inother areas, response planning is not ascomplete and restoration time is assumed be1.5 times longer. By combining these data
electric distribution substations.
with the damage curves for FC 66, the time-to-restoration curves shown in Figures B-61through B-63 were derived.
B.6 Water Supply
B.6.1 Transmission Aqueducts
1. General
Description: In general, various types oftransmission aqueducts can be used fortransporting water, depending ontopography, head availability, constructionpractices, and environmental and economicconsiderations. Open channels are used toconvey water under conditions ofatmospheric pressure. Flumes. are openchannels supported above ground. Channelsmay be lined or unlined. Lining materialsinclude concrete, bituminous materials,butyl rubber, vinyl, synthetic fabrics, or otherproducts to reduce the resistance to flow,minimize seepage, and lower maintenancecosts. Flumes are usually constructed ofconcrete, steel, or timber. Pipelines are builtwhere topographic conditions preclude the
AT-2Apni :Lfln unrblt ucin 4
Dzt0lH
E)a)
E(U
C
D=O1l X
ATC-25 Appendix B: Lifeline Vulnerability Functions 245

Distribution Substation
29e 1.00 66 1.0n
b
0.273
8.1390.0550.826
0.015
MITI a
6 0.0838
7 08,058 0.0829 0.806
10 0.078
R = b * days + a
i I I I I I
30 60 90 120 150 180 210 240Elapsed Time in Days
I I
Z70 300 330 365
dual capacity for electric distribution substations (NEHRP California 7).
Distribution Substation
-2Z9e I.001 bb 1. 00-
Figure B-61 Resic
Rz!
>.
aC_I0I- -=
._a)
n- u. -DAYS:
KH1 a
6 0.085
7 0.802
8 0.080
9 0.07010 0.077
b
0.1390.6550.0260.8150. 11
B b * days + a
I I I i I I I
t30 60 90 120 150 180 210Elapsed Time in Days
I 1 I I
240 270 300 330 365
Figure B-62 Residual capacity for electric distribution substations (NEHRP Map Area 3-6, Non-California 7, and Puget Sound 5).
Appendix B: Lifeline Vulnerability Functions A
R=10f
aCa() n_ rCa
n
cR
a,
A y,DA.DAYS
ATC-25,,,246
I I I I
S A .
L
I
. �?,� /I
- -- IV- uv L

Distribution Sstation
tMl1I a b,6 8 82 8 .8557 2.80 BI26
8 8.878 .8.8159 8.877 8.8i
10 0.876 8.888
R = lb days a
Elapsed Time in Days
Residual capacity for electric distribution substations (All other areas).
use of canals. Pipelines may be laid above--or below ground, or may be partly buried.Most modern pressure conduit are built ofconcrete, steel, ductile iron, or asbestoscement. Tunnels are used where it is notpractical to lay a pipeline, such as mountainor river crossings. They may be operatedunder pressure or act as open channels.Linings may be unreinforced concrete,reinforced concrete, steel, or brick.
Typical Seismic Damage: Channels aremost susceptible to damage from surfacefaulting and soil failures such as differentialsettlement, liquefaction, or landsliding.Unreinforced linings are more susceptible todamage than are reinforced linings. Smallfractures in the lining can result in atransmission aqueduct being taken out ofservice, as water leaking through the liningcould erode supporting embankments orsurrounding soils and cause significantdamage. Regional uplift could result in long-term loss of function by changing thehydraulic flow characteristics of theaqueduct.
ATC-25 Appendix B: Lifeline
Seismically Resistant Design: Seismicallyresistant design practices include providingreinforced concrete linings for channels andtunnels. Channels should have slopesappropriate for embankment materials toprevent slumping. Tunnels, should bestrengthened at intersections, bends, andchanges in shape and construction materials.Aqueducts should be sited to eliminate orminimize fault crossings. Aqueducts thatcross faults can be routed through pipeburied in shallow loose fill or installed aboveground near the fault, to allow lateral andlongitudinal slippage.
1. Direct Damage
Basis: Damage curves for transmissionaqueducts of the water supply system arebased on ATC-13 data for FC 3, tunnelspassing through alluvium, and FC 61, canals(see Figure B-64). Aqueducts are assumedto be a-combination of 50% tunnels and50% canals. Tunnels passing throughalluvium are less vulnerable than cut-and-cover tunnels and more vulnerable than
Vulnerability Functions
-0co
0-DC)[I0
. _
Figure B-63
R= 50;x
R= 80/DIr 60
247

Transmission Aqueduct
u tu,. I II I
61 O.so
Other
CA 7-
GA 3-6V I)^ 1 V I V I ,XI P,-s- X
VI V11 Vill IX P.S. X
Modified Mercalli Intensity (MMI)
Figure B-64 Damage percent by intensity for transmission aqueducts.
tunnels passing through rock; they werechosen as representative of all tunnels.
Standard construction is assumed torepresent typical California aqueducts underpresent conditions (i.e., a composite of olderand more modern aqueducts). Only minimalregional variation in construction quality ofaqueducts is assumed.
Present Conditions: In the absence of dataon the type of construction, age, etc., thefollowing factors were used to modify themean curves for the two facility classes listedabove, under present conditions:
NEHRP Map AreaCalifornia 7California 3-6Non-California 7Puget Sound 5All other areas
MM!Intensity
Shift
FC 3800
. 00
+1
FC 610000+1
Upgraded Conditions: For areas where itappears cost-effective to improve facilities,
assume on a preliminary basis that upgradesresult in a beneficial intensity shift of oneunit (i.e., -1), relative to the above presentconditions.
Time-to-restoration: The time-to-restoration data assigned to SF 30a,transmission aqueducts, are assumed toapply to all transmission aqueducts. Bycombining these data with the damagecurves derived using the data from FC 38and 61, the time-to-restoration curves shownin Figures B-65 and B-66 were derived.
B.6.2 Pumping Stations
1. General
Description: Pumping equipment forms animportant part of the water supply systemtransportation and distribution facilities. Ingeneral, pumping stations include largerstations adjacent to reservoirs and rivers,and smaller stations distributed throughoutthe water system intended to raise head.Large pumping stations typically includeintake structures. Pumping stations typically
Appendix B: Lifeline Vulnerability Functions
80
a)0)
E
0
PA-U.
248
-1-1 - -u=lnnz _ - En n.:n
ATC-25

Transnission queduct,XI- I 0f -in
.61
a raU.;)
9.50
MMI a6 -1.8B17 -8.913B -0.951
9 -8.922fl -0. 40
1.7180.5990.5458.3540.142
R = ays a
I I T T I I
e ~90 12 150 186 218Elapsed Time in Days
I i I -- -
240 27 3 330 365
Figure B-65 Residual capacity for transmission aqueducts (NEHRP Map Area: California 3-6, Californa7, Non-California 7, and Puget Sound 5).
Thansnission Aueduct
.0Cs
_ccco
0 R 0
68 90 1201 158 180 218 240 278 308 330 365Elapsed Time in Days
Figure B-66 Residual capacity for transmission aqueducts (All other areas).
ATC-25 Appendi�x B: Lilellne Vulnerability Functions 249
R1iB10. /
x
0-o1DGU
R= 90Z
- .I
DAYS:
> 5 5
. .11
ATC-25 Appendix B: Lifeline Vulnerability Functions 249

comprise shear-wall-type buildings, intakestructures, pump and motor units, pipes,valves, and associated electrical and controlequipment. Requirements vary from smallunits used to pump only a few gallons perminute to large units capable of handlingseveral hundred cubic feet per second.Vertical turbine (most common) anddisplacement pumps are the two primarytypes used. Horizontal centrifugal pumps,air-lift and jet pumps, and hydraulic rams arealso used in special applications. Centrifugalpumps have impellers, which impart energyto the water. Displacement pumps arecommonly the reciprocating-type where apiston draws water into a closed chamberand then expels it under pressure. Pumpsmay be in series or in parallel. Often anemergency power supply comprising astandby diesel generator, battery rack, anddiesel fuel tank is included in primarypumping stations to operate in emergencysituations when electric power fails.
Typical Seismic Damage: Pumping stationswill suffer damage closely related to theperformance of the soils on which they areconstructed. Intake structures are typicallytower-type structures that are vulnerable toinertial effects, and settlement andlandslides at bottoms of reservoirs andrixcrs. Toppling of these towers allowscoarse sediment to enter the distributionsystem, plugging pipelines and causingextensive damage to pump bearings andseals. Piping attached to heavy pumpstructures is susceptible to damage causedby differential settlement. Unanchoredelectrical and control equipment may beseverely damaged. Pumps with long shaftsmay suffer misalignment, and shafts may becracked or sheared by ground movement.Pipe hangers may be damaged by relativesettlement of building and associatedequipment. Damage to substationtransformers can result in the loss of power.
Seismically Resistant Design: Seismicallyresistant design practice includes avoidingunstable soils in siting the pumping stations,or providing foundations for structures andequipment capable of resisting expected soilfailures without damage. Design of intakestructures should consider inertial forcesdeveloped from self-mass and surrounding
water, and these structures should be builton stable soil. Also, pumps and heavyequipment should be provided with positivemeans (anchorage) of resisting lateralforces; base isolators should be used onlywhen adequate snubbers are provided.Buildings enclosing plant equipment shouldbe designed with seismic provisions of localor national building codes. The casings ofwells should be separated from the pumphouse by at least 1 inch to allow for relativemovement and settlement. Pumps that arehung from the motor at the top of the wellby a non-flexible drive shaft inside the pumpcolumn are not recommended. Submersiblemotor-driven, vertical turbine pumps do notrequire the long drive shaft, and the needfor a perfectly straight well casing istherefore eliminated. Horizontal pumps andtheir motors should be mounted on a singlefoundation to prevent differentialmovement. Provisions for emergency powershould be made for pump stations critical tosystems operation.
1. Direct Damage
Basis: Damage curves for pumping stationsfor the water system are based on ATC-13data for FC 10, medium-rise reinforcedmasonry shear wall buildings; FC 66,electrical equipment, and FC 68, mechanicalequipment (see Figure B-67). FC 10 waschosen to represent a generic building,based on review of damage curves for allbuildings. Pumping stations are assumed tobe a combination of 30% generic buildings,20% electrical equipment, and 50%mechanical equipment.
Standard construction is assumed torepresent typical California pumpingstations for water systems under presentconditions (i.e., a composite of older andmore modern stations). Only minimalregional variation in construction quality ofmechanical equipment is assumed, asoperational. loads frequently govern overseismic requirements.
Present Conditions: In the absence of dataon the type of pumps, age, etc., thefollowing factors were used to modify themean curves for each of the three facility
ATC-25Appendix B: Lifeline Vulnerability Functions250
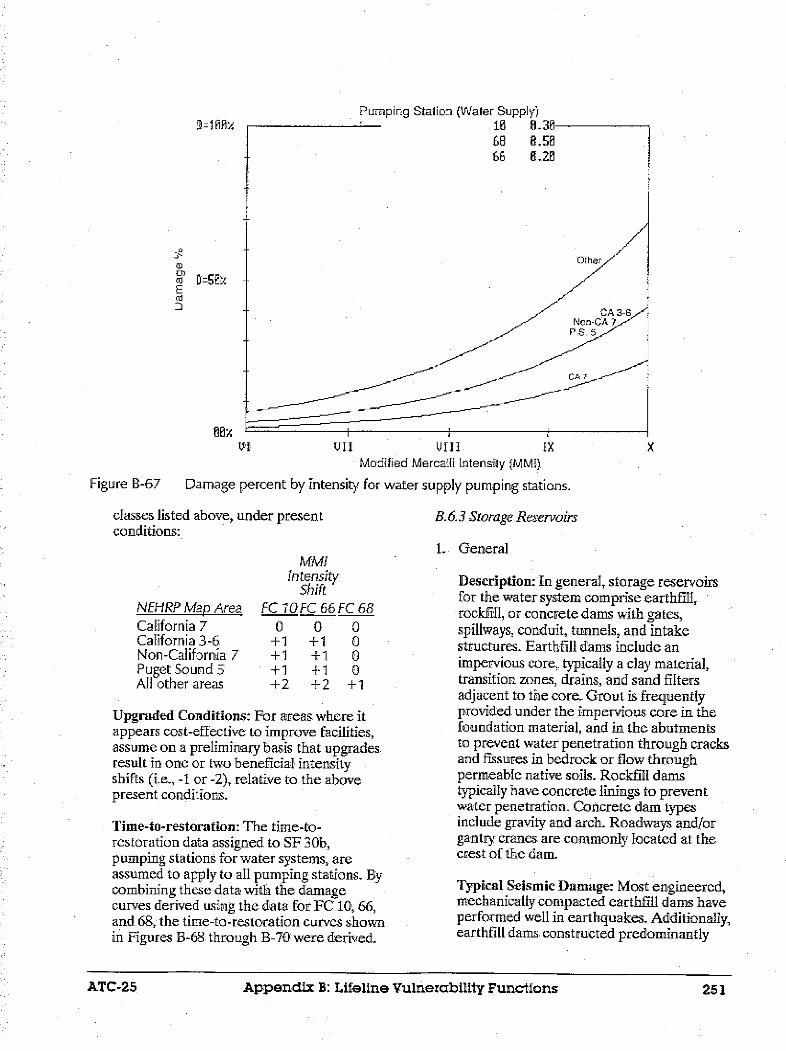
Pumping Station (Water Supply)
60' 0.5a66 0.20
Other
N-CA? 36
'A 5
VIIIModified Mercalli ntensily (MMI)
Ix
Figure B-67 Damage percent by intensity for water supply pumping stations.
classes listed above, under presentconditions:
B.6.3 Storage Reservoirs
MM!Intensity
ShiftFC I OFC 66 FC 68
o 0+1 +1+1 +1
*+1 +1+2 +2
1
+1
Upgraded Conditions: For areas where itappears cost-effective to improve facilities,assume on a preliminary basis that upgradesresult in one or two beneficial intensityshifts (ie., - or -2), relative to the abovepresent conditions.
Time-to-restoration: The time-to-restoration data assigned to SF 30b,pumping stations for water systems, areassumed to apply to all pumping stations. Bycombining these data with the damagecurves derived using the data for FC 10, 66,and 68, the time-to-restoration curves shownin Figures B-68 through B-70 were derived.
1. General
Description: In general, storage reservoirsfor the water system comprise earthfill,rockfill, or concrete dams with gates,spillways, conduit, tunnels, and intakestructures. Earthfill dams include animpervious, core, typically a clay material,transition zones, drains, and sand filtersadjacent to the core. Grout is frequentlyprovided under the impervious core in thefoundation material, and in the abutmentsto prevent water penetration through cracksand fissures in bedrock or flow throughpermeable native soils. Rockfill damstypically have concrete linings to preventwater penetration. Concrete dam typesinclude gravity and arch. Roadways and/organtry cranes are commo nly located at thecrest of the dam.
Typical Seismic Damage: Most engineered,mechanically compacted earthfill dams haveperformed well in earthquakes. Additionally,earthfill dams, constructed predominantly
Appendix B: Lifeline Vulnerability Functions
Dz=100/
CDcoD, 6;(a
VI Ul" X
NEHRP Map AreaCalifornia 7California 3-6Non-California 7Puget Sound 5A1I other areas
I0 H - -
251ATC-25
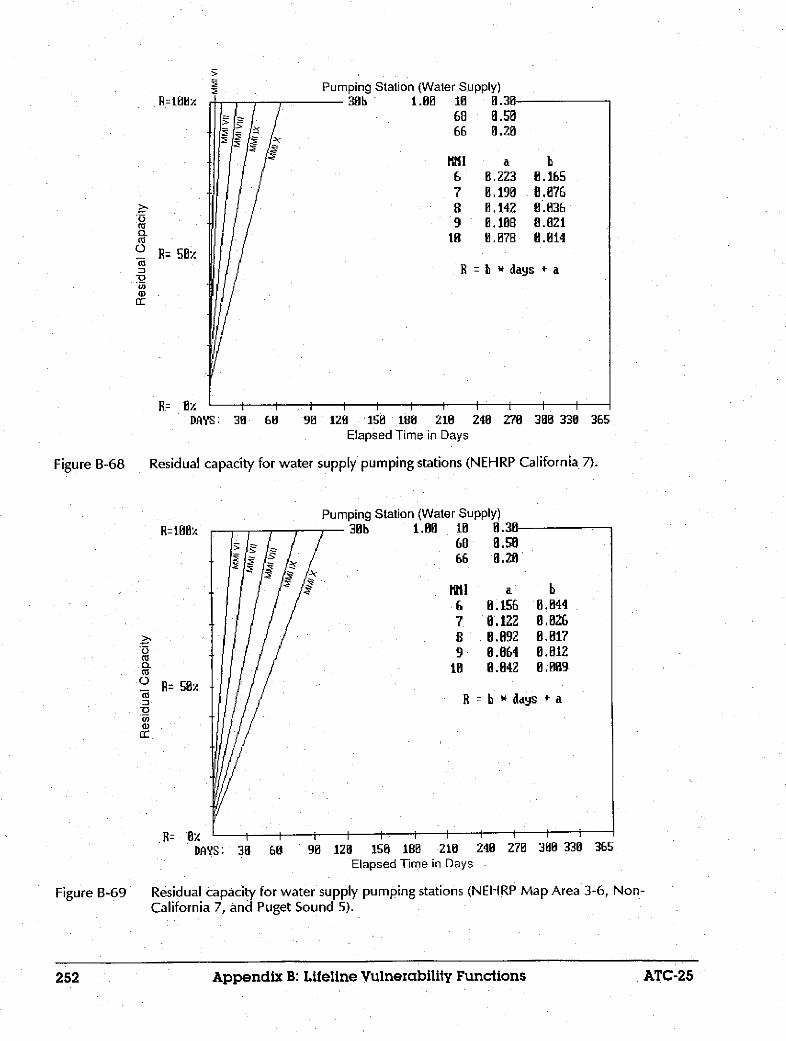
1.00 10 0.30Go 0.so
66 0.20
M1i1 a b
6 0.223 0.1657 0,190 8.8768 0.142 0.0369 0. 18 0.021
10 0.078 0.014
R = b * days a
30 60 90 120 150 180 210 248 270 388 330 365Elapsed Time in Days
Residual capacity for water supply pumping stations (NEHRP California. 7).
Pumping Station (Wal
R= 0/. I
DAYS: 30 60
ter Supply)10 8.30-
I I I I120 158 180 210
Elapsed Time in Days240 270 3 338 365
Figure B-69 Residual capacity for water supply pumping stations (NEHRP Map Area 3-6, Non-California 7, and Puget Sound 5).
Appendix B: Lifeline Vulnerability Functions
R=1800
U R= so/:n
R.= S0IIO
CCCCc-
:a:
Figure B-68
DAYS:
R=1
.
CO'aCL'
_ R-
caIr
r 3Bb 1.0068 8.5866 0.20
11111 a b
6 0 .156 0.0447 0.122 0,0268 0.092 0.0179 0.064 0.012
10 0.042 0.0B9
R = b days + a
l
Il l
ATC-25252

Pumping Station (Water Supply)OCR. . 1tR a R n a SA
68 8.50fis 8.20
MMT -ul
678
910
.0.20S0. 16
.8692W8064
4i
08. 1038. 044A. 826
8.8170.012
R b * days a
l~ ~ ~ l I
90 128 190 188 218 240 278 308 338 365Elapsed Time in Days
Figure B-70 Residual capacity for water supply pumping stations (All other areas).
with clayey soils have performed well. Damsconstructed of hydraulic fill using saturated,poorly compacted, fine-grain cohesionlessmaterial; dams constructed on naturalcohesionless deposits that are not as denseas the embankments; and dams withunusually steep embankments haveexperienced failures in past earthquakes.Dam embankments may respond to soilfailures by cracking (usually at the crest ornear the crest and abutments), spreading orsettling, or by slope stability failures. or zonalseparations. Liquefaction may occur insaturated zones of cohesionless materialsthat are loose or marginally compacted, suchas hydraulic fills. Both soil and rockfoundations may be damaged by faultrupture, resulting in loss of continuity orintegrity of internal design features, (drains,imperious zones, etc.) and water-releasefeatures (conduit and tunnels). Earthquake-induced landslides may block water outletfeatures or spillways, Or cause waves thatovertop the dam and cause erosion. Wherecracks are opened in the embankment orfoundation, the danger of piping exists ifcracks remain open. Rockfill dams haveperformed well, with some damage tomaterial near the crest of the dam.
Settlement of rockfill dams is also apossibility. Concrete dams have alsoperformed well with little damage known.Cracking of dams and foundation failuresare possible.
Seismically Resistant Design: Seismicallyresistant design practices for earthfill dams,include providing ample freeboard to allowfor settlement and other movements, andusing wide cores and transition zonesconstructed of material resistant to cracking.Current design typically used dynamicanalyses for all but small dams on stablefoundations. These analyses are used todetermine the liquefaction or strainpotential of embankments and foundations,and to estimate the settlement ofembankments. Conservative crest detailsinclude providing transition and shell zonesthat extend to the crest to control anyseepage that develops through cracks, andproviding camber for static and dynamicsettlement. Conservative zoning consists ofproviding confined clay cores, widecohesionless transitions, and free drainingshells. Reduction of embankment slopes andelimination of embankment saturationthrough linings can reduce susceptibility to
ATC-25 Appendix B: Lifeline Vulnerability Functions 253
3GO i~I to o..MaD-4 GO1..
1
05
-CL
O'R= 907
.. -
EC ~
DhYS: 30 60L I I I L l l I
. . . . . . . . .
ATC-25 Appendix B: Lifeline Vulnerability Functions 253
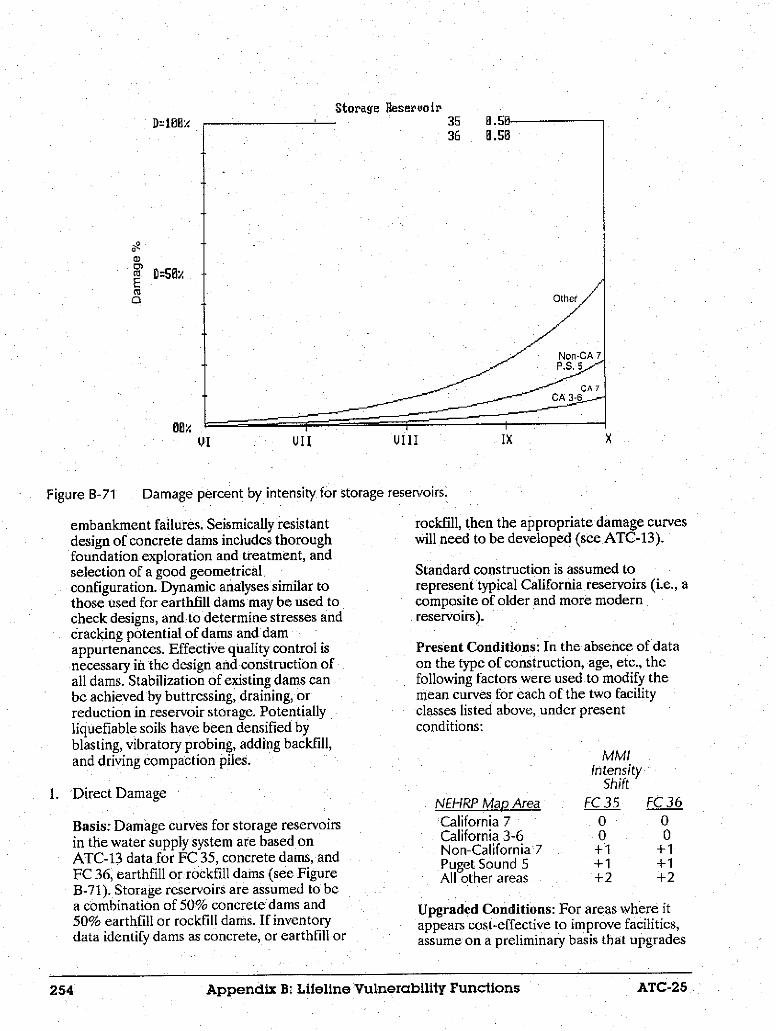
Storage Reservoir35 0.50-36 a.5
Other
VI I Vi Vill Ix
Damage percent by intensity for storage reservoirs.
embankment failures. Seismically resistantdesign of concrete dams includes thoroughfoundation exploration and treatment, andselection of a good geometricalconfiguration. Dynamic analyses similar tothose used for earthfill dams may be used tocheck designs, and to determine stresses andcracking potential of dams and damappurtenances. Effective quality control isnecessary in the design and construction ofall dams. Stabilization of existing dams canbe achieved by buttressing, draining, orreduction in reservoir storage. Potentiallyliquefiable soils have been densified byblasting, vibratory probing, adding backfill,and driving compaction piles.
1. Direct Damage
Basis: Damage curves for storage reservoirsin the water supply system are based onATC-13 data for FC 35, concrete dams, andFC 36, earthfill or rockfill dams (see FigureB-71). Storage reservoirs are assumed to bea combination of 50% concrete dams and50% earthfill or rockfill dams. If inventorydata identify dams as concrete, or earthfill or
rockfill, then the appropriate damage curveswill need to be developed (see ATC-13).
Standard construction is assumed torepresent typical California reservoirs (i.e., acomposite of older and more modernreservoirs).
Present Conditions: In the absence of dataon the type of construction, age, etc., thefollowing factors were used to modify themean curves for each of the two facilityclasses listed above, under presentconditions:
NEHRP Map Area
California 7California 3-6Non-California 7Puget Sound 5All other areas
MM/Intensity
ShiftFC35 FC36
o O 0
0 0+1 +1+-1 +1
+2 +2
Upgraded Conditions: For areas where itappears cost-effective to improve facilities,assume on a preliminary basis that upgrades
254 Appendix B: Lifeline Vulnerability Functions ATC-25
a)
ECZ
0a
Figure B-71
X
Appendix B, Lifeline Vulnerability Functions ATC-25254

age fleservolr1.a
rau U..JU
38 8.58
li
7
89
to
aL0.8718D865
2.8660.066
b8.537
e . 94e.833
8.819
= * das a
I t k I i
90 128 158 1B 218 248 Z 78 388 330Elapsed Time in ays
365
Residual capacity for storage reservoirs (NEHRP California 7).
result in a beneficial intensity shift of oneunit (i.e., -1), relative to the above presentconditions.
Time-to-restoration: The time-to-restoration data assigned to SF 30c, storagereservoirs for water supply systems, areassumed to apply to all storage reservoirs.By combining these data with the damagecurves derived using the damage data for FC35 and 36, the time-to-restoration curvesshown in Figures B-72 through B-74 werederived.
B.6.4 Treatment Plants
1. General
Description: Water treatment plants arecomplex facilities. In general, the typicalwater sources for a treatment plant areshallow or deep wells, rivers, natural lakes,and impounding reservoirs. Treatmentprocesses used depend on the raw-watersource and the quality of finished waterdesired. Water from wells typically requiresthe least treatment, and water from rivers
requires the most. Types of water treatmentplants include aeration, split treatment, orchemical treatment plants. Flexibility androom for growth are typically provided tohandle changing quality of water.Consequently, plants commonly containcomponents of different vintages andconstruction types. Current pre-treatmentprocesses are screening, pre-sedimentationor desilting, chemical addition, and aeration.Components in the treatment processinclude pre-sedimentation basins, aerators,detention tanks, flocculators, clarifiers,backwash tanks, conduit and channels, coal-sand or sand filters, mixing tanks, settlingtanks, clear wells, and chemical tanks.Processes used for flocculation includepaddle (most common in modem facilities),diffused air, baffles (common in olderfacilities), transverse or parallel shaft mixers,vertical turbine mixers, and walking-beam-type mixers. Sedimentation basinconstruction may vary from excavation inthe ground to a structure of concrete orsteel construction. Most modernsedimentation basins are circular concretetanks (open or covered), equipped with
Appendix B: Lifeline Vulnerability Functions
*0
CLco
EnCD
IC
B= S8Z
r= z.DAYS: 0 60
Figure B-72
ll l : l j l S
INs a C14
ATC:-25 255

Storage Reservohi- 30c, 1.00
68 98 120 150 188 218 ;
Elapsed Time in Days40 278 300 338 365
Residual capacity for storage reservoirs (NEHRP Map Area: California 3-6, Non-California7, and Puget Sound 5).
Storage Reservoir
DAYS: 30 68 90 120 158 188 218 Z40 270 308 330 365
Elapsed Time in Days
Residual capacity for storage reservoirs (All other areas).
256 Appendix B: Lifeline Vulnerability Functions ATC-25
co
o R= 5O
.D
a)I~r:
R= 0;/
DAYS: 30
Figure B-73
. _
co CLma
2 R=_ SOV:3
, C,
En
.R= Ox
Figure B-74
I
1
Appendix B: Lifeline Vulnerability Functions ATC-25256

mechanical scrapers for sludge removal.Depths typically vary from 8 to 12 feet anddiameters from 30 to 150 feet. Sludgeprocessing components include holdingtanks and clarifier thickeners. Controlequipment, pumps, piping, valves, and otherequipment are ypically housed in a controlbuilding. Yard equipment generally includestransformers and switchyard equipment.
Typical Seismic Damage: Structures andequipment in water treatment plants arevulnerable to settling of foundations,especially when founded on fill. Differentialsettlement of adjacent structures andcomponents supported on differentfoundations is a particular problem Pipesare vulnerable at locations where theyconnect to or penetrate treatmentstructures. Equipment such as pumps can bedamaged by loads imposed by piping whendifferential settlement occurs. Channels andlarge conduit connecting processing unitsare subject to seismic damage from severalmechanisms, including differentialmovement from inertial loading, differentialsettlement, and increased lateral earthpressures. Liquefaction may cause someunderground structures in areas of highgroundwater to float. Concrete basins andtanks are subject to cracking and collapse ofwalls and roofs. Pounding damage orpermanent movement may result in theopening of expansion joints in basins.Within basins, sloshing and wave action, aswell as shaking, can damage anchor boltsand support members for reactors and rakes.Building damage may range from droppedsuspended ceilings and cracks in walls andframes to partial and total collapse.Unanchored or improperly anchoredequipment may slide or topple, experiencingdamage or causing attached piping andconduit to fail. Damage to substationtransformers can result in loss of powersupply.
Seismically Resistant Design: Seismicallyresistant design includes providing capabilityto bypass plant treatment and to provideemergency chlorination in the event ofdamage caused by an earthquake. Anemergency power system for the chlorineinjection, controls, and radios is a minimumand if gravity flow is not possible, sufficient
emergency power to provide pumpingcapacity must be available. Slopes adjacentto the plant should be studied to ascertaintheir stability, and mitigating measuresshould be taken if necessary. Damage tochannels and conduit can be mitigated byproviding wall penetrations that allow fordifferential settlement. Similarly, flexibilityshould be provided in connections andpiping where they span across erypansionjoints or between structures on difterentfoundation types. Equipment damage can bereduced by using cast-in-place bolts ratherthan expansion anchors and usingequipment with a low center of gravity.Equipment and piping should be protectedfrom falling debris. Building design shouldsatisfy the seismic requirements of the localbuilding code, as a minimum. Heavyequipment such as sludge-processingequipment should be located as low aspossible in the building. Horizontal tanks onsaddles should be restrained to saddles toprevent slippage and rupture of attachedpiping. Design of equipment immersed inwater (e.g., paddles, rakes, baffles) shouldconsider both inertial effects and those dueto sloshing of water. Design of suchequipment should also consider ease ofreplacement. Vertical turbine pumpshanging in tanks should be avoided ifpossible--or designed for seismic loads, as aminimum. Chlorine cylinders should bestrapped in place on snubbed chlorinescales. Standard safety and shutdownsystems for gas and chemical systems shouldbe installed and properly maintained.Routine checks are recommended to ensurethat valves are operable, and that stockpilesof spare parts and tools are available. Basinsor structures founded on separatefoundation materials should have separatefoundations and should be separated by aflexible joint. All critical piping (exclusive ofcorrosive chemical systems) should bewelded steel.
2. Direct Damage
Basis: Damage curves for treatment plantsin the water supply system (see Figure B-75)are based on ATC-13 data for C 10,medium-rise reinforced masonry shear wallbuildings; C 41, underground liquid storagetanks, and FC 68, mechanical equipment.
Appendix B: Lifeline Vulnerabilitly FunctionsATC-25 257

Treatment Plant (Water Supply)
Other
VI VII Viii IXModified Mercalli Intensity (MMI)
Damage percent by intensity for water supply treatment plants.
FC 10 was chosen to represent a genericbuilding, based on review of damage curvesfor all buildings. Water treatment plants areassumed to a combination of 20% genericbuildings, 30% underground storage tanks,and 50% mechanical equipment.
Standard construction is assumed torepresent typical California treatment plantsunder present conditions (i.e., a compositeof older and more modern treatmentplants). It is assumed that minimal regionalvariation exists in construction quality ofunderground storage tanks and mechanicalequipment. Seismic loads have little impacton underground storage tank design, andoperational loads often govern over seismicrequirements in the design of mechanicalequipment.
Present Conditions: In the absence of dataon the type of material, age, etc., use thefollowing factors to modify the mean curvesfor each of the three facility classes listedabove, under present conditions:
NEHRP Map AreaCalifornia 7California 3-6Non-California 7Puget Sound 5All other areas
MM/Intensity
ShiftFC 10FC41FC68
o 0 0+1 0 0+1 0 0+1 0 0+2 +1 +1
Upgraded Conditions: For areas where itappears cost-effective to improve facilities,assume on a preliminary basis that upgradesresult in a beneficial intensity shift of oneunit (i.e., -1), relative to the above presentconditions.
Time-to-restoration: The time-to-restoration data assigned to SF 30d,treatment plants in the water supply system,are assumed to apply to all treatment plants.By combining these data with the damagecurves derived using the data for FC 10, 41,and 68, the time-to-restoration curves shownin Figures B-76 through B-78 were derived.
Appendix B: Lifeline Vulnerability Functions
a)0)E D=S073
Figure B-75
X
258 ATC-25

atment Plant (Water Supply)30d1 I.00 18 0.20
68 5.-541 0.3fi
78
18
a8.809
* .8360.8658. 80113.894
b0.W11
0.172.858
8. 228.811
R =b *days
68 981 120 150 188 218
Elapsed Time in Days240 2 3 38
Residuai capacity for water supply treatment plants NEHRP California 7).
:
u5G
aCaI
-a
Figure B-77
B= x
b0.4045 89180.838
B. 811H.Hi
ys +
lJAYS: 38 68 98 128 158 188 218Elapsed Time in Days
248 270 388 338
Residual capacity for water supply treatment plants (NEHRP Map Area 3-6, Non-California 7 and Puget Sound 5).
Appendix B: Lifeline Vulnerability Functions
5
H=1EB,
,S R= x
R= 13;:DAYS: 3f
Figure B-76
35
I I I i I I :I , , ,
IRz=1E0
I I
ATC-25 259

Treatment Plant (Water Supply)1.00 10 0.20
68 3.5041 0.30
IHHI a b6 0.051 0.0917 0.870 0.8308 0.085 B.01B9 0.897 0.818
10 0.106 0. 006
B b * da9s + a
I I I I 1
120 15 180 210 248Elapsed Time in Days
I I
270 300 330 365
Residual capacity for water supply treatment plants (All other areas).
B.6.5 Terminal ReservoirslTanks
1. General
Description: In general, terminal reservoirsmay be underground, on-ground, orelevated storage tanks or impoundingreservoirs. Underground storage tanks aretypically reinforced or prestressed concretewall construction with either concrete orwood roofs. They may be either circular orrectangular. On-ground water supplystorage tanks are typically vertical anchoredand/or unanchored tanks supported atground level. Construction materials includewelded, bolted, or riveted steel; reinforcedor prestressed concrete; or wood. Tankfoundations may consist of sand or gravel, ora concrete ring wall supporting the shell.Elevated storage tanks consist of tankssupported by single or multiple columns.Most elevated tanks are steel and aregenerally cylindrical or ellipsoidal in shape.Multiple-column tanks typically havediagonal braces, for lateral loads. Elevatedtanks are more common in areas of flatterrain. There is large variation in tank sizes(i.e., height and diameter), so volumes rangefrom thousands to millions of gallons.
Impounding reservoirs may be lined orunlined, and with or without roofs.
Typical Seismic Damage: Failure modes forunderground tanks include damage toconcrete columns that support roofs,sloshing damage to roofs, and cracking ofwalls. In cases of liquefaction, empty tankscan become buoyant and float upward,rupturing attached piping. Impoundingreservoirs perform similarly to undergroundtanks. At-ground tanks are subject to avariety of damage mechanisms, including,for steel tanks: (1) failure of weld betweenbase plate and wall, (2) buckling of tank wall(elephant foot), (3) rupture of attached rigidpiping resulting from sliding or rocking oftank, (4) implosion of tank caused by rapidloss of contents and negative internalpressure, (5) differential settlement, (6)anchorage failure or tearing of tank wall, (7)failure of roof-to-shell connection, (8)failure of shell at bolts or rivets, and (9) totalcollapse. Concrete tank failure modesinclude: (1) failure of columns supportingroofs, (2) spalling and cracking, and (3)sliding at construction joints. Wood tankshave not performed well in past earthquakesand generally fail in a catastrophic manner.
Appendix B: Lifeline Vulnerability Functions
R-10 0
._
Ca
C)a)cc
n n IA S U : 3
DAYS: 30
Figure B-78
I I
60 90
ATC-25260
1- UioI
:
1 I I II

Elevated tanks typically fail as a result ofinadequate bracing or struts, althoughcolumn buckling or anchorage orconnection failure (clevises and gussetplates) are common causes. If elevated tankdamage exceeds minor bracing orconnection failure, damage is usuallycatastrophic- Piping and otherappurtenances attached to tanks can alsofail because of tank or pipe motion, causingloss of contents.
Seismically Resistant Design: GeneralSeismically resistant design practices forunderground tanks include designing wallsfor a combination of earth pressures andseismic loads; densifyng the backfill usedbehind the walls to reduce liquefactionpotential; designing columns supporting theroof for seismic loads; tying the roof andwalls together; providing adequatefreeboard to prevent sloshing against theroof; and recognizing the potential forflotation and providing restraint Control ofbuoyant forces can be achieved by tying thetank to piles designed to resist uplift,increasing the mass of the tank (e.g., provideoverburden on the roo, or providing apositive drainage system. An annular spacethat permits relative movement should beprovided where piping penetrates the wall.Seismically resistant design practices for at-ground tanks include the use of flexiblepiping, pressure relief valves, and well-compacted foundations and reinforcedconcrete ring walls that prevent differentialsettlement. Adequate freeboard to preventsloshing against the roof should bemaintained. Good practices, for steel tanksinclude providing positive attachmentbetween the roof and shell, stiffening thebottom plate and its connection to the shell,protecting the base plate against corrosion,and avoiding abrupt changes in thicknessbetween adjacent courses. Properly detailedductile anchor bolts may be feasible onsmaller steel tanks. For concrete tanks,keying and detailing to prevent sliding isgood practice. Columns supporting roofsshould be detailed to prevent brittle failures.In areas where freeze-thaw cycles are aproblem, minimum strength requirementsthat ensure durability should be met. Forwood tanks, Seismically resistant designpractices include increasing hoop capacity,
and anchoring or strapping the tank to thefoundation. Maintaining a height-to-diameter ratio of between 0.3 and i07 fortanks supported on-ground controls seismicloading. Because the damage to elevatedtanks typically involves the supportingstructure rather than the supported vessel,the primary Seismically resistant designpractices for elevated tanks are design of thebraces for adequate lateral loads, providingadequate anchorage at the column bases,connecting the tank to the frames thatsupport it for load transfer, and providingflexibility in the attached piping toaccommodate expected motions. Thebracing system should be designed to yieldprior to connection failure. Rods used forbracing should have upset threads with largedeformable washers under retaining nuts toabsorb energy.
2. Direct Damage
Basis: Damage curves for water supplyterminal reservoirs are based on ATC-13data for FC 43, on-ground liquid storagetanks (see Figure B-79),. On-ground storagetanks, are less vulnerable than elevatedtanks, and more vulnerable thanunderground tanks, and were chosen asrepresentative of existing terminalreservoirs. If inventory data identify tanks asunderground or elevated, then use FC 41 or45, respectively, in lieu of FC 43.
Standard construction is assumed torepresent typical California terminalreservoirs under present conditions [i.e., acomposite of older, non-seismically designedtanks as well as more modern tanks designedto seismic requirements (e.g., AWWADI00, Appendix A)].
Present Conditions: In the absence of dataas to type of material, age etc., use thefollowing factors to modify the mean curves,under present conditions:
NEHRP Map Area
California 7California 3-6Non-California 7Puget Sound 5All other areas
MMIIntensity
Shift0
+1+1 '+1+2
Appendix B: Lifeline Vulnerability FunctionsATCC:-25 2,1

Terminal Reservoir (Storage43 1.
Othi
WII III IXModified Mercalli Intensity (MMI)
Damage percent by intensity for water supply terminal reservoirs/storage tanks.
Upgraded Conditions: For areas where itappears cost-effective to improve facilities,assume on a preliminary basis that upgradesresult in one or two beneficial intensityshifts (i.e., -1 or -2), relative to the abovepresent conditions.
Time-to-restoration: The time-to-restoration data assigned to SF 30e, terminalreservoirs for water supply, are assumed toapply to all tanks. By combining these datawith the damage curves for FC 43, the time-to-restoration curves shown in Figures B-80through B-82 are derived.
B.6.6 Trunk Lines
1. General
Description: In general, trunk lines may beunderground, on-ground, or supported onelevated frames above ground. However,most trunk lines in the water supply systemare located underground. Pipe materialsinclude cast iron, welded steel, riveted steel,concrete-lined steel, asbestos cement, andplastic. Newer trunk lines (typically 20
inches or more in diameter) are usuallywelded steel or reinforced concrete and maycarry water at high pressures (severalhundred psi). Joints in steel pipes may bewelded or bell-and-spigot types. Except inareas of freezing, backfill measured from thepipe crown is typically between 2.5 and 4.5feet. In addition to the pipes themselves,trunk lines include a number of othercomponents. Pipelines may require gatevalves, check valves, air-inlet release valves,drains, surge control equipment, expansionjoints, insulation joints, and manholes.Check valves are normally located on theupstream side of pumping equipment and atthe beginning of each rise in the pipeline toprevent back flow. Gate valves are used topermit portions of pipe or check valves to beisolated. Air-release valves are needed atthe high points in the line to release trappedgases and to vent the lines to preventvacuum formation. Drains are located at lowpoints to permit removal of sediment andallow the conduit to be emptied. Surge tanksor quick-opening valves provide relief forproblems of hydraulic surge.
Appendix B: Lifeline Vulnerability Functions
D=180v
80
a)0)ca D=507E
a
1V
Figure B-79
X
262 ATC-25

ninal Reservoir (Storage Tank),o- 4 an AS 4 ra-Uc .Inju tzl J. ULJ
6789
le
a0.26Z
E. 264
8.253
8.2360.802
b1.3470,72.22
a.8780.827
R =b * days + a
60 9 128 1581 1B8 218Elapsed Time in Days
I j I T
24a 278 3 330
Residual capacity-for water supply terminal reservoirsgstorage tanks NEHRP California 7).
minal Reservoir (Storage Tank)_ _ IR 11 I aR ' 4 via- -*.I f l .L.ZJ-
MII &
6 8.2647 1,'258,B . 2369 2.28218 - 43
.7578.2200.8788,827E.821
R =b * days + a
I I i i iR= 8
DAYS:I I I I I I I I
68 90 128 15 113 218 240 278 388 330
Elapsed Time in Days365
Residual capacity for water supply terminal reservoirs/storage tanks (NEHRP Map Area 3-6, Non-California 7, and Puget Sound 5).
Appendix B: Lifeline Vulnerability Functions
L;
c
W:
nC,La
DAYS: 30
Figure B-80
R=128O
. _
aC.C
0FU
Figure B-81
I i J ! § { { *'R x l
ATC-25 23

I R=10fly
.-
(ac)
o R= S8,
:m-aCn(U)
D- AR,
nal Reservoir (Storage Tank)I M 4A AO 4 R R -
U- U. I I , I I I I I I
DAYS: 3 60 90 120 15R 180 210 240 270 300 330 365Elapsed Time in Days
Figure B-82 Residual capacity for water supply terminal reservoirs/storage tanks (All other areas).
Typical Seismic Damage: The performance Seismically Resistant Design: Seismicallyof pipelines is strongly dependent on *resistant design practices for trunk lineswhether or not the supporting or include the use of ductile pipe materials,surrounding soil fails. Failure of a piping such as steel, ductile iron, copper, or plastic.system resulting from inertial loads only is The performance of welded steel pipelinesrare; more typically differential settlement is dependent upon the quality of welds, withor severe ground failure (e.g., landslide, more modern pipes generally havingliquefaction, faulting) causes damage. superior welds. Use of flexible joints (e.g.,Regional uplift can alter the hydraulic bell-and-spigot with rubber gaskets,characteristics of a transmission system mechanical joints, expansion joints, rubberrendering it nonfunctional. Pipe damage is or metallic bellows, and ball joints) andmost common in soft alluvial soils or at placement of pipes in dense native orinterfaces between soft and firm soils. Types compact soil not subject to liquefaction,of pipe damage include bending or crushing slides, or surface rupture will mitigate muchof the pipe, shearing of the pipe, of the potential damage. Special precautionscompressional buckling, soil deposits in the should be taken to reduce earthquakepipe, circumferential and longitudinal effects at pumping plants, tanks, bay or rivercracks, and joint failure. It has frequently crossings, and fault crossings. Shut-off valvesbeen observed that pipelines with rigid should be installed near active fault zones sojoints fail more frequently than those with that flow can be stopped if the pipelineflexible joints. Damage has been substantial crossing is damaged. Trunk lines at faultat locations of local restraint such as crossings should be located in a sacrificialpenetrations to heavy subsurface structures tunnel or culvert, or lubricated, wrapped in(including manholes), tees, and elbows. sheathing, or buried in shallow loose fill,Water hammer induced by ground motions installed or above ground near the fault tocan cause damage by temporarily increasing allow lateral and longitudinal slippage.pressure in pipelines. Anchors such as thrust blocks or bends
264 Appendix B: Lifeline Vulnerability Functions ATC-25
- Ie L.IJU *ta L.nU
MII a b6 0.258 0.2207 0.236 0,870B 0.002 0.8279 -8.413 8.021
10 -0.534 .017
R b * days + a
1 I I I I I I

bpk=20
IDG
E
by k=ia
m0)
V)
bipk=O
runk Lines
VI lii VIIIModified Mercalli Intensity (MM
Figure B-83 Damage percent by intensity for water supply trunk lines.
should be excluded within a distance of 300 (between 4feet of a fault zone and strengthened pipe generally mcshould be used within the zone. Valve because of tLspacing near fault zones, or in areas of assumed thaexpected soil failure should be reduced. approximateProper maintenance and cathodic use of one dprotection to limit corrosion, which weakens + 1).pipes, is important for mitigating damage.Supports for on- or above ground piping Standard coishould provide restraint in all three represent yorthogonal directions by using ring girders, under preseand spacing between adjacent trunk lines of older andshould be sufficient to prevent pounding. minimal regiUse of pressure relief valves can mitigate constructiondamage caused by water hammer.Redundancy should be built into the system Present Conwhenever possible; several smaller pipes on the type should be used in lieu of one large pipe. Any the followinequipment attached to piping should be the mean cuproperly anchored.
2. Direct Damage
Basis: Damage curves for trunk lines in thewater supply system are based on ATC-13data for FC 31, underground pipelines (seeFigure B-83). Distribution pipelines,
IxI13
and 20 inches in diameter) are)re susceptible to damageheir construction type, and it ist their behavior can be:d using these data through theetrimental intensity shift (i.e.,
Instruction is assumed toDpical California trunk linesant conditions (ie., a composite-more modern trunk lines). Onlyonal variation in thequality is assumed.
ditions: In the absence of data)f material, diameter, age, etc.,g factors were used to modifyrves, under present conditions:
NFHRP Map AreaCalifornia 7California 3-6Non-California 7Puget Sound 5All other areas
MM/Intensity
Shift0000
+1
Appendix B: Lifeline Vulnerability Functions
.
ATC:-25 26.5
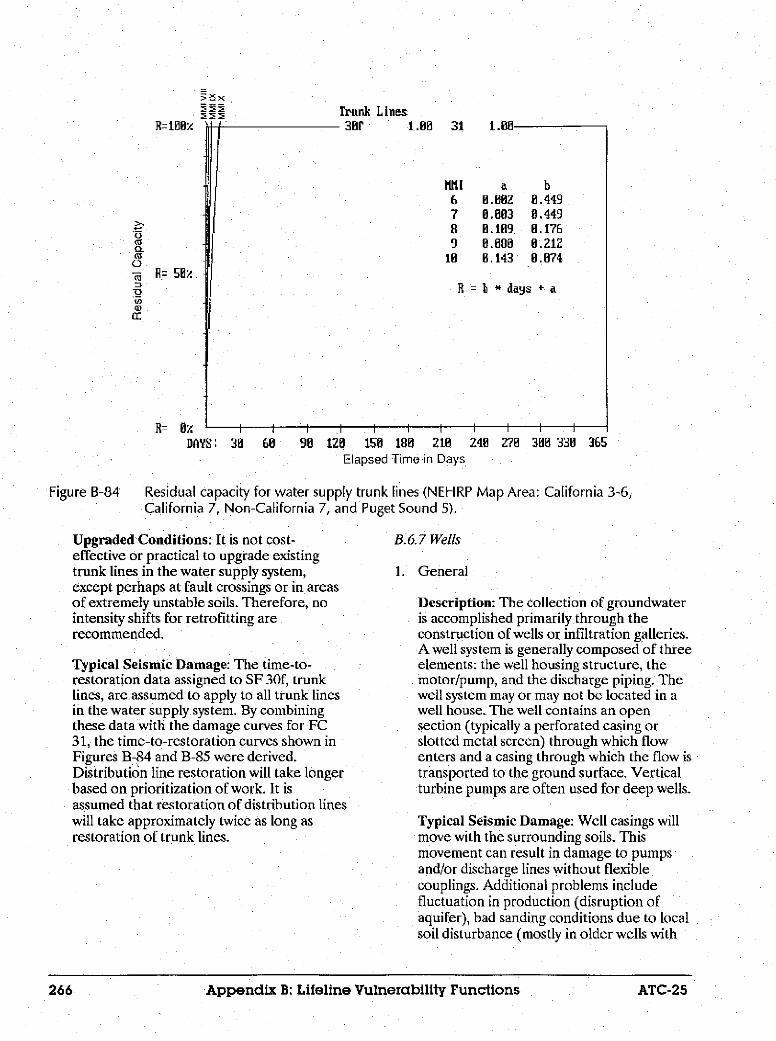
>xx
R2 100
*018
.
coQ
-F Rz So-o
a<)
c:
U .-- I
DAYS: 30 68
Trunk Lines .30F 1.00 31
I I1 I I I
90 120 150 180 210 Z40Elapsed Time in Days
Figure B-84 Residual capacity for water supply trurCalifornia 7, Non-California 7, and Put
Upgraded Conditions: It is not cost-effective or practical to upgrade existingtrunk lines in the water supply system,except perhaps at fault crossings or in areasof extremely unstable soils. Therefore, nointensity shifts for retrofitting arerecommended.
Typical Seismic Damage: The time-to-restoration data assigned to SF 30f, trunklines, are assumed to apply to all trunk linesin the water supply system. By combiningthese data with the damage curves for FC31, the time-to-restoration curves shown inFigures B-84 and B-85 were derived.Distribution line restoration will take longerbased on prioritization of work. It isassumed that restoration of distribution lineswill take approximately twice as long asrestoration of trunk lines.
I .00
27 3 338 365
ik lines (NEHRP Map Area: California 3-6,get Sound 5).
B.6. 7 Wells
1. General
Description: The collection of groundwateris accomplished primarily. through theconstruction of wells or infiltration galleries.A well system is generally composed of threeelements: the well housing structure, themotor/pump, and the discharge piping. Thewell system may or may not be located in awell house.. The well contains an opensection (typically a perforated casing orslotted metal screen) through which flowenters and a casing through which the flow istransported to the ground surface. Verticalturbine pumps are often used for deep wells.
Typical Seismic Damage: Well casings willmove with the surrounding soils. Thismovement can result in damage to pumpsand/or discharge lines without flexiblecouplings. Additional problems includefluctuation in production (disruption ofaquifer), bad sanding conditions due to localsoil disturbance (mostly in older wells with
Appendix B: Lifeline Vulnerability Functions
MII a b6 0.002 0.449
7 0.883 8.4498 8.109 0.1769 8.880 0.212
10 0.143 0.074
R b * days + a
I
- I use
I
266 ATC-25

20-aC_
UC:
DAYS: 38
Trunk LinesS3Br 1. 31
MII
67R
toin
.f
a-
E . 03
B . 90.1432. 179
bB .449
E . 176..212
0. 874E.034
R = b * ays + a
I I l I I I
60 90 126 158I 1 216
Elapsed Time in Days
I I i i
248 272 380 338 365
Residual capacity for water supply trunk lines (All other areas).
insufficient screen design), kinked tubing,and collapse of the casing. The well shaftcan be crushed or sheared off by grounddisplacement across, the shaft or by groundvibration. Wells may be contaminated byinflow from nearby sewers, septic tanks, andcesspools that are damaged by theearthquake. Damage to substationtransformers can result in loss of powersupply.
Seismically Resistant Design: As seismicdesign practices may include providingdouble casing at depths below wherehorizontal movement is expected.Submersible pumps/motors have a greaterprobability of remaining in service than dopumps connected to motors at the surfacewith drive shafts. Because the well casingwill respond differently than the slab of thesurrounding well house, a flexible separationjoint should be provided between the casingand the slab. Effects of differentialmovement and settlement can be mitigatedby providing a flexible joint between thepump discharge header and the dischargepiping. Other electrical and mechanical
equipment should be provided withadequate seismic anchorage. The well-housing structure should be designed withseismic provisions of local or nationalbuilding codes.
2. Direct Damage
Basis: Damage curves for wells in the watersupply system (see Figure B-&6) are basedon ATC-13 data for FC 68, mechanicalequipment. It is believed that this facilityclass best approximates the expectedperformance of wells, which typicallycomprise a vertical pump in a shaft.
Standard construction is assumed torepresent typical California wells underpresent conditions (i.e., a composite of olderand more modern wells). Only minimalregional variation in the construction qualityis assumed.
Present Conditions: In the absence of dataon the type of pump, etc., the followingfactors were used to modify the meancurves, under present conditions:
Appendix B: Lifeline Vulnerability Functions
Figure B-85
r fRR
i
D_ a.-M= M-fn- oz.
ATC-25 27
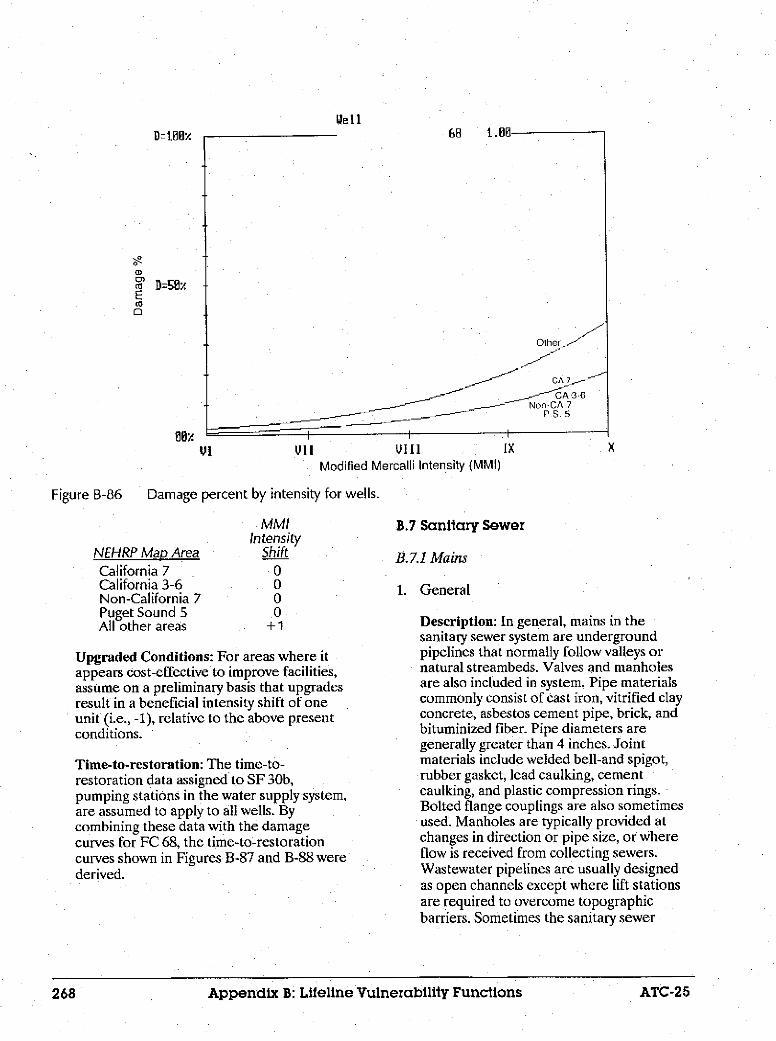
V1
Uell68 1.00
Other id
/ ~CA7 ,~ CA 3 -6
- - N~on-CA 7P.S.
1)11 VI11 Ix X
Modified Mercalli Intensity (MMI)
Figure B-86 Damage percent by intensity for wells.
MMIIntensity
NEHRP Map Area ShiftCalifornia 7 0California 3-6 0Non-California 7 0Puget Sound 5 0All other areas +1
Upgraded Conditions: For areas where itappears cost-effective to improve facilities,assume on a preliminary basis that upgradesresult in a beneficial intensity shift of oneunit (i.e., -1), relative to the above presentconditions.
Time-to-restoration: The time-to-restoration data assigned to SF 30b,pumping stations in the water supply system,are assumed to apply to all wells. Bycombining these data with the damagecurves for FC 68, the time-to-restorationcurves shown in Figures B-87 and B-88 werederived.
B.7 Sanitary Sewer
B. 7.1 Mains
1. General
Description: In general, mains in thesanitary sewer system are undergroundpipelines that normally follow valleys ornatural streambeds. Valves and manholesare also included in system. Pipe materialscommonly consist of cast iron, vitrified clayconcrete, asbestos cement pipe, brick, andbituminized fiber. Pipe diameters aregenerally greater than 4 inches. Jointmaterials include welded bell-and spigot,rubber gasket, lead caulking, cementcaulking, and plastic compression rings.Bolted flange couplings are also sometimesused. Manholes are typically provided atchanges in direction or pipe size, or whereflow is received from collecting sewers.Wastewater pipelines are usually designedas open channels except where lift stationsare required to overcome topographicbarriers. Sometimes the sanitary sewer
Appendix B: Lifeline Vulnerability Functions
0a)0)E(6
D=SOY
ATC-25268

Uell- 30h
Ii
E
IE
EB 98 i2o 158 is8 218Elapsed Time in Days
30
a 017 0.2k,39 0.89
56 0.4:
28 8.8 z3E6 0.011
&ays a
3
248 278 38 338
Residual capacity for wells (NEHRP Map Area: California 3-6, California 7, Non-California7, and Puget Sound 5).
WelIIaL
_
o
-o
a) -
R= l S 3 IDAYS: 30
1.80 68 1.00
LMI
67891o8
a8.199
80 15
8 .120lEl. I68GEl . 62
b,
0.043
8.8160.0L2
R = b * days + a
I t II I I I
5Q 9l 120; 155 1BO 218
Elapsed Time in Days240 278 38 330 365
Figure B-88 Residual capacity for wells (All other areas).
Appendix B: Lifeline Vulnerability Functions
5
C,
') R= 5Ez
;a
R= yDAYS: 38
Figure B-87
I I L
. L
I I
.IUD
. . . .
2.69ATC-25.

system flow is combined with the stormwater system prior to treatment.
Typical Seismic Damage: The performanceof pipelines is strongly dependent onwhether or not the surrounding soil fails(e.g., landslide, liquefaction, or faultrupture). Pipe damage is most common insoft alluvial soils or at interfaces betweensoft and firm soils. Failure of piping causedby inertial loads is uncommon. Potentialtypes of damage include pipe crushing andcracking caused by shearing andcompression; joint breaking because ofexcessive deflection or compression; jointspulling open in tension; and changes insewer grade, causing reduced flow capacity.Tension and compression failures at jointsbecause of soil movement have beencommon. Flexible joints have sufferedsignificantly less damage than rigid joints.Welded bell-and-spigot joints have.performed poorly when subjected tolongitudinal stress. Cast-iron pipes withrubber gaskets or lead-caulked joints haveaccommodated movements better thanthose caulked with cement, but may still pullapart with major soil movements.
Seismically Resistant Design: Seismicallyresistant design practices for mains in thesewer system include the use of flexiblejoints (e.g., butt-welded and double-weldedjoints, restrained-articulated joints, andrestrained bell-and-spigot joints with ringgaskets on a short length of pipe section),and avoiding longitudinally stiff couplingssuch as cement or lead-caulked, plain bell-and-spigot, and bolted flange. Placement ofmains in dense native or compact soil notsubject to liquefaction, slides, or surfacerupture will mitigate much of the potentialdamage. Special precautions should betaken to reduce earthquake effects at faultcrossings. Main lines at fault crossings canbe located in a sacrificial tunnel or culvert,or lubricated, wrapped in sheathing, buriedin shallow loose fill, or installed aboveground near the fault to allow lateral andlongitudinal slippage. Anchors such as bendsshould be excluded within a distance of 300feet of a fault zone and strengthened pipeshould be used within the zone. Isolationvalves should be placed near fault zones orin areas of expected soil failure. Proper
maintenance to limit corrosion of metalpipes, which weakens pipes, is important tomitigate damage. Any equipment attachedto piping should be properly anchored.
2. Direct Damage
Basis: Damage curves for mains in thesanitary sewer system are based on ATC-13data for FC 31, underground pipelines (seeFigure B-89). In general, mains in the.sanitary sewer system are more vulnerablethan those used in other systems because ofthe construction materials used. Unlike thewater supply system, larger pipes generallyoperate at lower pressures and thus are ofsimilar construction quality to the smallerpipes. Consequently, the above damagecurves may be used for all pipelines in thesanitary sewer system.
Standard construction is assumed torepresent typical California mains in thesanitary sewer system under presentconditions (i.e., a composite of older andmore modern mains). Only minimal regionalvariation in the construction quality isassumed.
Present Conditions: In the absence of dataon the type of material, diameter, age, etc.,the following factors were used to modifythe mean curves, under present conditions:
NEHRP Map AreaCalifornia 7California 3-6Non-California 7Puget Sound 5All other areas
MMIIntensity
Shift+1+1+1+1+2
Upgraded Conditions: It is not cost-effective or practical to upgrade existingmains in the sewer system, except perhaps atfault crossings or in areas of extremelyunstable soils. Therefore, no intensity shiftsfor retrofitting are recommended.
Time-to-restoration: The time-to-restoration data assigned to SF 31a, effluentand main sewer lines, are assumed to applyto all distribution lines. By combining thesedata with the damage curves for FC 31, thetime-to-restoration curves shown in Figures
270 Appendix B: Lifeline Vulnerability Functions ATC-25270 Appendix B: Lifeline Vulnerability Functions: ATC-25-

Mains/Linesbpk=20
ID
E
a0
a-CL_C
bpk=8
31
VI UVI VIII IXModified Mercalli Intensity (MMI)
Damage percent by intensity for sanitary sewer mains/lines.
B-'90 and B-91 were derived. Collector piperestoration will take longer because of itsrelatively lower priority. It is assumed thatrestoration of collector lines will takeapproximately twice as long as restoration ofthe mains.
B. 7.2 Pumping Stations
1. General
Description: Pumping stations or liftstations are typically used to transportaccumulated wastewater from a low point inthe collection system to a treatment plant.Pumping stations consist primarily of a wetwell, which intercepts incoming flows andpermits equalization of pump loadings, anda bank of pumps, which lift the wastewaterfrom the wet well. The centrifugal pumpfinds widest use at pumping stations. Liftstations are commonly located in small,shear-waIl-type buildings.
Typical Seismic Damage: Pumping stationswill suffer damage closely related to the soilmaterials on which they are constructed.
Because of their function, these stations aretypically located in low-lying areas of softalluvium where soil failures may occur.Buildings housing stations may experiencegeneric building damage ranging fromcracking of walls and frames to collapse, andunanchored electrical and mechanicalcontrol equipment may topple and slide,experiencing damage and tearing piping andconduit connections. Piping attached toheavy pump/motor equipment structures issusceptible to damage caused by differentialsettlement. Pumps/motors may alsoexperience damage as a result of differentialsettlement. Damage to substationtransformers can result in a loss of powersupply.
Seismically Resistant Design: Seismicallyresistant design practice includes avoidingunstable soils whenever possible andaddressing problems of expected differentialsettlement and liquefaction in the design offoundations. Flexibility of pipelines shouldbe provided when pipes are attached to twoseparate structures on different foundations.Annular space should be provided at pipe
Appendix B: Lifeline Vulnerability Functions
Figure B-89
K
ATC-25 271

R=tfloy
(a(at) R= 5v-I)
a:
DAYS: 30 60
Ha ins/Lines-1 a n n 4 o
i i i9gY 128 150 180 210
Elapsed Time in Days
I I I~~~~~~~~~~~
Z48 270 300 330 365
Residual capacity for sanitary sewer mains/lines (NEHRP Map Area: California 3-6,California 7, Non-California 7, and Puget Sound 5).
Hains/LinesII u 1 1 I R R -
Mll a6 -0.1737 -0.244B -0.0619 0.829
18 B. 09?
b
0.1340.1610.0558.0260.013
R = b days a
O I i I I I I I I iDAYS: 30 6 90 120 150 180 210 240 270 300 330 365
Elapsed Time in Days
Figure B-91 Residual capacity for sanitary sewer mains/lines (All other areas).
Appendix B: Lifeline Vulnerability Functions
titl a *b6 -8.517 0.3557 -0.173 0.134B -8.244 0.1619 -8.861 0 .855
10 0.029 H.026
R = b * days + a
Figure B-90
>oM
0 R= 50:v('3-0co
a:
- JeI .OU -. - uu
I I I I
- illd ~.U J]L I .....
BR=
ATC-25272

Pumping Station Sanitary Sewer)
Other
UI lUJI 'JII IX XModified Mercalli ntensity (MMi)
Damage percent by intensity for sanitary sewer pumping stations.
penetrations in massive structures. toprevent pipe damage in the event ofdifferential settlement. All mechanical andelectrical equipment should be anchoredand equipment on isolators properlysnubbed. Buildings housing equipmentshould be designed in accordance withseismic provisions of a local or nationalbuilding code. Provisions for emergencypower should be made for pumping stationscritical to systems operation.
2. Direct Damage
Basis: Damage curves for pumping stationsfor the sanitary sewer system (see Figure B-92) are based on ATC-13 data for FC 10,medium-rise reinforced masonry shear wallbuildings; FC 66, electrical equipment, andFC 68, mechanical equipment (see attachedfigure). FC 10 was chosen to represent ageneric building, based on review of damagecurves for all buildings. Pumping stations areassumed to be a combination of 30%generic buildings, 20% electrical equipment,and 50% mechanical equipment. Pumpingplants in the sewage system are assumed tobe located in poor soil areas. Consequently,the detrimental intensity shift indicated
below for mechanical and electricalequipment is assumed appropriate.
Standard construction is assumed torepresent typical California pumpingstations for sanitary sewer systems underpresent conditions (i.e., a composite of olderand more modern stations). Only minimalregional variation in construction quality ofmechanical equipment is assumed.
Present Conditions: In the absence of dataon the type of pumps, age, etc., thefollowing factors were used to modify themean curves, for each of the threefacilityclasses listed above, under presentconditions:
NEHRP Map AreaCalifornia 7California 3-6Non-California 7Puget Sound 5All other areas
MMIintensity
ShiftFC 10FC 66FC 68
0 0 +1+1 +1 +1+1 +1 +1+1 +1 +1+2 +2 +2
Appendix B: Lifeline Vulnerability Functions
D4Ei117
.0aC' D=SB7ECaC
Figure B-92
ATC-25 273

Pumping Station (Sanitary Sewer)31b 1.00 1 0.30
60 0.50
166 0.20
M1116789
10
a-0.146-0.189-0.232-8.261-0.280
b0. 182
0,8870.0430.0261.018
R = b * days a
B= en; "I l l i l l l li lIDAYS: 3 68 90 120 ISO 180 210 240 27 3 330 365
Elapsed Time in Days
Residual capacity for sanitary sewer pumping stations (NEHRP California 7).
Upgraded Conditions: For areas where itappears cost-effective to improve facilities,assume on a preliminary basis that upgradesresult in a beneficial intensity shift of oneunit (i.e., -1), relative to the above presentconditions.
Time-to-restoration: The time-to-restoration data assigned to SF 31b, boosterpumping and main sewer pumping stations,are assumed to apply to all pumping stationsin the sanitary sewer system. By combiningthese data with the damage curves derivedusing the data for FC 10, 66, and 68, thetime-to-restoration curves shown in FiguresB-93 through B-95 were derived.
B.7.3 Treatment Plants
1. General
Description: Treatment plants in thesanitary sewer system are complex facilitieswhich include a number of buildings(commonly reinforced concrete) andunderground or on-ground reinforcedconcrete tank structures or basins. Commoncomponents at a treatment plant includetrickling filters, clarifiers, chlorine tanks, re-
274 Appendix B: Lifelinc
circulation and wastewater pumpingstations, chlorine storage and handling,tanks, and pipelines. Concrete channels arefrequently used to convey the wastewaterfrom one location to another within thecomplex. Within the buildings aremechanical, electrical, and controlequipment, as well as piping and valves.Conventional wastewater treatment consistsof preliminary processes (pumping,screening, and grit removal), primary settlingto remove heavy solids and floatablematerials, and secondary biological aerationto metabolize and flocculate colloidal anddissolved organics. Waste sludge may bestored in a tank and concentrated in athickener. Raw sludge can be disposed of byanaerobic digestion and vacuum filtration,with centrifugation and wet combustion alsocurrently used. Additional preliminarytreatments (flotation, flocculation, andchemical treatment) may be required forindustrial wastes. Preliminary treatmentunits vary but generally include screens toprotect pumps and prevent solids fromfouling grit-removal units and flumes.Primary treatment typically comprisessedimentation, which removes up to half ofthe suspended solids. Secondary treatment
Vulnerability Functions ATC-25
RAHt8Wz
B= 50x
*0Ma0: )
-DIr0)
Figure B-93
I'/!
? Vulnerability Functions ATC-25

Pumping Station (Sanitary Sewer)Q1 L 4 00 Jfl s
Go 8.5366 0.20
mfl678
918
a-0. 163
-0 .216-8.24B-8.272-H.2RB
b
3. 131
0. 833
2.821O. 815
R = b * days +
I I I II- I I
68 98 128 158 18 218 248 Z78 388 330Elapsed Time in Days
365
Residual capacity for sanitary sewer pumping stations (NEHRP Map Area: California 3-6rNon-California 7, and Puget Sound 5.
Pumping Station (Sanitary Sewer),1 L 4 -R . i} - -i
G2 0.5866 8.28
Ml a
6 -0 .2Ih7 -2,2488 -0. 27Z
9 -8.200111 -. 381
b3E. 57
B .833H. 8218.8158.812
R = b * aays + a
DAYS: 30 68I I i I
98 128 158 188 210 240 278 308 338Elapsed Time in Days
365
Residual capacity for sanitary sewer pumping stations (All other areas).
ATC-25 Appendix B: Liteline Vulnerability Functions 275
0
co
U
r42e0
E= 0Z
R= O/x
DAYS: 30
Figure B-94
o -iC-
m
B= 8ot
Figure B-95
i l l l l | | E
i l l l l
I . 11 . i-- . - - I-a- R ,
1 -i I i1 i1 I i 1
ATC-25 . Appendix B: Lifeline Vulnerability Functions 275

removes remaining organic matter usingactivated-sludge processes, trickling filters,or biological towers. Chlorination ofeffluents is commonly required.
Typical Seismic Damage: Sanitary sewertreatment plants are commonly located inlow-lying areas on soft alluvium.Consequently, soil failure (e.g., liquefactionor settlement) is common. Many of theheavy structures are supported onfoundations that include piles. Differentialsettlements between these structures andstructures not supported on piles will resultin damage to pipes or conduit, especially atstructure penetrations. Liquefaction maycause some underground structures to floatin areas of high groundwater. Pumps andother equipment can be damaged by loadsimposed by piping when differentialsettlement occurs. Generic building damageranging from cracked walls and frames tocollapse may occur. Unanchored equipmentmay slide or topple, rupturing attachedpiping and conduit. Damage to substationtransformers can result in a loss of powersupply. Damage as the result of sloshing orwave action is likely in basins that containrotating equipment or other moving devices.Basin walls may crack or collapse. Poundingdamage or permanent movement may resultin the opening of expansion joints in basins.
Seismically Resistant Design: Seismicallyresistant design practice includes sitingtreatment plants in areas of stable soil, ordesigning foundations and systems toperform adequately in the event of expectedsoil failure. Each structure should besupported on one foundation type only ifadjacent structures have differentfoundation types; structures should beadequately separated; and piping and othersystems spanning between structures shouldbe provided with adequate flexibility toaccommodate relative motions. Pipingshould be provided with annular spacewhere it penetrates heavy structures toaccommodate settlement. Buildings shouldbe designed in accordance with the seismicrequirements of a local or national buildingcode. Walls for all basins should be designedfor a combination of soil and hydrodynamicpressures, taking into consideration thepossibility of soil failure. All backfills should
be compacted properly to avoid liquefaction.If buoyant loading is possible, foundationsshould be designed to resist such loading.All equipment should be properly anchored,and equipment on base isolators properlysnubbed. Arms, rakes, and other equipmentin basins should be designed forhydrodynamic forces associated withsloshing. Embankment stability andconsiderations for buried piping should betaken into account for sewage outfalls.Outfall diffusers are also subjected tohydrodynamic forces, which should beincluded in design consideration.
2. Direct Damage
Basis: Damage curves for treatment plantsin the sanitary system are based on ATC-13data for FC 10, medium-rise reinforcedmasonry shear wall buildings; FC 41,underground liquid storage tanks; and FC68, mechanical equipment (see Figure B-96). FC 10 was chosen to represent ageneric building, based on review of damagecurves for all buildings. Sanitary sewertreatment plants are assumed to acombination of 20% generic buildings, 30%underground storage tanks, and 50%mechanical equipment. Treatment plants inthe sewage system are assumed to be locatedin poor soil areas. Consequently, thedetrimental intensity shift indicated belowfor mechanical equipment is assumedappropriate.
Standard construction is assumed torepresent typical California treatment plantsunder present conditions (i.e., a compositeof older and more modern treatmentplants). It is assumed that minimal regionalvariation exists in construction quality ofunderground storage tanks and mechanicalequipment. Seismic loads have little impacton underground storage tank design, andoperational loads often govern over seismicrequirements in the design of mechanicalequipment.
Present Conditions: In the absence of dataon the type of construction, age, etc., thefollowing factors were used to modify themean curves for each of the three facilityclasses listed above, under presentconditions:
Appendix B: Lifeline Vulnerability Functions276 ATC-25
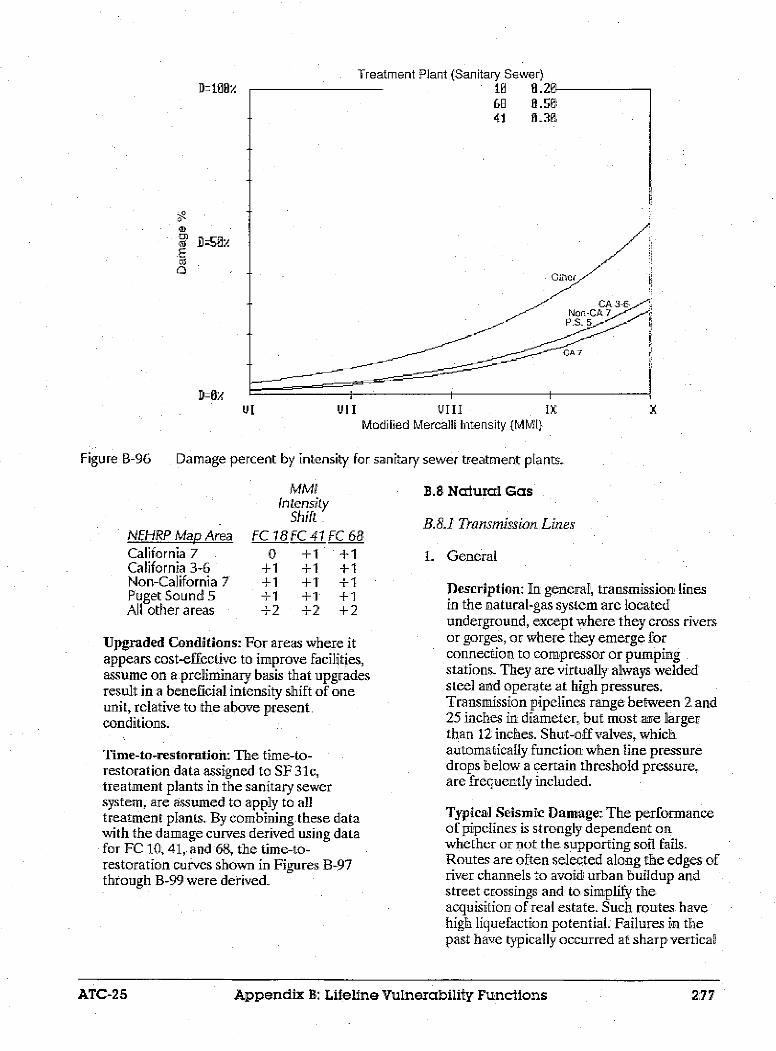
Treatment
60 8.5041 al30
liII 14ll IXModified Mercalli Intensity {MMI}
Damage percent by intensity for sanitary sewer treatment plants.
MMintensity
Shift
FC 18FC 41 FC 68o +1 +1
+1 +1 +1+1 +1 +1+1 +1 +1+2 +2 +2
Upgraded Conditions: For areas where itappears cost-effective to improve facilities,assume on a preliminary basis that upgradesresult in a beneficial intensity shift of oneunit, relative to the above present.conditions.
Time-to-restoration: The time-to-restoration data assigned to SF 3 ic,treatment plants in the sanitary sewersystem, are assumed to apply to alltreatment plants- By combining these datawith the damage curves derived using datafor FC 1 41, and 68, the time-to-restoration curves shown in Figures B-97through B-99 were derived.
B.8 Natural Gas
B.8.1 Transmission Lines
1. General
Description: In general, transmission linesin the natural-gas system are locatedunderground, except where they cross riversor gorges, or where they emerge forconnection to compressor or pumpingstations. They are virtually always weldedsteel and operate at high pressures.Transmission pipelines range between 2 and25 inches in diameter, but most are largerthan 12 inches. Shut-off valves, whichautomatically function when line pressuredrops below a certain threshold pressure,.are frequently included.
Typical Seismic Damage: The performanceof pipelines is strongly dependent onwhether or not the supporting soil fails,Routes are often selected along the edges ofriver channels to avoid urban buildup andstreet crossings and to simplify theacquisition of real estate. Such routes havehigh liquefaction potential. Failures in thepast have typically occurred at sharp vertical
Appendix B: Lifeline Vulnerability Functions
.0
Ea
D=CxHI
Figure B-96
X
NEHRP Map Area
California 7California 3-6Non-California 7Puget Sound 5All other areas
ATC-25 277

DAYS: 36 Go 90 120 ISO 18O 210 240 270 386 338 365
Elapsed Time in Days
Residual capacity for sanitary sewer treatment plants (NEHRP California 7).
DAYS: 36 60 90 120 ISO 186 216 240 276 300 338 365Elapsed Time in Days
Residual capacity for sanitary sewer treatment plants (NEHRP Map Area 3-6, Non-California 7, and Puget Sound 5).
278 ~~Appendix B: Lifeline Vulnerability Functions AC2
RzI6W.v
H: 0,%
H=8%
.0CII0-o'aa)cc
Figure B-97
0
a)a:,
R2: a
Figure B-98
ATC-25278

R= sox
R oxDAYS: 3 - - 98 128 150 1BO ;218 24* 278 388 338 365
Elapsed Time in Days
Residual capacity for sanitary sewer treatment plants (All other areas).
or lateral dislocations or ruptures of theground. Pipes may buckle undercompressive forces, especially where theycross ruptured faults. Damage has alsooccurred as a result of axial elongationscaused by relative movement of twohorizontally adjacent soil layers. Damagemay occur because of displacements ofunanchored compressors or pumps or otherabove ground structures. Several pastfailures have been attributed to corrosioncombined with surges in line pressure duringthe earthquake. Failures of above groundlines have been caused by support failure,failure of pipeline attachment to supportstructure, and relatively large supportmovement. Rupture of pipes and loss ofcontents could lead to fire and explosions.
Seismically Resistant Design: Modern high-pressure gas lines provided with proper fullpenetration welds and heavy walls are veryductile and have considerable resistance toearthquake damage. Welded steel pipelineperformance depends on the integrity of thewelds--modern butt-welded pipelinesperform well, whereas gas lines constructedbefore and during the early 19310s usingoxyacetylene and electric-arc welds do not.
Special precautions should be taken toreduce earthquake effects at bay, river, andfault crossings. Transmission lines at faultcrossings should be buried in shallow loosefill or installed above ground near the faultto allow lateral and longitudinal slippage.Anchors such as thrust blocks or bendsshould be excluded within a distance of 300feet of a fault zone, and strengthened pipeshould be used within the zone. Valvespacing near fault zones or in areas ofexpected soil failure should be reduced.Automatic shut-off valves should not rely onelectricity to operate. Proper maintenanceto limit corrosion, which weakens pipes, isimportant to mitigate damage.
1. Direct Damage
Basis: Damage curves for transmission linesin the natural-gas system are based on ATC-13 data for FC 31, underground pipelines(see Figure B-1lO). Transmission pipelinesare typically large-diameter, welded steelpipes that are expected to perform inearthquakes in a manner superior to that oftypical underground pipelines, as indicatedby the beneficial intensity shift below.
Appendix B: Lifeline Vulnerability Functions
2-,
Q
OLC
Figure B-99
279:ATC-25

Transmission Lines (Natural Gas)31 1.00-
VII vIII IxModified Mercalli Intensity (MMI)
Lire B-100 Damage percent by intensity for natural gas transmission lines.
Standard construction is assumed to intensity shifts forrepresent typical California natural-gas recommended.transmission lines under present conditions(i.e., a composite of older and more modern Time-to-restoratitransmission lines). Only minimal regional restoration data avariation in the construction quality is transmission linesassumed. all transmission lit
Present Conditions: In the absence of dataon the type of material, diameter, age, etc.,the following factors were used to modify.the mean curves, under present conditions:
system. By combildamage curves fo:restoration curvesand B-102 were d
B.8.2 Compressor Stat
* retrofitting are
on: The time-to-ssigned to SF 32a,, are assumed to apply tories in the natural-gasiing these data with ther FC 31, the time-to-s shown in Figures B-101erived.
nions
NEHRP Map Area
California 7California 3-6Non-California 7Puget Sound 5All other areas
MMIIntensity
Shift-1-1-1-10
Upgraded Conditions: It is not cost-effective or practical to upgrade existingnatural-gas transmission lines, exceptperhaps at fault crossings or in areas ofextremely unstable soils. Therefore, no
1. General
Description: In general, compressor stationsinclude a variety of electrical andmechanical equipment, as well as structuresand buildings. A typical plant yard maycontain electrical equipment, heatexchangers, horizontal gas-storage tanks onplinths, compressors, fans, air-operatedvalves, pumps, cooling towers, steel stacksand columns, and piping. The controlequipment is usually located in a controlbuilding. Cryogenic systems may also exist
Appendix B: Lifeline Vulnerability Functions
byk=20
a),E0< bpk=1ia
bpk
VI
Figi
OtherCA 7
-M
Non-CA 7P.S. 5 X
i.'M 0-v-
ATC-25280

Transmission Lines (Natural- 32a l.1E 31
7B
91
680 90 120' 150 8 218Elapsed Time in Days
240 20 30 330 365
Figure B-1 01 Residual capacity for natural gas transmission lines (NEHRP Map Area: California 3-6,California 7 Non-California 7, and Puget Sound 5).
R := E36e
.rU
(a° B= soz
-o<D -G
R= DAYS: 30
Figure B-1 02
Transmission Lines (Natural Gas)12 o4 -g
MH I
6 h-
? -88 -E9 -E
10 -0
R t
80 90 120 15 180 216 240 278 300 330 385Elapsed Time in Days
Residual capacity for natural gas transmission lines (All other areas).
Appendix B: Lifeline Vulnerability Functions
X
5a
n-tan..F.- Lhut.
.L
0
0 H I2
' i :: W
A
30
l l l l l l l, , , , r rMys'.
R -
j
. . . . .
ATC-25 28.1
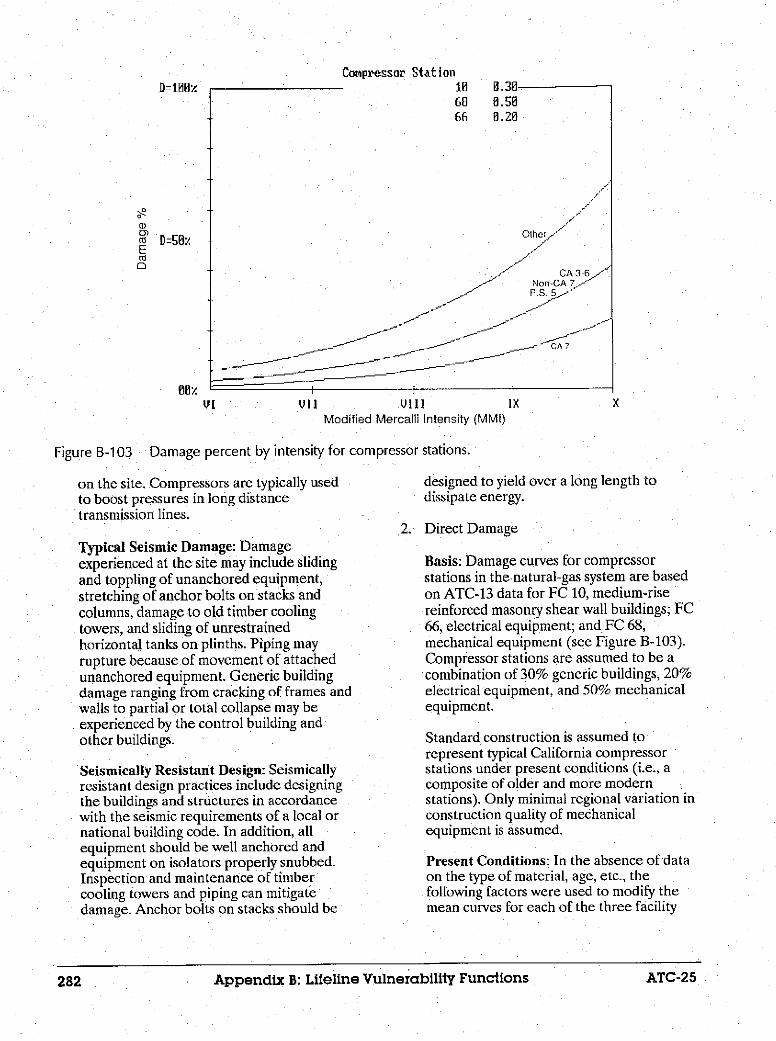
Compressor Station0.30a.500.20
Other,
VI V11 Vill IX
Modified Mercalli Intensity (MMI)
Figure B-1 03 Damage percent by intensity for compressor stations.
on the site. Compressors are typically usedto boost pressures in long distancetransmission lines.
Typical Seismic Damage: Damageexperienced at the site may include slidingand toppling of unanchored equipment,stretching of anchor bolts on stacks andcolumns, damage to old timber coolingtowers, and sliding of unrestrainedhorizontal tanks on plinths. Piping mayrupture because of movement of attachedunanchored equipment. Generic buildingdamage ranging from cracking of frames andwalls to partial or total collapse may beexperienced by the control building andother buildings.
Seismically Resistant Design: Seismicallyresistant design practices include designingthe buildings and structures in accordancewith the seismic requirements of a local ornational building code. In addition, allequipment should be well anchored andequipment on isolators properly snubbed.Inspection and maintenance of timbercooling towers and piping can mitigatedamage. Anchor bolts on stacks should be
designed to yield over a long length todissipate energy.
2. Direct Damage
Basis: Damage curves for compressorstations in the natural-gas system are basedon ATC-13 data for FC 10, medium-risereinforced masonry shear wall buildings; FC66, electrical equipment; and FC 68,mechanical equipment (see Figure B-103).Compressor stations are assumed to be acombination of 30% generic buildings, 20%electrical equipment, and 50% mechanicalequipment.
Standard construction is assumed torepresent typical California compressorstations under present conditions (i.e., acomposite of older and more modernstations). Only minimal regional variation inconstruction quality of mechanicalequipment is assumed.
Present Conditions: In the absence of dataon the type of material, age, etc., thefollowing factors were used to modify themean curves for each of the three facility
Appendix B: Lifeline Vulnerability Functions
80
a)U)(0 D=YE(0Q
X
ATC-25282

>>
R=iE8x
10a
cc
R= ax7
~a
-0'Lr
Bc 8
Canpress.ar Station
b,
1.2610. 488B . B3
0.I8038.092:
3
DAYS: 3 68 90 120' 158 188 218 248 278Elapsed Time in Days
Figure B-104 Residual capacity for compressor stations (NEHRP California 7).
classes listed above, under present conditions:
MMIIntensity
ShiftNEHRP Mar AreaCalifornia 7California 3-6Non-California7Puget Sound 5All other areas
FC 0 FC 66 FC 68o 0 0
+1 +1 0+1 +1 0+1 +1 0+2 +1 +1
Upgraded Conditions: For areas where itappears cost-effective to improve facilities,assume on a preliminary basis that upgradesresult in a beneficial intensity shift of oneunit (i.e., -1), relative to the above presentconditions.
Time-to-restoration: Te time-to-restoration data assigned to SF 32c,compressor stations, high-pressure holders,and mixer/switching terminals, are assumedto apply to all compressor stations in thenatural-gas system. By combining these datawith the damage curves derived using thedata for C 10, 66, and 68, the time-to-
300 330 365
restoration curves shown in Figures B-104through B-106 were derived.
B.&3 Distribution Mains
1. General
Description: n general, the distributionmains in the natural-gas system are locatedunderground, except where they cross riversor gorges or where they emerge forconnection to compressor or pumpingstations. They typically are between 2 and 20inches in diameter and may be composed ofsteel, cast iron, ductile iron, or plastic.Approximately 80% of all new distributionpiping is made of plastic. Shut-off valves,which automatically function when linepressure drops below a certain thresholdpressure, are frequently used
Typical Seismic Damage: The performanceof pipelines is, strongly dependent onwhether not the supporting soil fails.Routes are often selected along the edges ofriver channels to avoid urban buildup andstreet crossings and to simplify the
ATC-25 Appendix B: Lifeline Vulnerability Functions 283ATC-25 Appendix B: Lifeline Vulnerability Functions 283

Coipressor StationR=100
.
CU
a)
a:
R= RJ If II AYS: Figure B-1 05
6066
M1l6789
0.380.500.20
a-2.604-2.091-i.854-1.693-1.578
b0 .7090.2390 .1230.0730 .849
R = b * days + a
L l ~ ~ I I
38 68 90 120 150 180 210Elapsed Time in Days
1 I I
2 I 3 3240 Z70 300 330
Residual capacity for compressor stations (NEHRP Map Area: CaliforniaCalifornia 7, and Puget Sound 5).
Conpressor StationR=I100
>1
C.)Cu.
0 R-
0-U)a)
CC
Figure B-1 06
1�R- R
32c 1.00 10 0.3'Rl -- l_ I R R rIR
: 3. 68 96 1. 18 18 26 2. 2
DAYS: 30: 560 90 120 150 180 210 240 Z70 300 330 365Elapsed Time in Days
Residual capacity-for compressor stations (All other areas).
284 Appendix B: Lifeline Vulnerability Functions ATC-25
365
3-6, Non-
66 0.20
M"Il a b6 -2.173 0.2897 -1.908 0.1458 -1.724 0.8819 -1.592 0.052
10 -1.5i4 0 .039
R = b * days + a
I I !I I ) f I I I
: -
Appendix B, Lifeline Vulnerability Functions ATC-25284

Distribution laini1 1.0tl
R-S. SOther
CA 7CA 3-6
__ ~Non-C 7
VI V U111 XModified Mercalli Intensity {MMI)
Figure B-1 07 Damage percent by intensity for natural gas distribution mains.
acquisition of real estate. Such routes havehigh liquefaction potential Pipe damage ismost common in soft alluvial soils, atinterfaces between soft and firm soils, atlocations of fault ruptures, or at sharpvertical or lateral dislocations or ruptures ofthe ground. Pipes may buckle undercompressive forces, especially where theycross ruptured faults. Damage may occur asa result of displacements of unanchoredcompressors or pumps or other aboveground structures. Several past failures havebeen attributed to corrosion combined withsurges in line pressure during theearthquake. Rupture of pipes and loss ofcontents could lead to fire, explosions, orboth.
Seismically Resistant Design: Seismicallyresistant design provisions for distributionpiping are typically minimal. Consequently,large urban distribution systems should havesuitable valving installed so that large areascan be broken down into zones. Specialprecautions should be taken to reduceearthquake effects at bay, river, and faultcrossings. Distribution mains at faultcrossings should be buried in shallow loosefill or installed above ground near the fault
to allow lateral and longitudinal slippage.Anchors such as thrust blocks or bendsshould be excluded within a distance of 300feet of a fault zone and strengthened pipeshould be used within the zone. Valvespacing near fault zones or in areas ofexpected soil failure should be reduced.Automatic shut-off valves, which operatewhen pressure reduces, should not rely onelectricity to operate. Proper maintenanceto limit corrosion, which weakens pipes, isimportant for mitigating damage.
2. Direct Damage
Basis: Damage curves for distribution mainsin the natural-gas system are based on ATC-13 data for FC 31, underground pipelines(see Figure B-107). Standard construction isassumed to represent typical Californiadistribution mains under present conditions(i.e., a composite of older and more modernmains). Minimal regional variation inconstruction quality is assumed.
Present Conditions: In- the absence of dataon the type of material, diameter, age, etc.,the following factors were used to modifythe mean curves, under present conditions:
Appendix B: Lifeline Vulnerability Functions
bpk=2
toa)E_
a
02totom>
bpk=l2
bp=0X
o< -a
ATC-25 285

Distribution Hains- 3 1.00 31 1.00-
111 a
6 -0.038-7 -0.038
8 -0.0389 -0.030
10 -0.036
b
0.3730.3730.2800.2280.095
B = b * days + a
I I I II I I I I HI I I0 I
90 120 150 1883 210 240 270 308 330Elapsed Time in Days
365
Figure B-1 08 Residual capacity for natural gas distribution mains (NEHRP Map Area: California 3-6,California 7, and Non-California 7).
NEHRP Map Area
California 7California 3-6Non-California 7Puget Sound 5'All other areas
MM/Intensity
Shift000
+1+1
Upgraded Conditions: It is not cost-effective or practical to upgrade existingnatural-gas distribution mains, exceptperhaps at fault crossings or in areas ofextremely unstable soils. Therefore, nointensity shifts for retrofitting arerecommended.
Time-to-restoration: The time-to-restoration data assigned to SF 32d,distribution feeder mains, are assumed toapply to all distribution mains in the natural-gas system. By combining these data with thedamage curves for FC 31, the time-to-restoration curves shown in Figures B-108and B-109 were derived.
B.9 Petroleum Fuels
B. 9.1 Oil Fields
1. General
Description: In general, oil fields in thepetroleum fuels system may includespressure vessels, demineralizers, filters,vertical tanks, horizontal water and oilpumps, large heat exchangers, aircompressors, extensive piping, and air-operated valves. Additionally they mayinclude their own water treatment plant,which demineralizes and filters water beforeit is injected as steam into oil wells in thearea. Control houses with controlequipment may monitor production andflow in and out of the field.
Typical Seismic Damage: Building damagemay range from cracks in walls and frames topartial and total collapse. Unanchored orimproperly anchored equipment may slide*or topple, experiencing damage or causingattached piping and conduit to fail. Well
Appendix B: Lifeline Vulnerability Functions
*0
(a
I
n-cU,
n- el-n- V -
DAYS 30 68
I-
,:
ATC-25286

Distribution hins32d 1,88 31
MHI6
IS9
lo
L.
a-e.038-0.83-8.038-E. 83G-0.33
b8.373
0.2080 228E. 850.858
R =b *days + a
1 I I I I I
60 90 120 158 IB18 210
Efapsed lime fin Days
i I a 11
248 270 3 338 365
Figure B-1 09 Residual capacity for natural gas distribution mains (Puget Sound 5 and all other areas)'.
casings will move with the surrounding soilsand may result in damage to the oil pumps.Reduction or increase in production mayoccur after an earthquake as a result ofgeological changes in the oil field.
Seismically Resistant Design: Buildingsshould be designed in accordance with theseismic provisions of a local or nationalbuilding code. All equipment should be wellanchored.
2. Direct Damage
Basis: Damage curves for oil fields in thepetroleum fuels system (see Figure B-110)are based on ATC-13 data for FC 68,mechanical equipment. It is believed thatthis facility class best approximates theexpected performance of oil fields.
Standard construction is assumed torepresent typical California oil fields underpresent conditions (i.e., a composite of olderand more modern fields). Only minimalregional variation in the construction quality
is assumed, as shown in the intensity shiftfactors below.
Present Conditions: In the absence of dataon the type of equipment, age, etc., thefollowing factors were used to modify themean curve, under present conditions:
NEHRP Map2 AreaCalifornia 7California 3-6Non-California 7Puget Sound 5All other areas
Mm/IntensityShift
0010
+1
Upgraded Conditions: For areas where itappears cost-effective to improve facilities,assume on a preliminar basis that upgradesresult in a beneficial intensity shift of oneunit (i.e., -1), relative to the above presentconditions.
Time-to-restoration: The time-to-restoration data assigned to SF 1Sa isassumed to apply to all oil fields. Bycombining these data with the damage
ATC-25 AppendIx 3: Lifeline Vulnerability Functions 287
.r_5Ca
Cn*0
:0WI
x= n.e -
38
a
- .1.
DAYS:
ATC-25 Appendix B: Lifeline Vulnerability Functions 287
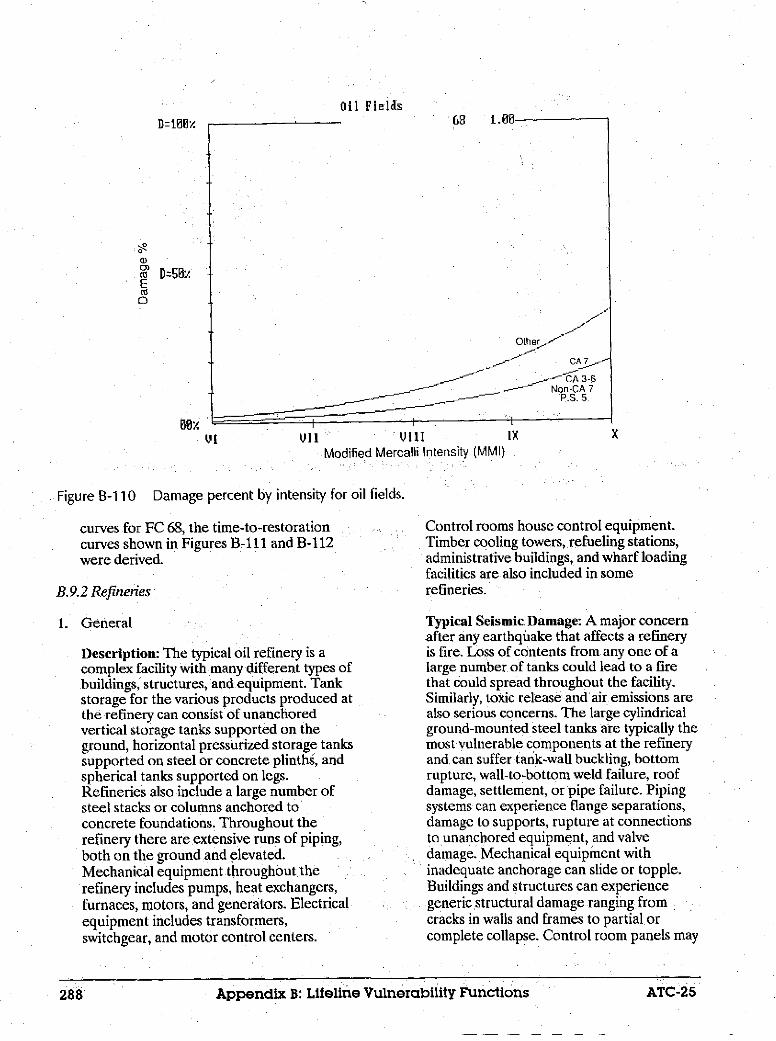
Oil Fields
Other
I VII Vill IX
Modified Mercalli Intensity (MMI)
.~~~~~~~~~~~~~~~~~~~~~~~~~~~~~~~~~ ,
_ . L . . Ir_ Al r 1. I'-
Damage percent by intensity Tor oil tields.
curves for FC 68, the time-to-restorationcurves shown in Figures B-ill and B-112were derived.
B.9.2 Refineries
1. General
Description: The typical oil refinery is acomplex facility with many different types ofbuildings, structures, and equipment. Tankstorage for the various products produced atthe refinery can consist of unanchoredvertical storage tanks supported on theground, horizontal pressurized storage tankssupported on steel or concrete plinths, andspherical tanks supported on legs.Refineries also include a large number ofsteel stacks or columns anchored toconcrete foundations. Throughout therefinery there are extensive runs of piping,both on the ground and elevated.Mechanical equipment throughout therefinery includes pumps, heat exchangers,furnaces, motors, and generators. Electricalequipment includes transformers,switchgear, and motor control centers.
Control rooms house control equipment.Timber cooling towers, refueling stations,administrative buildings, and wharf loadingfacilities are also included in somerefineries.
Typical Seismic Damage: A major concernafter any earthquake that affects a refineryis fire. Loss of contents from any one of alarge number of tanks could lead to a firethat could spread throughout the facility.Similarly, toxic release and air emissions arealso serious concerns. The large cylindricalground-mounted steel tanks are typically themost vulnerable components at the refineryand can suffer tank-wall buckling, bottomrupture, wall-to-bottom weld failure, roofdamage, settlement, or pipe failure. Pipingsystems can experience flange separations,damage to supports, rupture at connectionsto unanchored equipment, and valvedamage. Mechanical equipment withinadequate anchorage can slide or topple.Buildings and structures can experiencegeneric structural damage rangingfromcracks in walls and frames to partial orcomplete collapse. Control room panels may
Appendix B: Lifeline Vulnerability Functions
a)0)
Eo0
08
vi
Figure B-i 10
X
28.8
: _
. . .
ATC-25

Oil Fieldsf_ 4 a. no -
60 90 126 156 180 210
Elapsed Time in Days2401 2Z2 380 338 35
Figure B-1 11 Residual capacity for oil fields NEHRP Map Area: California 3-6, California 7, Non-California 7, and Puget Sound 5).
n-t1,.
35
) R= 8z
2~
R= 6A.
Oil FieldsI l.Jod 68
MM
67
9to
1.08
a0, 344
8 .2860.22313. 153
8.103
1. H28
H.0178.812H.-HI0.8180.8?
R b * ays a
DAYS: 38I a I
S 98 126 150 6 10 216
Elapsed Time in DaysI48 278 308 30 35
Figure B-1 12 Residual capacity for oil fields (All other areas).
Appendix B: Lifeline Vulnerability Functions
-5_
o R= S81xCUn,a._.co
R=
rb
.21
21
211
a
DlhYS: 30
CC
a
l l l li i
4 .Rv
r
- 4Za.,
ATC-.25 2859

D=100;Y
c)0)Co DZSO7Eco0
Ref inery68 0.30-43 0.4852 8.30
VI ViI Vill IxModified Mercalli Intensity (MMI)
Figure B-1 13 Damage percent by intensity for oil refineries.
slide or topple, or experience relayproblems. Stacks or columns may stretchanchor bolts. Horizontal tanks may slide on.their plinths and rupture attached piping.Brick linings in boilers may break.
Seismically Resistant Design: Seismicallyresistant design practices include design ofall buildings and structures (including tanks)for seismic requirements in a local ornational code. Storage tanks should beprovided with flexible piping, pressure reliefvalves, and well-compacted foundationsresistant to differential settlement.Retention dikes with sufficient capacity toretain all of the oil contained in the enclosedtanks are necessary to mitigate the danger ofcatastrophic fire after an earthquake.Embankments for such dikes should bestable when subjected to ground shaking.Horizontal tanks on plinths should berestrained to prevent attached pipes fromrupturing. Long anchor bolts that areproperly embedded in foundations shouldbe used for heavy equipment and stacks.Mechanical and electrical equipment shouldbe anchored to prevent sliding and toppling.Maintenance and inspection programs forcooling towers and piping should be
implemented. Supports for piping should bedesigned for seismic loads. An emergencypower system should be provided for controland emergency equipment as a minimum.
2. Direct Damage
Basis: Damage curves for refineries in thepetroleum fuels system are based on ATC-13 data for FC 43, on-ground liquid storagetanks; FC 52, steel chimneys; and FC 68,mechanical equipment (see Figure B-1 13).Refineries are assumed to be a combinationof 40% on-ground storage tanks, 30%chimneys, and 30% mechanical equipment.
Standard construction is assumed torepresent typical California refineries underpresent conditions (i.e., a composite of olderand more modern refineries). Only minimalregional variation in the construction qualityof mechanical equipment is assumed, asoperational loads frequently govern overseismic requirements.
Present Conditions: In the absence of dataon the type of construction, age, etc., thefollowing factors were used to modify themean curves for each of the three facility
290 Appendix B: Lifeline Vulnerability Functions ATC-25
Other
X
290 Appendix B: Lifeline Vulnerability Functions ATC-25
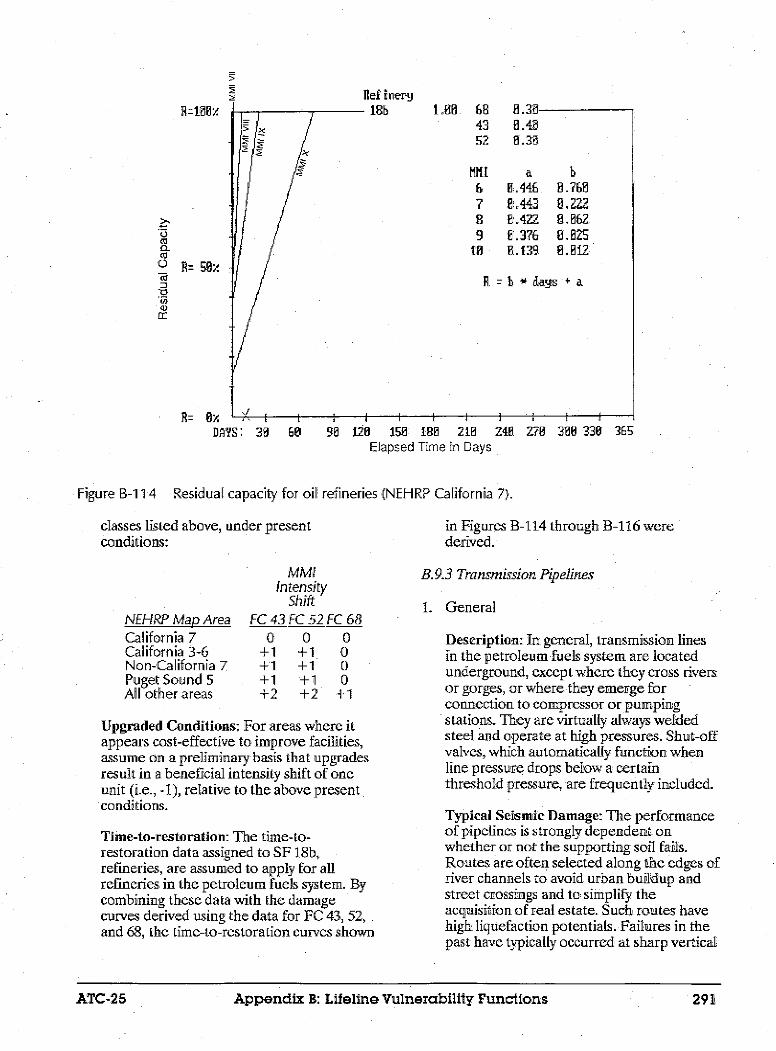
R=1Bx
.5
onL
CUO R= gov
cc
D- fI.,A- tA
43 0.4852 0.38
II a b
6 EA46 0.7&07 X,443 0.222B 1.422 8.062
9 101.37B 89. 2
10 0.139 '0.012
R = * days + a
DAYS: 68 90 120 150 1DB 210 241 278 308 330 365
Elapsed Time in Days
Figure B-114 Residual capacity for oil refineries (NEHRP California 7).
classes listed above, under presentconditions:
NEFHRP Map Area
California 7California 3-6Non-California 7Puget Sound 5All other areas
in Figures B-114 through B- 16 werederived
MMIIntensity
ShiftFC 43 FC 52 FC 68
0+1+1+1+2
0+1+1+1+2
0000
+1
Upgraded Conditions: For areas where itappears cost-effective to improve facilities,assume on a preliminary basis that upgradesresult in a beneficial intensity shift of oneunit (i.e., -), relative to the above presentconditions.
Time-to-restoration: The time-to-restoration data assigned to SF lb,refineries, are assumed to apply for allrefineries in the petroleum fuels system. Bycombining these data with the damagecurves derived using the data for FC 43, 52,and 68, the time-to-restoration curves shown
B.9.3 Transmission Pipelines
1. General
Description: In general, transmission linesin the petroleum fuels system are locatedunderground, except where they cross riversor gorges, or where they emerge forconnection to compressor or pumpingstations. They are virtually always weldedsteel and operate at high pressures. Shut-offvalves, which automatically function whenline pressure drops below a certainthreshold pressure, are frequently included.
Typical Seismic Damage: The performanceof pipelines is strongly dependent onwhether or not the supporting soil fails.Routes are often selected along the edges ofriver channels to avoid urban buildup andstreet crossings and to simplify theacquisition of real estate. Such routes havehigh liquefaction potentials. Failures in thepast have typically occurred at sharp vertical
I~ I i I I
Appendix B: Lifeline Vulnerability Functions
H --laAR
ATC-25 291

nery
I I I I I 30 60 90 120 150 180 210
Elapsed Time in Days240 270 300 330 365
Figure B-1 15 Residual capacity for oil refineries (NEHRP Map Area: California 3-6, Non-California 7,and Puget Sound 5).
Ref inery401. 4 00c tO LO .TU D
/ g~~~~2
Mi
67
, 89.
10
-/ ~~~~R =-
11a
8.400.30
a b0.435 0.160.401 0.83!0.234 0.01:-0.221 0.88-0.285 0.00!
b *days a
I
3
I I I I I
AYS: 30 68 90 120 150 180 210 240 270 308 330 365Elapsed Time in Days
Figure B-116 Residual capacity for oil refineries (All other areas).
Appendix B: Lifeline Vulnerability Functions
1.00 68 0.3043 8.4052 0.30
M'lI a b6 0.446 0.4687 0.435 0.101B 0.401 0.8359 0.234 0.Oi3
10 -0.221 0.009
R b * days a
I * 1Ii3
o R Sx
-o3
4)
R= eV. IDAYS:
R=100x
.
aco
o R= SOZ
In4)Er
D
R= In-v LI I I I I
-ATC-25292

Transmission Pipelines (Petroleum Fuels)
J I
VII VIIModified Mercalli Intensity (MMI)
Figure 8-117 Damage percent by intensity for petroleum fue[s transmission pipelines.
or lateral dislocations or ruptures of theground. Pipes, may buckle undercompressive forces, especially where theycross ruptured faults. Damage has alsooccurred because of axial elongationscaused by relative movement of twohorizontally adjacent soil layers. Damagemay occur as the result of displacements ofunanchored compressors or pumps or otherabove ground structures. Several pastfailures have been attributed to corrosioncombined with surges in line pressure duringthe earthquake. Failures of above groundlines have resulted from support failure,failure of pipeline attachment to supportstructure, and relatively large supportmovement. Rupture of pipes and loss ofcontents could lead to ignition, fire, and/orexplosions.
Seismically Resistant Design: Modern high-pressure petroleum fuel lines provided withproper full penetration welds, heavy walls,and strong couplings are very ductile andhave considerable resistance to earthquakedamage. Welded steel pipeline performancedepends on the integrity of the welds--modern butt-welded pipelines perform well,whereas lines constructed before and during
the early 1930s may not. Special precautionsshould be taken to reduce earthquakeeffects at bay, river, and fault crossings.Transmission lines at fault crossings shouldbe buried in shallow loose fill or installedabove wound near the fault to allow lateraland longitudinal slippage. Anchors, such asthrust blocks or bends should be excludedwithin a distance of 300 feet of a fault zone,and strengthened pipe should be used withinthe zone. Valve spacing near fault zones orin areas of expected soil failure should bereduced. Automatic shut-off valves shouldnot rely on electricity to operate. Propermaintenance to limit corrosion whichweakens pipes, is important for mitigatingdamage.
2. Direct Damage
Basis: Damage curves, for transmission linesin the petroleum fuels, system are based onATC-13 data for FC 31, undergroundpipelines (see Figure -117). Transmissionpipelines are typically large-diameter weldedsteel pipes that are expected to perform inearthquakes in a manner superior to typicalunderground pipelines, as indicated by thebeneficial intensity shift below.
Appendix B: Lifelind Vulnerability Functions
bpk=2
C)a)E01
0a.0-rC)M
tirJ-U _VI Ix X
-1S I H Z -
km >-H
AT, C-25 23

Transmission Pipelines (Petroleum Fuels)40_ 4 WI 11 4 Rn_ -
XE.
Mui
7 8.1448 0.1449 e.116
10 e.124
a b
e .1950 195
8. 106e.116
R = b * days + a
I I I I I30
I I I I I I
6 98 128 150 1 210,
Elapsed Time in Days
240 270 30 330 365
Figure B-118 Residual capacity for petroleum fuels transmission pipelines (NEHRP Map Area: California3-6, California 7, Non-California 7, Puget Sound 5, and all other areas).
Standard construction is assumed torepresent typical California petroleum fuelstransmission lines under present conditions(i.e., a composite of older and more moderntransmission lines). Only minimal regionalvariation in the construction quality isassumed.
Present Conditions: In the absence of dataon the type of material, diameter, age, etc.,the following factors were used to modifythe mean curves, under present conditions:
NEHRP Map AreaCalifornia 7California 3-6Non-California 7Puget Sound 5All other areas
MM/Intensity
Shift-1-1-1-1-1
Upgraded Conditions: It is not cost-effective or practical to upgrade existingpetroleum fuels transmission pipelines,except perhaps at fault crossings or in areasof extremely unstable soils. Therefore, no
intensity shifts for retrofitting arerecommended.
Time-to-restoration: The time-to-restoration data assigned to SF 18c,transmission pipelines, are assumed to applyto all transmission pipelines in thepetroleum fuels system. By combining thesedata with the damage curves for FC 31, thetime-to-restoration curves shwon in FigureB-i 18 were derived.
B.9.4 Distribution Storage Tanks
1. General
Description: Most oil storage tanks areunanchored, cylindrical tanks supporteddirectly on the ground. Older tanks haveboth fixed and floating roofs, while moremodern tanks are almost exclusivelyfloating-roofed. Diameters range fromapproximately 40 feet to more than 250 feet.Tank height is nearly always less than thediameter. Construction materials includewelded, bolted, or riveted steel. Tank
Appendix B: Lifeline Vulnerability Functions
E~ 2
I
R- SOY
.
a)W
D- R%.DAYS:
DAYS:
svQ x .uU vs 1.UU
I I I
294 ATC-25

foundations may consist of sand or gravel, ora concrete ring wall supporting the shell.
Typical Seismic Damage: On-ground oilstorage tanks are subject to a variety ofdamage mechanisms, including: (1) failure ofweld between base plate and wall, (2)buckling of tank wall (elephant foot), (3)rupture of attached rigid piping because ofsliding or rocking of tank, (4) implosion oftank resulting from rapid loss of contentsand negative internal pressure, (5)differential settlement, (6) anchorage failureor tearing of tank wall, (7) failure of roof-to-shell connection or damage to roof seals forfloating roofs (and loss of oil), (8) failure ofshell at bolts or rivets because of tensilehoop stresses, and (9) total collapse.Torsional rotations of floating roofs maydamage attachments such as guides, ladders,etc.
Seismically Resistant Design: Seismicallyresistant design practices for ground oildistribution storage tanks include the use offledbIe piping, pressure relief valves, andwell-compacted foundations and concretering walls that prevent differentialsettlement. Adequate freeboard to preventsloshing against the roof should bemaintained. Positive attachment betweenthe roof and shell should be provided for fix-roofedtanks. The bottom plate and itsconnection to the shell should be stiffenedto resist uplift forces, and the base plateshould be protected against corrosion.Abrupt changes in thickness betweenadjacent courses should be avoided.Properly detailed ductile anchor bolts maybe feasible on smaller steel tanks.Maintaining a height-to-diameter ratio ofbetween 0.3 and 0.7 for tanks supported onthe ground controls seismic loading.Retention dikes are needed to retain spilledoil and prevent it from reaching ignitionsources. These dikes should have sufficientcapacity to retain all oil that could spillwithin their confines. Also, all retention dikeembankments should be stable in groundshaking.
2. Direct Damage
Basis: Damage curves for distributionstorage tanks in the petroleum fuels system
are based on ATO-13 data for FC 43, on-ground liquid storage tanks (see Figure B-119). Standard construction is assumed torepresent typical California distributionstorage tanks under present conditions (ie.,a composite of older, non-seismicallydesigned tanks as well as more modern tanksdesigned to seismic requirements (e.g., API650).
Present Conditions: In the absence of dataon the type of material, age, etc., thefollowing factors. were used to modify themean curves, under present conditions:
NEHRP Map AreaCalifornia 7California 3-6Non-California 7Puget Sound 5All other areas
MMIIntensity
Shift0
+1+1+1+2
Upgraded Conditions: For areas where itappears cost-effective to improve facilities,assume on a preliminary basis that upgradesresult in one or two beneficial intensityshifts (i.e., -1 or -2), relative to the abovepresent conditions.
Time-to-restoration: The time-to-restoration data assigned to SF 18d,distribution storage tanks, are assumed toapply to all tanks. By combining these datawith the damage curves for FC 43, the time-to-restoration curves shown in Figures B-120 through B-121 were derived.
B.10 Emergency Service
B.10.1 Health Care
1. General
Description: Health care facilities(hospitals) are typically housed in one ormore buildings. Construction type variessignificantly. Smaller hospitals may containonly limited equipment associated withbuilding services. Large hospitals maycontain water treatment equipment,emergency power diesels, chillers, andboilers, as well as sophisticated equipmentused for treating patients.
Appendix B: Lifeline Vulnerability FunctionsATC-25, 25

Distribution Storage
Vi1 Vill IXModified Mercalli Intensity (MMI)
Figure B-1 19 Damage percent by intensity for petroleum fuelds distribution storage tanks.
,, :
R=111,/
..
Fi
Figure B-i 20
;a.2
n1)
D- £A .
Distribution Storage anks
l- A. I I I I I I I I I
DAYS: 30 60 90 120 150 1 210 248 Z70 300 330 365
Elapsed Time in Days
Residual capacity for petroleum fuelds distribution storage tanks (NEHRP California 7).
296 Appendix B: Lifeline Vulnerability Functions
Tanks1.00: D=11.'
a)
Eo D=50z
0 IVI X
8d 1.00 43 1.0f1
hII a b
6 0.408 0.110
7 0.403 0.8918 0.3U30 H.041
9 8.352 0.02010 0.258 0.009
R b * days + a
Other
CA 36Non CA 7
lid
I I
41,
296- ATC-25

ribution Storage Tanks4a lt Af 1 O1
68 so 128 158 188 218;
Elapsed Time in DaysZ48 278 388 33 35
Figure B-1 21 Residual capacity for petroleum fueldsc distribution storage tanks (NEHRP Map Area:California 3-6, Non-California 7, and Puget Sound 5).
Distribution Storage anks1.88 43 1.0
ml6
7
91
a8.388
O .2588.14280.860
b
8.841
0.828. 809
8. BO
.00,
R b * days + a
I I II I I
9B 128 158 188 218
Elapsed Time in Days24 278 3881 330 35
Figure B-1 22 ResiduaE capacity for petroleum fuelds distribution storage tanks (AlI other areas).
Appendix B: Lifeline Vulnerability Functions
>
R=tlx
.6,C1Ca
-0
LnaCC
R= E0x
"ml a b6 0.403 0.0917 0113 :80 0.841
8 352 0.8289 0.258 8.889
10 8.142 0.006
R = * days a
I I I IRz 07 IDAYS: 3D
5=1808
'Uaa
0 R= 96c
£/2. ) -CE
R rvD.- urDAYS: 38 G
I i I I
I I ,,
297ATC-25
_

D= A08V
80
0)oCU D=SO;.ECa0
UI
Health Care
Vil ViII IxModified Mercalli Intensity (MMI)
Figure B-1 23 Damage percent by intensity for health care facilities.
Typical Seismic Damage: Buildings mayexperience generic building damage rangingfrom cracks in walls and frames to partialand total collapse. Unanchored orimproperly anchored equipment may slideor topple. Equipment supported on isolationmounts with no snubbers may fall off themounts and rupture attached piping andconduits. Unrestrained batteries on racksmay fall, rendering the emergency powersystems inoperable. Suspended ceilings mayfall and impede operations. Equipmentnecessary for treating patients may bedamaged, especially if it is supported oncarts or on wheels, or is top-heavy.Equipment that requires precise alignmentis also susceptible to damage. In garages,structural damage may result in ambulancesbeing unavailable when they are needed.
Seismically Resistant Design: As essentialfacilities, hospital should be designed toremain operational in the event of a majorearthquake. Typically this involves usinglarger design forces and meeting morerestrictive design requirements than thoserequired by building codes for the building
design. However, equipment andnonstructural items also require specialattention if the hospital is to remainfunctional. All critical equipment should beanchored. Equipment on isolators should besnubbed. The emergency power systemshould be closely scrutinized, and theemergency diesel-generator system shouldbe maintained and tested frequently.Equipment used to treat patients should bestored and restrained properly. Medicine incabinets should be stored in a manner thatprevents it from falling to the floor.
2. Direct Damage
Basis: Damage curves for health carefacilities are based on ATC-13 data for FC10, medium-rise reinforced masonry shearwall buildings (see Figure B-123). FC 10 waschosen to represent a generic building,based on review of damage curves for allbuildings.
Standard construction is assumed torepresent typical California health carefacilities under present conditions (i.e., a
298 Appendix B: Lifeline VulnerabilIty Functions ATC-25
10
X
298 Appendix B: Lifeline Vulnerability Functions ATC-25

4 Dt-I.0J
a b
8.1?10. i~i-0.801-El.878
O. O250.Hi48.8e7EMs
* days + a
DAYS: 38 60 98 126 150 180 218 240 27 3 330 365Elapsed Time in Days
Figure B-124 Residual capacity for health care facilities (NEHRP California 7).
composite of older and more modern healthcare). It is assumed that such facilities weredesigned using enhanced seismicrequirements and that the beneficialintensity shifts, indicated below areappropriate.
Present Conditions: In the absence of dataon the type of construction, age, etc., thefollowing factors were used to modify themean curves, under present conditions:
NEHRP Map AreaCalifornia 7California 3-6Non-California 7Puget Sound 5All other areas
Mm/Intensity
Shift
-1000
Upgraded Conditions: For areas, where itappears cost-effective to improve facilities,assume on a preliminary basis that upgradesresult in one or two beneficial intensityshifts (i.e., -1 or -2), relative to the abovepresent conditions.
Time-to-restoration: The time-to-restoration data assigned to SF 8, healthcare services, are assumed to apply to allhealth care facilities. By combining thesedata with the damage curves for FC 10, thetime-to-restoration curves shown in FiguresB-124 through B-126 were derived.
B. 0.2 Emergency Response Services
1. General
Description: Emergency response servicesinclude fire and police stations. Both fireand police stations may be housed in low- tomedium-rise structures of virtually any typeof construction. In many urban areas thesestructures are old and were built prior to theadoption of earthquake design codes.Firehouses typically include garages tohouse engines, sleeping quarters, kitchens,utility rooms, and communications rooms.Some stations have hose towers used to dryhoses after use. Police stations typicallyinclude a dispatch center, detention area,and squad room.
Appendix B: Lifeline Vulnerability Functions
Health CareR=1010x
3
C
-i
Ca
) R= SOz
C1):5
R= l l i l
ATC-25 299

Health Care
98 120 10 180 210 Z40 270 300 330 365Elapsed Time in Days
Figure B-1 25 1
.5(U
Cl
I 0
-cz
(ni)
Figure B-i 26
Residual capacity for health care facilities (NEHRP Map Area: California 3-6, Non-California 7, and Puget Sound 5).
Health CareR=
jl: . W . I I I I .I I I I i
DAYS: 30 60 98 128 158 180 210 240 278 308 330 365Elapsed Time in Days
Residual capacity for health care facilities (All other areas).
Appendix B: Lifeline Vulnerability Functions
R=100v
R= 5e
CU0C)
-o(I)a)cc
MrII a b76 0.171 0.025
7 0.116 0.0148 -0.001 0. 00?9 -0.878 0.005
10 -0.165 0.004
R = b * days a
/ I I I I
DAYS 30 6e
ATC-25. 300
.S
. .
, .
OX!
n_

Emergency Response Seruice
WI VIll IxModified Mercalli Intensity (MM])
Damage percent by intensity for emergency response service facilities.
Typical Seismic Damage: Buildings housingfire and police stations may experiencegeneric building damage ranging fromcracking of frames and walls to partial ortotal collapse. Fire stations may be moresusceptible to damage than most buildingsbecause of the presence of the large garagedoor openings and the hose towers, whichinterrupt the continuity of the roofdiaphragm and frequently havediscontinuous shear walls or frames.Significant damage to a fire station couldlead to loss of use of engines housed withinthem. UJnanchored communicationsequipment in both stations could severelyhinder operations immediately after anearthquake.
Seismically Resistant Design: Both fire andpolice stations are critical buildings thatshould remain operational after a majorearthquake. Accordingly, these facilitiesshould be designed to meet the seismicrequirements for critical buildings of anational or local building code. Geometricirregularities that will result in poor seismicperformance should be avoided (e.g.,
separate hose towers should be provided).Communications equipment should beproperly restrained and provided withbackup emergency power. All equipment,especially boilers, should be well anchored.Engines and patrol cars should be stored inareas that are expected to escape seriousdamage.
2. Direct Damage
Basis: Damage curves for emergencyresponse service are based on ATC-13 datafor FC 10, medium-rise reinforced masonryshear wall buildings (see Figure B-127). FC10 was chosen to represent a genericbuilding, based on review of damage curvesfor all buildings. Although more modernfacilities may be designed to enhancedseismic design criteria, many old police andfire stations are still in use. Consequently,no intensity shifts from typical FC 10performance are assumed.
Standard construction is assumed torepresent typical emergency responsefacilities under present conditions (Le., a
Appendix B: Lifeline Vulnerability Functions3
C5
0)
VI
Figure B-127
x
3!0 ATC-25

R=1O0Y
.H .
ea(aC,
Cao R= So.C
:3
a)
m =e
Emergency Response Service
DAYS: 3 68 90 128 150 180 210 248 270 3 338 365I Elapsed Time in Days
Figure B-128 Residual capacity for emergency response service facilities (NEHRP California 7).
composite of older and more modern policeand fire stations).
Present Conditions: In the absence of dataon the type of construction, age, etc., thefollowing factors were used to modify themean curves, under present conditions:
NEHRP Map AreaCalifornia 7California 3-6Non-California 7Puget Sound 5All other areas
MM/Intensity
Shift
0,+1+1+1+2
Upgraded Conditions: For areas where itappears cost-effective to improve facilities,assume on a preliminary basis that upgradesresult in one or two beneficial intensityshifts (i.e., -1 or -2), relative to the abovepresent conditions.
Time-to-restoration: The time-to-restoration data assigned to SF 23,emergency response services, are assumedto apply to all emergency response servicefacilities. By combining these data with thedamage curves for FC 10, the time-to-restoration curves shown in Figures B-128through B-130 were derived.
Appendix B: Lifeline Vulnerability Functions302 ATC-25
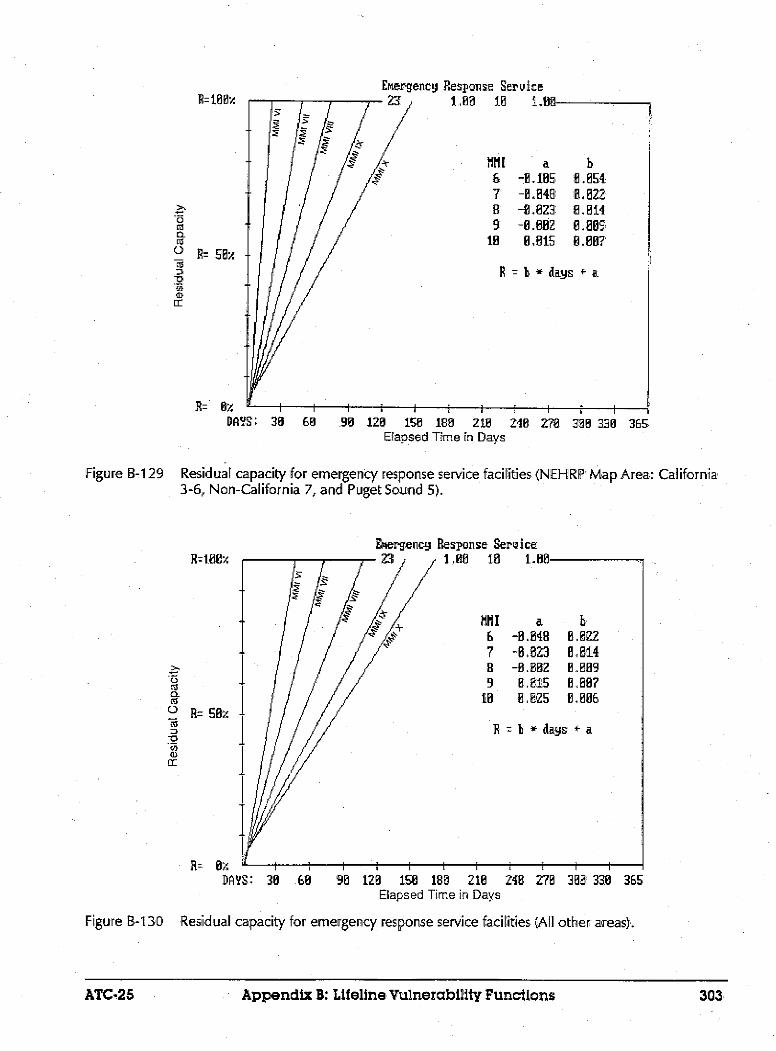
Emergenc Response Seruice
"Ml a b6 - .1B5 O. O8547 -0.84 0,.0228 -1,023 8.2149 -8.B B 8. 1009
10 8.815 0.887
R = b, * days +- a
68 98 128 1S 188 218 248 278 3 33 35Elapsed Time in Days
Figure B-1 29 Residual capacity for emergency response service facilities (NEHRP Map Area: California3-6, Non-California 7, and Puget Sound 5).
R=I8%
.)
7
:3:0
DAYS: 38 68
bergency Response Serviice
98 128 158 188 218Elapsed Time in Days
I I i I
248 278 3081 33 35
Figure B-130 Residual capacity for emergency response service facilities (All other areas).
Appendix B: Lifeline Vulnerability Functions
-50
CO
:3.0
nI a b,6 -0.048 8 .8227 -8823 0,i84B -8.BB2 ,80099 El15 0.087
ID 0. 025 0. 808,
R =bt * days + a
3
R=
OM: 30
1.00 10 1.00.
R= I 1
ATCC-25 303