appendix a - gpats · appendix a: public outreach ... allowing participants to view results and...
TRANSCRIPT
1
Greenville-Pickens Area Transportation Study
Kimley-Horn
Appendix A: Public Outreach
November 2017
Appendix A Public Outreach
The Horizon 2040 process included a robust public engagement process throughout all phases of the project.
This process and the data that resulted t is documented on the following pages. Intentional efforts were made
to reach a broad spectrum of audiences, and to incorporate the community’s input and comments into the final
project recommendations where possible.
2
Greenville-Pickens Area Transportation Study
Kimley-Horn
Appendix A: Public Outreach
November 2017
Public Participation Plan
Identifying a list of funded transportation improvements should occur, in part, through a community
engagement process that generates information equal in value to technical data. It is important to explain why
decisions were made and to point to milestones in the planning process that led to the resulting decisions. The
following Public Participation Plan helps ensure the plan outcomes are defensible and implementable.
Project Branding
To distinguish this planning process from previous and ongoing plans and studies within the region, the Horizon
2040 LRTP includes a branding theme (e.g. project moniker, color scheme, and design templates) for use in all
project deliverables. The purpose is to create a unifying theme now that will carry on the region’s transportation
vision and recommendations during implementation and be revisited during future LRTP updates.
Targeted Outreach
Creating a robust and implementable plan requires a continuous and inclusive process that brings residents,
business owners, and other stakeholders to the table with local staff and elected officials. The underlying
principle for understanding local dynamics is collaborative planning and consensus-building through a process
that recognizes the intimate knowledge of these groups and the current and expected issues facing the
Greenville region. Key interests that should be targeted or invited to participate in outreach activities include:
• GPATS staff
• Municipal staff
• Greenville and Pickens County staff
• SCDOT
• FHWA
• Elected officials
• State and Federal agencies
• Public transportation providers
• Public transportation users
• Freight operators
• Public service officials
• Major employers
• Chambers of Commerce
• Economic development agencies
• Bicycle and pedestrian advocates
• Community leaders
• Minority and low income communities
A variety of community events, meetings, surveys, and media channels should be used. Each technique targets
specific stakeholders and/or the community at-large. Special consideration has been given to reaching a
balanced cross-section of the community with the intent to accomplishing the following objectives:
• Engaging key community leaders
• Offering decision points for citizens
• Ensuring representation from a wide range of demographics
• Sequencing engagement activities to build support and participation
• Using the engagement process to raise awareness to regional transportation issues

3
Greenville-Pickens Area Transportation Study
Kimley-Horn
Appendix A: Public Outreach
November 2017
Elements for Participation
The table below provides additional detail on the various elements for public participation.
Outreach Summary
Event Target Audience Objective/Description
Policy Committee Meetings
(up to 3)
• Policy Committee Offer hands-on work sessions to engage the committee about the process, outcomes, and recommendations
Focus Group Meetings
(two meetings with three focus groups)
• Advocates and thought leaders
Provide task-oriented workshop-style meetings to provide direct input into the creation of the LRTP
Regional Workshops
(two events)
• Community at large
• Project committees
Create widespread interest and participation in the plan by engaging participants in active and meaningful ways
Sub-Regional Community Meetings
• Community at large
• Project committees
• Elected officials
Engage smaller subsets of the region through targeted workshop-style meetings
Stakeholder and Small Group Interviews
• Community at large
• Project committees
• Elected officials
Focused participation by individuals and small groups
Statistically-Valid Survey
• Community at large
• Project committees
• Elected officials
Collect data on issues, needs, and travel trends
MetroQuest • Community at large
• Project committees
• Elected officials
Gather feedback on potential projects and priorities
Project Webpage • Community at large
• Project committees
Serve as a portal for plan information; Highlight upcoming events, news, documents, resources, and meeting summaries
Social Media • Community at large
• Project committees
• Elected officials
Educate the public; Engage in conversations about issues
E-Blast
• Community at large
• Project committees
• Elected officials
Educate the community on the purpose, process, milestones, and project activities.

4
Greenville-Pickens Area Transportation Study
Kimley-Horn
Appendix A: Public Outreach
November 2017
Regional & Sub-Regional Workshop Summary
Introduction
Community engagement for the GPATS Horizon 2040 Long-Range Transportation Plan (Horizon 2040) kicked off
on Wednesday, September 7, 2016 with a Regional Workshop at the TD Convention Center in Greenville. This
event was supplemented with a series of meetings (i.e. Sub-Regional Community Meetings) throughout the
Upstate. These events offered a welcoming environment in which community members could provide input to
the visioning and issues identification phase of the Horizon 2040. The long-range transportation plan, sponsored
by the Greenville-Pickens Area Transportation Study, seeks to understand the region's existing and future
transportation needs and identify viable solutions. When completed, Horizon 2040 will identify transportation
improvements that can be funded through the year 2040.
This document summarizes the Regional Workshop and Sub-Regional Community Meetings, which were
designed as drop-in workshops with interactive stations providing information and collecting input. Feedback
collected at the workshops was combined with information received from stakeholder meetings and the online
survey to inform the initial phase of the planning process, including the creation of goals and objectives and the
understanding of existing conditions.
Regional Kickoff Workshop
• Greenville – Sep. 7
Sub-Regional Workshops
• Easley – Oct. 3
• Williamston – Oct. 10
• Mauldin – Oct. 11
• Fountain Inn – Oct. 12
• Clemson – Oct. 13
• Greer – Oct. 17
• Travelers Rest – Oct. 18
• Greenville – Oct 20
Workshop Agenda
• Info Wall
• One Word
• Priority Pyramid
• Though Wall
• More or Less
• Mapping Exercises
o Transit
o Roadway
o Bicycle & Pedestrian
• Exit Questionnaire
5
Greenville-Pickens Area Transportation Study
Kimley-Horn
Appendix A: Public Outreach
November 2017
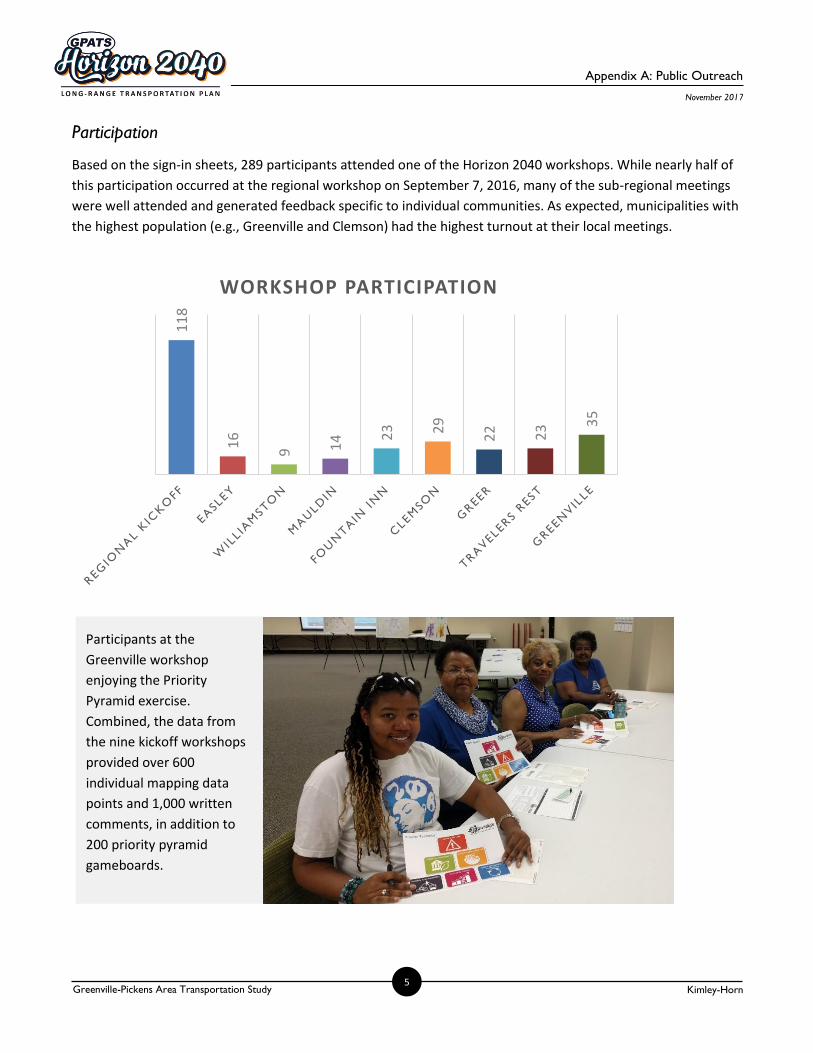
Participation
Based on the sign-in sheets, 289 participants attended one of the Horizon 2040 workshops. While nearly half of
this participation occurred at the regional workshop on September 7, 2016, many of the sub-regional meetings
were well attended and generated feedback specific to individual communities. As expected, municipalities with
the highest population (e.g., Greenville and Clemson) had the highest turnout at their local meetings.
Participants at the
Greenville workshop
enjoying the Priority
Pyramid exercise.
Combined, the data from
the nine kickoff workshops
provided over 600
individual mapping data
points and 1,000 written
comments, in addition to
200 priority pyramid
gameboards.
11
8
16
9 14 2
3 29
22 23 3
5
WORKSHOP PARTICIPATION
6
Greenville-Pickens Area Transportation Study
Kimley-Horn
Appendix A: Public Outreach
November 2017
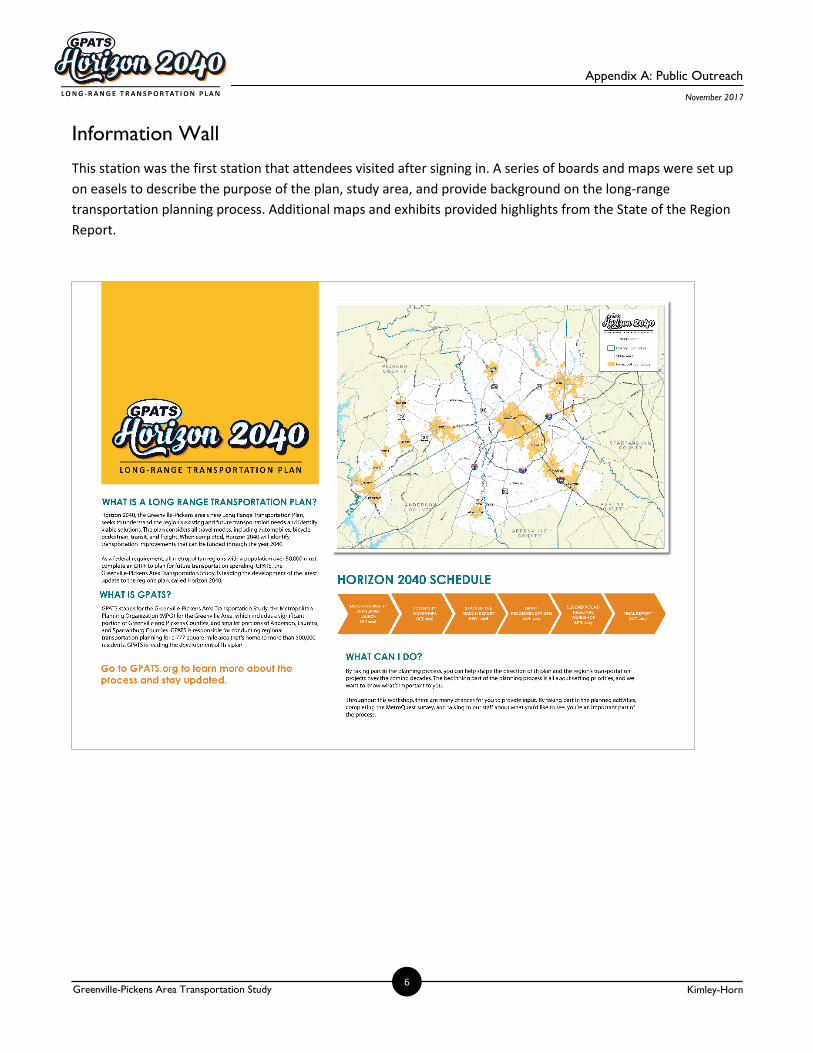
Information Wall
This station was the first station that attendees visited after signing in. A series of boards and maps were set up
on easels to describe the purpose of the plan, study area, and provide background on the long-range
transportation planning process. Additional maps and exhibits provided highlights from the State of the Region
Report.
7
Greenville-Pickens Area Transportation Study
Kimley-Horn
Appendix A: Public Outreach
November 2017

8
Greenville-Pickens Area Transportation Study
Kimley-Horn
Appendix A: Public Outreach
November 2017

9
Greenville-Pickens Area Transportation Study
Kimley-Horn
Appendix A: Public Outreach
November 2017
10
Greenville-Pickens Area Transportation Study
Kimley-Horn
Appendix A: Public Outreach
November 2017

11
Greenville-Pickens Area Transportation Study
Kimley-Horn
Appendix A: Public Outreach
November 2017
One Word
In the “One Word” activity, participants were asked to use one word to describe the transportation in the
Upstate today and one word to describe their vision for transportation in the Upstate in the future. These words
were then posted on the wall at the workshop, allowing participants to view results and ideas of other
participants. This activity helped the planning team gather broad views on the community’s existing perception
of the study area today and hopes for the future. Word clouds were created based on the response, with greater
emphasis placed on repeating themes.
Transportation in the Upstate Today…
Our vision for the future…

12
Greenville-Pickens Area Transportation Study
Kimley-Horn
Appendix A: Public Outreach
November 2017
Priority Pyramid
Participants were introduced to the projects six guiding statements and asked to rank the relative importance of
each, with the understanding that all are important. Their finalized game board was then posted beneath the
station banner representing their top priority, to allow participants to view the workshop’s overall outcome at a
glance. The results of this exercise provide valuable insight into the community’s values and will assist in project
prioritization.
When combining data from all workshops to calculate an aggregate score, Safety and Security scored as the
overall highest priority, with a weighted average of 245.3. Growth and Development was second with a score of
222.3, followed by Mobility and Accessibility with 199.5. System Preservation and Efficiency, Economicy Vitality,
and Culture and Environment trailed, though each received votes as a top priority.
Rank 1st
2nd
3rd
4th
5th
6th
Weighted
Average 245.3 222.3 199.5 142.6 127.6 111.7
Percent
Responses
by Tier
1st: 29%
2nd: 40%
3rd: 31%
1st: 21%
2nd: 42%
3rd: 37%
1st: 23%
2nd: 31%
3rd: 46%
1st: 9%
2nd: 33%
3rd: 58%
1st: 10%
2nd: 27%
3rd: 63%
1st: 7%
2nd: 26%
3rd: 67%
However, the results from each municipality differ slightly, depending on the differing values of each city or
town. For instance, participants from Clemson and Greenville ranked Mobility and Accessibility as their highest
priority, while Williamston and Mauldin ranked Growth and Development highest. Following are the top three
priorities and their weighted average scores broken down by municipality.

13
Greenville-Pickens Area Transportation Study
Kimley-Horn
Appendix A: Public Outreach
November 2017
Top Priorities by Workshop
Rank 1st 2nd 3rd
Regional Kickoff
Weighted Score 101.2 70.5 55.5
Easley
Weighted Score 21.1 18.3 15.5
Williamston
Weighted Score 4.6 7.4
Mauldin
Weighted Score 19.1 14.3 13.3
Fountain Inn
Weighted Score 56.1 32.4 26.5
Clemson
Weighted Score 60.2 56.1 37.5
Greer
Weighted Score 39.1 34.3 22.6
Travelers Rest
Weighted Score 39.2 35.2 22.5
Greenville
Weighted Score 53.2 41.4 41.4

14
Greenville-Pickens Area Transportation Study
Kimley-Horn
Appendix A: Public Outreach
November 2017
Common themes among the individual thoughts included the following:
• A wish to preserve and add green space throughout the study area.
• Reducing congestion from recent growth and development along key corridors (i.e.
Woodruff Rd).
• Maintaining a viable transportation system as one tool in an economic development
tool kit.
• Reducing road visibility hazards and crash risks in certain corridors.
• Expanding the public transportation system to further destinations throughout the
region.
Thought Wall
Participants at the Thought Wall station were given four pieces of paper and asked to write one issue, concern, topic, need, or challenge on each sheet. One sheet was reserved for their most important thought. Participants were then asked to place each of their comments under the planning theme posted on the designated “Thought Wall”. This exercised collected numerous thoughts that will inform the plan’s understanding of existing conditions. By having participants self-select a planning theme for each of their thoughts, a frequency of priority (sheets per theme) and an intensity of priority (most important thoughts per theme) were determined.
THEME
FREQUENCY
RANK 1 2 3 4 5 6
INTENSITY
RANK 1 2 4 5 3 6
COMMENTS
PRIORITY 59 45 31 25 19 15
GENERAL 57 57 61 50 37 40
Overall, 496 individual comments were collected, with the most attention being paid to Mobility and
Accessibility (116 comments overall).

15
Greenville-Pickens Area Transportation Study
Kimley-Horn
Appendix A: Public Outreach
November 2017
More or Less
Participants were given a game board that displayed five topic areas: roadways; bicycle and pedestrian; transit;
freight, rail and aviation; and intelligent transportation systems (ITS and transportation demand management
(TDM). Participants were asked to write down any each topic area that they would like to see more of or less of
in the community. These topics relate directly to recommendations that will be developed as part of Horizon
2040.
The greatest number of comments related to roadway design elements, an unsurprising phenomenon since that
is the element of the transportation network people are most familiar with. Bicycle and Pedestrian elements
elicited the second highest response rate.
+ -
Roadways 88 64
Bicycle/Pedestrian 90 41
Transit 77 25
Freight, Rail & Aviation 62 24
ITS & TDM 62 20
The following represents common answers.
• Roadway: Participants would like to see fewer potholes, less congestion, more turn lanes, and widening
on key congested corridors (Woodruff Rd.)
• Bicycle and Pedestrian: Participants would like to see more bike lanes and sidewalks, but less bike traffic
in heavily traveled areas
• Transit: Participants would like to see more public transit connecting to smaller communities.
• Freight, Rail and Aviation: In general, participants would like to see more emphasis on rail and aviation,
taking truck traffic off local highways.
• ITS & TDM: Many participants would like to see better synchronization between traffic lights.

16
Greenville-Pickens Area Transportation Study
Kimley-Horn
Appendix A: Public Outreach
November 2017
Mapping
For these activities, participants viewed large maps of the study area and placed different colored dots to
denote areas of concern or opportunities.
Three separate maps were available to map attributes of the roadway network, transit system, and bicycle and
pedestrian infrastructure.
The result of this exercise yields special areas and corridors within the region to focus planning efforts around.
Clusters of green and red dots were analyzed to show these locations as cohesive areas. In total, over 600
individual data points were placed on the maps during the nine workshops.
Bicycle & Pedestrian Results
In the map above, the vast majority of the dots are located surrounding Greenville, Greer and Clemson,
mirroring the area’s current bicycle and pedestrian infrastructure network. The map shows what the community
deems to be priority corridors, such as US Hwy 29, as well as a cluster of obstacles around Clemson University,
which is also a prime destination.
17
Greenville-Pickens Area Transportation Study
Kimley-Horn
Appendix A: Public Outreach
November 2017
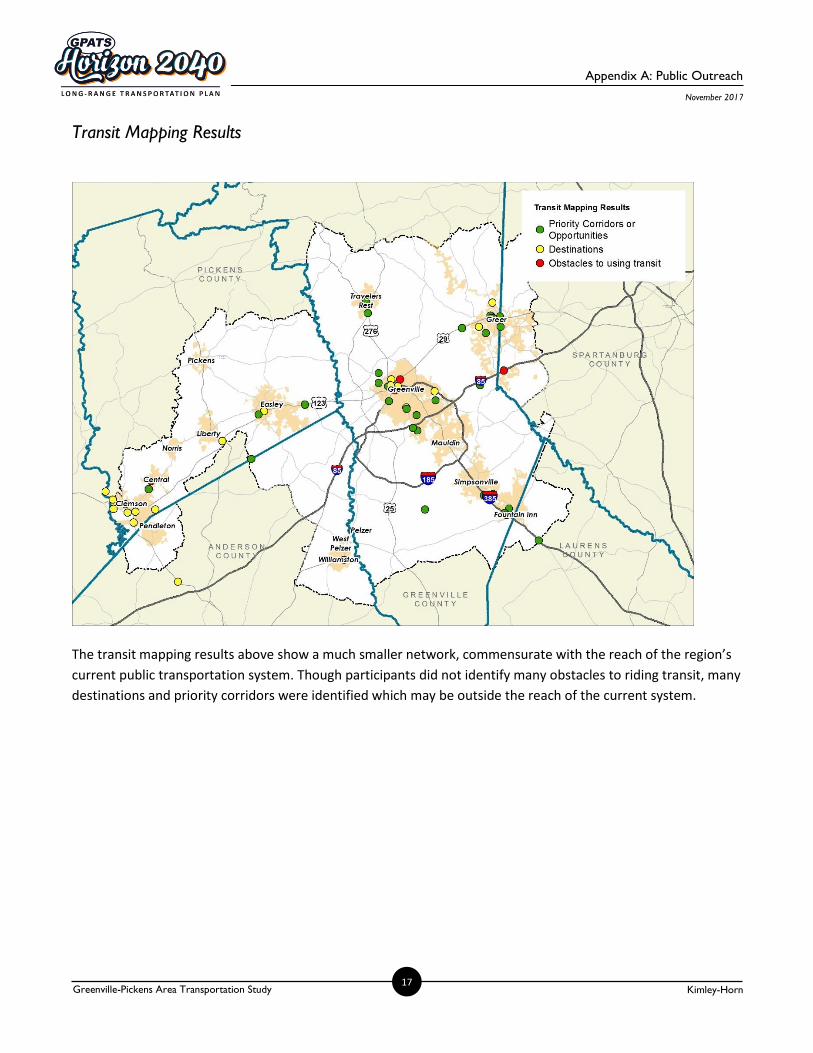
Transit Mapping Results
The transit mapping results above show a much smaller network, commensurate with the reach of the region’s
current public transportation system. Though participants did not identify many obstacles to riding transit, many
destinations and priority corridors were identified which may be outside the reach of the current system.

18
Greenville-Pickens Area Transportation Study
Kimley-Horn
Appendix A: Public Outreach
November 2017
Roadway Mapping Results
Many roadway safety and congestion concerns were identified throughout the study area, as shown in the map
above. These concerns are mainly located in downtown Greenville and along the most congested corridors,
including US Hwy 25, 29, and I-85. Many safety concerns and congestion also exists in Clemson, at the far west
end of the study area.

19
Greenville-Pickens Area Transportation Study
Kimley-Horn
Appendix A: Public Outreach
November 2017
Exit Questionnaire
As part of the event, participants were also asked to complete a brief exit questionnaire to gather brief
demographic information. Because the survey was not required, only 70 responses were received from the 118
participants who attended the meeting. However, these responses can provide a good insight into the
demographics of those who provided input.
African-American
(non-Hispanic)
13%
Caucasian (non-Hispanic)
80%
Latino/Hispanic 3%
Other4%
Race/Ethnicity
18 to 2913%
30 to 4527%
50 to 6536%
66 and above24%
Age
0
2
4
6
8
10
12
29
30
3
29
36
5
29
37
6
29
38
8
29
60
1
29
60
2
29
60
5
29
60
7
29
60
9
29
61
1
29
61
3
29
61
5
29
61
7
29
62
4
29
63
0
29
63
1
29
63
2
29
63
4
29
63
5
29
64
0
29
64
1
29
65
0
29
65
1
29
65
7
29
66
1
29
66
2
29
67
0
29
67
3
29
68
0
29
68
1
29
68
7
29
69
0
29
69
3
No
. Par
tici
pan
ts
Axis Title
Participant Home and Work/School Zip Codes
Home Work/School

20
Greenville-Pickens Area Transportation Study
Kimley-Horn
Appendix A: Public Outreach
November 2017
Metroquest Survey Summary
To ensure a broad range of perspectives was involved in the early phases of the Horizon2040 Long-Range
Transportation Plan, an online survey was designed to provide a tool for substantial community input. The
survey launched on September 7, 2016 at the Regional Kickoff Workshop and was available online through
March 9, 2017. Through the MetroQuest survey platform, the survey allowed participants to identify local and
regional transportation issues, prioritize topics that are most important to them, and suggest projects they
would like to see completed. The survey was available in both English and Spanish.
In addition to the MetroQuest survey, a statistically valid survey was distributed to 525 households in the region
during the same time period. These surveys were designed with similar language, with the intention of
comparing the results to develop a community consensus after compiling the results. Where relevant, these
results are discussed below. The MetroQuest survey results will be combined with information received from
the regional workshop, sub-regional community meetings, stakeholder meetings, focus group work sessions,
and the statistically-valid survey.
Screen Shots
Screen 1: Introduction
21
Greenville-Pickens Area Transportation Study
Kimley-Horn
Appendix A: Public Outreach
November 2017
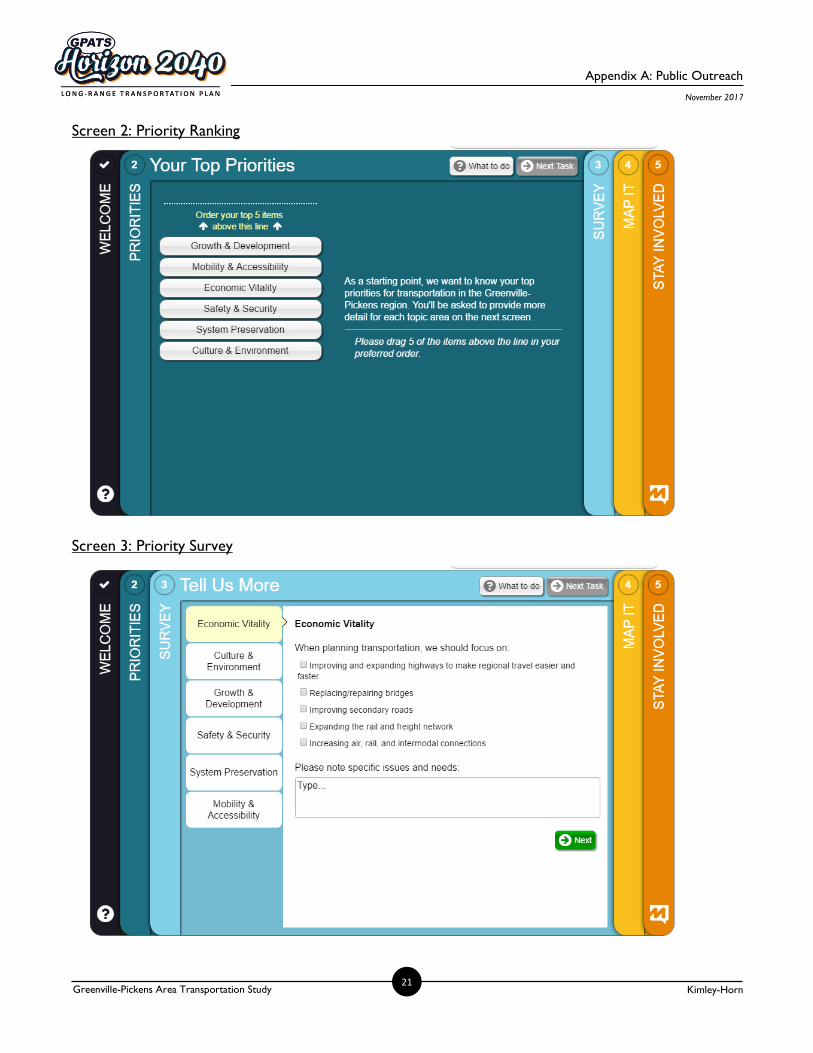
Screen 2: Priority Ranking
Screen 3: Priority Survey
22
Greenville-Pickens Area Transportation Study
Kimley-Horn
Appendix A: Public Outreach
November 2017
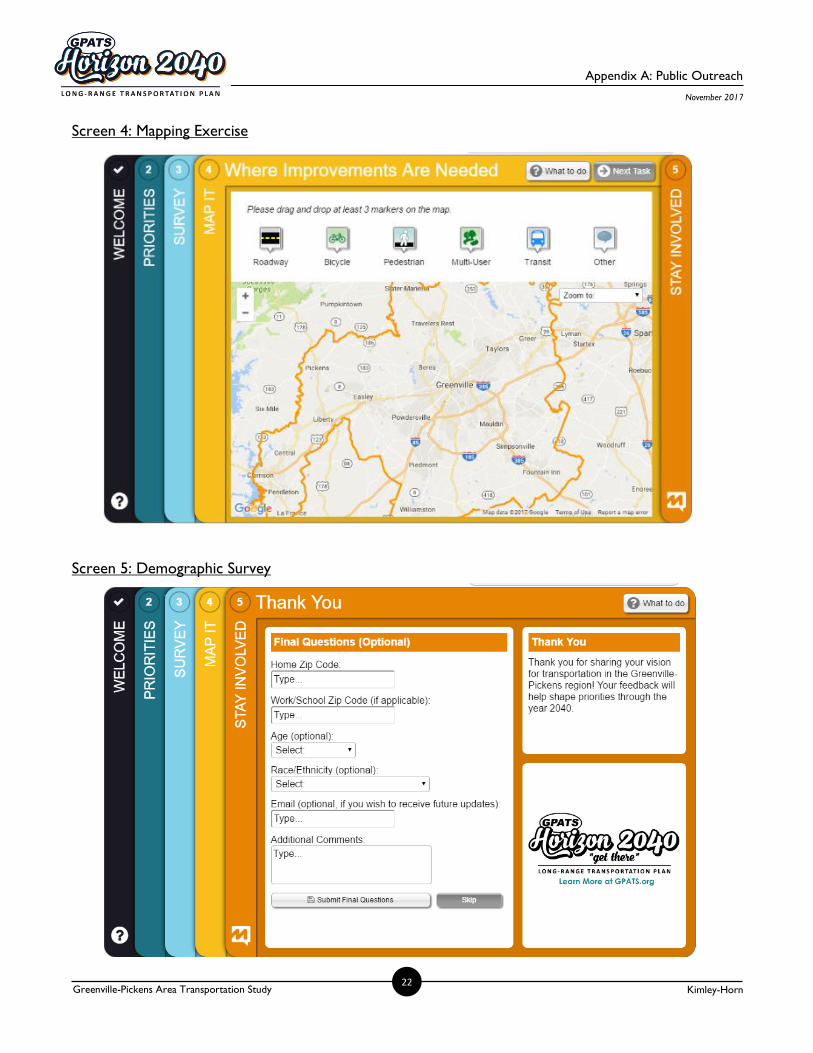
Screen 4: Mapping Exercise
Screen 5: Demographic Survey
23
Greenville-Pickens Area Transportation Study
Kimley-Horn
Appendix A: Public Outreach
November 2017
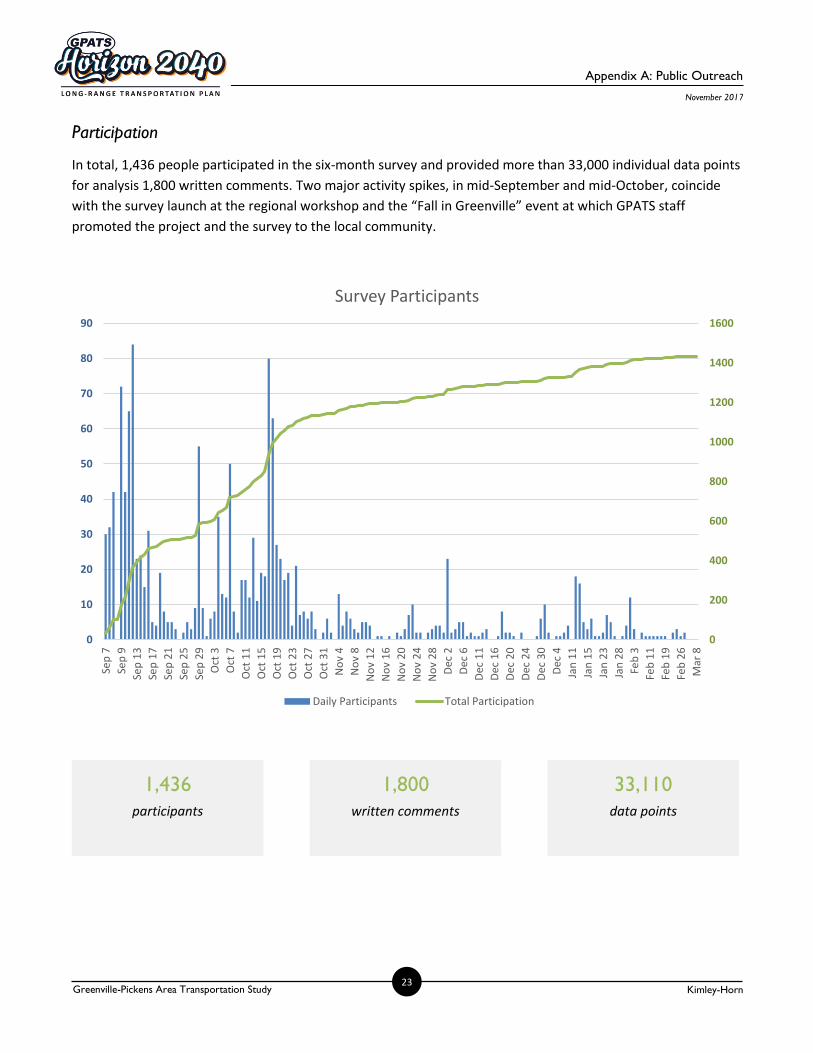
Participation
In total, 1,436 people participated in the six-month survey and provided more than 33,000 individual data points
for analysis 1,800 written comments. Two major activity spikes, in mid-September and mid-October, coincide
with the survey launch at the regional workshop and the “Fall in Greenville” event at which GPATS staff
promoted the project and the survey to the local community.
0
200
400
600
800
1000
1200
1400
1600
0
10
20
30
40
50
60
70
80
90
Sep
7
Sep
9
Sep
13
Sep
17
Sep
21
Sep
25
Sep
29
Oct
3
Oct
7
Oct
11
Oct
15
Oct
19
Oct
23
Oct
27
Oct
31
No
v 4
No
v 8
No
v 1
2
No
v 1
6
No
v 2
0
No
v 2
4
No
v 2
8
Dec
2
Dec
6
Dec
11
Dec
16
Dec
20
Dec
24
Dec
30
Dec
4
Jan
11
Jan
15
Jan
23
Jan
28
Feb
3
Feb
11
Feb
19
Feb
26
Mar
8
Survey Participants
Daily Participants Total Participation
1,436
participants
1,800
written comments
33,110
data points

5
Greenville-Pickens Area Transportation Study
Kimley-Horn
Appendix A: Public Outreach
November 2017
Priority Ranking
As the survey’s first exercise, participants were shown six different project themes and asked to select and
prioritize their top five. This exercise was designed to mirror the Priority Pyramid exercise from the September
and October workshops. The results from the two activities were compared to create a large dataset to inform
the plan’s general objectives and priorities. The six planning themes are shown below.
Culture and Environment
Enhance the region's quality of life by preserving and promoting its valued places and natural
assets.
Economic Vitality
Support regional economic vitality by making it easier to move people and freight within and
through the region.
Growth and Development
Make traveling more efficient by coordinating transportation investments with land use
decisions.
Mobility and Accessibility
Provide a balanced transportation system that makes it easier to bike, walk, and take transit.
Safety and Security
Promote a safe and secure transportation system by reducing crashes, making travel reliable and
predictable, and improving emergency response.
System Preservation and Efficiency
Extend the life of the transportation system and promote fiscal responsibility by emphasizing
maintenance and operational efficiency.

6
Greenville-Pickens Area Transportation Study
Kimley-Horn
Appendix A: Public Outreach
November 2017
In total, more than 5,000 data points associated with the priority rankings offered a more comprehensive
overview of the community’s priorities. The results from these rankings are shown below. Safety & Security was
the top ranked priority by a narrow margin, with Mobility & Accessibility following as a close second. Note, the
highest possible rank is 1, so smaller average rankings indicate higher priorities than larger averages.
MetroQuest Rank
1st 2nd 3rd 4th 5th 6th
Average Ranking 2.43 2.45 3.04 3.30 3.38 3.43
Times Ranked
(TOTAL) 963 908 904 823 819 705
Times Ranked
(FIRST) 341 (55%) 285 (31%) 138 (15%) 109 (13%) 112 (14%) 74 (10%)
When compared with the results from the regional workshop exercises, consensus begins to emerge. Safety &
Security also was ranked as the top-ranked priority in the workshops, and Growth & Development and Mobility
& Accessibility round out the top three priorities in both cases. This consensus provides a solid picture of the
community’s most important priorities. Most of the other priorities were ranked in different places by each
group.
Regional Workshop Priority Rankings
1st
2nd
3rd
4th
5th
6th
Note: To avoid confusing participants, the statistically valid survey did not ask the priority ranking question.

7
Greenville-Pickens Area Transportation Study
Kimley-Horn
Appendix A: Public Outreach
November 2017
Priority Survey
After ranking their top five priorities, participants navigated to Screen 2 which asked them to identify what the
plan should focus on within each of those priorities. They were only shown the five categories they selected on
the previous screen, and could select as many answers as they liked within each question. The results are shown
below. Additionally, each question offered the opportunity to provide written feedback. Over 1,600 comments
were provided. These comments can be provided under separate cover.
Safety & Security
When planning transportation, we should focus on…
Mobility & Accessibility
When planning transportation, we should focus on…
615
426
309
600
730
0 200 400 600 800 1000
Making it easier to bike and walk
Investing in smart transportationtechnologies
Reducing emergency response times
Making the transportation network morereliable and travel times more
predictable
Improving safety at the region's mostdangerous intersections
“Improving safety at dangerous
intersections” was the most
popular choice within Safety &
Security. However, “making the
transportation network more
reliable” and “making it easier
to bike and walk” were close
followers, highlighting the fact
that transportation safety has a
wide variety of meanings to
different groups.
Multiuse facilities (such as trails
and greenways) were more
popular than either dedicated
bicycle or pedestrian facilities.
Overall, the popularity of the
selections in this category were
relatively evenly spread. Off-
street trails were also noted as
the most important bicycle
improvement in the statistically
valid survey, outranking on-
street bicycle facilities 52% to
48%. 512
559
655
456
0 200 400 600 800 1000
Investing in pedestrian-specific facilities(e.g. sidewalks and crosswalks)
Investing in public transportation (e.g.bus routes and bus stop amenities)
Investing in multiuse facilities (e.g.greenways and multiuse paths)
Investing in bicycle-specific facilities (e.g.bicycle lanes)

8
Greenville-Pickens Area Transportation Study
Kimley-Horn
Appendix A: Public Outreach
November 2017
Growth & Development
When planning transportation, we should focus on…
Culture & Environment
When planning transportation we should focus on…
507
723
692
393
0 200 400 600 800 1000
Preserving existing Neighborhoods
Protecting the environment and existinggreenspace
Designing streets based on thesurrounding land use and urban form
Providing access to cultural features andamenities
In each survey, the responses in
this category were relatively
evenly split among the choices.
“Protecting the environment
and existing greenspace”
narrowly outranked “designing
streets based on the
surrounding land use” as the top
choice among MetroQuest
participants. In the statistically
valid survey, these top choices
were switched, but remained
the top two selections.
“Making it easier to travel
between home and jobs” far
outpaced the other options
within this category. This closely
mirrors the statistically valid
survey, in which making
commutes easier received 48%
of responses. Similarly,
“supporting economic
development and job creation”
was the second-most popular
priority in each survey.
305
495
937
429
0 200 400 600 800 1000
Strengthening connections between ourregion and other areas of the the state
and nation
Supporting economic development andjob creation
Making it easier to travel betweenhomes and jobs
Strengthening connections betweencities in our region
9
Greenville-Pickens Area Transportation Study
Kimley-Horn
Appendix A: Public Outreach
November 2017
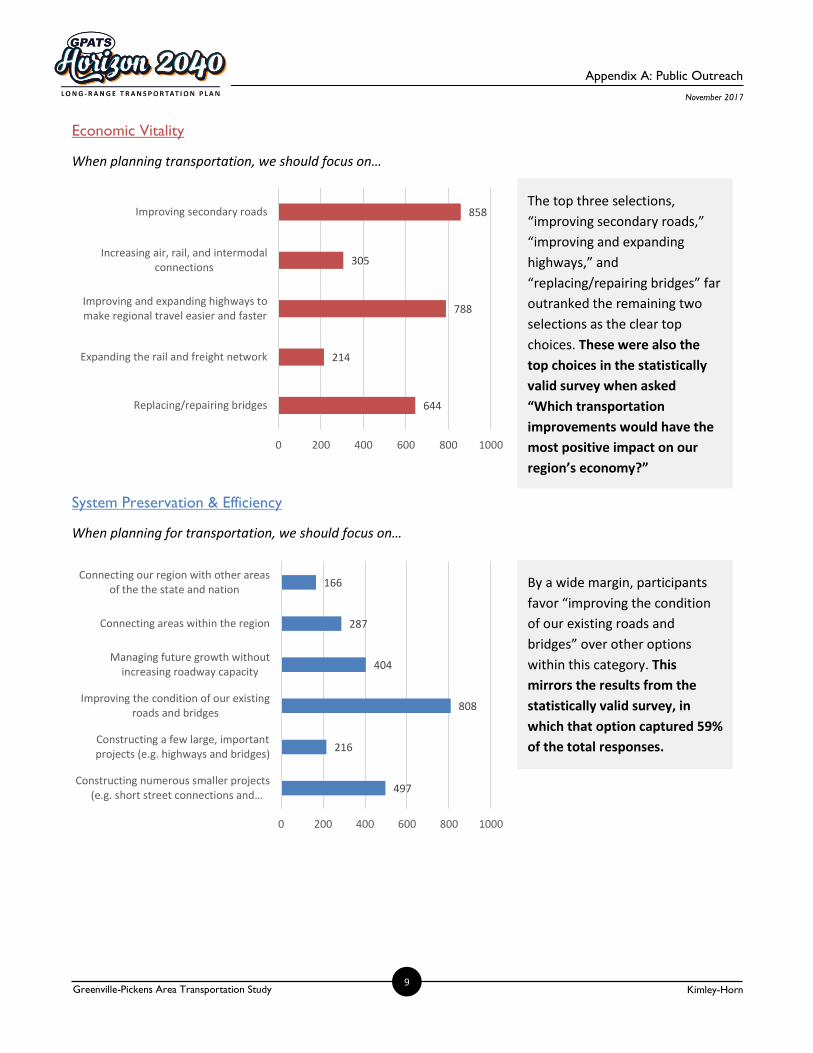
Economic Vitality
When planning transportation, we should focus on…
System Preservation & Efficiency
When planning for transportation, we should focus on…
497
216
808
404
287
166
0 200 400 600 800 1000
Constructing numerous smaller projects(e.g. short street connections and…
Constructing a few large, importantprojects (e.g. highways and bridges)
Improving the condition of our existingroads and bridges
Managing future growth withoutincreasing roadway capacity
Connecting areas within the region
Connecting our region with other areasof the the state and nation
644
214
788
305
858
0 200 400 600 800 1000
Replacing/repairing bridges
Expanding the rail and freight network
Improving and expanding highways tomake regional travel easier and faster
Increasing air, rail, and intermodalconnections
Improving secondary roadsThe top three selections,
“improving secondary roads,”
“improving and expanding
highways,” and
“replacing/repairing bridges” far
outranked the remaining two
selections as the clear top
choices. These were also the
top choices in the statistically
valid survey when asked
“Which transportation
improvements would have the
most positive impact on our
region’s economy?”
By a wide margin, participants
favor “improving the condition
of our existing roads and
bridges” over other options
within this category. This
mirrors the results from the
statistically valid survey, in
which that option captured 59%
of the total responses.

10
Greenville-Pickens Area Transportation Study
Kimley-Horn
Appendix A: Public Outreach
November 2017
Mapping Exercise
Finally, participants were asked to show specific locations throughout the study area they would like to see
considered for transportation improvement projects. They were given the option to drop markers on a map of
the GPATS area, categorize each marker as a roadway, bicycle, pedestrian, multi-user, transit or other project,
and provide additional information. Each of these markers was captured, and maps have been created to show
the general areas that participants would like to see improvement projects.
Roadway Project Suggestions
Project Categories Points
Intersection Improvement 302
Road Widening 273
Repaving 136
Safety 124
Other 80
1,408 points
950 comments

11
Greenville-Pickens Area Transportation Study
Kimley-Horn
Appendix A: Public Outreach
November 2017
Pedestrian Project Suggestions
456 points
251 comments
Project Categories Points
Safety 24
Crosswalk 21
Pedestrian Sign/Signal 13
Other 9
Maintenance/Repair 5
Sidewalk 1

12
Greenville-Pickens Area Transportation Study
Kimley-Horn
Appendix A: Public Outreach
October 2017
Bicycle Project Suggestions
702 points
342 comments
Project Categories Points
Safety 30
Other 17
Bike Parking 3
Bike Lane 2

13
Greenville-Pickens Area Transportation Study
Kimley-Horn
Appendix A: Public Outreach
October 2017
Multi-user Project Suggestions
317 points
156 comments
Project Categories Points
Off Street Greenways 91
Trail Amenities 11
Trailhead 5
On-Street Path 1

14
Greenville-Pickens Area Transportation Study
Kimley-Horn
Appendix A: Public Outreach
October 2017
Transit Project Suggestions
516 points
260 comments
Project Categories Points
Other 89
Bus Route Modification 20
Bus Stop 16
New Bus Route 4
15
Greenville-Pickens Area Transportation Study
Kimley-Horn
Appendix A: Public Outreach
October 2017
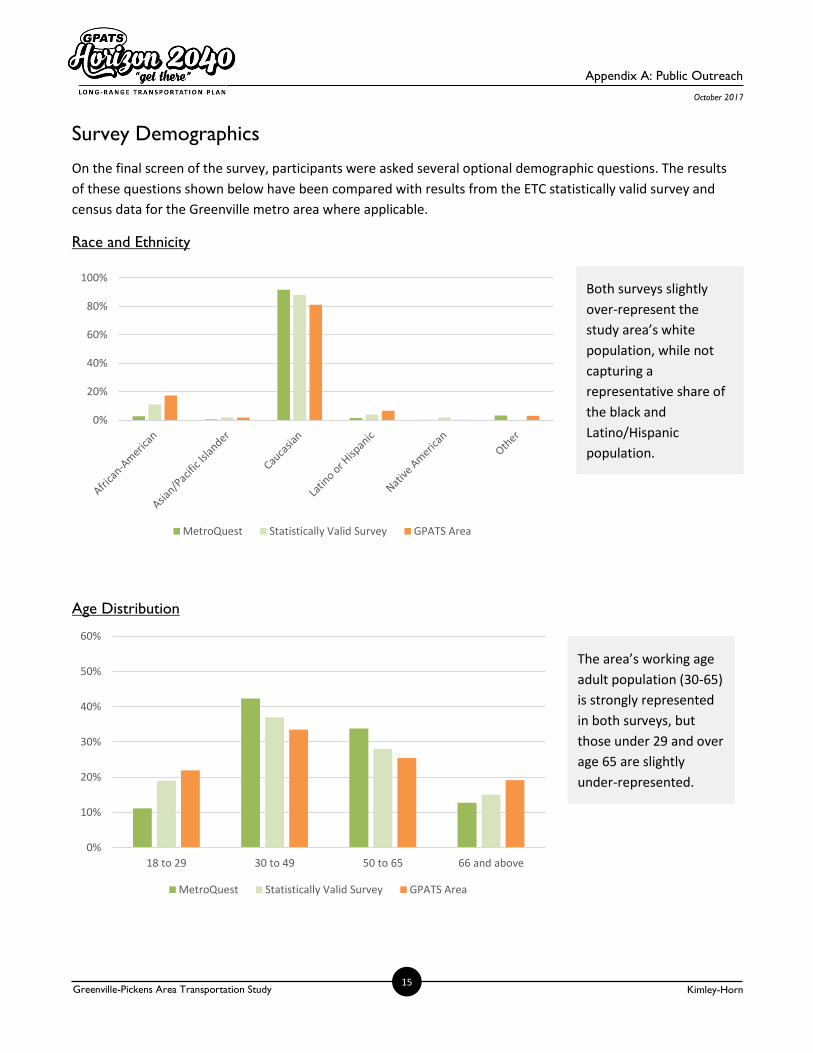
Both surveys slightly
over-represent the
study area’s white
population, while not
capturing a
representative share of
the black and
Latino/Hispanic
population.
The area’s working age
adult population (30-65)
is strongly represented
in both surveys, but
those under 29 and over
age 65 are slightly
under-represented.
Survey Demographics
On the final screen of the survey, participants were asked several optional demographic questions. The results
of these questions shown below have been compared with results from the ETC statistically valid survey and
census data for the Greenville metro area where applicable.
Race and Ethnicity
Age Distribution
0%
10%
20%
30%
40%
50%
60%
18 to 29 30 to 49 50 to 65 66 and above
MetroQuest Statistically Valid Survey GPATS Area
0%
20%
40%
60%
80%
100%
MetroQuest Statistically Valid Survey GPATS Area

16
Greenville-Pickens Area Transportation Study
Kimley-Horn
Appendix A: Public Outreach
October 2017
Home Locations of Respondents
Survey respondents were asked to
provide their home zip code to help the
study team better understand the
survey results. Most of the 1,400 people
who took the online survey live in
Greenville County. The dot density map
to the right shows the home locations
reported, with dots randomly placed
within each zip code to represent the
number of people who reported that
location.
Work or School Locations
Similarly, respondents were asked to
provide their work or school locations.
The distribution of these locations is
much different, with most clustered in
downtown Greenville. Again, the map
to the right shows the distribution of
responses by zip code, with dots placed
randomly within each zip code to
represent the number of responses.

Findings Report
…helping organizations make better decisions since 1982
Submitted by: ETC Institute 725 W. Frontier Lane, Olathe, Kansas 66061
February 2017
Horizon 2040
Long Range
Transportation
Plan Survey
Contents
Executive Summary ....................................................................... i
Section 1: Charts and Graphs ....................................................... 1
Section 2: Tabular Data .............................................................. 11
Section 3: Survey Instrument ..................................................... 28

Executive Su
mmary R
eport
Horizon 2040 Long Range Transportation Plan Survey
Purpose and Methodology
ETC Institute administered a survey to residents of the Greenville‐Pickens area during the winter of 2016. The purpose of the survey was to help the Greenville‐Pickens area update the region’s transportation plan. Horizon 2040, the Greenville‐Pickens area’s new long range transportation plan, considers all travel modes, including automobiles, bicycle, pedestrian, transit, and freight. Public outreach is an essential component of understanding the region’s existing and future transportation needs and identifying viable solutions. Survey responses will be used to help shape the direction of the plan.
The three‐page survey, cover letter and postage paid return envelope were mailed to a random sample of households in the Greenville‐Pickens area. The map below shows the study area from which respondents were selected for the random sample. The cover letter explained the purpose of the survey and encouraged residents to either return their survey by mail or complete the survey online. At the end of the online survey, residents were asked to enter their home address, this was done to ensure that only responses from residents who were part of the random sample were included in the final survey database.
Ten days after the surveys were mailed, ETC Institute sent emails and placed phone calls to the households that received the survey to encourage participation. The emails contained a link to the on‐line version of the survey to make it easy for residents to complete the survey. To prevent people who were not residents of the area from participating, everyone who completed the survey on‐line was required to enter their home address prior to submitting the survey. ETC Institute then matched the addresses that were entered on‐line with the addresses that were originally selected for the random sample. If the address from a survey
Page i
Executive Su
mmary R
eport
completed on‐line did not match one of the addresses selected for the sample, the on‐line survey was not counted.
The goal was to obtain completed surveys from at least 400 residents. The goal was exceeded with a total of 525 residents completing the survey. The overall results for the sample of 525 households have a precision of at least +/‐4.3% at the 95% level of confidence.
This report contains:
An executive summary of the methodology for administering the survey and major findings,
charts showing the overall results for most questions on the survey,
tables that show the results of the random sample for each question on the survey,
and a copy of the survey instrument.
Major Findings
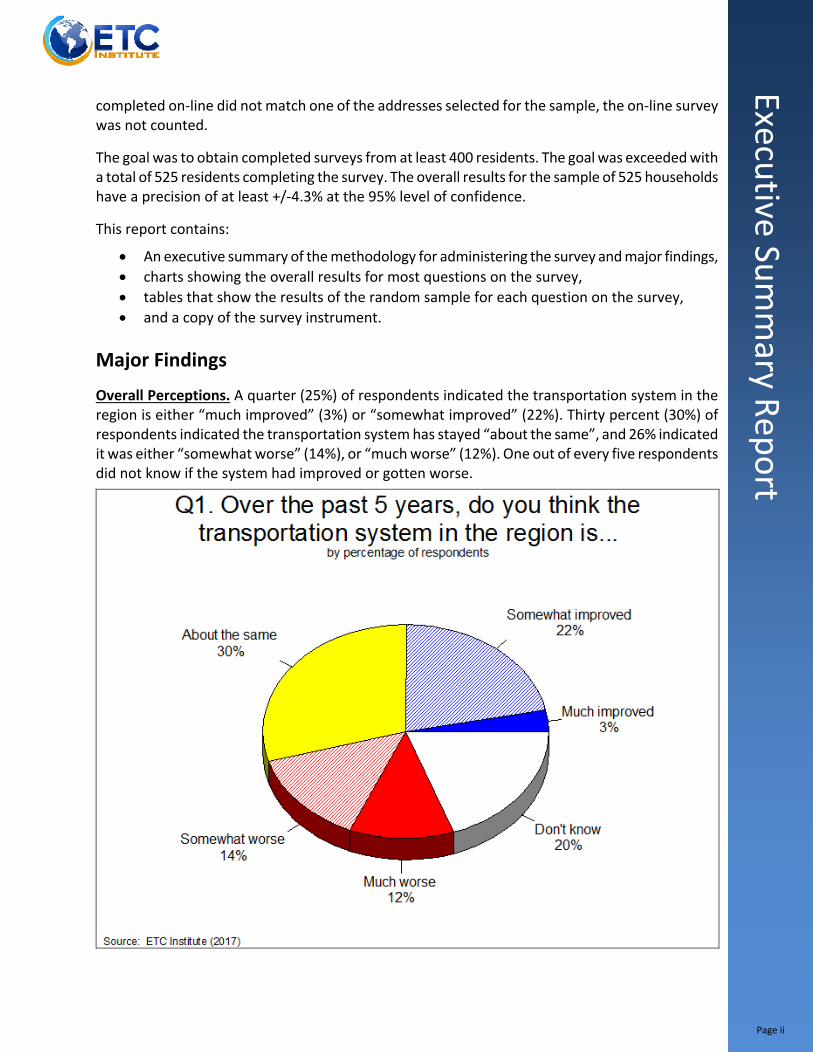
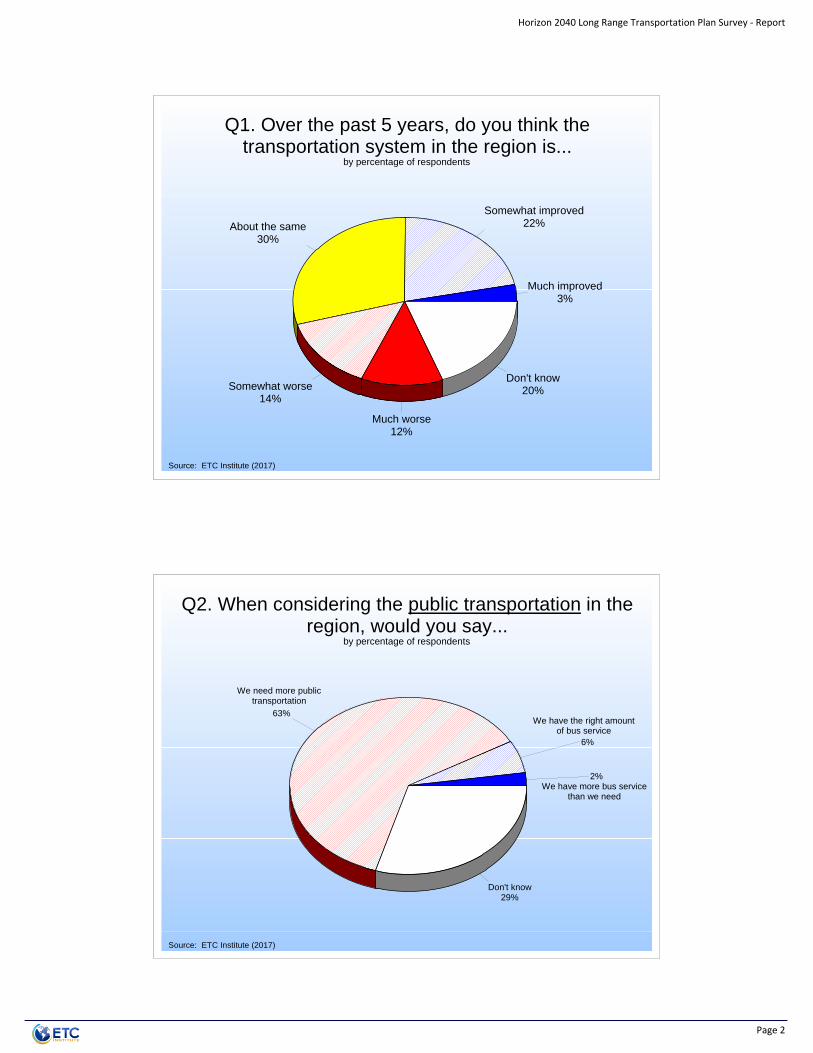
Overall Perceptions. A quarter (25%) of respondents indicated the transportation system in the region is either “much improved” (3%) or “somewhat improved” (22%). Thirty percent (30%) of respondents indicated the transportation system has stayed “about the same”, and 26% indicated it was either “somewhat worse” (14%), or “much worse” (12%). One out of every five respondents did not know if the system had improved or gotten worse.
Page ii

Executive Su
mmary R
eport
Public Transportation. A majority of respondents (63%) indicated they believe the region needs more public transportation, only 2% indicated that the region has more bus service than is needed, and 6% indicated the region has the right amount of bus service. Twenty‐nine percent (29%) of respondents indicated they don’t know if there is a need or not for additional service in the region.
When asked to indicate which public transportation improvements they would most like to see 51% of respondents indicated they would like to see rapid transit (e.g. rail), 39% would like to see better local bus service, 22% would like to see better options for persons with disabilities, and 20% would like to see better express bus service. Although a majority (51%) of respondents would like to see rapid transit, it is not an overwhelming majority which indicates further studies are needed to gain more insight into public perceptions regarding the need of rapid transit in the region.
Pedestrian. Eighty‐two percent of respondents indicated that the improvement of pedestrian facilities in the region is either “very important” (42%) or “important” (40%). Only 11% gave a “neutral” response, 6% indicated it was “not a priority”, and 1% indicated it was “not at all important”.
When asked to indicate which pedestrian improvements are most important to them 72% of respondents indicated sidewalks, 44% indicated greenways and trails, 26% indicated crosswalks, and 22% indicated pedestrian signals. Overwhelmingly sidewalks were the pedestrian improvement most important to respondents, however crosswalks and pedestrian signals are a big part of a good sidewalk system in any region. Although these items, crosswalks and pedestrian signals, did not garner as much attention from respondents, they are still vital to successful sidewalk infrastructure.
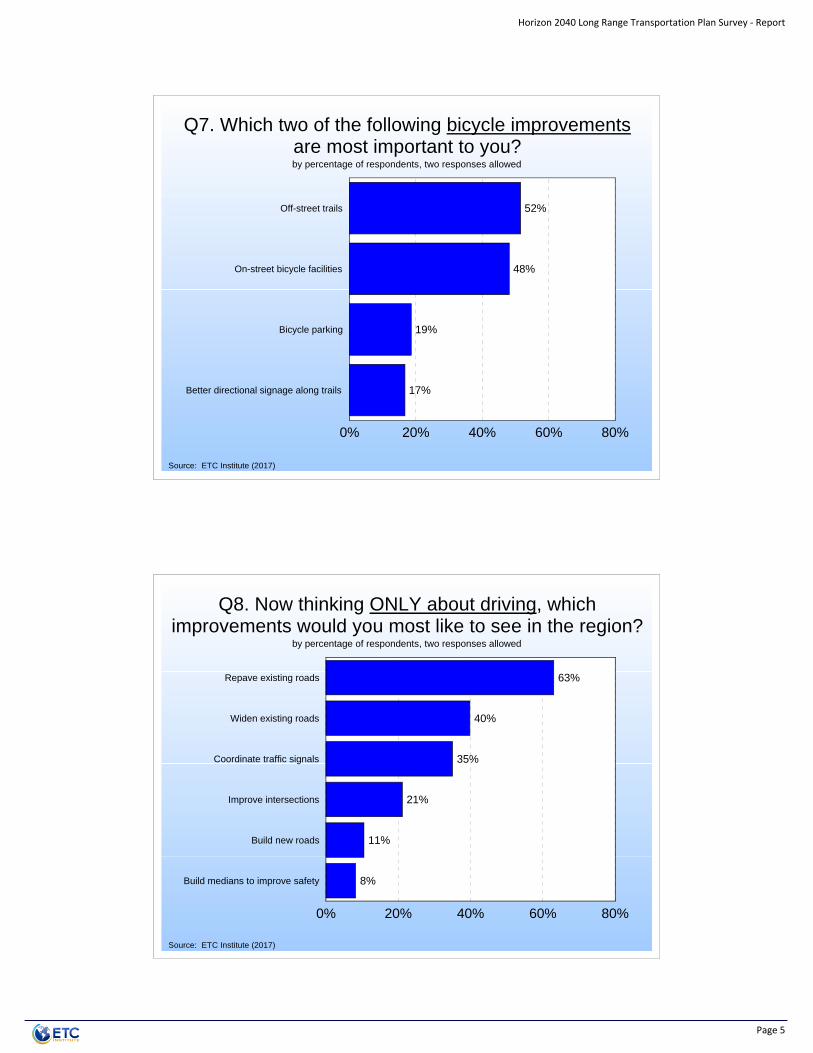
Bicycle. Sixty‐two percent of respondents indicated that the improvement of bicycle facilities in the region is either “very important” (29%) or “important” (33%). Twenty‐one percent (21%) gave a “neutral” response, 11% indicated it was “not a priority”, and 6% indicated it was “not at all important”. Respondents are clearly more interested in improvements to pedestrian facilities, but there is good support for improved bicycle facilities as well. The most important bicycle improvements are off street trails (52%) and on‐street bicycle facilities (48%), bicycle parking and better directional signage along trails both received minimal responses.
Driving. Respondents were asked to think only about driving and indicate which improvements they would most like to see in the region. Sixty‐three percent (63%) of respondents indicated they would like to see existing roads repaved, 40% would like to see existing roads widened, 35% would like coordinated traffic signals, 21% would like improved intersections, 11% would like to see new roads built, and 8% would like medians to be built to improve safety. A major trend among respondents throughout the nation is the desire to see the surface of roads and highways improve, the residents of the Greenville‐Pickens area uphold the national trend.
Improvements. When respondents were asked to indicate which transportation improvements would have the most positive impact on the region’s economy 70% selected the improvement of local roads, 54% indicated improving and expanding highways and interstates, and 28% indicated replacing and repairing bridges. The three most selected responses are all centered on improving the roadways in the region. Only 11% of respondents selected building new roads and only 8% of
Page iii
Executive Su
mmary R
eport
respondents selected building medians to improve safety. Thirteen‐percent (13%) of respondents selected focusing on rail and freight movements when asked to select which improvement would have the most positive impact on the region’s economy.
When considering transportation safety and security 37% of respondents indicated they believe the region should focus on improving safety, 12% believe the region should focus on making travel times more predictable, 12% would like to see a reduction in emergency response times, 15% would like to see an investment in transportation technologies, and 19% would like to see improvements making it easier to bike and walk.
Transportation Decisions. Respondents were asked to indicate what the region should consider when making transportation decisions. They were asked this question three times using different responses for each iteration of the question. All together there are 12 total options that respondents could have chosen from.
The three items respondents most believe the region should consider when making transportation decisions are: improving the condition of existing roads and bridges (56%), making it easier to travel between home and work (46%), and designing streets based on nearby land use (41%). The second most selected responses include: economic development and job creation (32%), using technology to manage congestion (26%), and protecting the environment (24%).
Conclusions
Respondents in the region have indicated they would like to see the improvement of the condition of existing roads, highways, interstates, and bridges in the region above all else, 63% of respondents indicated they would like to see existing roads repaved in the region. The same overarching theme is discovered whenever discussing transportation improvements nationally. The second most important item is typically traffic and congestion management on roads and highways. This is also a major theme in the Greenville‐Pickens region as evidenced by 46% of respondents indicating the region should consider making it easier to travel between home and work and 70% believe the improvement of local road would lead to the most positive impact in the region’s economy.
A strong number (51%) of respondents did indicate they would like to see some form of rapid transit in the area. However, this number indicates there is support, but much more insight is needed if the region is to make any major decisions regarding this topic. To further the case for regional rapid transit 63% of respondents did indicate the region does need more public transportation. Although these survey results do show potential support for future public transportation development, there is not overwhelming evidence to suggest a majority of residents would be in favor of improved or increased services in the region.
Page iv
Section 1 Charts and Graphs
Horizon 2040 Long Range Transportation Plan Survey - Report
Page 1
Much improved3%
Somewhat improved22%About the same
30%
Somewhat worse14%
Much worse12%
Don't know20%
Q1. Over the past 5 years, do you think the transportation system in the region is...
by percentage of respondents
Source: ETC Institute (2017)
2%
6%
63%
Don't know29%
Q2. When considering the public transportation in the region, would you say...
by percentage of respondents
Source: ETC Institute (2017)
We need more public transportation
We have more bus service than we need
We have the right amount of bus service
Horizon 2040 Long Range Transportation Plan Survey - Report
Page 2

Q3. What public transportation improvements would you like to see in the region?
by percentage of respondents, multiple responses allowed
Source: ETC Institute (2017)
51%
39%
22%
20%
Rapid transit (e.g. rail)
Better local bus service
Better option for persons with disabilities
Better express bus service
0% 20% 40% 60% 80%
Very important42%
Important40%
Neutral11%
Not a priority6%
Not at all important1%
Q4. How important is it to improve pedestrian facilities in the region
by percentage of respondents
Source: ETC Institute (2017)
Horizon 2040 Long Range Transportation Plan Survey - Report
Page 3

Q5. Which two of the following pedestrian improvements are most important to you?
by percentage of respondents, two responses allowed
Source: ETC Institute (2017)
72%
44%
26%
22%
Sidewalks
Greenways & trails
Crosswalks
Pedestrian signals
0% 20% 40% 60% 80%
Very important29%
Important33%
Neutral21%
Not a priority11%
Not at all important6%
Q6. How important is it to improve bicycle facilities in the region
by percentage of respondents
Source: ETC Institute (2017)
Horizon 2040 Long Range Transportation Plan Survey - Report
Page 4
Q7. Which two of the following bicycle improvements are most important to you?by percentage of respondents, two responses allowed
Source: ETC Institute (2017)
52%
48%
19%
17%
Off-street trails
On-street bicycle facilities
Bicycle parking
Better directional signage along trails
0% 20% 40% 60% 80%
Q8. Now thinking ONLY about driving, which improvements would you most like to see in the region?
by percentage of respondents, two responses allowed
Source: ETC Institute (2017)
63%
40%
35%
21%
11%
8%
Repave existing roads
Widen existing roads
Coordinate traffic signals
Improve intersections
Build new roads
Build medians to improve safety
0% 20% 40% 60% 80%
Horizon 2040 Long Range Transportation Plan Survey - Report
Page 5

Q9. Which transportation improvements would have the MOST positive impact on our region’s economy?
by percentage of respondents, two responses allowed
Source: ETC Institute (2017)
70%
54%
28%
13%
11%
8%
Improving our local roads
Improving & expanding our highways & interstates
Replacing & repairing our bridges
Focusing on rail & freight movements
Build new roads
Build medians to improve safety
0% 20% 40% 60% 80%
Improving safety37%
12%
12%
15% 19%
Don't know4%
Q10. When considering transportation safety and security, we should be focusing on...
by percentage of respondents
Source: ETC Institute (2017)
Making it easier to bike & walk
Making travel times more predictable
Reducing emergency response times
Investing in smart transportation technologies
Horizon 2040 Long Range Transportation Plan Survey - Report
Page 6

33%
48%
10%
9%
Q11. When making transportation decisions, we should consider...
by percentage of respondents
Source: ETC Institute (2017)
Connecting our city to other areas of state &
nation
Economic development & job creation
Making it easier to travel
between home & work Connecting cities in our region
6%
8%
59%
27%
Q12. When making transportation decisions, we should consider...
by percentage of respondents
Source: ETC Institute (2017)
Using technology to manage congestion
Constructing a few large projects
Constructing numerous small
projectsImproving condition of existing road &
bridges
Horizon 2040 Long Range Transportation Plan Survey - Report
Page 7

Q13. When making transportation decisions, we should consider...
by percentage of respondents
Source: ETC Institute (2017)
27%25%
4%
44%Designing streets based on nearby land use
Protecting the environmentPreserving existing neighborhoods
Providing access to cultural resources
Under 180%
18 to 2919%
30 to 4937%
50 to 6528%
66+15%
Q14. Respondent’s Ageby percentage of respondents
Source: ETC Institute (2017)
Horizon 2040 Long Range Transportation Plan Survey - Report
Page 8

Under $20K6%
$20K to $34,99911%
$35K to $49,99913%
$50K to $99,99940%
$100K to $199,99924%
$200K+6%
Q15. Total Annual Household Incomeby percentage of respondents
Source: ETC Institute (2017)
Q16. Are you of Hispanic or Latino Origin?
Yes4%
No96%
by percentage of respondents
Source: ETC Institute (2017)
Horizon 2040 Long Range Transportation Plan Survey - Report
Page 9

by percentage of respondents (multiple responses allowed)
Race/Ethnicity
88%
11%
2%
2%
White/Caucasian
African American/Black
Asian/Pacific Islander
Native American/Aleut
0% 20% 40% 60% 80% 100%
Source: ETC Institute (2017)
Q18. Your Genderby percentage of respondents
Male49%
Female51%
Source: ETC Institute (2017)
Horizon 2040 Long Range Transportation Plan Survey - Report
Page 10
Section 2 Tabular Data
Horizon 2040 Long Range Transportation Plan Survey - Report
Page 11

Q1. Over the past 5 years, do you think the transportation system in the region is… Q1. What do you think the transportation system in the region over the past 5 years Number Percent Much improved 17 3.2 % Somewhat improved 114 21.7 % About the same 155 29.5 % Somewhat worse 75 14.3 % Much worse 61 11.6 % Don't know 103 19.6 % Total 525 100.0 %
WITHOUT “DON’T KNOW” Q1. Over the past 5 years, do you think the transportation system in the region is… (without "don't know") Q1. What do you think the transportation system in the region over the past 5 years Number Percent Much improved 17 4.0 % Somewhat improved 114 27.0 % About the same 155 36.7 % Somewhat worse 75 17.8 % Much worse 61 14.5 % Total 422 100.0 %
Horizon 2040 Long Range Transportation Plan Survey - Report
Page 12

Q2. When considering the public transportation in the region, would you say… Q2. What would you say when considering the public transportation in the region Number Percent We have more bus service than we need 12 2.3 % We have the right amount of bus service 31 5.9 % We need more public transportation 328 62.5 % Don't know 154 29.3 % Total 525 100.0 %
WITHOUT “DON’T KNOW” Q2. When considering the public transportation in the region, would you say… (without "don't know") Q2. What would you say when considering the public transportation in the region Number Percent We have more bus service than we need 12 3.2 % We have the right amount of bus service 31 8.4 % We need more public transportation 328 88.4 % Total 371 100.0 %
Horizon 2040 Long Range Transportation Plan Survey - Report
Page 13

Q3. What public transportation improvements would you most like to see in the region? Q3. What public transportation improvements would you most like to see in the region Number Percent Better local bus service 204 39.2 % Better express bus service 103 19.8 % Rapid transit (e.g. rail) 267 51.2 % Better option for persons with disabilities 114 21.9 % Don't know 100 19.2 % Total 788
WITHOUT “DON’T KNOW” Q3. What public transportation improvements would you most like to see in the region? (without "don't know") Q3. What public transportation improvements would you most like to see in the region Number Percent Better local bus service 204 48.5 % Better express bus service 103 24.5 % Rapid transit (e.g. rail) 267 63.4 % Better option for persons with disabilities 114 27.1 % Total 688
Horizon 2040 Long Range Transportation Plan Survey - Report
Page 14
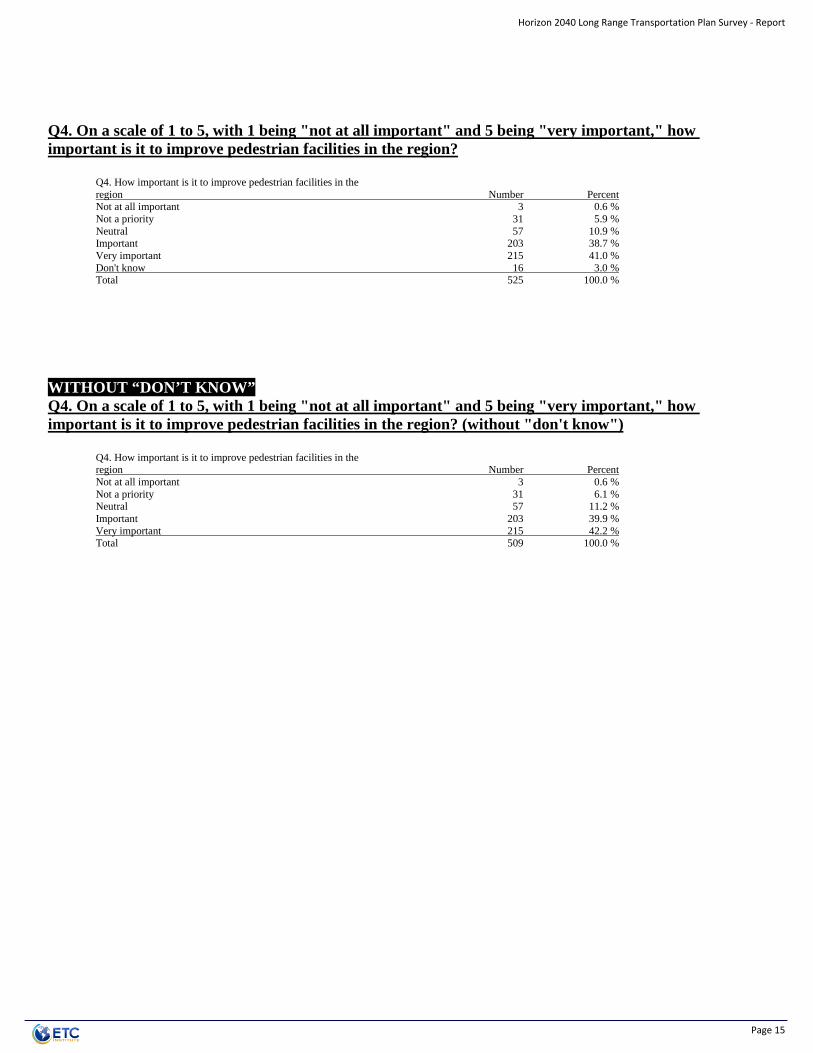
Q4. On a scale of 1 to 5, with 1 being "not at all important" and 5 being "very important," how important is it to improve pedestrian facilities in the region? Q4. How important is it to improve pedestrian facilities in the region Number Percent Not at all important 3 0.6 % Not a priority 31 5.9 % Neutral 57 10.9 % Important 203 38.7 % Very important 215 41.0 % Don't know 16 3.0 % Total 525 100.0 %
WITHOUT “DON’T KNOW” Q4. On a scale of 1 to 5, with 1 being "not at all important" and 5 being "very important," how important is it to improve pedestrian facilities in the region? (without "don't know") Q4. How important is it to improve pedestrian facilities in the region Number Percent Not at all important 3 0.6 % Not a priority 31 6.1 % Neutral 57 11.2 % Important 203 39.9 % Very important 215 42.2 % Total 509 100.0 %
Horizon 2040 Long Range Transportation Plan Survey - Report
Page 15
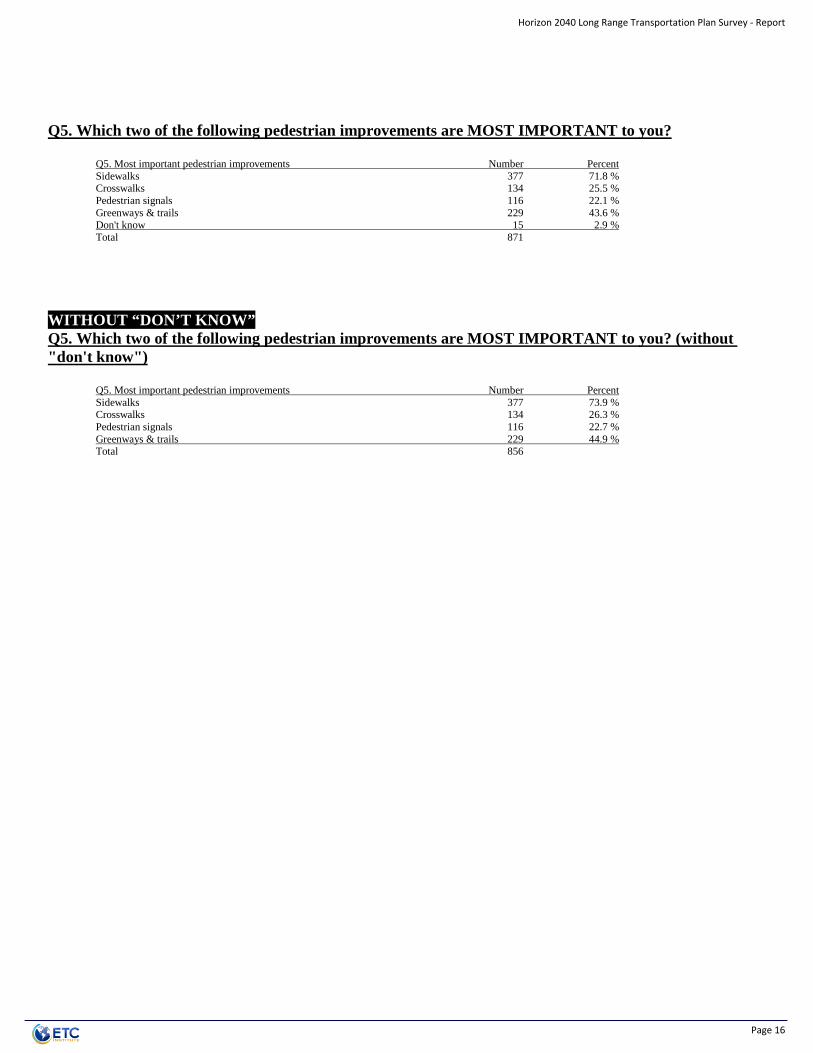
Q5. Which two of the following pedestrian improvements are MOST IMPORTANT to you? Q5. Most important pedestrian improvements Number Percent Sidewalks 377 71.8 % Crosswalks 134 25.5 % Pedestrian signals 116 22.1 % Greenways & trails 229 43.6 % Don't know 15 2.9 % Total 871
WITHOUT “DON’T KNOW” Q5. Which two of the following pedestrian improvements are MOST IMPORTANT to you? (without "don't know") Q5. Most important pedestrian improvements Number Percent Sidewalks 377 73.9 % Crosswalks 134 26.3 % Pedestrian signals 116 22.7 % Greenways & trails 229 44.9 % Total 856
Horizon 2040 Long Range Transportation Plan Survey - Report
Page 16

Q6. On a scale of 1 to 5, with 1 being "not at all important" and 5 being "very important," how important is it to improve bicycle facilities in the region? Q6. How important is it to improve bicycle facilities in the region Number Percent Not at all important 29 5.5 % Not a priority 57 10.9 % Neutral 106 20.2 % Important 166 31.6 % Very important 146 27.8 % Don't know 21 4.0 % Total 525 100.0 %
WITHOUT “DON’T KNOW” Q6. On a scale of 1 to 5, with 1 being "not at all important" and 5 being "very important," how important is it to improve bicycle facilities in the region? (without "don't know") Q6. How important is it to improve bicycle facilities in the region Number Percent Not at all important 29 5.8 % Not a priority 57 11.3 % Neutral 106 21.0 % Important 166 32.9 % Very important 146 29.0 % Total 504 100.0 %
Horizon 2040 Long Range Transportation Plan Survey - Report
Page 17
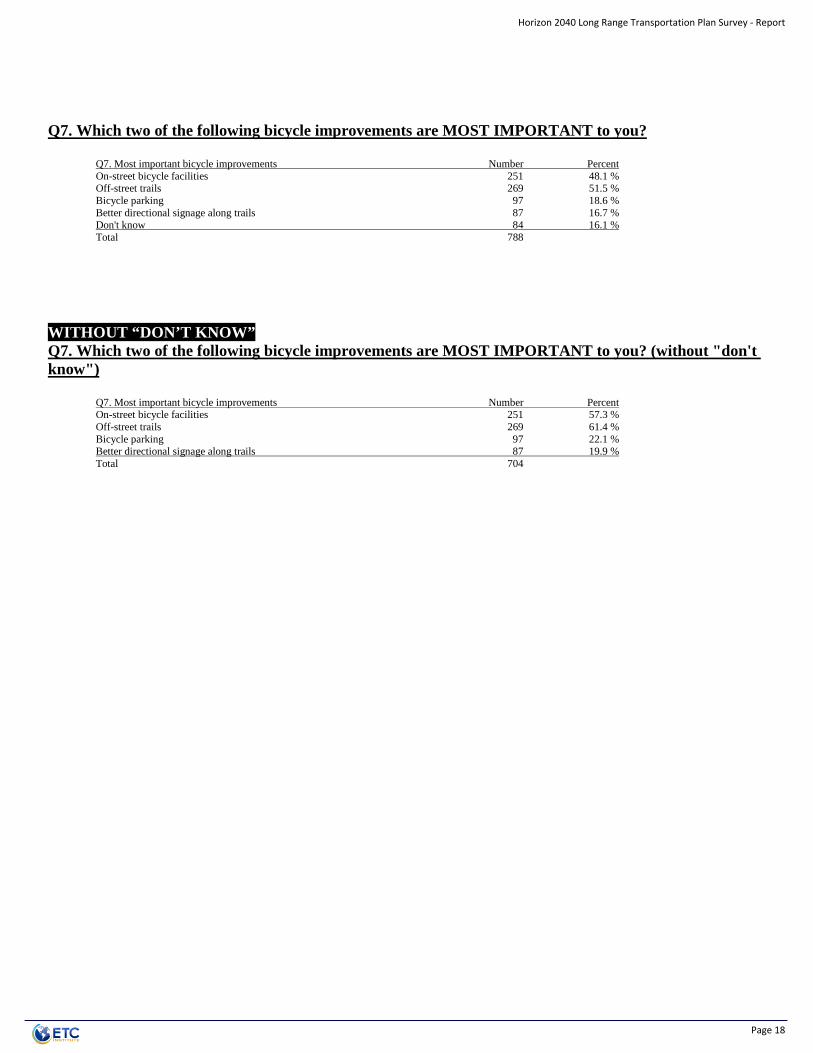
Q7. Which two of the following bicycle improvements are MOST IMPORTANT to you? Q7. Most important bicycle improvements Number Percent On-street bicycle facilities 251 48.1 % Off-street trails 269 51.5 % Bicycle parking 97 18.6 % Better directional signage along trails 87 16.7 % Don't know 84 16.1 % Total 788
WITHOUT “DON’T KNOW” Q7. Which two of the following bicycle improvements are MOST IMPORTANT to you? (without "don't know") Q7. Most important bicycle improvements Number Percent On-street bicycle facilities 251 57.3 % Off-street trails 269 61.4 % Bicycle parking 97 22.1 % Better directional signage along trails 87 19.9 % Total 704
Horizon 2040 Long Range Transportation Plan Survey - Report
Page 18
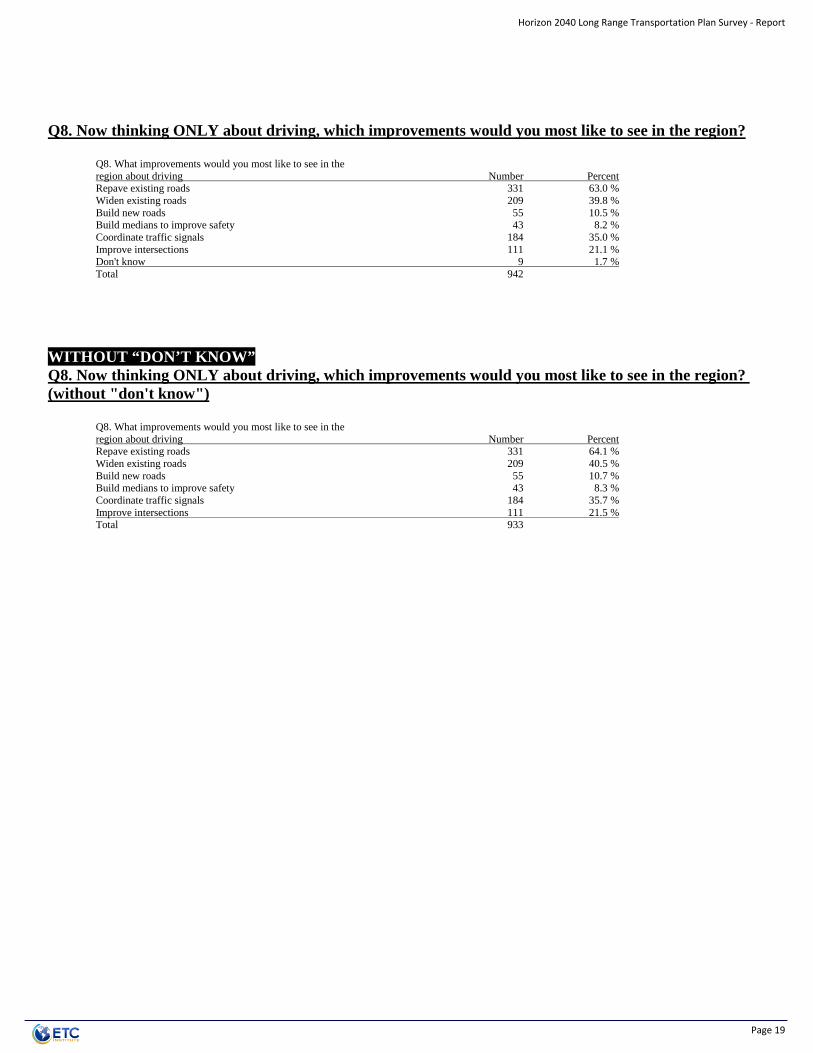
Q8. Now thinking ONLY about driving, which improvements would you most like to see in the region? Q8. What improvements would you most like to see in the region about driving Number Percent Repave existing roads 331 63.0 % Widen existing roads 209 39.8 % Build new roads 55 10.5 % Build medians to improve safety 43 8.2 % Coordinate traffic signals 184 35.0 % Improve intersections 111 21.1 % Don't know 9 1.7 % Total 942
WITHOUT “DON’T KNOW” Q8. Now thinking ONLY about driving, which improvements would you most like to see in the region? (without "don't know") Q8. What improvements would you most like to see in the region about driving Number Percent Repave existing roads 331 64.1 % Widen existing roads 209 40.5 % Build new roads 55 10.7 % Build medians to improve safety 43 8.3 % Coordinate traffic signals 184 35.7 % Improve intersections 111 21.5 % Total 933
Horizon 2040 Long Range Transportation Plan Survey - Report
Page 19
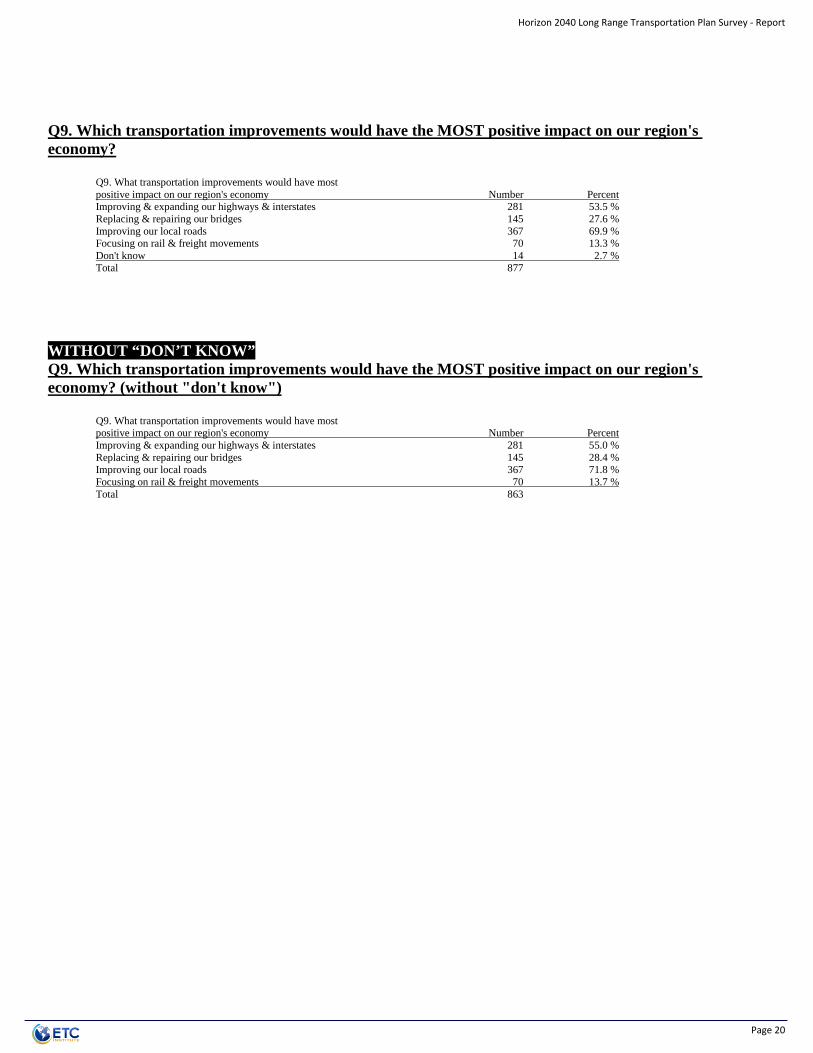
Q9. Which transportation improvements would have the MOST positive impact on our region's economy? Q9. What transportation improvements would have most positive impact on our region's economy Number Percent Improving & expanding our highways & interstates 281 53.5 % Replacing & repairing our bridges 145 27.6 % Improving our local roads 367 69.9 % Focusing on rail & freight movements 70 13.3 % Don't know 14 2.7 % Total 877
WITHOUT “DON’T KNOW” Q9. Which transportation improvements would have the MOST positive impact on our region's economy? (without "don't know") Q9. What transportation improvements would have most positive impact on our region's economy Number Percent Improving & expanding our highways & interstates 281 55.0 % Replacing & repairing our bridges 145 28.4 % Improving our local roads 367 71.8 % Focusing on rail & freight movements 70 13.7 % Total 863
Horizon 2040 Long Range Transportation Plan Survey - Report
Page 20

Q10. When considering transportation safety and security, we should be focusing on… Q10. What should we be focusing on when considering transportation safety & security Number Percent Improving safety 195 37.1 % Making travel times more predictable 63 12.0 % Reducing emergency response times 65 12.4 % Investing in smart transportation technologies 80 15.2 % Making it easier to bike & walk 100 19.0 % Don't know 22 4.2 % Total 525 100.0 %
WITHOUT “DON’T KNOW” Q10. When considering transportation safety and security, we should be focusing on… (without "don't know") Q10. What should we be focusing on when considering transportation safety & security Number Percent Improving safety 195 38.8 % Making travel times more predictable 63 12.5 % Reducing emergency response times 65 12.9 % Investing in smart transportation technologies 80 15.9 % Making it easier to bike & walk 100 19.9 % Total 503 100.0 %
Horizon 2040 Long Range Transportation Plan Survey - Report
Page 21

Q11. When making transportation decisions, we should consider… Q11. What should we consider when making transportation decisions Number Percent Economic development & job creation 166 31.6 % Making it easier to travel between home & work 242 46.1 % Connecting cities in our region 49 9.3 % Connecting our city to other areas of state & nation 46 8.8 % Don't know 22 4.2 % Total 525 100.0 %
WITHOUT “DON’T KNOW” Q11. When making transportation decisions, we should consider… (without "don't know") Q11. What should we consider when making transportation decisions Number Percent Economic development & job creation 166 33.0 % Making it easier to travel between home & work 242 48.1 % Connecting cities in our region 49 9.7 % Connecting our city to other areas of state & nation 46 9.1 % Total 503 100.0 %
Horizon 2040 Long Range Transportation Plan Survey - Report
Page 22
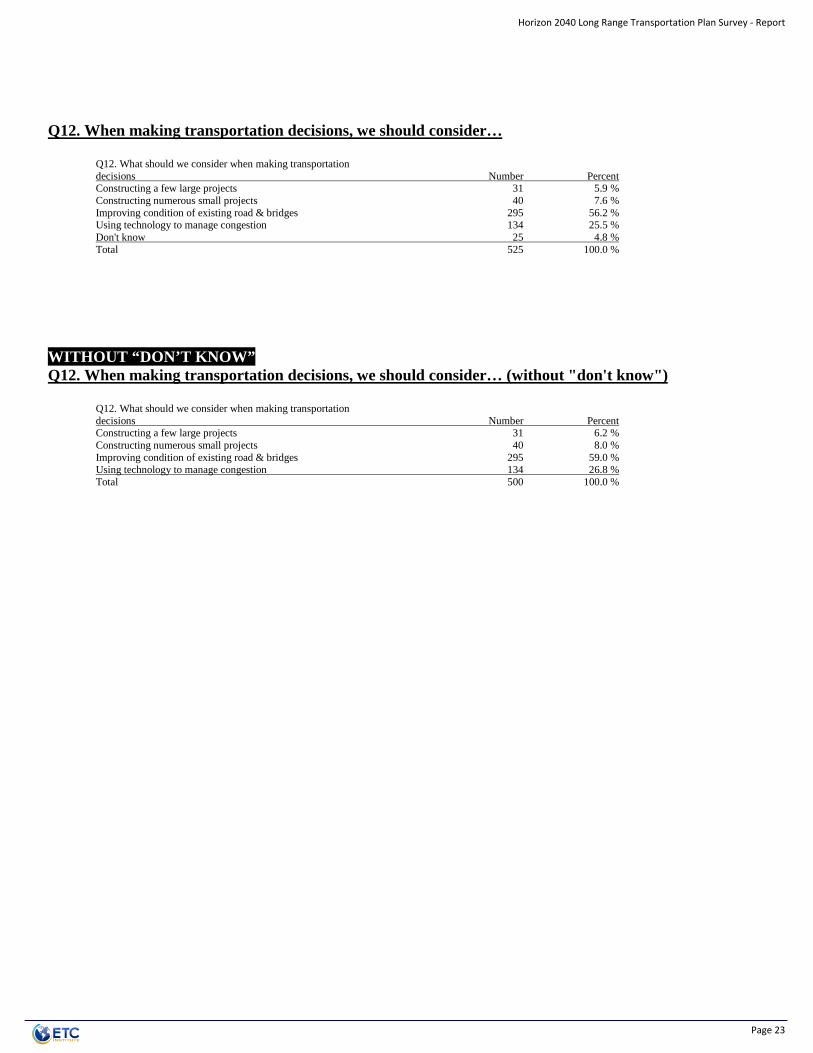
Q12. When making transportation decisions, we should consider… Q12. What should we consider when making transportation decisions Number Percent Constructing a few large projects 31 5.9 % Constructing numerous small projects 40 7.6 % Improving condition of existing road & bridges 295 56.2 % Using technology to manage congestion 134 25.5 % Don't know 25 4.8 % Total 525 100.0 %
WITHOUT “DON’T KNOW” Q12. When making transportation decisions, we should consider… (without "don't know") Q12. What should we consider when making transportation decisions Number Percent Constructing a few large projects 31 6.2 % Constructing numerous small projects 40 8.0 % Improving condition of existing road & bridges 295 59.0 % Using technology to manage congestion 134 26.8 % Total 500 100.0 %
Horizon 2040 Long Range Transportation Plan Survey - Report
Page 23

Q13. When making transportation decisions, we should consider… Q13. What should we consider when making transportation decisions Number Percent Protecting environment 127 24.2 % Preserving existing neighborhoods 120 22.9 % Providing access to cultural resources 19 3.6 % Designing streets based on nearby land use 213 40.6 % Don't know 46 8.8 % Total 525 100.0 %
WITHOUT “DON’T KNOW” Q13. When making transportation decisions, we should consider… (without "don't know") Q13. What should we consider when making transportation decisions Number Percent Protecting environment 127 26.5 % Preserving existing neighborhoods 120 25.1 % Providing access to cultural resources 19 4.0 % Designing streets based on nearby land use 213 44.5 % Total 479 100.0 %
Horizon 2040 Long Range Transportation Plan Survey - Report
Page 24

Q14. What is your age? Q14. Your age Number Percent Under 18 2 0.4 % 18 to 29 101 19.2 % 30 to 49 193 36.8 % 50 to 65 147 28.0 % 66+ 78 14.9 % Refused 4 0.8 % Total 525 100.0 %
WITHOUT “REFUSED” Q14. What is your age? (without "refused") Q14. Your age Number Percent Under 18 2 0.4 % 18 to 29 101 19.4 % 30 to 49 193 37.0 % 50 to 65 147 28.2 % 66+ 78 15.0 % Total 521 100.0 %
Q15. Would you say your total Household income is: Q15. Your total household income Number Percent Under $20K 29 5.5 % $20K to $34,999 52 9.9 % $35K to $49,999 60 11.4 % $50K to $99,999 186 35.4 % $100K to $199,999 112 21.3 % $200K+ 26 5.0 % Refused 60 11.4 % Total 525 100.0 %
WITHOUT “REFUSED” Q15. Would you say your total Household income is: (without "refused") Q15. Your total household income Number Percent Under $20K 29 6.2 % $20K to $34,999 52 11.2 % $35K to $49,999 60 12.9 % $50K to $99,999 186 40.0 % $100K to $199,999 112 24.1 % $200K+ 26 5.6 % Total 465 100.0 %
Horizon 2040 Long Range Transportation Plan Survey - Report
Page 25

Q16. Are you of Hispanic or Latino origin? Q16. Are you of Hispanic or Latino origin Number Percent Yes 21 4.0 % No 476 90.7 % Refused 28 5.3 % Total 525 100.0 %
WITHOUT “REFUSED” Q16. Are you of Hispanic or Latino origin? (without "refused") Q16. Are you of Hispanic or Latino origin Number Percent Yes 21 4.2 % No 476 95.8 % Total 497 100.0 %
Q17. Which of the following best describes your race? Q17. Your race Number Percent African American/Black 54 10.3 % Native American/Aleut 8 1.5 % Asian/Pacific Islander 10 1.9 % White/Caucasian 419 80.1 % Refused 49 9.4 % Total 540
WITHOUT “REFUSED” Q17. Which of the following best describes your race? (without "refused") Q17. Your race Number Percent African American/Black 54 11.4 % Native American/Aleut 8 1.7 % Asian/Pacific Islander 10 2.1 % White/Caucasian 419 88.4 % Total 491
Horizon 2040 Long Range Transportation Plan Survey - Report
Page 26

Q18. Your gender: Q18. Your gender Number Percent Male 254 48.4 % Female 267 50.9 % Prefer not to answer 4 0.8 % Total 525 100.0 %
WITHOUT “PREFER NOT TO ANSWER” Q18. Your gender: (without "prefer not to answer") Q18. Your gender Number Percent Male 254 48.8 % Female 267 51.2 % Total 521 100.0 %
Horizon 2040 Long Range Transportation Plan Survey - Report
Page 27
Section 3 Survey Instrument
Horizon 2040 Long Range Transportation Plan Survey - Report
Page 28
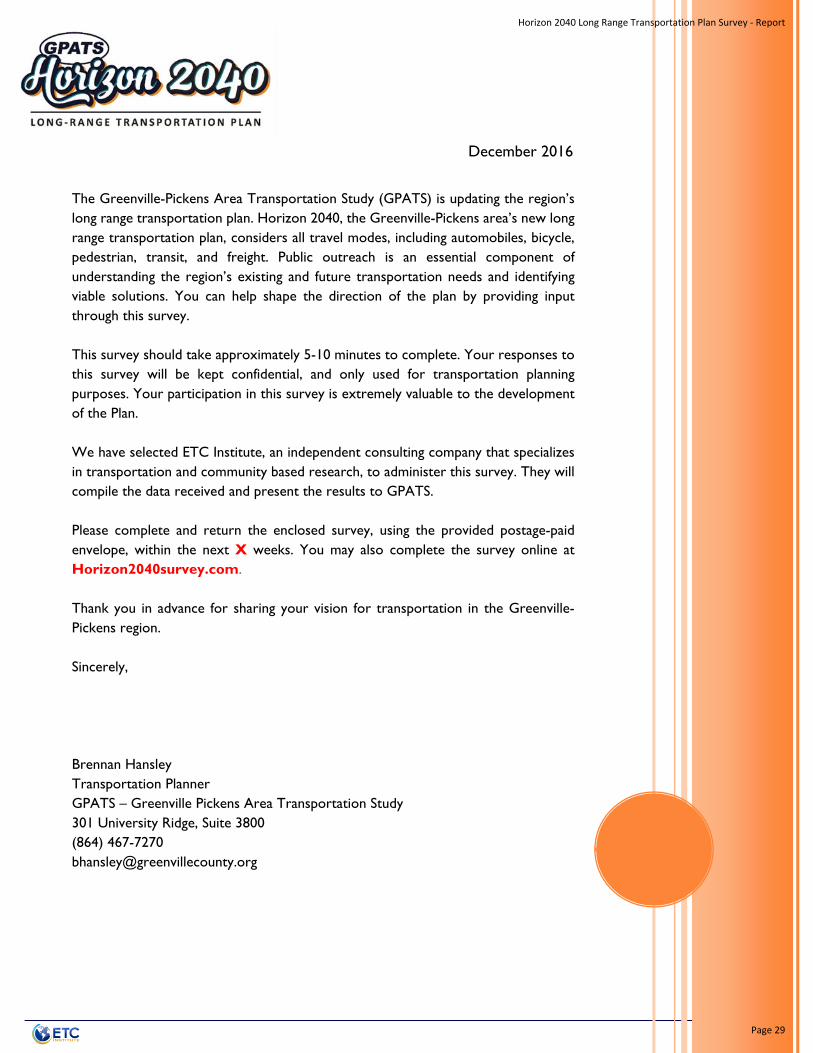
December 2016
The Greenville-Pickens Area Transportation Study (GPATS) is updating the region’s long range transportation plan. Horizon 2040, the Greenville-Pickens area’s new long range transportation plan, considers all travel modes, including automobiles, bicycle, pedestrian, transit, and freight. Public outreach is an essential component of understanding the region’s existing and future transportation needs and identifying viable solutions. You can help shape the direction of the plan by providing input through this survey. This survey should take approximately 5-10 minutes to complete. Your responses to this survey will be kept confidential, and only used for transportation planning purposes. Your participation in this survey is extremely valuable to the development of the Plan. We have selected ETC Institute, an independent consulting company that specializes in transportation and community based research, to administer this survey. They will compile the data received and present the results to GPATS. Please complete and return the enclosed survey, using the provided postage-paid envelope, within the next X weeks. You may also complete the survey online at Horizon2040survey.com. Thank you in advance for sharing your vision for transportation in the Greenville-Pickens region. Sincerely, Brennan Hansley Transportation Planner GPATS – Greenville Pickens Area Transportation Study 301 University Ridge, Suite 3800 (864) 467-7270 [email protected]
Horizon 2040 Long Range Transportation Plan Survey - Report
Page 29
Horizon 2040 Long Range Transportation Plan Survey
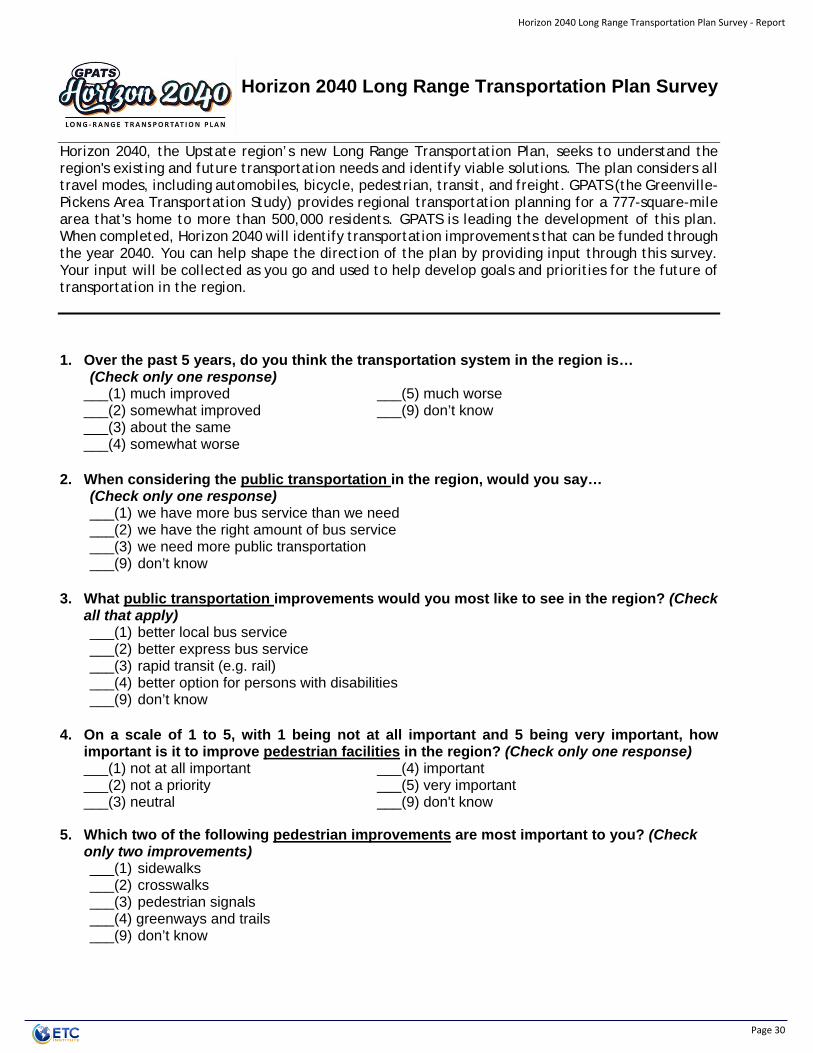
Horizon 2040, the Upstate region’s new Long Range Transportation Plan, seeks to understand the region's existing and future transportation needs and identify viable solutions. The plan considers all travel modes, including automobiles, bicycle, pedestrian, transit, and freight. GPATS (the Greenville-Pickens Area Transportation Study) provides regional transportation planning for a 777-square-mile area that's home to more than 500,000 residents. GPATS is leading the development of this plan. When completed, Horizon 2040 will identify transportation improvements that can be funded through the year 2040. You can help shape the direction of the plan by providing input through this survey. Your input will be collected as you go and used to help develop goals and priorities for the future of transportation in the region.
1. Over the past 5 years, do you think the transportation system in the region is…(Check only one response)
___(1) much improved ___(2) somewhat improved ___(3) about the same___(4) somewhat worse
___(5) much worse___(9) don’t know
2. When considering the public transportation in the region, would you say…(Check only one response)___(1) we have more bus service than we need___(2) we have the right amount of bus service___(3) we need more public transportation___(9) don’t know
3. What public transportation improvements would you most like to see in the region? (Checkall that apply)___(1) better local bus service___(2) better express bus service___(3) rapid transit (e.g. rail)___(4) better option for persons with disabilities___(9) don’t know
4. On a scale of 1 to 5, with 1 being not at all important and 5 being very important, howimportant is it to improve pedestrian facilities in the region? (Check only one response)___(1) not at all important ___(2) not a priority ___(3) neutral
___(4) important ___(5) very important ___(9) don't know
5. Which two of the following pedestrian improvements are most important to you? (Checkonly two improvements)___(1) sidewalks___(2) crosswalks___(3) pedestrian signals___(4) greenways and trails___(9) don’t know
Horizon 2040 Long Range Transportation Plan Survey - Report
Page 30

6. On a scale of 1 to 5, with 1 being not at all important and 5 being very important, how
important is it to improve bicycle facilities in the region? (Check only one response) ___(1) not at all important ___(2) not a priority ___(3) neutral
___(4) important ___(5) very important ___(9) don't know
7. Which two of the following bicycle improvements are most important to you? (Check only
two improvements)___(1) on-street bicycle facilities ___(2) off-street trails ___(3) bicycle parking ___(4) better directional signage along trails ___(9) don’t know
8. Now thinking ONLY about driving, which improvements would you most like to see in the
region? (Check only two improvements)___(1) repave existing roads ___(2) widen existing roads ___(3) build new roads ___(4) build medians to improve safety ___(5) coordinate traffic signals ___(6) improve intersections ___(7) no improvements ___(9) don’t know
9. Which transportation improvements would have the MOST positive impact on our region’s economy? (Check only two improvements)___(1) improving and expanding our highways and interstates ___(2) replacing and repairing our bridges ___(3) improving our local roads ___(4) focusing on rail and freight movements ___(9) don’t know
10. When considering transportation safety and security, we should be focusing on… (Check only ONE item)
___(1) improving safety ___(2) making travel times more predictable ___(3) reducing emergency response times ___(4) investing in smart transportation technologies (e.g. web-based travel information, variable
message signs, etc.) ___(5) making it easier to bike and walk ___(9) don’t know
11. When making transportation decisions, we should consider… (Check only ONE item)
___(1) economic development and job creation ___(2) making it easier to travel between home and work ___(3) connecting cities in our region ___(4) connecting our city to other areas of the state and nation ___(9) don’t know
Horizon 2040 Long Range Transportation Plan Survey - Report
Page 31
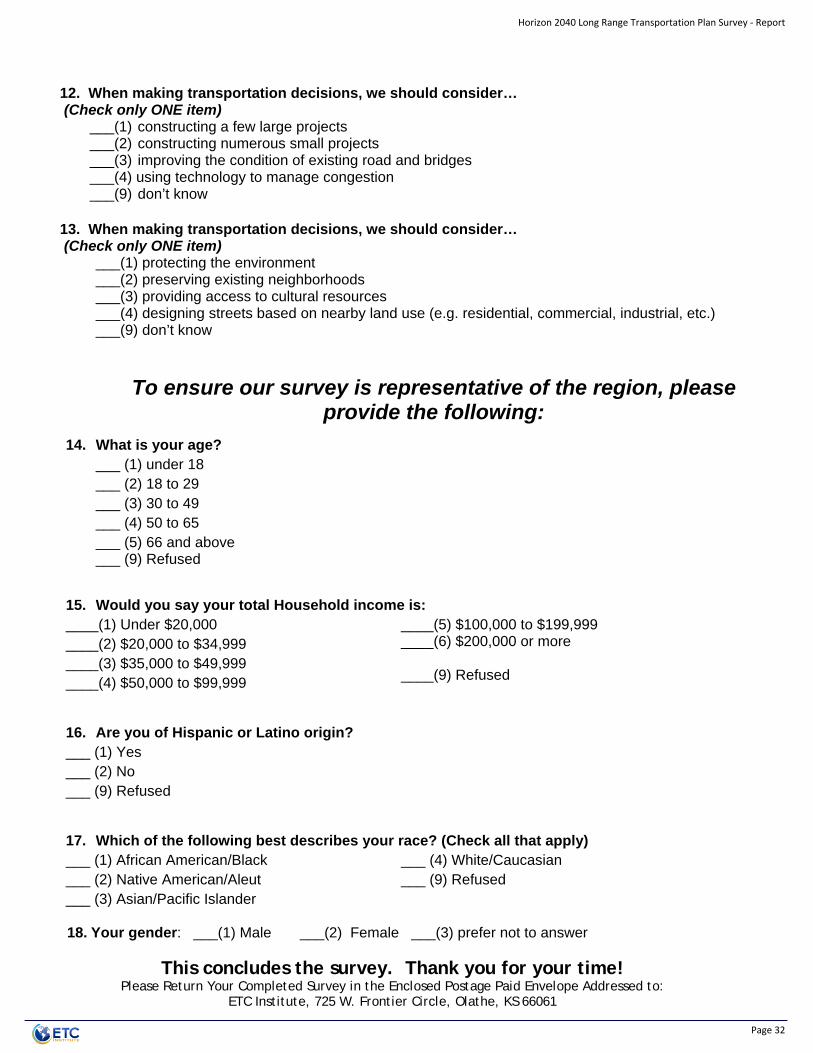
12. When making transportation decisions, we should consider… (Check only ONE item)
___(1) constructing a few large projects ___(2) constructing numerous small projects ___(3) improving the condition of existing road and bridges ___(4) using technology to manage congestion ___(9) don’t know
13. When making transportation decisions, we should consider… (Check only ONE item)
___(1) protecting the environment ___(2) preserving existing neighborhoods ___(3) providing access to cultural resources ___(4) designing streets based on nearby land use (e.g. residential, commercial, industrial, etc.) ___(9) don’t know
To ensure our survey is representative of the region, please provide the following:
14. What is your age? ___ (1) under 18
___ (2) 18 to 29
___ (3) 30 to 49 ___ (4) 50 to 65
___ (5) 66 and above ___ (9) Refused
15. Would you say your total Household income is: ____(1) Under $20,000
____(2) $20,000 to $34,999
____(3) $35,000 to $49,999
____(4) $50,000 to $99,999
____(5) $100,000 to $199,999 ____(6) $200,000 or more ____(9) Refused
16. Are you of Hispanic or Latino origin? ___ (1) Yes
___ (2) No
___ (9) Refused
17. Which of the following best describes your race? (Check all that apply) ___ (1) African American/Black
___ (2) Native American/Aleut
___ (3) Asian/Pacific Islander
___ (4) White/Caucasian
___ (9) Refused
18. Your gender: ___(1) Male ___(2) Female ___(3) prefer not to answer
This concludes the survey. Thank you for your time!
Please Return Your Completed Survey in the Enclosed Postage Paid Envelope Addressed to: ETC Institute, 725 W. Frontier Circle, Olathe, KS 66061
Horizon 2040 Long Range Transportation Plan Survey - Report
Page 32