appendix a - wordpress.com...almono lp 2 pa 837 pedestrian bridge new pedestrian bridge on sr 837...
TRANSCRIPT

Appendix A Background Plans / Studies

Appendix A | State Route 885 / Second Avenue Multimodal Corridor Study p. 1
Study Area Planned Projects (by Others) LIST
PROJECT NAME PROJECT DESCRIPTION STATUS SPONSOR
PEDESTRIAN AND BICYCLE PROJECTS
1 Blair Street Bike Path (Hazelwood Green)
On-street bike facilities on Blair Street through Hazelwood Green development to Hazelwood Ave
Constructed. Will be open to the public soon
City of Pittsburgh / Almono LP
2 PA 837 Pedestrian Bridge
New pedestrian bridge on SR 837 adjacent to SR885 at the Glenwood Interchange
In Development (completion ~2021)
PennDOT / TIP
TRANSIT PROJECTS
3 Route Modification for PAAC Bus Route 57
Imminent PAAC
4 Bus Rapid Transit – East End /Oakland / Downtown
Bus rapid transit routing (non-stop) between downtown and Oakland / East end areas
In Design Development URA / PAAC
5 PAAC Oakland BRT Signal Improvements
Smart Spines project includes signal upgrades on 2nd Avenue
Funding identified for short-term (2017-2020)
SPC / LRTP
ROADWAY/TRAFFIC PROJECTS
6 Almono -TIIF Highway Construction
Construction of on- and off-site transportation improvements and site utility infrastructure
In Development (completion ~2021)
Almono LP / PennDOT / TIP
7 Parkway East Improvements
Parkway East (Downtown to Monroeville) corridor safety improvements
In Development (completion ~2021)
PennDOT / TIP
8 Bates Street Reconstruction and Capacity Upgrades
Funding identified for long-term (2029 - 2040)
SPC / LRTP
9 Boulevard of the Allies Resurfacing
Resurfacing on Boulevard of the Allies from Bates Street to Interchange Ramp; includes ped improvements in Second Avenue Study Area
In Development (completion ~2020)
PennDOT / TIP
BRIDGE PROJECTS
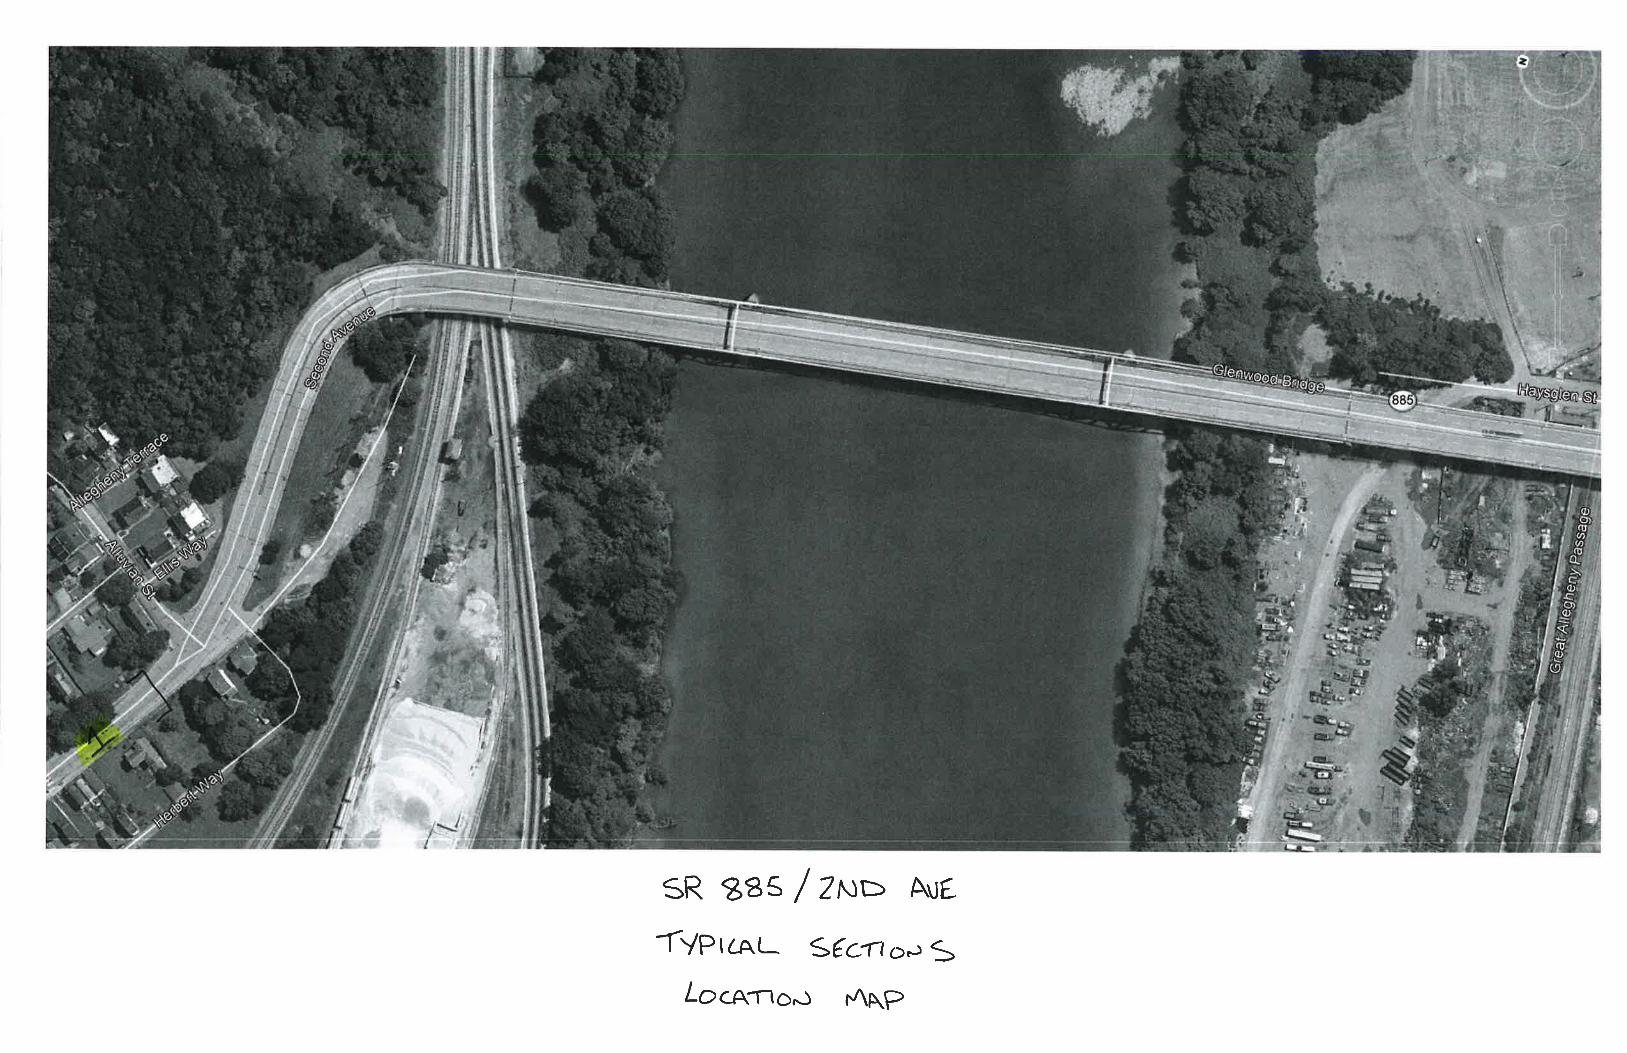
10 Glenwood Bridge Preservation (MA08)
Preservation on Glenwood Bridge (SR 885) over the Monongahela River
In Development (completion ~2021)
Allegheny County / TIP
11 Swinburne Bridge Restoration
Rehabilitation for the Swinburne Bridge in Junction Hollow
In Development (completion ~2024)
City of Pittsburgh / TIP

Appendix A | State Route 885 / Second Avenue Multimodal Corridor Study p. 2
12 Charles Anderson Bridge Replacement
Replacement/rehabilitation on Charles Anderson Bridge (Boulevard of the Allies) over Schenley Park
In Development City of Pittsburgh / TIP
13 Boulevard of the Allies Ramps Bridge Preservation
Preservation on several ramps on PA 885 AND SR 8004 over I-376 at Birmingham Bridge
In Development (completion ~2023)
PennDOT / TIP
14 Boulevard of the Allies Ramp U Bridge Preservation
Preservation on Ramp U of PA 885 (Boulevard of Allies) at Brady Street
Under Construction (completion ~2019)
PennDOT / TIP
15 Armstrong Tunnel Bridge Restoration (AR01)
Restoration for the Armstrong Tunnel, including retiling, cleaning and improvements to the drainage system
In Development (completion ~2021)
Allegheny County / TIP
16 10th Street Bridge Rehabilitation
Funding identified for short-term (2017-2020)
SPC / LRTP
17 Glenwood Bridge Ramps Rehabilitation
Planned project but no funding identified yet.
Planned SPC / LRTP

Appendix A | State Route 885 / Second Avenue Multimodal Corridor Study p. 3
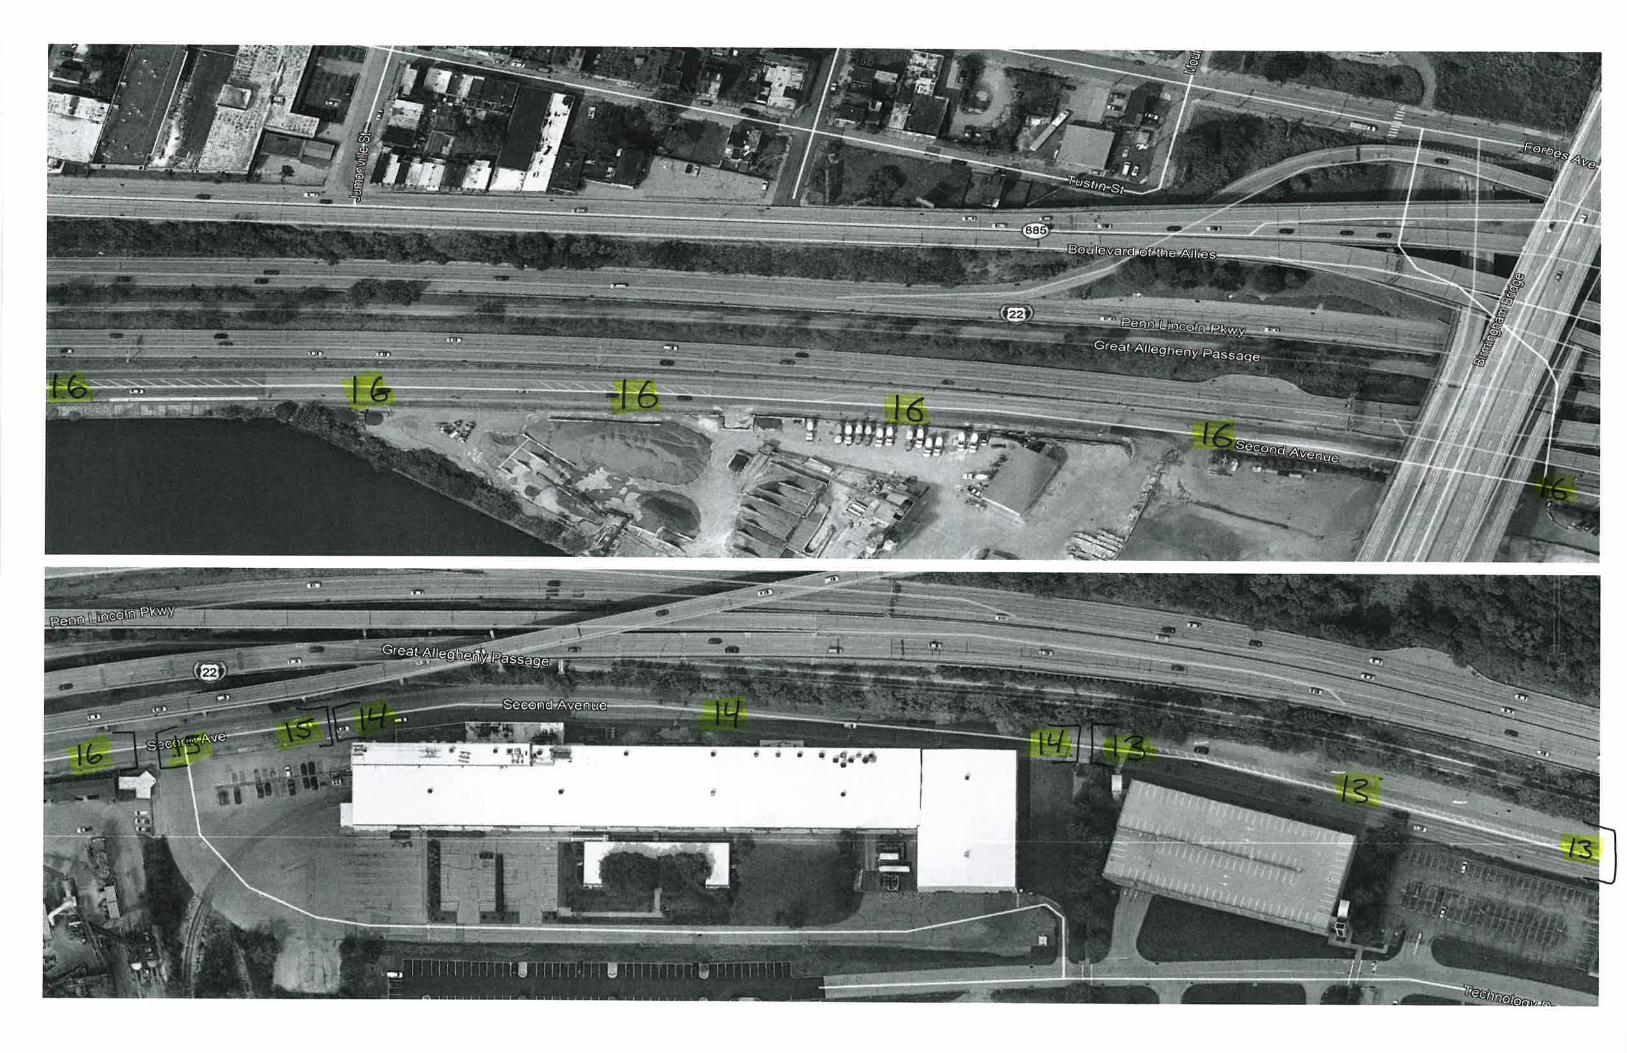
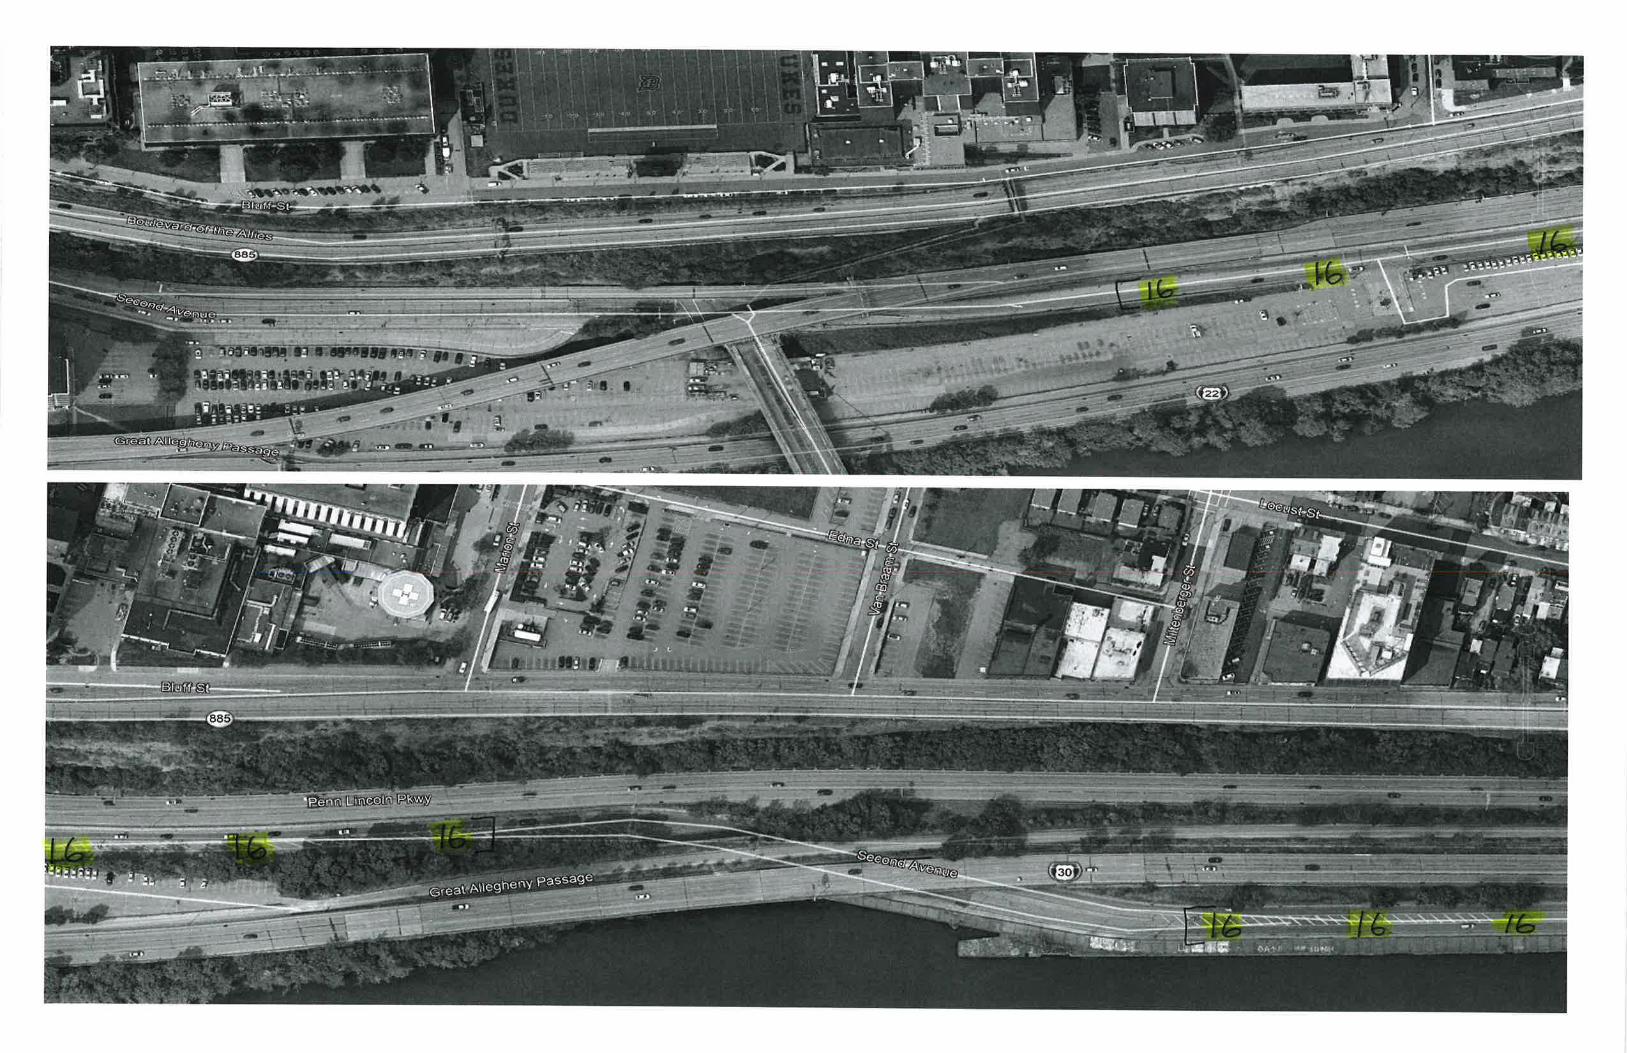
Study Area Planned Projects (by Others) MAP
Appendix A | State Route 885 / Second Avenue Multimodal Corridor Study p. 4
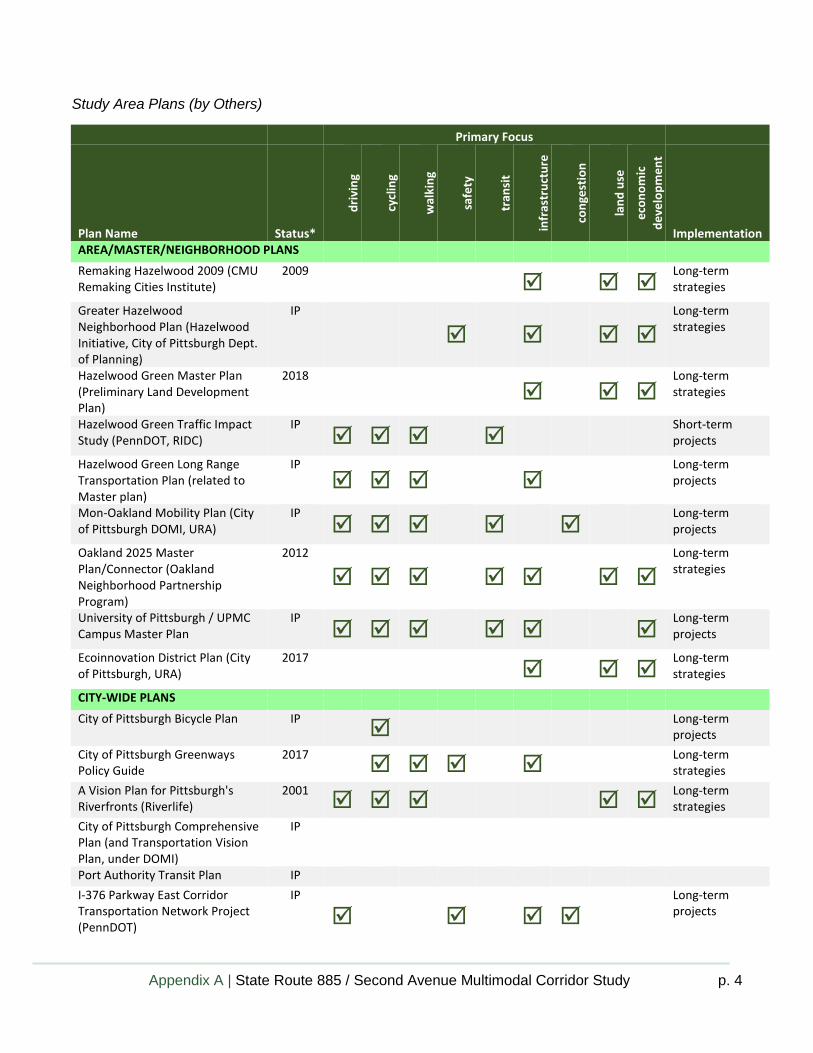
Study Area Plans (by Others)
Primary Focus
Plan Name Status*
dri
vin
g
cycl
ing
wal
kin
g
safe
ty
tran
sit
infr
astr
uct
ure
con
gest
ion
lan
d u
se
eco
no
mic
de
velo
pm
en
t
Implementation AREA/MASTER/NEIGHBORHOOD PLANS
Remaking Hazelwood 2009 (CMU Remaking Cities Institute)
2009
Long-term strategies
Greater Hazelwood Neighborhood Plan (Hazelwood Initiative, City of Pittsburgh Dept. of Planning)
IP
Long-term strategies
Hazelwood Green Master Plan (Preliminary Land Development Plan)
2018
Long-term strategies
Hazelwood Green Traffic Impact Study (PennDOT, RIDC)
IP
Short-term projects
Hazelwood Green Long Range Transportation Plan (related to Master plan)
IP
Long-term projects
Mon-Oakland Mobility Plan (City of Pittsburgh DOMI, URA)
IP
Long-term projects
Oakland 2025 Master Plan/Connector (Oakland Neighborhood Partnership Program)
2012
Long-term strategies
University of Pittsburgh / UPMC Campus Master Plan
IP
Long-term projects
Ecoinnovation District Plan (City of Pittsburgh, URA)
2017
Long-term strategies
CITY-WIDE PLANS City of Pittsburgh Bicycle Plan IP
Long-term projects
City of Pittsburgh Greenways Policy Guide
2017
Long-term strategies
A Vision Plan for Pittsburgh's Riverfronts (Riverlife)
2001
Long-term strategies
City of Pittsburgh Comprehensive Plan (and Transportation Vision Plan, under DOMI)
IP
Port Authority Transit Plan IP
I-376 Parkway East Corridor Transportation Network Project (PennDOT)
IP
Long-term projects
Appendix A | State Route 885 / Second Avenue Multimodal Corridor Study p. 5
Plan Name Status*
Primary Focus
Implementation
dri
vin
g
cycl
ing
wal
kin
g
safe
ty
tran
sit
infr
astr
uct
ure
con
gest
ion
lan
d u
se
eco
no
mic
de
velo
pm
en
t
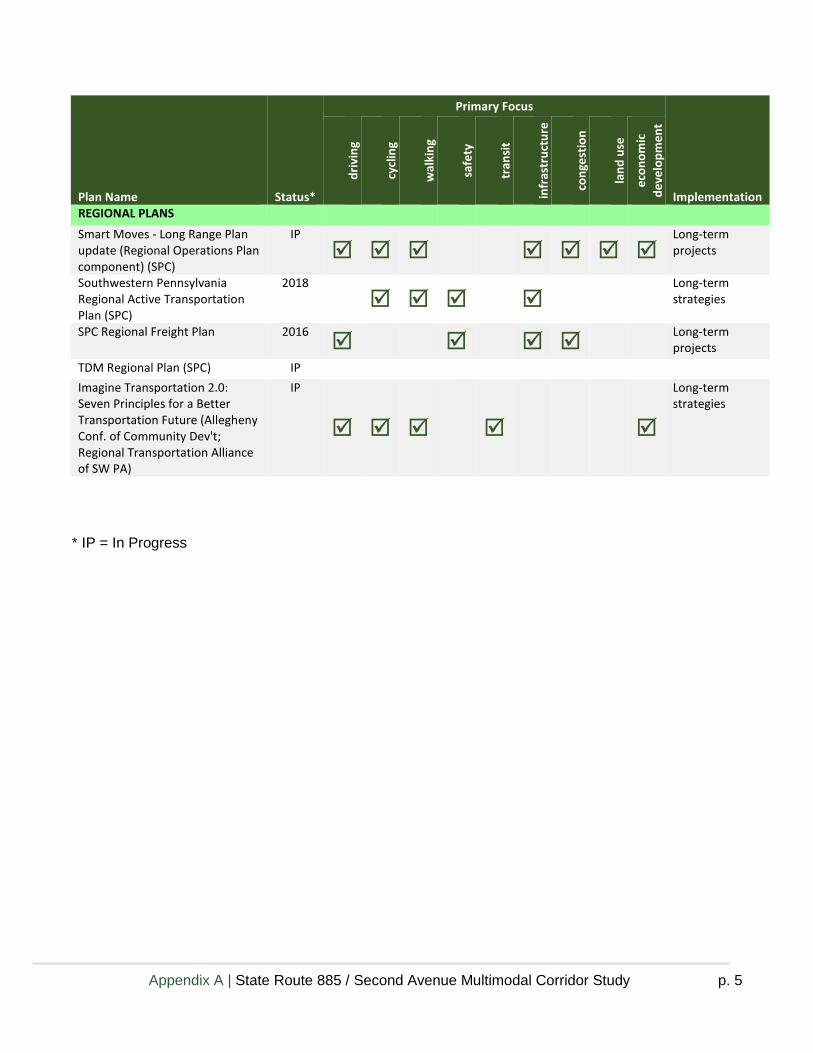
REGIONAL PLANS Smart Moves - Long Range Plan update (Regional Operations Plan component) (SPC)
IP
Long-term projects
Southwestern Pennsylvania Regional Active Transportation Plan (SPC)
2018
Long-term strategies
SPC Regional Freight Plan 2016
Long-term projects
TDM Regional Plan (SPC) IP Imagine Transportation 2.0: Seven Principles for a Better Transportation Future (Allegheny Conf. of Community Dev't; Regional Transportation Alliance of SW PA)
IP
Long-term strategies
* IP = In Progress
Appendix B Traffic Volume Data

0%
10%
20%
30%
40%
50%
60%
70%
80%
90%
100%
0
200
400
600
800
1,000
1,200
1,400
1,600
Ho
url
y T
raff
ic V
olu
me
(vp
h)
Start Time
ADT Site #1 SummarySR 885/2nd Ave @ North of Glenwood Bridge
Average Weekday Traffic by Direction
NB
SB
Directional Distribution

0%
10%
20%
30%
40%
50%
60%
70%
80%
90%
100%
0
200
400
600
800
1,000
1,200
1,400
1,600
Ho
url
y T
raff
ic V
olu
me
(vp
h)
Start Time
ADT Site #2 SummarySR 885/2nd Ave @ South of Hazelwood Ave
Average Weekday Traffic by Direction
NB
SB
Directional Distribution
0%
10%
20%
30%
40%
50%
60%
70%
80%
90%
100%
0
200
400
600
800
1,000
1,200
1,400
Ho
url
y T
raff
ic V
olu
me
(vp
h)
Start Time
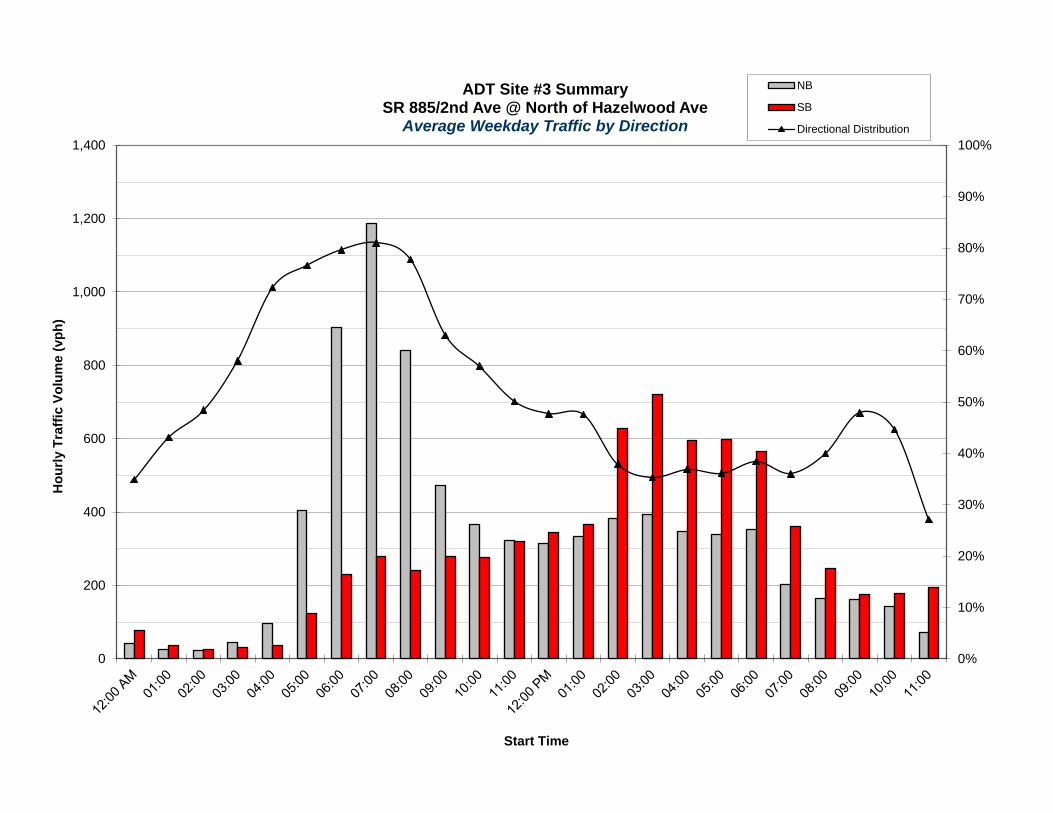
ADT Site #3 SummarySR 885/2nd Ave @ North of Hazelwood Ave
Average Weekday Traffic by Direction
NB
SB
Directional Distribution
0%
10%
20%
30%
40%
50%
60%
70%
80%
90%
100%
0
200
400
600
800
1,000
1,200
1,400
Ho
url
y T
raff
ic V
olu
me
(vp
h)
Start Time
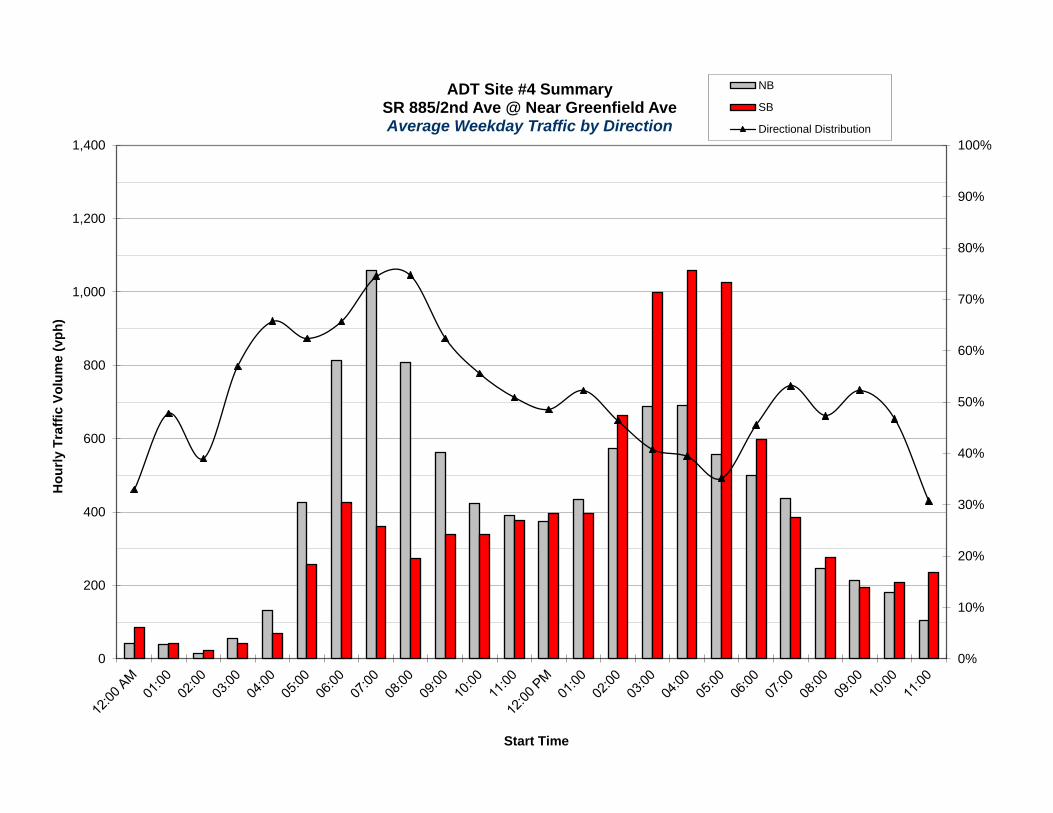
ADT Site #4 SummarySR 885/2nd Ave @ Near Greenfield AveAverage Weekday Traffic by Direction
NB
SB
Directional Distribution

0%
10%
20%
30%
40%
50%
60%
70%
80%
90%
100%
0
200
400
600
800
1,000
1,200
1,400
1,600
Ho
url
y T
raff
ic V
olu
me
(vp
h)
Start Time
ADT Site #5 SummarySR 885/2nd Ave @ South of 10th St Bridge
Average Weekday Traffic by Direction
NB
SB
Directional Distribution

0%
10%
20%
30%
40%
50%
60%
70%
80%
90%
100%
0
200
400
600
800
1,000
Ho
url
y T
raff
ic V
olu
me
(vp
h)
Start Time
ADT Site #6 SummarySR 885/2nd Ave @ Greenfield Ave
Average Weekday Traffic by Direction
EB
WB
Directional Distribution

File Name : 2nd & Elizabeth_AMSite Code : 17240014Start Date : 11/2/2017Page No : 1
Second Avenue and Elizabeth Street
Groups Printed- Pedestrians and BicyclesSecond Avenue
EastboundSecond Avenue
WestboundElizabeth Street
NorthboundElizabeth Street
SouthboundStart Time Left Thru Right Peds App. Total Left Thru Right Peds App. Total Left Thru Right Peds App. Total Left Thru Right Peds App. Total Int. Total
06:30 AM 0 0 0 0 0 0 0 0 9 9 0 0 0 0 0 0 0 0 3 3 1206:45 AM 0 0 0 1 1 0 0 0 2 2 0 0 0 0 0 1 0 0 3 4 7
Total 0 0 0 1 1 0 0 0 11 11 0 0 0 0 0 1 0 0 6 7 19
07:00 AM 0 0 0 0 0 0 0 0 13 13 0 0 0 0 0 0 0 0 3 3 1607:15 AM 0 0 0 1 1 0 0 0 3 3 0 0 0 0 0 0 0 0 4 4 807:30 AM 0 0 0 0 0 0 0 0 2 2 0 0 0 0 0 0 0 0 0 0 207:45 AM 0 0 0 2 2 0 0 0 2 2 0 0 0 0 0 0 0 0 0 0 4
Total 0 0 0 3 3 0 0 0 20 20 0 0 0 0 0 0 0 0 7 7 30
08:00 AM 0 0 0 0 0 0 0 0 11 11 0 0 0 0 0 0 0 0 0 0 1108:15 AM 0 0 0 1 1 0 0 0 7 7 0 0 0 4 4 2 0 0 0 2 1408:30 AM 0 0 0 0 0 0 0 0 15 15 0 0 0 2 2 0 0 0 1 1 1808:45 AM 0 0 0 2 2 0 0 0 7 7 0 0 0 1 1 0 0 0 2 2 12
Total 0 0 0 3 3 0 0 0 40 40 0 0 0 7 7 2 0 0 3 5 55
09:00 AM 0 1 0 2 3 0 0 0 1 1 0 0 0 0 0 0 0 0 0 0 409:15 AM 0 0 0 0 0 0 1 0 2 3 0 0 0 1 1 1 0 0 3 4 8
Grand Total 0 1 0 9 10 0 1 0 74 75 0 0 0 8 8 4 0 0 19 23 116Apprch % 0 10 0 90 0 1.3 0 98.7 0 0 0 100 17.4 0 0 82.6
Total % 0 0.9 0 7.8 8.6 0 0.9 0 63.8 64.7 0 0 0 6.9 6.9 3.4 0 0 16.4 19.8
Second AvenueEastbound
Second AvenueWestbound
Elizabeth StreetNorthbound
Elizabeth StreetSouthbound
Start Time Left Thru Right Peds App. Total Thru Right Peds App. Total Thru Right Peds App. Total Thru Right Peds App. Total Int. Total
Peak Hour Analysis From 06:30 AM to 09:15 AM - Peak 1 of 1Peak Hour for Entire Intersection Begins at 08:00 AM
08:00 AM 0 0 0 0 0 0 0 0 11 11 0 0 0 0 0 0 0 0 0 0 1108:15 AM 0 0 0 1 1 0 0 0 7 7 0 0 0 4 4 2 0 0 0 2 1408:30 AM 0 0 0 0 0 0 0 0 15 15 0 0 0 2 2 0 0 0 1 1 1808:45 AM 0 0 0 2 2 0 0 0 7 7 0 0 0 1 1 0 0 0 2 2 12Total Volume 0 0 0 3 3 0 0 0 40 40 0 0 0 7 7 2 0 0 3 5 55% App. Total 0 0 0 100 0 0 0 100 0 0 0 100 40 0 0 60
PHF .000 .000 .000 .375 .375 .000 .000 .000 .667 .667 .000 .000 .000 .438 .438 .250 .000 .000 .375 .625 .764

File Name : 2nd & Elizabeth_AMSite Code : 17240014Start Date : 11/2/2017Page No : 1
Second Avenue and Elizabeth Street
Groups Printed- Typical Vehicles - Heavy Duty VehiclesSecond Avenue
EastboundSecond Avenue
WestboundElizabeth Street
NorthboundElizabeth Street
Southbound
Start Time Left Thru RightRt. on
RedApp. Total Left Thru Right
Rt. on
RedApp. Total Left Thru Right
Rt. on
RedApp. Total Left Thru Right
Rt. on
RedApp. Total Int. Total
06:30 AM 0 77 0 0 77 1 240 0 0 241 1 2 1 0 4 1 1 1 0 3 32506:45 AM 0 69 2 0 71 3 277 1 0 281 0 0 0 0 0 0 1 1 0 2 354
Total 0 146 2 0 148 4 517 1 0 522 1 2 1 0 4 1 2 2 0 5 679
07:00 AM 1 82 0 0 83 1 278 0 0 279 0 1 2 0 3 3 3 2 0 8 37307:15 AM 1 97 1 0 99 2 304 0 0 306 0 1 1 0 2 1 3 3 0 7 41407:30 AM 0 79 0 0 79 7 356 2 0 365 1 1 0 0 2 2 1 3 0 6 45207:45 AM 1 105 1 0 107 5 346 0 0 351 3 2 0 0 5 0 1 3 0 4 467
Total 3 363 2 0 368 15 1284 2 0 1301 4 5 3 0 12 6 8 11 0 25 1706
08:00 AM 0 73 0 0 73 0 296 1 0 297 1 2 1 0 4 0 1 3 0 4 37808:15 AM 1 86 1 0 88 9 299 0 0 308 1 4 0 0 5 3 5 3 0 11 41208:30 AM 0 57 0 0 57 3 235 3 0 241 1 2 4 0 7 3 2 2 0 7 31208:45 AM 3 91 0 0 94 2 220 3 0 225 3 1 0 0 4 0 2 10 0 12 335
Total 4 307 1 0 312 14 1050 7 0 1071 6 9 5 0 20 6 10 18 0 34 1437
09:00 AM 4 75 3 0 82 4 177 3 0 184 2 2 1 0 5 1 2 4 0 7 27809:15 AM 4 81 4 0 89 1 160 1 0 162 2 0 3 0 5 3 1 3 0 7 263
Grand Total 15 972 12 0 999 38 3188 14 0 3240 15 18 13 0 46 17 23 38 0 78 4363Apprch % 1.5 97.3 1.2 0 1.2 98.4 0.4 0 32.6 39.1 28.3 0 21.8 29.5 48.7 0
Total % 0.3 22.3 0.3 0 22.9 0.9 73.1 0.3 0 74.3 0.3 0.4 0.3 0 1.1 0.4 0.5 0.9 0 1.8Typical Vehicles 3068
% Typical Vehicles 100 88.7 100 0 89 92.1 96.2 64.3 0 96 86.7 100 92.3 0 93.5 88.2 95.7 94.7 0 93.6 94.4Heavy Duty Vehicles
% Heavy Duty Vehicles 0 11.3 0 0 11 7.9 3.8 35.7 0 4 13.3 0 7.7 0 6.5 11.8 4.3 5.3 0 6.4 5.6
Second AvenueEastbound
Second AvenueWestbound
Elizabeth StreetNorthbound
Elizabeth StreetSouthbound
Start Time Left Thru RightRt. on
RedApp. Total Left Thru Right
Rt. on
RedApp. Total Left Thru Right
Rt. on
RedApp. Total Left Thru Right
Rt. on
RedApp. Total Int. Total
Peak Hour Analysis From 06:30 AM to 09:15 AM - Peak 1 of 1Peak Hour for Entire Intersection Begins at 07:15 AM
07:15 AM 1 97 1 0 99 2 304 0 0 306 0 1 1 0 2 1 3 3 0 7 41407:30 AM 0 79 0 0 79 7 356 2 0 365 1 1 0 0 2 2 1 3 0 6 45207:45 AM 1 105 1 0 107 5 346 0 0 351 3 2 0 0 5 0 1 3 0 4 46708:00 AM 0 73 0 0 73 0 296 1 0 297 1 2 1 0 4 0 1 3 0 4 378Total Volume 2 354 2 0 358 14 1302 3 0 1319 5 6 2 0 13 3 6 12 0 21 1711% App. Total 0.6 98.9 0.6 0 1.1 98.7 0.2 0 38.5 46.2 15.4 0 14.3 28.6 57.1 0
PHF .500 .843 .500 .000 .836 .500 .914 .375 .000 .903 .417 .750 .500 .000 .650 .375 .500 1.00 .000 .750 .916Typical Vehicles 1265
% Typical Vehicles 100 89.3 100 0 89.4 92.9 97.2 100 0 97.1 100 100 50.0 0 92.3 66.7 100 91.7 0 90.5 95.4Heavy Duty Vehicles
% Heavy Duty Vehicles 0 10.7 0 0 10.6 7.1 2.8 0 0 2.9 0 0 50.0 0 7.7 33.3 0 8.3 0 9.5 4.6
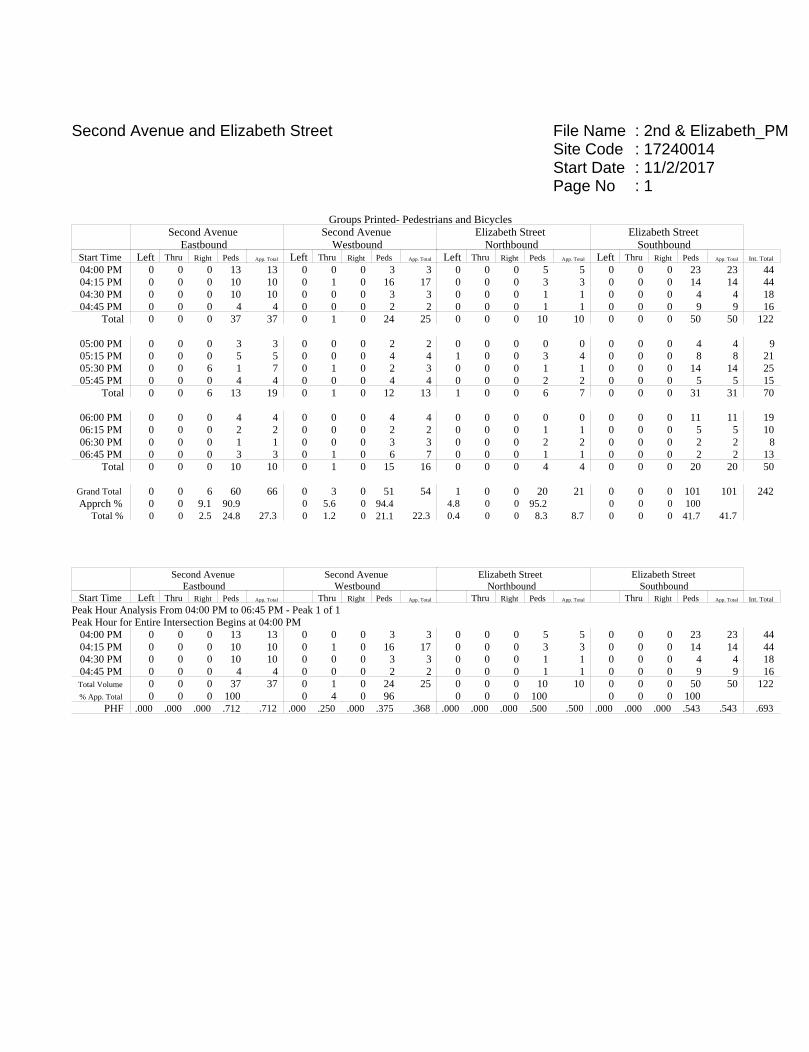
File Name : 2nd & Elizabeth_PMSite Code : 17240014Start Date : 11/2/2017Page No : 1
Second Avenue and Elizabeth Street
Groups Printed- Pedestrians and BicyclesSecond Avenue
EastboundSecond Avenue
WestboundElizabeth Street
NorthboundElizabeth Street
SouthboundStart Time Left Thru Right Peds App. Total Left Thru Right Peds App. Total Left Thru Right Peds App. Total Left Thru Right Peds App. Total Int. Total
04:00 PM 0 0 0 13 13 0 0 0 3 3 0 0 0 5 5 0 0 0 23 23 4404:15 PM 0 0 0 10 10 0 1 0 16 17 0 0 0 3 3 0 0 0 14 14 4404:30 PM 0 0 0 10 10 0 0 0 3 3 0 0 0 1 1 0 0 0 4 4 1804:45 PM 0 0 0 4 4 0 0 0 2 2 0 0 0 1 1 0 0 0 9 9 16
Total 0 0 0 37 37 0 1 0 24 25 0 0 0 10 10 0 0 0 50 50 122
05:00 PM 0 0 0 3 3 0 0 0 2 2 0 0 0 0 0 0 0 0 4 4 905:15 PM 0 0 0 5 5 0 0 0 4 4 1 0 0 3 4 0 0 0 8 8 2105:30 PM 0 0 6 1 7 0 1 0 2 3 0 0 0 1 1 0 0 0 14 14 2505:45 PM 0 0 0 4 4 0 0 0 4 4 0 0 0 2 2 0 0 0 5 5 15
Total 0 0 6 13 19 0 1 0 12 13 1 0 0 6 7 0 0 0 31 31 70
06:00 PM 0 0 0 4 4 0 0 0 4 4 0 0 0 0 0 0 0 0 11 11 1906:15 PM 0 0 0 2 2 0 0 0 2 2 0 0 0 1 1 0 0 0 5 5 1006:30 PM 0 0 0 1 1 0 0 0 3 3 0 0 0 2 2 0 0 0 2 2 806:45 PM 0 0 0 3 3 0 1 0 6 7 0 0 0 1 1 0 0 0 2 2 13
Total 0 0 0 10 10 0 1 0 15 16 0 0 0 4 4 0 0 0 20 20 50
Grand Total 0 0 6 60 66 0 3 0 51 54 1 0 0 20 21 0 0 0 101 101 242Apprch % 0 0 9.1 90.9 0 5.6 0 94.4 4.8 0 0 95.2 0 0 0 100
Total % 0 0 2.5 24.8 27.3 0 1.2 0 21.1 22.3 0.4 0 0 8.3 8.7 0 0 0 41.7 41.7
Second AvenueEastbound
Second AvenueWestbound
Elizabeth StreetNorthbound
Elizabeth StreetSouthbound
Start Time Left Thru Right Peds App. Total Thru Right Peds App. Total Thru Right Peds App. Total Thru Right Peds App. Total Int. Total
Peak Hour Analysis From 04:00 PM to 06:45 PM - Peak 1 of 1Peak Hour for Entire Intersection Begins at 04:00 PM
04:00 PM 0 0 0 13 13 0 0 0 3 3 0 0 0 5 5 0 0 0 23 23 4404:15 PM 0 0 0 10 10 0 1 0 16 17 0 0 0 3 3 0 0 0 14 14 4404:30 PM 0 0 0 10 10 0 0 0 3 3 0 0 0 1 1 0 0 0 4 4 1804:45 PM 0 0 0 4 4 0 0 0 2 2 0 0 0 1 1 0 0 0 9 9 16Total Volume 0 0 0 37 37 0 1 0 24 25 0 0 0 10 10 0 0 0 50 50 122% App. Total 0 0 0 100 0 4 0 96 0 0 0 100 0 0 0 100
PHF .000 .000 .000 .712 .712 .000 .250 .000 .375 .368 .000 .000 .000 .500 .500 .000 .000 .000 .543 .543 .693

File Name : 2nd & Elizabeth_PMSite Code : 17240014Start Date : 11/2/2017Page No : 1
Second Avenue and Elizabeth Street
Groups Printed- Typical Vehicles - Heavy Duty VehiclesSecond Avenue
EastboundSecond Avenue
WestboundElizabeth Street
NorthboundElizabeth Street
Southbound
Start Time Left Thru RightRt. on
RedApp. Total Left Thru Right
Rt. on
RedApp. Total Left Thru Right
Rt. on
RedApp. Total Left Thru Right
Rt. on
RedApp. Total Int. Total
04:00 PM 1 177 1 0 179 1 94 1 0 96 2 2 8 8 20 5 2 1 0 8 30304:15 PM 1 187 0 0 188 2 118 0 0 120 2 3 4 0 9 10 7 4 0 21 33804:30 PM 1 213 3 0 217 3 95 0 0 98 1 0 5 0 6 4 2 4 0 10 33104:45 PM 0 214 0 0 214 6 117 2 0 125 1 0 6 0 7 3 1 3 0 7 353
Total 3 791 4 0 798 12 424 3 0 439 6 5 23 8 42 22 12 12 0 46 1325
05:00 PM 1 229 1 0 231 2 112 0 0 114 3 1 11 0 15 3 1 2 0 6 36605:15 PM 0 209 4 0 213 6 115 1 0 122 1 1 8 0 10 7 3 1 1 12 35705:30 PM 0 212 1 0 213 5 103 1 0 109 6 0 3 0 9 4 2 2 0 8 33905:45 PM 2 212 3 0 217 8 104 2 0 114 3 3 3 0 9 2 0 2 0 4 344
Total 3 862 9 0 874 21 434 4 0 459 13 5 25 0 43 16 6 7 1 30 1406
06:00 PM 4 197 2 0 203 5 101 2 0 108 2 2 9 0 13 3 4 1 0 8 33206:15 PM 3 162 1 0 166 10 96 1 0 107 4 0 2 0 6 1 0 4 0 5 28406:30 PM 1 154 3 0 158 8 87 0 0 95 2 0 6 0 8 1 3 1 0 5 26606:45 PM 2 104 0 0 106 0 70 6 0 76 5 2 4 0 11 2 1 3 0 6 199
Total 10 617 6 0 633 23 354 9 0 386 13 4 21 0 38 7 8 9 0 24 1081
Grand Total 16 2270 19 0 2305 56 1212 16 0 1284 32 14 69 8 123 45 26 28 1 100 3812Apprch % 0.7 98.5 0.8 0 4.4 94.4 1.2 0 26 11.4 56.1 6.5 45 26 28 1
Total % 0.4 59.5 0.5 0 60.5 1.5 31.8 0.4 0 33.7 0.8 0.4 1.8 0.2 3.2 1.2 0.7 0.7 0 2.6Typical Vehicles 2206 1156
% Typical Vehicles 100 97.2 100 0 97.2 96.4 95.4 100 0 95.5 100 92.9 100 0 92.7 97.8 100 100 0 98 96.5Heavy Duty Vehicles
% Heavy Duty Vehicles 0 2.8 0 0 2.8 3.6 4.6 0 0 4.5 0 7.1 0 100 7.3 2.2 0 0 100 2 3.5
Second AvenueEastbound
Second AvenueWestbound
Elizabeth StreetNorthbound
Elizabeth StreetSouthbound
Start Time Left Thru RightRt. on
RedApp. Total Left Thru Right
Rt. on
RedApp. Total Left Thru Right
Rt. on
RedApp. Total Left Thru Right
Rt. on
RedApp. Total Int. Total
Peak Hour Analysis From 04:00 PM to 06:45 PM - Peak 1 of 1Peak Hour for Entire Intersection Begins at 04:45 PM
04:45 PM 0 214 0 0 214 6 117 2 0 125 1 0 6 0 7 3 1 3 0 7 35305:00 PM 1 229 1 0 231 2 112 0 0 114 3 1 11 0 15 3 1 2 0 6 36605:15 PM 0 209 4 0 213 6 115 1 0 122 1 1 8 0 10 7 3 1 1 12 35705:30 PM 0 212 1 0 213 5 103 1 0 109 6 0 3 0 9 4 2 2 0 8 339Total Volume 1 864 6 0 871 19 447 4 0 470 11 2 28 0 41 17 7 8 1 33 1415% App. Total 0.1 99.2 0.7 0 4 95.1 0.9 0 26.8 4.9 68.3 0 51.5 21.2 24.2 3
PHF .250 .943 .375 .000 .943 .792 .955 .500 .000 .940 .458 .500 .636 .000 .683 .607 .583 .667 .250 .688 .967Typical Vehicles
% Typical Vehicles 100 97.3 100 0 97.4 100 96.4 100 0 96.6 100 100 100 0 100 100 100 100 0 97.0 97.2Heavy Duty Vehicles
% Heavy Duty Vehicles 0 2.7 0 0 2.6 0 3.6 0 0 3.4 0 0 0 0 0 0 0 0 100 3.0 2.8

File Name : 2nd Av & Bates-Tech_AMSite Code : 17240005Start Date : 11/1/2017Page No : 1
Second Avenue and Bates Street/Technolog Drive(Technology Drive SB under Construction)
Groups Printed- Pedestrians and BicyclesSecond Avenue
EastboundSecond Avenue
WestboundTechnology Drive
NorthboundBates StreetSouthbound
Start Time Left Thru Right Peds App. Total Left Thru Right Peds App. Total Left Thru Right Peds App. Total Left Thru Right Peds App. Total Int. Total
06:30 AM 0 0 1 0 1 0 0 0 0 0 0 0 0 0 0 0 0 0 0 0 106:45 AM 0 0 0 0 0 0 0 0 2 2 0 0 0 1 1 0 0 0 1 1 4
Total 0 0 1 0 1 0 0 0 2 2 0 0 0 1 1 0 0 0 1 1 5
07:00 AM 0 0 0 1 1 0 1 0 1 2 0 0 0 0 0 0 0 0 2 2 507:15 AM 0 0 1 0 1 0 0 0 1 1 0 0 0 1 1 0 0 0 2 2 507:30 AM 0 0 0 0 0 0 0 0 1 1 0 0 0 1 1 0 0 0 2 2 407:45 AM 0 0 0 0 0 0 0 0 6 6 0 0 0 1 1 0 1 0 7 8 15
Total 0 0 1 1 2 0 1 0 9 10 0 0 0 3 3 0 1 0 13 14 29
08:00 AM 0 0 1 1 2 0 0 1 5 6 0 0 0 1 1 0 0 0 5 5 1408:15 AM 0 0 0 2 2 0 1 0 3 4 0 0 0 1 1 1 0 0 4 5 1208:30 AM 0 0 0 1 1 0 0 1 5 6 0 0 0 2 2 0 0 0 4 4 1308:45 AM 0 0 0 1 1 0 0 0 4 4 0 0 0 1 1 0 0 0 5 5 11
Total 0 0 1 5 6 0 1 2 17 20 0 0 0 5 5 1 0 0 18 19 50
09:00 AM 0 0 0 0 0 0 0 0 2 2 0 0 0 1 1 0 0 0 2 2 509:15 AM 0 0 0 0 0 0 0 0 2 2 0 0 0 0 0 1 0 0 1 2 4
Grand Total 0 0 3 6 9 0 2 2 32 36 0 0 0 10 10 2 1 0 35 38 93Apprch % 0 0 33.3 66.7 0 5.6 5.6 88.9 0 0 0 100 5.3 2.6 0 92.1
Total % 0 0 3.2 6.5 9.7 0 2.2 2.2 34.4 38.7 0 0 0 10.8 10.8 2.2 1.1 0 37.6 40.9
Second AvenueEastbound
Second AvenueWestbound
Technology DriveNorthbound
Bates StreetSouthbound
Start Time Left Thru Right Peds App. Total Thru Right Peds App. Total Thru Right Peds App. Total Thru Right Peds App. Total Int. Total
Peak Hour Analysis From 06:30 AM to 09:15 AM - Peak 1 of 1Peak Hour for Entire Intersection Begins at 07:45 AM
07:45 AM 0 0 0 0 0 0 0 0 6 6 0 0 0 1 1 0 1 0 7 8 1508:00 AM 0 0 1 1 2 0 0 1 5 6 0 0 0 1 1 0 0 0 5 5 1408:15 AM 0 0 0 2 2 0 1 0 3 4 0 0 0 1 1 1 0 0 4 5 1208:30 AM 0 0 0 1 1 0 0 1 5 6 0 0 0 2 2 0 0 0 4 4 13Total Volume 0 0 1 4 5 0 1 2 19 22 0 0 0 5 5 1 1 0 20 22 54% App. Total 0 0 20 80 0 4.5 9.1 86.4 0 0 0 100 4.5 4.5 0 90.9
PHF .000 .000 .250 .500 .625 .000 .250 .500 .792 .917 .000 .000 .000 .625 .625 .250 .250 .000 .714 .688 .900
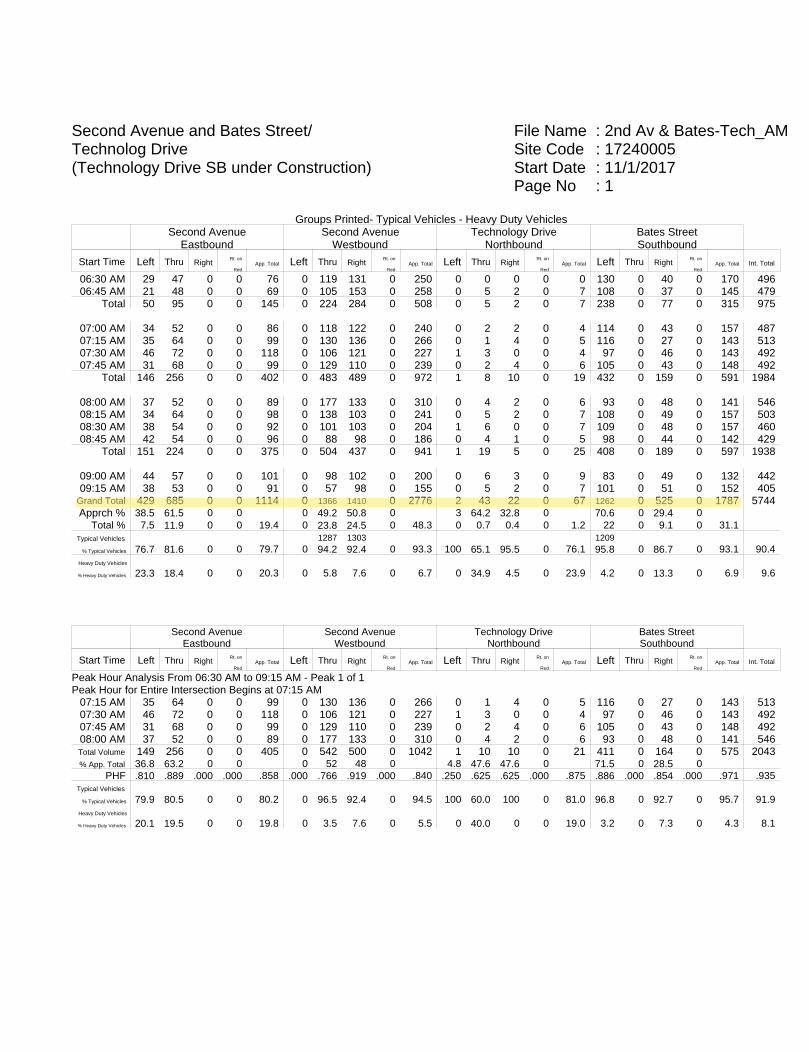
File Name : 2nd Av & Bates-Tech_AMSite Code : 17240005Start Date : 11/1/2017Page No : 1
Second Avenue and Bates Street/Technolog Drive(Technology Drive SB under Construction)
Groups Printed- Typical Vehicles - Heavy Duty VehiclesSecond Avenue
EastboundSecond Avenue
WestboundTechnology Drive
NorthboundBates StreetSouthbound
Start Time Left Thru RightRt. on
RedApp. Total Left Thru Right
Rt. on
RedApp. Total Left Thru Right
Rt. on
RedApp. Total Left Thru Right
Rt. on
RedApp. Total Int. Total
06:30 AM 29 47 0 0 76 0 119 131 0 250 0 0 0 0 0 130 0 40 0 170 49606:45 AM 21 48 0 0 69 0 105 153 0 258 0 5 2 0 7 108 0 37 0 145 479
Total 50 95 0 0 145 0 224 284 0 508 0 5 2 0 7 238 0 77 0 315 975
07:00 AM 34 52 0 0 86 0 118 122 0 240 0 2 2 0 4 114 0 43 0 157 48707:15 AM 35 64 0 0 99 0 130 136 0 266 0 1 4 0 5 116 0 27 0 143 51307:30 AM 46 72 0 0 118 0 106 121 0 227 1 3 0 0 4 97 0 46 0 143 49207:45 AM 31 68 0 0 99 0 129 110 0 239 0 2 4 0 6 105 0 43 0 148 492
Total 146 256 0 0 402 0 483 489 0 972 1 8 10 0 19 432 0 159 0 591 1984
08:00 AM 37 52 0 0 89 0 177 133 0 310 0 4 2 0 6 93 0 48 0 141 54608:15 AM 34 64 0 0 98 0 138 103 0 241 0 5 2 0 7 108 0 49 0 157 50308:30 AM 38 54 0 0 92 0 101 103 0 204 1 6 0 0 7 109 0 48 0 157 46008:45 AM 42 54 0 0 96 0 88 98 0 186 0 4 1 0 5 98 0 44 0 142 429
Total 151 224 0 0 375 0 504 437 0 941 1 19 5 0 25 408 0 189 0 597 1938
09:00 AM 44 57 0 0 101 0 98 102 0 200 0 6 3 0 9 83 0 49 0 132 44209:15 AM 38 53 0 0 91 0 57 98 0 155 0 5 2 0 7 101 0 51 0 152 405
Grand Total 429 685 0 0 1114 0 1366 1410 0 2776 2 43 22 0 67 1262 0 525 0 1787 5744Apprch % 38.5 61.5 0 0 0 49.2 50.8 0 3 64.2 32.8 0 70.6 0 29.4 0
Total % 7.5 11.9 0 0 19.4 0 23.8 24.5 0 48.3 0 0.7 0.4 0 1.2 22 0 9.1 0 31.1Typical Vehicles 1287 1303 1209
% Typical Vehicles 76.7 81.6 0 0 79.7 0 94.2 92.4 0 93.3 100 65.1 95.5 0 76.1 95.8 0 86.7 0 93.1 90.4Heavy Duty Vehicles
% Heavy Duty Vehicles 23.3 18.4 0 0 20.3 0 5.8 7.6 0 6.7 0 34.9 4.5 0 23.9 4.2 0 13.3 0 6.9 9.6
Second AvenueEastbound
Second AvenueWestbound
Technology DriveNorthbound
Bates StreetSouthbound
Start Time Left Thru RightRt. on
RedApp. Total Left Thru Right
Rt. on
RedApp. Total Left Thru Right
Rt. on
RedApp. Total Left Thru Right
Rt. on
RedApp. Total Int. Total
Peak Hour Analysis From 06:30 AM to 09:15 AM - Peak 1 of 1Peak Hour for Entire Intersection Begins at 07:15 AM
07:15 AM 35 64 0 0 99 0 130 136 0 266 0 1 4 0 5 116 0 27 0 143 51307:30 AM 46 72 0 0 118 0 106 121 0 227 1 3 0 0 4 97 0 46 0 143 49207:45 AM 31 68 0 0 99 0 129 110 0 239 0 2 4 0 6 105 0 43 0 148 49208:00 AM 37 52 0 0 89 0 177 133 0 310 0 4 2 0 6 93 0 48 0 141 546Total Volume 149 256 0 0 405 0 542 500 0 1042 1 10 10 0 21 411 0 164 0 575 2043% App. Total 36.8 63.2 0 0 0 52 48 0 4.8 47.6 47.6 0 71.5 0 28.5 0
PHF .810 .889 .000 .000 .858 .000 .766 .919 .000 .840 .250 .625 .625 .000 .875 .886 .000 .854 .000 .971 .935Typical Vehicles
% Typical Vehicles 79.9 80.5 0 0 80.2 0 96.5 92.4 0 94.5 100 60.0 100 0 81.0 96.8 0 92.7 0 95.7 91.9Heavy Duty Vehicles
% Heavy Duty Vehicles 20.1 19.5 0 0 19.8 0 3.5 7.6 0 5.5 0 40.0 0 0 19.0 3.2 0 7.3 0 4.3 8.1

File Name : 2nd Av & Bates-Tech_PMSite Code : 17240005Start Date : 11/8/2017Page No : 1
Second Avenue and Bates Street/Technology Drive
Groups Printed- Pedestrians and BicyclesSecond Avenue
EastboundSecond Avenue
WestboundTechnology Drive
NorthboundBates StreetSouthbound
Start Time Left Thru Right Peds App. Total Left Thru Right Peds App. Total Left Thru Right Peds App. Total Left Thru Right Peds App. Total Int. Total
04:00 PM 0 0 0 3 3 0 0 0 6 6 0 0 0 6 6 1 0 0 8 9 2404:15 PM 0 0 0 0 0 0 0 0 9 9 0 0 0 0 0 1 0 0 6 7 1604:30 PM 0 0 0 0 0 0 0 0 2 2 0 1 0 0 1 0 0 0 7 7 1004:45 PM 0 0 0 2 2 0 0 0 4 4 0 0 0 6 6 0 0 0 5 5 17
Total 0 0 0 5 5 0 0 0 21 21 0 1 0 12 13 2 0 0 26 28 67
05:00 PM 0 0 0 1 1 0 0 0 4 4 0 0 0 2 2 0 0 0 5 5 1205:15 PM 0 0 0 1 1 0 0 0 1 1 0 0 0 1 1 0 0 0 2 2 505:30 PM 0 0 0 0 0 0 0 0 3 3 0 0 0 1 1 0 0 0 1 1 505:45 PM 0 0 0 0 0 0 1 0 4 5 0 0 0 0 0 1 0 0 4 5 10
Total 0 0 0 2 2 0 1 0 12 13 0 0 0 4 4 1 0 0 12 13 32
06:00 PM 0 0 0 0 0 0 0 0 0 0 0 0 0 0 0 0 0 0 1 1 106:15 PM 0 0 0 0 0 0 0 0 1 1 0 0 0 0 0 0 0 0 3 3 406:30 PM 0 0 0 0 0 0 0 0 2 2 0 0 0 0 0 1 0 0 2 3 506:45 PM 0 0 0 0 0 0 0 0 1 1 0 0 0 3 3 0 0 0 1 1 5
Total 0 0 0 0 0 0 0 0 4 4 0 0 0 3 3 1 0 0 7 8 15
Grand Total 0 0 0 7 7 0 1 0 37 38 0 1 0 19 20 4 0 0 45 49 114Apprch % 0 0 0 100 0 2.6 0 97.4 0 5 0 95 8.2 0 0 91.8
Total % 0 0 0 6.1 6.1 0 0.9 0 32.5 33.3 0 0.9 0 16.7 17.5 3.5 0 0 39.5 43
Second AvenueEastbound
Second AvenueWestbound
Technology DriveNorthbound
Bates StreetSouthbound
Start Time Left Thru Right Peds App. Total Thru Right Peds App. Total Thru Right Peds App. Total Thru Right Peds App. Total Int. Total
Peak Hour Analysis From 04:00 PM to 06:45 PM - Peak 1 of 1Peak Hour for Entire Intersection Begins at 04:00 PM
04:00 PM 0 0 0 3 3 0 0 0 6 6 0 0 0 6 6 1 0 0 8 9 2404:15 PM 0 0 0 0 0 0 0 0 9 9 0 0 0 0 0 1 0 0 6 7 1604:30 PM 0 0 0 0 0 0 0 0 2 2 0 1 0 0 1 0 0 0 7 7 1004:45 PM 0 0 0 2 2 0 0 0 4 4 0 0 0 6 6 0 0 0 5 5 17Total Volume 0 0 0 5 5 0 0 0 21 21 0 1 0 12 13 2 0 0 26 28 67% App. Total 0 0 0 100 0 0 0 100 0 7.7 0 92.3 7.1 0 0 92.9
PHF .000 .000 .000 .417 .417 .000 .000 .000 .583 .583 .000 .250 .000 .500 .542 .500 .000 .000 .813 .778 .698

File Name : 2nd Av & Bates-Tech_PMSite Code : 17240005Start Date : 11/8/2017Page No : 1
Second Avenue and Bates Street/Technology Drive
Groups Printed- Typical Vehicles - Heavy Duty VehiclesSecond Avenue
EastboundSecond Avenue
WestboundTechnology Drive
NorthboundBates StreetSouthbound
Start Time Left Thru RightRt. on
RedApp. Total Left Thru Right
Rt. on
RedApp. Total Left Thru Right
Rt. on
RedApp. Total Left Thru Right
Rt. on
RedApp. Total Int. Total
04:00 PM 54 190 0 0 244 0 66 41 0 107 3 29 9 0 41 124 0 10 0 134 52604:15 PM 73 207 0 0 280 0 51 24 0 75 0 23 9 0 32 116 0 7 0 123 51004:30 PM 66 203 0 0 269 0 55 52 0 107 0 41 13 0 54 113 0 11 0 124 55404:45 PM 50 187 0 0 237 0 62 59 0 121 1 40 4 0 45 133 0 16 0 149 552
Total 243 787 0 0 1030 0 234 176 0 410 4 133 35 0 172 486 0 44 0 530 2142
05:00 PM 70 218 0 0 288 0 74 75 0 149 0 36 15 1 52 114 0 16 0 130 61905:15 PM 62 218 0 0 280 0 54 92 0 146 1 35 12 0 48 140 0 14 0 154 62805:30 PM 62 199 0 0 261 0 62 56 0 118 0 30 4 0 34 109 0 10 0 119 53205:45 PM 59 184 0 0 243 0 50 62 0 112 0 19 7 0 26 125 0 18 0 143 524
Total 253 819 0 0 1072 0 240 285 0 525 1 120 38 1 160 488 0 58 0 546 2303
06:00 PM 44 151 0 0 195 0 46 69 0 115 1 23 6 0 30 127 0 16 0 143 48306:15 PM 48 127 0 0 175 0 62 96 0 158 0 14 5 0 19 129 0 9 0 138 49006:30 PM 30 86 0 0 116 0 40 89 0 129 0 12 3 0 15 132 0 20 0 152 41206:45 PM 57 91 0 0 148 0 48 113 0 161 0 7 3 0 10 105 0 9 0 114 433
Total 179 455 0 0 634 0 196 367 0 563 1 56 17 0 74 493 0 54 0 547 1818
Grand Total 675 2061 0 0 2736 0 670 828 0 1498 6 309 90 1 406 1467 0 156 0 1623 6263Apprch % 24.7 75.3 0 0 0 44.7 55.3 0 1.5 76.1 22.2 0.2 90.4 0 9.6 0
Total % 10.8 32.9 0 0 43.7 0 10.7 13.2 0 23.9 0.1 4.9 1.4 0 6.5 23.4 0 2.5 0 25.9Typical Vehicles 1982 1444
% Typical Vehicles 98.2 96.2 0 0 96.7 0 90.3 96.4 0 93.7 100 94.5 96.7 0 94.8 98.4 0 96.2 0 98.2 96.2Heavy Duty Vehicles
% Heavy Duty Vehicles 1.8 3.8 0 0 3.3 0 9.7 3.6 0 6.3 0 5.5 3.3 100 5.2 1.6 0 3.8 0 1.8 3.8
Second AvenueEastbound
Second AvenueWestbound
Technology DriveNorthbound
Bates StreetSouthbound
Start Time Left Thru RightRt. on
RedApp. Total Left Thru Right
Rt. on
RedApp. Total Left Thru Right
Rt. on
RedApp. Total Left Thru Right
Rt. on
RedApp. Total Int. Total
Peak Hour Analysis From 04:00 PM to 06:45 PM - Peak 1 of 1Peak Hour for Entire Intersection Begins at 04:30 PM
04:30 PM 66 203 0 0 269 0 55 52 0 107 0 41 13 0 54 113 0 11 0 124 55404:45 PM 50 187 0 0 237 0 62 59 0 121 1 40 4 0 45 133 0 16 0 149 55205:00 PM 70 218 0 0 288 0 74 75 0 149 0 36 15 1 52 114 0 16 0 130 61905:15 PM 62 218 0 0 280 0 54 92 0 146 1 35 12 0 48 140 0 14 0 154 628Total Volume 248 826 0 0 1074 0 245 278 0 523 2 152 44 1 199 500 0 57 0 557 2353% App. Total 23.1 76.9 0 0 0 46.8 53.2 0 1 76.4 22.1 0.5 89.8 0 10.2 0
PHF .886 .947 .000 .000 .932 .000 .828 .755 .000 .878 .500 .927 .733 .250 .921 .893 .000 .891 .000 .904 .937Typical Vehicles
% Typical Vehicles 99.2 96.9 0 0 97.4 0 90.2 96.8 0 93.7 100 97.4 95.5 0 96.5 98.6 0 96.5 0 98.4 96.7Heavy Duty Vehicles
% Heavy Duty Vehicles 0.8 3.1 0 0 2.6 0 9.8 3.2 0 6.3 0 2.6 4.5 100 3.5 1.4 0 3.5 0 1.6 3.3
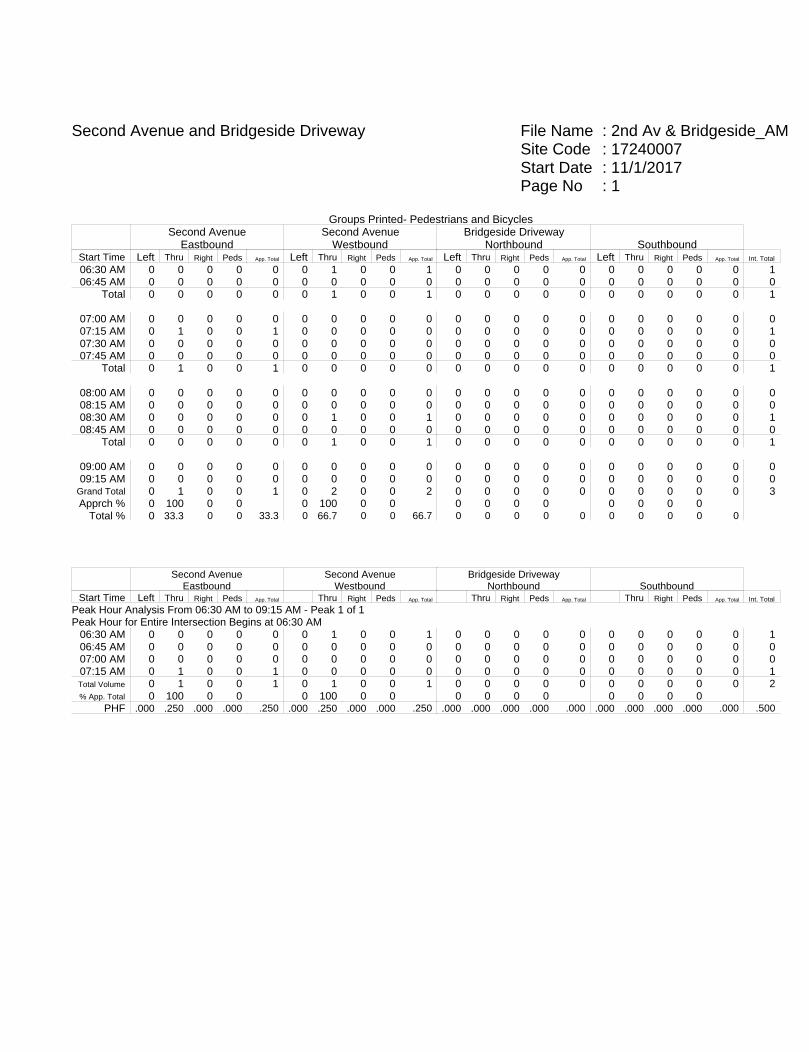
File Name : 2nd Av & Bridgeside_AMSite Code : 17240007Start Date : 11/1/2017Page No : 1
Second Avenue and Bridgeside Driveway
Groups Printed- Pedestrians and BicyclesSecond Avenue
EastboundSecond Avenue
WestboundBridgeside Driveway
Northbound SouthboundStart Time Left Thru Right Peds App. Total Left Thru Right Peds App. Total Left Thru Right Peds App. Total Left Thru Right Peds App. Total Int. Total
06:30 AM 0 0 0 0 0 0 1 0 0 1 0 0 0 0 0 0 0 0 0 0 106:45 AM 0 0 0 0 0 0 0 0 0 0 0 0 0 0 0 0 0 0 0 0 0
Total 0 0 0 0 0 0 1 0 0 1 0 0 0 0 0 0 0 0 0 0 1
07:00 AM 0 0 0 0 0 0 0 0 0 0 0 0 0 0 0 0 0 0 0 0 007:15 AM 0 1 0 0 1 0 0 0 0 0 0 0 0 0 0 0 0 0 0 0 107:30 AM 0 0 0 0 0 0 0 0 0 0 0 0 0 0 0 0 0 0 0 0 007:45 AM 0 0 0 0 0 0 0 0 0 0 0 0 0 0 0 0 0 0 0 0 0
Total 0 1 0 0 1 0 0 0 0 0 0 0 0 0 0 0 0 0 0 0 1
08:00 AM 0 0 0 0 0 0 0 0 0 0 0 0 0 0 0 0 0 0 0 0 008:15 AM 0 0 0 0 0 0 0 0 0 0 0 0 0 0 0 0 0 0 0 0 008:30 AM 0 0 0 0 0 0 1 0 0 1 0 0 0 0 0 0 0 0 0 0 108:45 AM 0 0 0 0 0 0 0 0 0 0 0 0 0 0 0 0 0 0 0 0 0
Total 0 0 0 0 0 0 1 0 0 1 0 0 0 0 0 0 0 0 0 0 1
09:00 AM 0 0 0 0 0 0 0 0 0 0 0 0 0 0 0 0 0 0 0 0 009:15 AM 0 0 0 0 0 0 0 0 0 0 0 0 0 0 0 0 0 0 0 0 0
Grand Total 0 1 0 0 1 0 2 0 0 2 0 0 0 0 0 0 0 0 0 0 3Apprch % 0 100 0 0 0 100 0 0 0 0 0 0 0 0 0 0
Total % 0 33.3 0 0 33.3 0 66.7 0 0 66.7 0 0 0 0 0 0 0 0 0 0
Second AvenueEastbound
Second AvenueWestbound
Bridgeside DrivewayNorthbound Southbound
Start Time Left Thru Right Peds App. Total Thru Right Peds App. Total Thru Right Peds App. Total Thru Right Peds App. Total Int. Total
Peak Hour Analysis From 06:30 AM to 09:15 AM - Peak 1 of 1Peak Hour for Entire Intersection Begins at 06:30 AM
06:30 AM 0 0 0 0 0 0 1 0 0 1 0 0 0 0 0 0 0 0 0 0 106:45 AM 0 0 0 0 0 0 0 0 0 0 0 0 0 0 0 0 0 0 0 0 007:00 AM 0 0 0 0 0 0 0 0 0 0 0 0 0 0 0 0 0 0 0 0 007:15 AM 0 1 0 0 1 0 0 0 0 0 0 0 0 0 0 0 0 0 0 0 1Total Volume 0 1 0 0 1 0 1 0 0 1 0 0 0 0 0 0 0 0 0 0 2% App. Total 0 100 0 0 0 100 0 0 0 0 0 0 0 0 0 0
PHF .000 .250 .000 .000 .250 .000 .250 .000 .000 .250 .000 .000 .000 .000 .000 .000 .000 .000 .000 .000 .500
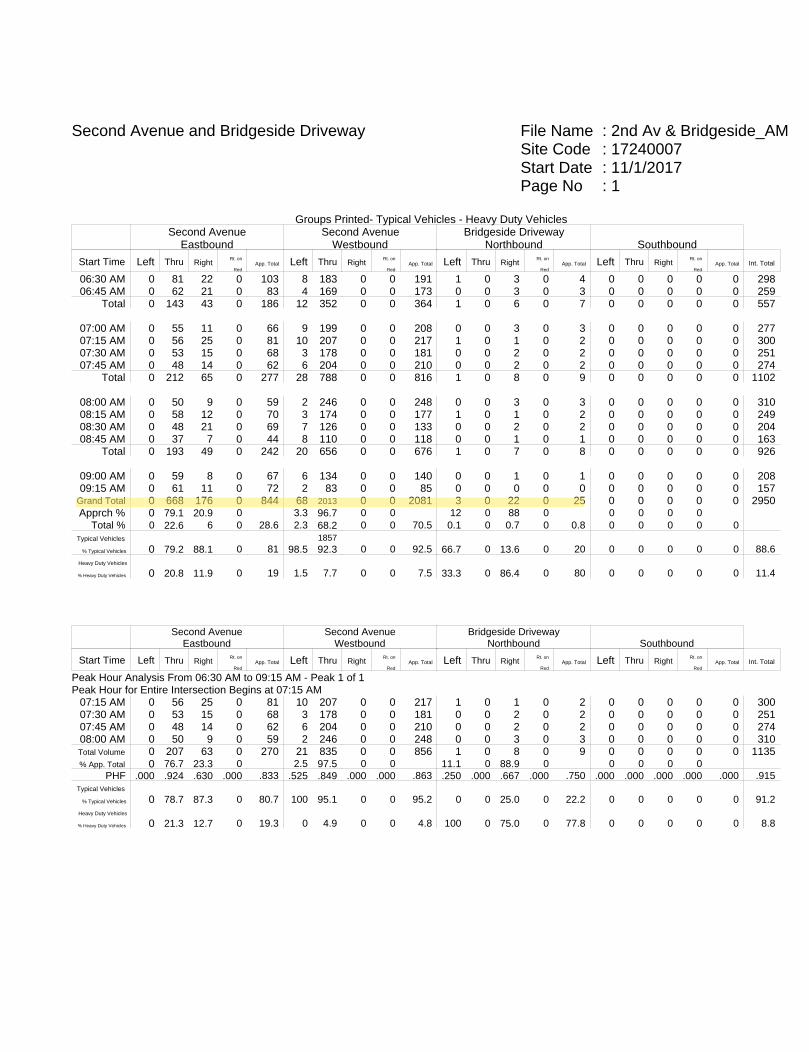
File Name : 2nd Av & Bridgeside_AMSite Code : 17240007Start Date : 11/1/2017Page No : 1
Second Avenue and Bridgeside Driveway
Groups Printed- Typical Vehicles - Heavy Duty VehiclesSecond Avenue
EastboundSecond Avenue
WestboundBridgeside Driveway
Northbound Southbound
Start Time Left Thru RightRt. on
RedApp. Total Left Thru Right
Rt. on
RedApp. Total Left Thru Right
Rt. on
RedApp. Total Left Thru Right
Rt. on
RedApp. Total Int. Total
06:30 AM 0 81 22 0 103 8 183 0 0 191 1 0 3 0 4 0 0 0 0 0 29806:45 AM 0 62 21 0 83 4 169 0 0 173 0 0 3 0 3 0 0 0 0 0 259
Total 0 143 43 0 186 12 352 0 0 364 1 0 6 0 7 0 0 0 0 0 557
07:00 AM 0 55 11 0 66 9 199 0 0 208 0 0 3 0 3 0 0 0 0 0 27707:15 AM 0 56 25 0 81 10 207 0 0 217 1 0 1 0 2 0 0 0 0 0 30007:30 AM 0 53 15 0 68 3 178 0 0 181 0 0 2 0 2 0 0 0 0 0 25107:45 AM 0 48 14 0 62 6 204 0 0 210 0 0 2 0 2 0 0 0 0 0 274
Total 0 212 65 0 277 28 788 0 0 816 1 0 8 0 9 0 0 0 0 0 1102
08:00 AM 0 50 9 0 59 2 246 0 0 248 0 0 3 0 3 0 0 0 0 0 31008:15 AM 0 58 12 0 70 3 174 0 0 177 1 0 1 0 2 0 0 0 0 0 24908:30 AM 0 48 21 0 69 7 126 0 0 133 0 0 2 0 2 0 0 0 0 0 20408:45 AM 0 37 7 0 44 8 110 0 0 118 0 0 1 0 1 0 0 0 0 0 163
Total 0 193 49 0 242 20 656 0 0 676 1 0 7 0 8 0 0 0 0 0 926
09:00 AM 0 59 8 0 67 6 134 0 0 140 0 0 1 0 1 0 0 0 0 0 20809:15 AM 0 61 11 0 72 2 83 0 0 85 0 0 0 0 0 0 0 0 0 0 157
Grand Total 0 668 176 0 844 68 2013 0 0 2081 3 0 22 0 25 0 0 0 0 0 2950Apprch % 0 79.1 20.9 0 3.3 96.7 0 0 12 0 88 0 0 0 0 0
Total % 0 22.6 6 0 28.6 2.3 68.2 0 0 70.5 0.1 0 0.7 0 0.8 0 0 0 0 0Typical Vehicles 1857
% Typical Vehicles 0 79.2 88.1 0 81 98.5 92.3 0 0 92.5 66.7 0 13.6 0 20 0 0 0 0 0 88.6Heavy Duty Vehicles
% Heavy Duty Vehicles 0 20.8 11.9 0 19 1.5 7.7 0 0 7.5 33.3 0 86.4 0 80 0 0 0 0 0 11.4
Second AvenueEastbound
Second AvenueWestbound
Bridgeside DrivewayNorthbound Southbound
Start Time Left Thru RightRt. on
RedApp. Total Left Thru Right
Rt. on
RedApp. Total Left Thru Right
Rt. on
RedApp. Total Left Thru Right
Rt. on
RedApp. Total Int. Total
Peak Hour Analysis From 06:30 AM to 09:15 AM - Peak 1 of 1Peak Hour for Entire Intersection Begins at 07:15 AM
07:15 AM 0 56 25 0 81 10 207 0 0 217 1 0 1 0 2 0 0 0 0 0 30007:30 AM 0 53 15 0 68 3 178 0 0 181 0 0 2 0 2 0 0 0 0 0 25107:45 AM 0 48 14 0 62 6 204 0 0 210 0 0 2 0 2 0 0 0 0 0 27408:00 AM 0 50 9 0 59 2 246 0 0 248 0 0 3 0 3 0 0 0 0 0 310Total Volume 0 207 63 0 270 21 835 0 0 856 1 0 8 0 9 0 0 0 0 0 1135% App. Total 0 76.7 23.3 0 2.5 97.5 0 0 11.1 0 88.9 0 0 0 0 0
PHF .000 .924 .630 .000 .833 .525 .849 .000 .000 .863 .250 .000 .667 .000 .750 .000 .000 .000 .000 .000 .915Typical Vehicles
% Typical Vehicles 0 78.7 87.3 0 80.7 100 95.1 0 0 95.2 0 0 25.0 0 22.2 0 0 0 0 0 91.2Heavy Duty Vehicles
% Heavy Duty Vehicles 0 21.3 12.7 0 19.3 0 4.9 0 0 4.8 100 0 75.0 0 77.8 0 0 0 0 0 8.8
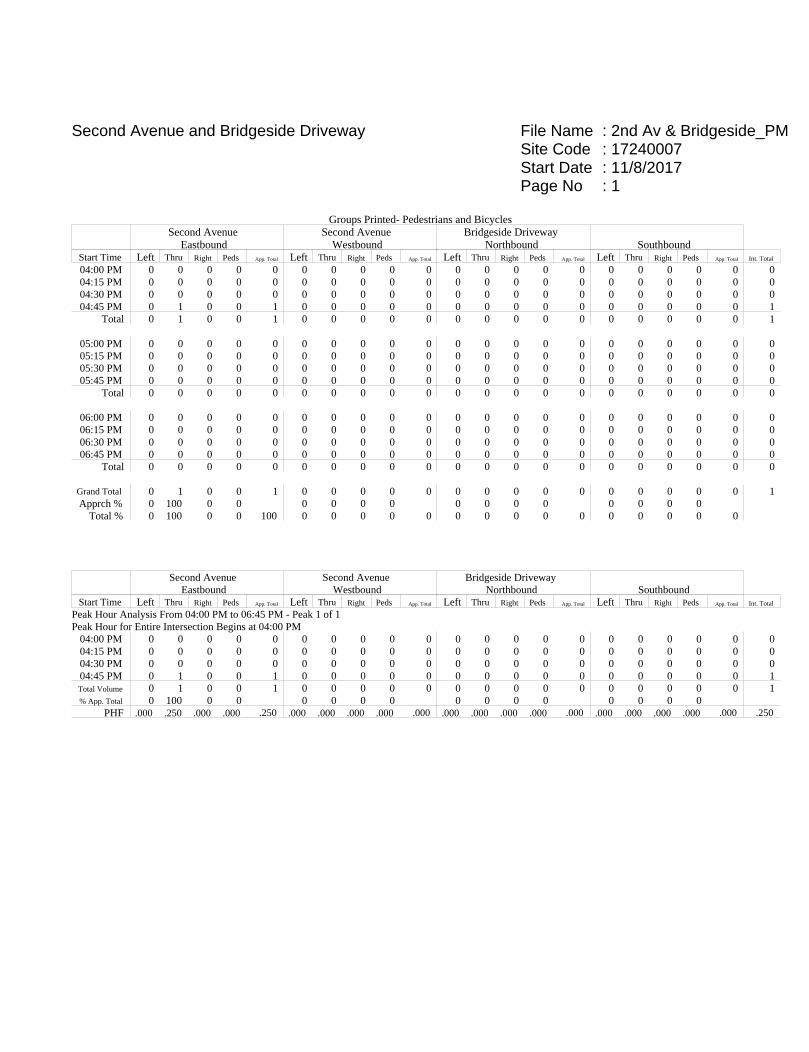
File Name : 2nd Av & Bridgeside_PMSite Code : 17240007Start Date : 11/8/2017Page No : 1
Second Avenue and Bridgeside Driveway
Groups Printed- Pedestrians and BicyclesSecond Avenue
EastboundSecond Avenue
WestboundBridgeside Driveway
Northbound SouthboundStart Time Left Thru Right Peds App. Total Left Thru Right Peds App. Total Left Thru Right Peds App. Total Left Thru Right Peds App. Total Int. Total
04:00 PM 0 0 0 0 0 0 0 0 0 0 0 0 0 0 0 0 0 0 0 0 004:15 PM 0 0 0 0 0 0 0 0 0 0 0 0 0 0 0 0 0 0 0 0 004:30 PM 0 0 0 0 0 0 0 0 0 0 0 0 0 0 0 0 0 0 0 0 004:45 PM 0 1 0 0 1 0 0 0 0 0 0 0 0 0 0 0 0 0 0 0 1
Total 0 1 0 0 1 0 0 0 0 0 0 0 0 0 0 0 0 0 0 0 1
05:00 PM 0 0 0 0 0 0 0 0 0 0 0 0 0 0 0 0 0 0 0 0 005:15 PM 0 0 0 0 0 0 0 0 0 0 0 0 0 0 0 0 0 0 0 0 005:30 PM 0 0 0 0 0 0 0 0 0 0 0 0 0 0 0 0 0 0 0 0 005:45 PM 0 0 0 0 0 0 0 0 0 0 0 0 0 0 0 0 0 0 0 0 0
Total 0 0 0 0 0 0 0 0 0 0 0 0 0 0 0 0 0 0 0 0 0
06:00 PM 0 0 0 0 0 0 0 0 0 0 0 0 0 0 0 0 0 0 0 0 006:15 PM 0 0 0 0 0 0 0 0 0 0 0 0 0 0 0 0 0 0 0 0 006:30 PM 0 0 0 0 0 0 0 0 0 0 0 0 0 0 0 0 0 0 0 0 006:45 PM 0 0 0 0 0 0 0 0 0 0 0 0 0 0 0 0 0 0 0 0 0
Total 0 0 0 0 0 0 0 0 0 0 0 0 0 0 0 0 0 0 0 0 0
Grand Total 0 1 0 0 1 0 0 0 0 0 0 0 0 0 0 0 0 0 0 0 1Apprch % 0 100 0 0 0 0 0 0 0 0 0 0 0 0 0 0
Total % 0 100 0 0 100 0 0 0 0 0 0 0 0 0 0 0 0 0 0 0
Second AvenueEastbound
Second AvenueWestbound
Bridgeside DrivewayNorthbound Southbound
Start Time Left Thru Right Peds App. Total Left Thru Right Peds App. Total Left Thru Right Peds App. Total Left Thru Right Peds App. Total Int. Total
Peak Hour Analysis From 04:00 PM to 06:45 PM - Peak 1 of 1Peak Hour for Entire Intersection Begins at 04:00 PM
04:00 PM 0 0 0 0 0 0 0 0 0 0 0 0 0 0 0 0 0 0 0 0 004:15 PM 0 0 0 0 0 0 0 0 0 0 0 0 0 0 0 0 0 0 0 0 004:30 PM 0 0 0 0 0 0 0 0 0 0 0 0 0 0 0 0 0 0 0 0 004:45 PM 0 1 0 0 1 0 0 0 0 0 0 0 0 0 0 0 0 0 0 0 1Total Volume 0 1 0 0 1 0 0 0 0 0 0 0 0 0 0 0 0 0 0 0 1% App. Total 0 100 0 0 0 0 0 0 0 0 0 0 0 0 0 0
PHF .000 .250 .000 .000 .250 .000 .000 .000 .000 .000 .000 .000 .000 .000 .000 .000 .000 .000 .000 .000 .250

File Name : 2nd Av & Bridgeside_PMSite Code : 17240007Start Date : 11/8/2017Page No : 1
Second Avenue and Bridgeside Driveway
Groups Printed- Typical Vehicles - Heavy Duty VehiclesSecond Avenue
EastboundSecond Avenue
WestboundBridgeside Driveway
Northbound Southbound
Start Time Left Thru RightRt. on
RedApp. Total Left Thru Right
Rt. on
RedApp. Total Left Thru Right
Rt. on
RedApp. Total Left Thru Right
Rt. on
RedApp. Total Int. Total
04:00 PM 0 246 2 0 248 5 65 0 0 70 11 0 13 0 24 0 0 0 0 0 34204:15 PM 0 271 1 0 272 0 85 0 0 85 11 0 17 0 28 0 0 0 0 0 38504:30 PM 0 254 1 0 255 0 78 0 0 78 21 0 12 0 33 0 0 0 0 0 36604:45 PM 0 284 3 0 287 1 103 0 0 104 13 0 14 0 27 0 0 0 0 0 418
Total 0 1055 7 0 1062 6 331 0 0 337 56 0 56 0 112 0 0 0 0 0 1511
05:00 PM 0 257 1 0 258 0 77 0 0 77 18 0 6 0 24 0 0 0 0 0 35905:15 PM 0 279 3 0 282 0 84 0 0 84 14 0 14 0 28 0 0 0 0 0 39405:30 PM 0 239 1 0 240 0 82 0 0 82 6 0 11 0 17 0 0 0 0 0 33905:45 PM 0 246 2 0 248 1 75 0 0 76 9 0 7 0 16 0 0 0 0 0 340
Total 0 1021 7 0 1028 1 318 0 0 319 47 0 38 0 85 0 0 0 0 0 1432
06:00 PM 0 221 3 0 224 0 85 0 0 85 7 0 5 0 12 0 0 0 0 0 32106:15 PM 0 176 2 0 178 0 74 0 0 74 5 0 3 0 8 0 0 0 0 0 26006:30 PM 0 154 3 0 157 0 90 0 0 90 3 0 5 0 8 0 0 0 0 0 25506:45 PM 0 120 3 0 123 0 62 0 0 62 10 0 3 0 13 0 0 0 0 0 198
Total 0 671 11 0 682 0 311 0 0 311 25 0 16 0 41 0 0 0 0 0 1034
Grand Total 0 2747 25 0 2772 7 960 0 0 967 128 0 110 0 238 0 0 0 0 0 3977Apprch % 0 99.1 0.9 0 0.7 99.3 0 0 53.8 0 46.2 0 0 0 0 0
Total % 0 69.1 0.6 0 69.7 0.2 24.1 0 0 24.3 3.2 0 2.8 0 6 0 0 0 0 0Typical Vehicles 2671
% Typical Vehicles 0 97.2 24 0 96.6 100 92.4 0 0 92.5 100 0 82.7 0 92 0 0 0 0 0 95.3Heavy Duty Vehicles
% Heavy Duty Vehicles 0 2.8 76 0 3.4 0 7.6 0 0 7.5 0 0 17.3 0 8 0 0 0 0 0 4.7
Second AvenueEastbound
Second AvenueWestbound
Bridgeside DrivewayNorthbound Southbound
Start Time Left Thru RightRt. on
RedApp. Total Left Thru Right
Rt. on
RedApp. Total Left Thru Right
Rt. on
RedApp. Total Left Thru Right
Rt. on
RedApp. Total Int. Total
Peak Hour Analysis From 04:00 PM to 06:45 PM - Peak 1 of 1Peak Hour for Entire Intersection Begins at 04:30 PM
04:30 PM 0 254 1 0 255 0 78 0 0 78 21 0 12 0 33 0 0 0 0 0 36604:45 PM 0 284 3 0 287 1 103 0 0 104 13 0 14 0 27 0 0 0 0 0 41805:00 PM 0 257 1 0 258 0 77 0 0 77 18 0 6 0 24 0 0 0 0 0 35905:15 PM 0 279 3 0 282 0 84 0 0 84 14 0 14 0 28 0 0 0 0 0 394Total Volume 0 1074 8 0 1082 1 342 0 0 343 66 0 46 0 112 0 0 0 0 0 1537% App. Total 0 99.3 0.7 0 0.3 99.7 0 0 58.9 0 41.1 0 0 0 0 0
PHF .000 .945 .667 .000 .943 .250 .830 .000 .000 .825 .786 .000 .821 .000 .848 .000 .000 .000 .000 .000 .919Typical Vehicles 1047
% Typical Vehicles 0 97.5 12.5 0 96.9 100 93.0 0 0 93.0 100 0 84.8 0 93.8 0 0 0 0 0 95.8Heavy Duty Vehicles
% Heavy Duty Vehicles 0 2.5 87.5 0 3.1 0 7.0 0 0 7.0 0 0 15.2 0 6.3 0 0 0 0 0 4.2

File Name : 2nd Av & Flowers_AMSite Code : 17240012Start Date : 11/2/2017Page No : 1
Second Avenue and Flowers Avenue
Groups Printed- Pedestrians and BicyclesSecond Avenue
EastboundSecond Avenue
Westbound NorthboundFlowers Avenue
SouthboundStart Time Left Thru Right Peds App. Total Left Thru Right Peds App. Total Left Thru Right Peds App. Total Left Thru Right Peds App. Total Int. Total
06:30 AM 0 0 0 0 0 0 0 0 2 2 0 0 0 0 0 0 0 0 0 0 206:45 AM 0 0 0 0 0 0 0 0 1 1 0 0 0 0 0 0 0 0 1 1 2
Total 0 0 0 0 0 0 0 0 3 3 0 0 0 0 0 0 0 0 1 1 4
07:00 AM 0 0 0 0 0 0 0 0 0 0 0 0 0 0 0 0 0 0 1 1 107:15 AM 0 0 0 0 0 0 0 0 4 4 0 0 0 0 0 0 0 0 0 0 407:30 AM 0 0 0 0 0 0 0 0 0 0 0 0 0 0 0 0 0 0 1 1 107:45 AM 0 0 0 0 0 0 0 0 0 0 0 0 0 0 0 0 0 0 0 0 0
Total 0 0 0 0 0 0 0 0 4 4 0 0 0 0 0 0 0 0 2 2 6
08:00 AM 0 0 0 0 0 0 0 0 2 2 0 0 0 0 0 0 0 0 0 0 208:15 AM 0 0 0 0 0 0 0 0 1 1 0 0 0 0 0 0 0 0 2 2 308:30 AM 0 0 0 0 0 0 0 0 1 1 0 0 0 0 0 0 0 0 2 2 308:45 AM 0 0 0 0 0 0 0 0 4 4 0 0 0 0 0 0 0 0 1 1 5
Total 0 0 0 0 0 0 0 0 8 8 0 0 0 0 0 0 0 0 5 5 13
09:00 AM 0 1 0 0 1 0 0 0 1 1 0 0 0 0 0 0 0 0 0 0 209:15 AM 0 1 0 0 1 0 1 0 0 1 0 0 0 0 0 0 0 0 0 0 2
Grand Total 0 2 0 0 2 0 1 0 16 17 0 0 0 0 0 0 0 0 8 8 27Apprch % 0 100 0 0 0 5.9 0 94.1 0 0 0 0 0 0 0 100
Total % 0 7.4 0 0 7.4 0 3.7 0 59.3 63 0 0 0 0 0 0 0 0 29.6 29.6
Second AvenueEastbound
Second AvenueWestbound Northbound
Flowers AvenueSouthbound
Start Time Left Thru Right Peds App. Total Thru Right Peds App. Total Thru Right Peds App. Total Thru Right Peds App. Total Int. Total
Peak Hour Analysis From 06:30 AM to 09:15 AM - Peak 1 of 1Peak Hour for Entire Intersection Begins at 08:00 AM
08:00 AM 0 0 0 0 0 0 0 0 2 2 0 0 0 0 0 0 0 0 0 0 208:15 AM 0 0 0 0 0 0 0 0 1 1 0 0 0 0 0 0 0 0 2 2 308:30 AM 0 0 0 0 0 0 0 0 1 1 0 0 0 0 0 0 0 0 2 2 308:45 AM 0 0 0 0 0 0 0 0 4 4 0 0 0 0 0 0 0 0 1 1 5Total Volume 0 0 0 0 0 0 0 0 8 8 0 0 0 0 0 0 0 0 5 5 13% App. Total 0 0 0 0 0 0 0 100 0 0 0 0 0 0 0 100
PHF .000 .000 .000 .000 .000 .000 .000 .000 .500 .500 .000 .000 .000 .000 .000 .000 .000 .000 .625 .625 .650

File Name : 2nd Av & Flowers_AMSite Code : 17240012Start Date : 11/2/2017Page No : 1
Second Avenue and Flowers Avenue
Groups Printed- Typical Vehicles - Heavy Duty VehiclesSecond Avenue
EastboundSecond Avenue
Westbound NorthboundFlowers Avenue
Southbound
Start Time Left Thru RightRt. on
RedApp. Total Left Thru Right
Rt. on
RedApp. Total Left Thru Right
Rt. on
RedApp. Total Left Thru Right
Rt. on
RedApp. Total Int. Total
06:30 AM 0 65 0 0 65 0 257 0 0 257 0 0 0 0 0 1 0 5 0 6 32806:45 AM 3 65 0 0 68 0 290 2 0 292 0 0 0 0 0 2 0 7 0 9 369
Total 3 130 0 0 133 0 547 2 0 549 0 0 0 0 0 3 0 12 0 15 697
07:00 AM 4 88 0 0 92 0 273 1 0 274 0 0 0 0 0 2 0 10 0 12 37807:15 AM 3 103 0 0 106 0 327 3 0 330 0 0 0 0 0 4 0 15 0 19 45507:30 AM 1 80 0 0 81 0 348 0 0 348 0 0 0 0 0 4 0 8 0 12 44107:45 AM 1 99 0 0 100 0 332 3 0 335 0 0 0 0 0 5 0 15 1 21 456
Total 9 370 0 0 379 0 1280 7 0 1287 0 0 0 0 0 15 0 48 1 64 1730
08:00 AM 2 77 0 0 79 0 312 4 0 316 0 0 0 0 0 4 0 14 1 19 41408:15 AM 3 81 0 0 84 0 288 2 0 290 0 0 0 0 0 4 0 9 4 17 39108:30 AM 0 74 0 0 74 0 244 0 0 244 0 0 0 0 0 0 0 27 3 30 34808:45 AM 5 92 0 0 97 0 211 0 1 212 0 0 0 0 0 3 0 20 1 24 333
Total 10 324 0 0 334 0 1055 6 1 1062 0 0 0 0 0 11 0 70 9 90 1486
09:00 AM 3 80 0 0 83 0 219 3 0 222 0 0 0 0 0 8 0 15 2 25 33009:15 AM 3 91 0 0 94 0 161 0 0 161 0 0 0 0 0 4 0 8 0 12 267
Grand Total 28 995 0 0 1023 0 3262 18 1 3281 0 0 0 0 0 41 0 153 12 206 4510Apprch % 2.7 97.3 0 0 0 99.4 0.5 0 0 0 0 0 19.9 0 74.3 5.8
Total % 0.6 22.1 0 0 22.7 0 72.3 0.4 0 72.7 0 0 0 0 0 0.9 0 3.4 0.3 4.6Typical Vehicles 3119
% Typical Vehicles 71.4 87.2 0 0 86.8 0 95.6 100 100 95.6 0 0 0 0 0 95.1 0 95.4 100 95.6 93.6Heavy Duty Vehicles
% Heavy Duty Vehicles 28.6 12.8 0 0 13.2 0 4.4 0 0 4.4 0 0 0 0 0 4.9 0 4.6 0 4.4 6.4
Second AvenueEastbound
Second AvenueWestbound Northbound
Flowers AvenueSouthbound
Start Time Left Thru RightRt. on
RedApp. Total Left Thru Right
Rt. on
RedApp. Total Left Thru Right
Rt. on
RedApp. Total Left Thru Right
Rt. on
RedApp. Total Int. Total
Peak Hour Analysis From 06:30 AM to 09:15 AM - Peak 1 of 1Peak Hour for Entire Intersection Begins at 07:15 AM
07:15 AM 3 103 0 0 106 0 327 3 0 330 0 0 0 0 0 4 0 15 0 19 45507:30 AM 1 80 0 0 81 0 348 0 0 348 0 0 0 0 0 4 0 8 0 12 44107:45 AM 1 99 0 0 100 0 332 3 0 335 0 0 0 0 0 5 0 15 1 21 45608:00 AM 2 77 0 0 79 0 312 4 0 316 0 0 0 0 0 4 0 14 1 19 414Total Volume 7 359 0 0 366 0 1319 10 0 1329 0 0 0 0 0 17 0 52 2 71 1766% App. Total 1.9 98.1 0 0 0 99.2 0.8 0 0 0 0 0 23.9 0 73.2 2.8
PHF .583 .871 .000 .000 .863 .000 .948 .625 .000 .955 .000 .000 .000 .000 .000 .850 .000 .867 .500 .845 .968Typical Vehicles 1278
% Typical Vehicles 85.7 87.2 0 0 87.2 0 96.9 100 0 96.9 0 0 0 0 0 94.1 0 94.2 100 94.4 94.8Heavy Duty Vehicles
% Heavy Duty Vehicles 14.3 12.8 0 0 12.8 0 3.1 0 0 3.1 0 0 0 0 0 5.9 0 5.8 0 5.6 5.2

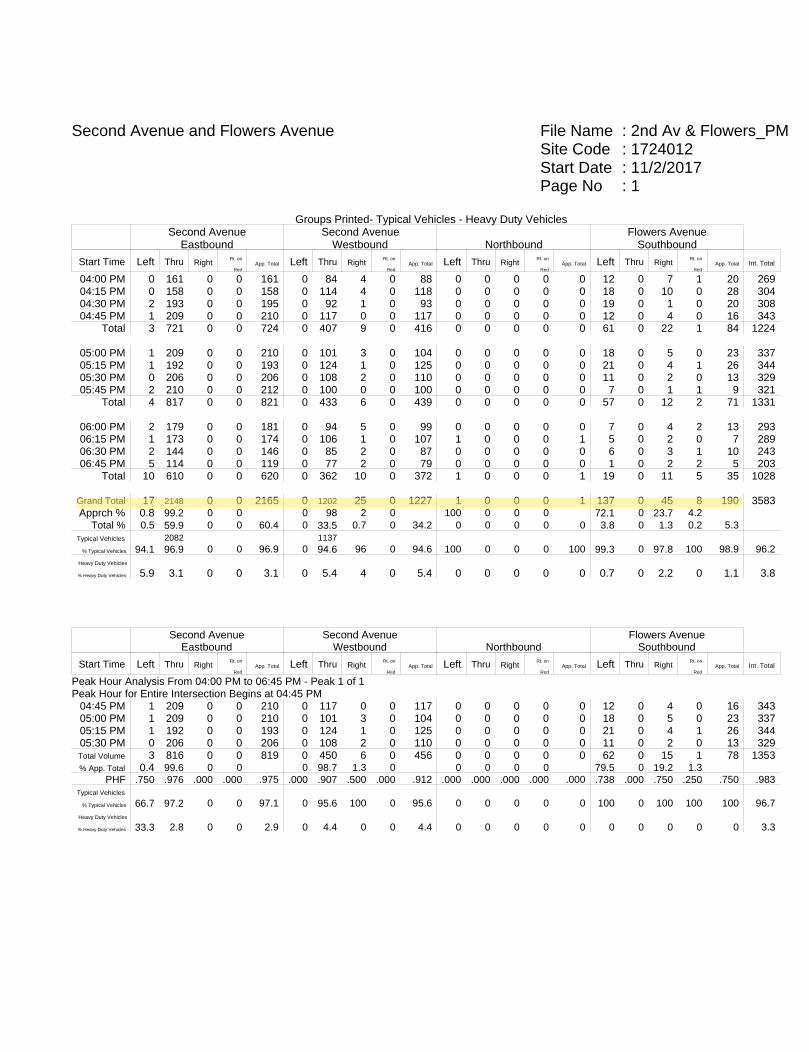
File Name : 2nd Av & Flowers_PMSite Code : 1724012Start Date : 11/2/2017Page No : 1
Second Avenue and Flowers Avenue
Groups Printed- Pedestrians and BicyclesSecond Avenue
EastboundSecond Avenue
Westbound NorthboundFlowers Avenue
SouthboundStart Time Left Thru Right Peds App. Total Left Thru Right Peds App. Total Left Thru Right Peds App. Total Left Thru Right Peds App. Total Int. Total
04:00 PM 0 0 0 0 0 0 0 0 3 3 0 0 0 0 0 0 0 0 2 2 504:15 PM 0 0 0 1 1 0 0 0 3 3 0 0 0 0 0 0 0 0 0 0 404:30 PM 0 1 0 0 1 0 0 0 1 1 0 0 0 0 0 0 0 0 0 0 204:45 PM 0 0 0 0 0 0 0 0 4 4 0 0 0 0 0 0 0 0 1 1 5
Total 0 1 0 1 2 0 0 0 11 11 0 0 0 0 0 0 0 0 3 3 16
05:00 PM 0 0 0 0 0 0 0 0 5 5 0 0 0 0 0 0 0 0 0 0 505:15 PM 0 1 0 0 1 0 0 0 2 2 0 0 0 0 0 0 0 0 0 0 305:30 PM 0 0 0 0 0 0 1 0 1 2 0 0 0 0 0 0 0 0 1 1 305:45 PM 0 0 0 0 0 0 1 0 0 1 0 0 0 0 0 0 0 0 2 2 3
Total 0 1 0 0 1 0 2 0 8 10 0 0 0 0 0 0 0 0 3 3 14
06:00 PM 0 0 0 0 0 0 0 0 1 1 0 0 0 0 0 0 0 0 3 3 406:15 PM 0 0 0 0 0 0 0 0 0 0 0 0 0 0 0 0 0 0 0 0 006:30 PM 0 0 0 0 0 0 0 0 0 0 0 0 0 0 0 0 0 0 0 0 006:45 PM 0 0 0 0 0 0 0 0 0 0 0 0 0 0 0 0 0 0 0 0 0
Total 0 0 0 0 0 0 0 0 1 1 0 0 0 0 0 0 0 0 3 3 4
Grand Total 0 2 0 1 3 0 2 0 20 22 0 0 0 0 0 0 0 0 9 9 34Apprch % 0 66.7 0 33.3 0 9.1 0 90.9 0 0 0 0 0 0 0 100
Total % 0 5.9 0 2.9 8.8 0 5.9 0 58.8 64.7 0 0 0 0 0 0 0 0 26.5 26.5
Second AvenueEastbound
Second AvenueWestbound Northbound
Flowers AvenueSouthbound
Start Time Left Thru Right Peds App. Total Thru Right Peds App. Total Thru Right Peds App. Total Thru Right Peds App. Total Int. Total
Peak Hour Analysis From 04:00 PM to 06:45 PM - Peak 1 of 1Peak Hour for Entire Intersection Begins at 04:00 PM
04:00 PM 0 0 0 0 0 0 0 0 3 3 0 0 0 0 0 0 0 0 2 2 504:15 PM 0 0 0 1 1 0 0 0 3 3 0 0 0 0 0 0 0 0 0 0 404:30 PM 0 1 0 0 1 0 0 0 1 1 0 0 0 0 0 0 0 0 0 0 204:45 PM 0 0 0 0 0 0 0 0 4 4 0 0 0 0 0 0 0 0 1 1 5Total Volume 0 1 0 1 2 0 0 0 11 11 0 0 0 0 0 0 0 0 3 3 16% App. Total 0 50 0 50 0 0 0 100 0 0 0 0 0 0 0 100
PHF .000 .250 .000 .250 .500 .000 .000 .000 .688 .688 .000 .000 .000 .000 .000 .000 .000 .000 .375 .375 .800
File Name : 2nd Av & Flowers_PMSite Code : 1724012Start Date : 11/2/2017Page No : 1
Second Avenue and Flowers Avenue
Groups Printed- Typical Vehicles - Heavy Duty VehiclesSecond Avenue
EastboundSecond Avenue
Westbound NorthboundFlowers Avenue
Southbound
Start Time Left Thru RightRt. on
RedApp. Total Left Thru Right
Rt. on
RedApp. Total Left Thru Right
Rt. on
RedApp. Total Left Thru Right
Rt. on
RedApp. Total Int. Total
04:00 PM 0 161 0 0 161 0 84 4 0 88 0 0 0 0 0 12 0 7 1 20 26904:15 PM 0 158 0 0 158 0 114 4 0 118 0 0 0 0 0 18 0 10 0 28 30404:30 PM 2 193 0 0 195 0 92 1 0 93 0 0 0 0 0 19 0 1 0 20 30804:45 PM 1 209 0 0 210 0 117 0 0 117 0 0 0 0 0 12 0 4 0 16 343
Total 3 721 0 0 724 0 407 9 0 416 0 0 0 0 0 61 0 22 1 84 1224
05:00 PM 1 209 0 0 210 0 101 3 0 104 0 0 0 0 0 18 0 5 0 23 33705:15 PM 1 192 0 0 193 0 124 1 0 125 0 0 0 0 0 21 0 4 1 26 34405:30 PM 0 206 0 0 206 0 108 2 0 110 0 0 0 0 0 11 0 2 0 13 32905:45 PM 2 210 0 0 212 0 100 0 0 100 0 0 0 0 0 7 0 1 1 9 321
Total 4 817 0 0 821 0 433 6 0 439 0 0 0 0 0 57 0 12 2 71 1331
06:00 PM 2 179 0 0 181 0 94 5 0 99 0 0 0 0 0 7 0 4 2 13 29306:15 PM 1 173 0 0 174 0 106 1 0 107 1 0 0 0 1 5 0 2 0 7 28906:30 PM 2 144 0 0 146 0 85 2 0 87 0 0 0 0 0 6 0 3 1 10 24306:45 PM 5 114 0 0 119 0 77 2 0 79 0 0 0 0 0 1 0 2 2 5 203
Total 10 610 0 0 620 0 362 10 0 372 1 0 0 0 1 19 0 11 5 35 1028
Grand Total 17 2148 0 0 2165 0 1202 25 0 1227 1 0 0 0 1 137 0 45 8 190 3583Apprch % 0.8 99.2 0 0 0 98 2 0 100 0 0 0 72.1 0 23.7 4.2
Total % 0.5 59.9 0 0 60.4 0 33.5 0.7 0 34.2 0 0 0 0 0 3.8 0 1.3 0.2 5.3Typical Vehicles 2082 1137
% Typical Vehicles 94.1 96.9 0 0 96.9 0 94.6 96 0 94.6 100 0 0 0 100 99.3 0 97.8 100 98.9 96.2Heavy Duty Vehicles
% Heavy Duty Vehicles 5.9 3.1 0 0 3.1 0 5.4 4 0 5.4 0 0 0 0 0 0.7 0 2.2 0 1.1 3.8
Second AvenueEastbound
Second AvenueWestbound Northbound
Flowers AvenueSouthbound
Start Time Left Thru RightRt. on
RedApp. Total Left Thru Right
Rt. on
RedApp. Total Left Thru Right
Rt. on
RedApp. Total Left Thru Right
Rt. on
RedApp. Total Int. Total
Peak Hour Analysis From 04:00 PM to 06:45 PM - Peak 1 of 1Peak Hour for Entire Intersection Begins at 04:45 PM
04:45 PM 1 209 0 0 210 0 117 0 0 117 0 0 0 0 0 12 0 4 0 16 34305:00 PM 1 209 0 0 210 0 101 3 0 104 0 0 0 0 0 18 0 5 0 23 33705:15 PM 1 192 0 0 193 0 124 1 0 125 0 0 0 0 0 21 0 4 1 26 34405:30 PM 0 206 0 0 206 0 108 2 0 110 0 0 0 0 0 11 0 2 0 13 329Total Volume 3 816 0 0 819 0 450 6 0 456 0 0 0 0 0 62 0 15 1 78 1353% App. Total 0.4 99.6 0 0 0 98.7 1.3 0 0 0 0 0 79.5 0 19.2 1.3
PHF .750 .976 .000 .000 .975 .000 .907 .500 .000 .912 .000 .000 .000 .000 .000 .738 .000 .750 .250 .750 .983Typical Vehicles
% Typical Vehicles 66.7 97.2 0 0 97.1 0 95.6 100 0 95.6 0 0 0 0 0 100 0 100 100 100 96.7Heavy Duty Vehicles
% Heavy Duty Vehicles 33.3 2.8 0 0 2.9 0 4.4 0 0 4.4 0 0 0 0 0 0 0 0 0 0 3.3
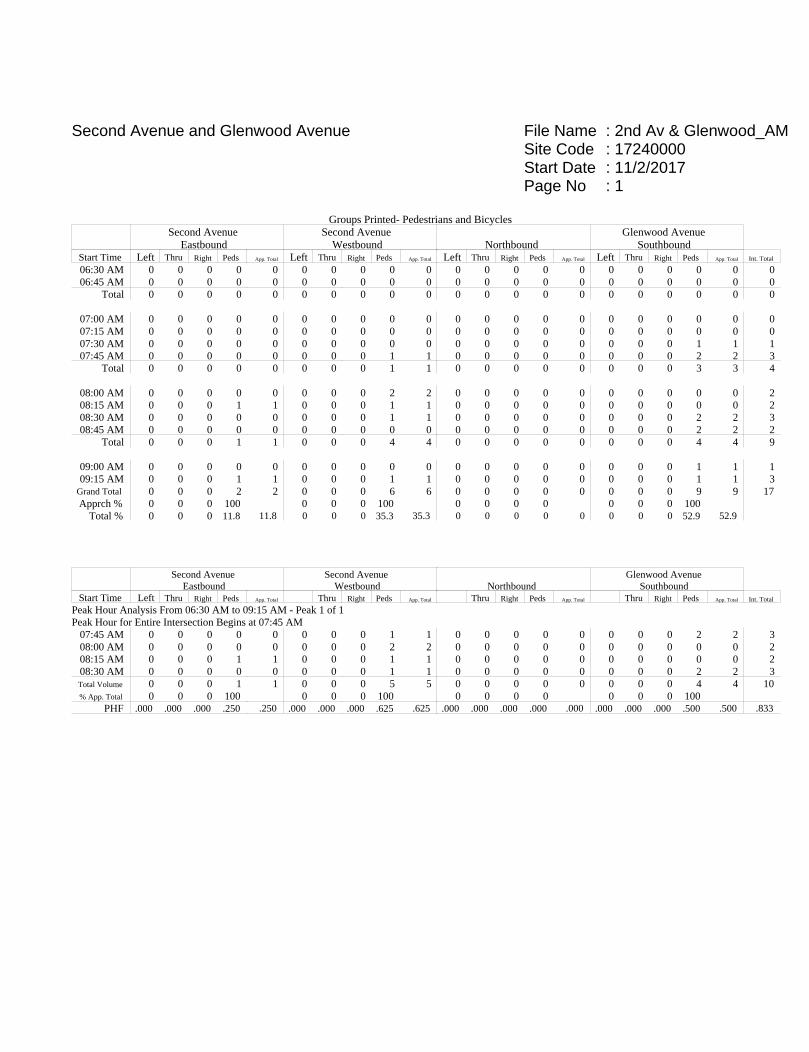
File Name : 2nd Av & Glenwood_AMSite Code : 17240000Start Date : 11/2/2017Page No : 1
Second Avenue and Glenwood Avenue
Groups Printed- Pedestrians and BicyclesSecond Avenue
EastboundSecond Avenue
Westbound NorthboundGlenwood Avenue
SouthboundStart Time Left Thru Right Peds App. Total Left Thru Right Peds App. Total Left Thru Right Peds App. Total Left Thru Right Peds App. Total Int. Total
06:30 AM 0 0 0 0 0 0 0 0 0 0 0 0 0 0 0 0 0 0 0 0 006:45 AM 0 0 0 0 0 0 0 0 0 0 0 0 0 0 0 0 0 0 0 0 0
Total 0 0 0 0 0 0 0 0 0 0 0 0 0 0 0 0 0 0 0 0 0
07:00 AM 0 0 0 0 0 0 0 0 0 0 0 0 0 0 0 0 0 0 0 0 007:15 AM 0 0 0 0 0 0 0 0 0 0 0 0 0 0 0 0 0 0 0 0 007:30 AM 0 0 0 0 0 0 0 0 0 0 0 0 0 0 0 0 0 0 1 1 107:45 AM 0 0 0 0 0 0 0 0 1 1 0 0 0 0 0 0 0 0 2 2 3
Total 0 0 0 0 0 0 0 0 1 1 0 0 0 0 0 0 0 0 3 3 4
08:00 AM 0 0 0 0 0 0 0 0 2 2 0 0 0 0 0 0 0 0 0 0 208:15 AM 0 0 0 1 1 0 0 0 1 1 0 0 0 0 0 0 0 0 0 0 208:30 AM 0 0 0 0 0 0 0 0 1 1 0 0 0 0 0 0 0 0 2 2 308:45 AM 0 0 0 0 0 0 0 0 0 0 0 0 0 0 0 0 0 0 2 2 2
Total 0 0 0 1 1 0 0 0 4 4 0 0 0 0 0 0 0 0 4 4 9
09:00 AM 0 0 0 0 0 0 0 0 0 0 0 0 0 0 0 0 0 0 1 1 109:15 AM 0 0 0 1 1 0 0 0 1 1 0 0 0 0 0 0 0 0 1 1 3
Grand Total 0 0 0 2 2 0 0 0 6 6 0 0 0 0 0 0 0 0 9 9 17Apprch % 0 0 0 100 0 0 0 100 0 0 0 0 0 0 0 100
Total % 0 0 0 11.8 11.8 0 0 0 35.3 35.3 0 0 0 0 0 0 0 0 52.9 52.9
Second AvenueEastbound
Second AvenueWestbound Northbound
Glenwood AvenueSouthbound
Start Time Left Thru Right Peds App. Total Thru Right Peds App. Total Thru Right Peds App. Total Thru Right Peds App. Total Int. Total
Peak Hour Analysis From 06:30 AM to 09:15 AM - Peak 1 of 1Peak Hour for Entire Intersection Begins at 07:45 AM
07:45 AM 0 0 0 0 0 0 0 0 1 1 0 0 0 0 0 0 0 0 2 2 308:00 AM 0 0 0 0 0 0 0 0 2 2 0 0 0 0 0 0 0 0 0 0 208:15 AM 0 0 0 1 1 0 0 0 1 1 0 0 0 0 0 0 0 0 0 0 208:30 AM 0 0 0 0 0 0 0 0 1 1 0 0 0 0 0 0 0 0 2 2 3Total Volume 0 0 0 1 1 0 0 0 5 5 0 0 0 0 0 0 0 0 4 4 10% App. Total 0 0 0 100 0 0 0 100 0 0 0 0 0 0 0 100
PHF .000 .000 .000 .250 .250 .000 .000 .000 .625 .625 .000 .000 .000 .000 .000 .000 .000 .000 .500 .500 .833
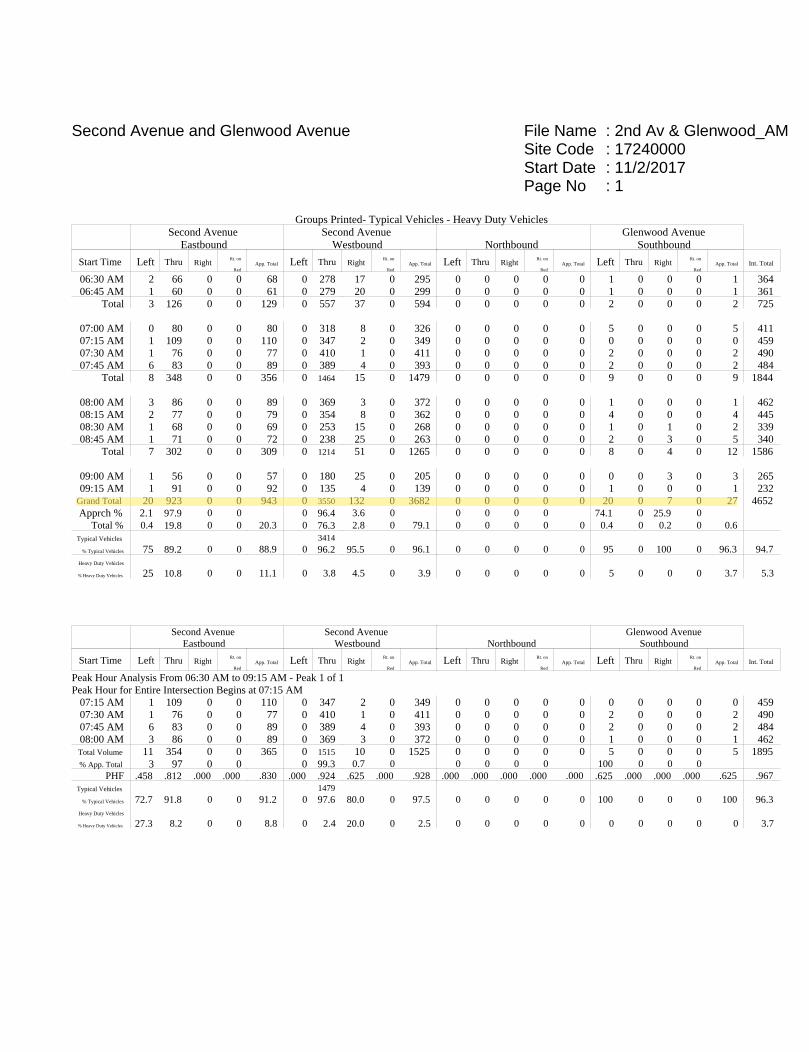
File Name : 2nd Av & Glenwood_AMSite Code : 17240000Start Date : 11/2/2017Page No : 1
Second Avenue and Glenwood Avenue
Groups Printed- Typical Vehicles - Heavy Duty VehiclesSecond Avenue
EastboundSecond Avenue
Westbound NorthboundGlenwood Avenue
Southbound
Start Time Left Thru RightRt. on
RedApp. Total Left Thru Right
Rt. on
RedApp. Total Left Thru Right
Rt. on
RedApp. Total Left Thru Right
Rt. on
RedApp. Total Int. Total
06:30 AM 2 66 0 0 68 0 278 17 0 295 0 0 0 0 0 1 0 0 0 1 36406:45 AM 1 60 0 0 61 0 279 20 0 299 0 0 0 0 0 1 0 0 0 1 361
Total 3 126 0 0 129 0 557 37 0 594 0 0 0 0 0 2 0 0 0 2 725
07:00 AM 0 80 0 0 80 0 318 8 0 326 0 0 0 0 0 5 0 0 0 5 41107:15 AM 1 109 0 0 110 0 347 2 0 349 0 0 0 0 0 0 0 0 0 0 45907:30 AM 1 76 0 0 77 0 410 1 0 411 0 0 0 0 0 2 0 0 0 2 49007:45 AM 6 83 0 0 89 0 389 4 0 393 0 0 0 0 0 2 0 0 0 2 484
Total 8 348 0 0 356 0 1464 15 0 1479 0 0 0 0 0 9 0 0 0 9 1844
08:00 AM 3 86 0 0 89 0 369 3 0 372 0 0 0 0 0 1 0 0 0 1 46208:15 AM 2 77 0 0 79 0 354 8 0 362 0 0 0 0 0 4 0 0 0 4 44508:30 AM 1 68 0 0 69 0 253 15 0 268 0 0 0 0 0 1 0 1 0 2 33908:45 AM 1 71 0 0 72 0 238 25 0 263 0 0 0 0 0 2 0 3 0 5 340
Total 7 302 0 0 309 0 1214 51 0 1265 0 0 0 0 0 8 0 4 0 12 1586
09:00 AM 1 56 0 0 57 0 180 25 0 205 0 0 0 0 0 0 0 3 0 3 26509:15 AM 1 91 0 0 92 0 135 4 0 139 0 0 0 0 0 1 0 0 0 1 232
Grand Total 20 923 0 0 943 0 3550 132 0 3682 0 0 0 0 0 20 0 7 0 27 4652Apprch % 2.1 97.9 0 0 0 96.4 3.6 0 0 0 0 0 74.1 0 25.9 0
Total % 0.4 19.8 0 0 20.3 0 76.3 2.8 0 79.1 0 0 0 0 0 0.4 0 0.2 0 0.6Typical Vehicles 3414
% Typical Vehicles 75 89.2 0 0 88.9 0 96.2 95.5 0 96.1 0 0 0 0 0 95 0 100 0 96.3 94.7Heavy Duty Vehicles
% Heavy Duty Vehicles 25 10.8 0 0 11.1 0 3.8 4.5 0 3.9 0 0 0 0 0 5 0 0 0 3.7 5.3
Second AvenueEastbound
Second AvenueWestbound Northbound
Glenwood AvenueSouthbound
Start Time Left Thru RightRt. on
RedApp. Total Left Thru Right
Rt. on
RedApp. Total Left Thru Right
Rt. on
RedApp. Total Left Thru Right
Rt. on
RedApp. Total Int. Total
Peak Hour Analysis From 06:30 AM to 09:15 AM - Peak 1 of 1Peak Hour for Entire Intersection Begins at 07:15 AM
07:15 AM 1 109 0 0 110 0 347 2 0 349 0 0 0 0 0 0 0 0 0 0 45907:30 AM 1 76 0 0 77 0 410 1 0 411 0 0 0 0 0 2 0 0 0 2 49007:45 AM 6 83 0 0 89 0 389 4 0 393 0 0 0 0 0 2 0 0 0 2 48408:00 AM 3 86 0 0 89 0 369 3 0 372 0 0 0 0 0 1 0 0 0 1 462Total Volume 11 354 0 0 365 0 1515 10 0 1525 0 0 0 0 0 5 0 0 0 5 1895% App. Total 3 97 0 0 0 99.3 0.7 0 0 0 0 0 100 0 0 0
PHF .458 .812 .000 .000 .830 .000 .924 .625 .000 .928 .000 .000 .000 .000 .000 .625 .000 .000 .000 .625 .967Typical Vehicles 1479
% Typical Vehicles 72.7 91.8 0 0 91.2 0 97.6 80.0 0 97.5 0 0 0 0 0 100 0 0 0 100 96.3Heavy Duty Vehicles
% Heavy Duty Vehicles 27.3 8.2 0 0 8.8 0 2.4 20.0 0 2.5 0 0 0 0 0 0 0 0 0 0 3.7
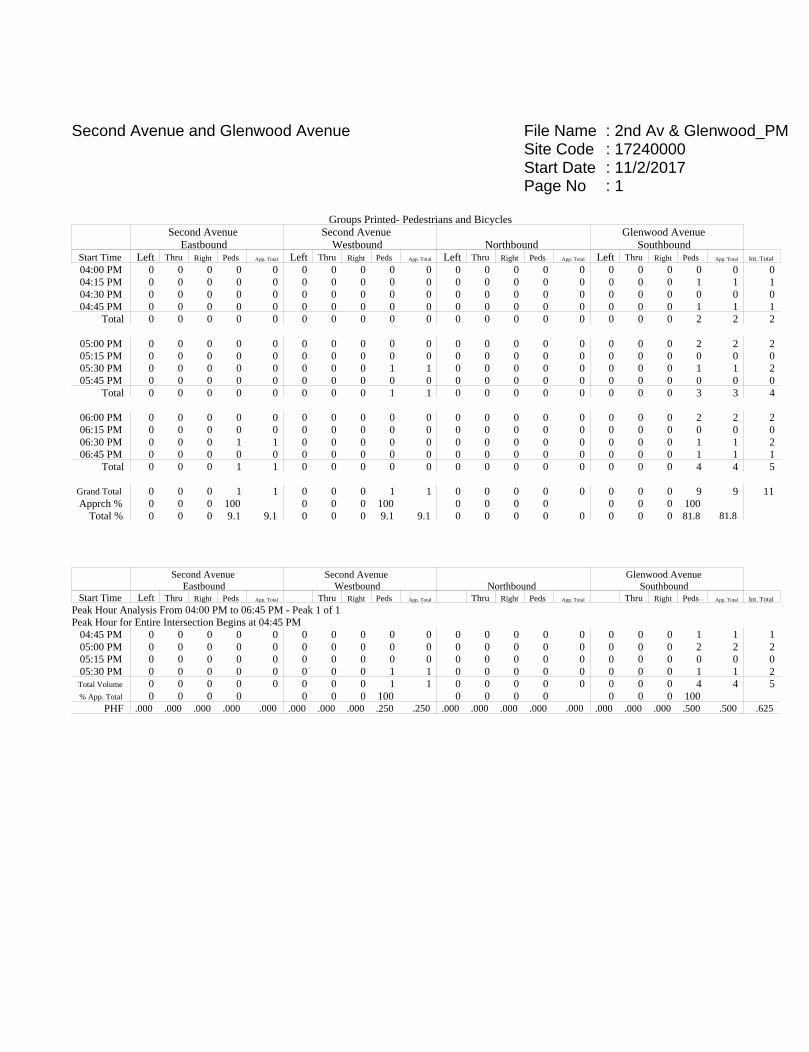
File Name : 2nd Av & Glenwood_PMSite Code : 17240000Start Date : 11/2/2017Page No : 1
Second Avenue and Glenwood Avenue
Groups Printed- Pedestrians and BicyclesSecond Avenue
EastboundSecond Avenue
Westbound NorthboundGlenwood Avenue
SouthboundStart Time Left Thru Right Peds App. Total Left Thru Right Peds App. Total Left Thru Right Peds App. Total Left Thru Right Peds App. Total Int. Total
04:00 PM 0 0 0 0 0 0 0 0 0 0 0 0 0 0 0 0 0 0 0 0 004:15 PM 0 0 0 0 0 0 0 0 0 0 0 0 0 0 0 0 0 0 1 1 104:30 PM 0 0 0 0 0 0 0 0 0 0 0 0 0 0 0 0 0 0 0 0 004:45 PM 0 0 0 0 0 0 0 0 0 0 0 0 0 0 0 0 0 0 1 1 1
Total 0 0 0 0 0 0 0 0 0 0 0 0 0 0 0 0 0 0 2 2 2
05:00 PM 0 0 0 0 0 0 0 0 0 0 0 0 0 0 0 0 0 0 2 2 205:15 PM 0 0 0 0 0 0 0 0 0 0 0 0 0 0 0 0 0 0 0 0 005:30 PM 0 0 0 0 0 0 0 0 1 1 0 0 0 0 0 0 0 0 1 1 205:45 PM 0 0 0 0 0 0 0 0 0 0 0 0 0 0 0 0 0 0 0 0 0
Total 0 0 0 0 0 0 0 0 1 1 0 0 0 0 0 0 0 0 3 3 4
06:00 PM 0 0 0 0 0 0 0 0 0 0 0 0 0 0 0 0 0 0 2 2 206:15 PM 0 0 0 0 0 0 0 0 0 0 0 0 0 0 0 0 0 0 0 0 006:30 PM 0 0 0 1 1 0 0 0 0 0 0 0 0 0 0 0 0 0 1 1 206:45 PM 0 0 0 0 0 0 0 0 0 0 0 0 0 0 0 0 0 0 1 1 1
Total 0 0 0 1 1 0 0 0 0 0 0 0 0 0 0 0 0 0 4 4 5
Grand Total 0 0 0 1 1 0 0 0 1 1 0 0 0 0 0 0 0 0 9 9 11Apprch % 0 0 0 100 0 0 0 100 0 0 0 0 0 0 0 100
Total % 0 0 0 9.1 9.1 0 0 0 9.1 9.1 0 0 0 0 0 0 0 0 81.8 81.8
Second AvenueEastbound
Second AvenueWestbound Northbound
Glenwood AvenueSouthbound
Start Time Left Thru Right Peds App. Total Thru Right Peds App. Total Thru Right Peds App. Total Thru Right Peds App. Total Int. Total
Peak Hour Analysis From 04:00 PM to 06:45 PM - Peak 1 of 1Peak Hour for Entire Intersection Begins at 04:45 PM
04:45 PM 0 0 0 0 0 0 0 0 0 0 0 0 0 0 0 0 0 0 1 1 105:00 PM 0 0 0 0 0 0 0 0 0 0 0 0 0 0 0 0 0 0 2 2 205:15 PM 0 0 0 0 0 0 0 0 0 0 0 0 0 0 0 0 0 0 0 0 005:30 PM 0 0 0 0 0 0 0 0 1 1 0 0 0 0 0 0 0 0 1 1 2Total Volume 0 0 0 0 0 0 0 0 1 1 0 0 0 0 0 0 0 0 4 4 5% App. Total 0 0 0 0 0 0 0 100 0 0 0 0 0 0 0 100
PHF .000 .000 .000 .000 .000 .000 .000 .000 .250 .250 .000 .000 .000 .000 .000 .000 .000 .000 .500 .500 .625

File Name : 2nd Av & Glenwood_PMSite Code : 17240000Start Date : 11/2/2017Page No : 1
Second Avenue and Glenwood Avenue
Groups Printed- Typical Vehicles - Heavy Duty VehiclesSecond Avenue
EastboundSecond Avenue
Westbound NorthboundGlenwood Avenue
Southbound
Start Time Left Thru RightRt. on
RedApp. Total Left Thru Right
Rt. on
RedApp. Total Left Thru Right
Rt. on
RedApp. Total Left Thru Right
Rt. on
RedApp. Total Int. Total
04:00 PM 1 208 0 0 209 0 90 5 0 95 0 0 0 0 0 13 0 1 0 14 31804:15 PM 1 220 0 0 221 0 94 7 0 101 0 0 0 0 0 19 0 3 0 22 34404:30 PM 0 267 1 0 268 0 95 6 0 101 0 0 0 0 0 17 0 1 0 18 38704:45 PM 0 264 0 0 264 0 118 4 0 122 0 0 0 0 0 6 0 1 0 7 393
Total 2 959 1 0 962 0 397 22 0 419 0 0 0 0 0 55 0 6 0 61 1442
05:00 PM 0 258 0 0 258 0 110 3 0 113 0 0 0 0 0 17 0 0 0 17 38805:15 PM 0 244 0 0 244 0 104 2 0 106 0 0 0 0 0 14 0 0 0 14 36405:30 PM 0 228 0 0 228 0 100 5 0 105 0 0 0 0 0 13 0 0 0 13 34605:45 PM 2 219 0 0 221 0 109 4 0 113 0 0 0 0 0 8 0 0 0 8 342
Total 2 949 0 0 951 0 423 14 0 437 0 0 0 0 0 52 0 0 0 52 1440
06:00 PM 1 212 0 0 213 0 105 7 0 112 0 0 0 0 0 6 0 1 0 7 33206:15 PM 0 181 0 0 181 0 95 7 0 102 0 0 0 0 0 1 0 0 0 1 28406:30 PM 0 146 0 0 146 0 92 3 0 95 0 0 0 0 0 3 0 0 0 3 24406:45 PM 2 116 0 0 118 0 75 3 0 78 0 0 0 0 0 2 0 1 0 3 199
Total 3 655 0 0 658 0 367 20 0 387 0 0 0 0 0 12 0 2 0 14 1059
Grand Total 7 2563 1 0 2571 0 1187 56 0 1243 0 0 0 0 0 119 0 8 0 127 3941Apprch % 0.3 99.7 0 0 0 95.5 4.5 0 0 0 0 0 93.7 0 6.3 0
Total % 0.2 65 0 0 65.2 0 30.1 1.4 0 31.5 0 0 0 0 0 3 0 0.2 0 3.2Typical Vehicles 2504 1141
% Typical Vehicles 85.7 97.7 0 0 97.6 0 96.1 98.2 0 96.2 0 0 0 0 0 97.5 0 87.5 0 96.9 97.2Heavy Duty Vehicles
% Heavy Duty Vehicles 14.3 2.3 100 0 2.4 0 3.9 1.8 0 3.8 0 0 0 0 0 2.5 0 12.5 0 3.1 2.8
Second AvenueEastbound
Second AvenueWestbound Northbound
Glenwood AvenueSouthbound
Start Time Left Thru RightRt. on
RedApp. Total Left Thru Right
Rt. on
RedApp. Total Left Thru Right
Rt. on
RedApp. Total Left Thru Right
Rt. on
RedApp. Total Int. Total
Peak Hour Analysis From 04:00 PM to 06:45 PM - Peak 1 of 1Peak Hour for Entire Intersection Begins at 04:30 PM
04:30 PM 0 267 1 0 268 0 95 6 0 101 0 0 0 0 0 17 0 1 0 18 38704:45 PM 0 264 0 0 264 0 118 4 0 122 0 0 0 0 0 6 0 1 0 7 39305:00 PM 0 258 0 0 258 0 110 3 0 113 0 0 0 0 0 17 0 0 0 17 38805:15 PM 0 244 0 0 244 0 104 2 0 106 0 0 0 0 0 14 0 0 0 14 364Total Volume 0 1033 1 0 1034 0 427 15 0 442 0 0 0 0 0 54 0 2 0 56 1532% App. Total 0 99.9 0.1 0 0 96.6 3.4 0 0 0 0 0 96.4 0 3.6 0
PHF .000 .967 .250 .000 .965 .000 .905 .625 .000 .906 .000 .000 .000 .000 .000 .794 .000 .500 .000 .778 .975Typical Vehicles 1012
% Typical Vehicles 0 98.0 0 0 97.9 0 97.0 100 0 97.1 0 0 0 0 0 98.1 0 50.0 0 96.4 97.6Heavy Duty Vehicles
% Heavy Duty Vehicles 0 2.0 100 0 2.1 0 3.0 0 0 2.9 0 0 0 0 0 1.9 0 50.0 0 3.6 2.4
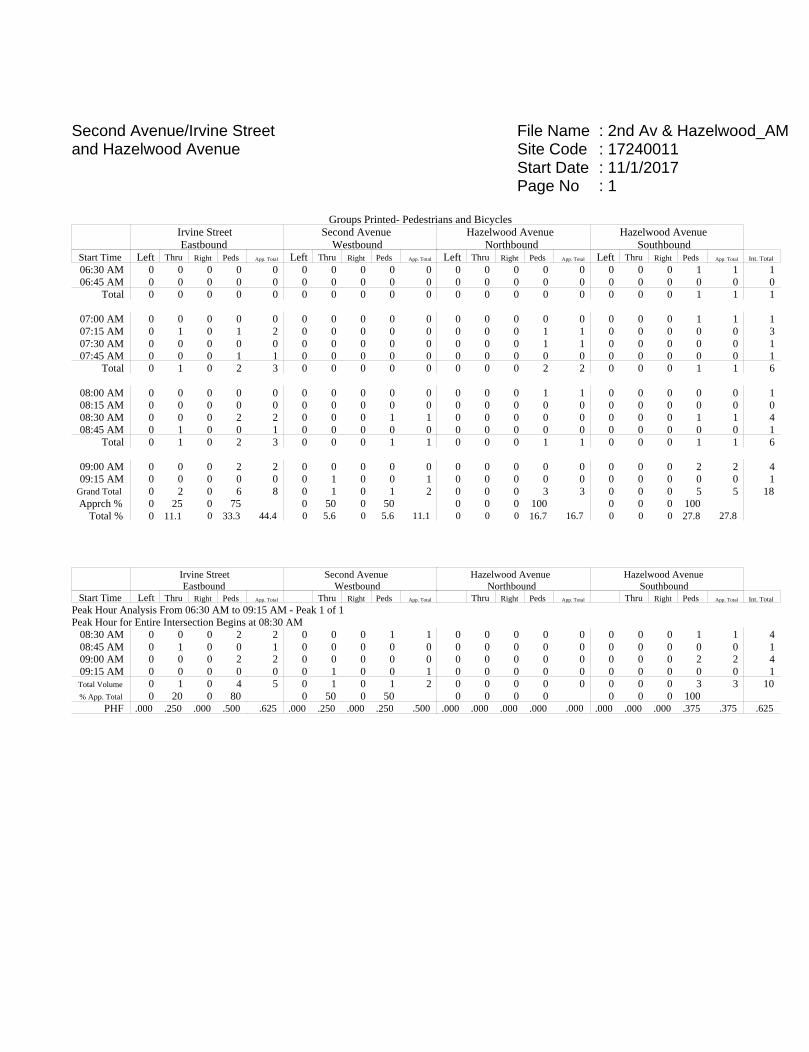
File Name : 2nd Av & Hazelwood_AMSite Code : 17240011Start Date : 11/1/2017Page No : 1
Second Avenue/Irvine Streetand Hazelwood Avenue
Groups Printed- Pedestrians and BicyclesIrvine StreetEastbound
Second AvenueWestbound
Hazelwood AvenueNorthbound
Hazelwood AvenueSouthbound
Start Time Left Thru Right Peds App. Total Left Thru Right Peds App. Total Left Thru Right Peds App. Total Left Thru Right Peds App. Total Int. Total
06:30 AM 0 0 0 0 0 0 0 0 0 0 0 0 0 0 0 0 0 0 1 1 106:45 AM 0 0 0 0 0 0 0 0 0 0 0 0 0 0 0 0 0 0 0 0 0
Total 0 0 0 0 0 0 0 0 0 0 0 0 0 0 0 0 0 0 1 1 1
07:00 AM 0 0 0 0 0 0 0 0 0 0 0 0 0 0 0 0 0 0 1 1 107:15 AM 0 1 0 1 2 0 0 0 0 0 0 0 0 1 1 0 0 0 0 0 307:30 AM 0 0 0 0 0 0 0 0 0 0 0 0 0 1 1 0 0 0 0 0 107:45 AM 0 0 0 1 1 0 0 0 0 0 0 0 0 0 0 0 0 0 0 0 1
Total 0 1 0 2 3 0 0 0 0 0 0 0 0 2 2 0 0 0 1 1 6
08:00 AM 0 0 0 0 0 0 0 0 0 0 0 0 0 1 1 0 0 0 0 0 108:15 AM 0 0 0 0 0 0 0 0 0 0 0 0 0 0 0 0 0 0 0 0 008:30 AM 0 0 0 2 2 0 0 0 1 1 0 0 0 0 0 0 0 0 1 1 408:45 AM 0 1 0 0 1 0 0 0 0 0 0 0 0 0 0 0 0 0 0 0 1
Total 0 1 0 2 3 0 0 0 1 1 0 0 0 1 1 0 0 0 1 1 6
09:00 AM 0 0 0 2 2 0 0 0 0 0 0 0 0 0 0 0 0 0 2 2 409:15 AM 0 0 0 0 0 0 1 0 0 1 0 0 0 0 0 0 0 0 0 0 1
Grand Total 0 2 0 6 8 0 1 0 1 2 0 0 0 3 3 0 0 0 5 5 18Apprch % 0 25 0 75 0 50 0 50 0 0 0 100 0 0 0 100
Total % 0 11.1 0 33.3 44.4 0 5.6 0 5.6 11.1 0 0 0 16.7 16.7 0 0 0 27.8 27.8
Irvine StreetEastbound
Second AvenueWestbound
Hazelwood AvenueNorthbound
Hazelwood AvenueSouthbound
Start Time Left Thru Right Peds App. Total Thru Right Peds App. Total Thru Right Peds App. Total Thru Right Peds App. Total Int. Total
Peak Hour Analysis From 06:30 AM to 09:15 AM - Peak 1 of 1Peak Hour for Entire Intersection Begins at 08:30 AM
08:30 AM 0 0 0 2 2 0 0 0 1 1 0 0 0 0 0 0 0 0 1 1 408:45 AM 0 1 0 0 1 0 0 0 0 0 0 0 0 0 0 0 0 0 0 0 109:00 AM 0 0 0 2 2 0 0 0 0 0 0 0 0 0 0 0 0 0 2 2 409:15 AM 0 0 0 0 0 0 1 0 0 1 0 0 0 0 0 0 0 0 0 0 1Total Volume 0 1 0 4 5 0 1 0 1 2 0 0 0 0 0 0 0 0 3 3 10% App. Total 0 20 0 80 0 50 0 50 0 0 0 0 0 0 0 100
PHF .000 .250 .000 .500 .625 .000 .250 .000 .250 .500 .000 .000 .000 .000 .000 .000 .000 .000 .375 .375 .625
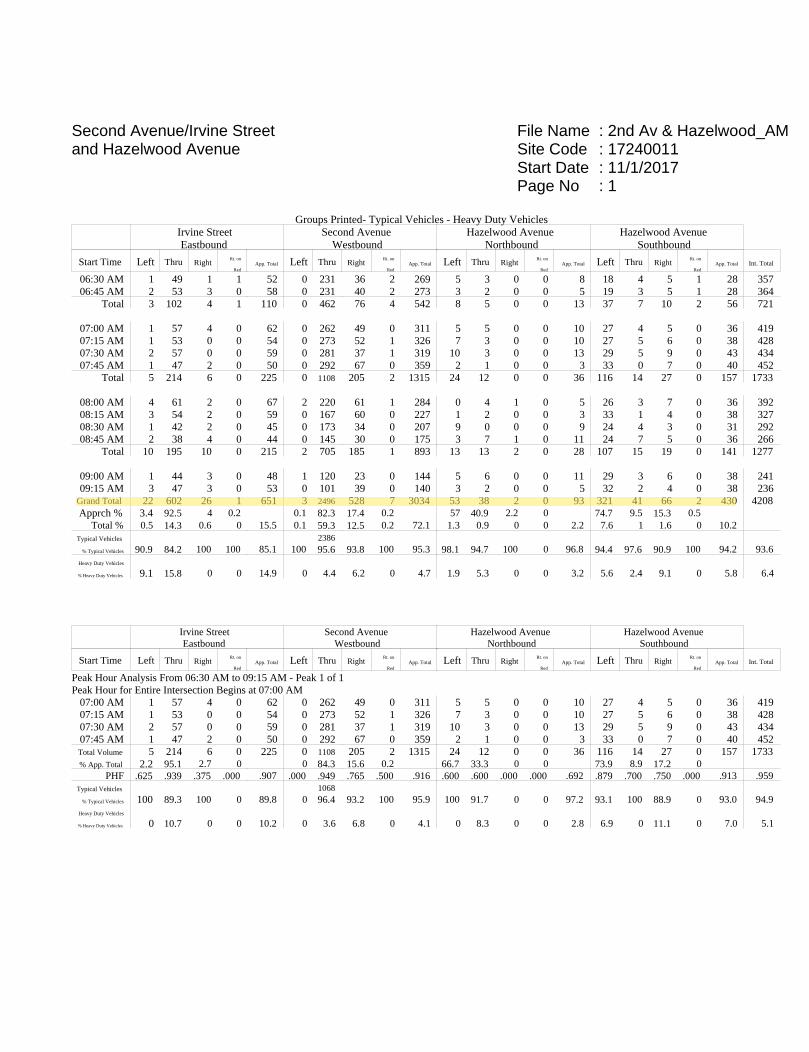
File Name : 2nd Av & Hazelwood_AMSite Code : 17240011Start Date : 11/1/2017Page No : 1
Second Avenue/Irvine Streetand Hazelwood Avenue
Groups Printed- Typical Vehicles - Heavy Duty VehiclesIrvine StreetEastbound
Second AvenueWestbound
Hazelwood AvenueNorthbound
Hazelwood AvenueSouthbound
Start Time Left Thru RightRt. on
RedApp. Total Left Thru Right
Rt. on
RedApp. Total Left Thru Right
Rt. on
RedApp. Total Left Thru Right
Rt. on
RedApp. Total Int. Total
06:30 AM 1 49 1 1 52 0 231 36 2 269 5 3 0 0 8 18 4 5 1 28 35706:45 AM 2 53 3 0 58 0 231 40 2 273 3 2 0 0 5 19 3 5 1 28 364
Total 3 102 4 1 110 0 462 76 4 542 8 5 0 0 13 37 7 10 2 56 721
07:00 AM 1 57 4 0 62 0 262 49 0 311 5 5 0 0 10 27 4 5 0 36 41907:15 AM 1 53 0 0 54 0 273 52 1 326 7 3 0 0 10 27 5 6 0 38 42807:30 AM 2 57 0 0 59 0 281 37 1 319 10 3 0 0 13 29 5 9 0 43 43407:45 AM 1 47 2 0 50 0 292 67 0 359 2 1 0 0 3 33 0 7 0 40 452
Total 5 214 6 0 225 0 1108 205 2 1315 24 12 0 0 36 116 14 27 0 157 1733
08:00 AM 4 61 2 0 67 2 220 61 1 284 0 4 1 0 5 26 3 7 0 36 39208:15 AM 3 54 2 0 59 0 167 60 0 227 1 2 0 0 3 33 1 4 0 38 32708:30 AM 1 42 2 0 45 0 173 34 0 207 9 0 0 0 9 24 4 3 0 31 29208:45 AM 2 38 4 0 44 0 145 30 0 175 3 7 1 0 11 24 7 5 0 36 266
Total 10 195 10 0 215 2 705 185 1 893 13 13 2 0 28 107 15 19 0 141 1277
09:00 AM 1 44 3 0 48 1 120 23 0 144 5 6 0 0 11 29 3 6 0 38 24109:15 AM 3 47 3 0 53 0 101 39 0 140 3 2 0 0 5 32 2 4 0 38 236
Grand Total 22 602 26 1 651 3 2496 528 7 3034 53 38 2 0 93 321 41 66 2 430 4208Apprch % 3.4 92.5 4 0.2 0.1 82.3 17.4 0.2 57 40.9 2.2 0 74.7 9.5 15.3 0.5
Total % 0.5 14.3 0.6 0 15.5 0.1 59.3 12.5 0.2 72.1 1.3 0.9 0 0 2.2 7.6 1 1.6 0 10.2Typical Vehicles 2386
% Typical Vehicles 90.9 84.2 100 100 85.1 100 95.6 93.8 100 95.3 98.1 94.7 100 0 96.8 94.4 97.6 90.9 100 94.2 93.6Heavy Duty Vehicles
% Heavy Duty Vehicles 9.1 15.8 0 0 14.9 0 4.4 6.2 0 4.7 1.9 5.3 0 0 3.2 5.6 2.4 9.1 0 5.8 6.4
Irvine StreetEastbound
Second AvenueWestbound
Hazelwood AvenueNorthbound
Hazelwood AvenueSouthbound
Start Time Left Thru RightRt. on
RedApp. Total Left Thru Right
Rt. on
RedApp. Total Left Thru Right
Rt. on
RedApp. Total Left Thru Right
Rt. on
RedApp. Total Int. Total
Peak Hour Analysis From 06:30 AM to 09:15 AM - Peak 1 of 1Peak Hour for Entire Intersection Begins at 07:00 AM
07:00 AM 1 57 4 0 62 0 262 49 0 311 5 5 0 0 10 27 4 5 0 36 41907:15 AM 1 53 0 0 54 0 273 52 1 326 7 3 0 0 10 27 5 6 0 38 42807:30 AM 2 57 0 0 59 0 281 37 1 319 10 3 0 0 13 29 5 9 0 43 43407:45 AM 1 47 2 0 50 0 292 67 0 359 2 1 0 0 3 33 0 7 0 40 452Total Volume 5 214 6 0 225 0 1108 205 2 1315 24 12 0 0 36 116 14 27 0 157 1733% App. Total 2.2 95.1 2.7 0 0 84.3 15.6 0.2 66.7 33.3 0 0 73.9 8.9 17.2 0
PHF .625 .939 .375 .000 .907 .000 .949 .765 .500 .916 .600 .600 .000 .000 .692 .879 .700 .750 .000 .913 .959Typical Vehicles 1068
% Typical Vehicles 100 89.3 100 0 89.8 0 96.4 93.2 100 95.9 100 91.7 0 0 97.2 93.1 100 88.9 0 93.0 94.9Heavy Duty Vehicles
% Heavy Duty Vehicles 0 10.7 0 0 10.2 0 3.6 6.8 0 4.1 0 8.3 0 0 2.8 6.9 0 11.1 0 7.0 5.1
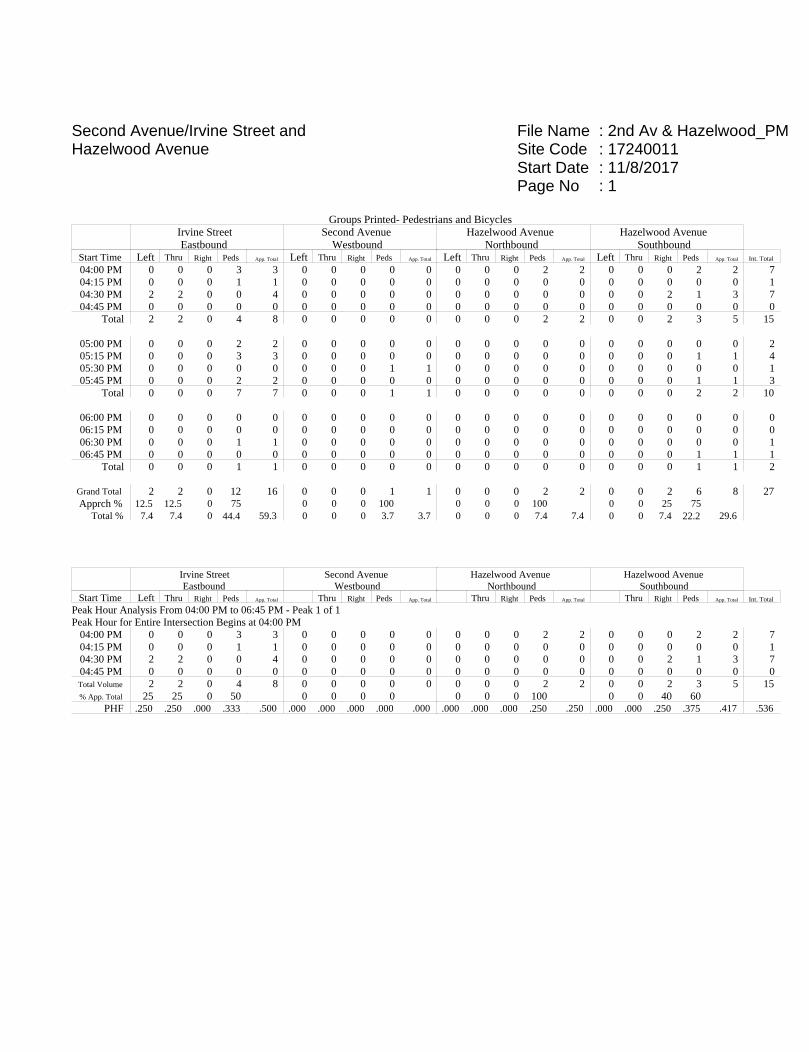
File Name : 2nd Av & Hazelwood_PMSite Code : 17240011Start Date : 11/8/2017Page No : 1
Second Avenue/Irvine Street andHazelwood Avenue
Groups Printed- Pedestrians and BicyclesIrvine StreetEastbound
Second AvenueWestbound
Hazelwood AvenueNorthbound
Hazelwood AvenueSouthbound
Start Time Left Thru Right Peds App. Total Left Thru Right Peds App. Total Left Thru Right Peds App. Total Left Thru Right Peds App. Total Int. Total
04:00 PM 0 0 0 3 3 0 0 0 0 0 0 0 0 2 2 0 0 0 2 2 704:15 PM 0 0 0 1 1 0 0 0 0 0 0 0 0 0 0 0 0 0 0 0 104:30 PM 2 2 0 0 4 0 0 0 0 0 0 0 0 0 0 0 0 2 1 3 704:45 PM 0 0 0 0 0 0 0 0 0 0 0 0 0 0 0 0 0 0 0 0 0
Total 2 2 0 4 8 0 0 0 0 0 0 0 0 2 2 0 0 2 3 5 15
05:00 PM 0 0 0 2 2 0 0 0 0 0 0 0 0 0 0 0 0 0 0 0 205:15 PM 0 0 0 3 3 0 0 0 0 0 0 0 0 0 0 0 0 0 1 1 405:30 PM 0 0 0 0 0 0 0 0 1 1 0 0 0 0 0 0 0 0 0 0 105:45 PM 0 0 0 2 2 0 0 0 0 0 0 0 0 0 0 0 0 0 1 1 3
Total 0 0 0 7 7 0 0 0 1 1 0 0 0 0 0 0 0 0 2 2 10
06:00 PM 0 0 0 0 0 0 0 0 0 0 0 0 0 0 0 0 0 0 0 0 006:15 PM 0 0 0 0 0 0 0 0 0 0 0 0 0 0 0 0 0 0 0 0 006:30 PM 0 0 0 1 1 0 0 0 0 0 0 0 0 0 0 0 0 0 0 0 106:45 PM 0 0 0 0 0 0 0 0 0 0 0 0 0 0 0 0 0 0 1 1 1
Total 0 0 0 1 1 0 0 0 0 0 0 0 0 0 0 0 0 0 1 1 2
Grand Total 2 2 0 12 16 0 0 0 1 1 0 0 0 2 2 0 0 2 6 8 27Apprch % 12.5 12.5 0 75 0 0 0 100 0 0 0 100 0 0 25 75
Total % 7.4 7.4 0 44.4 59.3 0 0 0 3.7 3.7 0 0 0 7.4 7.4 0 0 7.4 22.2 29.6
Irvine StreetEastbound
Second AvenueWestbound
Hazelwood AvenueNorthbound
Hazelwood AvenueSouthbound
Start Time Left Thru Right Peds App. Total Thru Right Peds App. Total Thru Right Peds App. Total Thru Right Peds App. Total Int. Total
Peak Hour Analysis From 04:00 PM to 06:45 PM - Peak 1 of 1Peak Hour for Entire Intersection Begins at 04:00 PM
04:00 PM 0 0 0 3 3 0 0 0 0 0 0 0 0 2 2 0 0 0 2 2 704:15 PM 0 0 0 1 1 0 0 0 0 0 0 0 0 0 0 0 0 0 0 0 104:30 PM 2 2 0 0 4 0 0 0 0 0 0 0 0 0 0 0 0 2 1 3 704:45 PM 0 0 0 0 0 0 0 0 0 0 0 0 0 0 0 0 0 0 0 0 0Total Volume 2 2 0 4 8 0 0 0 0 0 0 0 0 2 2 0 0 2 3 5 15% App. Total 25 25 0 50 0 0 0 0 0 0 0 100 0 0 40 60
PHF .250 .250 .000 .333 .500 .000 .000 .000 .000 .000 .000 .000 .000 .250 .250 .000 .000 .250 .375 .417 .536

File Name : 2nd Av & Hazelwood_PMSite Code : 17240011Start Date : 11/8/2017Page No : 1
Second Avenue/Irvine Street andHazelwood Avenue
Groups Printed- Typical Vehicles - Heavy Duty VehiclesIrvine StreetEastbound
Second AvenueWestbound
Hazelwood AvenueNorthbound
Hazelwood AvenueSouthbound
Start Time Left Thru RightRt. on
RedApp. Total Left Thru Right
Rt. on
RedApp. Total Left Thru Right
Rt. on
RedApp. Total Left Thru Right
Rt. on
RedApp. Total Int. Total
04:00 PM 8 128 3 0 139 0 65 47 0 112 1 4 0 0 5 40 6 2 0 48 30404:15 PM 16 136 2 0 154 1 59 39 0 99 3 8 0 0 11 40 6 3 0 49 31304:30 PM 10 116 2 0 128 1 66 44 0 111 2 7 0 0 9 50 7 6 0 63 31104:45 PM 6 127 1 0 134 0 66 48 0 114 2 5 0 0 7 62 11 3 0 76 331
Total 40 507 8 0 555 2 256 178 0 436 8 24 0 0 32 192 30 14 0 236 1259
05:00 PM 9 144 4 0 157 0 63 60 0 123 2 6 0 0 8 53 2 5 0 60 34805:15 PM 9 133 4 0 146 0 73 47 0 120 0 2 0 0 2 60 8 0 0 68 33605:30 PM 12 153 5 0 170 0 82 43 0 125 3 1 0 0 4 48 4 1 0 53 35205:45 PM 9 147 5 0 161 0 63 47 0 110 2 1 0 0 3 59 3 3 0 65 339
Total 39 577 18 0 634 0 281 197 0 478 7 10 0 0 17 220 17 9 0 246 1375
06:00 PM 21 180 6 0 207 0 78 24 0 102 7 4 0 0 11 45 6 1 0 52 37206:15 PM 23 122 3 0 148 2 65 44 0 111 0 2 0 0 2 37 0 3 0 40 30106:30 PM 8 131 1 0 140 4 62 30 0 96 6 1 0 0 7 34 3 2 0 39 28206:45 PM 9 75 2 0 86 1 50 31 0 82 3 1 0 0 4 29 8 1 0 38 210
Total 61 508 12 0 581 7 255 129 0 391 16 8 0 0 24 145 17 7 0 169 1165
Grand Total 140 1592 38 0 1770 9 792 504 0 1305 31 42 0 0 73 557 64 30 0 651 3799Apprch % 7.9 89.9 2.1 0 0.7 60.7 38.6 0 42.5 57.5 0 0 85.6 9.8 4.6 0
Total % 3.7 41.9 1 0 46.6 0.2 20.8 13.3 0 34.4 0.8 1.1 0 0 1.9 14.7 1.7 0.8 0 17.1Typical Vehicles 1549
% Typical Vehicles 98.6 97.3 97.4 0 97.4 100 93.7 97.6 0 95.2 96.8 100 0 0 98.6 96.8 98.4 93.3 0 96.8 96.6Heavy Duty Vehicles
% Heavy Duty Vehicles 1.4 2.7 2.6 0 2.6 0 6.3 2.4 0 4.8 3.2 0 0 0 1.4 3.2 1.6 6.7 0 3.2 3.4
Irvine StreetEastbound
Second AvenueWestbound
Hazelwood AvenueNorthbound
Hazelwood AvenueSouthbound
Start Time Left Thru RightRt. on
RedApp. Total Left Thru Right
Rt. on
RedApp. Total Left Thru Right
Rt. on
RedApp. Total Left Thru Right
Rt. on
RedApp. Total Int. Total
Peak Hour Analysis From 04:00 PM to 06:45 PM - Peak 1 of 1Peak Hour for Entire Intersection Begins at 05:15 PM
05:15 PM 9 133 4 0 146 0 73 47 0 120 0 2 0 0 2 60 8 0 0 68 33605:30 PM 12 153 5 0 170 0 82 43 0 125 3 1 0 0 4 48 4 1 0 53 35205:45 PM 9 147 5 0 161 0 63 47 0 110 2 1 0 0 3 59 3 3 0 65 33906:00 PM 21 180 6 0 207 0 78 24 0 102 7 4 0 0 11 45 6 1 0 52 372Total Volume 51 613 20 0 684 0 296 161 0 457 12 8 0 0 20 212 21 5 0 238 1399% App. Total 7.5 89.6 2.9 0 0 64.8 35.2 0 60 40 0 0 89.1 8.8 2.1 0
PHF .607 .851 .833 .000 .826 .000 .902 .856 .000 .914 .429 .500 .000 .000 .455 .883 .656 .417 .000 .875 .940Typical Vehicles
% Typical Vehicles 100 97.9 100 0 98.1 0 97.3 98.1 0 97.6 100 100 0 0 100 98.1 100 80.0 0 97.9 97.9Heavy Duty Vehicles
% Heavy Duty Vehicles 0 2.1 0 0 1.9 0 2.7 1.9 0 2.4 0 0 0 0 0 1.9 0 20.0 0 2.1 2.1
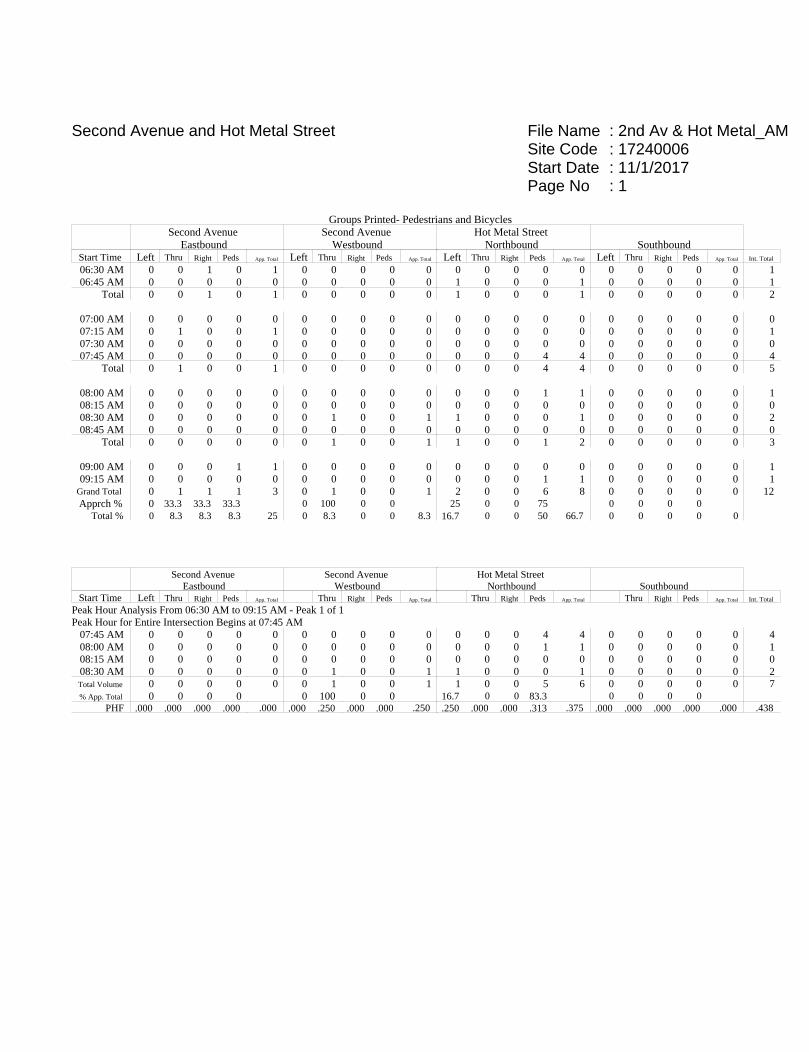
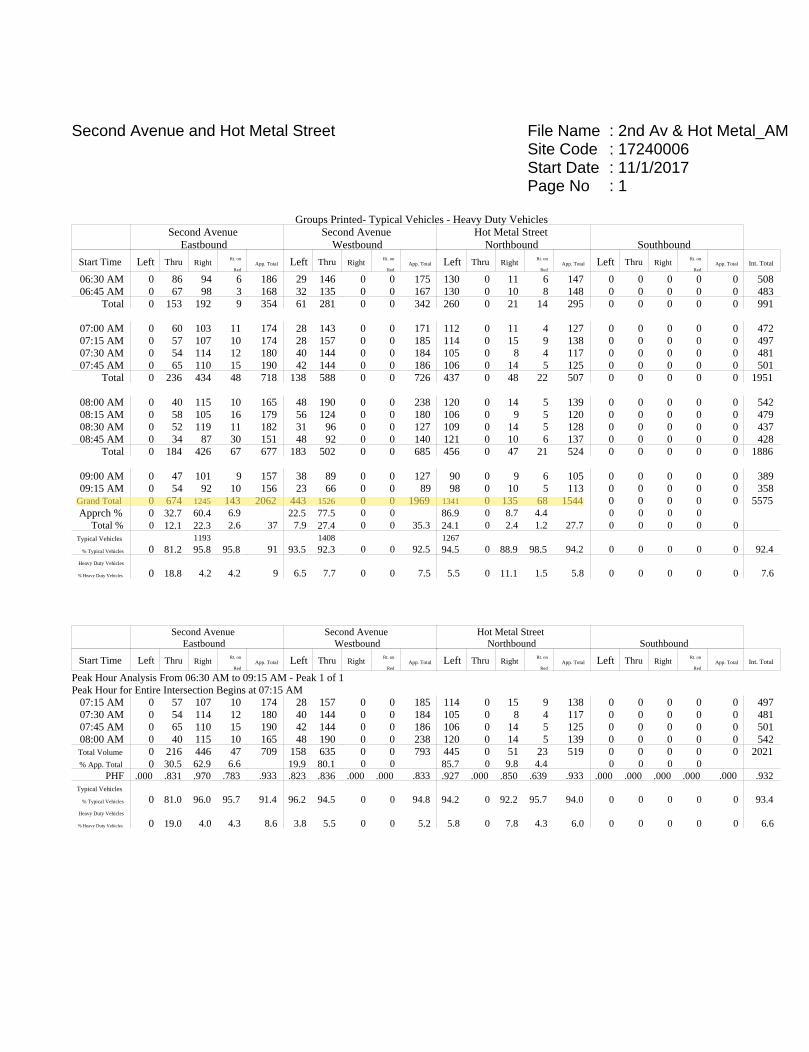
File Name : 2nd Av & Hot Metal_AMSite Code : 17240006Start Date : 11/1/2017Page No : 1
Second Avenue and Hot Metal Street
Groups Printed- Pedestrians and BicyclesSecond Avenue
EastboundSecond Avenue
WestboundHot Metal Street
Northbound SouthboundStart Time Left Thru Right Peds App. Total Left Thru Right Peds App. Total Left Thru Right Peds App. Total Left Thru Right Peds App. Total Int. Total
06:30 AM 0 0 1 0 1 0 0 0 0 0 0 0 0 0 0 0 0 0 0 0 106:45 AM 0 0 0 0 0 0 0 0 0 0 1 0 0 0 1 0 0 0 0 0 1
Total 0 0 1 0 1 0 0 0 0 0 1 0 0 0 1 0 0 0 0 0 2
07:00 AM 0 0 0 0 0 0 0 0 0 0 0 0 0 0 0 0 0 0 0 0 007:15 AM 0 1 0 0 1 0 0 0 0 0 0 0 0 0 0 0 0 0 0 0 107:30 AM 0 0 0 0 0 0 0 0 0 0 0 0 0 0 0 0 0 0 0 0 007:45 AM 0 0 0 0 0 0 0 0 0 0 0 0 0 4 4 0 0 0 0 0 4
Total 0 1 0 0 1 0 0 0 0 0 0 0 0 4 4 0 0 0 0 0 5
08:00 AM 0 0 0 0 0 0 0 0 0 0 0 0 0 1 1 0 0 0 0 0 108:15 AM 0 0 0 0 0 0 0 0 0 0 0 0 0 0 0 0 0 0 0 0 008:30 AM 0 0 0 0 0 0 1 0 0 1 1 0 0 0 1 0 0 0 0 0 208:45 AM 0 0 0 0 0 0 0 0 0 0 0 0 0 0 0 0 0 0 0 0 0
Total 0 0 0 0 0 0 1 0 0 1 1 0 0 1 2 0 0 0 0 0 3
09:00 AM 0 0 0 1 1 0 0 0 0 0 0 0 0 0 0 0 0 0 0 0 109:15 AM 0 0 0 0 0 0 0 0 0 0 0 0 0 1 1 0 0 0 0 0 1
Grand Total 0 1 1 1 3 0 1 0 0 1 2 0 0 6 8 0 0 0 0 0 12Apprch % 0 33.3 33.3 33.3 0 100 0 0 25 0 0 75 0 0 0 0
Total % 0 8.3 8.3 8.3 25 0 8.3 0 0 8.3 16.7 0 0 50 66.7 0 0 0 0 0
Second AvenueEastbound
Second AvenueWestbound
Hot Metal StreetNorthbound Southbound
Start Time Left Thru Right Peds App. Total Thru Right Peds App. Total Thru Right Peds App. Total Thru Right Peds App. Total Int. Total
Peak Hour Analysis From 06:30 AM to 09:15 AM - Peak 1 of 1Peak Hour for Entire Intersection Begins at 07:45 AM
07:45 AM 0 0 0 0 0 0 0 0 0 0 0 0 0 4 4 0 0 0 0 0 408:00 AM 0 0 0 0 0 0 0 0 0 0 0 0 0 1 1 0 0 0 0 0 108:15 AM 0 0 0 0 0 0 0 0 0 0 0 0 0 0 0 0 0 0 0 0 008:30 AM 0 0 0 0 0 0 1 0 0 1 1 0 0 0 1 0 0 0 0 0 2Total Volume 0 0 0 0 0 0 1 0 0 1 1 0 0 5 6 0 0 0 0 0 7% App. Total 0 0 0 0 0 100 0 0 16.7 0 0 83.3 0 0 0 0
PHF .000 .000 .000 .000 .000 .000 .250 .000 .000 .250 .250 .000 .000 .313 .375 .000 .000 .000 .000 .000 .438
File Name : 2nd Av & Hot Metal_AMSite Code : 17240006Start Date : 11/1/2017Page No : 1
Second Avenue and Hot Metal Street
Groups Printed- Typical Vehicles - Heavy Duty VehiclesSecond Avenue
EastboundSecond Avenue
WestboundHot Metal Street
Northbound Southbound
Start Time Left Thru RightRt. on
RedApp. Total Left Thru Right
Rt. on
RedApp. Total Left Thru Right
Rt. on
RedApp. Total Left Thru Right
Rt. on
RedApp. Total Int. Total
06:30 AM 0 86 94 6 186 29 146 0 0 175 130 0 11 6 147 0 0 0 0 0 50806:45 AM 0 67 98 3 168 32 135 0 0 167 130 0 10 8 148 0 0 0 0 0 483
Total 0 153 192 9 354 61 281 0 0 342 260 0 21 14 295 0 0 0 0 0 991
07:00 AM 0 60 103 11 174 28 143 0 0 171 112 0 11 4 127 0 0 0 0 0 47207:15 AM 0 57 107 10 174 28 157 0 0 185 114 0 15 9 138 0 0 0 0 0 49707:30 AM 0 54 114 12 180 40 144 0 0 184 105 0 8 4 117 0 0 0 0 0 48107:45 AM 0 65 110 15 190 42 144 0 0 186 106 0 14 5 125 0 0 0 0 0 501
Total 0 236 434 48 718 138 588 0 0 726 437 0 48 22 507 0 0 0 0 0 1951
08:00 AM 0 40 115 10 165 48 190 0 0 238 120 0 14 5 139 0 0 0 0 0 54208:15 AM 0 58 105 16 179 56 124 0 0 180 106 0 9 5 120 0 0 0 0 0 47908:30 AM 0 52 119 11 182 31 96 0 0 127 109 0 14 5 128 0 0 0 0 0 43708:45 AM 0 34 87 30 151 48 92 0 0 140 121 0 10 6 137 0 0 0 0 0 428
Total 0 184 426 67 677 183 502 0 0 685 456 0 47 21 524 0 0 0 0 0 1886
09:00 AM 0 47 101 9 157 38 89 0 0 127 90 0 9 6 105 0 0 0 0 0 38909:15 AM 0 54 92 10 156 23 66 0 0 89 98 0 10 5 113 0 0 0 0 0 358
Grand Total 0 674 1245 143 2062 443 1526 0 0 1969 1341 0 135 68 1544 0 0 0 0 0 5575Apprch % 0 32.7 60.4 6.9 22.5 77.5 0 0 86.9 0 8.7 4.4 0 0 0 0
Total % 0 12.1 22.3 2.6 37 7.9 27.4 0 0 35.3 24.1 0 2.4 1.2 27.7 0 0 0 0 0Typical Vehicles 1193 1408 1267
% Typical Vehicles 0 81.2 95.8 95.8 91 93.5 92.3 0 0 92.5 94.5 0 88.9 98.5 94.2 0 0 0 0 0 92.4Heavy Duty Vehicles
% Heavy Duty Vehicles 0 18.8 4.2 4.2 9 6.5 7.7 0 0 7.5 5.5 0 11.1 1.5 5.8 0 0 0 0 0 7.6
Second AvenueEastbound
Second AvenueWestbound
Hot Metal StreetNorthbound Southbound
Start Time Left Thru RightRt. on
RedApp. Total Left Thru Right
Rt. on
RedApp. Total Left Thru Right
Rt. on
RedApp. Total Left Thru Right
Rt. on
RedApp. Total Int. Total
Peak Hour Analysis From 06:30 AM to 09:15 AM - Peak 1 of 1Peak Hour for Entire Intersection Begins at 07:15 AM
07:15 AM 0 57 107 10 174 28 157 0 0 185 114 0 15 9 138 0 0 0 0 0 49707:30 AM 0 54 114 12 180 40 144 0 0 184 105 0 8 4 117 0 0 0 0 0 48107:45 AM 0 65 110 15 190 42 144 0 0 186 106 0 14 5 125 0 0 0 0 0 50108:00 AM 0 40 115 10 165 48 190 0 0 238 120 0 14 5 139 0 0 0 0 0 542Total Volume 0 216 446 47 709 158 635 0 0 793 445 0 51 23 519 0 0 0 0 0 2021% App. Total 0 30.5 62.9 6.6 19.9 80.1 0 0 85.7 0 9.8 4.4 0 0 0 0
PHF .000 .831 .970 .783 .933 .823 .836 .000 .000 .833 .927 .000 .850 .639 .933 .000 .000 .000 .000 .000 .932Typical Vehicles
% Typical Vehicles 0 81.0 96.0 95.7 91.4 96.2 94.5 0 0 94.8 94.2 0 92.2 95.7 94.0 0 0 0 0 0 93.4Heavy Duty Vehicles
% Heavy Duty Vehicles 0 19.0 4.0 4.3 8.6 3.8 5.5 0 0 5.2 5.8 0 7.8 4.3 6.0 0 0 0 0 0 6.6
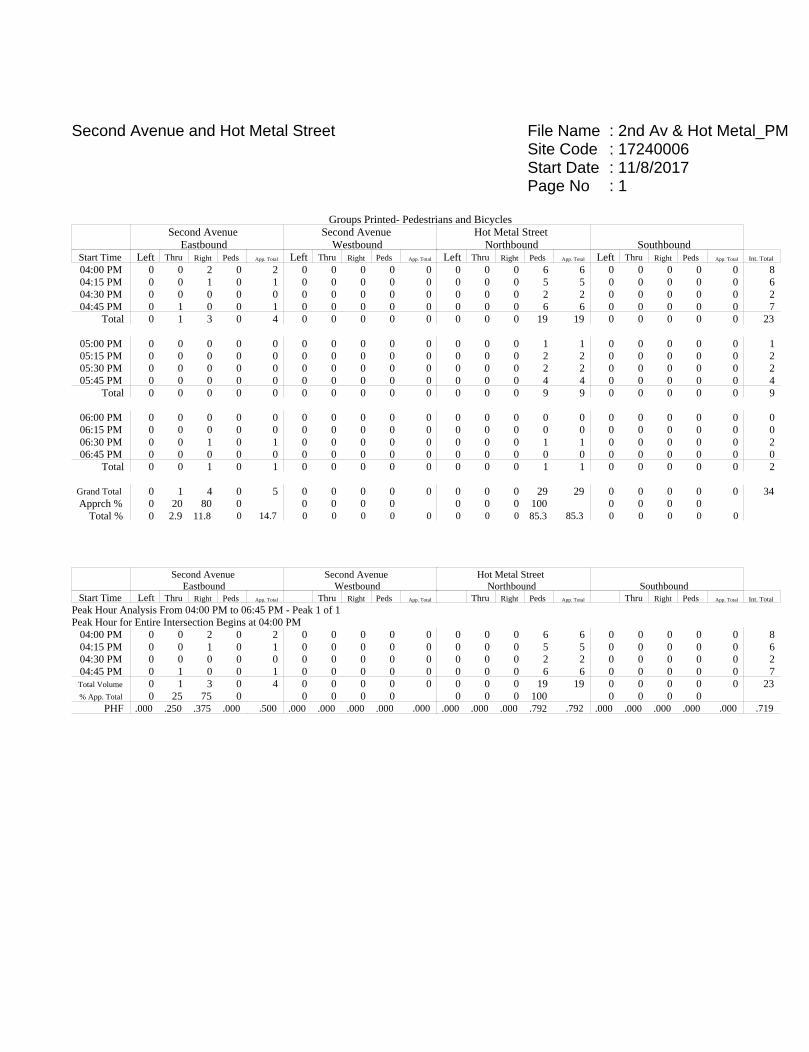
File Name : 2nd Av & Hot Metal_PMSite Code : 17240006Start Date : 11/8/2017Page No : 1
Second Avenue and Hot Metal Street
Groups Printed- Pedestrians and BicyclesSecond Avenue
EastboundSecond Avenue
WestboundHot Metal Street
Northbound SouthboundStart Time Left Thru Right Peds App. Total Left Thru Right Peds App. Total Left Thru Right Peds App. Total Left Thru Right Peds App. Total Int. Total
04:00 PM 0 0 2 0 2 0 0 0 0 0 0 0 0 6 6 0 0 0 0 0 804:15 PM 0 0 1 0 1 0 0 0 0 0 0 0 0 5 5 0 0 0 0 0 604:30 PM 0 0 0 0 0 0 0 0 0 0 0 0 0 2 2 0 0 0 0 0 204:45 PM 0 1 0 0 1 0 0 0 0 0 0 0 0 6 6 0 0 0 0 0 7
Total 0 1 3 0 4 0 0 0 0 0 0 0 0 19 19 0 0 0 0 0 23
05:00 PM 0 0 0 0 0 0 0 0 0 0 0 0 0 1 1 0 0 0 0 0 105:15 PM 0 0 0 0 0 0 0 0 0 0 0 0 0 2 2 0 0 0 0 0 205:30 PM 0 0 0 0 0 0 0 0 0 0 0 0 0 2 2 0 0 0 0 0 205:45 PM 0 0 0 0 0 0 0 0 0 0 0 0 0 4 4 0 0 0 0 0 4
Total 0 0 0 0 0 0 0 0 0 0 0 0 0 9 9 0 0 0 0 0 9
06:00 PM 0 0 0 0 0 0 0 0 0 0 0 0 0 0 0 0 0 0 0 0 006:15 PM 0 0 0 0 0 0 0 0 0 0 0 0 0 0 0 0 0 0 0 0 006:30 PM 0 0 1 0 1 0 0 0 0 0 0 0 0 1 1 0 0 0 0 0 206:45 PM 0 0 0 0 0 0 0 0 0 0 0 0 0 0 0 0 0 0 0 0 0
Total 0 0 1 0 1 0 0 0 0 0 0 0 0 1 1 0 0 0 0 0 2
Grand Total 0 1 4 0 5 0 0 0 0 0 0 0 0 29 29 0 0 0 0 0 34Apprch % 0 20 80 0 0 0 0 0 0 0 0 100 0 0 0 0
Total % 0 2.9 11.8 0 14.7 0 0 0 0 0 0 0 0 85.3 85.3 0 0 0 0 0
Second AvenueEastbound
Second AvenueWestbound
Hot Metal StreetNorthbound Southbound
Start Time Left Thru Right Peds App. Total Thru Right Peds App. Total Thru Right Peds App. Total Thru Right Peds App. Total Int. Total
Peak Hour Analysis From 04:00 PM to 06:45 PM - Peak 1 of 1Peak Hour for Entire Intersection Begins at 04:00 PM
04:00 PM 0 0 2 0 2 0 0 0 0 0 0 0 0 6 6 0 0 0 0 0 804:15 PM 0 0 1 0 1 0 0 0 0 0 0 0 0 5 5 0 0 0 0 0 604:30 PM 0 0 0 0 0 0 0 0 0 0 0 0 0 2 2 0 0 0 0 0 204:45 PM 0 1 0 0 1 0 0 0 0 0 0 0 0 6 6 0 0 0 0 0 7Total Volume 0 1 3 0 4 0 0 0 0 0 0 0 0 19 19 0 0 0 0 0 23% App. Total 0 25 75 0 0 0 0 0 0 0 0 100 0 0 0 0
PHF .000 .250 .375 .000 .500 .000 .000 .000 .000 .000 .000 .000 .000 .792 .792 .000 .000 .000 .000 .000 .719

File Name : 2nd Av & Hot Metal_PMSite Code : 17240006Start Date : 11/8/2017Page No : 1
Second Avenue and Hot Metal Street
Groups Printed- Typical Vehicles - Heavy Duty VehiclesSecond Avenue
EastboundSecond Avenue
WestboundHot Metal Street
Northbound Southbound
Start Time Left Thru RightRt. on
RedApp. Total Left Thru Right
Rt. on
RedApp. Total Left Thru Right
Rt. on
RedApp. Total Left Thru Right
Rt. on
RedApp. Total Int. Total
04:00 PM 0 193 138 20 351 45 60 0 0 105 69 0 41 10 120 0 0 0 0 0 57604:15 PM 0 236 126 26 388 25 56 0 0 81 52 0 35 8 95 0 0 0 0 0 56404:30 PM 0 199 165 11 375 32 63 0 0 95 61 0 51 10 122 0 0 0 0 0 59204:45 PM 0 204 120 41 365 47 88 0 0 135 73 0 56 30 159 0 0 0 0 0 659
Total 0 832 549 98 1479 149 267 0 0 416 255 0 183 58 496 0 0 0 0 0 2391
05:00 PM 0 195 117 30 342 28 64 0 0 92 76 0 58 8 142 0 0 0 0 0 57605:15 PM 0 217 112 47 376 44 60 0 0 104 100 0 34 24 158 0 0 0 0 0 63805:30 PM 0 175 106 57 338 35 51 0 0 86 95 0 42 27 164 0 0 0 0 0 58805:45 PM 0 190 139 38 367 38 47 0 0 85 90 0 34 26 150 0 0 0 0 0 602
Total 0 777 474 172 1423 145 222 0 0 367 361 0 168 85 614 0 0 0 0 0 2404
06:00 PM 0 170 116 35 321 32 61 0 0 93 97 0 24 31 152 0 0 0 0 0 56606:15 PM 0 141 107 45 293 22 59 0 0 81 86 0 35 12 133 0 0 0 0 0 50706:30 PM 1 106 90 34 231 36 55 0 0 91 92 0 26 16 134 0 0 0 0 0 45606:45 PM 0 108 90 60 258 15 65 0 0 80 135 0 26 17 178 0 0 0 0 0 516
Total 1 525 403 174 1103 105 240 0 0 345 410 0 111 76 597 0 0 0 0 0 2045
Grand Total 1 2134 1426 444 4005 399 729 0 0 1128 1026 0 462 219 1707 0 0 0 0 0 6840Apprch % 0 53.3 35.6 11.1 35.4 64.6 0 0 60.1 0 27.1 12.8 0 0 0 0
Total % 0 31.2 20.8 6.5 58.6 5.8 10.7 0 0 16.5 15 0 6.8 3.2 25 0 0 0 0 0Typical Vehicles 2043 1410 1009
% Typical Vehicles 0 95.7 98.9 99.1 97.2 97.5 90.9 0 0 93.3 98.3 0 99.6 98.6 98.7 0 0 0 0 0 96.9Heavy Duty Vehicles
% Heavy Duty Vehicles 100 4.3 1.1 0.9 2.8 2.5 9.1 0 0 6.7 1.7 0 0.4 1.4 1.3 0 0 0 0 0 3.1
Second AvenueEastbound
Second AvenueWestbound
Hot Metal StreetNorthbound Southbound
Start Time Left Thru RightRt. on
RedApp. Total Left Thru Right
Rt. on
RedApp. Total Left Thru Right
Rt. on
RedApp. Total Left Thru Right
Rt. on
RedApp. Total Int. Total
Peak Hour Analysis From 04:00 PM to 06:45 PM - Peak 1 of 1Peak Hour for Entire Intersection Begins at 04:30 PM
04:30 PM 0 199 165 11 375 32 63 0 0 95 61 0 51 10 122 0 0 0 0 0 59204:45 PM 0 204 120 41 365 47 88 0 0 135 73 0 56 30 159 0 0 0 0 0 65905:00 PM 0 195 117 30 342 28 64 0 0 92 76 0 58 8 142 0 0 0 0 0 57605:15 PM 0 217 112 47 376 44 60 0 0 104 100 0 34 24 158 0 0 0 0 0 638Total Volume 0 815 514 129 1458 151 275 0 0 426 310 0 199 72 581 0 0 0 0 0 2465% App. Total 0 55.9 35.3 8.8 35.4 64.6 0 0 53.4 0 34.3 12.4 0 0 0 0
PHF .000 .939 .779 .686 .969 .803 .781 .000 .000 .789 .775 .000 .858 .600 .914 .000 .000 .000 .000 .000 .935Typical Vehicles
% Typical Vehicles 0 95.8 99.2 100 97.4 98.7 90.9 0 0 93.7 98.7 0 100 100 99.3 0 0 0 0 0 97.2Heavy Duty Vehicles
% Heavy Duty Vehicles 0 4.2 0.8 0 2.6 1.3 9.1 0 0 6.3 1.3 0 0 0 0.7 0 0 0 0 0 2.8

File Name : 2nd Av & Johnston_AMSite Code : 17240015Start Date : 11/2/2017Page No : 1
Second Avenue and Johnston Avenue
Groups Printed- Pedestrians and BicyclesSecond Avenue
EastboundSecond Avenue
Westbound NorthboundJohnston Avenue
SouthboundStart Time Left Thru Right Peds App. Total Left Thru Right Peds App. Total Left Thru Right Peds App. Total Left Thru Right Peds App. Total Int. Total
06:30 AM 0 0 0 0 0 0 0 0 0 0 0 0 0 0 0 0 0 0 4 4 406:45 AM 0 0 0 0 0 0 0 0 0 0 0 0 0 0 0 0 0 0 1 1 1
Total 0 0 0 0 0 0 0 0 0 0 0 0 0 0 0 0 0 0 5 5 5
07:00 AM 0 0 0 0 0 0 0 0 0 0 0 0 0 0 0 0 0 0 1 1 107:15 AM 0 0 0 0 0 0 0 0 0 0 0 0 0 0 0 0 0 0 0 0 007:30 AM 0 0 0 0 0 0 0 0 0 0 0 0 0 0 0 0 0 0 4 4 407:45 AM 0 0 0 0 0 0 0 0 0 0 0 0 0 0 0 0 0 0 2 2 2
Total 0 0 0 0 0 0 0 0 0 0 0 0 0 0 0 0 0 0 7 7 7
08:00 AM 0 0 0 0 0 0 0 0 0 0 0 0 0 0 0 0 0 0 3 3 308:15 AM 0 0 0 0 0 0 0 0 0 0 0 0 0 0 0 0 0 0 0 0 008:30 AM 0 0 0 0 0 0 0 0 0 0 0 0 0 0 0 0 0 0 0 0 008:45 AM 0 0 0 0 0 0 0 0 0 0 0 0 0 0 0 0 0 0 3 3 3
Total 0 0 0 0 0 0 0 0 0 0 0 0 0 0 0 0 0 0 6 6 6
09:00 AM 1 0 0 0 1 0 0 0 1 1 0 0 0 0 0 0 0 0 4 4 609:15 AM 0 0 0 0 0 0 0 0 0 0 0 0 0 0 0 0 0 1 1 2 2
Grand Total 1 0 0 0 1 0 0 0 1 1 0 0 0 0 0 0 0 1 23 24 26Apprch % 100 0 0 0 0 0 0 100 0 0 0 0 0 0 4.2 95.8
Total % 3.8 0 0 0 3.8 0 0 0 3.8 3.8 0 0 0 0 0 0 0 3.8 88.5 92.3
Second AvenueEastbound
Second AvenueWestbound Northbound
Johnston AvenueSouthbound
Start Time Left Thru Right Peds App. Total Thru Right Peds App. Total Thru Right Peds App. Total Thru Right Peds App. Total Int. Total
Peak Hour Analysis From 06:30 AM to 09:15 AM - Peak 1 of 1Peak Hour for Entire Intersection Begins at 08:30 AM
08:30 AM 0 0 0 0 0 0 0 0 0 0 0 0 0 0 0 0 0 0 0 0 008:45 AM 0 0 0 0 0 0 0 0 0 0 0 0 0 0 0 0 0 0 3 3 309:00 AM 1 0 0 0 1 0 0 0 1 1 0 0 0 0 0 0 0 0 4 4 609:15 AM 0 0 0 0 0 0 0 0 0 0 0 0 0 0 0 0 0 1 1 2 2Total Volume 1 0 0 0 1 0 0 0 1 1 0 0 0 0 0 0 0 1 8 9 11% App. Total 100 0 0 0 0 0 0 100 0 0 0 0 0 0 11.1 88.9
PHF .250 .000 .000 .000 .250 .000 .000 .000 .250 .250 .000 .000 .000 .000 .000 .000 .000 .250 .500 .563 .458

File Name : 2nd Av & Johnston_AMSite Code : 17240015Start Date : 11/2/2017Page No : 1
Second Avenue and Johnston Avenue
Groups Printed- Typical Vehicles - Heavy Duty VehiclesSecond Avenue
EastboundSecond Avenue
Westbound NorthboundJohnston Avenue
SouthboundStart Time Left Thru Right App. Total Left Thru Right App. Total Left Thru Right App. Total Left Thru Right App. Total Int. Total
06:30 AM 1 78 0 0 79 0 247 4 0 251 0 0 0 0 0 2 0 2 0 4 33406:45 AM 4 56 0 0 60 0 274 6 0 280 0 0 0 0 0 0 0 8 0 8 348
Total 5 134 0 0 139 0 521 10 0 531 0 0 0 0 0 2 0 10 0 12 682
07:00 AM 3 85 0 0 88 0 291 10 0 301 0 0 0 0 0 1 0 3 0 4 39307:15 AM 6 97 0 0 103 0 308 7 0 315 0 0 0 0 0 2 0 4 0 6 42407:30 AM 4 76 0 0 80 0 365 13 0 378 0 0 0 0 0 2 0 4 0 6 46407:45 AM 5 105 0 0 110 0 348 8 1 357 0 0 0 0 0 1 0 5 0 6 473
Total 18 363 0 0 381 0 1312 38 1 1351 0 0 0 0 0 6 0 16 0 22 1754
08:00 AM 5 72 0 0 77 0 283 7 0 290 0 0 0 0 0 3 0 9 0 12 37908:15 AM 8 82 0 0 90 0 291 10 0 301 0 0 0 0 0 1 0 9 0 10 40108:30 AM 5 60 0 2 67 0 235 3 0 238 0 0 0 0 0 3 0 12 0 15 32008:45 AM 9 78 0 0 87 0 200 10 0 210 0 0 0 0 0 1 0 14 0 15 312
Total 27 292 0 2 321 0 1009 30 0 1039 0 0 0 0 0 8 0 44 0 52 1412
09:00 AM 9 65 0 0 74 0 182 6 0 188 0 0 0 0 0 0 0 11 0 11 27309:15 AM 7 82 0 0 89 0 145 1 0 146 0 0 0 0 0 3 0 2 0 5 240
Grand Total 66 936 0 2 1004 0 3169 85 1 3255 0 0 0 0 0 19 0 83 0 102 4361Apprch % 6.6 93.2 0 0.2 0 97.4 2.6 0 0 0 0 0 18.6 0 81.4 0
Total % 1.5 21.5 0 0 23 0 72.7 1.9 0 74.6 0 0 0 0 0 0.4 0 1.9 0 2.3Typical Vehicles 3048
% Typical Vehicles 77.3 88.6 0 0 87.6 0 96.2 94.1 0 96.1 0 0 0 0 0 78.9 0 78.3 0 78.4 93.7Heavy Duty Vehicles
% Heavy Duty Vehicles 22.7 11.4 0 100 12.4 0 3.8 5.9 100 3.9 0 0 0 0 0 21.1 0 21.7 0 21.6 6.3
Second AvenueEastbound
Second AvenueWestbound Northbound
Johnston AvenueSouthbound
Start Time Left Thru Right App. Total Thru Right App. Total Thru Right App. Total Thru Right App. Total Int. Total
Peak Hour Analysis From 06:30 AM to 09:15 AM - Peak 1 of 1Peak Hour for Entire Intersection Begins at 07:00 AM
07:00 AM 3 85 0 0 88 0 291 10 0 301 0 0 0 0 0 1 0 3 0 4 39307:15 AM 6 97 0 0 103 0 308 7 0 315 0 0 0 0 0 2 0 4 0 6 42407:30 AM 4 76 0 0 80 0 365 13 0 378 0 0 0 0 0 2 0 4 0 6 46407:45 AM 5 105 0 0 110 0 348 8 1 357 0 0 0 0 0 1 0 5 0 6 473Total Volume 18 363 0 0 381 0 1312 38 1 1351 0 0 0 0 0 6 0 16 0 22 1754% App. Total 4.7 95.3 0 0 0 97.1 2.8 0.1 0 0 0 0 27.3 0 72.7 0
PHF .750 .864 .000 .000 .866 .000 .899 .731 .250 .894 .000 .000 .000 .000 .000 .750 .000 .800 .000 .917 .927Typical Vehicles 1271
% Typical Vehicles 72.2 89.8 0 0 89.0 0 96.9 94.7 0 96.7 0 0 0 0 0 83.3 0 62.5 0 68.2 94.7Heavy Duty Vehicles
% Heavy Duty Vehicles 27.8 10.2 0 0 11.0 0 3.1 5.3 100 3.3 0 0 0 0 0 16.7 0 37.5 0 31.8 5.3
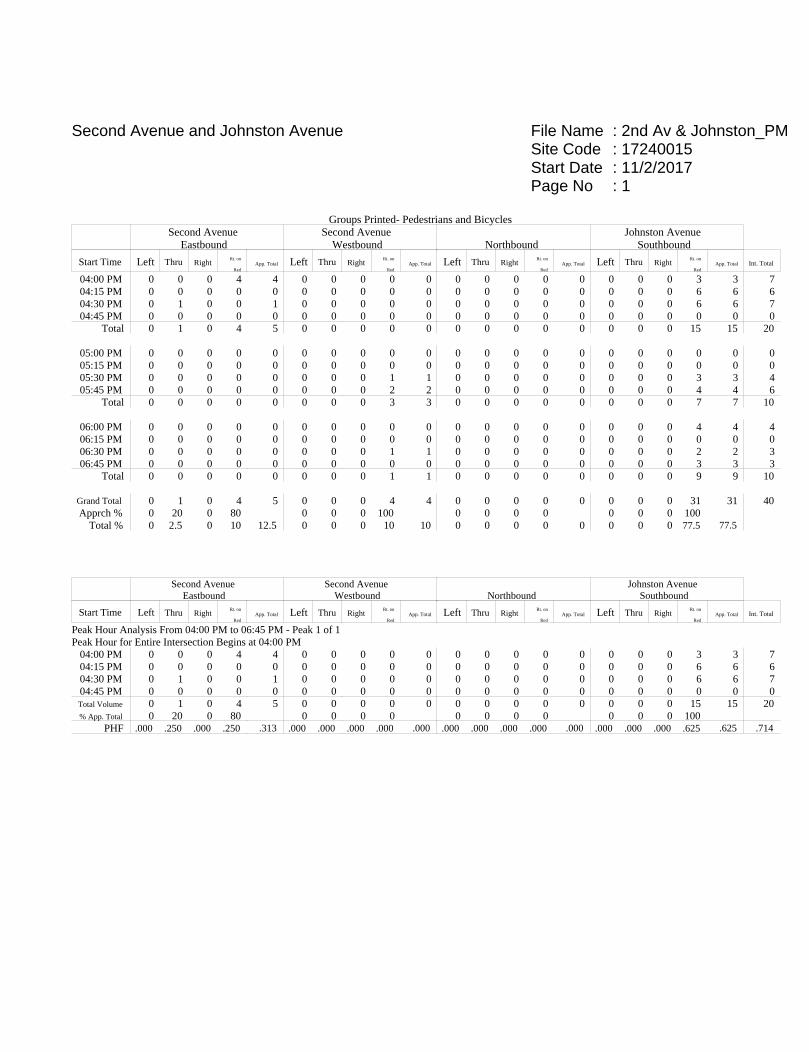
File Name : 2nd Av & Johnston_PMSite Code : 17240015Start Date : 11/2/2017Page No : 1
Second Avenue and Johnston Avenue
Groups Printed- Pedestrians and BicyclesSecond Avenue
EastboundSecond Avenue
Westbound NorthboundJohnston Avenue
Southbound
Start Time Left Thru RightRt. on
RedApp. Total Left Thru Right
Rt. on
RedApp. Total Left Thru Right
Rt. on
RedApp. Total Left Thru Right
Rt. on
RedApp. Total Int. Total
04:00 PM 0 0 0 4 4 0 0 0 0 0 0 0 0 0 0 0 0 0 3 3 704:15 PM 0 0 0 0 0 0 0 0 0 0 0 0 0 0 0 0 0 0 6 6 604:30 PM 0 1 0 0 1 0 0 0 0 0 0 0 0 0 0 0 0 0 6 6 704:45 PM 0 0 0 0 0 0 0 0 0 0 0 0 0 0 0 0 0 0 0 0 0
Total 0 1 0 4 5 0 0 0 0 0 0 0 0 0 0 0 0 0 15 15 20
05:00 PM 0 0 0 0 0 0 0 0 0 0 0 0 0 0 0 0 0 0 0 0 005:15 PM 0 0 0 0 0 0 0 0 0 0 0 0 0 0 0 0 0 0 0 0 005:30 PM 0 0 0 0 0 0 0 0 1 1 0 0 0 0 0 0 0 0 3 3 405:45 PM 0 0 0 0 0 0 0 0 2 2 0 0 0 0 0 0 0 0 4 4 6
Total 0 0 0 0 0 0 0 0 3 3 0 0 0 0 0 0 0 0 7 7 10
06:00 PM 0 0 0 0 0 0 0 0 0 0 0 0 0 0 0 0 0 0 4 4 406:15 PM 0 0 0 0 0 0 0 0 0 0 0 0 0 0 0 0 0 0 0 0 006:30 PM 0 0 0 0 0 0 0 0 1 1 0 0 0 0 0 0 0 0 2 2 306:45 PM 0 0 0 0 0 0 0 0 0 0 0 0 0 0 0 0 0 0 3 3 3
Total 0 0 0 0 0 0 0 0 1 1 0 0 0 0 0 0 0 0 9 9 10
Grand Total 0 1 0 4 5 0 0 0 4 4 0 0 0 0 0 0 0 0 31 31 40Apprch % 0 20 0 80 0 0 0 100 0 0 0 0 0 0 0 100
Total % 0 2.5 0 10 12.5 0 0 0 10 10 0 0 0 0 0 0 0 0 77.5 77.5
Second AvenueEastbound
Second AvenueWestbound Northbound
Johnston AvenueSouthbound
Start Time Left Thru RightRt. on
RedApp. Total Left Thru Right
Rt. on
RedApp. Total Left Thru Right
Rt. on
RedApp. Total Left Thru Right
Rt. on
RedApp. Total Int. Total
Peak Hour Analysis From 04:00 PM to 06:45 PM - Peak 1 of 1Peak Hour for Entire Intersection Begins at 04:00 PM
04:00 PM 0 0 0 4 4 0 0 0 0 0 0 0 0 0 0 0 0 0 3 3 704:15 PM 0 0 0 0 0 0 0 0 0 0 0 0 0 0 0 0 0 0 6 6 604:30 PM 0 1 0 0 1 0 0 0 0 0 0 0 0 0 0 0 0 0 6 6 704:45 PM 0 0 0 0 0 0 0 0 0 0 0 0 0 0 0 0 0 0 0 0 0Total Volume 0 1 0 4 5 0 0 0 0 0 0 0 0 0 0 0 0 0 15 15 20% App. Total 0 20 0 80 0 0 0 0 0 0 0 0 0 0 0 100
PHF .000 .250 .000 .250 .313 .000 .000 .000 .000 .000 .000 .000 .000 .000 .000 .000 .000 .000 .625 .625 .714

File Name : 2nd Av & Johnston_PMSite Code : 17240015Start Date : 11/2/2017Page No : 1
Second Avenue and Johnston Avenue
Groups Printed- Typical Vehicles - Heavy Duty VehiclesSecond Avenue
EastboundSecond Avenue
Westbound NorthboundJohnston Avenue
Southbound
Start Time Left Thru RightRt. on
RedApp. Total Left Thru Right
Rt. on
RedApp. Total Left Thru Right
Rt. on
RedApp. Total Left Thru Right
Rt. on
RedApp. Total Int. Total
04:00 PM 12 174 0 0 186 0 87 6 0 93 0 0 0 0 0 13 0 7 0 20 29904:15 PM 11 173 0 0 184 0 125 7 0 132 0 0 0 0 0 22 0 9 0 31 34704:30 PM 6 221 0 0 227 0 89 3 0 92 0 0 0 0 0 8 0 7 2 17 33604:45 PM 10 210 0 0 220 0 118 3 0 121 0 0 0 0 0 6 0 6 0 12 353
Total 39 778 0 0 817 0 419 19 0 438 0 0 0 0 0 49 0 29 2 80 1335
05:00 PM 7 238 0 1 246 0 102 4 0 106 0 0 0 0 0 7 0 12 0 19 37105:15 PM 11 207 0 0 218 0 106 2 1 109 0 0 0 0 0 7 0 12 0 19 34605:30 PM 5 207 0 0 212 0 104 1 1 106 0 0 0 0 0 6 0 5 0 11 32905:45 PM 9 209 0 0 218 0 114 4 0 118 0 0 0 0 0 9 0 7 0 16 352
Total 32 861 0 1 894 0 426 11 2 439 0 0 0 0 0 29 0 36 0 65 1398
06:00 PM 11 200 0 0 211 0 106 1 1 108 0 0 0 0 0 4 0 10 0 14 33306:15 PM 7 157 0 0 164 0 93 2 0 95 0 0 0 0 0 2 0 9 0 11 27006:30 PM 10 150 0 0 160 0 87 5 0 92 0 0 0 0 0 3 0 7 0 10 26206:45 PM 8 101 0 0 109 0 70 7 0 77 0 0 0 0 0 3 0 5 0 8 194
Total 36 608 0 0 644 0 356 15 1 372 0 0 0 0 0 12 0 31 0 43 1059
Grand Total 107 2247 0 1 2355 0 1201 45 3 1249 0 0 0 0 0 90 0 96 2 188 3792Apprch % 4.5 95.4 0 0 0 96.2 3.6 0.2 0 0 0 0 47.9 0 51.1 1.1
Total % 2.8 59.3 0 0 62.1 0 31.7 1.2 0.1 32.9 0 0 0 0 0 2.4 0 2.5 0.1 5Typical Vehicles 2193 1156
% Typical Vehicles 86 97.6 0 0 97 0 96.3 95.6 0 96 0 0 0 0 0 96.7 0 85.4 100 91 96.4Heavy Duty Vehicles
% Heavy Duty Vehicles 14 2.4 0 100 3 0 3.7 4.4 100 4 0 0 0 0 0 3.3 0 14.6 0 9 3.6
Second AvenueEastbound
Second AvenueWestbound Northbound
Johnston AvenueSouthbound
Start Time Left Thru RightRt. on
RedApp. Total Left Thru Right
Rt. on
RedApp. Total Left Thru Right
Rt. on
RedApp. Total Left Thru Right
Rt. on
RedApp. Total Int. Total
Peak Hour Analysis From 04:00 PM to 06:45 PM - Peak 1 of 1Peak Hour for Entire Intersection Begins at 04:15 PM
04:15 PM 11 173 0 0 184 0 125 7 0 132 0 0 0 0 0 22 0 9 0 31 34704:30 PM 6 221 0 0 227 0 89 3 0 92 0 0 0 0 0 8 0 7 2 17 33604:45 PM 10 210 0 0 220 0 118 3 0 121 0 0 0 0 0 6 0 6 0 12 35305:00 PM 7 238 0 1 246 0 102 4 0 106 0 0 0 0 0 7 0 12 0 19 371Total Volume 34 842 0 1 877 0 434 17 0 451 0 0 0 0 0 43 0 34 2 79 1407% App. Total 3.9 96 0 0.1 0 96.2 3.8 0 0 0 0 0 54.4 0 43 2.5
PHF .773 .884 .000 .250 .891 .000 .868 .607 .000 .854 .000 .000 .000 .000 .000 .489 .000 .708 .250 .637 .948Typical Vehicles
% Typical Vehicles 82.4 97.1 0 0 96.5 0 94.7 94.1 0 94.7 0 0 0 0 0 97.7 0 82.4 100 91.1 95.6Heavy Duty Vehicles
% Heavy Duty Vehicles 17.6 2.9 0 100 3.5 0 5.3 5.9 0 5.3 0 0 0 0 0 2.3 0 17.6 0 8.9 4.4

File Name : 2nd Av & Mansion_AMSite Code : 17240016Start Date : 11/2/2017Page No : 1
Second Avenue and Mansion Street
Groups Printed- Pedestrians and BicyclesSecond Avenue
EastboundSecond Avenue
Westbound
NorthboundMansion Street
SouthboundStart Time Left Thru Right Peds App. Total Left Thru Right Peds App. Total Left Thru Right Peds App. Total Left Thru Right Peds App. Total Int. Total
06:30 AM 0 0 0 0 0 0 0 0 0 0 0 0 0 0 0 0 0 0 0 0 006:45 AM 0 0 0 0 0 0 0 0 0 0 0 0 0 0 0 0 0 0 2 2 2
Total 0 0 0 0 0 0 0 0 0 0 0 0 0 0 0 0 0 0 2 2 2
07:00 AM 0 0 0 0 0 0 0 0 0 0 0 0 0 0 0 0 0 0 0 0 007:15 AM 0 0 0 0 0 0 0 0 0 0 0 0 0 0 0 0 0 0 0 0 007:30 AM 0 0 0 0 0 0 0 0 0 0 0 0 0 0 0 0 0 0 2 2 207:45 AM 0 0 0 1 1 0 0 0 0 0 0 0 0 0 0 0 0 0 2 2 3
Total 0 0 0 1 1 0 0 0 0 0 0 0 0 0 0 0 0 0 4 4 5
08:00 AM 0 0 0 2 2 0 0 0 0 0 0 0 0 0 0 0 0 0 1 1 308:15 AM 0 0 0 3 3 1 0 0 4 5 0 0 0 0 0 0 0 0 0 0 808:30 AM 0 0 0 0 0 0 0 0 3 3 0 0 0 0 0 0 0 0 4 4 708:45 AM 0 0 0 0 0 0 0 0 0 0 0 0 0 0 0 0 0 0 1 1 1
Total 0 0 0 5 5 1 0 0 7 8 0 0 0 0 0 0 0 0 6 6 19
09:00 AM 0 0 0 0 0 0 0 0 0 0 0 0 0 0 0 0 0 0 3 3 309:15 AM 0 0 0 1 1 0 0 0 0 0 0 0 0 0 0 0 0 0 1 1 2
Grand Total 0 0 0 7 7 1 0 0 7 8 0 0 0 0 0 0 0 0 16 16 31Apprch % 0 0 0 100 12.5 0 0 87.5 0 0 0 0 0 0 0 100
Total % 0 0 0 22.6 22.6 3.2 0 0 22.6 25.8 0 0 0 0 0 0 0 0 51.6 51.6
Second AvenueEastbound
Second AvenueWestbound
Northbound
Mansion StreetSouthbound
Start Time Left Thru Right Peds App. Total Thru Right Peds App. Total Thru Right Peds App. Total Thru Right Peds App. Total Int. Total
Peak Hour Analysis From 06:30 AM to 09:15 AM - Peak 1 of 1Peak Hour for Entire Intersection Begins at 07:45 AM
07:45 AM 0 0 0 1 1 0 0 0 0 0 0 0 0 0 0 0 0 0 2 2 308:00 AM 0 0 0 2 2 0 0 0 0 0 0 0 0 0 0 0 0 0 1 1 308:15 AM 0 0 0 3 3 1 0 0 4 5 0 0 0 0 0 0 0 0 0 0 808:30 AM 0 0 0 0 0 0 0 0 3 3 0 0 0 0 0 0 0 0 4 4 7Total Volume 0 0 0 6 6 1 0 0 7 8 0 0 0 0 0 0 0 0 7 7 21% App. Total 0 0 0 100 12.5 0 0 87.5 0 0 0 0 0 0 0 100
PHF .000 .000 .000 .500 .500 .250 .000 .000 .438 .400 .000 .000 .000 .000 .000 .000 .000 .000 .438 .438 .656

File Name : 2nd Av & Mansion_AMSite Code : 17240016Start Date : 11/2/2017Page No : 1
Second Avenue and Mansion Street
Groups Printed- Typical Vehicles - Heavy Duty VehiclesSecond Avenue
EastboundSecond Avenue
Westbound
NorthboundMansion Street
Southbound
Start Time Left Thru RightRt. on
RedApp. Total Left Thru Right
Rt. on
RedApp. Total Left Thru Right
Rt. on
RedApp. Total Left Thru Right
Rt. on
RedApp. Total Int. Total
06:30 AM 3 62 0 0 65 0 258 3 0 261 0 0 0 0 0 3 0 1 1 5 33106:45 AM 0 59 0 0 59 0 272 7 0 279 0 0 0 0 0 4 0 1 0 5 343
Total 3 121 0 0 124 0 530 10 0 540 0 0 0 0 0 7 0 2 1 10 674
07:00 AM 1 87 0 0 88 0 320 11 0 331 0 0 0 0 0 3 0 0 2 5 42407:15 AM 2 93 0 0 95 0 321 13 0 334 0 0 0 0 0 6 0 0 0 6 43507:30 AM 3 72 0 0 75 0 373 25 0 398 0 0 0 0 0 5 0 1 1 7 48007:45 AM 3 97 0 0 100 0 354 32 0 386 0 0 0 0 0 1 0 3 0 4 490
Total 9 349 0 0 358 0 1368 81 0 1449 0 0 0 0 0 15 0 4 3 22 1829
08:00 AM 0 72 0 0 72 0 323 45 0 368 0 0 0 0 0 8 0 2 0 10 45008:15 AM 4 73 0 0 77 0 294 29 2 325 0 0 0 0 0 5 0 3 0 8 41008:30 AM 0 59 0 0 59 0 215 33 2 250 0 0 0 0 0 8 0 3 0 11 32008:45 AM 4 75 0 0 79 0 210 34 0 244 0 0 0 0 0 6 0 3 0 9 332
Total 8 279 0 0 287 0 1042 141 4 1187 0 0 0 0 0 27 0 11 0 38 1512
09:00 AM 1 68 0 0 69 0 192 28 2 222 0 0 0 0 0 2 0 0 0 2 29309:15 AM 1 77 0 0 78 0 122 3 0 125 0 0 0 0 0 4 0 3 0 7 210
Grand Total 22 894 0 0 916 0 3254 263 6 3523 0 0 0 0 0 55 0 20 4 79 4518Apprch % 2.4 97.6 0 0 0 92.4 7.5 0.2 0 0 0 0 69.6 0 25.3 5.1
Total % 0.5 19.8 0 0 20.3 0 72 5.8 0.1 78 0 0 0 0 0 1.2 0 0.4 0.1 1.7Typical Vehicles 3134
% Typical Vehicles 90.9 88.1 0 0 88.2 0 96.3 95.1 83.3 96.2 0 0 0 0 0 92.7 0 70 100 87.3 94.4Heavy Duty Vehicles
% Heavy Duty Vehicles 9.1 11.9 0 0 11.8 0 3.7 4.9 16.7 3.8 0 0 0 0 0 7.3 0 30 0 12.7 5.6
Second AvenueEastbound
Second AvenueWestbound
Northbound
Mansion StreetSouthbound
Start Time Left Thru RightRt. on
RedApp. Total Left Thru Right
Rt. on
RedApp. Total Left Thru Right
Rt. on
RedApp. Total Left Thru Right
Rt. on
RedApp. Total Int. Total
Peak Hour Analysis From 06:30 AM to 09:15 AM - Peak 1 of 1Peak Hour for Entire Intersection Begins at 07:15 AM
07:15 AM 2 93 0 0 95 0 321 13 0 334 0 0 0 0 0 6 0 0 0 6 43507:30 AM 3 72 0 0 75 0 373 25 0 398 0 0 0 0 0 5 0 1 1 7 48007:45 AM 3 97 0 0 100 0 354 32 0 386 0 0 0 0 0 1 0 3 0 4 49008:00 AM 0 72 0 0 72 0 323 45 0 368 0 0 0 0 0 8 0 2 0 10 450Total Volume 8 334 0 0 342 0 1371 115 0 1486 0 0 0 0 0 20 0 6 1 27 1855% App. Total 2.3 97.7 0 0 0 92.3 7.7 0 0 0 0 0 74.1 0 22.2 3.7
PHF .667 .861 .000 .000 .855 .000 .919 .639 .000 .933 .000 .000 .000 .000 .000 .625 .000 .500 .250 .675 .946Typical Vehicles 1336
% Typical Vehicles 87.5 88.0 0 0 88.0 0 97.4 95.7 0 97.3 0 0 0 0 0 95.0 0 83.3 100 92.6 95.5Heavy Duty Vehicles
% Heavy Duty Vehicles 12.5 12.0 0 0 12.0 0 2.6 4.3 0 2.7 0 0 0 0 0 5.0 0 16.7 0 7.4 4.5
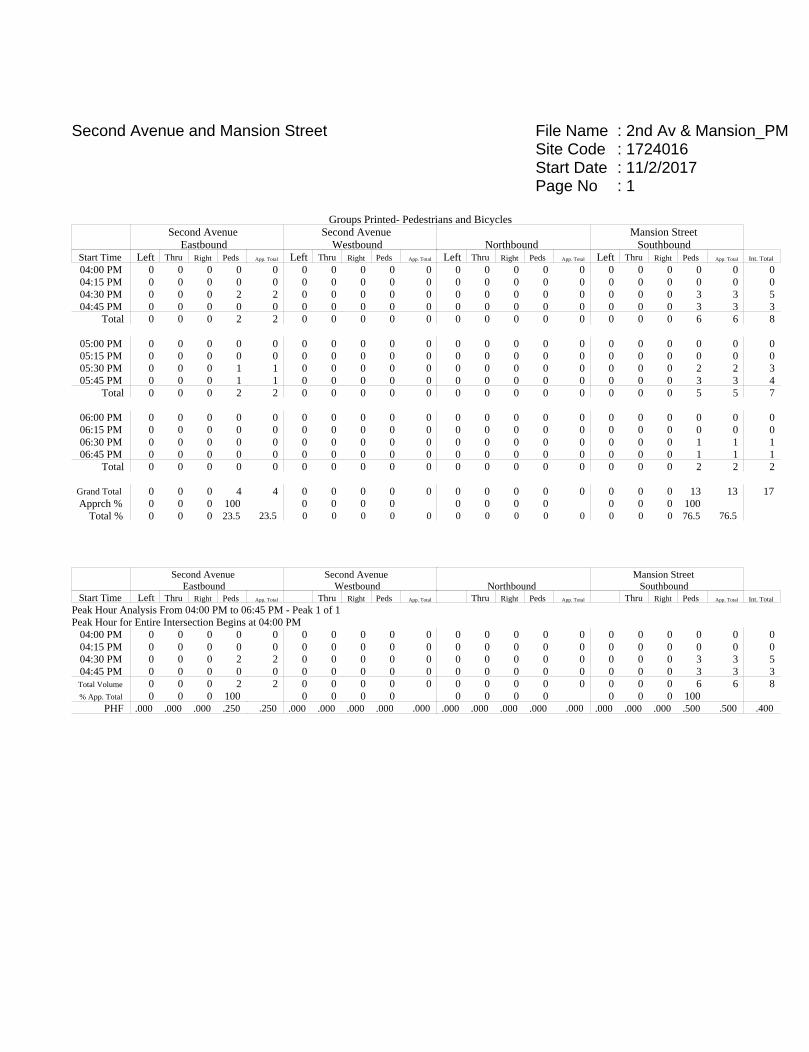
File Name : 2nd Av & Mansion_PMSite Code : 1724016Start Date : 11/2/2017Page No : 1
Second Avenue and Mansion Street
Groups Printed- Pedestrians and BicyclesSecond Avenue
EastboundSecond Avenue
Westbound
NorthboundMansion Street
SouthboundStart Time Left Thru Right Peds App. Total Left Thru Right Peds App. Total Left Thru Right Peds App. Total Left Thru Right Peds App. Total Int. Total
04:00 PM 0 0 0 0 0 0 0 0 0 0 0 0 0 0 0 0 0 0 0 0 004:15 PM 0 0 0 0 0 0 0 0 0 0 0 0 0 0 0 0 0 0 0 0 004:30 PM 0 0 0 2 2 0 0 0 0 0 0 0 0 0 0 0 0 0 3 3 504:45 PM 0 0 0 0 0 0 0 0 0 0 0 0 0 0 0 0 0 0 3 3 3
Total 0 0 0 2 2 0 0 0 0 0 0 0 0 0 0 0 0 0 6 6 8
05:00 PM 0 0 0 0 0 0 0 0 0 0 0 0 0 0 0 0 0 0 0 0 005:15 PM 0 0 0 0 0 0 0 0 0 0 0 0 0 0 0 0 0 0 0 0 005:30 PM 0 0 0 1 1 0 0 0 0 0 0 0 0 0 0 0 0 0 2 2 305:45 PM 0 0 0 1 1 0 0 0 0 0 0 0 0 0 0 0 0 0 3 3 4
Total 0 0 0 2 2 0 0 0 0 0 0 0 0 0 0 0 0 0 5 5 7
06:00 PM 0 0 0 0 0 0 0 0 0 0 0 0 0 0 0 0 0 0 0 0 006:15 PM 0 0 0 0 0 0 0 0 0 0 0 0 0 0 0 0 0 0 0 0 006:30 PM 0 0 0 0 0 0 0 0 0 0 0 0 0 0 0 0 0 0 1 1 106:45 PM 0 0 0 0 0 0 0 0 0 0 0 0 0 0 0 0 0 0 1 1 1
Total 0 0 0 0 0 0 0 0 0 0 0 0 0 0 0 0 0 0 2 2 2
Grand Total 0 0 0 4 4 0 0 0 0 0 0 0 0 0 0 0 0 0 13 13 17Apprch % 0 0 0 100 0 0 0 0 0 0 0 0 0 0 0 100
Total % 0 0 0 23.5 23.5 0 0 0 0 0 0 0 0 0 0 0 0 0 76.5 76.5
Second AvenueEastbound
Second AvenueWestbound
Northbound
Mansion StreetSouthbound
Start Time Left Thru Right Peds App. Total Thru Right Peds App. Total Thru Right Peds App. Total Thru Right Peds App. Total Int. Total
Peak Hour Analysis From 04:00 PM to 06:45 PM - Peak 1 of 1Peak Hour for Entire Intersection Begins at 04:00 PM
04:00 PM 0 0 0 0 0 0 0 0 0 0 0 0 0 0 0 0 0 0 0 0 004:15 PM 0 0 0 0 0 0 0 0 0 0 0 0 0 0 0 0 0 0 0 0 004:30 PM 0 0 0 2 2 0 0 0 0 0 0 0 0 0 0 0 0 0 3 3 504:45 PM 0 0 0 0 0 0 0 0 0 0 0 0 0 0 0 0 0 0 3 3 3Total Volume 0 0 0 2 2 0 0 0 0 0 0 0 0 0 0 0 0 0 6 6 8% App. Total 0 0 0 100 0 0 0 0 0 0 0 0 0 0 0 100
PHF .000 .000 .000 .250 .250 .000 .000 .000 .000 .000 .000 .000 .000 .000 .000 .000 .000 .000 .500 .500 .400
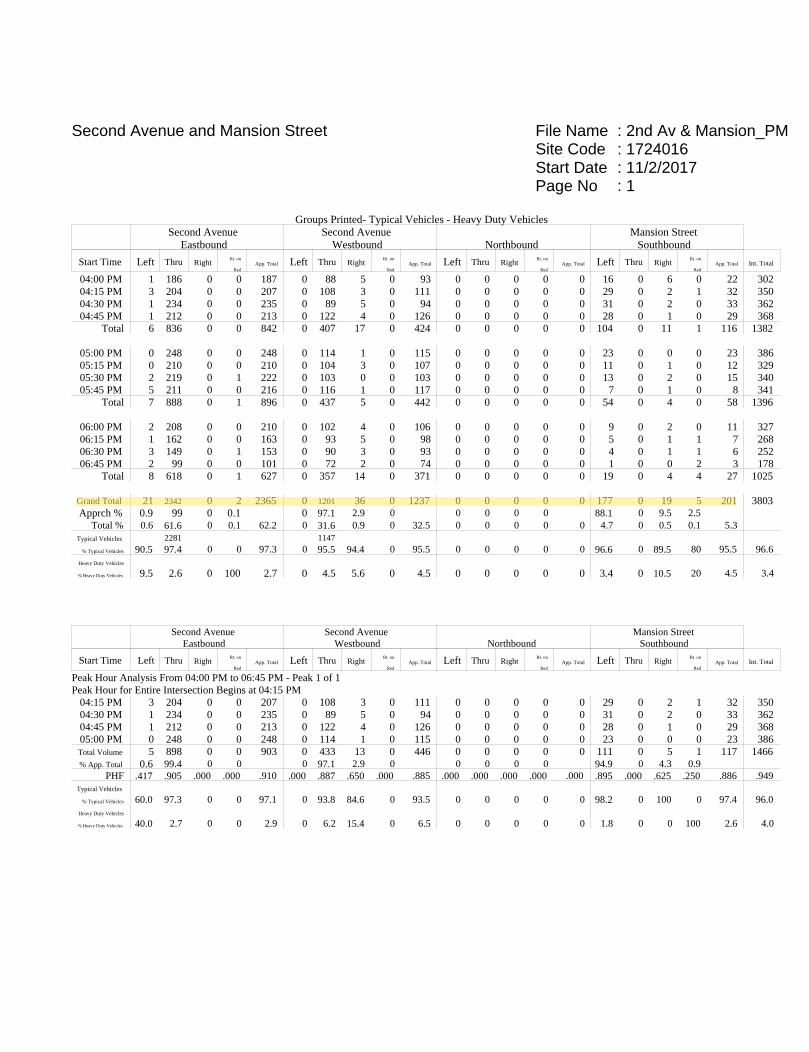
File Name : 2nd Av & Mansion_PMSite Code : 1724016Start Date : 11/2/2017Page No : 1
Second Avenue and Mansion Street
Groups Printed- Typical Vehicles - Heavy Duty VehiclesSecond Avenue
EastboundSecond Avenue
Westbound
NorthboundMansion Street
Southbound
Start Time Left Thru RightRt. on
RedApp. Total Left Thru Right
Rt. on
RedApp. Total Left Thru Right
Rt. on
RedApp. Total Left Thru Right
Rt. on
RedApp. Total Int. Total
04:00 PM 1 186 0 0 187 0 88 5 0 93 0 0 0 0 0 16 0 6 0 22 30204:15 PM 3 204 0 0 207 0 108 3 0 111 0 0 0 0 0 29 0 2 1 32 35004:30 PM 1 234 0 0 235 0 89 5 0 94 0 0 0 0 0 31 0 2 0 33 36204:45 PM 1 212 0 0 213 0 122 4 0 126 0 0 0 0 0 28 0 1 0 29 368
Total 6 836 0 0 842 0 407 17 0 424 0 0 0 0 0 104 0 11 1 116 1382
05:00 PM 0 248 0 0 248 0 114 1 0 115 0 0 0 0 0 23 0 0 0 23 38605:15 PM 0 210 0 0 210 0 104 3 0 107 0 0 0 0 0 11 0 1 0 12 32905:30 PM 2 219 0 1 222 0 103 0 0 103 0 0 0 0 0 13 0 2 0 15 34005:45 PM 5 211 0 0 216 0 116 1 0 117 0 0 0 0 0 7 0 1 0 8 341
Total 7 888 0 1 896 0 437 5 0 442 0 0 0 0 0 54 0 4 0 58 1396
06:00 PM 2 208 0 0 210 0 102 4 0 106 0 0 0 0 0 9 0 2 0 11 32706:15 PM 1 162 0 0 163 0 93 5 0 98 0 0 0 0 0 5 0 1 1 7 26806:30 PM 3 149 0 1 153 0 90 3 0 93 0 0 0 0 0 4 0 1 1 6 25206:45 PM 2 99 0 0 101 0 72 2 0 74 0 0 0 0 0 1 0 0 2 3 178
Total 8 618 0 1 627 0 357 14 0 371 0 0 0 0 0 19 0 4 4 27 1025
Grand Total 21 2342 0 2 2365 0 1201 36 0 1237 0 0 0 0 0 177 0 19 5 201 3803Apprch % 0.9 99 0 0.1 0 97.1 2.9 0 0 0 0 0 88.1 0 9.5 2.5
Total % 0.6 61.6 0 0.1 62.2 0 31.6 0.9 0 32.5 0 0 0 0 0 4.7 0 0.5 0.1 5.3Typical Vehicles 2281 1147
% Typical Vehicles 90.5 97.4 0 0 97.3 0 95.5 94.4 0 95.5 0 0 0 0 0 96.6 0 89.5 80 95.5 96.6Heavy Duty Vehicles
% Heavy Duty Vehicles 9.5 2.6 0 100 2.7 0 4.5 5.6 0 4.5 0 0 0 0 0 3.4 0 10.5 20 4.5 3.4
Second AvenueEastbound
Second AvenueWestbound
Northbound
Mansion StreetSouthbound
Start Time Left Thru RightRt. on
RedApp. Total Left Thru Right
Rt. on
RedApp. Total Left Thru Right
Rt. on
RedApp. Total Left Thru Right
Rt. on
RedApp. Total Int. Total
Peak Hour Analysis From 04:00 PM to 06:45 PM - Peak 1 of 1Peak Hour for Entire Intersection Begins at 04:15 PM
04:15 PM 3 204 0 0 207 0 108 3 0 111 0 0 0 0 0 29 0 2 1 32 35004:30 PM 1 234 0 0 235 0 89 5 0 94 0 0 0 0 0 31 0 2 0 33 36204:45 PM 1 212 0 0 213 0 122 4 0 126 0 0 0 0 0 28 0 1 0 29 36805:00 PM 0 248 0 0 248 0 114 1 0 115 0 0 0 0 0 23 0 0 0 23 386Total Volume 5 898 0 0 903 0 433 13 0 446 0 0 0 0 0 111 0 5 1 117 1466% App. Total 0.6 99.4 0 0 0 97.1 2.9 0 0 0 0 0 94.9 0 4.3 0.9
PHF .417 .905 .000 .000 .910 .000 .887 .650 .000 .885 .000 .000 .000 .000 .000 .895 .000 .625 .250 .886 .949Typical Vehicles
% Typical Vehicles 60.0 97.3 0 0 97.1 0 93.8 84.6 0 93.5 0 0 0 0 0 98.2 0 100 0 97.4 96.0Heavy Duty Vehicles
% Heavy Duty Vehicles 40.0 2.7 0 0 2.9 0 6.2 15.4 0 6.5 0 0 0 0 0 1.8 0 0 100 2.6 4.0
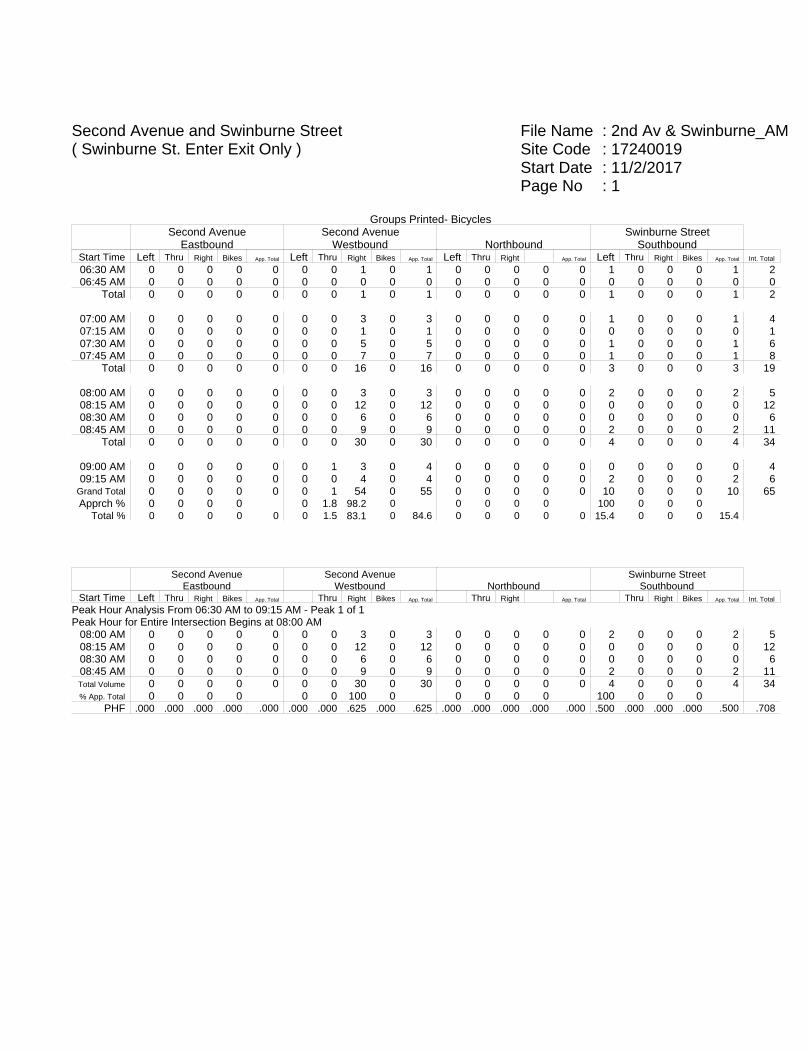
File Name : 2nd Av & Swinburne_AMSite Code : 17240019Start Date : 11/2/2017Page No : 1
Second Avenue and Swinburne Street( Swinburne St. Enter Exit Only )
Groups Printed- BicyclesSecond Avenue
EastboundSecond Avenue
Westbound NorthboundSwinburne Street
SouthboundStart Time Left Thru Right Bikes App. Total Left Thru Right Bikes App. Total Left Thru Right App. Total Left Thru Right Bikes App. Total Int. Total
06:30 AM 0 0 0 0 0 0 0 1 0 1 0 0 0 0 0 1 0 0 0 1 206:45 AM 0 0 0 0 0 0 0 0 0 0 0 0 0 0 0 0 0 0 0 0 0
Total 0 0 0 0 0 0 0 1 0 1 0 0 0 0 0 1 0 0 0 1 2
07:00 AM 0 0 0 0 0 0 0 3 0 3 0 0 0 0 0 1 0 0 0 1 407:15 AM 0 0 0 0 0 0 0 1 0 1 0 0 0 0 0 0 0 0 0 0 107:30 AM 0 0 0 0 0 0 0 5 0 5 0 0 0 0 0 1 0 0 0 1 607:45 AM 0 0 0 0 0 0 0 7 0 7 0 0 0 0 0 1 0 0 0 1 8
Total 0 0 0 0 0 0 0 16 0 16 0 0 0 0 0 3 0 0 0 3 19
08:00 AM 0 0 0 0 0 0 0 3 0 3 0 0 0 0 0 2 0 0 0 2 508:15 AM 0 0 0 0 0 0 0 12 0 12 0 0 0 0 0 0 0 0 0 0 1208:30 AM 0 0 0 0 0 0 0 6 0 6 0 0 0 0 0 0 0 0 0 0 608:45 AM 0 0 0 0 0 0 0 9 0 9 0 0 0 0 0 2 0 0 0 2 11
Total 0 0 0 0 0 0 0 30 0 30 0 0 0 0 0 4 0 0 0 4 34
09:00 AM 0 0 0 0 0 0 1 3 0 4 0 0 0 0 0 0 0 0 0 0 409:15 AM 0 0 0 0 0 0 0 4 0 4 0 0 0 0 0 2 0 0 0 2 6
Grand Total 0 0 0 0 0 0 1 54 0 55 0 0 0 0 0 10 0 0 0 10 65Apprch % 0 0 0 0 0 1.8 98.2 0 0 0 0 0 100 0 0 0
Total % 0 0 0 0 0 0 1.5 83.1 0 84.6 0 0 0 0 0 15.4 0 0 0 15.4
Second AvenueEastbound
Second AvenueWestbound Northbound
Swinburne StreetSouthbound
Start Time Left Thru Right Bikes App. Total Thru Right Bikes App. Total Thru Right App. Total Thru Right Bikes App. Total Int. Total
Peak Hour Analysis From 06:30 AM to 09:15 AM - Peak 1 of 1Peak Hour for Entire Intersection Begins at 08:00 AM
08:00 AM 0 0 0 0 0 0 0 3 0 3 0 0 0 0 0 2 0 0 0 2 508:15 AM 0 0 0 0 0 0 0 12 0 12 0 0 0 0 0 0 0 0 0 0 1208:30 AM 0 0 0 0 0 0 0 6 0 6 0 0 0 0 0 0 0 0 0 0 608:45 AM 0 0 0 0 0 0 0 9 0 9 0 0 0 0 0 2 0 0 0 2 11Total Volume 0 0 0 0 0 0 0 30 0 30 0 0 0 0 0 4 0 0 0 4 34% App. Total 0 0 0 0 0 0 100 0 0 0 0 0 100 0 0 0
PHF .000 .000 .000 .000 .000 .000 .000 .625 .000 .625 .000 .000 .000 .000 .000 .500 .000 .000 .000 .500 .708

File Name : 2nd Av & Swinburne_AMSite Code : 17240019Start Date : 11/2/2017Page No : 1
Second Avenue and Swinburne Street( Swinburne St. Enter Exit Only )
Groups Printed- PedestriansSecond Avenue
EastboundSecond Avenue
Westbound NorthboundSwinburne Street
SouthboundStart Time Left Thru Right Peds App. Total Left Thru Right Peds App. Total Left Thru Right App. Total Left Thru Right Peds App. Total Int. Total
06:30 AM 0 0 0 0 0 0 0 0 0 0 0 0 0 0 0 0 0 0 0 0 006:45 AM 0 0 0 0 0 0 0 0 0 0 0 0 0 0 0 0 0 0 0 0 0
Total 0 0 0 0 0 0 0 0 0 0 0 0 0 0 0 0 0 0 0 0 0
07:00 AM 0 0 0 0 0 0 0 0 0 0 0 0 0 0 0 0 0 0 0 0 007:15 AM 0 0 0 0 0 0 0 0 0 0 0 0 0 0 0 0 0 0 0 0 007:30 AM 0 0 0 0 0 0 0 0 0 0 0 0 0 0 0 0 0 0 0 0 007:45 AM 0 0 0 0 0 0 0 1 0 1 0 0 0 0 0 0 0 0 0 0 1
Total 0 0 0 0 0 0 0 1 0 1 0 0 0 0 0 0 0 0 0 0 1
08:00 AM 0 0 0 0 0 0 0 1 0 1 0 0 0 0 0 1 0 0 0 1 208:15 AM 0 0 0 0 0 0 0 0 0 0 0 0 0 0 0 0 0 0 0 0 008:30 AM 0 0 0 0 0 0 0 0 0 0 0 0 0 0 0 0 0 0 0 0 008:45 AM 0 0 0 0 0 0 0 2 0 2 0 0 0 0 0 0 0 0 0 0 2
Total 0 0 0 0 0 0 0 3 0 3 0 0 0 0 0 1 0 0 0 1 4
09:00 AM 0 0 0 0 0 0 0 0 0 0 0 0 0 0 0 0 0 0 0 0 009:15 AM 0 0 0 0 0 0 0 1 0 1 0 0 0 0 0 1 0 0 0 1 2
Grand Total 0 0 0 0 0 0 0 5 0 5 0 0 0 0 0 2 0 0 0 2 7Apprch % 0 0 0 0 0 0 100 0 0 0 0 0 100 0 0 0
Total % 0 0 0 0 0 0 0 71.4 0 71.4 0 0 0 0 0 28.6 0 0 0 28.6
Second AvenueEastbound
Second AvenueWestbound Northbound
Swinburne StreetSouthbound
Start Time Left Thru Right Peds App. Total Thru Right Peds App. Total Thru Right App. Total Thru Right Peds App. Total Int. Total
Peak Hour Analysis From 06:30 AM to 09:15 AM - Peak 1 of 1Peak Hour for Entire Intersection Begins at 08:00 AM
08:00 AM 0 0 0 0 0 0 0 1 0 1 0 0 0 0 0 1 0 0 0 1 208:15 AM 0 0 0 0 0 0 0 0 0 0 0 0 0 0 0 0 0 0 0 0 008:30 AM 0 0 0 0 0 0 0 0 0 0 0 0 0 0 0 0 0 0 0 0 008:45 AM 0 0 0 0 0 0 0 2 0 2 0 0 0 0 0 0 0 0 0 0 2Total Volume 0 0 0 0 0 0 0 3 0 3 0 0 0 0 0 1 0 0 0 1 4% App. Total 0 0 0 0 0 0 100 0 0 0 0 0 100 0 0 0
PHF .000 .000 .000 .000 .000 .000 .000 .375 .000 .375 .000 .000 .000 .000 .000 .250 .000 .000 .000 .250 .500
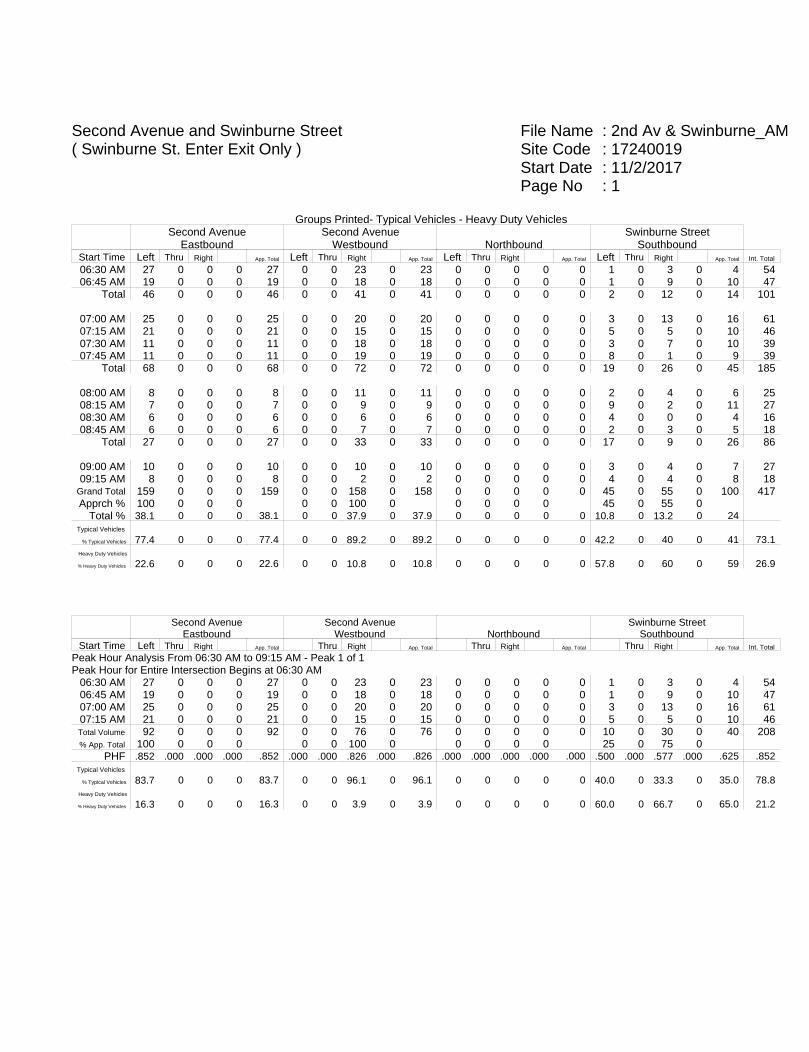
File Name : 2nd Av & Swinburne_AMSite Code : 17240019Start Date : 11/2/2017Page No : 1
Second Avenue and Swinburne Street( Swinburne St. Enter Exit Only )
Groups Printed- Typical Vehicles - Heavy Duty VehiclesSecond Avenue
EastboundSecond Avenue
Westbound NorthboundSwinburne Street
SouthboundStart Time Left Thru Right App. Total Left Thru Right App. Total Left Thru Right App. Total Left Thru Right App. Total Int. Total
06:30 AM 27 0 0 0 27 0 0 23 0 23 0 0 0 0 0 1 0 3 0 4 5406:45 AM 19 0 0 0 19 0 0 18 0 18 0 0 0 0 0 1 0 9 0 10 47
Total 46 0 0 0 46 0 0 41 0 41 0 0 0 0 0 2 0 12 0 14 101
07:00 AM 25 0 0 0 25 0 0 20 0 20 0 0 0 0 0 3 0 13 0 16 6107:15 AM 21 0 0 0 21 0 0 15 0 15 0 0 0 0 0 5 0 5 0 10 4607:30 AM 11 0 0 0 11 0 0 18 0 18 0 0 0 0 0 3 0 7 0 10 3907:45 AM 11 0 0 0 11 0 0 19 0 19 0 0 0 0 0 8 0 1 0 9 39
Total 68 0 0 0 68 0 0 72 0 72 0 0 0 0 0 19 0 26 0 45 185
08:00 AM 8 0 0 0 8 0 0 11 0 11 0 0 0 0 0 2 0 4 0 6 2508:15 AM 7 0 0 0 7 0 0 9 0 9 0 0 0 0 0 9 0 2 0 11 2708:30 AM 6 0 0 0 6 0 0 6 0 6 0 0 0 0 0 4 0 0 0 4 1608:45 AM 6 0 0 0 6 0 0 7 0 7 0 0 0 0 0 2 0 3 0 5 18
Total 27 0 0 0 27 0 0 33 0 33 0 0 0 0 0 17 0 9 0 26 86
09:00 AM 10 0 0 0 10 0 0 10 0 10 0 0 0 0 0 3 0 4 0 7 2709:15 AM 8 0 0 0 8 0 0 2 0 2 0 0 0 0 0 4 0 4 0 8 18
Grand Total 159 0 0 0 159 0 0 158 0 158 0 0 0 0 0 45 0 55 0 100 417Apprch % 100 0 0 0 0 0 100 0 0 0 0 0 45 0 55 0
Total % 38.1 0 0 0 38.1 0 0 37.9 0 37.9 0 0 0 0 0 10.8 0 13.2 0 24Typical Vehicles
% Typical Vehicles 77.4 0 0 0 77.4 0 0 89.2 0 89.2 0 0 0 0 0 42.2 0 40 0 41 73.1Heavy Duty Vehicles
% Heavy Duty Vehicles 22.6 0 0 0 22.6 0 0 10.8 0 10.8 0 0 0 0 0 57.8 0 60 0 59 26.9
Second AvenueEastbound
Second AvenueWestbound Northbound
Swinburne StreetSouthbound
Start Time Left Thru Right App. Total Thru Right App. Total Thru Right App. Total Thru Right App. Total Int. Total
Peak Hour Analysis From 06:30 AM to 09:15 AM - Peak 1 of 1Peak Hour for Entire Intersection Begins at 06:30 AM
06:30 AM 27 0 0 0 27 0 0 23 0 23 0 0 0 0 0 1 0 3 0 4 5406:45 AM 19 0 0 0 19 0 0 18 0 18 0 0 0 0 0 1 0 9 0 10 4707:00 AM 25 0 0 0 25 0 0 20 0 20 0 0 0 0 0 3 0 13 0 16 6107:15 AM 21 0 0 0 21 0 0 15 0 15 0 0 0 0 0 5 0 5 0 10 46Total Volume 92 0 0 0 92 0 0 76 0 76 0 0 0 0 0 10 0 30 0 40 208% App. Total 100 0 0 0 0 0 100 0 0 0 0 0 25 0 75 0
PHF .852 .000 .000 .000 .852 .000 .000 .826 .000 .826 .000 .000 .000 .000 .000 .500 .000 .577 .000 .625 .852Typical Vehicles
% Typical Vehicles 83.7 0 0 0 83.7 0 0 96.1 0 96.1 0 0 0 0 0 40.0 0 33.3 0 35.0 78.8Heavy Duty Vehicles
% Heavy Duty Vehicles 16.3 0 0 0 16.3 0 0 3.9 0 3.9 0 0 0 0 0 60.0 0 66.7 0 65.0 21.2

File Name : 2nd Av & Swinburne_PMSite Code : 17240019Start Date : 11/2/2017Page No : 1
Second Avenue and Swinburne Street( Swinburne St. Enter Exit Only )
Groups Printed- BicyclesSecond Avenue
EastboundSecond Avenue
Westbound NorthboundSwinburne Street
SouthboundStart Time Left Thru Right Bikes App. Total Left Thru Right Bikes App. Total Left Thru Right App. Total Left Thru Right Bikes App. Total Int. Total
04:00 PM 0 0 0 0 0 0 0 7 0 7 0 0 0 0 0 4 0 0 0 4 1104:15 PM 0 0 0 0 0 0 1 2 0 3 0 0 0 0 0 7 0 0 0 7 1004:30 PM 0 0 0 0 0 0 0 2 0 2 0 0 0 0 0 10 0 0 0 10 1204:45 PM 0 0 0 0 0 0 0 5 0 5 0 0 0 0 0 9 0 0 0 9 14
Total 0 0 0 0 0 0 1 16 0 17 0 0 0 0 0 30 0 0 0 30 47
05:00 PM 0 0 0 0 0 0 0 7 0 7 0 0 0 0 0 11 0 0 0 11 1805:15 PM 0 0 0 0 0 0 0 5 0 5 0 0 0 0 0 8 0 0 0 8 1305:30 PM 0 0 0 0 0 0 0 6 0 6 0 0 0 0 0 11 0 0 0 11 1705:45 PM 0 0 0 0 0 0 0 2 0 2 0 0 0 0 0 12 0 0 0 12 14
Total 0 0 0 0 0 0 0 20 0 20 0 0 0 0 0 42 0 0 0 42 62
06:00 PM 0 0 0 0 0 0 0 5 0 5 0 0 0 0 0 7 0 0 0 7 1206:15 PM 0 0 0 0 0 0 2 4 0 6 0 0 0 0 0 4 0 0 0 4 1006:30 PM 0 0 0 0 0 0 0 5 0 5 0 0 0 0 0 4 0 0 0 4 906:45 PM 0 0 0 0 0 0 0 2 0 2 0 0 0 0 0 4 0 0 0 4 6
Total 0 0 0 0 0 0 2 16 0 18 0 0 0 0 0 19 0 0 0 19 37
Grand Total 0 0 0 0 0 0 3 52 0 55 0 0 0 0 0 91 0 0 0 91 146Apprch % 0 0 0 0 0 5.5 94.5 0 0 0 0 0 100 0 0 0
Total % 0 0 0 0 0 0 2.1 35.6 0 37.7 0 0 0 0 0 62.3 0 0 0 62.3
Second AvenueEastbound
Second AvenueWestbound Northbound
Swinburne StreetSouthbound
Start Time Left Thru Right Bikes App. Total Thru Right Bikes App. Total Thru Right App. Total Thru Right Bikes App. Total Int. Total
Peak Hour Analysis From 04:00 PM to 06:45 PM - Peak 1 of 1Peak Hour for Entire Intersection Begins at 04:45 PM
04:45 PM 0 0 0 0 0 0 0 5 0 5 0 0 0 0 0 9 0 0 0 9 1405:00 PM 0 0 0 0 0 0 0 7 0 7 0 0 0 0 0 11 0 0 0 11 1805:15 PM 0 0 0 0 0 0 0 5 0 5 0 0 0 0 0 8 0 0 0 8 1305:30 PM 0 0 0 0 0 0 0 6 0 6 0 0 0 0 0 11 0 0 0 11 17Total Volume 0 0 0 0 0 0 0 23 0 23 0 0 0 0 0 39 0 0 0 39 62% App. Total 0 0 0 0 0 0 100 0 0 0 0 0 100 0 0 0
PHF .000 .000 .000 .000 .000 .000 .000 .821 .000 .821 .000 .000 .000 .000 .000 .886 .000 .000 .000 .886 .861

File Name : 2nd Av & Swinburne_PMSite Code : 17240019Start Date : 11/2/2017Page No : 1
Second Avenue and Swinburne Street( Swinburne St. Enter Exit Only )
Groups Printed- PedestriansSecond Avenue
EastboundSecond Avenue
Westbound NorthboundSwinburne Street
SouthboundStart Time Left Thru Right Peds App. Total Left Thru Right Peds App. Total Left Thru Right App. Total Left Thru Right Peds App. Total Int. Total
04:00 PM 0 0 0 0 0 0 0 0 0 0 0 0 0 0 0 0 0 0 0 0 004:15 PM 0 0 0 0 0 0 0 0 0 0 0 0 0 0 0 0 0 0 0 0 004:30 PM 0 0 0 0 0 0 0 2 0 2 0 0 0 0 0 1 0 0 0 1 304:45 PM 0 0 0 0 0 0 0 9 0 9 0 0 0 0 0 0 0 0 0 0 9
Total 0 0 0 0 0 0 0 11 0 11 0 0 0 0 0 1 0 0 0 1 12
05:00 PM 0 0 0 0 0 0 0 3 0 3 0 0 0 0 0 3 0 0 0 3 605:15 PM 0 0 0 0 0 0 0 2 0 2 0 0 0 0 0 1 0 0 0 1 305:30 PM 0 0 0 0 0 0 0 1 0 1 0 0 0 0 0 1 0 0 0 1 205:45 PM 0 0 0 0 0 0 0 2 0 2 0 0 0 0 0 3 0 0 0 3 5
Total 0 0 0 0 0 0 0 8 0 8 0 0 0 0 0 8 0 0 0 8 16
06:00 PM 0 0 0 0 0 0 0 1 0 1 0 0 0 0 0 4 0 0 0 4 506:15 PM 0 0 0 0 0 0 0 3 0 3 0 0 0 0 0 1 0 0 0 1 406:30 PM 0 0 0 0 0 0 0 1 0 1 0 0 0 0 0 1 0 0 0 1 206:45 PM 0 0 0 0 0 0 0 0 0 0 0 0 0 0 0 1 0 0 0 1 1
Total 0 0 0 0 0 0 0 5 0 5 0 0 0 0 0 7 0 0 0 7 12
Grand Total 0 0 0 0 0 0 0 24 0 24 0 0 0 0 0 16 0 0 0 16 40Apprch % 0 0 0 0 0 0 100 0 0 0 0 0 100 0 0 0
Total % 0 0 0 0 0 0 0 60 0 60 0 0 0 0 0 40 0 0 0 40
Second AvenueEastbound
Second AvenueWestbound Northbound
Swinburne StreetSouthbound
Start Time Left Thru Right Peds App. Total Left Thru Right Peds App. Total Left Thru Right App. Total Left Thru Right Peds App. Total Int. Total
Peak Hour Analysis From 04:00 PM to 06:45 PM - Peak 1 of 1Peak Hour for Entire Intersection Begins at 04:30 PM
04:30 PM 0 0 0 0 0 0 0 2 0 2 0 0 0 0 0 1 0 0 0 1 304:45 PM 0 0 0 0 0 0 0 9 0 9 0 0 0 0 0 0 0 0 0 0 905:00 PM 0 0 0 0 0 0 0 3 0 3 0 0 0 0 0 3 0 0 0 3 605:15 PM 0 0 0 0 0 0 0 2 0 2 0 0 0 0 0 1 0 0 0 1 3Total Volume 0 0 0 0 0 0 0 16 0 16 0 0 0 0 0 5 0 0 0 5 21% App. Total 0 0 0 0 0 0 100 0 0 0 0 0 100 0 0 0
PHF .000 .000 .000 .000 .000 .000 .000 .444 .000 .444 .000 .000 .000 .000 .000 .417 .000 .000 .000 .417 .583
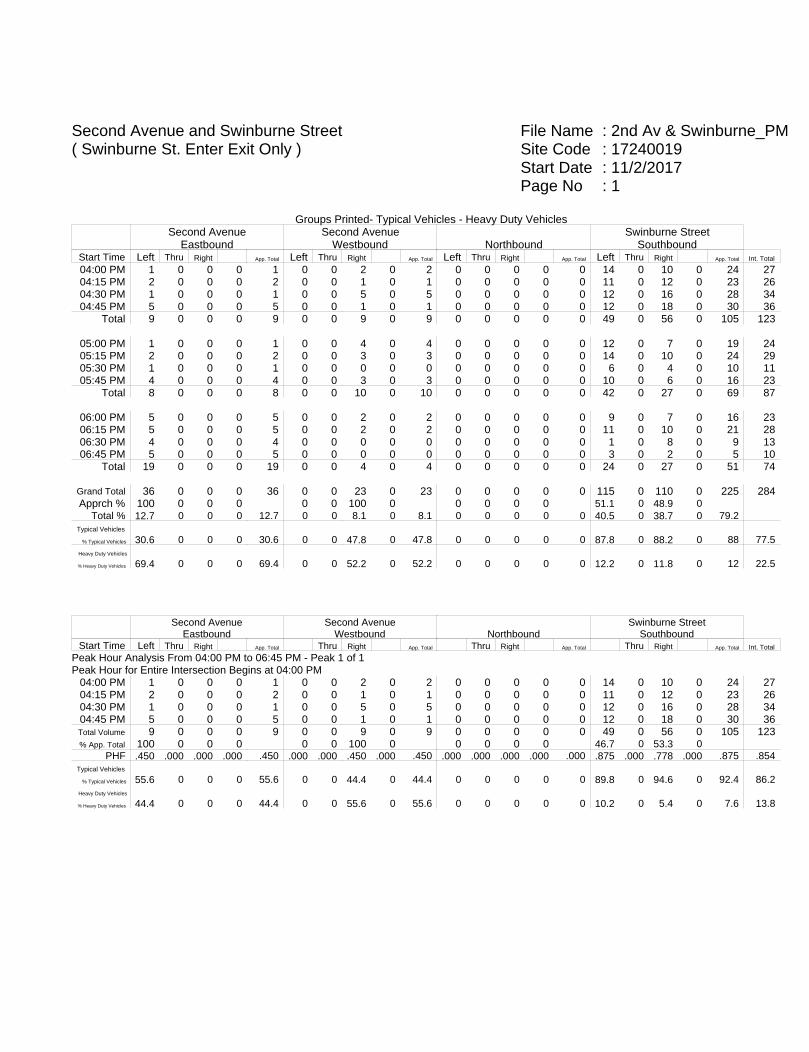
File Name : 2nd Av & Swinburne_PMSite Code : 17240019Start Date : 11/2/2017Page No : 1
Second Avenue and Swinburne Street( Swinburne St. Enter Exit Only )
Groups Printed- Typical Vehicles - Heavy Duty VehiclesSecond Avenue
EastboundSecond Avenue
Westbound NorthboundSwinburne Street
SouthboundStart Time Left Thru Right App. Total Left Thru Right App. Total Left Thru Right App. Total Left Thru Right App. Total Int. Total
04:00 PM 1 0 0 0 1 0 0 2 0 2 0 0 0 0 0 14 0 10 0 24 2704:15 PM 2 0 0 0 2 0 0 1 0 1 0 0 0 0 0 11 0 12 0 23 2604:30 PM 1 0 0 0 1 0 0 5 0 5 0 0 0 0 0 12 0 16 0 28 3404:45 PM 5 0 0 0 5 0 0 1 0 1 0 0 0 0 0 12 0 18 0 30 36
Total 9 0 0 0 9 0 0 9 0 9 0 0 0 0 0 49 0 56 0 105 123
05:00 PM 1 0 0 0 1 0 0 4 0 4 0 0 0 0 0 12 0 7 0 19 2405:15 PM 2 0 0 0 2 0 0 3 0 3 0 0 0 0 0 14 0 10 0 24 2905:30 PM 1 0 0 0 1 0 0 0 0 0 0 0 0 0 0 6 0 4 0 10 1105:45 PM 4 0 0 0 4 0 0 3 0 3 0 0 0 0 0 10 0 6 0 16 23
Total 8 0 0 0 8 0 0 10 0 10 0 0 0 0 0 42 0 27 0 69 87
06:00 PM 5 0 0 0 5 0 0 2 0 2 0 0 0 0 0 9 0 7 0 16 2306:15 PM 5 0 0 0 5 0 0 2 0 2 0 0 0 0 0 11 0 10 0 21 2806:30 PM 4 0 0 0 4 0 0 0 0 0 0 0 0 0 0 1 0 8 0 9 1306:45 PM 5 0 0 0 5 0 0 0 0 0 0 0 0 0 0 3 0 2 0 5 10
Total 19 0 0 0 19 0 0 4 0 4 0 0 0 0 0 24 0 27 0 51 74
Grand Total 36 0 0 0 36 0 0 23 0 23 0 0 0 0 0 115 0 110 0 225 284Apprch % 100 0 0 0 0 0 100 0 0 0 0 0 51.1 0 48.9 0
Total % 12.7 0 0 0 12.7 0 0 8.1 0 8.1 0 0 0 0 0 40.5 0 38.7 0 79.2Typical Vehicles
% Typical Vehicles 30.6 0 0 0 30.6 0 0 47.8 0 47.8 0 0 0 0 0 87.8 0 88.2 0 88 77.5Heavy Duty Vehicles
% Heavy Duty Vehicles 69.4 0 0 0 69.4 0 0 52.2 0 52.2 0 0 0 0 0 12.2 0 11.8 0 12 22.5
Second AvenueEastbound
Second AvenueWestbound Northbound
Swinburne StreetSouthbound
Start Time Left Thru Right App. Total Thru Right App. Total Thru Right App. Total Thru Right App. Total Int. Total
Peak Hour Analysis From 04:00 PM to 06:45 PM - Peak 1 of 1Peak Hour for Entire Intersection Begins at 04:00 PM
04:00 PM 1 0 0 0 1 0 0 2 0 2 0 0 0 0 0 14 0 10 0 24 2704:15 PM 2 0 0 0 2 0 0 1 0 1 0 0 0 0 0 11 0 12 0 23 2604:30 PM 1 0 0 0 1 0 0 5 0 5 0 0 0 0 0 12 0 16 0 28 3404:45 PM 5 0 0 0 5 0 0 1 0 1 0 0 0 0 0 12 0 18 0 30 36Total Volume 9 0 0 0 9 0 0 9 0 9 0 0 0 0 0 49 0 56 0 105 123% App. Total 100 0 0 0 0 0 100 0 0 0 0 0 46.7 0 53.3 0
PHF .450 .000 .000 .000 .450 .000 .000 .450 .000 .450 .000 .000 .000 .000 .000 .875 .000 .778 .000 .875 .854Typical Vehicles
% Typical Vehicles 55.6 0 0 0 55.6 0 0 44.4 0 44.4 0 0 0 0 0 89.8 0 94.6 0 92.4 86.2Heavy Duty Vehicles
% Heavy Duty Vehicles 44.4 0 0 0 44.4 0 0 55.6 0 55.6 0 0 0 0 0 10.2 0 5.4 0 7.6 13.8
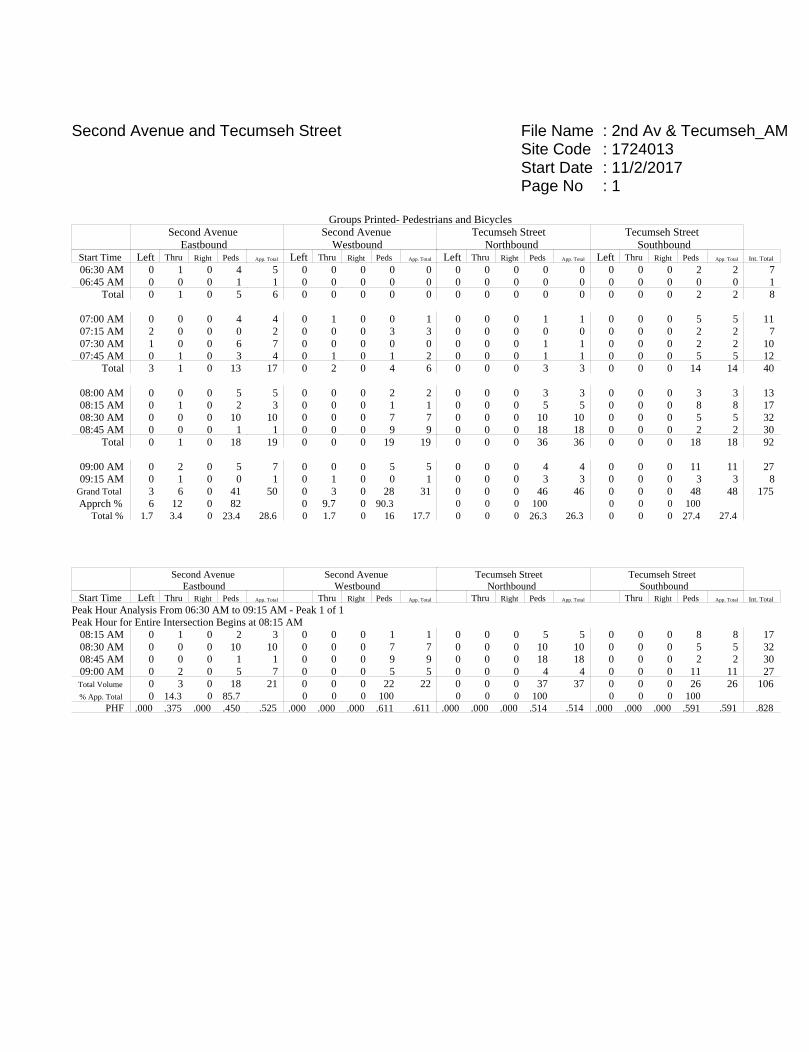
File Name : 2nd Av & Tecumseh_AMSite Code : 1724013Start Date : 11/2/2017Page No : 1
Second Avenue and Tecumseh Street
Groups Printed- Pedestrians and BicyclesSecond Avenue
EastboundSecond Avenue
WestboundTecumseh Street
NorthboundTecumseh Street
SouthboundStart Time Left Thru Right Peds App. Total Left Thru Right Peds App. Total Left Thru Right Peds App. Total Left Thru Right Peds App. Total Int. Total
06:30 AM 0 1 0 4 5 0 0 0 0 0 0 0 0 0 0 0 0 0 2 2 706:45 AM 0 0 0 1 1 0 0 0 0 0 0 0 0 0 0 0 0 0 0 0 1
Total 0 1 0 5 6 0 0 0 0 0 0 0 0 0 0 0 0 0 2 2 8
07:00 AM 0 0 0 4 4 0 1 0 0 1 0 0 0 1 1 0 0 0 5 5 1107:15 AM 2 0 0 0 2 0 0 0 3 3 0 0 0 0 0 0 0 0 2 2 707:30 AM 1 0 0 6 7 0 0 0 0 0 0 0 0 1 1 0 0 0 2 2 1007:45 AM 0 1 0 3 4 0 1 0 1 2 0 0 0 1 1 0 0 0 5 5 12
Total 3 1 0 13 17 0 2 0 4 6 0 0 0 3 3 0 0 0 14 14 40
08:00 AM 0 0 0 5 5 0 0 0 2 2 0 0 0 3 3 0 0 0 3 3 1308:15 AM 0 1 0 2 3 0 0 0 1 1 0 0 0 5 5 0 0 0 8 8 1708:30 AM 0 0 0 10 10 0 0 0 7 7 0 0 0 10 10 0 0 0 5 5 3208:45 AM 0 0 0 1 1 0 0 0 9 9 0 0 0 18 18 0 0 0 2 2 30
Total 0 1 0 18 19 0 0 0 19 19 0 0 0 36 36 0 0 0 18 18 92
09:00 AM 0 2 0 5 7 0 0 0 5 5 0 0 0 4 4 0 0 0 11 11 2709:15 AM 0 1 0 0 1 0 1 0 0 1 0 0 0 3 3 0 0 0 3 3 8
Grand Total 3 6 0 41 50 0 3 0 28 31 0 0 0 46 46 0 0 0 48 48 175Apprch % 6 12 0 82 0 9.7 0 90.3 0 0 0 100 0 0 0 100
Total % 1.7 3.4 0 23.4 28.6 0 1.7 0 16 17.7 0 0 0 26.3 26.3 0 0 0 27.4 27.4
Second AvenueEastbound
Second AvenueWestbound
Tecumseh StreetNorthbound
Tecumseh StreetSouthbound
Start Time Left Thru Right Peds App. Total Thru Right Peds App. Total Thru Right Peds App. Total Thru Right Peds App. Total Int. Total
Peak Hour Analysis From 06:30 AM to 09:15 AM - Peak 1 of 1Peak Hour for Entire Intersection Begins at 08:15 AM
08:15 AM 0 1 0 2 3 0 0 0 1 1 0 0 0 5 5 0 0 0 8 8 1708:30 AM 0 0 0 10 10 0 0 0 7 7 0 0 0 10 10 0 0 0 5 5 3208:45 AM 0 0 0 1 1 0 0 0 9 9 0 0 0 18 18 0 0 0 2 2 3009:00 AM 0 2 0 5 7 0 0 0 5 5 0 0 0 4 4 0 0 0 11 11 27Total Volume 0 3 0 18 21 0 0 0 22 22 0 0 0 37 37 0 0 0 26 26 106% App. Total 0 14.3 0 85.7 0 0 0 100 0 0 0 100 0 0 0 100
PHF .000 .375 .000 .450 .525 .000 .000 .000 .611 .611 .000 .000 .000 .514 .514 .000 .000 .000 .591 .591 .828

File Name : 2nd Av & Tecumseh_AMSite Code : 1724013Start Date : 11/2/2017Page No : 1
Second Avenue and Tecumseh Street
Groups Printed- Typical Vehicles - Heavy Duty VehiclesSecond Avenue
EastboundSecond Avenue
WestboundTecumseh Street
NorthboundTecumseh Street
Southbound
Start Time Left Thru RightRt. on
RedApp. Total Left Thru Right
Rt. on
RedApp. Total Left Thru Right
Rt. on
RedApp. Total Left Thru Right
Rt. on
RedApp. Total Int. Total
06:30 AM 0 62 2 0 64 1 260 1 0 262 3 2 2 0 7 0 0 0 0 0 33306:45 AM 0 61 1 0 62 2 283 0 0 285 1 1 2 0 4 0 0 0 0 0 351
Total 0 123 3 0 126 3 543 1 0 547 4 3 4 0 11 0 0 0 0 0 684
07:00 AM 0 94 0 0 94 2 275 2 0 279 3 2 0 0 5 0 0 4 0 4 38207:15 AM 0 97 1 0 98 1 320 0 0 321 2 0 1 0 3 0 0 1 0 1 42307:30 AM 0 82 1 0 83 0 364 0 0 364 1 0 0 0 1 0 0 0 0 0 44807:45 AM 0 103 2 0 105 0 324 0 0 324 0 0 0 0 0 1 0 2 0 3 432
Total 0 376 4 0 380 3 1283 2 0 1288 6 2 1 0 9 1 0 7 0 8 1685
08:00 AM 0 73 1 0 74 0 301 0 0 301 2 0 0 0 2 0 0 1 0 1 37808:15 AM 0 82 5 0 87 2 316 2 0 320 1 1 1 0 3 0 0 0 0 0 41008:30 AM 0 68 2 0 70 1 239 0 0 240 2 0 1 0 3 0 0 3 0 3 31608:45 AM 0 88 4 0 92 0 204 1 0 205 1 1 0 0 2 0 0 1 0 1 300
Total 0 311 12 0 323 3 1060 3 0 1066 6 2 2 0 10 0 0 5 0 5 1404
09:00 AM 0 77 1 0 78 1 213 2 0 216 1 1 3 0 5 0 1 0 0 1 30009:15 AM 1 96 7 0 104 0 165 1 0 166 2 0 1 0 3 0 0 4 0 4 277
Grand Total 1 983 27 0 1011 10 3264 9 0 3283 19 8 11 0 38 1 1 16 0 18 4350Apprch % 0.1 97.2 2.7 0 0.3 99.4 0.3 0 50 21.1 28.9 0 5.6 5.6 88.9 0
Total % 0 22.6 0.6 0 23.2 0.2 75 0.2 0 75.5 0.4 0.2 0.3 0 0.9 0 0 0.4 0 0.4Typical Vehicles 3133
% Typical Vehicles 100 88.4 77.8 0 88.1 100 96 88.9 0 96 94.7 87.5 90.9 0 92.1 100 100 81.2 0 83.3 94.1Heavy Duty Vehicles
% Heavy Duty Vehicles 0 11.6 22.2 0 11.9 0 4 11.1 0 4 5.3 12.5 9.1 0 7.9 0 0 18.8 0 16.7 5.9
Second AvenueEastbound
Second AvenueWestbound
Tecumseh StreetNorthbound
Tecumseh StreetSouthbound
Start Time Left Thru RightRt. on
RedApp. Total Left Thru Right
Rt. on
RedApp. Total Left Thru Right
Rt. on
RedApp. Total Left Thru Right
Rt. on
RedApp. Total Int. Total
Peak Hour Analysis From 06:30 AM to 09:15 AM - Peak 1 of 1Peak Hour for Entire Intersection Begins at 07:00 AM
07:00 AM 0 94 0 0 94 2 275 2 0 279 3 2 0 0 5 0 0 4 0 4 38207:15 AM 0 97 1 0 98 1 320 0 0 321 2 0 1 0 3 0 0 1 0 1 42307:30 AM 0 82 1 0 83 0 364 0 0 364 1 0 0 0 1 0 0 0 0 0 44807:45 AM 0 103 2 0 105 0 324 0 0 324 0 0 0 0 0 1 0 2 0 3 432Total Volume 0 376 4 0 380 3 1283 2 0 1288 6 2 1 0 9 1 0 7 0 8 1685% App. Total 0 98.9 1.1 0 0.2 99.6 0.2 0 66.7 22.2 11.1 0 12.5 0 87.5 0
PHF .000 .913 .500 .000 .905 .375 .881 .250 .000 .885 .500 .250 .250 .000 .450 .250 .000 .438 .000 .500 .940Typical Vehicles 1243
% Typical Vehicles 0 89.6 75.0 0 89.5 100 96.9 100 0 96.9 100 100 100 0 100 100 0 85.7 0 87.5 95.2Heavy Duty Vehicles
% Heavy Duty Vehicles 0 10.4 25.0 0 10.5 0 3.1 0 0 3.1 0 0 0 0 0 0 0 14.3 0 12.5 4.8
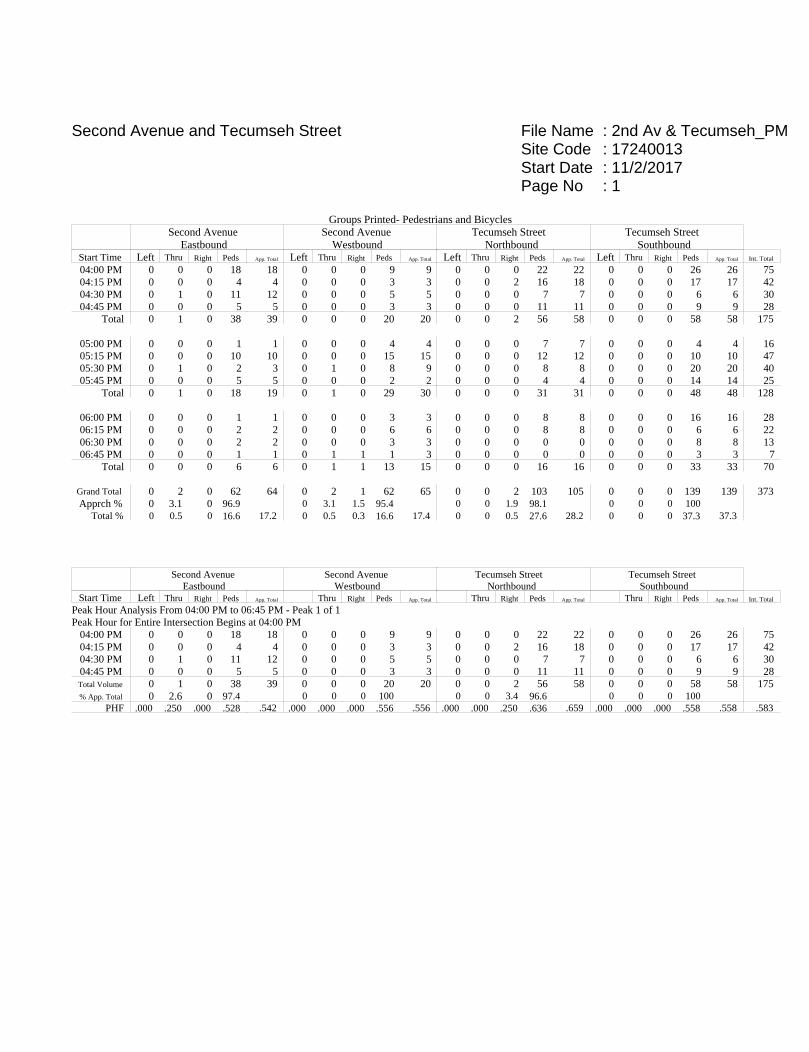
File Name : 2nd Av & Tecumseh_PMSite Code : 17240013Start Date : 11/2/2017Page No : 1
Second Avenue and Tecumseh Street
Groups Printed- Pedestrians and BicyclesSecond Avenue
EastboundSecond Avenue
WestboundTecumseh Street
NorthboundTecumseh Street
SouthboundStart Time Left Thru Right Peds App. Total Left Thru Right Peds App. Total Left Thru Right Peds App. Total Left Thru Right Peds App. Total Int. Total
04:00 PM 0 0 0 18 18 0 0 0 9 9 0 0 0 22 22 0 0 0 26 26 7504:15 PM 0 0 0 4 4 0 0 0 3 3 0 0 2 16 18 0 0 0 17 17 4204:30 PM 0 1 0 11 12 0 0 0 5 5 0 0 0 7 7 0 0 0 6 6 3004:45 PM 0 0 0 5 5 0 0 0 3 3 0 0 0 11 11 0 0 0 9 9 28
Total 0 1 0 38 39 0 0 0 20 20 0 0 2 56 58 0 0 0 58 58 175
05:00 PM 0 0 0 1 1 0 0 0 4 4 0 0 0 7 7 0 0 0 4 4 1605:15 PM 0 0 0 10 10 0 0 0 15 15 0 0 0 12 12 0 0 0 10 10 4705:30 PM 0 1 0 2 3 0 1 0 8 9 0 0 0 8 8 0 0 0 20 20 4005:45 PM 0 0 0 5 5 0 0 0 2 2 0 0 0 4 4 0 0 0 14 14 25
Total 0 1 0 18 19 0 1 0 29 30 0 0 0 31 31 0 0 0 48 48 128
06:00 PM 0 0 0 1 1 0 0 0 3 3 0 0 0 8 8 0 0 0 16 16 2806:15 PM 0 0 0 2 2 0 0 0 6 6 0 0 0 8 8 0 0 0 6 6 2206:30 PM 0 0 0 2 2 0 0 0 3 3 0 0 0 0 0 0 0 0 8 8 1306:45 PM 0 0 0 1 1 0 1 1 1 3 0 0 0 0 0 0 0 0 3 3 7
Total 0 0 0 6 6 0 1 1 13 15 0 0 0 16 16 0 0 0 33 33 70
Grand Total 0 2 0 62 64 0 2 1 62 65 0 0 2 103 105 0 0 0 139 139 373Apprch % 0 3.1 0 96.9 0 3.1 1.5 95.4 0 0 1.9 98.1 0 0 0 100
Total % 0 0.5 0 16.6 17.2 0 0.5 0.3 16.6 17.4 0 0 0.5 27.6 28.2 0 0 0 37.3 37.3
Second AvenueEastbound
Second AvenueWestbound
Tecumseh StreetNorthbound
Tecumseh StreetSouthbound
Start Time Left Thru Right Peds App. Total Thru Right Peds App. Total Thru Right Peds App. Total Thru Right Peds App. Total Int. Total
Peak Hour Analysis From 04:00 PM to 06:45 PM - Peak 1 of 1Peak Hour for Entire Intersection Begins at 04:00 PM
04:00 PM 0 0 0 18 18 0 0 0 9 9 0 0 0 22 22 0 0 0 26 26 7504:15 PM 0 0 0 4 4 0 0 0 3 3 0 0 2 16 18 0 0 0 17 17 4204:30 PM 0 1 0 11 12 0 0 0 5 5 0 0 0 7 7 0 0 0 6 6 3004:45 PM 0 0 0 5 5 0 0 0 3 3 0 0 0 11 11 0 0 0 9 9 28Total Volume 0 1 0 38 39 0 0 0 20 20 0 0 2 56 58 0 0 0 58 58 175% App. Total 0 2.6 0 97.4 0 0 0 100 0 0 3.4 96.6 0 0 0 100
PHF .000 .250 .000 .528 .542 .000 .000 .000 .556 .556 .000 .000 .250 .636 .659 .000 .000 .000 .558 .558 .583

File Name : 2nd Av & Tecumseh_PMSite Code : 17240013Start Date : 11/2/2017Page No : 1
Second Avenue and Tecumseh Street
Groups Printed- Typical Vehicles - Heavy Duty VehiclesSecond Avenue
EastboundSecond Avenue
WestboundTecumseh Street
NorthboundTecumseh Street
Southbound
Start Time Left Thru RightRt. on
RedApp. Total Left Thru Right
Rt. on
RedApp. Total Left Thru Right
Rt. on
RedApp. Total Left Thru Right
Rt. on
RedApp. Total Int. Total
04:00 PM 0 180 3 0 183 1 90 4 0 95 4 0 3 0 7 0 0 4 0 4 28904:15 PM 1 173 3 0 177 2 117 2 0 121 2 0 5 0 7 2 2 1 0 5 31004:30 PM 1 221 3 0 225 2 95 3 0 100 3 0 2 0 5 3 0 1 0 4 33404:45 PM 0 214 3 0 217 2 117 1 0 120 2 0 2 0 4 1 0 1 0 2 343
Total 2 788 12 0 802 7 419 10 0 436 11 0 12 0 23 6 2 7 0 15 1276
05:00 PM 0 231 1 0 232 1 108 1 0 110 6 1 1 0 8 0 1 1 0 2 35205:15 PM 0 206 0 0 206 2 114 3 0 119 4 1 2 0 7 2 0 0 0 2 33405:30 PM 0 212 1 0 213 2 106 0 0 108 5 0 2 0 7 0 0 1 0 1 32905:45 PM 0 220 2 0 222 3 101 0 0 104 3 1 0 0 4 0 2 1 0 3 333
Total 0 869 4 0 873 8 429 4 0 441 18 3 5 0 26 2 3 3 0 8 1348
06:00 PM 0 192 4 0 196 0 103 1 0 104 4 2 0 0 6 1 0 0 0 1 30706:15 PM 1 171 2 0 174 0 109 0 0 109 1 0 2 0 3 1 0 1 0 2 28806:30 PM 0 152 0 0 152 0 93 0 0 93 3 1 1 0 5 2 2 0 0 4 25406:45 PM 1 106 2 0 109 2 75 1 0 78 6 0 1 0 7 0 0 0 0 0 194
Total 2 621 8 0 631 2 380 2 0 384 14 3 4 0 21 4 2 1 0 7 1043
Grand Total 4 2278 24 0 2306 17 1228 16 0 1261 43 6 21 0 70 12 7 11 0 30 3667Apprch % 0.2 98.8 1 0 1.3 97.4 1.3 0 61.4 8.6 30 0 40 23.3 36.7 0
Total % 0.1 62.1 0.7 0 62.9 0.5 33.5 0.4 0 34.4 1.2 0.2 0.6 0 1.9 0.3 0.2 0.3 0 0.8Typical Vehicles 2213 1167
% Typical Vehicles 100 97.1 100 0 97.2 100 95 93.8 0 95.1 100 100 95.2 0 98.6 100 100 63.6 0 86.7 96.4Heavy Duty Vehicles
% Heavy Duty Vehicles 0 2.9 0 0 2.8 0 5 6.2 0 4.9 0 0 4.8 0 1.4 0 0 36.4 0 13.3 3.6
Second AvenueEastbound
Second AvenueWestbound
Tecumseh StreetNorthbound
Tecumseh StreetSouthbound
Start Time Left Thru RightRt. on
RedApp. Total Left Thru Right
Rt. on
RedApp. Total Left Thru Right
Rt. on
RedApp. Total Left Thru Right
Rt. on
RedApp. Total Int. Total
Peak Hour Analysis From 04:00 PM to 06:45 PM - Peak 1 of 1Peak Hour for Entire Intersection Begins at 04:30 PM
04:30 PM 1 221 3 0 225 2 95 3 0 100 3 0 2 0 5 3 0 1 0 4 33404:45 PM 0 214 3 0 217 2 117 1 0 120 2 0 2 0 4 1 0 1 0 2 34305:00 PM 0 231 1 0 232 1 108 1 0 110 6 1 1 0 8 0 1 1 0 2 35205:15 PM 0 206 0 0 206 2 114 3 0 119 4 1 2 0 7 2 0 0 0 2 334Total Volume 1 872 7 0 880 7 434 8 0 449 15 2 7 0 24 6 1 3 0 10 1363% App. Total 0.1 99.1 0.8 0 1.6 96.7 1.8 0 62.5 8.3 29.2 0 60 10 30 0
PHF .250 .944 .583 .000 .948 .875 .927 .667 .000 .935 .625 .500 .875 .000 .750 .500 .250 .750 .000 .625 .968Typical Vehicles
% Typical Vehicles 100 97.2 100 0 97.3 100 95.4 100 0 95.5 100 100 100 0 100 100 100 66.7 0 90.0 96.7Heavy Duty Vehicles
% Heavy Duty Vehicles 0 2.8 0 0 2.7 0 4.6 0 0 4.5 0 0 0 0 0 0 0 33.3 0 10.0 3.3

File Name : Bates & Blvd Allies_PMSite Code : 17240001Start Date : 11/8/2017Page No : 1
Bates Street and Boulevard of the Allies
Groups Printed- Pedestrians and BicyclesBoulevard of the Allies
EastboundBoulevard of the Allies
WestboundBates StreetNorthbound
Bates StreetSouthbound
Start Time Left Thru Right Peds App. Total Left Thru Right Peds App. Total Left Thru Right Peds App. Total Left Thru Right Peds App. Total Int. Total
04:00 PM 0 0 0 13 13 0 0 0 8 8 0 0 0 3 3 0 2 0 0 2 2604:15 PM 0 1 0 7 8 0 0 0 5 5 0 1 0 5 6 0 2 0 3 5 2404:30 PM 0 0 0 8 8 0 1 1 6 8 0 0 0 1 1 0 1 0 6 7 2404:45 PM 0 0 0 16 16 0 0 0 1 1 0 1 0 1 2 0 3 0 1 4 23
Total 0 1 0 44 45 0 1 1 20 22 0 2 0 10 12 0 8 0 10 18 97
05:00 PM 0 2 0 14 16 0 1 0 1 2 0 0 0 8 8 0 1 0 1 2 2805:15 PM 0 0 0 7 7 0 1 0 13 14 0 0 0 0 0 0 0 0 2 2 2305:30 PM 0 0 1 3 4 0 0 0 9 9 0 0 0 1 1 0 0 0 0 0 1405:45 PM 0 1 0 7 8 0 0 0 13 13 0 0 0 0 0 0 1 0 3 4 25
Total 0 3 1 31 35 0 2 0 36 38 0 0 0 9 9 0 2 0 6 8 90
06:00 PM 0 0 0 2 2 0 1 1 2 4 0 1 0 0 1 0 2 0 1 3 1006:15 PM 0 1 0 0 1 0 0 0 2 2 0 0 0 0 0 0 0 0 3 3 606:30 PM 0 0 0 1 1 0 0 0 1 1 0 0 0 0 0 0 1 0 0 1 306:45 PM 0 0 1 2 3 0 0 0 4 4 0 0 0 0 0 0 0 0 2 2 9
Total 0 1 1 5 7 0 1 1 9 11 0 1 0 0 1 0 3 0 6 9 28
Grand Total 0 5 2 80 87 0 4 2 65 71 0 3 0 19 22 0 13 0 22 35 215Apprch % 0 5.7 2.3 92 0 5.6 2.8 91.5 0 13.6 0 86.4 0 37.1 0 62.9
Total % 0 2.3 0.9 37.2 40.5 0 1.9 0.9 30.2 33 0 1.4 0 8.8 10.2 0 6 0 10.2 16.3
Boulevard of the AlliesEastbound
Boulevard of the AlliesWestbound
Bates StreetNorthbound
Bates StreetSouthbound
Start Time Left Thru Right Peds App. Total Thru Right Peds App. Total Thru Right Peds App. Total Thru Right Peds App. Total Int. Total
Peak Hour Analysis From 04:00 PM to 06:00 PM - Peak 1 of 1Peak Hour for Entire Intersection Begins at 04:15 PM
04:15 PM 0 1 0 7 8 0 0 0 5 5 0 1 0 5 6 0 2 0 3 5 2404:30 PM 0 0 0 8 8 0 1 1 6 8 0 0 0 1 1 0 1 0 6 7 2404:45 PM 0 0 0 16 16 0 0 0 1 1 0 1 0 1 2 0 3 0 1 4 2305:00 PM 0 2 0 14 16 0 1 0 1 2 0 0 0 8 8 0 1 0 1 2 28Total Volume 0 3 0 45 48 0 2 1 13 16 0 2 0 15 17 0 7 0 11 18 99% App. Total 0 6.2 0 93.8 0 12.5 6.2 81.2 0 11.8 0 88.2 0 38.9 0 61.1
PHF .000 .375 .000 .703 .750 .000 .500 .250 .542 .500 .000 .500 .000 .469 .531 .000 .583 .000 .458 .643 .884
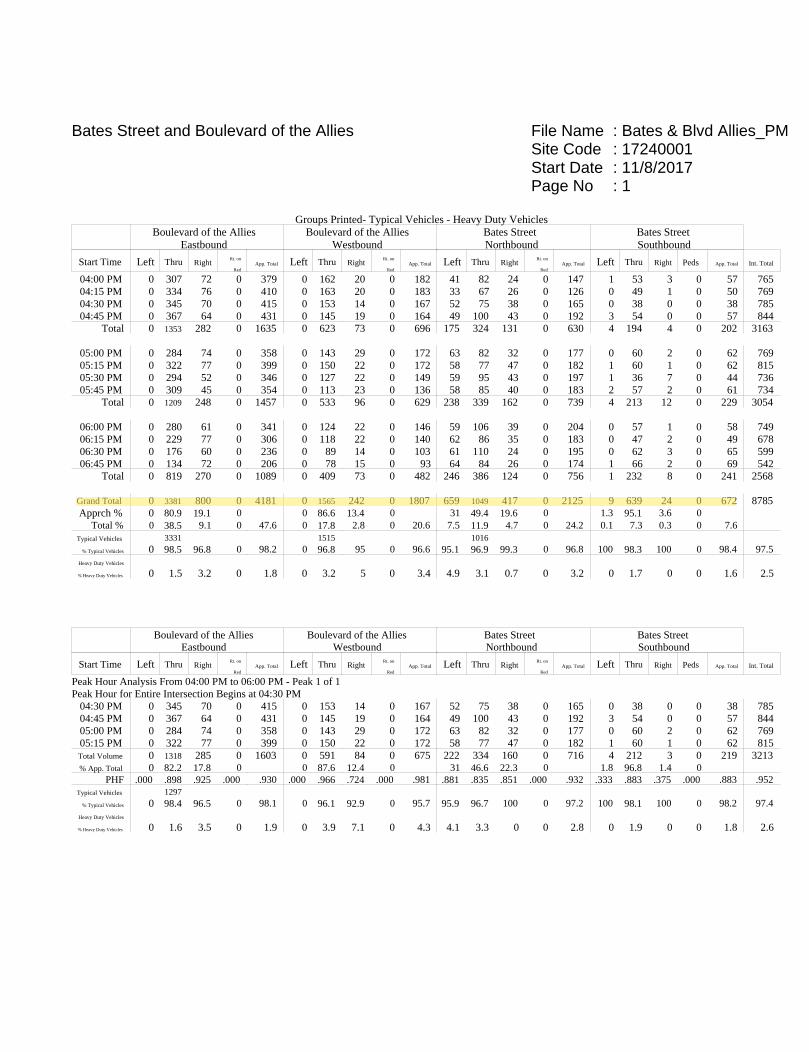
File Name : Bates & Blvd Allies_PMSite Code : 17240001Start Date : 11/8/2017Page No : 1
Bates Street and Boulevard of the Allies
Groups Printed- Typical Vehicles - Heavy Duty VehiclesBoulevard of the Allies
EastboundBoulevard of the Allies
WestboundBates StreetNorthbound
Bates StreetSouthbound
Start Time Left Thru RightRt. on
RedApp. Total Left Thru Right
Rt. on
RedApp. Total Left Thru Right
Rt. on
RedApp. Total Left Thru Right Peds App. Total Int. Total
04:00 PM 0 307 72 0 379 0 162 20 0 182 41 82 24 0 147 1 53 3 0 57 76504:15 PM 0 334 76 0 410 0 163 20 0 183 33 67 26 0 126 0 49 1 0 50 76904:30 PM 0 345 70 0 415 0 153 14 0 167 52 75 38 0 165 0 38 0 0 38 78504:45 PM 0 367 64 0 431 0 145 19 0 164 49 100 43 0 192 3 54 0 0 57 844
Total 0 1353 282 0 1635 0 623 73 0 696 175 324 131 0 630 4 194 4 0 202 3163
05:00 PM 0 284 74 0 358 0 143 29 0 172 63 82 32 0 177 0 60 2 0 62 76905:15 PM 0 322 77 0 399 0 150 22 0 172 58 77 47 0 182 1 60 1 0 62 81505:30 PM 0 294 52 0 346 0 127 22 0 149 59 95 43 0 197 1 36 7 0 44 73605:45 PM 0 309 45 0 354 0 113 23 0 136 58 85 40 0 183 2 57 2 0 61 734
Total 0 1209 248 0 1457 0 533 96 0 629 238 339 162 0 739 4 213 12 0 229 3054
06:00 PM 0 280 61 0 341 0 124 22 0 146 59 106 39 0 204 0 57 1 0 58 74906:15 PM 0 229 77 0 306 0 118 22 0 140 62 86 35 0 183 0 47 2 0 49 67806:30 PM 0 176 60 0 236 0 89 14 0 103 61 110 24 0 195 0 62 3 0 65 59906:45 PM 0 134 72 0 206 0 78 15 0 93 64 84 26 0 174 1 66 2 0 69 542
Total 0 819 270 0 1089 0 409 73 0 482 246 386 124 0 756 1 232 8 0 241 2568
Grand Total 0 3381 800 0 4181 0 1565 242 0 1807 659 1049 417 0 2125 9 639 24 0 672 8785Apprch % 0 80.9 19.1 0 0 86.6 13.4 0 31 49.4 19.6 0 1.3 95.1 3.6 0
Total % 0 38.5 9.1 0 47.6 0 17.8 2.8 0 20.6 7.5 11.9 4.7 0 24.2 0.1 7.3 0.3 0 7.6Typical Vehicles 3331 1515 1016
% Typical Vehicles 0 98.5 96.8 0 98.2 0 96.8 95 0 96.6 95.1 96.9 99.3 0 96.8 100 98.3 100 0 98.4 97.5Heavy Duty Vehicles
% Heavy Duty Vehicles 0 1.5 3.2 0 1.8 0 3.2 5 0 3.4 4.9 3.1 0.7 0 3.2 0 1.7 0 0 1.6 2.5
Boulevard of the AlliesEastbound
Boulevard of the AlliesWestbound
Bates StreetNorthbound
Bates StreetSouthbound
Start Time Left Thru RightRt. on
RedApp. Total Left Thru Right
Rt. on
RedApp. Total Left Thru Right
Rt. on
RedApp. Total Left Thru Right Peds App. Total Int. Total
Peak Hour Analysis From 04:00 PM to 06:00 PM - Peak 1 of 1Peak Hour for Entire Intersection Begins at 04:30 PM
04:30 PM 0 345 70 0 415 0 153 14 0 167 52 75 38 0 165 0 38 0 0 38 78504:45 PM 0 367 64 0 431 0 145 19 0 164 49 100 43 0 192 3 54 0 0 57 84405:00 PM 0 284 74 0 358 0 143 29 0 172 63 82 32 0 177 0 60 2 0 62 76905:15 PM 0 322 77 0 399 0 150 22 0 172 58 77 47 0 182 1 60 1 0 62 815Total Volume 0 1318 285 0 1603 0 591 84 0 675 222 334 160 0 716 4 212 3 0 219 3213% App. Total 0 82.2 17.8 0 0 87.6 12.4 0 31 46.6 22.3 0 1.8 96.8 1.4 0
PHF .000 .898 .925 .000 .930 .000 .966 .724 .000 .981 .881 .835 .851 .000 .932 .333 .883 .375 .000 .883 .952Typical Vehicles 1297
% Typical Vehicles 0 98.4 96.5 0 98.1 0 96.1 92.9 0 95.7 95.9 96.7 100 0 97.2 100 98.1 100 0 98.2 97.4Heavy Duty Vehicles
% Heavy Duty Vehicles 0 1.6 3.5 0 1.9 0 3.9 7.1 0 4.3 4.1 3.3 0 0 2.8 0 1.9 0 0 1.8 2.6

File Name : Bates and Blvd Allies_AMSite Code : 17240001Start Date : 11/1/2017Page No : 1
Bates Street and Boulevard of the Allies
Groups Printed- Pedestrians and BicyclesBoulevard of the Allies
EastboundBoulevard of the Allies
WestboundBates StreetNorthbound
Bates StreetSouthbound
Start Time Left Thru Right Peds App. Total Left Thru Right Peds App. Total Left Thru Right Peds App. Total Left Thru Right Peds App. Total Int. Total
06:30 AM 0 0 0 1 1 0 0 0 1 1 0 0 0 0 0 0 1 0 1 2 406:45 AM 0 0 0 1 1 0 1 0 5 6 0 2 0 0 2 0 0 0 4 4 13
Total 0 0 0 2 2 0 1 0 6 7 0 2 0 0 2 0 1 0 5 6 17
07:00 AM 0 0 0 4 4 0 1 0 2 3 0 0 0 1 1 0 0 0 0 0 807:15 AM 0 0 0 3 3 0 1 0 4 5 0 0 0 13 13 0 0 0 1 1 2207:30 AM 0 1 0 3 4 0 1 0 5 6 0 0 0 6 6 0 1 0 3 4 2007:45 AM 0 0 0 2 2 0 4 0 10 14 0 0 0 4 4 0 0 0 2 2 22
Total 0 1 0 12 13 0 7 0 21 28 0 0 0 24 24 0 1 0 6 7 72
08:00 AM 1 0 0 4 5 0 1 0 6 7 0 0 0 5 5 0 2 0 0 2 1908:15 AM 0 1 0 5 6 0 2 1 3 6 0 1 0 2 3 0 1 0 1 2 1708:30 AM 0 0 0 11 11 0 0 0 4 4 0 0 0 12 12 0 0 0 3 3 3008:45 AM 0 0 0 4 4 0 0 0 8 8 0 0 0 3 3 0 1 0 2 3 18
Total 1 1 0 24 26 0 3 1 21 25 0 1 0 22 23 0 4 0 6 10 84
09:00 AM 0 0 0 3 3 0 1 0 10 11 0 0 0 10 10 0 1 0 1 2 2609:15 AM 0 0 0 5 5 0 0 2 12 14 0 0 0 11 11 0 0 0 0 0 30
Grand Total 1 2 0 46 49 0 12 3 70 85 0 3 0 67 70 0 7 0 18 25 229Apprch % 2 4.1 0 93.9 0 14.1 3.5 82.4 0 4.3 0 95.7 0 28 0 72
Total % 0.4 0.9 0 20.1 21.4 0 5.2 1.3 30.6 37.1 0 1.3 0 29.3 30.6 0 3.1 0 7.9 10.9
Boulevard of the AlliesEastbound
Boulevard of the AlliesWestbound
Bates StreetNorthbound
Bates StreetSouthbound
Start Time Left Thru Right Peds App. Total Thru Right Peds App. Total Thru Right Peds App. Total Thru Right Peds App. Total Int. Total
Peak Hour Analysis From 06:30 AM to 09:15 AM - Peak 1 of 1Peak Hour for Entire Intersection Begins at 08:30 AM
08:30 AM 0 0 0 11 11 0 0 0 4 4 0 0 0 12 12 0 0 0 3 3 3008:45 AM 0 0 0 4 4 0 0 0 8 8 0 0 0 3 3 0 1 0 2 3 1809:00 AM 0 0 0 3 3 0 1 0 10 11 0 0 0 10 10 0 1 0 1 2 2609:15 AM 0 0 0 5 5 0 0 2 12 14 0 0 0 11 11 0 0 0 0 0 30Total Volume 0 0 0 23 23 0 1 2 34 37 0 0 0 36 36 0 2 0 6 8 104% App. Total 0 0 0 100 0 2.7 5.4 91.9 0 0 0 100 0 25 0 75
PHF .000 .000 .000 .523 .523 .000 .250 .250 .708 .661 .000 .000 .000 .750 .750 .000 .500 .000 .500 .667 .867
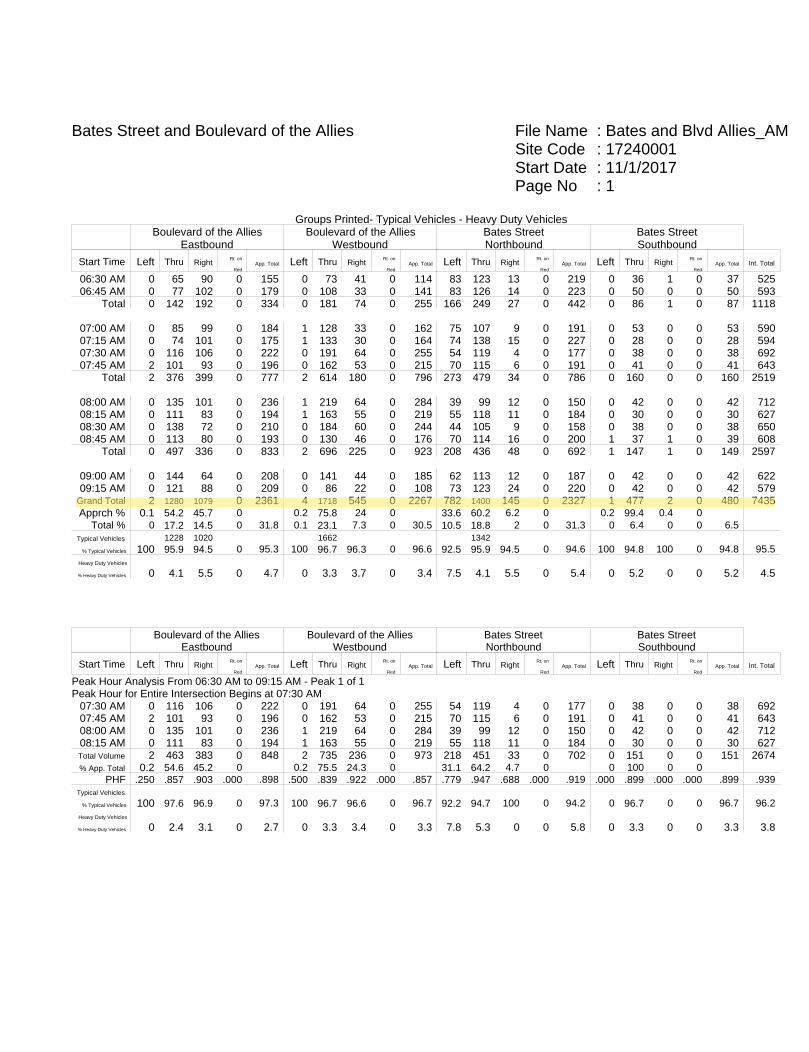
File Name : Bates and Blvd Allies_AMSite Code : 17240001Start Date : 11/1/2017Page No : 1
Bates Street and Boulevard of the Allies
Groups Printed- Typical Vehicles - Heavy Duty VehiclesBoulevard of the Allies
EastboundBoulevard of the Allies
WestboundBates StreetNorthbound
Bates StreetSouthbound
Start Time Left Thru RightRt. on
RedApp. Total Left Thru Right
Rt. on
RedApp. Total Left Thru Right
Rt. on
RedApp. Total Left Thru Right
Rt. on
RedApp. Total Int. Total
06:30 AM 0 65 90 0 155 0 73 41 0 114 83 123 13 0 219 0 36 1 0 37 52506:45 AM 0 77 102 0 179 0 108 33 0 141 83 126 14 0 223 0 50 0 0 50 593
Total 0 142 192 0 334 0 181 74 0 255 166 249 27 0 442 0 86 1 0 87 1118
07:00 AM 0 85 99 0 184 1 128 33 0 162 75 107 9 0 191 0 53 0 0 53 59007:15 AM 0 74 101 0 175 1 133 30 0 164 74 138 15 0 227 0 28 0 0 28 59407:30 AM 0 116 106 0 222 0 191 64 0 255 54 119 4 0 177 0 38 0 0 38 69207:45 AM 2 101 93 0 196 0 162 53 0 215 70 115 6 0 191 0 41 0 0 41 643
Total 2 376 399 0 777 2 614 180 0 796 273 479 34 0 786 0 160 0 0 160 2519
08:00 AM 0 135 101 0 236 1 219 64 0 284 39 99 12 0 150 0 42 0 0 42 71208:15 AM 0 111 83 0 194 1 163 55 0 219 55 118 11 0 184 0 30 0 0 30 62708:30 AM 0 138 72 0 210 0 184 60 0 244 44 105 9 0 158 0 38 0 0 38 65008:45 AM 0 113 80 0 193 0 130 46 0 176 70 114 16 0 200 1 37 1 0 39 608
Total 0 497 336 0 833 2 696 225 0 923 208 436 48 0 692 1 147 1 0 149 2597
09:00 AM 0 144 64 0 208 0 141 44 0 185 62 113 12 0 187 0 42 0 0 42 62209:15 AM 0 121 88 0 209 0 86 22 0 108 73 123 24 0 220 0 42 0 0 42 579
Grand Total 2 1280 1079 0 2361 4 1718 545 0 2267 782 1400 145 0 2327 1 477 2 0 480 7435Apprch % 0.1 54.2 45.7 0 0.2 75.8 24 0 33.6 60.2 6.2 0 0.2 99.4 0.4 0
Total % 0 17.2 14.5 0 31.8 0.1 23.1 7.3 0 30.5 10.5 18.8 2 0 31.3 0 6.4 0 0 6.5Typical Vehicles 1228 1020 1662 1342
% Typical Vehicles 100 95.9 94.5 0 95.3 100 96.7 96.3 0 96.6 92.5 95.9 94.5 0 94.6 100 94.8 100 0 94.8 95.5Heavy Duty Vehicles
% Heavy Duty Vehicles 0 4.1 5.5 0 4.7 0 3.3 3.7 0 3.4 7.5 4.1 5.5 0 5.4 0 5.2 0 0 5.2 4.5
Boulevard of the AlliesEastbound
Boulevard of the AlliesWestbound
Bates StreetNorthbound
Bates StreetSouthbound
Start Time Left Thru RightRt. on
RedApp. Total Left Thru Right
Rt. on
RedApp. Total Left Thru Right
Rt. on
RedApp. Total Left Thru Right
Rt. on
RedApp. Total Int. Total
Peak Hour Analysis From 06:30 AM to 09:15 AM - Peak 1 of 1Peak Hour for Entire Intersection Begins at 07:30 AM
07:30 AM 0 116 106 0 222 0 191 64 0 255 54 119 4 0 177 0 38 0 0 38 69207:45 AM 2 101 93 0 196 0 162 53 0 215 70 115 6 0 191 0 41 0 0 41 64308:00 AM 0 135 101 0 236 1 219 64 0 284 39 99 12 0 150 0 42 0 0 42 71208:15 AM 0 111 83 0 194 1 163 55 0 219 55 118 11 0 184 0 30 0 0 30 627Total Volume 2 463 383 0 848 2 735 236 0 973 218 451 33 0 702 0 151 0 0 151 2674% App. Total 0.2 54.6 45.2 0 0.2 75.5 24.3 0 31.1 64.2 4.7 0 0 100 0 0
PHF .250 .857 .903 .000 .898 .500 .839 .922 .000 .857 .779 .947 .688 .000 .919 .000 .899 .000 .000 .899 .939Typical Vehicles
% Typical Vehicles 100 97.6 96.9 0 97.3 100 96.7 96.6 0 96.7 92.2 94.7 100 0 94.2 0 96.7 0 0 96.7 96.2Heavy Duty Vehicles
% Heavy Duty Vehicles 0 2.4 3.1 0 2.7 0 3.3 3.4 0 3.3 7.8 5.3 0 0 5.8 0 3.3 0 0 3.3 3.8
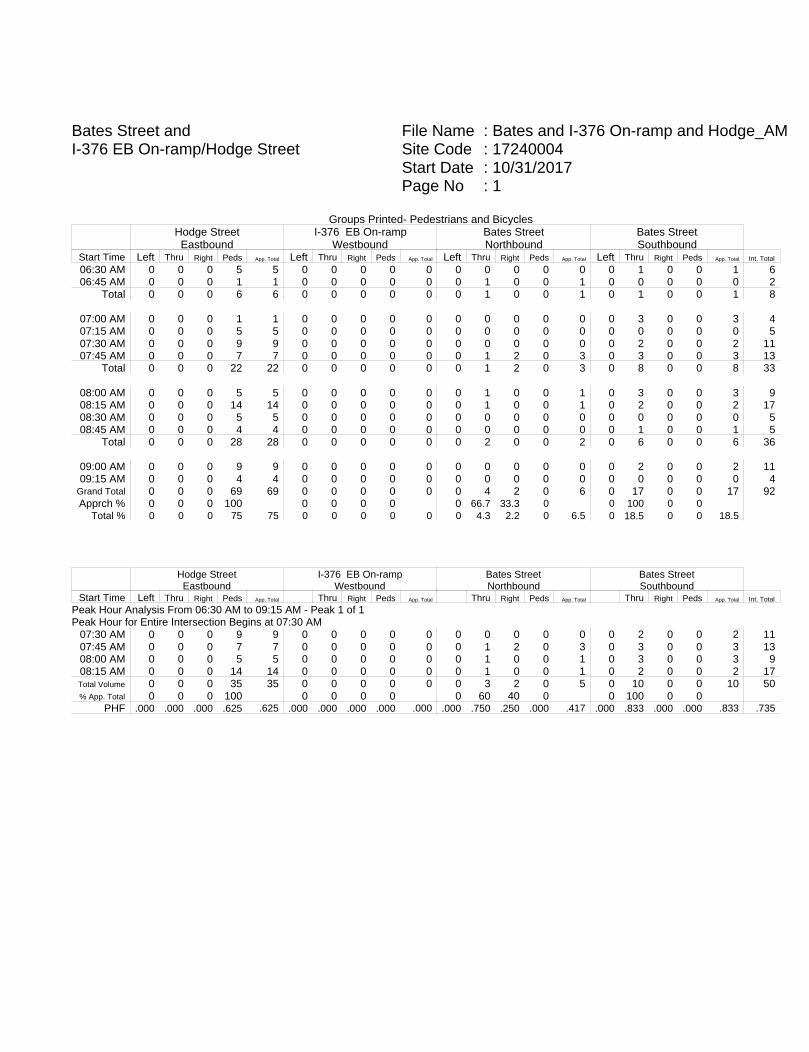
File Name : Bates and I-376 On-ramp and Hodge_AMSite Code : 17240004Start Date : 10/31/2017Page No : 1
Bates Street andI-376 EB On-ramp/Hodge Street
Groups Printed- Pedestrians and BicyclesHodge StreetEastbound
I-376 EB On-rampWestbound
Bates StreetNorthbound
Bates StreetSouthbound
Start Time Left Thru Right Peds App. Total Left Thru Right Peds App. Total Left Thru Right Peds App. Total Left Thru Right Peds App. Total Int. Total
06:30 AM 0 0 0 5 5 0 0 0 0 0 0 0 0 0 0 0 1 0 0 1 606:45 AM 0 0 0 1 1 0 0 0 0 0 0 1 0 0 1 0 0 0 0 0 2
Total 0 0 0 6 6 0 0 0 0 0 0 1 0 0 1 0 1 0 0 1 8
07:00 AM 0 0 0 1 1 0 0 0 0 0 0 0 0 0 0 0 3 0 0 3 407:15 AM 0 0 0 5 5 0 0 0 0 0 0 0 0 0 0 0 0 0 0 0 507:30 AM 0 0 0 9 9 0 0 0 0 0 0 0 0 0 0 0 2 0 0 2 1107:45 AM 0 0 0 7 7 0 0 0 0 0 0 1 2 0 3 0 3 0 0 3 13
Total 0 0 0 22 22 0 0 0 0 0 0 1 2 0 3 0 8 0 0 8 33
08:00 AM 0 0 0 5 5 0 0 0 0 0 0 1 0 0 1 0 3 0 0 3 908:15 AM 0 0 0 14 14 0 0 0 0 0 0 1 0 0 1 0 2 0 0 2 1708:30 AM 0 0 0 5 5 0 0 0 0 0 0 0 0 0 0 0 0 0 0 0 508:45 AM 0 0 0 4 4 0 0 0 0 0 0 0 0 0 0 0 1 0 0 1 5
Total 0 0 0 28 28 0 0 0 0 0 0 2 0 0 2 0 6 0 0 6 36
09:00 AM 0 0 0 9 9 0 0 0 0 0 0 0 0 0 0 0 2 0 0 2 1109:15 AM 0 0 0 4 4 0 0 0 0 0 0 0 0 0 0 0 0 0 0 0 4
Grand Total 0 0 0 69 69 0 0 0 0 0 0 4 2 0 6 0 17 0 0 17 92Apprch % 0 0 0 100 0 0 0 0 0 66.7 33.3 0 0 100 0 0
Total % 0 0 0 75 75 0 0 0 0 0 0 4.3 2.2 0 6.5 0 18.5 0 0 18.5
Hodge StreetEastbound
I-376 EB On-rampWestbound
Bates StreetNorthbound
Bates StreetSouthbound
Start Time Left Thru Right Peds App. Total Thru Right Peds App. Total Thru Right Peds App. Total Thru Right Peds App. Total Int. Total
Peak Hour Analysis From 06:30 AM to 09:15 AM - Peak 1 of 1Peak Hour for Entire Intersection Begins at 07:30 AM
07:30 AM 0 0 0 9 9 0 0 0 0 0 0 0 0 0 0 0 2 0 0 2 1107:45 AM 0 0 0 7 7 0 0 0 0 0 0 1 2 0 3 0 3 0 0 3 1308:00 AM 0 0 0 5 5 0 0 0 0 0 0 1 0 0 1 0 3 0 0 3 908:15 AM 0 0 0 14 14 0 0 0 0 0 0 1 0 0 1 0 2 0 0 2 17Total Volume 0 0 0 35 35 0 0 0 0 0 0 3 2 0 5 0 10 0 0 10 50% App. Total 0 0 0 100 0 0 0 0 0 60 40 0 0 100 0 0
PHF .000 .000 .000 .625 .625 .000 .000 .000 .000 .000 .000 .750 .250 .000 .417 .000 .833 .000 .000 .833 .735

File Name : Bates and I-376 On-ramp and Hodge_AMSite Code : 17240004Start Date : 10/31/2017Page No : 1
Bates Street andI-376 EB On-ramp/Hodge Street
Groups Printed- Typical Vehicles - Heavy Duty VehiclesHodge StreetEastbound
I-376 EB On-rampWestbound
Bates StreetNorthbound
Bates StreetSouthbound
Start Time Left Thru Right App. Total Left Thru Right App. Total Left Thru Right App. Total Left Thru Right App. Total Int. Total
06:30 AM 0 0 2 0 2 0 0 0 0 0 0 120 69 0 189 44 149 0 0 193 38406:45 AM 0 0 0 0 0 0 0 0 0 0 0 112 72 0 184 39 140 1 0 180 364
Total 0 0 2 0 2 0 0 0 0 0 0 232 141 0 373 83 289 1 0 373 748
07:00 AM 2 0 1 0 3 0 0 0 0 0 0 96 68 0 164 71 151 0 0 222 38907:15 AM 0 0 0 0 0 0 0 0 0 0 0 92 82 0 174 57 161 0 0 218 39207:30 AM 0 0 0 0 0 0 0 0 0 0 0 93 80 0 173 69 140 0 0 209 38207:45 AM 1 0 1 0 2 0 0 0 0 0 0 84 74 0 158 52 155 0 0 207 367
Total 3 0 2 0 5 0 0 0 0 0 0 365 304 0 669 249 607 0 0 856 1530
08:00 AM 1 0 0 0 1 0 0 0 0 0 0 90 84 0 174 49 163 0 0 212 38708:15 AM 0 0 0 0 0 0 0 0 0 0 0 78 77 0 155 43 164 1 0 208 36308:30 AM 0 0 0 0 0 0 0 0 0 0 0 82 77 0 159 46 156 1 0 203 36208:45 AM 0 0 0 0 0 0 0 0 0 0 1 81 73 1 156 31 140 0 0 171 327
Total 1 0 0 0 1 0 0 0 0 0 1 331 311 1 644 169 623 2 0 794 1439
09:00 AM 1 0 0 0 1 0 0 0 0 0 0 100 67 0 167 44 153 1 0 198 36609:15 AM 1 0 0 0 1 0 0 0 0 0 0 76 57 0 133 54 154 0 0 208 342
Grand Total 6 0 4 0 10 0 0 0 0 0 1 1104 880 1 1986 599 1826 4 0 2429 4425Apprch % 60 0 40 0 0 0 0 0 0.1 55.6 44.3 0.1 24.7 75.2 0.2 0
Total % 0.1 0 0.1 0 0.2 0 0 0 0 0 0 24.9 19.9 0 44.9 13.5 41.3 0.1 0 54.9Typical Vehicles 1019 1708
% Typical Vehicles 100 0 100 0 100 0 0 0 0 0 100 92.3 85.5 0 89.2 94 93.5 100 0 93.7 91.7Heavy Duty Vehicles
% Heavy Duty Vehicles 0 0 0 0 0 0 0 0 0 0 0 7.7 14.5 100 10.8 6 6.5 0 0 6.3 8.3
Hodge StreetEastbound
I-376 EB On-rampWestbound
Bates StreetNorthbound
Bates StreetSouthbound
Start Time Left Thru Right App. Total Thru Right App. Total Thru Right App. Total Thru Right App. Total Int. Total
Peak Hour Analysis From 06:30 AM to 09:15 AM - Peak 1 of 1Peak Hour for Entire Intersection Begins at 07:00 AM
07:00 AM 2 0 1 0 3 0 0 0 0 0 0 96 68 0 164 71 151 0 0 222 38907:15 AM 0 0 0 0 0 0 0 0 0 0 0 92 82 0 174 57 161 0 0 218 39207:30 AM 0 0 0 0 0 0 0 0 0 0 0 93 80 0 173 69 140 0 0 209 38207:45 AM 1 0 1 0 2 0 0 0 0 0 0 84 74 0 158 52 155 0 0 207 367Total Volume 3 0 2 0 5 0 0 0 0 0 0 365 304 0 669 249 607 0 0 856 1530% App. Total 60 0 40 0 0 0 0 0 0 54.6 45.4 0 29.1 70.9 0 0
PHF .375 .000 .500 .000 .417 .000 .000 .000 .000 .000 .000 .951 .927 .000 .961 .877 .943 .000 .000 .964 .976Typical Vehicles
% Typical Vehicles 100 0 100 0 100 0 0 0 0 0 0 91.2 86.5 0 89.1 97.2 95.6 0 0 96.0 93.0Heavy Duty Vehicles
% Heavy Duty Vehicles 0 0 0 0 0 0 0 0 0 0 0 8.8 13.5 0 10.9 2.8 4.4 0 0 4.0 7.0
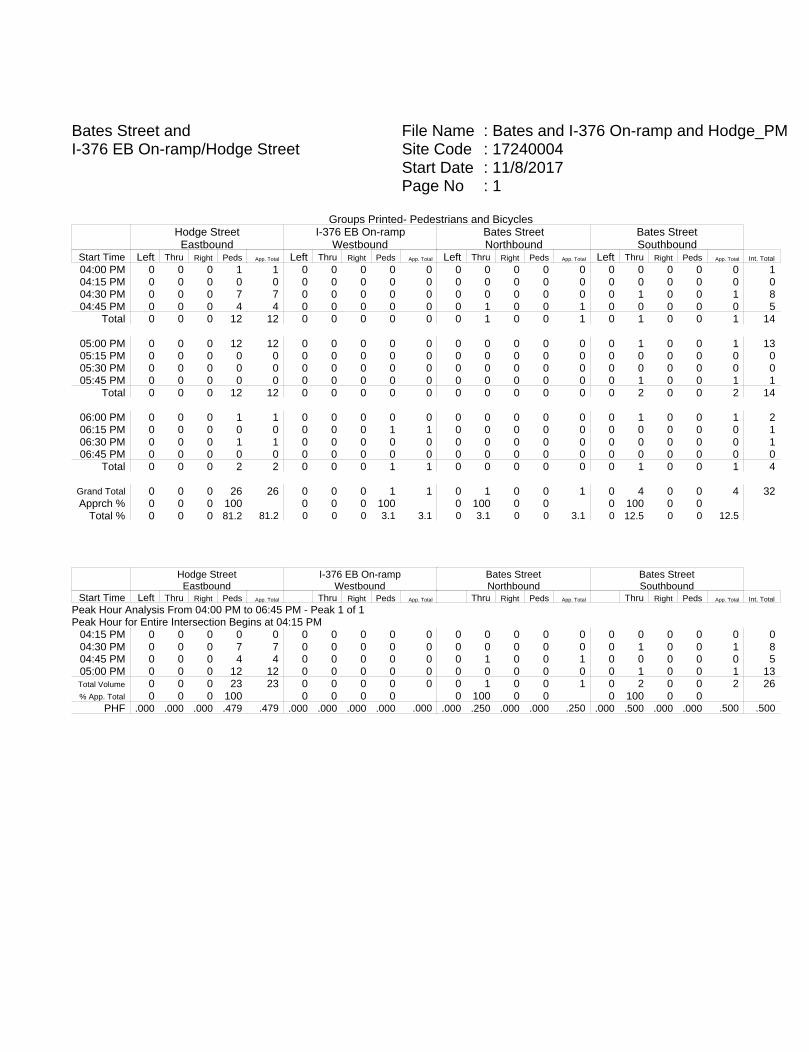
File Name : Bates and I-376 On-ramp and Hodge_PMSite Code : 17240004Start Date : 11/8/2017Page No : 1
Bates Street andI-376 EB On-ramp/Hodge Street
Groups Printed- Pedestrians and BicyclesHodge StreetEastbound
I-376 EB On-rampWestbound
Bates StreetNorthbound
Bates StreetSouthbound
Start Time Left Thru Right Peds App. Total Left Thru Right Peds App. Total Left Thru Right Peds App. Total Left Thru Right Peds App. Total Int. Total
04:00 PM 0 0 0 1 1 0 0 0 0 0 0 0 0 0 0 0 0 0 0 0 104:15 PM 0 0 0 0 0 0 0 0 0 0 0 0 0 0 0 0 0 0 0 0 004:30 PM 0 0 0 7 7 0 0 0 0 0 0 0 0 0 0 0 1 0 0 1 804:45 PM 0 0 0 4 4 0 0 0 0 0 0 1 0 0 1 0 0 0 0 0 5
Total 0 0 0 12 12 0 0 0 0 0 0 1 0 0 1 0 1 0 0 1 14
05:00 PM 0 0 0 12 12 0 0 0 0 0 0 0 0 0 0 0 1 0 0 1 1305:15 PM 0 0 0 0 0 0 0 0 0 0 0 0 0 0 0 0 0 0 0 0 005:30 PM 0 0 0 0 0 0 0 0 0 0 0 0 0 0 0 0 0 0 0 0 005:45 PM 0 0 0 0 0 0 0 0 0 0 0 0 0 0 0 0 1 0 0 1 1
Total 0 0 0 12 12 0 0 0 0 0 0 0 0 0 0 0 2 0 0 2 14
06:00 PM 0 0 0 1 1 0 0 0 0 0 0 0 0 0 0 0 1 0 0 1 206:15 PM 0 0 0 0 0 0 0 0 1 1 0 0 0 0 0 0 0 0 0 0 106:30 PM 0 0 0 1 1 0 0 0 0 0 0 0 0 0 0 0 0 0 0 0 106:45 PM 0 0 0 0 0 0 0 0 0 0 0 0 0 0 0 0 0 0 0 0 0
Total 0 0 0 2 2 0 0 0 1 1 0 0 0 0 0 0 1 0 0 1 4
Grand Total 0 0 0 26 26 0 0 0 1 1 0 1 0 0 1 0 4 0 0 4 32Apprch % 0 0 0 100 0 0 0 100 0 100 0 0 0 100 0 0
Total % 0 0 0 81.2 81.2 0 0 0 3.1 3.1 0 3.1 0 0 3.1 0 12.5 0 0 12.5
Hodge StreetEastbound
I-376 EB On-rampWestbound
Bates StreetNorthbound
Bates StreetSouthbound
Start Time Left Thru Right Peds App. Total Thru Right Peds App. Total Thru Right Peds App. Total Thru Right Peds App. Total Int. Total
Peak Hour Analysis From 04:00 PM to 06:45 PM - Peak 1 of 1Peak Hour for Entire Intersection Begins at 04:15 PM
04:15 PM 0 0 0 0 0 0 0 0 0 0 0 0 0 0 0 0 0 0 0 0 004:30 PM 0 0 0 7 7 0 0 0 0 0 0 0 0 0 0 0 1 0 0 1 804:45 PM 0 0 0 4 4 0 0 0 0 0 0 1 0 0 1 0 0 0 0 0 505:00 PM 0 0 0 12 12 0 0 0 0 0 0 0 0 0 0 0 1 0 0 1 13Total Volume 0 0 0 23 23 0 0 0 0 0 0 1 0 0 1 0 2 0 0 2 26% App. Total 0 0 0 100 0 0 0 0 0 100 0 0 0 100 0 0
PHF .000 .000 .000 .479 .479 .000 .000 .000 .000 .000 .000 .250 .000 .000 .250 .000 .500 .000 .000 .500 .500
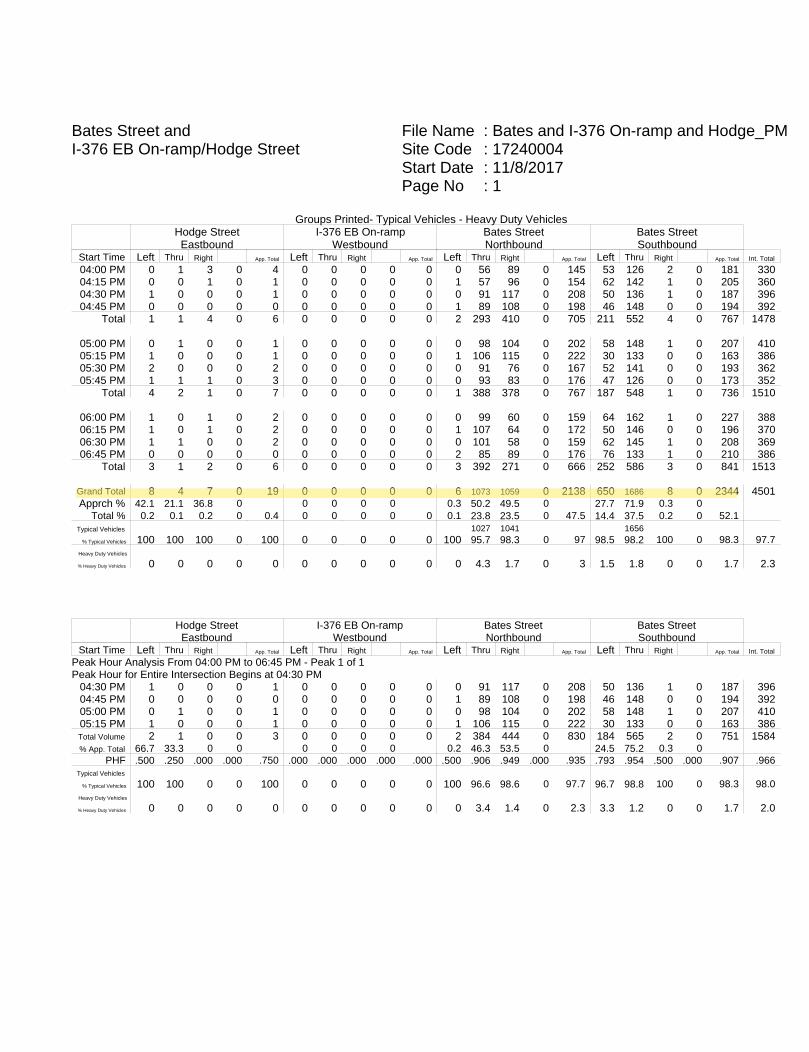
File Name : Bates and I-376 On-ramp and Hodge_PMSite Code : 17240004Start Date : 11/8/2017Page No : 1
Bates Street andI-376 EB On-ramp/Hodge Street
Groups Printed- Typical Vehicles - Heavy Duty VehiclesHodge StreetEastbound
I-376 EB On-rampWestbound
Bates StreetNorthbound
Bates StreetSouthbound
Start Time Left Thru Right App. Total Left Thru Right App. Total Left Thru Right App. Total Left Thru Right App. Total Int. Total
04:00 PM 0 1 3 0 4 0 0 0 0 0 0 56 89 0 145 53 126 2 0 181 33004:15 PM 0 0 1 0 1 0 0 0 0 0 1 57 96 0 154 62 142 1 0 205 36004:30 PM 1 0 0 0 1 0 0 0 0 0 0 91 117 0 208 50 136 1 0 187 39604:45 PM 0 0 0 0 0 0 0 0 0 0 1 89 108 0 198 46 148 0 0 194 392
Total 1 1 4 0 6 0 0 0 0 0 2 293 410 0 705 211 552 4 0 767 1478
05:00 PM 0 1 0 0 1 0 0 0 0 0 0 98 104 0 202 58 148 1 0 207 41005:15 PM 1 0 0 0 1 0 0 0 0 0 1 106 115 0 222 30 133 0 0 163 38605:30 PM 2 0 0 0 2 0 0 0 0 0 0 91 76 0 167 52 141 0 0 193 36205:45 PM 1 1 1 0 3 0 0 0 0 0 0 93 83 0 176 47 126 0 0 173 352
Total 4 2 1 0 7 0 0 0 0 0 1 388 378 0 767 187 548 1 0 736 1510
06:00 PM 1 0 1 0 2 0 0 0 0 0 0 99 60 0 159 64 162 1 0 227 38806:15 PM 1 0 1 0 2 0 0 0 0 0 1 107 64 0 172 50 146 0 0 196 37006:30 PM 1 1 0 0 2 0 0 0 0 0 0 101 58 0 159 62 145 1 0 208 36906:45 PM 0 0 0 0 0 0 0 0 0 0 2 85 89 0 176 76 133 1 0 210 386
Total 3 1 2 0 6 0 0 0 0 0 3 392 271 0 666 252 586 3 0 841 1513
Grand Total 8 4 7 0 19 0 0 0 0 0 6 1073 1059 0 2138 650 1686 8 0 2344 4501Apprch % 42.1 21.1 36.8 0 0 0 0 0 0.3 50.2 49.5 0 27.7 71.9 0.3 0
Total % 0.2 0.1 0.2 0 0.4 0 0 0 0 0 0.1 23.8 23.5 0 47.5 14.4 37.5 0.2 0 52.1Typical Vehicles 1027 1041 1656
% Typical Vehicles 100 100 100 0 100 0 0 0 0 0 100 95.7 98.3 0 97 98.5 98.2 100 0 98.3 97.7Heavy Duty Vehicles
% Heavy Duty Vehicles 0 0 0 0 0 0 0 0 0 0 0 4.3 1.7 0 3 1.5 1.8 0 0 1.7 2.3
Hodge StreetEastbound
I-376 EB On-rampWestbound
Bates StreetNorthbound
Bates StreetSouthbound
Start Time Left Thru Right App. Total Left Thru Right App. Total Left Thru Right App. Total Left Thru Right App. Total Int. Total
Peak Hour Analysis From 04:00 PM to 06:45 PM - Peak 1 of 1Peak Hour for Entire Intersection Begins at 04:30 PM
04:30 PM 1 0 0 0 1 0 0 0 0 0 0 91 117 0 208 50 136 1 0 187 39604:45 PM 0 0 0 0 0 0 0 0 0 0 1 89 108 0 198 46 148 0 0 194 39205:00 PM 0 1 0 0 1 0 0 0 0 0 0 98 104 0 202 58 148 1 0 207 41005:15 PM 1 0 0 0 1 0 0 0 0 0 1 106 115 0 222 30 133 0 0 163 386Total Volume 2 1 0 0 3 0 0 0 0 0 2 384 444 0 830 184 565 2 0 751 1584% App. Total 66.7 33.3 0 0 0 0 0 0 0.2 46.3 53.5 0 24.5 75.2 0.3 0
PHF .500 .250 .000 .000 .750 .000 .000 .000 .000 .000 .500 .906 .949 .000 .935 .793 .954 .500 .000 .907 .966Typical Vehicles
% Typical Vehicles 100 100 0 0 100 0 0 0 0 0 100 96.6 98.6 0 97.7 96.7 98.8 100 0 98.3 98.0Heavy Duty Vehicles
% Heavy Duty Vehicles 0 0 0 0 0 0 0 0 0 0 0 3.4 1.4 0 2.3 3.3 1.2 0 0 1.7 2.0

File Name : E. Carson & Hot Metal_AMSite Code : 17240018Start Date : 11/8/2017Page No : 1
E. Carson Street and Hot Metal Street
Groups Printed- Pedestrians and BicyclesE. Carson Street
EastboundE. Carson Street
Westbound NorthboundHot Metal Street
SouthboundStart Time Left Thru Right Peds App. Total Left Thru Right Peds App. Total Left Thru Right Peds App. Total Left Thru Right Peds App. Total Int. Total
06:30 AM 0 1 0 10 11 0 0 0 0 0 0 0 0 0 0 0 0 0 1 1 1206:45 AM 0 0 0 19 19 0 0 0 4 4 0 1 0 0 1 0 0 0 2 2 26
Total 0 1 0 29 30 0 0 0 4 4 0 1 0 0 1 0 0 0 3 3 38
07:00 AM 0 0 0 12 12 0 0 0 2 2 0 0 0 0 0 0 0 0 1 1 1507:15 AM 0 0 0 15 15 0 1 0 1 2 0 0 0 0 0 0 0 0 0 0 1707:30 AM 0 0 0 23 23 0 0 0 4 4 0 0 0 0 0 0 0 0 6 6 3307:45 AM 0 0 0 22 22 0 0 0 2 2 0 0 0 0 0 0 0 0 6 6 30
Total 0 0 0 72 72 0 1 0 9 10 0 0 0 0 0 0 0 0 13 13 95
08:00 AM 0 0 0 13 13 0 0 0 7 7 0 0 0 0 0 0 0 0 4 4 2408:15 AM 0 0 0 7 7 0 0 0 1 1 0 0 0 0 0 0 0 0 1 1 908:30 AM 0 0 0 10 10 0 0 0 0 0 0 0 0 0 0 0 0 0 1 1 1108:45 AM 0 0 0 6 6 0 1 0 2 3 0 0 0 0 0 0 0 0 5 5 14
Total 0 0 0 36 36 0 1 0 10 11 0 0 0 0 0 0 0 0 11 11 58
09:00 AM 0 0 0 1 1 0 0 0 0 0 0 0 0 0 0 0 0 0 2 2 309:15 AM 0 0 0 5 5 0 0 0 5 5 0 0 0 0 0 0 0 0 1 1 11
Grand Total 0 1 0 143 144 0 2 0 28 30 0 1 0 0 1 0 0 0 30 30 205Apprch % 0 0.7 0 99.3 0 6.7 0 93.3 0 100 0 0 0 0 0 100
Total % 0 0.5 0 69.8 70.2 0 1 0 13.7 14.6 0 0.5 0 0 0.5 0 0 0 14.6 14.6
E. Carson StreetEastbound
E. Carson StreetWestbound Northbound
Hot Metal StreetSouthbound
Start Time Left Thru Right Peds App. Total Thru Right Peds App. Total Thru Right Peds App. Total Thru Right Peds App. Total Int. Total
Peak Hour Analysis From 06:30 AM to 09:15 AM - Peak 1 of 1Peak Hour for Entire Intersection Begins at 07:15 AM
07:15 AM 0 0 0 15 15 0 1 0 1 2 0 0 0 0 0 0 0 0 0 0 1707:30 AM 0 0 0 23 23 0 0 0 4 4 0 0 0 0 0 0 0 0 6 6 3307:45 AM 0 0 0 22 22 0 0 0 2 2 0 0 0 0 0 0 0 0 6 6 3008:00 AM 0 0 0 13 13 0 0 0 7 7 0 0 0 0 0 0 0 0 4 4 24Total Volume 0 0 0 73 73 0 1 0 14 15 0 0 0 0 0 0 0 0 16 16 104% App. Total 0 0 0 100 0 6.7 0 93.3 0 0 0 0 0 0 0 100
PHF .000 .000 .000 .793 .793 .000 .250 .000 .500 .536 .000 .000 .000 .000 .000 .000 .000 .000 .667 .667 .788

File Name : E. Carson & Hot Metal_AMSite Code : 17240018Start Date : 11/8/2017Page No : 1
E. Carson Street and Hot Metal Street
Groups Printed- Typical Vehicles - Heavy Duty VehiclesE. Carson Street
EastboundE. Carson Street
Westbound NorthboundHot Metal Street
Southbound
Start Time Left Thru RightRt. on
RedApp. Total Left Thru Right
Rt. on
RedApp. Total Left Thru Right
Rt. on
RedApp. Total Left Thru Right
Rt. on
RedApp. Total Int. Total
06:30 AM 18 61 0 0 79 0 180 94 0 274 0 0 0 0 0 41 1 16 0 58 41106:45 AM 26 55 0 0 81 0 198 69 0 267 0 0 0 0 0 43 0 17 0 60 408
Total 44 116 0 0 160 0 378 163 0 541 0 0 0 0 0 84 1 33 0 118 819
07:00 AM 21 63 0 0 84 0 193 70 0 263 0 0 0 0 0 47 0 24 0 71 41807:15 AM 42 67 0 0 109 0 161 64 0 225 0 0 0 0 0 42 0 15 0 57 39107:30 AM 27 82 0 0 109 0 158 57 0 215 0 0 0 0 0 46 0 24 0 70 39407:45 AM 17 66 0 0 83 0 148 43 0 191 0 0 0 0 0 36 0 21 0 57 331
Total 107 278 0 0 385 0 660 234 0 894 0 0 0 0 0 171 0 84 0 255 1534
08:00 AM 28 69 0 0 97 0 161 58 0 219 0 0 0 0 0 27 0 18 0 45 36108:15 AM 24 63 0 0 87 0 171 40 0 211 0 0 0 0 0 25 0 22 0 47 34508:30 AM 32 64 0 0 96 0 167 71 0 238 0 0 0 0 0 36 0 25 0 61 39508:45 AM 16 63 0 0 79 0 151 62 0 213 0 0 0 0 0 32 0 22 0 54 346
Total 100 259 0 0 359 0 650 231 0 881 0 0 0 0 0 120 0 87 0 207 1447
09:00 AM 27 58 0 0 85 0 123 59 0 182 0 0 0 0 0 33 0 30 0 63 33009:15 AM 34 66 0 0 100 0 133 51 0 184 0 0 0 0 0 43 0 35 0 78 362
Grand Total 312 777 0 0 1089 0 1944 738 0 2682 0 0 0 0 0 451 1 269 0 721 4492Apprch % 28.7 71.3 0 0 0 72.5 27.5 0 0 0 0 0 62.6 0.1 37.3 0
Total % 6.9 17.3 0 0 24.2 0 43.3 16.4 0 59.7 0 0 0 0 0 10 0 6 0 16.1Typical Vehicles 1784
% Typical Vehicles 92.3 85.7 0 0 87.6 0 91.8 92.1 0 91.9 0 0 0 0 0 88.2 100 96.3 0 91.3 90.7Heavy Duty Vehicles
% Heavy Duty Vehicles 7.7 14.3 0 0 12.4 0 8.2 7.9 0 8.1 0 0 0 0 0 11.8 0 3.7 0 8.7 9.3
E. Carson StreetEastbound
E. Carson StreetWestbound Northbound
Hot Metal StreetSouthbound
Start Time Left Thru RightRt. on
RedApp. Total Left Thru Right
Rt. on
RedApp. Total Left Thru Right
Rt. on
RedApp. Total Left Thru Right
Rt. on
RedApp. Total Int. Total
Peak Hour Analysis From 06:30 AM to 09:15 AM - Peak 1 of 1Peak Hour for Entire Intersection Begins at 06:30 AM
06:30 AM 18 61 0 0 79 0 180 94 0 274 0 0 0 0 0 41 1 16 0 58 41106:45 AM 26 55 0 0 81 0 198 69 0 267 0 0 0 0 0 43 0 17 0 60 40807:00 AM 21 63 0 0 84 0 193 70 0 263 0 0 0 0 0 47 0 24 0 71 41807:15 AM 42 67 0 0 109 0 161 64 0 225 0 0 0 0 0 42 0 15 0 57 391Total Volume 107 246 0 0 353 0 732 297 0 1029 0 0 0 0 0 173 1 72 0 246 1628% App. Total 30.3 69.7 0 0 0 71.1 28.9 0 0 0 0 0 70.3 0.4 29.3 0
PHF .637 .918 .000 .000 .810 .000 .924 .790 .000 .939 .000 .000 .000 .000 .000 .920 .250 .750 .000 .866 .974Typical Vehicles
% Typical Vehicles 91.6 89.8 0 0 90.4 0 94.0 96.6 0 94.8 0 0 0 0 0 89.0 100 98.6 0 91.9 93.4Heavy Duty Vehicles
% Heavy Duty Vehicles 8.4 10.2 0 0 9.6 0 6.0 3.4 0 5.2 0 0 0 0 0 11.0 0 1.4 0 8.1 6.6
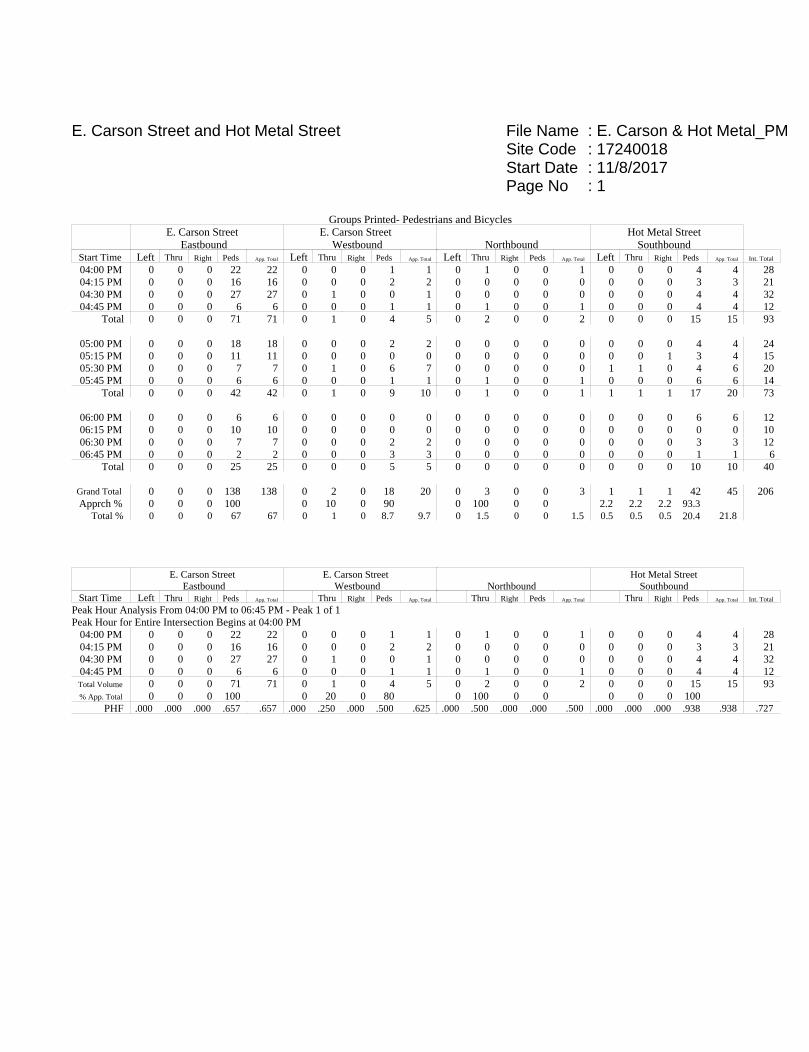
File Name : E. Carson & Hot Metal_PMSite Code : 17240018Start Date : 11/8/2017Page No : 1
E. Carson Street and Hot Metal Street
Groups Printed- Pedestrians and BicyclesE. Carson Street
EastboundE. Carson Street
Westbound NorthboundHot Metal Street
SouthboundStart Time Left Thru Right Peds App. Total Left Thru Right Peds App. Total Left Thru Right Peds App. Total Left Thru Right Peds App. Total Int. Total
04:00 PM 0 0 0 22 22 0 0 0 1 1 0 1 0 0 1 0 0 0 4 4 2804:15 PM 0 0 0 16 16 0 0 0 2 2 0 0 0 0 0 0 0 0 3 3 2104:30 PM 0 0 0 27 27 0 1 0 0 1 0 0 0 0 0 0 0 0 4 4 3204:45 PM 0 0 0 6 6 0 0 0 1 1 0 1 0 0 1 0 0 0 4 4 12
Total 0 0 0 71 71 0 1 0 4 5 0 2 0 0 2 0 0 0 15 15 93
05:00 PM 0 0 0 18 18 0 0 0 2 2 0 0 0 0 0 0 0 0 4 4 2405:15 PM 0 0 0 11 11 0 0 0 0 0 0 0 0 0 0 0 0 1 3 4 1505:30 PM 0 0 0 7 7 0 1 0 6 7 0 0 0 0 0 1 1 0 4 6 2005:45 PM 0 0 0 6 6 0 0 0 1 1 0 1 0 0 1 0 0 0 6 6 14
Total 0 0 0 42 42 0 1 0 9 10 0 1 0 0 1 1 1 1 17 20 73
06:00 PM 0 0 0 6 6 0 0 0 0 0 0 0 0 0 0 0 0 0 6 6 1206:15 PM 0 0 0 10 10 0 0 0 0 0 0 0 0 0 0 0 0 0 0 0 1006:30 PM 0 0 0 7 7 0 0 0 2 2 0 0 0 0 0 0 0 0 3 3 1206:45 PM 0 0 0 2 2 0 0 0 3 3 0 0 0 0 0 0 0 0 1 1 6
Total 0 0 0 25 25 0 0 0 5 5 0 0 0 0 0 0 0 0 10 10 40
Grand Total 0 0 0 138 138 0 2 0 18 20 0 3 0 0 3 1 1 1 42 45 206Apprch % 0 0 0 100 0 10 0 90 0 100 0 0 2.2 2.2 2.2 93.3
Total % 0 0 0 67 67 0 1 0 8.7 9.7 0 1.5 0 0 1.5 0.5 0.5 0.5 20.4 21.8
E. Carson StreetEastbound
E. Carson StreetWestbound Northbound
Hot Metal StreetSouthbound
Start Time Left Thru Right Peds App. Total Thru Right Peds App. Total Thru Right Peds App. Total Thru Right Peds App. Total Int. Total
Peak Hour Analysis From 04:00 PM to 06:45 PM - Peak 1 of 1Peak Hour for Entire Intersection Begins at 04:00 PM
04:00 PM 0 0 0 22 22 0 0 0 1 1 0 1 0 0 1 0 0 0 4 4 2804:15 PM 0 0 0 16 16 0 0 0 2 2 0 0 0 0 0 0 0 0 3 3 2104:30 PM 0 0 0 27 27 0 1 0 0 1 0 0 0 0 0 0 0 0 4 4 3204:45 PM 0 0 0 6 6 0 0 0 1 1 0 1 0 0 1 0 0 0 4 4 12Total Volume 0 0 0 71 71 0 1 0 4 5 0 2 0 0 2 0 0 0 15 15 93% App. Total 0 0 0 100 0 20 0 80 0 100 0 0 0 0 0 100
PHF .000 .000 .000 .657 .657 .000 .250 .000 .500 .625 .000 .500 .000 .000 .500 .000 .000 .000 .938 .938 .727
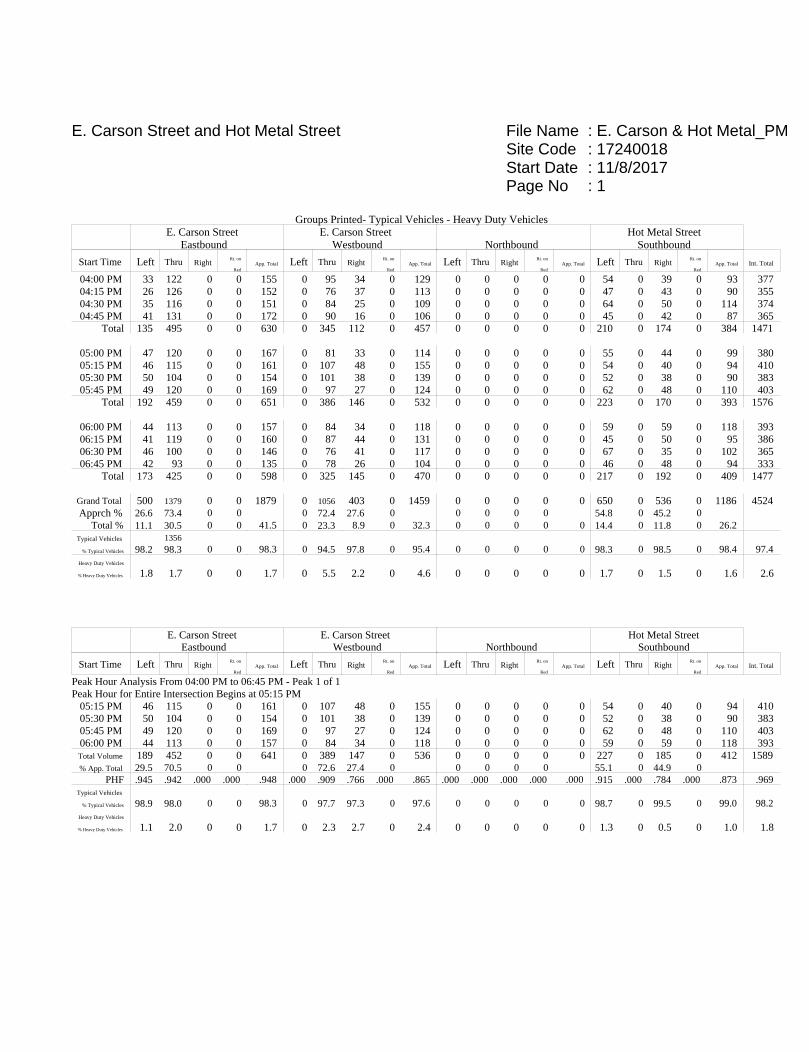
File Name : E. Carson & Hot Metal_PMSite Code : 17240018Start Date : 11/8/2017Page No : 1
E. Carson Street and Hot Metal Street
Groups Printed- Typical Vehicles - Heavy Duty VehiclesE. Carson Street
EastboundE. Carson Street
Westbound NorthboundHot Metal Street
Southbound
Start Time Left Thru RightRt. on
RedApp. Total Left Thru Right
Rt. on
RedApp. Total Left Thru Right
Rt. on
RedApp. Total Left Thru Right
Rt. on
RedApp. Total Int. Total
04:00 PM 33 122 0 0 155 0 95 34 0 129 0 0 0 0 0 54 0 39 0 93 37704:15 PM 26 126 0 0 152 0 76 37 0 113 0 0 0 0 0 47 0 43 0 90 35504:30 PM 35 116 0 0 151 0 84 25 0 109 0 0 0 0 0 64 0 50 0 114 37404:45 PM 41 131 0 0 172 0 90 16 0 106 0 0 0 0 0 45 0 42 0 87 365
Total 135 495 0 0 630 0 345 112 0 457 0 0 0 0 0 210 0 174 0 384 1471
05:00 PM 47 120 0 0 167 0 81 33 0 114 0 0 0 0 0 55 0 44 0 99 38005:15 PM 46 115 0 0 161 0 107 48 0 155 0 0 0 0 0 54 0 40 0 94 41005:30 PM 50 104 0 0 154 0 101 38 0 139 0 0 0 0 0 52 0 38 0 90 38305:45 PM 49 120 0 0 169 0 97 27 0 124 0 0 0 0 0 62 0 48 0 110 403
Total 192 459 0 0 651 0 386 146 0 532 0 0 0 0 0 223 0 170 0 393 1576
06:00 PM 44 113 0 0 157 0 84 34 0 118 0 0 0 0 0 59 0 59 0 118 39306:15 PM 41 119 0 0 160 0 87 44 0 131 0 0 0 0 0 45 0 50 0 95 38606:30 PM 46 100 0 0 146 0 76 41 0 117 0 0 0 0 0 67 0 35 0 102 36506:45 PM 42 93 0 0 135 0 78 26 0 104 0 0 0 0 0 46 0 48 0 94 333
Total 173 425 0 0 598 0 325 145 0 470 0 0 0 0 0 217 0 192 0 409 1477
Grand Total 500 1379 0 0 1879 0 1056 403 0 1459 0 0 0 0 0 650 0 536 0 1186 4524Apprch % 26.6 73.4 0 0 0 72.4 27.6 0 0 0 0 0 54.8 0 45.2 0
Total % 11.1 30.5 0 0 41.5 0 23.3 8.9 0 32.3 0 0 0 0 0 14.4 0 11.8 0 26.2Typical Vehicles 1356
% Typical Vehicles 98.2 98.3 0 0 98.3 0 94.5 97.8 0 95.4 0 0 0 0 0 98.3 0 98.5 0 98.4 97.4Heavy Duty Vehicles
% Heavy Duty Vehicles 1.8 1.7 0 0 1.7 0 5.5 2.2 0 4.6 0 0 0 0 0 1.7 0 1.5 0 1.6 2.6
E. Carson StreetEastbound
E. Carson StreetWestbound Northbound
Hot Metal StreetSouthbound
Start Time Left Thru RightRt. on
RedApp. Total Left Thru Right
Rt. on
RedApp. Total Left Thru Right
Rt. on
RedApp. Total Left Thru Right
Rt. on
RedApp. Total Int. Total
Peak Hour Analysis From 04:00 PM to 06:45 PM - Peak 1 of 1Peak Hour for Entire Intersection Begins at 05:15 PM
05:15 PM 46 115 0 0 161 0 107 48 0 155 0 0 0 0 0 54 0 40 0 94 41005:30 PM 50 104 0 0 154 0 101 38 0 139 0 0 0 0 0 52 0 38 0 90 38305:45 PM 49 120 0 0 169 0 97 27 0 124 0 0 0 0 0 62 0 48 0 110 40306:00 PM 44 113 0 0 157 0 84 34 0 118 0 0 0 0 0 59 0 59 0 118 393Total Volume 189 452 0 0 641 0 389 147 0 536 0 0 0 0 0 227 0 185 0 412 1589% App. Total 29.5 70.5 0 0 0 72.6 27.4 0 0 0 0 0 55.1 0 44.9 0
PHF .945 .942 .000 .000 .948 .000 .909 .766 .000 .865 .000 .000 .000 .000 .000 .915 .000 .784 .000 .873 .969Typical Vehicles
% Typical Vehicles 98.9 98.0 0 0 98.3 0 97.7 97.3 0 97.6 0 0 0 0 0 98.7 0 99.5 0 99.0 98.2Heavy Duty Vehicles
% Heavy Duty Vehicles 1.1 2.0 0 0 1.7 0 2.3 2.7 0 2.4 0 0 0 0 0 1.3 0 0.5 0 1.0 1.8

Whitman, Requardt, and Associates, LLP2009 MacKenzie Way
Suite 240Cranberry Twp, Pennsylvania, United States 16066
724-779-7940 [email protected] Focused - Project Driven
Count Name: Greenfield Ave and FrazierSt/Swinburne StSite Code:Start Date: 11/14/2018Page No: 1
Turning Movement Data
Start Time
Greenfield Ave Greenfield Ave Frazier St/Swinburne St Sylvan Ave
Westbound Eastbound Southbound Northbound
Left Thru Right Peds App. Total Left Thru Right Peds App. Total Left Thru Right Peds App. Total Left Thru Right Peds App. Total Int. Total
7:00 AM 0 45 4 0 49 93 51 0 0 144 4 0 37 1 41 1 0 0 0 1 235
7:15 AM 0 67 3 0 70 113 42 1 0 156 3 0 35 0 38 0 0 0 0 0 264
7:30 AM 0 72 6 0 78 116 55 0 0 171 4 0 39 1 43 0 0 0 0 0 292
7:45 AM 0 64 11 0 75 110 69 0 0 179 5 0 31 1 36 0 0 1 1 1 291
Hourly Total 0 248 24 0 272 432 217 1 0 650 16 0 142 3 158 1 0 1 1 2 1082
8:00 AM 0 70 10 0 80 95 55 0 0 150 6 0 30 0 36 0 0 0 0 0 266
8:15 AM 0 59 5 0 64 75 43 0 0 118 3 1 26 1 30 0 0 0 0 0 212
8:30 AM 0 55 6 1 61 77 29 0 0 106 2 0 44 3 46 0 0 0 1 0 213
8:45 AM 0 60 7 0 67 69 42 0 0 111 2 1 35 0 38 1 0 1 0 2 218
Hourly Total 0 244 28 1 272 316 169 0 0 485 13 2 135 4 150 1 0 1 1 2 909
9:00 AM 0 1 1 0 2 0 0 0 0 0 0 0 0 1 0 0 0 0 0 0 2
*** BREAK *** - - - - - - - - - - - - - - - - - - - - -
Hourly Total 0 1 1 0 2 0 0 0 0 0 0 0 0 1 0 0 0 0 0 0 2
3:00 PM 0 34 7 1 41 24 104 0 0 128 10 1 75 1 86 0 0 0 1 0 255
3:15 PM 1 39 6 0 46 23 134 1 0 158 9 1 66 0 76 0 0 1 0 1 281
3:30 PM 1 40 4 0 45 22 140 0 0 162 16 0 73 1 89 1 0 0 0 1 297
3:45 PM 0 50 5 0 55 32 173 0 0 205 17 1 94 0 112 0 0 0 0 0 372
Hourly Total 2 163 22 1 187 101 551 1 0 653 52 3 308 2 363 1 0 1 1 2 1205
4:00 PM 1 47 11 0 59 27 170 1 0 198 19 3 77 2 99 0 0 1 0 1 357
4:15 PM 0 49 6 0 55 29 183 0 0 212 16 1 60 1 77 0 0 0 0 0 344
4:30 PM 2 29 7 0 38 39 164 1 0 204 24 6 73 4 103 0 1 0 0 1 346
4:45 PM 1 35 4 0 40 33 182 2 0 217 21 7 77 3 105 0 0 0 0 0 362
Hourly Total 4 160 28 0 192 128 699 4 0 831 80 17 287 10 384 0 1 1 0 2 1409
5:00 PM 0 46 4 0 50 40 183 3 0 226 24 4 43 5 71 0 0 0 0 0 347
5:15 PM 0 44 13 0 57 37 182 4 0 223 7 1 68 3 76 0 0 1 0 1 357
5:30 PM 1 35 4 0 40 47 157 1 0 205 17 0 46 3 63 0 0 0 0 0 308
5:45 PM 0 42 2 0 44 48 173 1 0 222 18 0 48 3 66 0 0 0 0 0 332
Hourly Total 1 167 23 0 191 172 695 9 0 876 66 5 205 14 276 0 0 1 0 1 1344
6:00 PM 0 43 8 0 51 34 118 0 0 152 5 0 40 3 45 0 0 0 0 0 248
6:15 PM 0 49 11 0 60 24 102 0 1 126 7 0 36 1 43 0 0 0 0 0 229
6:30 PM 0 40 6 0 46 40 78 0 0 118 12 0 31 0 43 1 0 0 0 1 208
6:45 PM 0 38 2 0 40 20 42 0 0 62 11 0 21 0 32 0 0 0 0 0 134
Hourly Total 0 170 27 0 197 118 340 0 1 458 35 0 128 4 163 1 0 0 0 1 819
7:00 PM 0 0 0 0 0 0 0 0 0 0 0 0 0 0 0 0 0 0 0 0 0
Grand Total 7 1153 153 2 1313 1267 2671 15 1 3953 262 27 1205 38 1494 4 1 5 3 10 6770
Approach % 0.5 87.8 11.7 - - 32.1 67.6 0.4 - - 17.5 1.8 80.7 - - 40.0 10.0 50.0 - - -
Total % 0.1 17.0 2.3 - 19.4 18.7 39.5 0.2 - 58.4 3.9 0.4 17.8 - 22.1 0.1 0.0 0.1 - 0.1 -
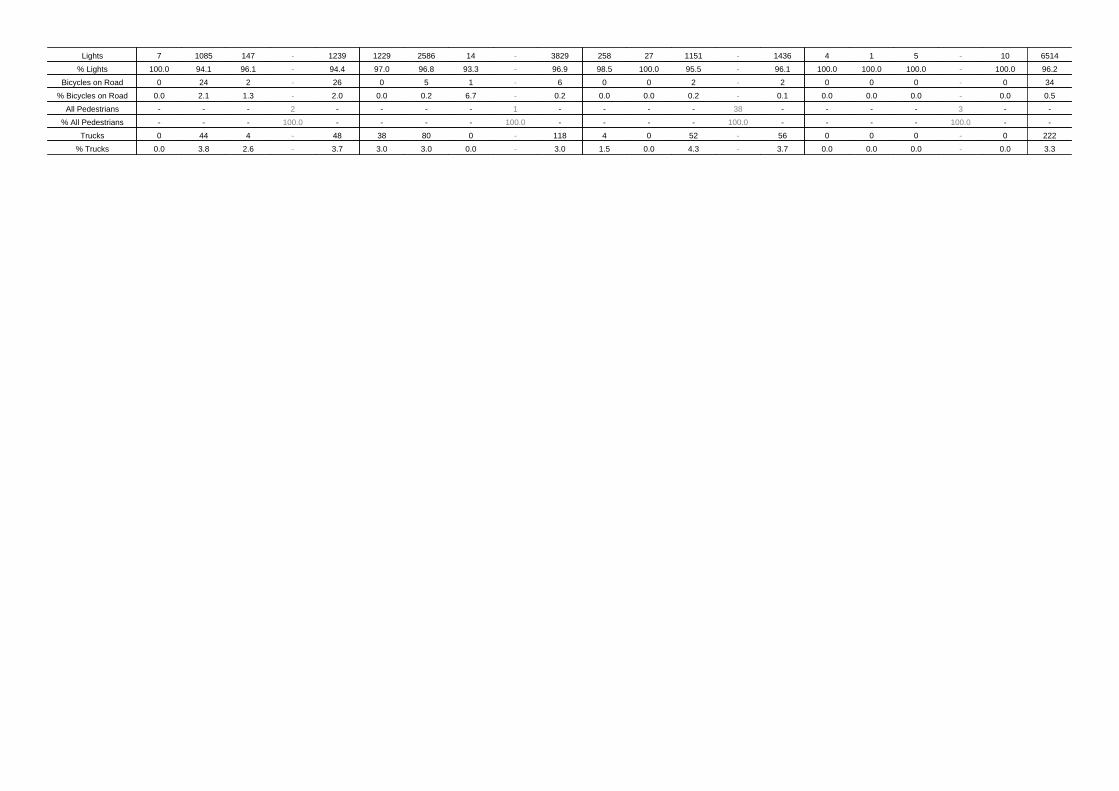
Lights 7 1085 147 - 1239 1229 2586 14 - 3829 258 27 1151 - 1436 4 1 5 - 10 6514
% Lights 100.0 94.1 96.1 - 94.4 97.0 96.8 93.3 - 96.9 98.5 100.0 95.5 - 96.1 100.0 100.0 100.0 - 100.0 96.2
Bicycles on Road 0 24 2 - 26 0 5 1 - 6 0 0 2 - 2 0 0 0 - 0 34
% Bicycles on Road 0.0 2.1 1.3 - 2.0 0.0 0.2 6.7 - 0.2 0.0 0.0 0.2 - 0.1 0.0 0.0 0.0 - 0.0 0.5
All Pedestrians - - - 2 - - - - 1 - - - - 38 - - - - 3 - -
% All Pedestrians - - - 100.0 - - - - 100.0 - - - - 100.0 - - - - 100.0 - -
Trucks 0 44 4 - 48 38 80 0 - 118 4 0 52 - 56 0 0 0 - 0 222
% Trucks 0.0 3.8 2.6 - 3.7 3.0 3.0 0.0 - 3.0 1.5 0.0 4.3 - 3.7 0.0 0.0 0.0 - 0.0 3.3
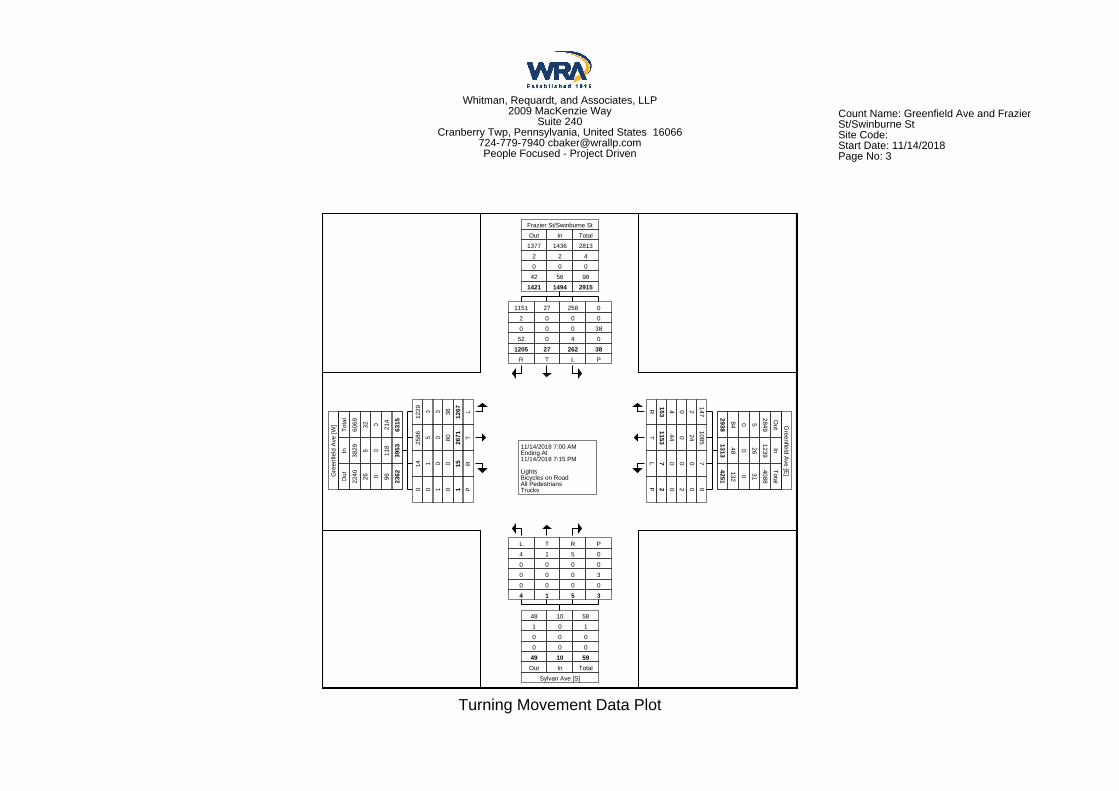
Whitman, Requardt, and Associates, LLP2009 MacKenzie Way
Suite 240Cranberry Twp, Pennsylvania, United States 16066
724-779-7940 [email protected] Focused - Project Driven
Count Name: Greenfield Ave and FrazierSt/Swinburne StSite Code:Start Date: 11/14/2018Page No: 3
11/14/2018 7:00 AMEnding At11/14/2018 7:15 PM
LightsBicycles on RoadAll PedestriansTrucks
Frazier St/Swinburne St
Out In Total
1377 1436 2813
2 2 4
0 0 0
42 56 98
1421 1494 2915
1151 27 258 0
2 0 0 0
0 0 0 38
52 0 4 0
1205 27 262 38R T L P
293884 0 5
2849
Out
131348 0 26
1239
In
4251132 0 31
4088
Total
Greenfield A
ve [E]
R 153 4 0 2 147
T1153
44 0 241085
L 7 0 0 0 7
P 2 0 2 0 0
48 10 58
1 0 1
0 0 0
0 0 0
49 10 59Out In Total
Sylvan Ave [S]
L T R P
4 1 5 0
0 0 0 0
0 0 0 3
0 0 0 0
4 1 5 3
Gre
enfie
ld A
ve [W
]
Tota
l
6069 32 0 214
6315
In
3829 6 0 118
3953
Out
2240 26 0 96 2362
1229 0 0 38 1267 L
2586 5 0 80 2671 T
14 1 0 0 15 R
0 0 1 0 1 P
Turning Movement Data Plot

Whitman, Requardt, and Associates, LLP2009 MacKenzie Way
Suite 240Cranberry Twp, Pennsylvania, United States 16066
724-779-7940 [email protected] Focused - Project Driven
Count Name: Greenfield Ave and FrazierSt/Swinburne StSite Code:Start Date: 11/14/2018Page No: 4
Turning Movement Peak Hour Data (7:15 AM)
Start Time
Greenfield Ave Greenfield Ave Frazier St/Swinburne St Sylvan Ave
Westbound Eastbound Southbound Northbound
Left Thru Right Peds App. Total Left Thru Right Peds App. Total Left Thru Right Peds App. Total Left Thru Right Peds App. Total Int. Total
7:15 AM 0 67 3 0 70 113 42 1 0 156 3 0 35 0 38 0 0 0 0 0 264
7:30 AM 0 72 6 0 78 116 55 0 0 171 4 0 39 1 43 0 0 0 0 0 292
7:45 AM 0 64 11 0 75 110 69 0 0 179 5 0 31 1 36 0 0 1 1 1 291
8:00 AM 0 70 10 0 80 95 55 0 0 150 6 0 30 0 36 0 0 0 0 0 266
Total 0 273 30 0 303 434 221 1 0 656 18 0 135 2 153 0 0 1 1 1 1113
Approach % 0.0 90.1 9.9 - - 66.2 33.7 0.2 - - 11.8 0.0 88.2 - - 0.0 0.0 100.0 - - -
Total % 0.0 24.5 2.7 - 27.2 39.0 19.9 0.1 - 58.9 1.6 0.0 12.1 - 13.7 0.0 0.0 0.1 - 0.1 -
PHF 0.000 0.948 0.682 - 0.947 0.935 0.801 0.250 - 0.916 0.750 0.000 0.865 - 0.890 0.000 0.000 0.250 - 0.250 0.953
Lights 0 249 27 - 276 422 199 1 - 622 15 0 130 - 145 0 0 1 - 1 1044
% Lights - 91.2 90.0 - 91.1 97.2 90.0 100.0 - 94.8 83.3 - 96.3 - 94.8 - - 100.0 - 100.0 93.8
Bicycles on Road 0 16 1 - 17 0 0 0 - 0 0 0 0 - 0 0 0 0 - 0 17
% Bicycles on Road - 5.9 3.3 - 5.6 0.0 0.0 0.0 - 0.0 0.0 - 0.0 - 0.0 - - 0.0 - 0.0 1.5
All Pedestrians - - - 0 - - - - 0 - - - - 2 - - - - 1 - -
% All Pedestrians - - - - - - - - - - - - - 100.0 - - - - 100.0 - -
Trucks 0 8 2 - 10 12 22 0 - 34 3 0 5 - 8 0 0 0 - 0 52
% Trucks - 2.9 6.7 - 3.3 2.8 10.0 0.0 - 5.2 16.7 - 3.7 - 5.2 - - 0.0 - 0.0 4.7
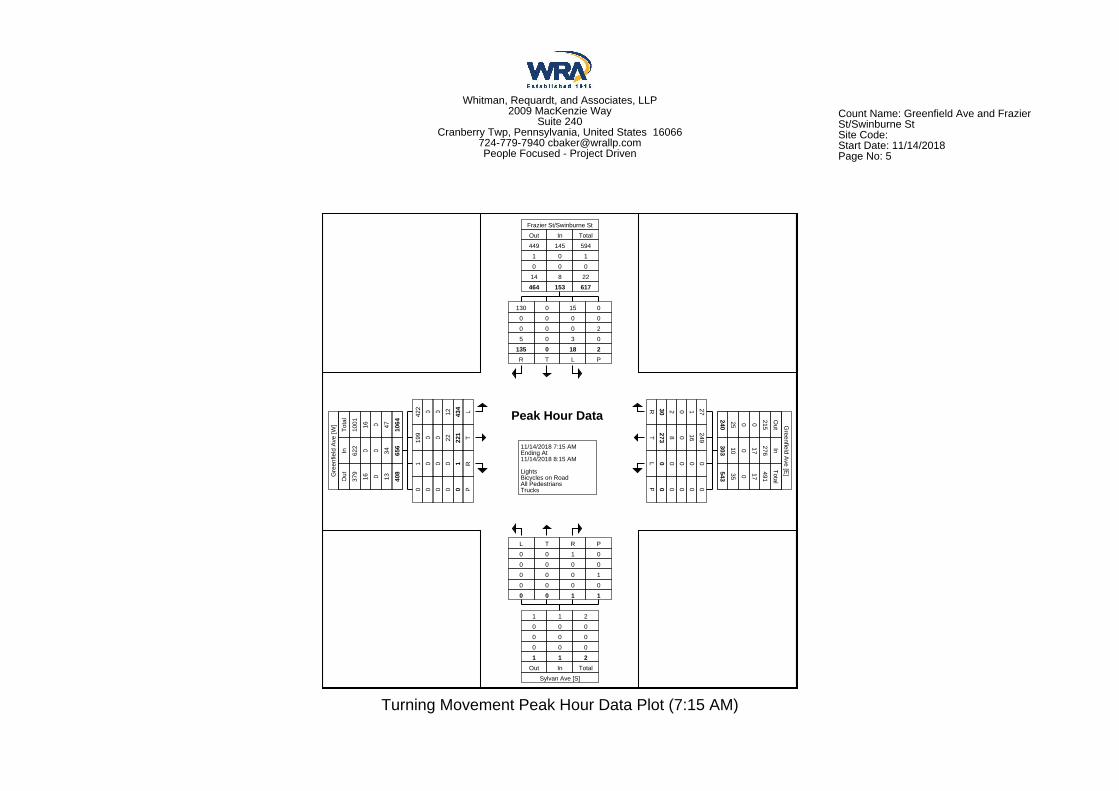
Whitman, Requardt, and Associates, LLP2009 MacKenzie Way
Suite 240Cranberry Twp, Pennsylvania, United States 16066
724-779-7940 [email protected] Focused - Project Driven
Count Name: Greenfield Ave and FrazierSt/Swinburne StSite Code:Start Date: 11/14/2018Page No: 5
Peak Hour Data
11/14/2018 7:15 AMEnding At11/14/2018 8:15 AM
LightsBicycles on RoadAll PedestriansTrucks
Frazier St/Swinburne St
Out In Total
449 145 594
1 0 1
0 0 0
14 8 22
464 153 617
130 0 15 0
0 0 0 0
0 0 0 2
5 0 3 0
135 0 18 2R T L P
24025 0 0 215
Out
30310 0 17
276
In
54335 0 17
491
Total
Greenfield A
ve [E]
R 30 2 0 1 27
T 273 8 0 16249
L 0 0 0 0 0
P 0 0 0 0 0
1 1 2
0 0 0
0 0 0
0 0 0
1 1 2Out In Total
Sylvan Ave [S]
L T R P
0 0 1 0
0 0 0 0
0 0 0 1
0 0 0 0
0 0 1 1
Gre
enfie
ld A
ve [W
]
Tota
l
1001 16 0 47 1064
In 622 0 0 34 656
Out
379
16 0 13 408
422 0 0 12 434 L
199 0 0 22 221 T
1 0 0 0 1 R
0 0 0 0 0 P
Turning Movement Peak Hour Data Plot (7:15 AM)
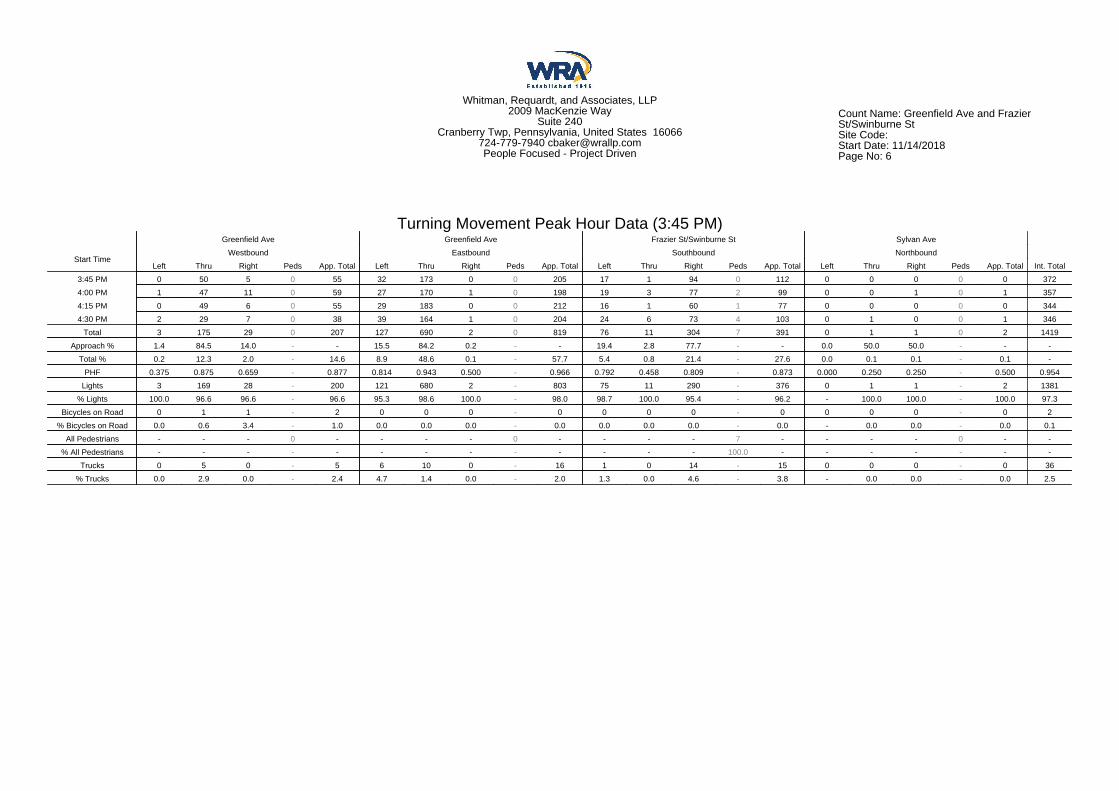
Whitman, Requardt, and Associates, LLP2009 MacKenzie Way
Suite 240Cranberry Twp, Pennsylvania, United States 16066
724-779-7940 [email protected] Focused - Project Driven
Count Name: Greenfield Ave and FrazierSt/Swinburne StSite Code:Start Date: 11/14/2018Page No: 6
Turning Movement Peak Hour Data (3:45 PM)
Start Time
Greenfield Ave Greenfield Ave Frazier St/Swinburne St Sylvan Ave
Westbound Eastbound Southbound Northbound
Left Thru Right Peds App. Total Left Thru Right Peds App. Total Left Thru Right Peds App. Total Left Thru Right Peds App. Total Int. Total
3:45 PM 0 50 5 0 55 32 173 0 0 205 17 1 94 0 112 0 0 0 0 0 372
4:00 PM 1 47 11 0 59 27 170 1 0 198 19 3 77 2 99 0 0 1 0 1 357
4:15 PM 0 49 6 0 55 29 183 0 0 212 16 1 60 1 77 0 0 0 0 0 344
4:30 PM 2 29 7 0 38 39 164 1 0 204 24 6 73 4 103 0 1 0 0 1 346
Total 3 175 29 0 207 127 690 2 0 819 76 11 304 7 391 0 1 1 0 2 1419
Approach % 1.4 84.5 14.0 - - 15.5 84.2 0.2 - - 19.4 2.8 77.7 - - 0.0 50.0 50.0 - - -
Total % 0.2 12.3 2.0 - 14.6 8.9 48.6 0.1 - 57.7 5.4 0.8 21.4 - 27.6 0.0 0.1 0.1 - 0.1 -
PHF 0.375 0.875 0.659 - 0.877 0.814 0.943 0.500 - 0.966 0.792 0.458 0.809 - 0.873 0.000 0.250 0.250 - 0.500 0.954
Lights 3 169 28 - 200 121 680 2 - 803 75 11 290 - 376 0 1 1 - 2 1381
% Lights 100.0 96.6 96.6 - 96.6 95.3 98.6 100.0 - 98.0 98.7 100.0 95.4 - 96.2 - 100.0 100.0 - 100.0 97.3
Bicycles on Road 0 1 1 - 2 0 0 0 - 0 0 0 0 - 0 0 0 0 - 0 2
% Bicycles on Road 0.0 0.6 3.4 - 1.0 0.0 0.0 0.0 - 0.0 0.0 0.0 0.0 - 0.0 - 0.0 0.0 - 0.0 0.1
All Pedestrians - - - 0 - - - - 0 - - - - 7 - - - - 0 - -
% All Pedestrians - - - - - - - - - - - - - 100.0 - - - - - - -
Trucks 0 5 0 - 5 6 10 0 - 16 1 0 14 - 15 0 0 0 - 0 36
% Trucks 0.0 2.9 0.0 - 2.4 4.7 1.4 0.0 - 2.0 1.3 0.0 4.6 - 3.8 - 0.0 0.0 - 0.0 2.5

Whitman, Requardt, and Associates, LLP2009 MacKenzie Way
Suite 240Cranberry Twp, Pennsylvania, United States 16066
724-779-7940 [email protected] Focused - Project Driven
Count Name: Greenfield Ave and FrazierSt/Swinburne StSite Code:Start Date: 11/14/2018Page No: 7
Peak Hour Data
11/14/2018 3:45 PMEnding At11/14/2018 4:45 PM
LightsBicycles on RoadAll PedestriansTrucks
Frazier St/Swinburne St
Out In Total
150 376 526
1 0 1
0 0 0
6 15 21
157 391 548
290 11 75 0
0 0 0 0
0 0 0 7
14 0 1 0
304 11 76 7R T L P
76711 0 0 756
Out
207 5 0 2 200
In
97416 0 2 956
Total
Greenfield A
ve [E]
R 29 0 0 1 28
T 175 5 0 1 169
L 3 0 0 0 3
P 0 0 0 0 0
16 2 18
0 0 0
0 0 0
0 0 0
16 2 18Out In Total
Sylvan Ave [S]
L T R P
0 1 1 0
0 0 0 0
0 0 0 0
0 0 0 0
0 1 1 0
Gre
enfie
ld A
ve [W
]
Tota
l
1262 1 0 35 1298
In 803 0 0 16 819
Out
459 1 0 19 479
121 0 0 6 127 L
680 0 0 10 690 T
2 0 0 0 2 R
0 0 0 0 0 P
Turning Movement Peak Hour Data Plot (3:45 PM)
Whitman, Requardt, and Associates, LLP2009 MacKenzie Way
Suite 240Cranberry Twp, Pennsylvania, United States 16066
724-779-7940 [email protected] Focused - Project Driven
Count Name: Greenfield Ave and FrazierSt/Swinburne StSite Code:Start Date: 11/14/2018Page No: 8

File Name : I-376 WB Off-ramp at Bates to Glenwood_AMSite Code : 17240002Start Date : 11/8/2017Page No : 1
Bates Street and I-376 WB Off-rampto Glenwood
Groups Printed- Pedestrians and BicyclesI-376 WB Off-ramp to
GlenwoodEastbound
WestboundBates StreetNorthbound
Bates StreetSouthbound
Start Time Left Thru Right Peds App. Total Left Thru Right Peds App. Total Left Thru Right Peds App. Total Left Thru Right Peds App. Total Int. Total
06:30 AM 0 0 0 3 3 0 0 0 0 0 0 0 0 0 0 0 1 0 0 1 406:45 AM 0 0 0 2 2 0 0 0 0 0 0 1 0 0 1 0 0 0 0 0 3
Total 0 0 0 5 5 0 0 0 0 0 0 1 0 0 1 0 1 0 0 1 7
07:00 AM 0 0 0 3 3 0 0 0 0 0 0 0 0 0 0 0 3 0 0 3 607:15 AM 0 0 0 7 7 0 0 0 0 0 0 0 0 0 0 0 1 0 0 1 807:30 AM 0 0 0 8 8 0 0 0 0 0 0 0 0 0 0 0 2 0 0 2 1007:45 AM 0 0 0 4 4 0 0 0 0 0 0 1 0 0 1 0 3 0 0 3 8
Total 0 0 0 22 22 0 0 0 0 0 0 1 0 0 1 0 9 0 0 9 32
08:00 AM 0 0 0 5 5 0 0 0 0 0 0 1 0 0 1 0 3 0 0 3 908:15 AM 0 0 0 16 16 0 0 0 0 0 0 1 0 0 1 0 2 0 0 2 1908:30 AM 0 0 0 4 4 0 0 0 0 0 0 0 0 0 0 0 0 0 0 0 408:45 AM 0 0 0 5 5 0 0 0 0 0 0 0 0 0 0 0 1 0 0 1 6
Total 0 0 0 30 30 0 0 0 0 0 0 2 0 0 2 0 6 0 0 6 38
09:00 AM 0 0 0 7 7 0 0 0 0 0 0 0 0 0 0 0 2 0 0 2 909:15 AM 0 0 0 5 5 0 0 0 0 0 0 0 0 0 0 0 0 0 0 0 5
Grand Total 0 0 0 69 69 0 0 0 0 0 0 4 0 0 4 0 18 0 0 18 91Apprch % 0 0 0 100 0 0 0 0 0 100 0 0 0 100 0 0
Total % 0 0 0 75.8 75.8 0 0 0 0 0 0 4.4 0 0 4.4 0 19.8 0 0 19.8
I-376 WB Off-ramp toGlenwoodEastbound
WestboundBates StreetNorthbound
Bates StreetSouthbound
Start Time Left Thru Right Peds App. Total Thru Right Peds App. Total Thru Right Peds App. Total Thru Right Peds App. Total Int. Total
Peak Hour Analysis From 06:30 AM to 09:15 AM - Peak 1 of 1Peak Hour for Entire Intersection Begins at 07:30 AM
07:30 AM 0 0 0 8 8 0 0 0 0 0 0 0 0 0 0 0 2 0 0 2 1007:45 AM 0 0 0 4 4 0 0 0 0 0 0 1 0 0 1 0 3 0 0 3 808:00 AM 0 0 0 5 5 0 0 0 0 0 0 1 0 0 1 0 3 0 0 3 908:15 AM 0 0 0 16 16 0 0 0 0 0 0 1 0 0 1 0 2 0 0 2 19Total Volume 0 0 0 33 33 0 0 0 0 0 0 3 0 0 3 0 10 0 0 10 46% App. Total 0 0 0 100 0 0 0 0 0 100 0 0 0 100 0 0
PHF .000 .000 .000 .516 .516 .000 .000 .000 .000 .000 .000 .750 .000 .000 .750 .000 .833 .000 .000 .833 .605
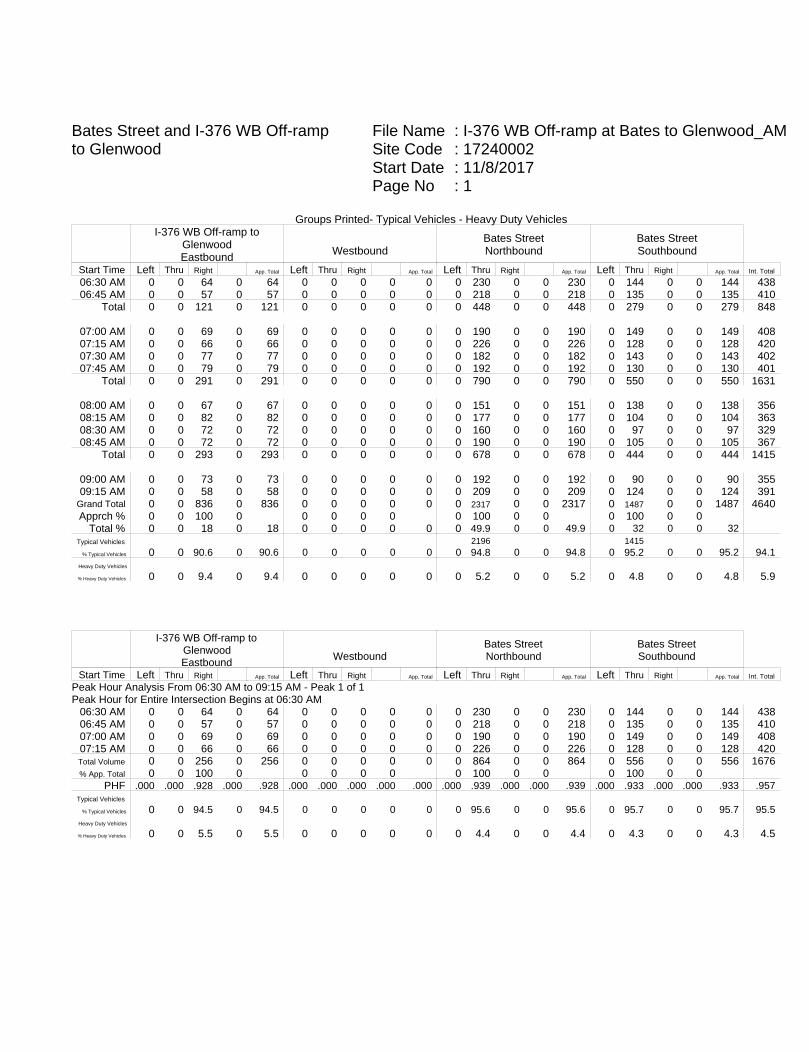
File Name : I-376 WB Off-ramp at Bates to Glenwood_AMSite Code : 17240002Start Date : 11/8/2017Page No : 1
Bates Street and I-376 WB Off-rampto Glenwood
Groups Printed- Typical Vehicles - Heavy Duty VehiclesI-376 WB Off-ramp to
GlenwoodEastbound
WestboundBates StreetNorthbound
Bates StreetSouthbound
Start Time Left Thru Right App. Total Left Thru Right App. Total Left Thru Right App. Total Left Thru Right App. Total Int. Total
06:30 AM 0 0 64 0 64 0 0 0 0 0 0 230 0 0 230 0 144 0 0 144 43806:45 AM 0 0 57 0 57 0 0 0 0 0 0 218 0 0 218 0 135 0 0 135 410
Total 0 0 121 0 121 0 0 0 0 0 0 448 0 0 448 0 279 0 0 279 848
07:00 AM 0 0 69 0 69 0 0 0 0 0 0 190 0 0 190 0 149 0 0 149 40807:15 AM 0 0 66 0 66 0 0 0 0 0 0 226 0 0 226 0 128 0 0 128 42007:30 AM 0 0 77 0 77 0 0 0 0 0 0 182 0 0 182 0 143 0 0 143 40207:45 AM 0 0 79 0 79 0 0 0 0 0 0 192 0 0 192 0 130 0 0 130 401
Total 0 0 291 0 291 0 0 0 0 0 0 790 0 0 790 0 550 0 0 550 1631
08:00 AM 0 0 67 0 67 0 0 0 0 0 0 151 0 0 151 0 138 0 0 138 35608:15 AM 0 0 82 0 82 0 0 0 0 0 0 177 0 0 177 0 104 0 0 104 36308:30 AM 0 0 72 0 72 0 0 0 0 0 0 160 0 0 160 0 97 0 0 97 32908:45 AM 0 0 72 0 72 0 0 0 0 0 0 190 0 0 190 0 105 0 0 105 367
Total 0 0 293 0 293 0 0 0 0 0 0 678 0 0 678 0 444 0 0 444 1415
09:00 AM 0 0 73 0 73 0 0 0 0 0 0 192 0 0 192 0 90 0 0 90 35509:15 AM 0 0 58 0 58 0 0 0 0 0 0 209 0 0 209 0 124 0 0 124 391
Grand Total 0 0 836 0 836 0 0 0 0 0 0 2317 0 0 2317 0 1487 0 0 1487 4640Apprch % 0 0 100 0 0 0 0 0 0 100 0 0 0 100 0 0
Total % 0 0 18 0 18 0 0 0 0 0 0 49.9 0 0 49.9 0 32 0 0 32Typical Vehicles 2196 1415
% Typical Vehicles 0 0 90.6 0 90.6 0 0 0 0 0 0 94.8 0 0 94.8 0 95.2 0 0 95.2 94.1Heavy Duty Vehicles
% Heavy Duty Vehicles 0 0 9.4 0 9.4 0 0 0 0 0 0 5.2 0 0 5.2 0 4.8 0 0 4.8 5.9
I-376 WB Off-ramp toGlenwoodEastbound
WestboundBates StreetNorthbound
Bates StreetSouthbound
Start Time Left Thru Right App. Total Left Thru Right App. Total Left Thru Right App. Total Left Thru Right App. Total Int. Total
Peak Hour Analysis From 06:30 AM to 09:15 AM - Peak 1 of 1Peak Hour for Entire Intersection Begins at 06:30 AM
06:30 AM 0 0 64 0 64 0 0 0 0 0 0 230 0 0 230 0 144 0 0 144 43806:45 AM 0 0 57 0 57 0 0 0 0 0 0 218 0 0 218 0 135 0 0 135 41007:00 AM 0 0 69 0 69 0 0 0 0 0 0 190 0 0 190 0 149 0 0 149 40807:15 AM 0 0 66 0 66 0 0 0 0 0 0 226 0 0 226 0 128 0 0 128 420Total Volume 0 0 256 0 256 0 0 0 0 0 0 864 0 0 864 0 556 0 0 556 1676% App. Total 0 0 100 0 0 0 0 0 0 100 0 0 0 100 0 0
PHF .000 .000 .928 .000 .928 .000 .000 .000 .000 .000 .000 .939 .000 .000 .939 .000 .933 .000 .000 .933 .957Typical Vehicles
% Typical Vehicles 0 0 94.5 0 94.5 0 0 0 0 0 0 95.6 0 0 95.6 0 95.7 0 0 95.7 95.5Heavy Duty Vehicles
% Heavy Duty Vehicles 0 0 5.5 0 5.5 0 0 0 0 0 0 4.4 0 0 4.4 0 4.3 0 0 4.3 4.5
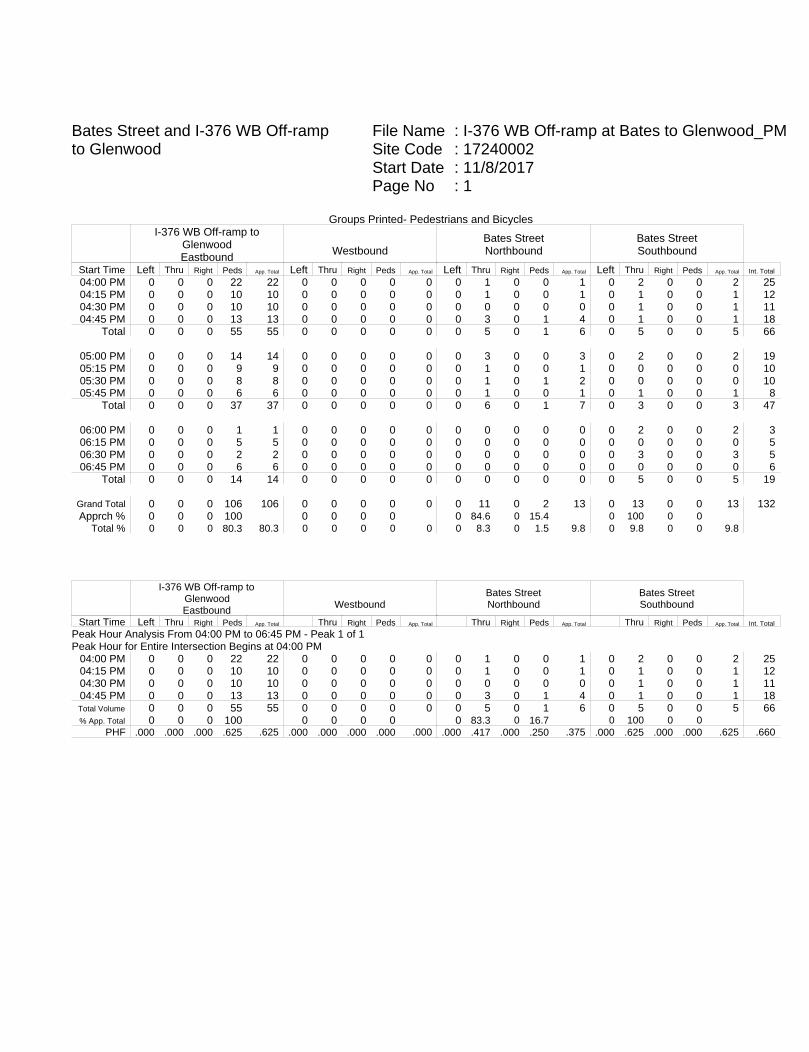
File Name : I-376 WB Off-ramp at Bates to Glenwood_PMSite Code : 17240002Start Date : 11/8/2017Page No : 1
Bates Street and I-376 WB Off-rampto Glenwood
Groups Printed- Pedestrians and BicyclesI-376 WB Off-ramp to
GlenwoodEastbound
WestboundBates StreetNorthbound
Bates StreetSouthbound
Start Time Left Thru Right Peds App. Total Left Thru Right Peds App. Total Left Thru Right Peds App. Total Left Thru Right Peds App. Total Int. Total
04:00 PM 0 0 0 22 22 0 0 0 0 0 0 1 0 0 1 0 2 0 0 2 2504:15 PM 0 0 0 10 10 0 0 0 0 0 0 1 0 0 1 0 1 0 0 1 1204:30 PM 0 0 0 10 10 0 0 0 0 0 0 0 0 0 0 0 1 0 0 1 1104:45 PM 0 0 0 13 13 0 0 0 0 0 0 3 0 1 4 0 1 0 0 1 18
Total 0 0 0 55 55 0 0 0 0 0 0 5 0 1 6 0 5 0 0 5 66
05:00 PM 0 0 0 14 14 0 0 0 0 0 0 3 0 0 3 0 2 0 0 2 1905:15 PM 0 0 0 9 9 0 0 0 0 0 0 1 0 0 1 0 0 0 0 0 1005:30 PM 0 0 0 8 8 0 0 0 0 0 0 1 0 1 2 0 0 0 0 0 1005:45 PM 0 0 0 6 6 0 0 0 0 0 0 1 0 0 1 0 1 0 0 1 8
Total 0 0 0 37 37 0 0 0 0 0 0 6 0 1 7 0 3 0 0 3 47
06:00 PM 0 0 0 1 1 0 0 0 0 0 0 0 0 0 0 0 2 0 0 2 306:15 PM 0 0 0 5 5 0 0 0 0 0 0 0 0 0 0 0 0 0 0 0 506:30 PM 0 0 0 2 2 0 0 0 0 0 0 0 0 0 0 0 3 0 0 3 506:45 PM 0 0 0 6 6 0 0 0 0 0 0 0 0 0 0 0 0 0 0 0 6
Total 0 0 0 14 14 0 0 0 0 0 0 0 0 0 0 0 5 0 0 5 19
Grand Total 0 0 0 106 106 0 0 0 0 0 0 11 0 2 13 0 13 0 0 13 132Apprch % 0 0 0 100 0 0 0 0 0 84.6 0 15.4 0 100 0 0
Total % 0 0 0 80.3 80.3 0 0 0 0 0 0 8.3 0 1.5 9.8 0 9.8 0 0 9.8
I-376 WB Off-ramp toGlenwoodEastbound
WestboundBates StreetNorthbound
Bates StreetSouthbound
Start Time Left Thru Right Peds App. Total Thru Right Peds App. Total Thru Right Peds App. Total Thru Right Peds App. Total Int. Total
Peak Hour Analysis From 04:00 PM to 06:45 PM - Peak 1 of 1Peak Hour for Entire Intersection Begins at 04:00 PM
04:00 PM 0 0 0 22 22 0 0 0 0 0 0 1 0 0 1 0 2 0 0 2 2504:15 PM 0 0 0 10 10 0 0 0 0 0 0 1 0 0 1 0 1 0 0 1 1204:30 PM 0 0 0 10 10 0 0 0 0 0 0 0 0 0 0 0 1 0 0 1 1104:45 PM 0 0 0 13 13 0 0 0 0 0 0 3 0 1 4 0 1 0 0 1 18Total Volume 0 0 0 55 55 0 0 0 0 0 0 5 0 1 6 0 5 0 0 5 66% App. Total 0 0 0 100 0 0 0 0 0 83.3 0 16.7 0 100 0 0
PHF .000 .000 .000 .625 .625 .000 .000 .000 .000 .000 .000 .417 .000 .250 .375 .000 .625 .000 .000 .625 .660

File Name : I-376 WB Off-ramp at Bates to Glenwood_PMSite Code : 17240002Start Date : 11/8/2017Page No : 1
Bates Street and I-376 WB Off-rampto Glenwood
Groups Printed- Typical Vehicles - Heavy Duty VehiclesI-376 WB Off-ramp to
GlenwoodEastbound
WestboundBates StreetNorthbound
Bates StreetSouthbound
Start Time Left Thru Right App. Total Left Thru Right App. Total Left Thru Right App. Total Left Thru Right App. Total Int. Total
04:00 PM 0 0 58 0 58 0 0 0 0 0 0 144 0 0 144 0 133 0 0 133 33504:15 PM 0 0 65 0 65 0 0 0 0 0 0 133 0 0 133 0 145 0 0 145 34304:30 PM 0 0 60 0 60 0 0 0 0 0 0 160 0 0 160 0 129 0 0 129 34904:45 PM 0 0 60 0 60 0 0 0 0 0 0 182 0 0 182 0 132 0 0 132 374
Total 0 0 243 0 243 0 0 0 0 0 0 619 0 0 619 0 539 0 0 539 1401
05:00 PM 0 0 74 0 74 0 0 0 0 0 0 170 0 0 170 0 134 0 0 134 37805:15 PM 0 0 56 0 56 0 0 0 0 0 0 196 0 0 196 0 102 0 0 102 35405:30 PM 0 0 67 0 67 0 0 0 0 0 0 192 0 0 192 0 117 0 0 117 37605:45 PM 0 0 62 0 62 0 0 0 0 0 0 188 0 0 188 0 109 0 0 109 359
Total 0 0 259 0 259 0 0 0 0 0 0 746 0 0 746 0 462 0 0 462 1467
06:00 PM 0 0 67 0 67 0 0 0 0 0 0 198 0 0 198 0 150 0 0 150 41506:15 PM 0 0 59 0 59 0 0 0 0 0 0 183 0 0 183 0 140 0 0 140 38206:30 PM 0 0 58 0 58 0 0 0 0 0 0 198 0 0 198 0 144 0 0 144 40006:45 PM 0 0 57 0 57 0 0 0 0 0 0 163 0 0 163 0 149 0 0 149 369
Total 0 0 241 0 241 0 0 0 0 0 0 742 0 0 742 0 583 0 0 583 1566
Grand Total 0 0 743 0 743 0 0 0 0 0 0 2107 0 0 2107 0 1584 0 0 1584 4434Apprch % 0 0 100 0 0 0 0 0 0 100 0 0 0 100 0 0
Total % 0 0 16.8 0 16.8 0 0 0 0 0 0 47.5 0 0 47.5 0 35.7 0 0 35.7Typical Vehicles 2049 1551
% Typical Vehicles 0 0 99.6 0 99.6 0 0 0 0 0 0 97.2 0 0 97.2 0 97.9 0 0 97.9 97.9Heavy Duty Vehicles
% Heavy Duty Vehicles 0 0 0.4 0 0.4 0 0 0 0 0 0 2.8 0 0 2.8 0 2.1 0 0 2.1 2.1
I-376 WB Off-ramp toGlenwoodEastbound
WestboundBates StreetNorthbound
Bates StreetSouthbound
Start Time Left Thru Right App. Total Left Thru Right App. Total Left Thru Right App. Total Left Thru Right App. Total Int. Total
Peak Hour Analysis From 04:00 PM to 06:45 PM - Peak 1 of 1Peak Hour for Entire Intersection Begins at 06:00 PM
06:00 PM 0 0 67 0 67 0 0 0 0 0 0 198 0 0 198 0 150 0 0 150 41506:15 PM 0 0 59 0 59 0 0 0 0 0 0 183 0 0 183 0 140 0 0 140 38206:30 PM 0 0 58 0 58 0 0 0 0 0 0 198 0 0 198 0 144 0 0 144 40006:45 PM 0 0 57 0 57 0 0 0 0 0 0 163 0 0 163 0 149 0 0 149 369Total Volume 0 0 241 0 241 0 0 0 0 0 0 742 0 0 742 0 583 0 0 583 1566% App. Total 0 0 100 0 0 0 0 0 0 100 0 0 0 100 0 0
PHF .000 .000 .899 .000 .899 .000 .000 .000 .000 .000 .000 .937 .000 .000 .937 .000 .972 .000 .000 .972 .943Typical Vehicles
% Typical Vehicles 0 0 100 0 100 0 0 0 0 0 0 97.2 0 0 97.2 0 98.1 0 0 98.1 98.0Heavy Duty Vehicles
% Heavy Duty Vehicles 0 0 0 0 0 0 0 0 0 0 0 2.8 0 0 2.8 0 1.9 0 0 1.9 2.0

File Name : I-376 WB Off-ramp at Bates to Oakland_AMSite Code : 17240003Start Date : 11/1/2017Page No : 1
I-376 WB Off-ramp at Bates St to Oakland( I-376 WB to Bates St. NB )
Groups Printed- Pedestrians and BicyclesI-376 WB Off-ramp at Bates St.
WestboundStart Time Left Thru Right Peds App. Total Int. Total06:30 AM 0 0 0 0 0 006:45 AM 0 0 0 0 0 0
Total 0 0 0 0 0 0
07:00 AM 0 0 0 0 0 007:15 AM 0 0 0 0 0 007:30 AM 0 0 0 0 0 007:45 AM 0 0 0 0 0 0
Total 0 0 0 0 0 0
08:00 AM 0 0 0 0 0 008:15 AM 0 0 0 0 0 008:30 AM 0 0 0 0 0 008:45 AM 0 0 0 0 0 0
Total 0 0 0 0 0 0
09:00 AM 0 0 0 0 0 009:15 AM 0 0 0 0 0 0
Grand Total 0 0 0 0 0 0Apprch % 0 0 0 0
Total %
I-376 WB Off-ramp at Bates St.Westbound
Start Time Left Thru Right Peds App. Total Int. TotalPeak Hour Analysis From 06:30 AM to 09:15 AM - Peak 1 of 1Peak Hour for Entire Intersection Begins at 06:30 AM
06:30 AM 0 0 0 0 0 006:45 AM 0 0 0 0 0 007:00 AM 0 0 0 0 0 007:15 AM 0 0 0 0 0 0
Total Volume 0 0 0 0 0 0% App. Total 0 0 0 0
PHF .000 .000 .000 .000 .000 .000

File Name : I-376 WB Off-ramp at Bates to Oakland_AMSite Code : 17240003Start Date : 11/1/2017Page No : 1
I-376 WB Off-ramp at Bates St to Oakland( I-376 WB to Bates St. NB )
Groups Printed- Typical Vehicles - Heavy Duty VehiclesI-376 WB Off-ramp at Bates St.
WestboundStart Time Left Thru Right App. Total Int. Total06:30 AM 0 0 107 0 107 10706:45 AM 0 0 104 0 104 104
Total 0 0 211 0 211 211
07:00 AM 0 0 102 0 102 10207:15 AM 0 0 105 0 105 10507:30 AM 0 0 88 0 88 8807:45 AM 0 0 91 0 91 91
Total 0 0 386 0 386 386
08:00 AM 0 0 77 0 77 7708:15 AM 0 0 84 0 84 8408:30 AM 0 0 107 0 107 10708:45 AM 0 0 93 0 93 93
Total 0 0 361 0 361 361
09:00 AM 0 0 112 0 112 11209:15 AM 0 0 115 0 115 115
Grand Total 0 0 1185 0 1185 1185Apprch % 0 0 100 0
Total % 0 0 100 0 100Typical Vehicles 0 0 1159 0 1159 1159
% Typical Vehicles 0 0 97.8 0 97.8 97.8Heavy Duty Vehicles 0 0 26 0 26 26
% Heavy Duty Vehicles 0 0 2.2 0 2.2 2.2
I-376 WB Off-ramp at Bates St.Westbound
Start Time Left Thru Right App. Total Int. TotalPeak Hour Analysis From 06:30 AM to 09:15 AM - Peak 1 of 1Peak Hour for Entire Intersection Begins at 08:30 AM
08:30 AM 0 0 107 0 107 10708:45 AM 0 0 93 0 93 9309:00 AM 0 0 112 0 112 11209:15 AM 0 0 115 0 115 115
Total Volume 0 0 427 0 427 427% App. Total 0 0 100 0
PHF .000 .000 .928 .000 .928 .928Typical Vehicles 0 0 412 0 412 412
% Typical Vehicles 0 0 96.5 0 96.5 96.5Heavy Duty Vehicles 0 0 15 0 15 15
% Heavy Duty Vehicles 0 0 3.5 0 3.5 3.5
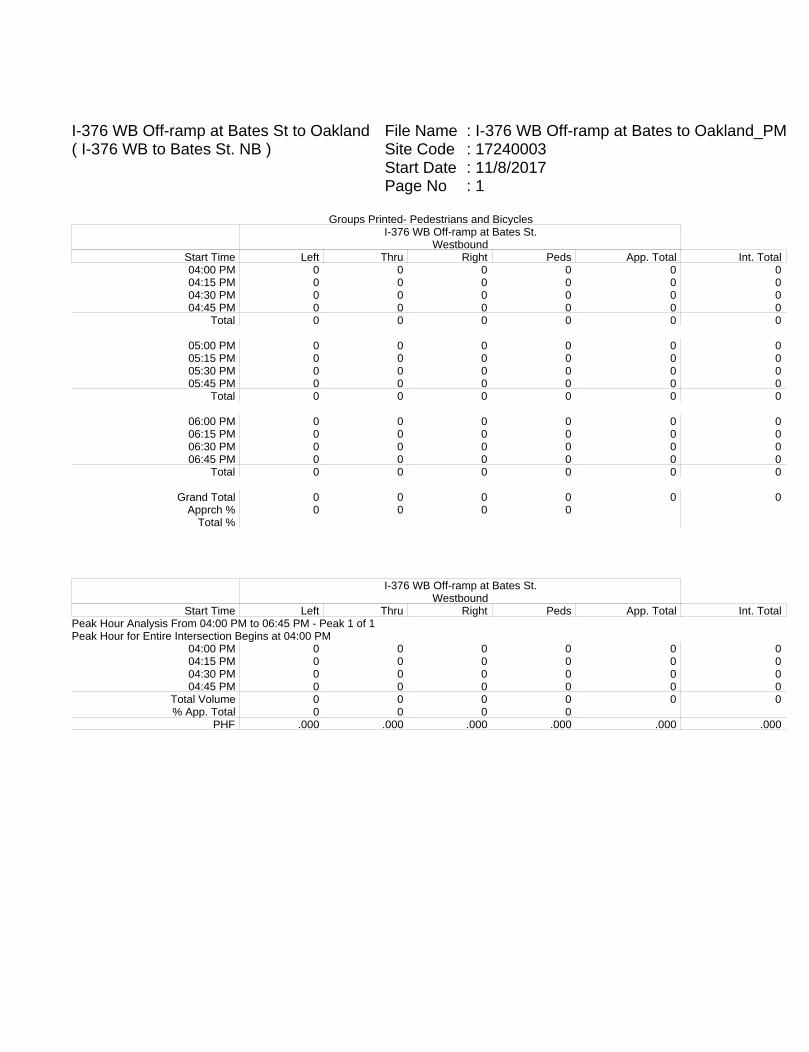
File Name : I-376 WB Off-ramp at Bates to Oakland_PMSite Code : 17240003Start Date : 11/8/2017Page No : 1
I-376 WB Off-ramp at Bates St to Oakland( I-376 WB to Bates St. NB )
Groups Printed- Pedestrians and BicyclesI-376 WB Off-ramp at Bates St.
WestboundStart Time Left Thru Right Peds App. Total Int. Total04:00 PM 0 0 0 0 0 004:15 PM 0 0 0 0 0 004:30 PM 0 0 0 0 0 004:45 PM 0 0 0 0 0 0
Total 0 0 0 0 0 0
05:00 PM 0 0 0 0 0 005:15 PM 0 0 0 0 0 005:30 PM 0 0 0 0 0 005:45 PM 0 0 0 0 0 0
Total 0 0 0 0 0 0
06:00 PM 0 0 0 0 0 006:15 PM 0 0 0 0 0 006:30 PM 0 0 0 0 0 006:45 PM 0 0 0 0 0 0
Total 0 0 0 0 0 0
Grand Total 0 0 0 0 0 0Apprch % 0 0 0 0
Total %
I-376 WB Off-ramp at Bates St.Westbound
Start Time Left Thru Right Peds App. Total Int. TotalPeak Hour Analysis From 04:00 PM to 06:45 PM - Peak 1 of 1Peak Hour for Entire Intersection Begins at 04:00 PM
04:00 PM 0 0 0 0 0 004:15 PM 0 0 0 0 0 004:30 PM 0 0 0 0 0 004:45 PM 0 0 0 0 0 0
Total Volume 0 0 0 0 0 0% App. Total 0 0 0 0
PHF .000 .000 .000 .000 .000 .000

File Name : I-376 WB Off-ramp at Bates to Oakland_PMSite Code : 17240003Start Date : 11/8/2017Page No : 1
I-376 WB Off-ramp at Bates St to Oakland( I-376 WB to Bates St. NB )
Groups Printed- Typical Vehicles - Heavy Duty VehiclesI-376 WB Off-ramp at Bates St.
WestboundStart Time Left Thru Right App. Total Int. Total04:00 PM 0 0 83 0 83 8304:15 PM 0 0 81 0 81 8104:30 PM 0 0 73 0 73 7304:45 PM 0 0 95 0 95 95
Total 0 0 332 0 332 332
05:00 PM 0 0 77 0 77 7705:15 PM 0 0 96 0 96 9605:30 PM 0 0 97 0 97 9705:45 PM 0 0 97 0 97 97
Total 0 0 367 0 367 367
06:00 PM 0 0 93 0 93 9306:15 PM 0 0 82 0 82 8206:30 PM 0 0 106 0 106 10606:45 PM 0 0 70 0 70 70
Total 0 0 351 0 351 351
Grand Total 0 0 1050 0 1050 1050Apprch % 0 0 100 0
Total % 0 0 100 0 100Typical Vehicles 0 0 1033 0 1033 1033
% Typical Vehicles 0 0 98.4 0 98.4 98.4Heavy Duty Vehicles 0 0 17 0 17 17
% Heavy Duty Vehicles 0 0 1.6 0 1.6 1.6
I-376 WB Off-ramp at Bates St.Westbound
Start Time Left Thru Right App. Total Int. TotalPeak Hour Analysis From 04:00 PM to 06:45 PM - Peak 1 of 1Peak Hour for Entire Intersection Begins at 05:15 PM
05:15 PM 0 0 96 0 96 9605:30 PM 0 0 97 0 97 9705:45 PM 0 0 97 0 97 9706:00 PM 0 0 93 0 93 93
Total Volume 0 0 383 0 383 383% App. Total 0 0 100 0
PHF .000 .000 .987 .000 .987 .987Typical Vehicles 0 0 378 0 378 378
% Typical Vehicles 0 0 98.7 0 98.7 98.7Heavy Duty Vehicles 0 0 5 0 5 5
% Heavy Duty Vehicles 0 0 1.3 0 1.3 1.3

File Name : Irvine & Greenfield_AMSite Code : 17240009Start Date : 11/1/2017Page No : 1
Greenfield Avenue & Irvine St./Saline St
Groups Printed- Pedestrians and BicyclesSaline StreetEastbound
Irvine StreetWestbound
Greenfield AvenueNorthbound
Greenfield AvenueSouthbound
Start Time Left Thru Right Peds App. Total Left Thru Right Peds App. Total Left Thru Right Peds App. Total Left Thru Right Peds App. Total Int. Total
06:30 AM 0 0 0 1 1 1 0 0 0 1 0 0 0 0 0 0 0 0 0 0 206:45 AM 0 0 1 0 1 0 0 0 0 0 0 0 0 0 0 0 0 0 0 0 1
Total 0 0 1 1 2 1 0 0 0 1 0 0 0 0 0 0 0 0 0 0 3
07:00 AM 0 0 2 2 4 0 0 0 0 0 2 0 0 0 2 0 0 0 0 0 607:15 AM 0 0 1 1 2 0 0 0 0 0 1 0 0 0 1 0 1 0 0 1 407:30 AM 0 0 4 3 7 0 0 0 0 0 1 0 0 0 1 0 7 1 0 8 1607:45 AM 0 0 1 1 2 0 0 0 0 0 0 0 0 0 0 0 3 0 0 3 5
Total 0 0 8 7 15 0 0 0 0 0 4 0 0 0 4 0 11 1 0 12 31
08:00 AM 0 0 2 2 4 0 0 0 0 0 1 0 0 0 1 0 2 1 0 3 808:15 AM 0 0 2 1 3 0 0 0 0 0 2 0 2 0 4 1 3 1 0 5 1208:30 AM 0 0 3 1 4 0 0 0 0 0 2 0 0 0 2 0 5 0 0 5 1108:45 AM 0 1 1 1 3 0 0 0 0 0 2 0 0 0 2 0 3 2 0 5 10
Total 0 1 8 5 14 0 0 0 0 0 7 0 2 0 9 1 13 4 0 18 41
09:00 AM 0 0 1 1 2 0 0 0 1 1 0 0 0 0 0 0 2 0 0 2 509:15 AM 0 0 6 1 7 1 0 0 0 1 0 0 0 0 0 0 0 0 0 0 8
Grand Total 0 1 24 15 40 2 0 0 1 3 11 0 2 0 13 1 26 5 0 32 88Apprch % 0 2.5 60 37.5 66.7 0 0 33.3 84.6 0 15.4 0 3.1 81.2 15.6 0
Total % 0 1.1 27.3 17 45.5 2.3 0 0 1.1 3.4 12.5 0 2.3 0 14.8 1.1 29.5 5.7 0 36.4
Saline StreetEastbound
Irvine StreetWestbound
Greenfield AvenueNorthbound
Greenfield AvenueSouthbound
Start Time Left Thru Right Peds App. Total Thru Right Peds App. Total Thru Right Peds App. Total Thru Right Peds App. Total Int. Total
Peak Hour Analysis From 06:30 AM to 08:30 AM - Peak 1 of 1Peak Hour for Entire Intersection Begins at 07:30 AM
07:30 AM 0 0 4 3 7 0 0 0 0 0 1 0 0 0 1 0 7 1 0 8 1607:45 AM 0 0 1 1 2 0 0 0 0 0 0 0 0 0 0 0 3 0 0 3 508:00 AM 0 0 2 2 4 0 0 0 0 0 1 0 0 0 1 0 2 1 0 3 808:15 AM 0 0 2 1 3 0 0 0 0 0 2 0 2 0 4 1 3 1 0 5 12Total Volume 0 0 9 7 16 0 0 0 0 0 4 0 2 0 6 1 15 3 0 19 41% App. Total 0 0 56.2 43.8 0 0 0 0 66.7 0 33.3 0 5.3 78.9 15.8 0
PHF .000 .000 .563 .583 .571 .000 .000 .000 .000 .000 .500 .000 .250 .000 .375 .250 .536 .750 .000 .594 .641

File Name : Irvine & Greenfield_AMSite Code : 17240009Start Date : 11/1/2017Page No : 1
Greenfield Avenue & Irvine St./Saline St
Groups Printed- Typical Vehicles - Heavy Duty VehiclesSaline StreetEastbound
Irvine StreetWestbound
Greenfield AvenueNorthbound
Greenfield AvenueSouthbound
Start Time Left Thru RightRt. on
RedApp. Total Left Thru Right
Rt. on
RedApp. Total Left Thru Right
Rt. on
RedApp. Total Left Thru Right
Rt. on
RedApp. Total Int. Total
06:30 AM 2 0 1 0 3 151 2 69 0 222 1 8 34 0 43 21 50 2 0 73 34106:45 AM 4 1 6 0 11 123 2 101 0 226 1 20 41 0 62 25 38 3 0 66 365
Total 6 1 7 0 14 274 4 170 0 448 2 28 75 0 105 46 88 5 0 139 706
07:00 AM 5 1 8 0 14 178 0 97 0 275 2 12 27 0 41 24 34 2 0 60 39007:15 AM 2 2 3 0 7 169 1 114 0 284 1 12 29 0 42 27 52 5 0 84 41707:30 AM 3 2 2 0 7 172 0 126 0 298 0 21 30 0 51 30 42 4 0 76 43207:45 AM 11 2 1 0 14 160 4 140 0 304 1 20 22 0 43 28 52 6 0 86 447
Total 21 7 14 0 42 679 5 477 0 1161 4 65 108 0 177 109 180 17 0 306 1686
08:00 AM 9 0 0 0 9 148 3 84 0 235 1 19 36 0 56 29 67 8 0 104 40408:15 AM 8 1 2 0 11 110 2 92 0 204 0 20 35 0 55 21 54 5 0 80 35008:30 AM 8 2 4 0 14 97 1 69 0 167 3 18 27 0 48 15 39 8 0 62 29108:45 AM 9 3 1 0 13 90 3 85 0 178 1 12 22 0 35 17 62 9 0 88 314
Total 34 6 7 0 47 445 9 330 0 784 5 69 120 0 194 82 222 30 0 334 1359
09:00 AM 8 2 5 0 15 76 0 58 0 134 3 17 35 1 56 25 52 2 0 79 28409:15 AM 5 0 1 0 6 61 0 46 0 107 0 22 30 0 52 17 31 8 0 56 221
Grand Total 74 16 34 0 124 1535 18 1081 0 2634 14 201 368 1 584 279 573 62 0 914 4256Apprch % 59.7 12.9 27.4 0 58.3 0.7 41 0 2.4 34.4 63 0.2 30.5 62.7 6.8 0
Total % 1.7 0.4 0.8 0 2.9 36.1 0.4 25.4 0 61.9 0.3 4.7 8.6 0 13.7 6.6 13.5 1.5 0 21.5Typical Vehicles 1443 1046
% Typical Vehicles 90.5 93.8 94.1 0 91.9 94 88.9 96.8 0 95.1 78.6 81.1 76.6 0 78.1 95.7 94.1 96.8 0 94.7 92.6Heavy Duty Vehicles
% Heavy Duty Vehicles 9.5 6.2 5.9 0 8.1 6 11.1 3.2 0 4.9 21.4 18.9 23.4 100 21.9 4.3 5.9 3.2 0 5.3 7.4
Saline StreetEastbound
Irvine StreetWestbound
Greenfield AvenueNorthbound
Greenfield AvenueSouthbound
Start Time Left Thru RightRt. on
RedApp. Total Left Thru Right
Rt. on
RedApp. Total Left Thru Right
Rt. on
RedApp. Total Left Thru Right
Rt. on
RedApp. Total Int. Total
Peak Hour Analysis From 06:30 AM to 08:30 AM - Peak 1 of 1Peak Hour for Entire Intersection Begins at 07:15 AM
07:15 AM 2 2 3 0 7 169 1 114 0 284 1 12 29 0 42 27 52 5 0 84 41707:30 AM 3 2 2 0 7 172 0 126 0 298 0 21 30 0 51 30 42 4 0 76 43207:45 AM 11 2 1 0 14 160 4 140 0 304 1 20 22 0 43 28 52 6 0 86 44708:00 AM 9 0 0 0 9 148 3 84 0 235 1 19 36 0 56 29 67 8 0 104 404Total Volume 25 6 6 0 37 649 8 464 0 1121 3 72 117 0 192 114 213 23 0 350 1700% App. Total 67.6 16.2 16.2 0 57.9 0.7 41.4 0 1.6 37.5 60.9 0 32.6 60.9 6.6 0
PHF .568 .750 .500 .000 .661 .943 .500 .829 .000 .922 .750 .857 .813 .000 .857 .950 .795 .719 .000 .841 .951Typical Vehicles
% Typical Vehicles 96.0 100 100 0 97.3 96.0 75.0 96.8 0 96.2 100 81.9 73.5 0 77.1 95.6 96.2 100 0 96.3 94.1Heavy Duty Vehicles
% Heavy Duty Vehicles 4.0 0 0 0 2.7 4.0 25.0 3.2 0 3.8 0 18.1 26.5 0 22.9 4.4 3.8 0 0 3.7 5.9
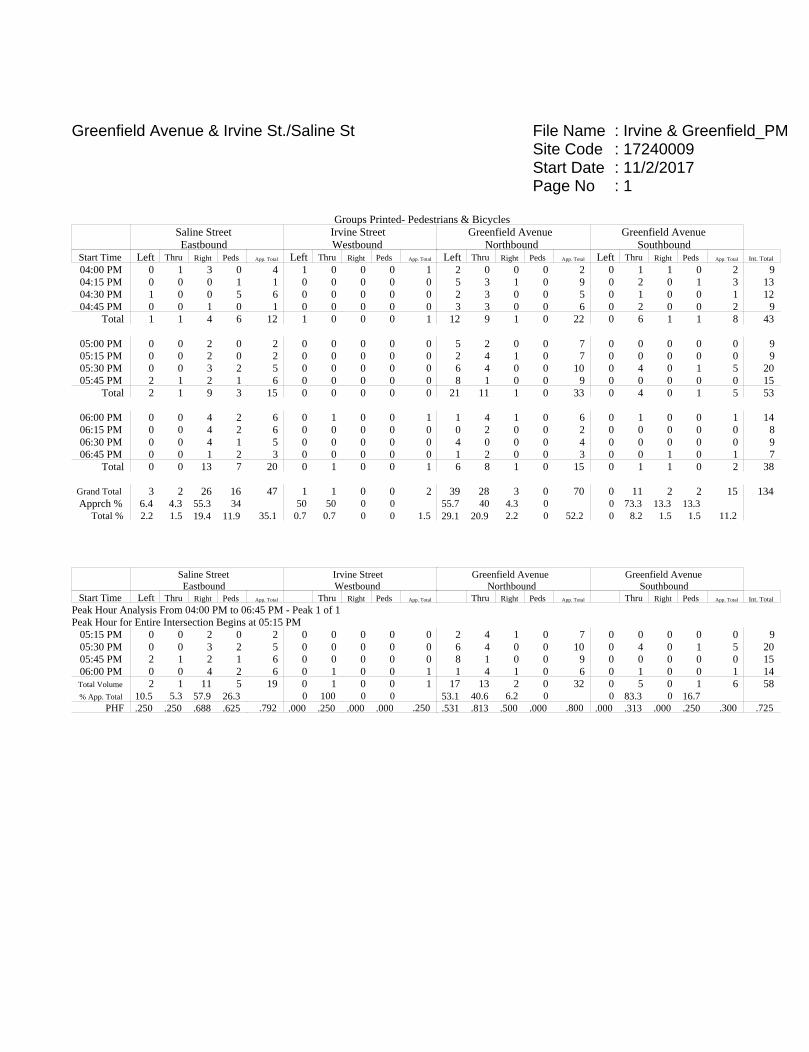
File Name : Irvine & Greenfield_PMSite Code : 17240009Start Date : 11/2/2017Page No : 1
Greenfield Avenue & Irvine St./Saline St
Groups Printed- Pedestrians & BicyclesSaline StreetEastbound
Irvine StreetWestbound
Greenfield AvenueNorthbound
Greenfield AvenueSouthbound
Start Time Left Thru Right Peds App. Total Left Thru Right Peds App. Total Left Thru Right Peds App. Total Left Thru Right Peds App. Total Int. Total
04:00 PM 0 1 3 0 4 1 0 0 0 1 2 0 0 0 2 0 1 1 0 2 904:15 PM 0 0 0 1 1 0 0 0 0 0 5 3 1 0 9 0 2 0 1 3 1304:30 PM 1 0 0 5 6 0 0 0 0 0 2 3 0 0 5 0 1 0 0 1 1204:45 PM 0 0 1 0 1 0 0 0 0 0 3 3 0 0 6 0 2 0 0 2 9
Total 1 1 4 6 12 1 0 0 0 1 12 9 1 0 22 0 6 1 1 8 43
05:00 PM 0 0 2 0 2 0 0 0 0 0 5 2 0 0 7 0 0 0 0 0 905:15 PM 0 0 2 0 2 0 0 0 0 0 2 4 1 0 7 0 0 0 0 0 905:30 PM 0 0 3 2 5 0 0 0 0 0 6 4 0 0 10 0 4 0 1 5 2005:45 PM 2 1 2 1 6 0 0 0 0 0 8 1 0 0 9 0 0 0 0 0 15
Total 2 1 9 3 15 0 0 0 0 0 21 11 1 0 33 0 4 0 1 5 53
06:00 PM 0 0 4 2 6 0 1 0 0 1 1 4 1 0 6 0 1 0 0 1 1406:15 PM 0 0 4 2 6 0 0 0 0 0 0 2 0 0 2 0 0 0 0 0 806:30 PM 0 0 4 1 5 0 0 0 0 0 4 0 0 0 4 0 0 0 0 0 906:45 PM 0 0 1 2 3 0 0 0 0 0 1 2 0 0 3 0 0 1 0 1 7
Total 0 0 13 7 20 0 1 0 0 1 6 8 1 0 15 0 1 1 0 2 38
Grand Total 3 2 26 16 47 1 1 0 0 2 39 28 3 0 70 0 11 2 2 15 134Apprch % 6.4 4.3 55.3 34 50 50 0 0 55.7 40 4.3 0 0 73.3 13.3 13.3
Total % 2.2 1.5 19.4 11.9 35.1 0.7 0.7 0 0 1.5 29.1 20.9 2.2 0 52.2 0 8.2 1.5 1.5 11.2
Saline StreetEastbound
Irvine StreetWestbound
Greenfield AvenueNorthbound
Greenfield AvenueSouthbound
Start Time Left Thru Right Peds App. Total Thru Right Peds App. Total Thru Right Peds App. Total Thru Right Peds App. Total Int. Total
Peak Hour Analysis From 04:00 PM to 06:45 PM - Peak 1 of 1Peak Hour for Entire Intersection Begins at 05:15 PM
05:15 PM 0 0 2 0 2 0 0 0 0 0 2 4 1 0 7 0 0 0 0 0 905:30 PM 0 0 3 2 5 0 0 0 0 0 6 4 0 0 10 0 4 0 1 5 2005:45 PM 2 1 2 1 6 0 0 0 0 0 8 1 0 0 9 0 0 0 0 0 1506:00 PM 0 0 4 2 6 0 1 0 0 1 1 4 1 0 6 0 1 0 0 1 14Total Volume 2 1 11 5 19 0 1 0 0 1 17 13 2 0 32 0 5 0 1 6 58% App. Total 10.5 5.3 57.9 26.3 0 100 0 0 53.1 40.6 6.2 0 0 83.3 0 16.7
PHF .250 .250 .688 .625 .792 .000 .250 .000 .000 .250 .531 .813 .500 .000 .800 .000 .313 .000 .250 .300 .725
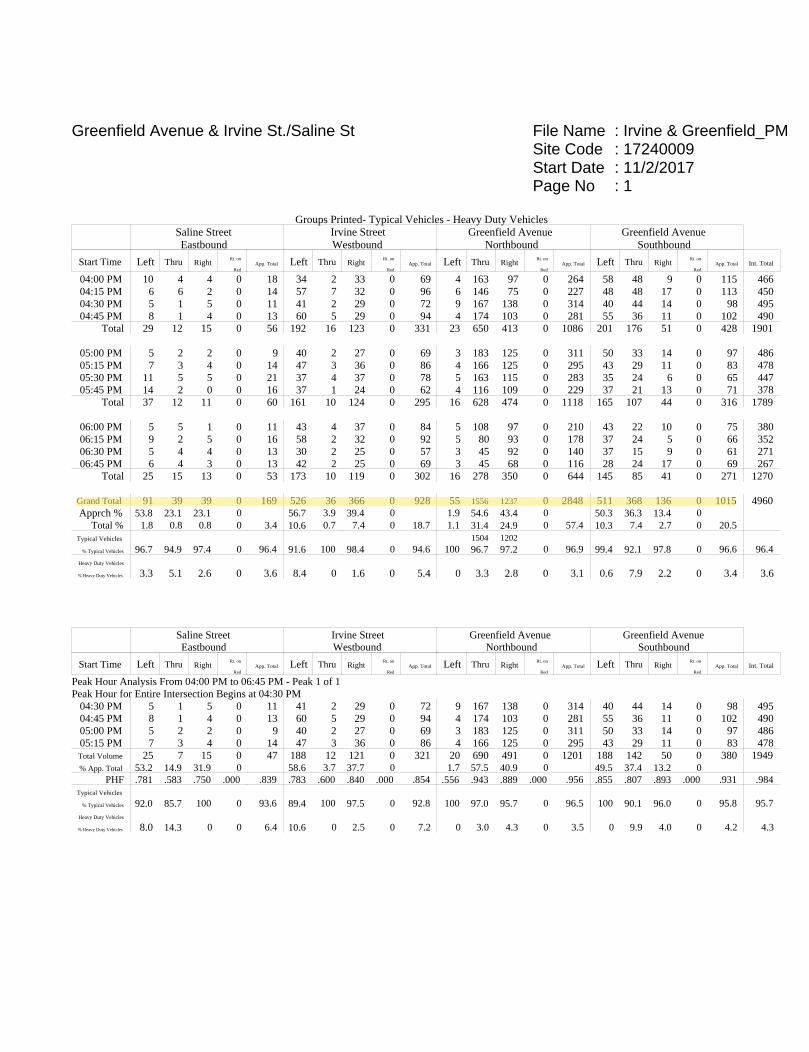
File Name : Irvine & Greenfield_PMSite Code : 17240009Start Date : 11/2/2017Page No : 1
Greenfield Avenue & Irvine St./Saline St
Groups Printed- Typical Vehicles - Heavy Duty VehiclesSaline StreetEastbound
Irvine StreetWestbound
Greenfield AvenueNorthbound
Greenfield AvenueSouthbound
Start Time Left Thru RightRt. on
RedApp. Total Left Thru Right
Rt. on
RedApp. Total Left Thru Right
Rt. on
RedApp. Total Left Thru Right
Rt. on
RedApp. Total Int. Total
04:00 PM 10 4 4 0 18 34 2 33 0 69 4 163 97 0 264 58 48 9 0 115 46604:15 PM 6 6 2 0 14 57 7 32 0 96 6 146 75 0 227 48 48 17 0 113 45004:30 PM 5 1 5 0 11 41 2 29 0 72 9 167 138 0 314 40 44 14 0 98 49504:45 PM 8 1 4 0 13 60 5 29 0 94 4 174 103 0 281 55 36 11 0 102 490
Total 29 12 15 0 56 192 16 123 0 331 23 650 413 0 1086 201 176 51 0 428 1901
05:00 PM 5 2 2 0 9 40 2 27 0 69 3 183 125 0 311 50 33 14 0 97 48605:15 PM 7 3 4 0 14 47 3 36 0 86 4 166 125 0 295 43 29 11 0 83 47805:30 PM 11 5 5 0 21 37 4 37 0 78 5 163 115 0 283 35 24 6 0 65 44705:45 PM 14 2 0 0 16 37 1 24 0 62 4 116 109 0 229 37 21 13 0 71 378
Total 37 12 11 0 60 161 10 124 0 295 16 628 474 0 1118 165 107 44 0 316 1789
06:00 PM 5 5 1 0 11 43 4 37 0 84 5 108 97 0 210 43 22 10 0 75 38006:15 PM 9 2 5 0 16 58 2 32 0 92 5 80 93 0 178 37 24 5 0 66 35206:30 PM 5 4 4 0 13 30 2 25 0 57 3 45 92 0 140 37 15 9 0 61 27106:45 PM 6 4 3 0 13 42 2 25 0 69 3 45 68 0 116 28 24 17 0 69 267
Total 25 15 13 0 53 173 10 119 0 302 16 278 350 0 644 145 85 41 0 271 1270
Grand Total 91 39 39 0 169 526 36 366 0 928 55 1556 1237 0 2848 511 368 136 0 1015 4960Apprch % 53.8 23.1 23.1 0 56.7 3.9 39.4 0 1.9 54.6 43.4 0 50.3 36.3 13.4 0
Total % 1.8 0.8 0.8 0 3.4 10.6 0.7 7.4 0 18.7 1.1 31.4 24.9 0 57.4 10.3 7.4 2.7 0 20.5Typical Vehicles 1504 1202
% Typical Vehicles 96.7 94.9 97.4 0 96.4 91.6 100 98.4 0 94.6 100 96.7 97.2 0 96.9 99.4 92.1 97.8 0 96.6 96.4Heavy Duty Vehicles
% Heavy Duty Vehicles 3.3 5.1 2.6 0 3.6 8.4 0 1.6 0 5.4 0 3.3 2.8 0 3.1 0.6 7.9 2.2 0 3.4 3.6
Saline StreetEastbound
Irvine StreetWestbound
Greenfield AvenueNorthbound
Greenfield AvenueSouthbound
Start Time Left Thru RightRt. on
RedApp. Total Left Thru Right
Rt. on
RedApp. Total Left Thru Right
Rt. on
RedApp. Total Left Thru Right
Rt. on
RedApp. Total Int. Total
Peak Hour Analysis From 04:00 PM to 06:45 PM - Peak 1 of 1Peak Hour for Entire Intersection Begins at 04:30 PM
04:30 PM 5 1 5 0 11 41 2 29 0 72 9 167 138 0 314 40 44 14 0 98 49504:45 PM 8 1 4 0 13 60 5 29 0 94 4 174 103 0 281 55 36 11 0 102 49005:00 PM 5 2 2 0 9 40 2 27 0 69 3 183 125 0 311 50 33 14 0 97 48605:15 PM 7 3 4 0 14 47 3 36 0 86 4 166 125 0 295 43 29 11 0 83 478Total Volume 25 7 15 0 47 188 12 121 0 321 20 690 491 0 1201 188 142 50 0 380 1949% App. Total 53.2 14.9 31.9 0 58.6 3.7 37.7 0 1.7 57.5 40.9 0 49.5 37.4 13.2 0
PHF .781 .583 .750 .000 .839 .783 .600 .840 .000 .854 .556 .943 .889 .000 .956 .855 .807 .893 .000 .931 .984Typical Vehicles
% Typical Vehicles 92.0 85.7 100 0 93.6 89.4 100 97.5 0 92.8 100 97.0 95.7 0 96.5 100 90.1 96.0 0 95.8 95.7Heavy Duty Vehicles
% Heavy Duty Vehicles 8.0 14.3 0 0 6.4 10.6 0 2.5 0 7.2 0 3.0 4.3 0 3.5 0 9.9 4.0 0 4.2 4.3

File Name : Irvine & Mobile_AMSite Code : 17240010Start Date : 11/1/2017Page No : 1
Irvine Street and Mobile Street
Groups Printed- Pedestrians and BicyclesIrvine StreetEastbound
Irvine StreetWestbound Northbound
Mobile StreetSouthbound
Start Time Left Thru Right Peds App. Total Left Thru Right Peds App. Total Left Thru Right Peds App. Total Left Thru Right Peds App. Total Int. Total
06:30 AM 0 0 0 0 0 0 1 0 0 1 0 0 0 0 0 0 0 0 0 0 106:45 AM 0 0 0 0 0 0 0 0 0 0 0 0 0 0 0 0 0 0 0 0 0
Total 0 0 0 0 0 0 1 0 0 1 0 0 0 0 0 0 0 0 0 0 1
07:00 AM 0 0 0 0 0 0 0 0 0 0 0 0 0 0 0 0 0 0 0 0 007:15 AM 0 1 0 0 1 0 0 0 0 0 0 0 0 0 0 0 0 0 1 1 207:30 AM 0 0 0 0 0 0 0 0 0 0 0 0 0 0 0 0 0 0 1 1 107:45 AM 0 0 0 0 0 0 0 0 0 0 0 0 0 0 0 0 0 0 0 0 0
Total 0 1 0 0 1 0 0 0 0 0 0 0 0 0 0 0 0 0 2 2 3
08:00 AM 0 0 0 0 0 0 0 0 0 0 0 0 0 0 0 0 0 0 0 0 008:15 AM 0 0 0 0 0 0 0 0 0 0 0 0 0 0 0 0 0 0 0 0 008:30 AM 0 0 0 0 0 0 0 0 0 0 0 0 0 0 0 0 0 0 0 0 008:45 AM 0 0 0 0 0 0 0 0 0 0 0 0 0 0 0 0 0 0 1 1 1
Total 0 0 0 0 0 0 0 0 0 0 0 0 0 0 0 0 0 0 1 1 1
09:00 AM 0 0 0 0 0 0 0 0 0 0 0 0 0 0 0 0 0 0 0 0 009:15 AM 0 0 0 0 0 0 1 0 0 1 0 0 0 0 0 0 0 0 0 0 1
Grand Total 0 1 0 0 1 0 2 0 0 2 0 0 0 0 0 0 0 0 3 3 6Apprch % 0 100 0 0 0 100 0 0 0 0 0 0 0 0 0 100
Total % 0 16.7 0 0 16.7 0 33.3 0 0 33.3 0 0 0 0 0 0 0 0 50 50
Irvine StreetEastbound
Irvine StreetWestbound Northbound
Mobile StreetSouthbound
Start Time Left Thru Right Peds App. Total Thru Right Peds App. Total Thru Right Peds App. Total Thru Right Peds App. Total Int. Total
Peak Hour Analysis From 06:30 AM to 09:15 AM - Peak 1 of 1Peak Hour for Entire Intersection Begins at 06:30 AM
06:30 AM 0 0 0 0 0 0 1 0 0 1 0 0 0 0 0 0 0 0 0 0 106:45 AM 0 0 0 0 0 0 0 0 0 0 0 0 0 0 0 0 0 0 0 0 007:00 AM 0 0 0 0 0 0 0 0 0 0 0 0 0 0 0 0 0 0 0 0 007:15 AM 0 1 0 0 1 0 0 0 0 0 0 0 0 0 0 0 0 0 1 1 2Total Volume 0 1 0 0 1 0 1 0 0 1 0 0 0 0 0 0 0 0 1 1 3% App. Total 0 100 0 0 0 100 0 0 0 0 0 0 0 0 0 100
PHF .000 .250 .000 .000 .250 .000 .250 .000 .000 .250 .000 .000 .000 .000 .000 .000 .000 .000 .250 .250 .375

File Name : Irvine & Mobile_AMSite Code : 17240010Start Date : 11/1/2017Page No : 1
Irvine Street and Mobile Street
Groups Printed- Typical Vehicles - Heavy Duty VehiclesIrvine StreetEastbound
Irvine StreetWestbound Northbound
Mobile StreetSouthbound
Start Time Left Thru RightRt. on
RedApp. Total Left Thru Right
Rt. on
RedApp. Total Left Thru Right
Rt. on
RedApp. Total Left Thru Right
Rt. on
RedApp. Total Int. Total
06:30 AM 0 53 0 0 53 0 238 0 0 238 0 0 0 0 0 0 0 1 0 1 29206:45 AM 0 58 0 0 58 0 241 0 0 241 0 0 0 0 0 0 0 0 0 0 299
Total 0 111 0 0 111 0 479 0 0 479 0 0 0 0 0 0 0 1 0 1 591
07:00 AM 0 65 0 0 65 0 268 0 0 268 0 0 0 0 0 1 0 0 0 1 33407:15 AM 0 55 0 0 55 0 290 0 0 290 0 0 0 0 0 0 0 4 0 4 34907:30 AM 1 59 0 0 60 0 298 0 0 298 0 0 0 0 0 0 0 3 0 3 36107:45 AM 0 54 0 0 54 0 300 0 0 300 0 0 0 0 0 0 0 3 0 3 357
Total 1 233 0 0 234 0 1156 0 0 1156 0 0 0 0 0 1 0 10 0 11 1401
08:00 AM 1 67 0 0 68 0 227 0 0 227 0 0 0 0 0 0 0 2 0 2 29708:15 AM 0 56 0 0 56 0 189 0 0 189 0 0 0 0 0 0 0 0 0 0 24508:30 AM 0 45 0 0 45 0 171 0 0 171 0 0 0 0 0 0 0 2 0 2 21808:45 AM 1 46 0 0 47 0 173 0 0 173 0 0 0 0 0 0 0 0 0 0 220
Total 2 214 0 0 216 0 760 0 0 760 0 0 0 0 0 0 0 4 0 4 980
09:00 AM 0 51 0 0 51 0 127 0 0 127 0 0 0 0 0 0 0 0 0 0 17809:15 AM 0 50 0 0 50 0 105 0 0 105 0 0 0 0 0 0 0 0 0 0 155
Grand Total 3 659 0 0 662 0 2627 0 0 2627 0 0 0 0 0 1 0 15 0 16 3305Apprch % 0.5 99.5 0 0 0 100 0 0 0 0 0 0 6.2 0 93.8 0
Total % 0.1 19.9 0 0 20 0 79.5 0 0 79.5 0 0 0 0 0 0 0 0.5 0 0.5Typical Vehicles 2515
% Typical Vehicles 33.3 85.1 0 0 84.9 0 95.7 0 0 95.7 0 0 0 0 0 100 0 86.7 0 87.5 93.5Heavy Duty Vehicles
% Heavy Duty Vehicles 66.7 14.9 0 0 15.1 0 4.3 0 0 4.3 0 0 0 0 0 0 0 13.3 0 12.5 6.5
Irvine StreetEastbound
Irvine StreetWestbound Northbound
Mobile StreetSouthbound
Start Time Left Thru RightRt. on
RedApp. Total Left Thru Right
Rt. on
RedApp. Total Left Thru Right
Rt. on
RedApp. Total Left Thru Right
Rt. on
RedApp. Total Int. Total
Peak Hour Analysis From 06:30 AM to 09:15 AM - Peak 1 of 1Peak Hour for Entire Intersection Begins at 07:00 AM
07:00 AM 0 65 0 0 65 0 268 0 0 268 0 0 0 0 0 1 0 0 0 1 33407:15 AM 0 55 0 0 55 0 290 0 0 290 0 0 0 0 0 0 0 4 0 4 34907:30 AM 1 59 0 0 60 0 298 0 0 298 0 0 0 0 0 0 0 3 0 3 36107:45 AM 0 54 0 0 54 0 300 0 0 300 0 0 0 0 0 0 0 3 0 3 357Total Volume 1 233 0 0 234 0 1156 0 0 1156 0 0 0 0 0 1 0 10 0 11 1401% App. Total 0.4 99.6 0 0 0 100 0 0 0 0 0 0 9.1 0 90.9 0
PHF .250 .896 .000 .000 .900 .000 .963 .000 .000 .963 .000 .000 .000 .000 .000 .250 .000 .625 .000 .688 .970Typical Vehicles 1117
% Typical Vehicles 0 90.1 0 0 89.7 0 96.6 0 0 96.6 0 0 0 0 0 100 0 90.0 0 90.9 95.4Heavy Duty Vehicles
% Heavy Duty Vehicles 100 9.9 0 0 10.3 0 3.4 0 0 3.4 0 0 0 0 0 0 0 10.0 0 9.1 4.6

File Name : Irvine & Mobile_PMSite Code : 17240010Start Date : 11/2/2017Page No : 1
Irvine Street and Mobile Street
Groups Printed- Pedestrians and BicyclesIrvine StreetEastbound
Irvine StreetWestbound Northbound
Mobile StreetSouthbound
Start Time Left Thru Right Peds App. Total Left Thru Right Peds App. Total Left Thru Right Peds App. Total Left Thru Right Peds App. Total Int. Total
04:00 PM 0 0 0 0 0 0 0 0 0 0 0 0 0 0 0 0 0 0 0 0 004:15 PM 0 0 0 0 0 0 0 0 0 0 0 0 0 0 0 0 0 0 0 0 004:30 PM 0 0 0 1 1 0 0 0 0 0 0 0 0 0 0 0 0 0 0 0 104:45 PM 0 0 0 0 0 0 0 0 0 0 0 0 0 0 0 0 0 0 0 0 0
Total 0 0 0 1 1 0 0 0 0 0 0 0 0 0 0 0 0 0 0 0 1
05:00 PM 0 0 0 0 0 0 0 0 0 0 0 0 0 0 0 0 0 0 0 0 005:15 PM 0 0 0 1 1 0 0 0 0 0 0 0 0 0 0 0 0 0 0 0 105:30 PM 0 0 0 0 0 0 0 0 0 0 0 0 0 0 0 0 0 0 0 0 005:45 PM 0 0 0 0 0 0 0 0 0 0 0 0 0 0 0 0 0 0 0 0 0
Total 0 0 0 1 1 0 0 0 0 0 0 0 0 0 0 0 0 0 0 0 1
06:00 PM 0 0 0 0 0 0 0 0 0 0 0 0 0 0 0 0 0 0 1 1 106:15 PM 0 0 0 0 0 0 0 0 0 0 0 0 0 0 0 0 0 0 0 0 006:30 PM 0 0 0 0 0 0 0 0 0 0 0 0 0 0 0 0 0 0 0 0 006:45 PM 0 0 0 0 0 0 0 0 0 0 0 0 0 0 0 0 0 0 0 0 0
Total 0 0 0 0 0 0 0 0 0 0 0 0 0 0 0 0 0 0 1 1 1
Grand Total 0 0 0 2 2 0 0 0 0 0 0 0 0 0 0 0 0 0 1 1 3Apprch % 0 0 0 100 0 0 0 0 0 0 0 0 0 0 0 100
Total % 0 0 0 66.7 66.7 0 0 0 0 0 0 0 0 0 0 0 0 0 33.3 33.3
Irvine StreetEastbound
Irvine StreetWestbound Northbound
Mobile StreetSouthbound
Start Time Left Thru Right Peds App. Total Thru Right Peds App. Total Thru Right Peds App. Total Thru Right Peds App. Total Int. Total
Peak Hour Analysis From 04:00 PM to 06:45 PM - Peak 1 of 1Peak Hour for Entire Intersection Begins at 04:30 PM
04:30 PM 0 0 0 1 1 0 0 0 0 0 0 0 0 0 0 0 0 0 0 0 104:45 PM 0 0 0 0 0 0 0 0 0 0 0 0 0 0 0 0 0 0 0 0 005:00 PM 0 0 0 0 0 0 0 0 0 0 0 0 0 0 0 0 0 0 0 0 005:15 PM 0 0 0 1 1 0 0 0 0 0 0 0 0 0 0 0 0 0 0 0 1Total Volume 0 0 0 2 2 0 0 0 0 0 0 0 0 0 0 0 0 0 0 0 2% App. Total 0 0 0 100 0 0 0 0 0 0 0 0 0 0 0 0
PHF .000 .000 .000 .500 .500 .000 .000 .000 .000 .000 .000 .000 .000 .000 .000 .000 .000 .000 .000 .000 .500
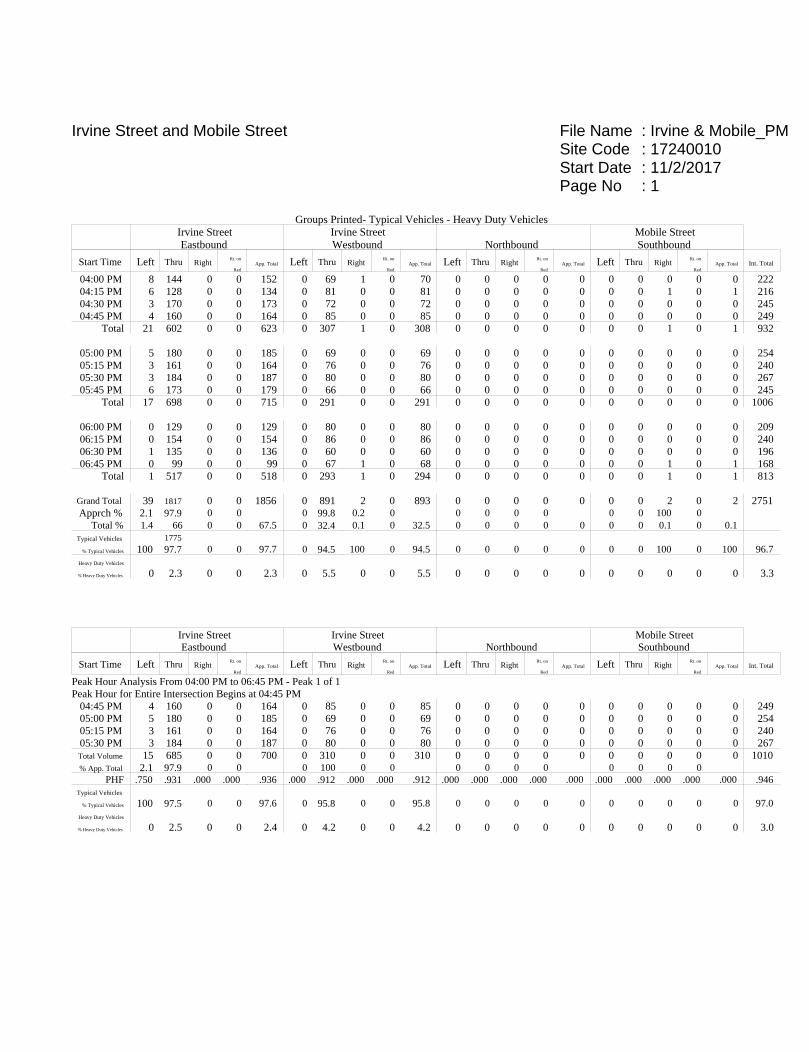
File Name : Irvine & Mobile_PMSite Code : 17240010Start Date : 11/2/2017Page No : 1
Irvine Street and Mobile Street
Groups Printed- Typical Vehicles - Heavy Duty VehiclesIrvine StreetEastbound
Irvine StreetWestbound Northbound
Mobile StreetSouthbound
Start Time Left Thru RightRt. on
RedApp. Total Left Thru Right
Rt. on
RedApp. Total Left Thru Right
Rt. on
RedApp. Total Left Thru Right
Rt. on
RedApp. Total Int. Total
04:00 PM 8 144 0 0 152 0 69 1 0 70 0 0 0 0 0 0 0 0 0 0 22204:15 PM 6 128 0 0 134 0 81 0 0 81 0 0 0 0 0 0 0 1 0 1 21604:30 PM 3 170 0 0 173 0 72 0 0 72 0 0 0 0 0 0 0 0 0 0 24504:45 PM 4 160 0 0 164 0 85 0 0 85 0 0 0 0 0 0 0 0 0 0 249
Total 21 602 0 0 623 0 307 1 0 308 0 0 0 0 0 0 0 1 0 1 932
05:00 PM 5 180 0 0 185 0 69 0 0 69 0 0 0 0 0 0 0 0 0 0 25405:15 PM 3 161 0 0 164 0 76 0 0 76 0 0 0 0 0 0 0 0 0 0 24005:30 PM 3 184 0 0 187 0 80 0 0 80 0 0 0 0 0 0 0 0 0 0 26705:45 PM 6 173 0 0 179 0 66 0 0 66 0 0 0 0 0 0 0 0 0 0 245
Total 17 698 0 0 715 0 291 0 0 291 0 0 0 0 0 0 0 0 0 0 1006
06:00 PM 0 129 0 0 129 0 80 0 0 80 0 0 0 0 0 0 0 0 0 0 20906:15 PM 0 154 0 0 154 0 86 0 0 86 0 0 0 0 0 0 0 0 0 0 24006:30 PM 1 135 0 0 136 0 60 0 0 60 0 0 0 0 0 0 0 0 0 0 19606:45 PM 0 99 0 0 99 0 67 1 0 68 0 0 0 0 0 0 0 1 0 1 168
Total 1 517 0 0 518 0 293 1 0 294 0 0 0 0 0 0 0 1 0 1 813
Grand Total 39 1817 0 0 1856 0 891 2 0 893 0 0 0 0 0 0 0 2 0 2 2751Apprch % 2.1 97.9 0 0 0 99.8 0.2 0 0 0 0 0 0 0 100 0
Total % 1.4 66 0 0 67.5 0 32.4 0.1 0 32.5 0 0 0 0 0 0 0 0.1 0 0.1Typical Vehicles 1775
% Typical Vehicles 100 97.7 0 0 97.7 0 94.5 100 0 94.5 0 0 0 0 0 0 0 100 0 100 96.7Heavy Duty Vehicles
% Heavy Duty Vehicles 0 2.3 0 0 2.3 0 5.5 0 0 5.5 0 0 0 0 0 0 0 0 0 0 3.3
Irvine StreetEastbound
Irvine StreetWestbound Northbound
Mobile StreetSouthbound
Start Time Left Thru RightRt. on
RedApp. Total Left Thru Right
Rt. on
RedApp. Total Left Thru Right
Rt. on
RedApp. Total Left Thru Right
Rt. on
RedApp. Total Int. Total
Peak Hour Analysis From 04:00 PM to 06:45 PM - Peak 1 of 1Peak Hour for Entire Intersection Begins at 04:45 PM
04:45 PM 4 160 0 0 164 0 85 0 0 85 0 0 0 0 0 0 0 0 0 0 24905:00 PM 5 180 0 0 185 0 69 0 0 69 0 0 0 0 0 0 0 0 0 0 25405:15 PM 3 161 0 0 164 0 76 0 0 76 0 0 0 0 0 0 0 0 0 0 24005:30 PM 3 184 0 0 187 0 80 0 0 80 0 0 0 0 0 0 0 0 0 0 267Total Volume 15 685 0 0 700 0 310 0 0 310 0 0 0 0 0 0 0 0 0 0 1010% App. Total 2.1 97.9 0 0 0 100 0 0 0 0 0 0 0 0 0 0
PHF .750 .931 .000 .000 .936 .000 .912 .000 .000 .912 .000 .000 .000 .000 .000 .000 .000 .000 .000 .000 .946Typical Vehicles
% Typical Vehicles 100 97.5 0 0 97.6 0 95.8 0 0 95.8 0 0 0 0 0 0 0 0 0 0 97.0Heavy Duty Vehicles
% Heavy Duty Vehicles 0 2.5 0 0 2.4 0 4.2 0 0 4.2 0 0 0 0 0 0 0 0 0 0 3.0

Whitman, Requardt, and Associates, LLP2009 MacKenzie Way
Suite 240Cranberry Twp, Pennsylvania, United States 16066
724-779-7940 [email protected] Focused - Project Driven
Count Name: SR 885 and Brady StSite Code:Start Date: 11/14/2018Page No: 1
Turning Movement Data
Start Time
2nd Ave 2nd Ave Private Drwy Brady St
Westbound Eastbound Southbound Northbound
Left Thru Right Peds App. Total Left Thru Right Peds App. Total Left Thru Right Peds App. Total Left Thru Right Peds App. Total Int. Total
7:00 AM 2 159 3 0 164 15 134 0 0 149 57 1 3 0 61 0 0 0 0 0 374
7:15 AM 0 153 5 0 158 6 122 0 0 128 55 2 4 0 61 0 0 0 0 0 347
7:30 AM 2 188 7 0 197 5 102 0 0 107 47 0 4 0 51 1 0 1 0 2 357
7:45 AM 5 162 4 0 171 14 107 0 0 121 61 1 6 0 68 0 1 0 0 1 361
Hourly Total 9 662 19 0 690 40 465 0 0 505 220 4 17 0 241 1 1 1 0 3 1439
8:00 AM 0 167 4 0 171 12 120 0 0 132 42 0 3 0 45 2 0 4 0 6 354
8:15 AM 1 151 6 0 158 11 105 0 0 116 54 0 6 0 60 2 0 0 0 2 336
8:30 AM 3 111 4 0 118 15 104 0 0 119 57 0 3 0 60 1 0 1 0 2 299
8:45 AM 3 124 4 0 131 15 112 0 0 127 51 0 9 0 60 0 0 5 0 5 323
Hourly Total 7 553 18 0 578 53 441 0 0 494 204 0 21 0 225 5 0 10 0 15 1312
*** BREAK *** - - - - - - - - - - - - - - - - - - - - -
3:00 PM 0 108 7 0 115 16 178 0 0 194 108 0 5 0 113 0 0 1 0 1 423
3:15 PM 0 118 16 0 134 13 184 0 0 197 84 0 6 0 90 2 0 2 0 4 425
3:30 PM 0 138 12 0 150 22 186 2 0 210 122 0 4 0 126 0 0 4 0 4 490
3:45 PM 0 149 4 0 153 16 216 0 1 232 98 0 3 1 101 2 0 0 0 2 488
Hourly Total 0 513 39 0 552 67 764 2 1 833 412 0 18 1 430 4 0 7 0 11 1826
4:00 PM 0 113 17 0 130 16 224 0 0 240 118 0 2 0 120 1 0 0 0 1 491
4:15 PM 0 145 8 0 153 26 220 0 1 246 122 1 1 0 124 0 0 0 0 0 523
4:30 PM 0 115 5 0 120 17 238 0 0 255 130 0 2 0 132 1 0 0 0 1 508
4:45 PM 0 78 9 0 87 24 220 0 0 244 115 0 2 0 117 0 0 0 1 0 448
Hourly Total 0 451 39 0 490 83 902 0 1 985 485 1 7 0 493 2 0 0 1 2 1970
5:00 PM 0 99 12 0 111 19 233 0 0 252 126 0 2 0 128 0 0 1 0 1 492
5:15 PM 0 88 10 0 98 29 239 0 0 268 125 0 4 0 129 0 0 0 0 0 495
5:30 PM 0 86 16 0 102 20 256 0 0 276 82 0 6 0 88 0 0 0 0 0 466
5:45 PM 0 79 13 0 92 23 186 0 0 209 75 0 2 0 77 0 0 0 0 0 378
Hourly Total 0 352 51 0 403 91 914 0 0 1005 408 0 14 0 422 0 0 1 0 1 1831
6:00 PM 0 71 8 0 79 15 180 0 0 195 66 0 2 0 68 0 0 0 0 0 342
6:15 PM 0 73 6 0 79 13 167 0 0 180 63 0 9 0 72 0 0 0 0 0 331
6:30 PM 0 67 6 0 73 4 138 0 0 142 49 0 1 0 50 0 0 0 0 0 265
6:45 PM 0 49 4 0 53 20 111 0 0 131 38 0 3 0 41 0 0 0 0 0 225
Hourly Total 0 260 24 0 284 52 596 0 0 648 216 0 15 0 231 0 0 0 0 0 1163
7:00 PM 0 0 0 0 0 1 1 0 0 2 0 0 0 0 0 0 0 0 0 0 2
Grand Total 16 2791 190 0 2997 387 4083 2 2 4472 1945 5 92 1 2042 12 1 19 1 32 9543
Approach % 0.5 93.1 6.3 - - 8.7 91.3 0.0 - - 95.2 0.2 4.5 - - 37.5 3.1 59.4 - - -
Total % 0.2 29.2 2.0 - 31.4 4.1 42.8 0.0 - 46.9 20.4 0.1 1.0 - 21.4 0.1 0.0 0.2 - 0.3 -
Lights 2 2658 188 - 2848 383 3920 1 - 4304 1881 4 88 - 1973 7 0 4 - 11 9136
% Lights 12.5 95.2 98.9 - 95.0 99.0 96.0 50.0 - 96.2 96.7 80.0 95.7 - 96.6 58.3 0.0 21.1 - 34.4 95.7

Bicycles on Road 0 0 0 - 0 0 0 0 - 0 0 0 0 - 0 0 0 0 - 0 0
% Bicycles on Road 0.0 0.0 0.0 - 0.0 0.0 0.0 0.0 - 0.0 0.0 0.0 0.0 - 0.0 0.0 0.0 0.0 - 0.0 0.0
All Pedestrians - - - 0 - - - - 2 - - - - 1 - - - - 1 - -
% All Pedestrians - - - - - - - - 100.0 - - - - 100.0 - - - - 100.0 - -
Trucks 14 133 2 - 149 4 163 1 - 168 64 1 4 - 69 5 1 15 - 21 407
% Trucks 87.5 4.8 1.1 - 5.0 1.0 4.0 50.0 - 3.8 3.3 20.0 4.3 - 3.4 41.7 100.0 78.9 - 65.6 4.3
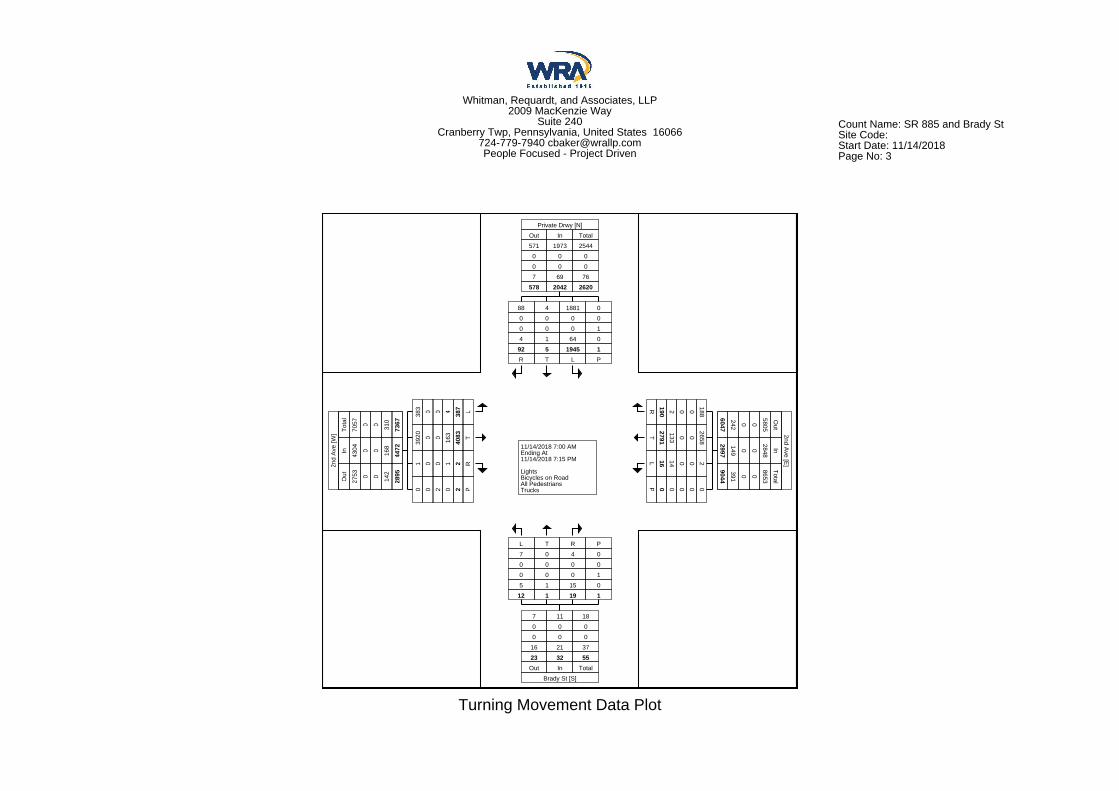
Whitman, Requardt, and Associates, LLP2009 MacKenzie Way
Suite 240Cranberry Twp, Pennsylvania, United States 16066
724-779-7940 [email protected] Focused - Project Driven
Count Name: SR 885 and Brady StSite Code:Start Date: 11/14/2018Page No: 3
11/14/2018 7:00 AMEnding At11/14/2018 7:15 PM
LightsBicycles on RoadAll PedestriansTrucks
Private Drwy [N]
Out In Total
571 1973 2544
0 0 0
0 0 0
7 69 76
578 2042 2620
88 4 1881 0
0 0 0 0
0 0 0 1
4 1 64 0
92 5 1945 1R T L P
6047242 0 0
5805
Out
2997149 0 0
2848
In
9044391 0 0
8653
Total
2nd Ave [E
]
R 190 2 0 0 188
T2791133 0 0
2658
L 16 14 0 0 2
P 0 0 0 0 0
7 11 18
0 0 0
0 0 0
16 21 37
23 32 55Out In Total
Brady St [S]
L T R P
7 0 4 0
0 0 0 0
0 0 0 1
5 1 15 0
12 1 19 1
2nd
Ave
[W] To
tal
7057 0 0 310
7367
In
4304 0 0 168
4472
Out
2753 0 0 142
2895
383 0 0 4 387 L
3920 0 0 163
4083 T
1 0 0 1 2 R
0 0 2 0 2 P
Turning Movement Data Plot

Whitman, Requardt, and Associates, LLP2009 MacKenzie Way
Suite 240Cranberry Twp, Pennsylvania, United States 16066
724-779-7940 [email protected] Focused - Project Driven
Count Name: SR 885 and Brady StSite Code:Start Date: 11/14/2018Page No: 4
Turning Movement Peak Hour Data (7:00 AM)
Start Time
2nd Ave 2nd Ave Private Drwy Brady St
Westbound Eastbound Southbound Northbound
Left Thru Right Peds App. Total Left Thru Right Peds App. Total Left Thru Right Peds App. Total Left Thru Right Peds App. Total Int. Total
7:00 AM 2 159 3 0 164 15 134 0 0 149 57 1 3 0 61 0 0 0 0 0 374
7:15 AM 0 153 5 0 158 6 122 0 0 128 55 2 4 0 61 0 0 0 0 0 347
7:30 AM 2 188 7 0 197 5 102 0 0 107 47 0 4 0 51 1 0 1 0 2 357
7:45 AM 5 162 4 0 171 14 107 0 0 121 61 1 6 0 68 0 1 0 0 1 361
Total 9 662 19 0 690 40 465 0 0 505 220 4 17 0 241 1 1 1 0 3 1439
Approach % 1.3 95.9 2.8 - - 7.9 92.1 0.0 - - 91.3 1.7 7.1 - - 33.3 33.3 33.3 - - -
Total % 0.6 46.0 1.3 - 47.9 2.8 32.3 0.0 - 35.1 15.3 0.3 1.2 - 16.7 0.1 0.1 0.1 - 0.2 -
PHF 0.450 0.880 0.679 - 0.876 0.667 0.868 0.000 - 0.847 0.902 0.500 0.708 - 0.886 0.250 0.250 0.250 - 0.375 0.962
Lights 1 637 19 - 657 40 437 0 - 477 203 3 16 - 222 0 0 1 - 1 1357
% Lights 11.1 96.2 100.0 - 95.2 100.0 94.0 - - 94.5 92.3 75.0 94.1 - 92.1 0.0 0.0 100.0 - 33.3 94.3
Bicycles on Road 0 0 0 - 0 0 0 0 - 0 0 0 0 - 0 0 0 0 - 0 0
% Bicycles on Road 0.0 0.0 0.0 - 0.0 0.0 0.0 - - 0.0 0.0 0.0 0.0 - 0.0 0.0 0.0 0.0 - 0.0 0.0
All Pedestrians - - - 0 - - - - 0 - - - - 0 - - - - 0 - -
% All Pedestrians - - - - - - - - - - - - - - - - - - - - -
Trucks 8 25 0 - 33 0 28 0 - 28 17 1 1 - 19 1 1 0 - 2 82
% Trucks 88.9 3.8 0.0 - 4.8 0.0 6.0 - - 5.5 7.7 25.0 5.9 - 7.9 100.0 100.0 0.0 - 66.7 5.7
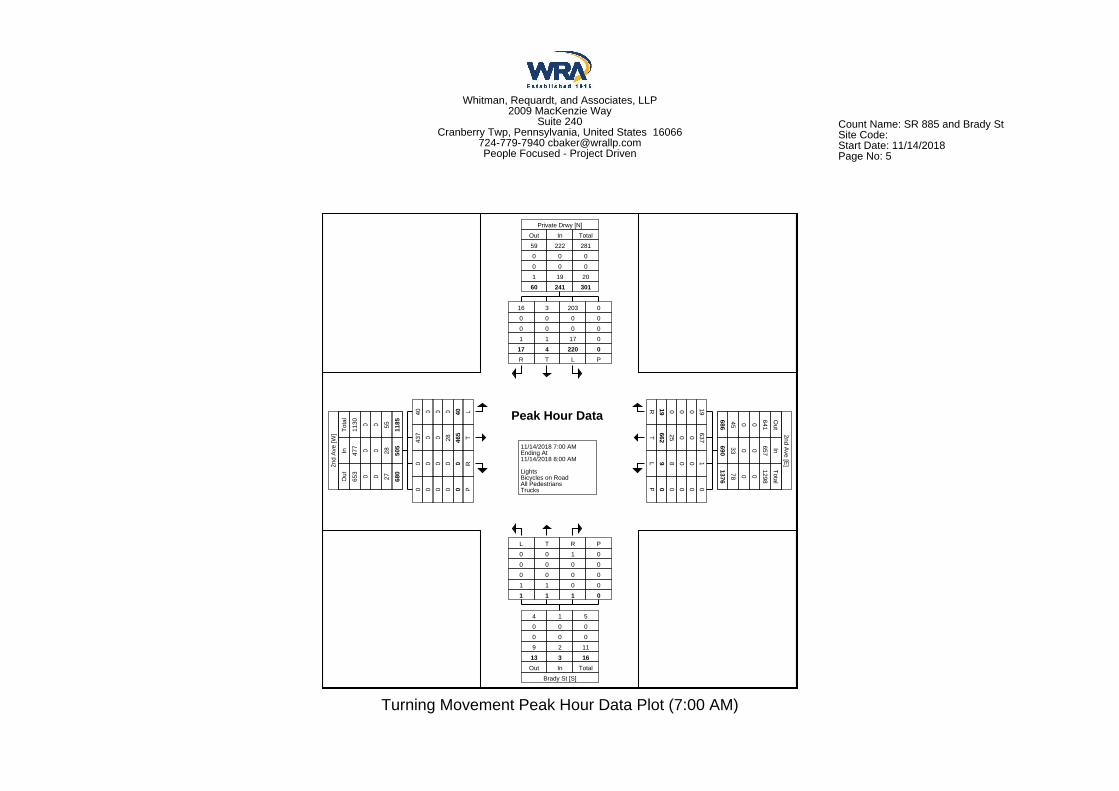
Whitman, Requardt, and Associates, LLP2009 MacKenzie Way
Suite 240Cranberry Twp, Pennsylvania, United States 16066
724-779-7940 [email protected] Focused - Project Driven
Count Name: SR 885 and Brady StSite Code:Start Date: 11/14/2018Page No: 5
Peak Hour Data
11/14/2018 7:00 AMEnding At11/14/2018 8:00 AM
LightsBicycles on RoadAll PedestriansTrucks
Private Drwy [N]
Out In Total
59 222 281
0 0 0
0 0 0
1 19 20
60 241 301
16 3 203 0
0 0 0 0
0 0 0 0
1 1 17 0
17 4 220 0R T L P
68645 0 0 641
Out
69033 0 0 657
In
137678 0 0
1298
Total
2nd Ave [E
]
R 19 0 0 0 19
T 66225 0 0 637
L 9 8 0 0 1
P 0 0 0 0 0
4 1 5
0 0 0
0 0 0
9 2 11
13 3 16Out In Total
Brady St [S]
L T R P
0 0 1 0
0 0 0 0
0 0 0 0
1 1 0 0
1 1 1 0
2nd
Ave
[W] To
tal
1130 0 0 55 1185
In 477 0 0 28 505
Out
653 0 0 27 680
40 0 0 0 40 L
437 0 0 28 465 T
0 0 0 0 0 R
0 0 0 0 0 P
Turning Movement Peak Hour Data Plot (7:00 AM)

Whitman, Requardt, and Associates, LLP2009 MacKenzie Way
Suite 240Cranberry Twp, Pennsylvania, United States 16066
724-779-7940 [email protected] Focused - Project Driven
Count Name: SR 885 and Brady StSite Code:Start Date: 11/14/2018Page No: 6
Turning Movement Peak Hour Data (3:45 PM)
Start Time
2nd Ave 2nd Ave Private Drwy Brady St
Westbound Eastbound Southbound Northbound
Left Thru Right Peds App. Total Left Thru Right Peds App. Total Left Thru Right Peds App. Total Left Thru Right Peds App. Total Int. Total
3:45 PM 0 149 4 0 153 16 216 0 1 232 98 0 3 1 101 2 0 0 0 2 488
4:00 PM 0 113 17 0 130 16 224 0 0 240 118 0 2 0 120 1 0 0 0 1 491
4:15 PM 0 145 8 0 153 26 220 0 1 246 122 1 1 0 124 0 0 0 0 0 523
4:30 PM 0 115 5 0 120 17 238 0 0 255 130 0 2 0 132 1 0 0 0 1 508
Total 0 522 34 0 556 75 898 0 2 973 468 1 8 1 477 4 0 0 0 4 2010
Approach % 0.0 93.9 6.1 - - 7.7 92.3 0.0 - - 98.1 0.2 1.7 - - 100.0 0.0 0.0 - - -
Total % 0.0 26.0 1.7 - 27.7 3.7 44.7 0.0 - 48.4 23.3 0.0 0.4 - 23.7 0.2 0.0 0.0 - 0.2 -
PHF 0.000 0.876 0.500 - 0.908 0.721 0.943 0.000 - 0.954 0.900 0.250 0.667 - 0.903 0.500 0.000 0.000 - 0.500 0.961
Lights 0 495 34 - 529 75 873 0 - 948 462 1 8 - 471 4 0 0 - 4 1952
% Lights - 94.8 100.0 - 95.1 100.0 97.2 - - 97.4 98.7 100.0 100.0 - 98.7 100.0 - - - 100.0 97.1
Bicycles on Road 0 0 0 - 0 0 0 0 - 0 0 0 0 - 0 0 0 0 - 0 0
% Bicycles on Road - 0.0 0.0 - 0.0 0.0 0.0 - - 0.0 0.0 0.0 0.0 - 0.0 0.0 - - - 0.0 0.0
All Pedestrians - - - 0 - - - - 2 - - - - 1 - - - - 0 - -
% All Pedestrians - - - - - - - - 100.0 - - - - 100.0 - - - - - - -
Trucks 0 27 0 - 27 0 25 0 - 25 6 0 0 - 6 0 0 0 - 0 58
% Trucks - 5.2 0.0 - 4.9 0.0 2.8 - - 2.6 1.3 0.0 0.0 - 1.3 0.0 - - - 0.0 2.9

Whitman, Requardt, and Associates, LLP2009 MacKenzie Way
Suite 240Cranberry Twp, Pennsylvania, United States 16066
724-779-7940 [email protected] Focused - Project Driven
Count Name: SR 885 and Brady StSite Code:Start Date: 11/14/2018Page No: 7
Peak Hour Data
11/14/2018 3:45 PMEnding At11/14/2018 4:45 PM
LightsBicycles on RoadAll PedestriansTrucks
Private Drwy [N]
Out In Total
109 471 580
0 0 0
0 0 0
0 6 6
109 477 586
8 1 462 0
0 0 0 0
0 0 0 1
0 0 6 0
8 1 468 1R T L P
136631 0 0
1335
Out
55627 0 0 529
In
192258 0 0
1864
Total
2nd Ave [E
]
R 34 0 0 0 34
T 52227 0 0 495
L 0 0 0 0 0
P 0 0 0 0 0
1 4 5
0 0 0
0 0 0
0 0 0
1 4 5Out In Total
Brady St [S]
L T R P
4 0 0 0
0 0 0 0
0 0 0 0
0 0 0 0
4 0 0 0
2nd
Ave
[W] To
tal
1455 0 0 52 1507
In 948 0 0 25 973
Out
507 0 0 27 534
75 0 0 0 75 L
873 0 0 25 898 T
0 0 0 0 0 R
0 0 2 0 2 P
Turning Movement Peak Hour Data Plot (3:45 PM)

Whitman, Requardt, and Associates, LLP2009 MacKenzie Way
Suite 240Cranberry Twp, Pennsylvania, United States 16066
724-779-7940 [email protected] Focused - Project Driven
Count Name: SR 885 and Brady StSite Code:Start Date: 11/14/2018Page No: 8

Whitman, Requardt, and Associates, LLP2009 MacKenzie Way
Suite 240Cranberry Twp, Pennsylvania, United States 16066
724-779-7940 [email protected] Focused - Project Driven
Count Name: SR 885 and Middle Access DrSite Code:Start Date: 11/14/2018Page No: 1
Turning Movement Data
Start Time
2nd Ave 2nd Ave Middle Access Dr
Westbound Eastbound Northbound
Left Thru Peds App. Total Thru Right Peds App. Total Left Right Peds App. Total Int. Total
7:00 AM 5 168 0 173 158 5 0 163 0 0 0 0 336
7:15 AM 6 160 0 166 142 5 0 147 2 1 0 3 316
7:30 AM 4 215 0 219 128 2 0 130 2 0 3 2 351
7:45 AM 1 179 1 180 147 4 0 151 2 1 0 3 334
Hourly Total 16 722 1 738 575 16 0 591 6 2 3 8 1337
8:00 AM 4 184 1 188 124 10 0 134 1 0 2 1 323
8:15 AM 4 155 1 159 122 8 0 130 4 1 0 5 294
8:30 AM 4 137 0 141 129 6 0 135 0 0 0 0 276
8:45 AM 3 144 2 147 142 3 0 145 0 1 4 1 293
Hourly Total 15 620 4 635 517 27 0 544 5 2 6 7 1186
9:00 AM 0 0 0 0 0 0 0 0 0 0 0 0 0
*** BREAK *** - - - - - - - - - - - - -
Hourly Total 0 0 0 0 0 0 0 0 0 0 0 0 0
3:00 PM 2 87 4 89 294 2 0 296 5 6 0 11 396
3:15 PM 3 106 0 109 276 1 0 277 8 2 0 10 396
3:30 PM 0 102 0 102 313 2 0 315 7 1 0 8 425
3:45 PM 1 127 0 128 308 3 0 311 4 2 0 6 445
Hourly Total 6 422 4 428 1191 8 0 1199 24 11 0 35 1662
4:00 PM 2 83 1 85 325 3 0 328 8 0 0 8 421
4:15 PM 1 119 3 120 348 4 0 352 6 2 0 8 480
4:30 PM 1 109 1 110 349 5 0 354 4 2 0 6 470
4:45 PM 2 77 1 79 325 5 0 330 5 0 1 5 414
Hourly Total 6 388 6 394 1347 17 0 1364 23 4 1 27 1785
5:00 PM 2 84 1 86 348 3 0 351 7 3 0 10 447
5:15 PM 1 89 2 90 341 7 0 348 4 2 0 6 444
5:30 PM 3 79 0 82 313 8 0 321 8 1 0 9 412
5:45 PM 3 78 0 81 270 1 0 271 2 4 0 6 358
Hourly Total 9 330 3 339 1272 19 0 1291 21 10 0 31 1661
6:00 PM 1 68 2 69 244 1 0 245 5 2 0 7 321
6:15 PM 1 78 0 79 228 0 0 228 5 1 0 6 313
6:30 PM 3 57 0 60 184 2 0 186 3 4 0 7 253
6:45 PM 1 47 0 48 157 1 0 158 1 2 0 3 209
Hourly Total 6 250 2 256 813 4 0 817 14 9 0 23 1096
7:00 PM 0 0 0 0 0 0 0 0 0 0 0 0 0
Grand Total 58 2732 20 2790 5715 91 0 5806 93 38 10 131 8727
Approach % 2.1 97.9 - - 98.4 1.6 - - 71.0 29.0 - - -
Total % 0.7 31.3 - 32.0 65.5 1.0 - 66.5 1.1 0.4 - 1.5 -

Lights 50 2581 - 2631 5489 91 - 5580 93 38 - 131 8342
% Lights 86.2 94.5 - 94.3 96.0 100.0 - 96.1 100.0 100.0 - 100.0 95.6
Bicycles on Road 0 0 - 0 0 0 - 0 0 0 - 0 0
% Bicycles on Road 0.0 0.0 - 0.0 0.0 0.0 - 0.0 0.0 0.0 - 0.0 0.0
All Pedestrians - - 20 - - - 0 - - - 10 - -
% All Pedestrians - - 100.0 - - - - - - - 100.0 - -
Trucks 8 151 - 159 226 0 - 226 0 0 - 0 385
% Trucks 13.8 5.5 - 5.7 4.0 0.0 - 3.9 0.0 0.0 - 0.0 4.4
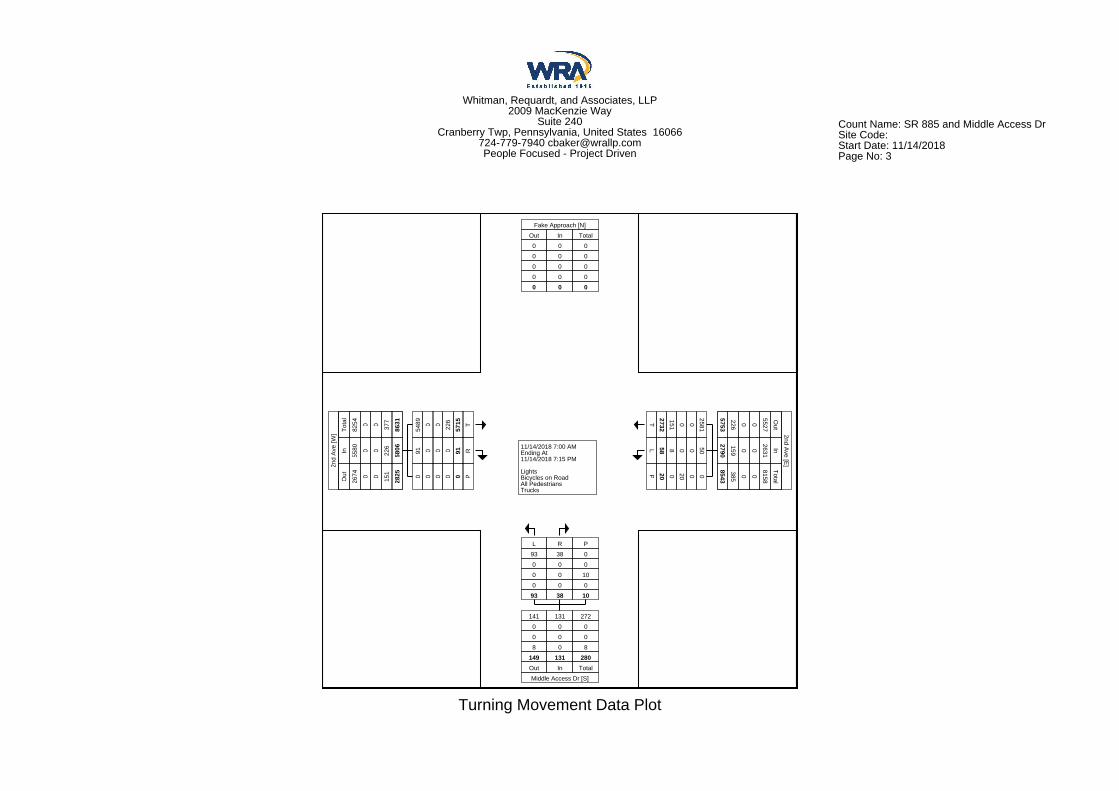
Whitman, Requardt, and Associates, LLP2009 MacKenzie Way
Suite 240Cranberry Twp, Pennsylvania, United States 16066
724-779-7940 [email protected] Focused - Project Driven
Count Name: SR 885 and Middle Access DrSite Code:Start Date: 11/14/2018Page No: 3
11/14/2018 7:00 AMEnding At11/14/2018 7:15 PM
LightsBicycles on RoadAll PedestriansTrucks
Fake Approach [N]
Out In Total
0 0 0
0 0 0
0 0 0
0 0 0
0 0 0
5753226 0 0
5527
Out
2790159 0 0
2631
In
8543385 0 0
8158
Total
2nd Ave [E
]
T2732151 0 0
2581
L 58 8 0 0 50
P 20 0 20 0 0
141 131 272
0 0 0
0 0 0
8 0 8
149 131 280Out In Total
Middle Access Dr [S]
L R P
93 38 0
0 0 0
0 0 10
0 0 0
93 38 10
2nd
Ave
[W] To
tal
8254 0 0 377
8631
In
5580 0 0 226
5806
Out
2674 0 0 151
2825
5489 0 0 226
5715 T
91 0 0 0 91 R
0 0 0 0 0 P
Turning Movement Data Plot
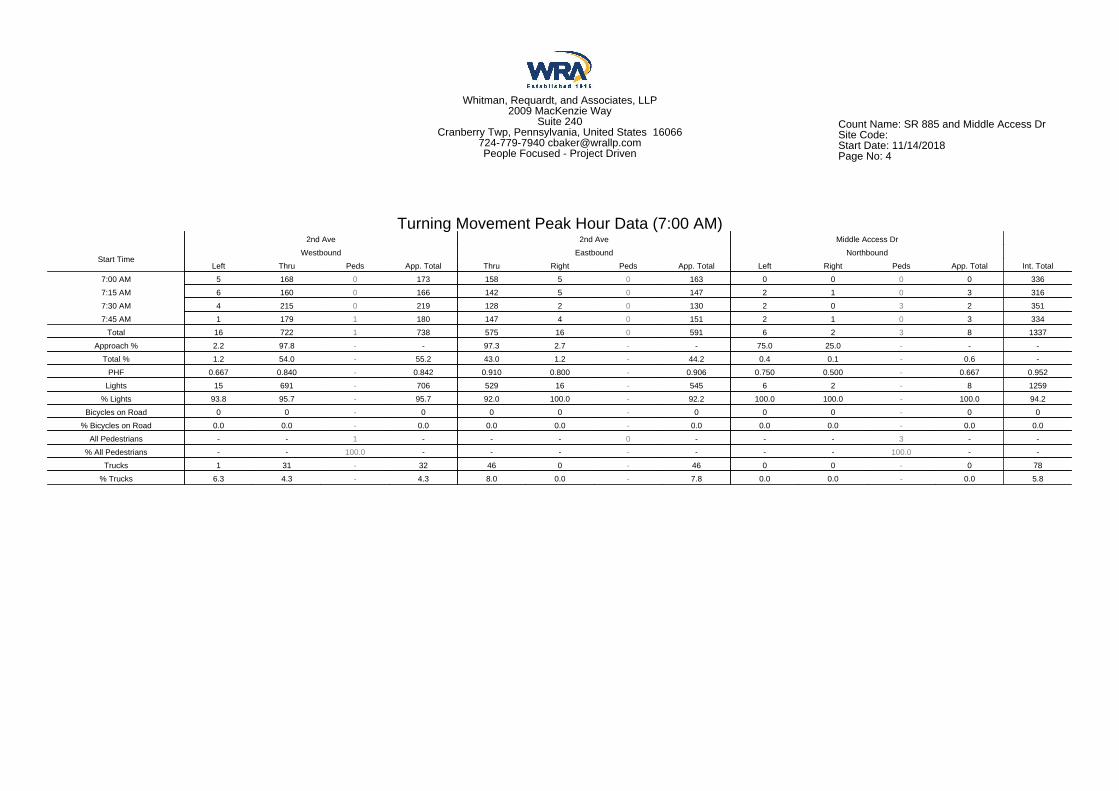
Whitman, Requardt, and Associates, LLP2009 MacKenzie Way
Suite 240Cranberry Twp, Pennsylvania, United States 16066
724-779-7940 [email protected] Focused - Project Driven
Count Name: SR 885 and Middle Access DrSite Code:Start Date: 11/14/2018Page No: 4
Turning Movement Peak Hour Data (7:00 AM)
Start Time
2nd Ave 2nd Ave Middle Access Dr
Westbound Eastbound Northbound
Left Thru Peds App. Total Thru Right Peds App. Total Left Right Peds App. Total Int. Total
7:00 AM 5 168 0 173 158 5 0 163 0 0 0 0 336
7:15 AM 6 160 0 166 142 5 0 147 2 1 0 3 316
7:30 AM 4 215 0 219 128 2 0 130 2 0 3 2 351
7:45 AM 1 179 1 180 147 4 0 151 2 1 0 3 334
Total 16 722 1 738 575 16 0 591 6 2 3 8 1337
Approach % 2.2 97.8 - - 97.3 2.7 - - 75.0 25.0 - - -
Total % 1.2 54.0 - 55.2 43.0 1.2 - 44.2 0.4 0.1 - 0.6 -
PHF 0.667 0.840 - 0.842 0.910 0.800 - 0.906 0.750 0.500 - 0.667 0.952
Lights 15 691 - 706 529 16 - 545 6 2 - 8 1259
% Lights 93.8 95.7 - 95.7 92.0 100.0 - 92.2 100.0 100.0 - 100.0 94.2
Bicycles on Road 0 0 - 0 0 0 - 0 0 0 - 0 0
% Bicycles on Road 0.0 0.0 - 0.0 0.0 0.0 - 0.0 0.0 0.0 - 0.0 0.0
All Pedestrians - - 1 - - - 0 - - - 3 - -
% All Pedestrians - - 100.0 - - - - - - - 100.0 - -
Trucks 1 31 - 32 46 0 - 46 0 0 - 0 78
% Trucks 6.3 4.3 - 4.3 8.0 0.0 - 7.8 0.0 0.0 - 0.0 5.8

Whitman, Requardt, and Associates, LLP2009 MacKenzie Way
Suite 240Cranberry Twp, Pennsylvania, United States 16066
724-779-7940 [email protected] Focused - Project Driven
Count Name: SR 885 and Middle Access DrSite Code:Start Date: 11/14/2018Page No: 5
Peak Hour Data
11/14/2018 7:00 AMEnding At11/14/2018 8:00 AM
LightsBicycles on RoadAll PedestriansTrucks
Fake Approach [N]
Out In Total
0 0 0
0 0 0
0 0 0
0 0 0
0 0 0
57746 0 0 531
Out
73832 0 0 706
In
131578 0 0
1237
Total
2nd Ave [E
]
T 72231 0 0 691
L 16 1 0 0 15
P 1 0 1 0 0
31 8 39
0 0 0
0 0 0
1 0 1
32 8 40Out In Total
Middle Access Dr [S]
L R P
6 2 0
0 0 0
0 0 3
0 0 0
6 2 3
2nd
Ave
[W] To
tal
1242 0 0 77 1319
In 545 0 0 46 591
Out
697 0 0 31 728
529 0 0 46 575 T
16 0 0 0 16 R
0 0 0 0 0 P
Turning Movement Peak Hour Data Plot (7:00 AM)

Whitman, Requardt, and Associates, LLP2009 MacKenzie Way
Suite 240Cranberry Twp, Pennsylvania, United States 16066
724-779-7940 [email protected] Focused - Project Driven
Count Name: SR 885 and Middle Access DrSite Code:Start Date: 11/14/2018Page No: 6
Turning Movement Peak Hour Data (3:45 PM)
Start Time
2nd Ave 2nd Ave Middle Access Dr
Westbound Eastbound Northbound
Left Thru Peds App. Total Thru Right Peds App. Total Left Right Peds App. Total Int. Total
3:45 PM 1 127 0 128 308 3 0 311 4 2 0 6 445
4:00 PM 2 83 1 85 325 3 0 328 8 0 0 8 421
4:15 PM 1 119 3 120 348 4 0 352 6 2 0 8 480
4:30 PM 1 109 1 110 349 5 0 354 4 2 0 6 470
Total 5 438 5 443 1330 15 0 1345 22 6 0 28 1816
Approach % 1.1 98.9 - - 98.9 1.1 - - 78.6 21.4 - - -
Total % 0.3 24.1 - 24.4 73.2 0.8 - 74.1 1.2 0.3 - 1.5 -
PHF 0.625 0.862 - 0.865 0.953 0.750 - 0.950 0.688 0.750 - 0.875 0.946
Lights 4 410 - 414 1300 15 - 1315 22 6 - 28 1757
% Lights 80.0 93.6 - 93.5 97.7 100.0 - 97.8 100.0 100.0 - 100.0 96.8
Bicycles on Road 0 0 - 0 0 0 - 0 0 0 - 0 0
% Bicycles on Road 0.0 0.0 - 0.0 0.0 0.0 - 0.0 0.0 0.0 - 0.0 0.0
All Pedestrians - - 5 - - - 0 - - - 0 - -
% All Pedestrians - - 100.0 - - - - - - - - - -
Trucks 1 28 - 29 30 0 - 30 0 0 - 0 59
% Trucks 20.0 6.4 - 6.5 2.3 0.0 - 2.2 0.0 0.0 - 0.0 3.2
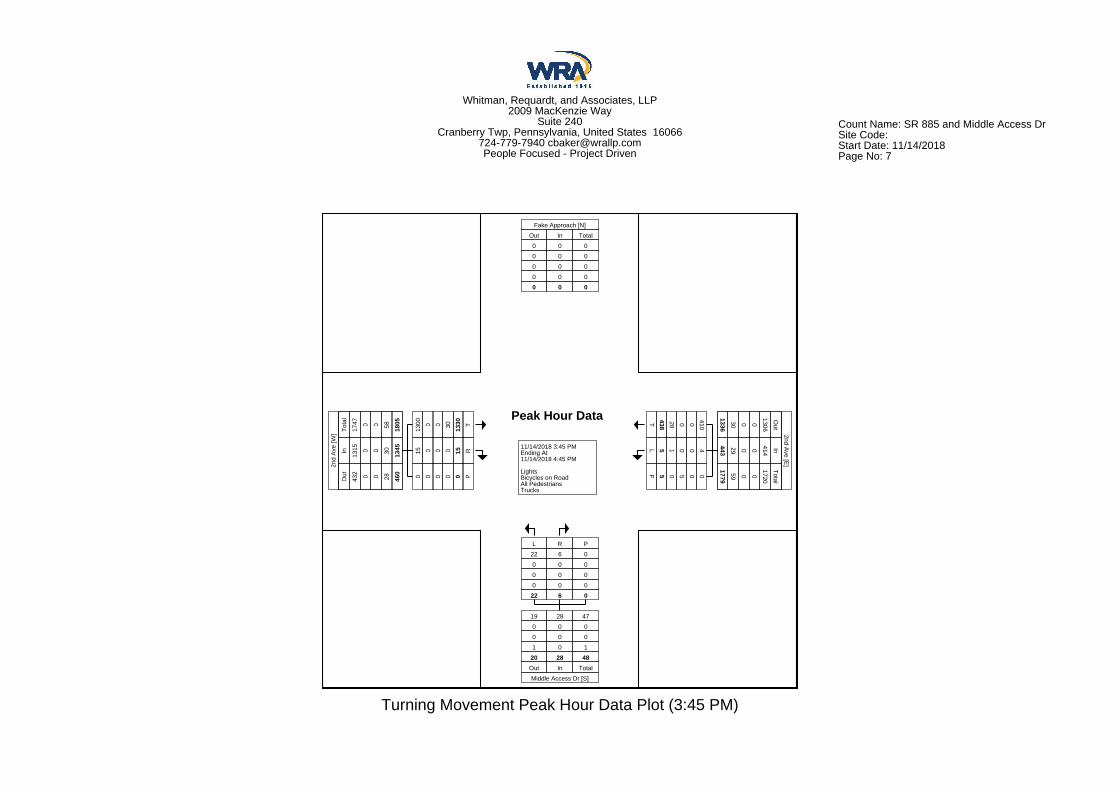
Whitman, Requardt, and Associates, LLP2009 MacKenzie Way
Suite 240Cranberry Twp, Pennsylvania, United States 16066
724-779-7940 [email protected] Focused - Project Driven
Count Name: SR 885 and Middle Access DrSite Code:Start Date: 11/14/2018Page No: 7
Peak Hour Data
11/14/2018 3:45 PMEnding At11/14/2018 4:45 PM
LightsBicycles on RoadAll PedestriansTrucks
Fake Approach [N]
Out In Total
0 0 0
0 0 0
0 0 0
0 0 0
0 0 0
133630 0 0
1306
Out
44329 0 0 414
In
177959 0 0
1720
Total
2nd Ave [E
]
T 43828 0 0 410
L 5 1 0 0 4
P 5 0 5 0 0
19 28 47
0 0 0
0 0 0
1 0 1
20 28 48Out In Total
Middle Access Dr [S]
L R P
22 6 0
0 0 0
0 0 0
0 0 0
22 6 0
2nd
Ave
[W] To
tal
1747 0 0 58 1805
In
1315 0 0 30 1345
Out
432 0 0 28 460
1300 0 0 30 1330 T
15 0 0 0 15 R
0 0 0 0 0 P
Turning Movement Peak Hour Data Plot (3:45 PM)

Whitman, Requardt, and Associates, LLP2009 MacKenzie Way
Suite 240Cranberry Twp, Pennsylvania, United States 16066
724-779-7940 [email protected] Focused - Project Driven
Count Name: SR 885 and Middle Access DrSite Code:Start Date: 11/14/2018Page No: 8

Whitman, Requardt, and Associates, LLP2009 MacKenzie Way
Suite 240Cranberry Twp, Pennsylvania, United States 16066
724-779-7940 [email protected] Focused - Project Driven
Count Name: SR 885 and Technology DrSite Code:Start Date: 11/14/2018Page No: 1
Turning Movement Data
Start Time
2nd Ave 2nd Ave Technology Dr
Westbound Eastbound Northbound
Left Thru Peds App. Total Left Thru Right Peds App. Total Left Right Peds App. Total Int. Total
7:00 AM 14 153 0 167 0 163 34 0 197 3 1 0 4 368
7:15 AM 19 153 0 172 0 146 27 1 173 2 1 0 3 348
7:30 AM 10 203 0 213 0 125 18 0 143 3 0 0 3 359
7:45 AM 7 169 0 176 0 151 29 0 180 1 2 0 3 359
Hourly Total 50 678 0 728 0 585 108 1 693 9 4 0 13 1434
8:00 AM 17 159 0 176 0 137 30 0 167 1 1 0 2 345
8:15 AM 15 153 0 168 0 126 22 0 148 0 1 0 1 317
8:30 AM 13 118 0 131 0 123 37 1 160 2 8 0 10 301
8:45 AM 16 126 0 142 0 145 30 0 175 1 4 0 5 322
Hourly Total 61 556 0 617 0 531 119 1 650 4 14 0 18 1285
9:00 AM 0 0 0 0 0 0 0 0 0 0 0 0 0 0
*** BREAK *** - - - - - - - - - - - - - -
Hourly Total 0 0 0 0 0 0 0 0 0 0 0 0 0 0
3:00 PM 0 94 2 94 0 289 3 0 292 27 19 0 46 432
3:15 PM 0 110 1 110 0 257 4 0 261 28 4 0 32 403
3:30 PM 1 114 0 115 0 307 8 0 315 30 17 0 47 477
3:45 PM 0 126 1 126 0 303 12 0 315 28 5 0 33 474
Hourly Total 1 444 4 445 0 1156 27 0 1183 113 45 0 158 1786
4:00 PM 1 89 1 90 0 327 11 0 338 33 10 0 43 471
4:15 PM 3 124 0 127 0 331 14 0 345 30 12 0 42 514
4:30 PM 1 102 2 103 1 349 18 0 368 17 5 0 22 493
4:45 PM 3 71 1 74 0 302 19 0 321 19 11 1 30 425
Hourly Total 8 386 4 394 1 1309 62 0 1372 99 38 1 137 1903
5:00 PM 5 85 0 90 0 350 20 0 370 25 9 0 34 494
5:15 PM 6 82 0 88 0 347 21 0 368 14 5 0 19 475
5:30 PM 3 95 0 98 0 319 13 0 332 14 3 0 17 447
5:45 PM 2 77 0 79 0 268 5 0 273 11 1 0 12 364
Hourly Total 16 339 0 355 0 1284 59 0 1343 64 18 0 82 1780
6:00 PM 2 77 0 79 0 244 4 0 248 4 0 0 4 331
6:15 PM 4 68 0 72 0 223 7 0 230 11 3 0 14 316
6:30 PM 3 65 0 68 0 191 4 0 195 6 3 0 9 272
6:45 PM 1 50 0 51 0 151 1 0 152 3 4 0 7 210
Hourly Total 10 260 0 270 0 809 16 0 825 24 10 0 34 1129
7:00 PM 0 0 0 0 0 1 0 0 1 0 0 0 0 1
Grand Total 146 2663 8 2809 1 5675 391 2 6067 313 129 1 442 9318
Approach % 5.2 94.8 - - 0.0 93.5 6.4 - - 70.8 29.2 - - -
Total % 1.6 28.6 - 30.1 0.0 60.9 4.2 - 65.1 3.4 1.4 - 4.7 -
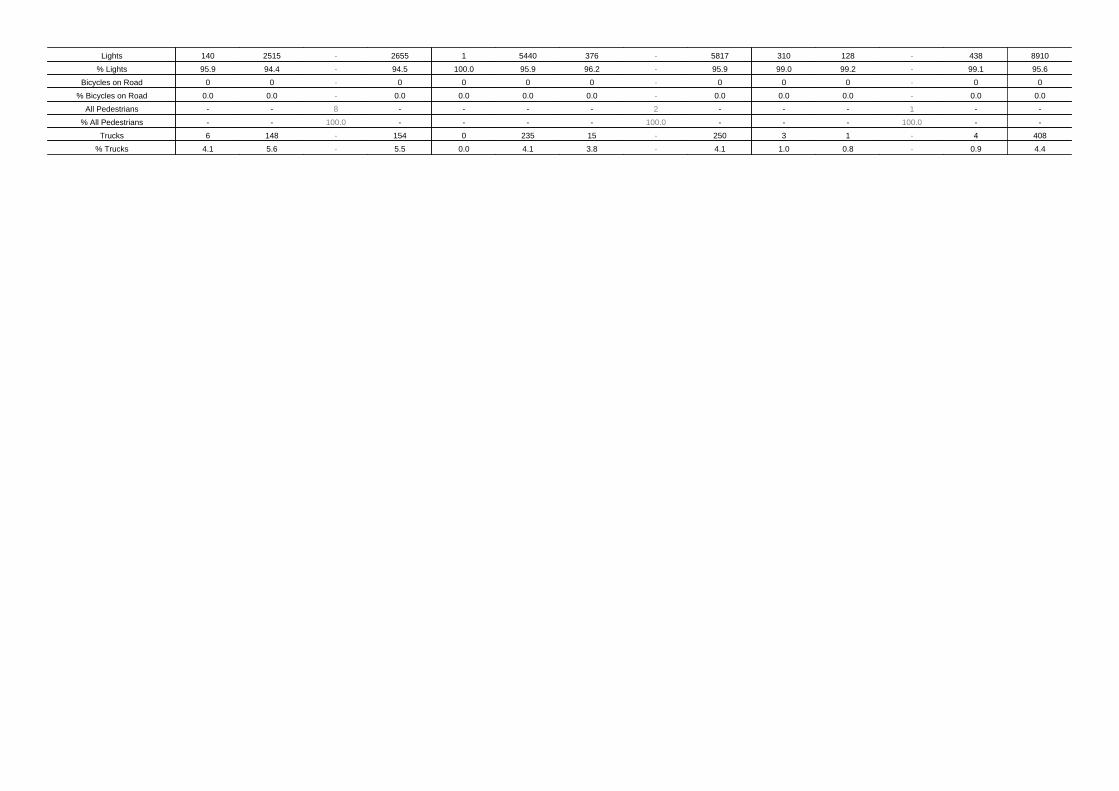
Lights 140 2515 - 2655 1 5440 376 - 5817 310 128 - 438 8910
% Lights 95.9 94.4 - 94.5 100.0 95.9 96.2 - 95.9 99.0 99.2 - 99.1 95.6
Bicycles on Road 0 0 - 0 0 0 0 - 0 0 0 - 0 0
% Bicycles on Road 0.0 0.0 - 0.0 0.0 0.0 0.0 - 0.0 0.0 0.0 - 0.0 0.0
All Pedestrians - - 8 - - - - 2 - - - 1 - -
% All Pedestrians - - 100.0 - - - - 100.0 - - - 100.0 - -
Trucks 6 148 - 154 0 235 15 - 250 3 1 - 4 408
% Trucks 4.1 5.6 - 5.5 0.0 4.1 3.8 - 4.1 1.0 0.8 - 0.9 4.4

Whitman, Requardt, and Associates, LLP2009 MacKenzie Way
Suite 240Cranberry Twp, Pennsylvania, United States 16066
724-779-7940 [email protected] Focused - Project Driven
Count Name: SR 885 and Technology DrSite Code:Start Date: 11/14/2018Page No: 3
11/14/2018 7:00 AMEnding At11/14/2018 7:15 PM
LightsBicycles on RoadAll PedestriansTrucks
Fake Approach [N]
Out In Total
1 0 1
0 0 0
0 0 0
0 0 0
1 0 1
5804236 0 0
5568
Out
2809154 0 0
2655
In
8613390 0 0
8223
Total
2nd Ave [E
]
T2663148 0 0
2515
L 146 6 0 0 140
P 8 0 8 0 0
516 438 954
0 0 0
0 0 0
21 4 25
537 442 979Out In Total
Technology Dr [S]
L R P
310 128 0
0 0 0
0 0 1
3 1 0
313 129 1
2nd
Ave
[W] To
tal
8642 0 0 401
9043
In
5817 0 0 250
6067
Out
2825 0 0 151
2976
1 0 0 0 1 L
5440 0 0 235
5675 T
376 0 0 15 391 R
0 0 2 0 2 P
Turning Movement Data Plot

Whitman, Requardt, and Associates, LLP2009 MacKenzie Way
Suite 240Cranberry Twp, Pennsylvania, United States 16066
724-779-7940 [email protected] Focused - Project Driven
Count Name: SR 885 and Technology DrSite Code:Start Date: 11/14/2018Page No: 4
Turning Movement Peak Hour Data (7:00 AM)
Start Time
2nd Ave 2nd Ave Technology Dr
Westbound Eastbound Northbound
Left Thru Peds App. Total Left Thru Right Peds App. Total Left Right Peds App. Total Int. Total
7:00 AM 14 153 0 167 0 163 34 0 197 3 1 0 4 368
7:15 AM 19 153 0 172 0 146 27 1 173 2 1 0 3 348
7:30 AM 10 203 0 213 0 125 18 0 143 3 0 0 3 359
7:45 AM 7 169 0 176 0 151 29 0 180 1 2 0 3 359
Total 50 678 0 728 0 585 108 1 693 9 4 0 13 1434
Approach % 6.9 93.1 - - 0.0 84.4 15.6 - - 69.2 30.8 - - -
Total % 3.5 47.3 - 50.8 0.0 40.8 7.5 - 48.3 0.6 0.3 - 0.9 -
PHF 0.658 0.835 - 0.854 0.000 0.897 0.794 - 0.879 0.750 0.500 - 0.813 0.974
Lights 49 645 - 694 0 540 106 - 646 8 4 - 12 1352
% Lights 98.0 95.1 - 95.3 - 92.3 98.1 - 93.2 88.9 100.0 - 92.3 94.3
Bicycles on Road 0 0 - 0 0 0 0 - 0 0 0 - 0 0
% Bicycles on Road 0.0 0.0 - 0.0 - 0.0 0.0 - 0.0 0.0 0.0 - 0.0 0.0
All Pedestrians - - 0 - - - - 1 - - - 0 - -
% All Pedestrians - - - - - - - 100.0 - - - - - -
Trucks 1 33 - 34 0 45 2 - 47 1 0 - 1 82
% Trucks 2.0 4.9 - 4.7 - 7.7 1.9 - 6.8 11.1 0.0 - 7.7 5.7

Whitman, Requardt, and Associates, LLP2009 MacKenzie Way
Suite 240Cranberry Twp, Pennsylvania, United States 16066
724-779-7940 [email protected] Focused - Project Driven
Count Name: SR 885 and Technology DrSite Code:Start Date: 11/14/2018Page No: 5
Peak Hour Data
11/14/2018 7:00 AMEnding At11/14/2018 8:00 AM
LightsBicycles on RoadAll PedestriansTrucks
Fake Approach [N]
Out In Total
0 0 0
0 0 0
0 0 0
0 0 0
0 0 0
58945 0 0 544
Out
72834 0 0 694
In
131779 0 0
1238
Total
2nd Ave [E
]
T 67833 0 0 645
L 50 1 0 0 49
P 0 0 0 0 0
155 12 167
0 0 0
0 0 0
3 1 4
158 13 171Out In Total
Technology Dr [S]
L R P
8 4 0
0 0 0
0 0 0
1 0 0
9 4 0
2nd
Ave
[W] To
tal
1299 0 0 81 1380
In 646 0 0 47 693
Out
653 0 0 34 687
0 0 0 0 0 L
540 0 0 45 585 T
106 0 0 2 108 R
0 0 1 0 1 P
Turning Movement Peak Hour Data Plot (7:00 AM)

Whitman, Requardt, and Associates, LLP2009 MacKenzie Way
Suite 240Cranberry Twp, Pennsylvania, United States 16066
724-779-7940 [email protected] Focused - Project Driven
Count Name: SR 885 and Technology DrSite Code:Start Date: 11/14/2018Page No: 6
Turning Movement Peak Hour Data (3:45 PM)
Start Time
2nd Ave 2nd Ave Technology Dr
Westbound Eastbound Northbound
Left Thru Peds App. Total Left Thru Right Peds App. Total Left Right Peds App. Total Int. Total
3:45 PM 0 126 1 126 0 303 12 0 315 28 5 0 33 474
4:00 PM 1 89 1 90 0 327 11 0 338 33 10 0 43 471
4:15 PM 3 124 0 127 0 331 14 0 345 30 12 0 42 514
4:30 PM 1 102 2 103 1 349 18 0 368 17 5 0 22 493
Total 5 441 4 446 1 1310 55 0 1366 108 32 0 140 1952
Approach % 1.1 98.9 - - 0.1 95.9 4.0 - - 77.1 22.9 - - -
Total % 0.3 22.6 - 22.8 0.1 67.1 2.8 - 70.0 5.5 1.6 - 7.2 -
PHF 0.417 0.875 - 0.878 0.250 0.938 0.764 - 0.928 0.818 0.667 - 0.814 0.949
Lights 4 413 - 417 1 1278 53 - 1332 108 32 - 140 1889
% Lights 80.0 93.7 - 93.5 100.0 97.6 96.4 - 97.5 100.0 100.0 - 100.0 96.8
Bicycles on Road 0 0 - 0 0 0 0 - 0 0 0 - 0 0
% Bicycles on Road 0.0 0.0 - 0.0 0.0 0.0 0.0 - 0.0 0.0 0.0 - 0.0 0.0
All Pedestrians - - 4 - - - - 0 - - - 0 - -
% All Pedestrians - - 100.0 - - - - - - - - - - -
Trucks 1 28 - 29 0 32 2 - 34 0 0 - 0 63
% Trucks 20.0 6.3 - 6.5 0.0 2.4 3.6 - 2.5 0.0 0.0 - 0.0 3.2

Whitman, Requardt, and Associates, LLP2009 MacKenzie Way
Suite 240Cranberry Twp, Pennsylvania, United States 16066
724-779-7940 [email protected] Focused - Project Driven
Count Name: SR 885 and Technology DrSite Code:Start Date: 11/14/2018Page No: 7
Peak Hour Data
11/14/2018 3:45 PMEnding At11/14/2018 4:45 PM
LightsBicycles on RoadAll PedestriansTrucks
Fake Approach [N]
Out In Total
1 0 1
0 0 0
0 0 0
0 0 0
1 0 1
134232 0 0
1310
Out
44629 0 0 417
In
178861 0 0
1727
Total
2nd Ave [E
]
T 44128 0 0 413
L 5 1 0 0 4
P 4 0 4 0 0
57 140 197
0 0 0
0 0 0
3 0 3
60 140 200Out In Total
Technology Dr [S]
L R P
108 32 0
0 0 0
0 0 0
0 0 0
108 32 0
2nd
Ave
[W] To
tal
1853 0 0 62 1915
In
1332 0 0 34 1366
Out
521 0 0 28 549
1 0 0 0 1 L
1278 0 0 32 1310 T
53 0 0 2 55 R
0 0 0 0 0 P
Turning Movement Peak Hour Data Plot (3:45 PM)
Whitman, Requardt, and Associates, LLP2009 MacKenzie Way
Suite 240Cranberry Twp, Pennsylvania, United States 16066
724-779-7940 [email protected] Focused - Project Driven
Count Name: SR 885 and Technology DrSite Code:Start Date: 11/14/2018Page No: 8
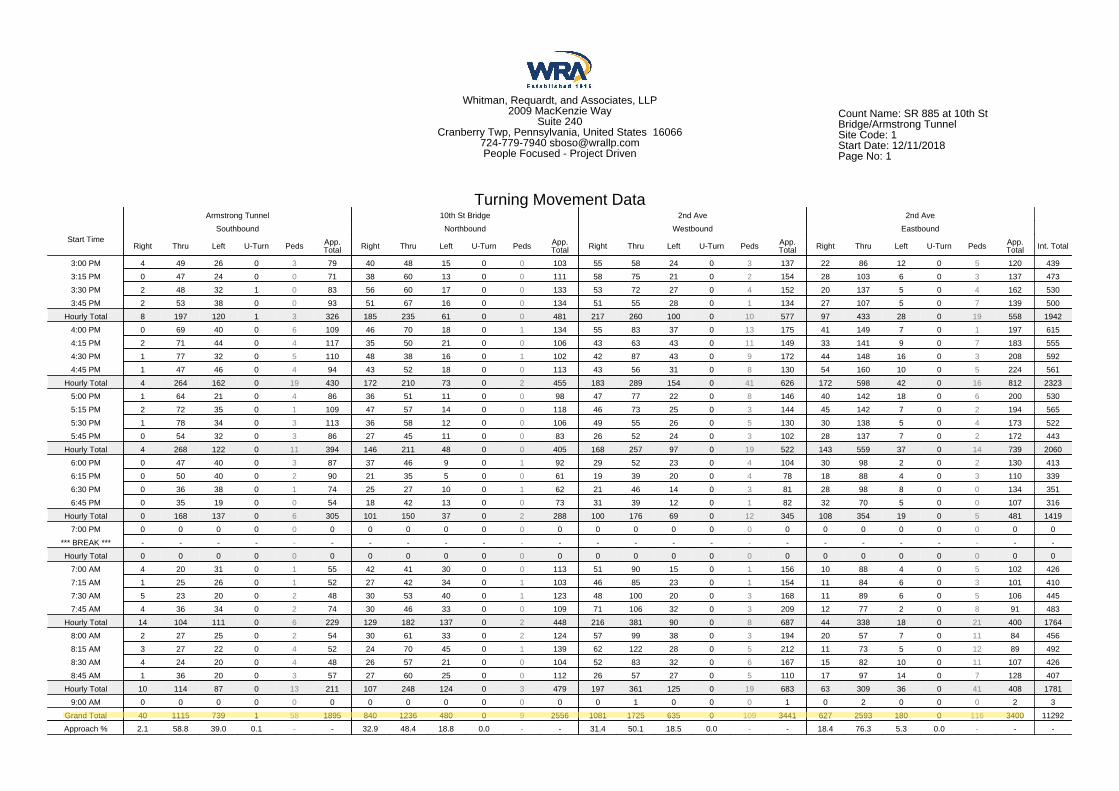
Whitman, Requardt, and Associates, LLP2009 MacKenzie Way
Suite 240Cranberry Twp, Pennsylvania, United States 16066
724-779-7940 [email protected] Focused - Project Driven
Count Name: SR 885 at 10th StBridge/Armstrong TunnelSite Code: 1Start Date: 12/11/2018Page No: 1
Turning Movement Data
Start Time
Armstrong Tunnel 10th St Bridge 2nd Ave 2nd Ave
Southbound Northbound Westbound Eastbound
Right Thru Left U-Turn Peds App.Total Right Thru Left U-Turn Peds App.
Total Right Thru Left U-Turn Peds App.Total Right Thru Left U-Turn Peds App.
Total Int. Total
3:00 PM 4 49 26 0 3 79 40 48 15 0 0 103 55 58 24 0 3 137 22 86 12 0 5 120 439
3:15 PM 0 47 24 0 0 71 38 60 13 0 0 111 58 75 21 0 2 154 28 103 6 0 3 137 473
3:30 PM 2 48 32 1 0 83 56 60 17 0 0 133 53 72 27 0 4 152 20 137 5 0 4 162 530
3:45 PM 2 53 38 0 0 93 51 67 16 0 0 134 51 55 28 0 1 134 27 107 5 0 7 139 500
Hourly Total 8 197 120 1 3 326 185 235 61 0 0 481 217 260 100 0 10 577 97 433 28 0 19 558 1942
4:00 PM 0 69 40 0 6 109 46 70 18 0 1 134 55 83 37 0 13 175 41 149 7 0 1 197 615
4:15 PM 2 71 44 0 4 117 35 50 21 0 0 106 43 63 43 0 11 149 33 141 9 0 7 183 555
4:30 PM 1 77 32 0 5 110 48 38 16 0 1 102 42 87 43 0 9 172 44 148 16 0 3 208 592
4:45 PM 1 47 46 0 4 94 43 52 18 0 0 113 43 56 31 0 8 130 54 160 10 0 5 224 561
Hourly Total 4 264 162 0 19 430 172 210 73 0 2 455 183 289 154 0 41 626 172 598 42 0 16 812 2323
5:00 PM 1 64 21 0 4 86 36 51 11 0 0 98 47 77 22 0 8 146 40 142 18 0 6 200 530
5:15 PM 2 72 35 0 1 109 47 57 14 0 0 118 46 73 25 0 3 144 45 142 7 0 2 194 565
5:30 PM 1 78 34 0 3 113 36 58 12 0 0 106 49 55 26 0 5 130 30 138 5 0 4 173 522
5:45 PM 0 54 32 0 3 86 27 45 11 0 0 83 26 52 24 0 3 102 28 137 7 0 2 172 443
Hourly Total 4 268 122 0 11 394 146 211 48 0 0 405 168 257 97 0 19 522 143 559 37 0 14 739 2060
6:00 PM 0 47 40 0 3 87 37 46 9 0 1 92 29 52 23 0 4 104 30 98 2 0 2 130 413
6:15 PM 0 50 40 0 2 90 21 35 5 0 0 61 19 39 20 0 4 78 18 88 4 0 3 110 339
6:30 PM 0 36 38 0 1 74 25 27 10 0 1 62 21 46 14 0 3 81 28 98 8 0 0 134 351
6:45 PM 0 35 19 0 0 54 18 42 13 0 0 73 31 39 12 0 1 82 32 70 5 0 0 107 316
Hourly Total 0 168 137 0 6 305 101 150 37 0 2 288 100 176 69 0 12 345 108 354 19 0 5 481 1419
7:00 PM 0 0 0 0 0 0 0 0 0 0 0 0 0 0 0 0 0 0 0 0 0 0 0 0 0
*** BREAK *** - - - - - - - - - - - - - - - - - - - - - - - - -
Hourly Total 0 0 0 0 0 0 0 0 0 0 0 0 0 0 0 0 0 0 0 0 0 0 0 0 0
7:00 AM 4 20 31 0 1 55 42 41 30 0 0 113 51 90 15 0 1 156 10 88 4 0 5 102 426
7:15 AM 1 25 26 0 1 52 27 42 34 0 1 103 46 85 23 0 1 154 11 84 6 0 3 101 410
7:30 AM 5 23 20 0 2 48 30 53 40 0 1 123 48 100 20 0 3 168 11 89 6 0 5 106 445
7:45 AM 4 36 34 0 2 74 30 46 33 0 0 109 71 106 32 0 3 209 12 77 2 0 8 91 483
Hourly Total 14 104 111 0 6 229 129 182 137 0 2 448 216 381 90 0 8 687 44 338 18 0 21 400 1764
8:00 AM 2 27 25 0 2 54 30 61 33 0 2 124 57 99 38 0 3 194 20 57 7 0 11 84 456
8:15 AM 3 27 22 0 4 52 24 70 45 0 1 139 62 122 28 0 5 212 11 73 5 0 12 89 492
8:30 AM 4 24 20 0 4 48 26 57 21 0 0 104 52 83 32 0 6 167 15 82 10 0 11 107 426
8:45 AM 1 36 20 0 3 57 27 60 25 0 0 112 26 57 27 0 5 110 17 97 14 0 7 128 407
Hourly Total 10 114 87 0 13 211 107 248 124 0 3 479 197 361 125 0 19 683 63 309 36 0 41 408 1781
9:00 AM 0 0 0 0 0 0 0 0 0 0 0 0 0 1 0 0 0 1 0 2 0 0 0 2 3
Grand Total 40 1115 739 1 58 1895 840 1236 480 0 9 2556 1081 1725 635 0 109 3441 627 2593 180 0 116 3400 11292
Approach % 2.1 58.8 39.0 0.1 - - 32.9 48.4 18.8 0.0 - - 31.4 50.1 18.5 0.0 - - 18.4 76.3 5.3 0.0 - - -

Total % 0.4 9.9 6.5 0.0 - 16.8 7.4 10.9 4.3 0.0 - 22.6 9.6 15.3 5.6 0.0 - 30.5 5.6 23.0 1.6 0.0 - 30.1 -
Lights 40 1098 711 1 - 1850 819 1174 468 0 - 2461 1039 1627 616 0 - 3282 607 2422 172 0 - 3201 10794
% Lights 100.0 98.5 96.2 100.0 - 97.6 97.5 95.0 97.5 - - 96.3 96.1 94.3 97.0 - - 95.4 96.8 93.4 95.6 - - 94.1 95.6
Buses 0 4 5 0 - 9 5 34 3 0 - 42 3 69 6 0 - 78 2 131 4 0 - 137 266
% Buses 0.0 0.4 0.7 0.0 - 0.5 0.6 2.8 0.6 - - 1.6 0.3 4.0 0.9 - - 2.3 0.3 5.1 2.2 - - 4.0 2.4
Trucks 0 12 23 0 - 35 16 28 8 0 - 52 39 29 13 0 - 81 17 40 4 0 - 61 229
% Trucks 0.0 1.1 3.1 0.0 - 1.8 1.9 2.3 1.7 - - 2.0 3.6 1.7 2.0 - - 2.4 2.7 1.5 2.2 - - 1.8 2.0
Bicycles on Road 0 1 0 0 - 1 0 0 1 0 - 1 0 0 0 0 - 0 1 0 0 0 - 1 3
% Bicycles onRoad 0.0 0.1 0.0 0.0 - 0.1 0.0 0.0 0.2 - - 0.0 0.0 0.0 0.0 - - 0.0 0.2 0.0 0.0 - - 0.0 0.0
Bicycles onCrosswalk - - - - 0 - - - - - 0 - - - - - 1 - - - - - 2 - -
% Bicycles onCrosswalk - - - - 0.0 - - - - - 0.0 - - - - - 0.9 - - - - - 1.7 - -
Pedestrians - - - - 58 - - - - - 9 - - - - - 108 - - - - - 114 - -
% Pedestrians - - - - 100.0 - - - - - 100.0 - - - - - 99.1 - - - - - 98.3 - -

Whitman, Requardt, and Associates, LLP2009 MacKenzie Way
Suite 240Cranberry Twp, Pennsylvania, United States 16066
724-779-7940 [email protected] Focused - Project Driven
Count Name: SR 885 at 10th StBridge/Armstrong TunnelSite Code: 1Start Date: 12/11/2018Page No: 3
12/11/2018 3:00 PMEnding At12/12/2018 9:15 AM
LightsBusesTrucksBicycles on RoadOther
Armstrong Tunnel [N]
Out In Total
2386 1850 4236
41 9 50
71 35 106
0 1 1
0 0 0
2498 1895 4393
40 1098 711 1 0
0 4 5 0 0
0 12 23 0 0
0 1 0 0 0
0 0 0 0 58
40 1115 739 1 58R T L U P
41720 0 79
141
3952
Out
34410 0 81 78
3282
In
76130 0 160
219
7234
Total
2nd Ave [E
]
R1081
0 0 39 31039
T1725
0 0 29 691627
L 635 0 0 13 6 616
U 0 0 0 0 0 0
P 109109 0 0 0 0
2321 2461 4782
12 42 54
42 52 94
2 1 3
0 0 0
2377 2556 4933Out In Total
10th St Bridge [S]
U L T R P
0 468 1174 819 0
0 3 34 5 0
0 8 28 16 0
0 1 0 0 0
0 0 0 0 9
0 480 1236 840 9
2nd
Ave
[W] To
tal
5336
209
98 2 0
5645
In
3201
137
61 1 0
3400
Out
2135 72 37 1 0
2245
0 0 0 0 0 0 U
172 4 4 0 0 180 L
2422
131
40 0 025
93 T
607 2 17 1 0 627 R
0 0 0 0 116
116 P
Turning Movement Data Plot

Whitman, Requardt, and Associates, LLP2009 MacKenzie Way
Suite 240Cranberry Twp, Pennsylvania, United States 16066
724-779-7940 [email protected] Focused - Project Driven
Count Name: SR 885 at 10th StBridge/Armstrong TunnelSite Code: 1Start Date: 12/11/2018Page No: 4
Turning Movement Peak Hour Data (4:00 PM)
Start Time
Armstrong Tunnel 10th St Bridge 2nd Ave 2nd Ave
Southbound Northbound Westbound Eastbound
Right Thru Left U-Turn Peds App.Total Right Thru Left U-Turn Peds App.
Total Right Thru Left U-Turn Peds App.Total Right Thru Left U-Turn Peds App.
Total Int. Total
4:00 PM 0 69 40 0 6 109 46 70 18 0 1 134 55 83 37 0 13 175 41 149 7 0 1 197 615
4:15 PM 2 71 44 0 4 117 35 50 21 0 0 106 43 63 43 0 11 149 33 141 9 0 7 183 555
4:30 PM 1 77 32 0 5 110 48 38 16 0 1 102 42 87 43 0 9 172 44 148 16 0 3 208 592
4:45 PM 1 47 46 0 4 94 43 52 18 0 0 113 43 56 31 0 8 130 54 160 10 0 5 224 561
Total 4 264 162 0 19 430 172 210 73 0 2 455 183 289 154 0 41 626 172 598 42 0 16 812 2323
Approach % 0.9 61.4 37.7 0.0 - - 37.8 46.2 16.0 0.0 - - 29.2 46.2 24.6 0.0 - - 21.2 73.6 5.2 0.0 - - -
Total % 0.2 11.4 7.0 0.0 - 18.5 7.4 9.0 3.1 0.0 - 19.6 7.9 12.4 6.6 0.0 - 26.9 7.4 25.7 1.8 0.0 - 35.0 -
PHF 0.500 0.857 0.880 0.000 - 0.919 0.896 0.750 0.869 0.000 - 0.849 0.832 0.830 0.895 0.000 - 0.894 0.796 0.934 0.656 0.000 - 0.906 0.944
Lights 4 261 156 0 - 421 172 202 71 0 - 445 180 264 152 0 - 596 167 564 42 0 - 773 2235
% Lights 100.0 98.9 96.3 - - 97.9 100.0 96.2 97.3 - - 97.8 98.4 91.3 98.7 - - 95.2 97.1 94.3 100.0 - - 95.2 96.2
Buses 0 1 0 0 - 1 0 5 0 0 - 5 0 20 1 0 - 21 0 26 0 0 - 26 53
% Buses 0.0 0.4 0.0 - - 0.2 0.0 2.4 0.0 - - 1.1 0.0 6.9 0.6 - - 3.4 0.0 4.3 0.0 - - 3.2 2.3
Trucks 0 2 6 0 - 8 0 3 1 0 - 4 3 5 1 0 - 9 5 8 0 0 - 13 34
% Trucks 0.0 0.8 3.7 - - 1.9 0.0 1.4 1.4 - - 0.9 1.6 1.7 0.6 - - 1.4 2.9 1.3 0.0 - - 1.6 1.5
Bicycles on Road 0 0 0 0 - 0 0 0 1 0 - 1 0 0 0 0 - 0 0 0 0 0 - 0 1
% Bicycles onRoad 0.0 0.0 0.0 - - 0.0 0.0 0.0 1.4 - - 0.2 0.0 0.0 0.0 - - 0.0 0.0 0.0 0.0 - - 0.0 0.0
Bicycles onCrosswalk - - - - 0 - - - - - 0 - - - - - 1 - - - - - 1 - -
% Bicycles onCrosswalk - - - - 0.0 - - - - - 0.0 - - - - - 2.4 - - - - - 6.3 - -
Pedestrians - - - - 19 - - - - - 2 - - - - - 40 - - - - - 15 - -
% Pedestrians - - - - 100.0 - - - - - 100.0 - - - - - 97.6 - - - - - 93.8 - -

Whitman, Requardt, and Associates, LLP2009 MacKenzie Way
Suite 240Cranberry Twp, Pennsylvania, United States 16066
724-779-7940 [email protected] Focused - Project Driven
Count Name: SR 885 at 10th StBridge/Armstrong TunnelSite Code: 1Start Date: 12/11/2018Page No: 5
Peak Hour Data
12/11/2018 4:00 PMEnding At12/11/2018 5:00 PM
LightsBusesTrucksBicycles on RoadOther
Armstrong Tunnel [N]
Out In Total
424 421 845
5 1 6
6 8 14
0 0 0
0 0 0
435 430 865
4 261 156 0 0
0 1 0 0 0
0 2 6 0 0
0 0 0 0 0
0 0 0 0 19
4 264 162 0 19R T L U P
932 0 0 14 26
892
Out
626 0 0 9 21
596
In
15580 0 23 47
1488
Total
2nd Ave [E
]
R 183 0 0 3 0 180
T 289 0 0 5 20264
L 154 0 0 1 1 152
U 0 0 0 0 0 0
P 41 41 0 0 0 0
580 445 1025
2 5 7
8 4 12
0 1 1
0 0 0
590 455 1045Out In Total
10th St Bridge [S]
U L T R P
0 71 202 172 0
0 0 5 0 0
0 1 3 0 0
0 1 0 0 0
0 0 0 0 2
0 73 210 172 2
2nd
Ave
[W] To
tal
1112 46 19 1 0
1178
In 773
26 13 0 0 812
Out
339
20 6 1 0 366
0 0 0 0 0 0 U
42 0 0 0 0 42 L
564
26 8 0 0 598 T
167 0 5 0 0 172 R
0 0 0 0 16 16 P
Turning Movement Peak Hour Data Plot (4:00 PM)
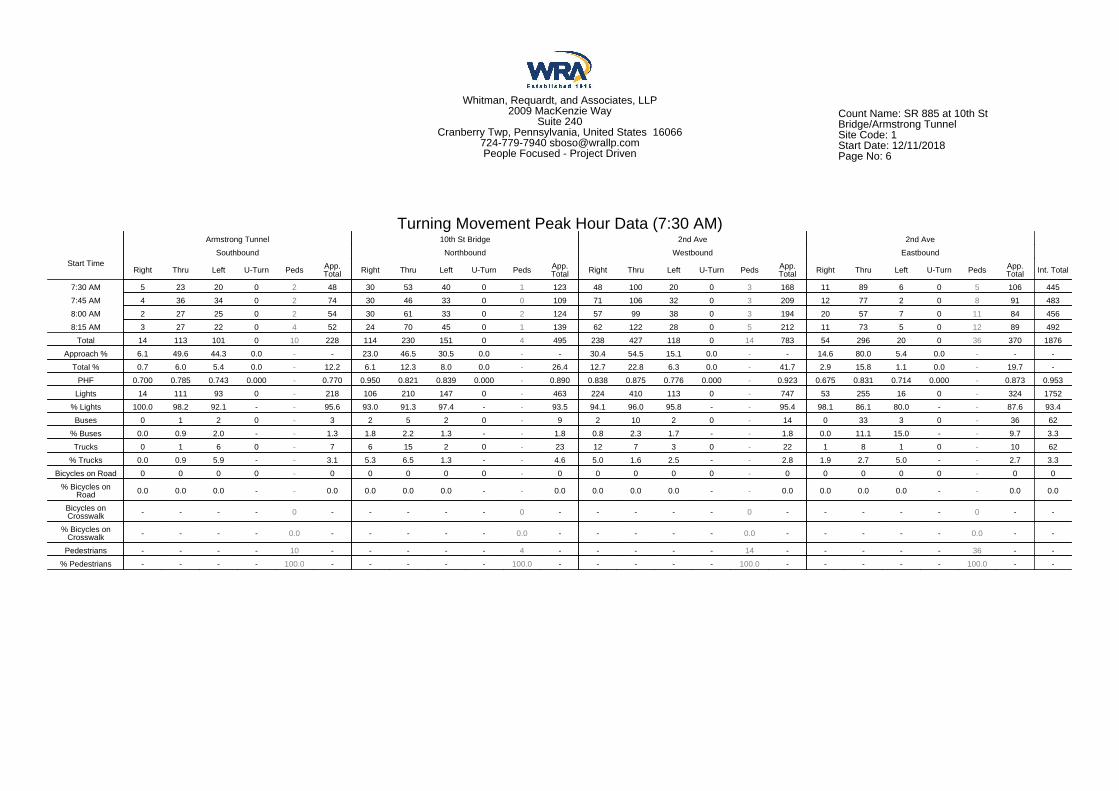
Whitman, Requardt, and Associates, LLP2009 MacKenzie Way
Suite 240Cranberry Twp, Pennsylvania, United States 16066
724-779-7940 [email protected] Focused - Project Driven
Count Name: SR 885 at 10th StBridge/Armstrong TunnelSite Code: 1Start Date: 12/11/2018Page No: 6
Turning Movement Peak Hour Data (7:30 AM)
Start Time
Armstrong Tunnel 10th St Bridge 2nd Ave 2nd Ave
Southbound Northbound Westbound Eastbound
Right Thru Left U-Turn Peds App.Total Right Thru Left U-Turn Peds App.
Total Right Thru Left U-Turn Peds App.Total Right Thru Left U-Turn Peds App.
Total Int. Total
7:30 AM 5 23 20 0 2 48 30 53 40 0 1 123 48 100 20 0 3 168 11 89 6 0 5 106 445
7:45 AM 4 36 34 0 2 74 30 46 33 0 0 109 71 106 32 0 3 209 12 77 2 0 8 91 483
8:00 AM 2 27 25 0 2 54 30 61 33 0 2 124 57 99 38 0 3 194 20 57 7 0 11 84 456
8:15 AM 3 27 22 0 4 52 24 70 45 0 1 139 62 122 28 0 5 212 11 73 5 0 12 89 492
Total 14 113 101 0 10 228 114 230 151 0 4 495 238 427 118 0 14 783 54 296 20 0 36 370 1876
Approach % 6.1 49.6 44.3 0.0 - - 23.0 46.5 30.5 0.0 - - 30.4 54.5 15.1 0.0 - - 14.6 80.0 5.4 0.0 - - -
Total % 0.7 6.0 5.4 0.0 - 12.2 6.1 12.3 8.0 0.0 - 26.4 12.7 22.8 6.3 0.0 - 41.7 2.9 15.8 1.1 0.0 - 19.7 -
PHF 0.700 0.785 0.743 0.000 - 0.770 0.950 0.821 0.839 0.000 - 0.890 0.838 0.875 0.776 0.000 - 0.923 0.675 0.831 0.714 0.000 - 0.873 0.953
Lights 14 111 93 0 - 218 106 210 147 0 - 463 224 410 113 0 - 747 53 255 16 0 - 324 1752
% Lights 100.0 98.2 92.1 - - 95.6 93.0 91.3 97.4 - - 93.5 94.1 96.0 95.8 - - 95.4 98.1 86.1 80.0 - - 87.6 93.4
Buses 0 1 2 0 - 3 2 5 2 0 - 9 2 10 2 0 - 14 0 33 3 0 - 36 62
% Buses 0.0 0.9 2.0 - - 1.3 1.8 2.2 1.3 - - 1.8 0.8 2.3 1.7 - - 1.8 0.0 11.1 15.0 - - 9.7 3.3
Trucks 0 1 6 0 - 7 6 15 2 0 - 23 12 7 3 0 - 22 1 8 1 0 - 10 62
% Trucks 0.0 0.9 5.9 - - 3.1 5.3 6.5 1.3 - - 4.6 5.0 1.6 2.5 - - 2.8 1.9 2.7 5.0 - - 2.7 3.3
Bicycles on Road 0 0 0 0 - 0 0 0 0 0 - 0 0 0 0 0 - 0 0 0 0 0 - 0 0
% Bicycles onRoad 0.0 0.0 0.0 - - 0.0 0.0 0.0 0.0 - - 0.0 0.0 0.0 0.0 - - 0.0 0.0 0.0 0.0 - - 0.0 0.0
Bicycles onCrosswalk - - - - 0 - - - - - 0 - - - - - 0 - - - - - 0 - -
% Bicycles onCrosswalk - - - - 0.0 - - - - - 0.0 - - - - - 0.0 - - - - - 0.0 - -
Pedestrians - - - - 10 - - - - - 4 - - - - - 14 - - - - - 36 - -
% Pedestrians - - - - 100.0 - - - - - 100.0 - - - - - 100.0 - - - - - 100.0 - -
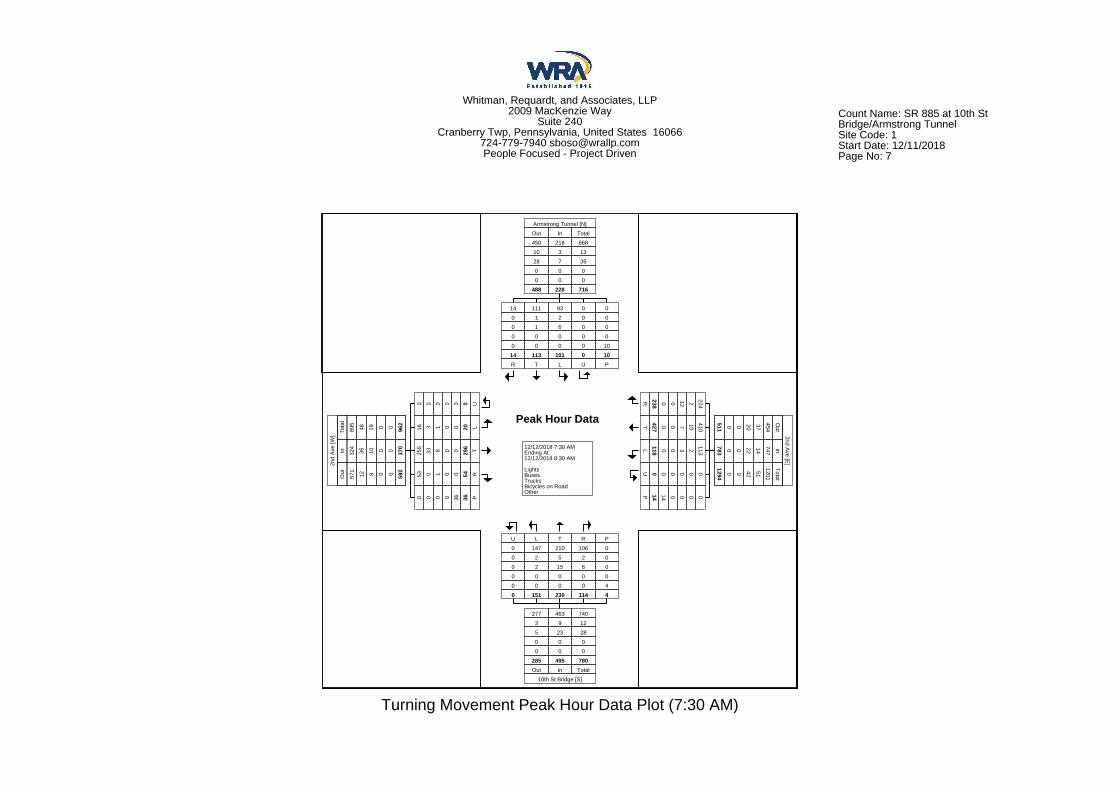
Whitman, Requardt, and Associates, LLP2009 MacKenzie Way
Suite 240Cranberry Twp, Pennsylvania, United States 16066
724-779-7940 [email protected] Focused - Project Driven
Count Name: SR 885 at 10th StBridge/Armstrong TunnelSite Code: 1Start Date: 12/11/2018Page No: 7
Peak Hour Data
12/12/2018 7:30 AMEnding At12/12/2018 8:30 AM
LightsBusesTrucksBicycles on RoadOther
Armstrong Tunnel [N]
Out In Total
450 218 668
10 3 13
28 7 35
0 0 0
0 0 0
488 228 716
14 111 93 0 0
0 1 2 0 0
0 1 6 0 0
0 0 0 0 0
0 0 0 0 10
14 113 101 0 10R T L U P
511 0 0 20 37
454
Out
783 0 0 22 14
747
In
12940 0 42 51
1201
Total
2nd Ave [E
]
R 238 0 0 12 2 224
T 427 0 0 7 10410
L 118 0 0 3 2 113
U 0 0 0 0 0 0
P 14 14 0 0 0 0
277 463 740
3 9 12
5 23 28
0 0 0
0 0 0
285 495 780Out In Total
10th St Bridge [S]
U L T R P
0 147 210 106 0
0 2 5 2 0
0 2 15 6 0
0 0 0 0 0
0 0 0 0 4
0 151 230 114 4
2nd
Ave
[W] To
tal
895
48 19 0 0 962
In 324
36 10 0 0 370
Out
571
12 9 0 0 592
0 0 0 0 0 0 U
16 3 1 0 0 20 L
255
33 8 0 0 296 T
53 0 1 0 0 54 R
0 0 0 0 36 36 P
Turning Movement Peak Hour Data Plot (7:30 AM)

Whitman, Requardt, and Associates, LLP2009 MacKenzie Way
Suite 240Cranberry Twp, Pennsylvania, United States 16066
724-779-7940 [email protected] Focused - Project Driven
Count Name: SR 885 at 10th StBridge/Armstrong TunnelSite Code: 1Start Date: 12/11/2018Page No: 8

Appendix C Travel Time Data

0
2
4
6
8
10
12
14
16
Ra
w T
rave
l T
ime
Da
ta b
y R
un
(M
inu
tes
)
Cross Street / Direction of Traffic Flow
SR 885 / Second Avenue Travel TimeRaw Travel Time Data for: 2018 Weekday Peaks by Run / AM Peak Northbound
NB 8:52 - 9:06 AM
NB 8:20 - 8:36 AM
NB 7:47 - 8:02 AM
NB 7:15 - 7:30 AM
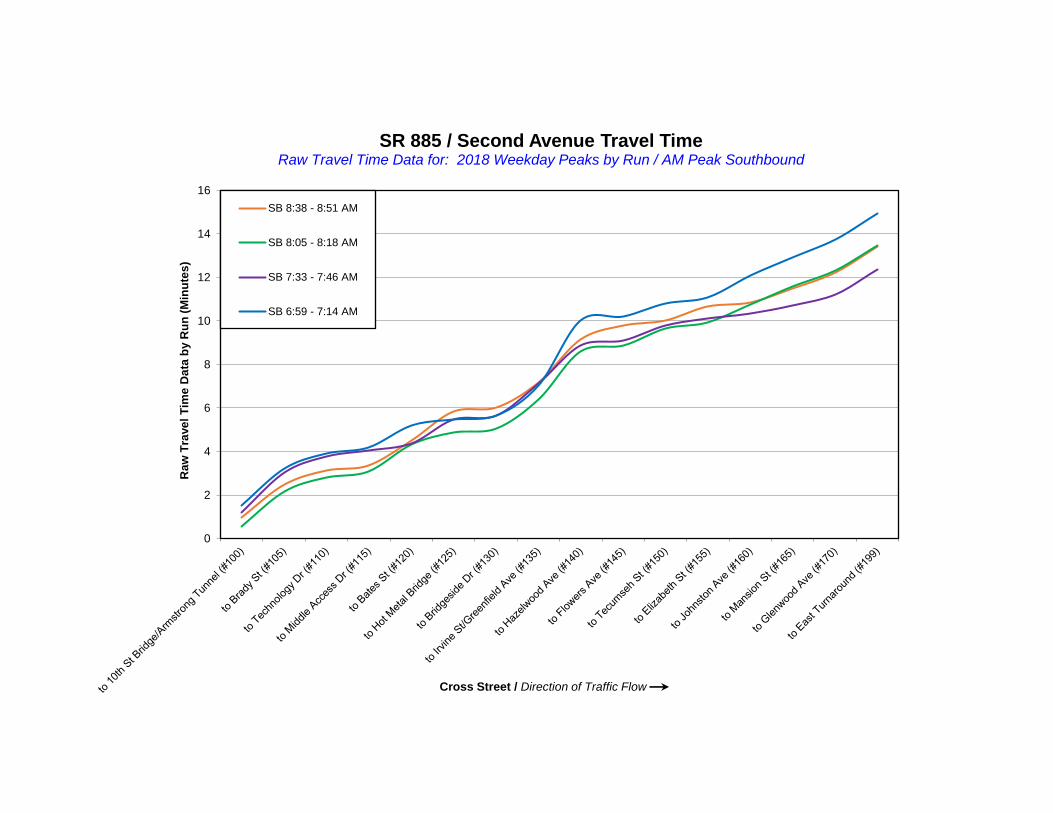
0
2
4
6
8
10
12
14
16R
aw
Tra
ve
l T
ime
Da
ta b
y R
un
(M
inu
tes
)
Cross Street / Direction of Traffic Flow
SR 885 / Second Avenue Travel TimeRaw Travel Time Data for: 2018 Weekday Peaks by Run / AM Peak Southbound
SB 8:38 - 8:51 AM
SB 8:05 - 8:18 AM
SB 7:33 - 7:46 AM
SB 6:59 - 7:14 AM

0
2
4
6
8
10
12
14
16
Ra
w T
rave
l T
ime
Da
ta b
y R
un
(M
inu
tes
)
Cross Street / Direction of Traffic Flow
SR 885 / Second Avenue Travel TimeRaw Travel Time Data for: 2018 Weekday Peaks by Run / PM Peak Northbound
SB 5:16 - 5:32 PM
SB 4:28 - 4:43 PM

0
5
10
15
20
25
30
35R
aw
Tra
ve
l T
ime
Da
ta b
y R
un
(M
inu
tes
)
Cross Street / Direction of Traffic Flow
SR 885 / Second Avenue Travel TimeRaw Travel Time Data for: 2018 Weekday Peaks by Run / PM Peak Southbound
SB 5:35 - 5:56 PM
SB 4:45 - 5:15 PM
SB 3:59 - 4:27 PM

Appendix D Queuing Observations
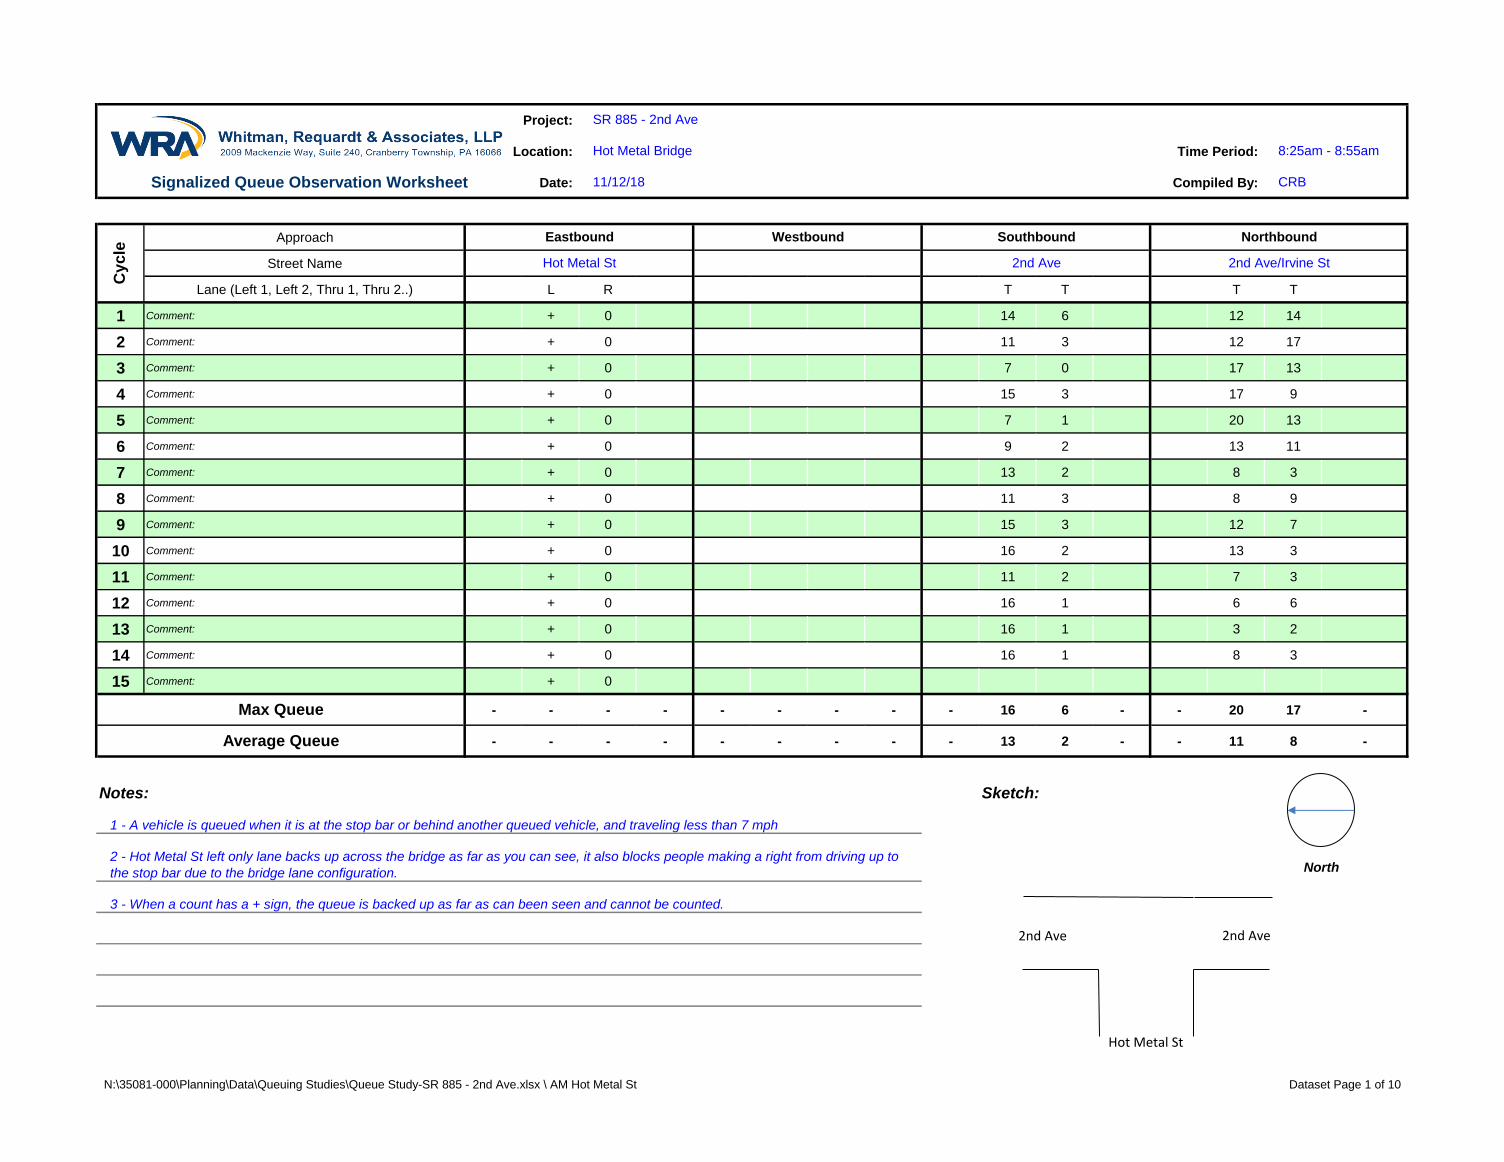
Project:
Location: Time Period:
Date: Compiled By:
Approach
Street Name
Lane (Left 1, Left 2, Thru 1, Thru 2..) L R T T T T
1 Comment: + 0 14 6 12 14
2 Comment: + 0 11 3 12 17
3 Comment: + 0 7 0 17 13
4 Comment: + 0 15 3 17 9
5 Comment: + 0 7 1 20 13
6 Comment: + 0 9 2 13 11
7 Comment: + 0 13 2 8 3
8 Comment: + 0 11 3 8 9
9 Comment: + 0 15 3 12 7
10 Comment: + 0 16 2 13 3
11 Comment: + 0 11 2 7 3
12 Comment: + 0 16 1 6 6
13 Comment: + 0 16 1 3 2
14 Comment: + 0 16 1 8 3
15 Comment: + 0
- - - - - - - - - 16 6 - - 20 17 -
- - - - - - - - - 13 2 - - 11 8 -
Notes: Sketch:
SR 885 - 2nd Ave
Hot Metal Bridge 8:25am - 8:55am
Signalized Queue Observation Worksheet 11/12/18 CRB
Cycle
Eastbound Westbound Southbound Northbound
Hot Metal St 2nd Ave 2nd Ave/Irvine St
Max Queue
Average Queue
1 - A vehicle is queued when it is at the stop bar or behind another queued vehicle, and traveling less than 7 mph
2 - Hot Metal St left only lane backs up across the bridge as far as you can see, it also blocks people making a right from driving up to
the stop bar due to the bridge lane configuration.
3 - When a count has a + sign, the queue is backed up as far as can been seen and cannot be counted.
North
2nd Ave2nd Ave
Hot Metal St
N:\35081-000\Planning\Data\Queuing Studies\Queue Study-SR 885 - 2nd Ave.xlsx \ AM Hot Metal St Dataset Page 1 of 10
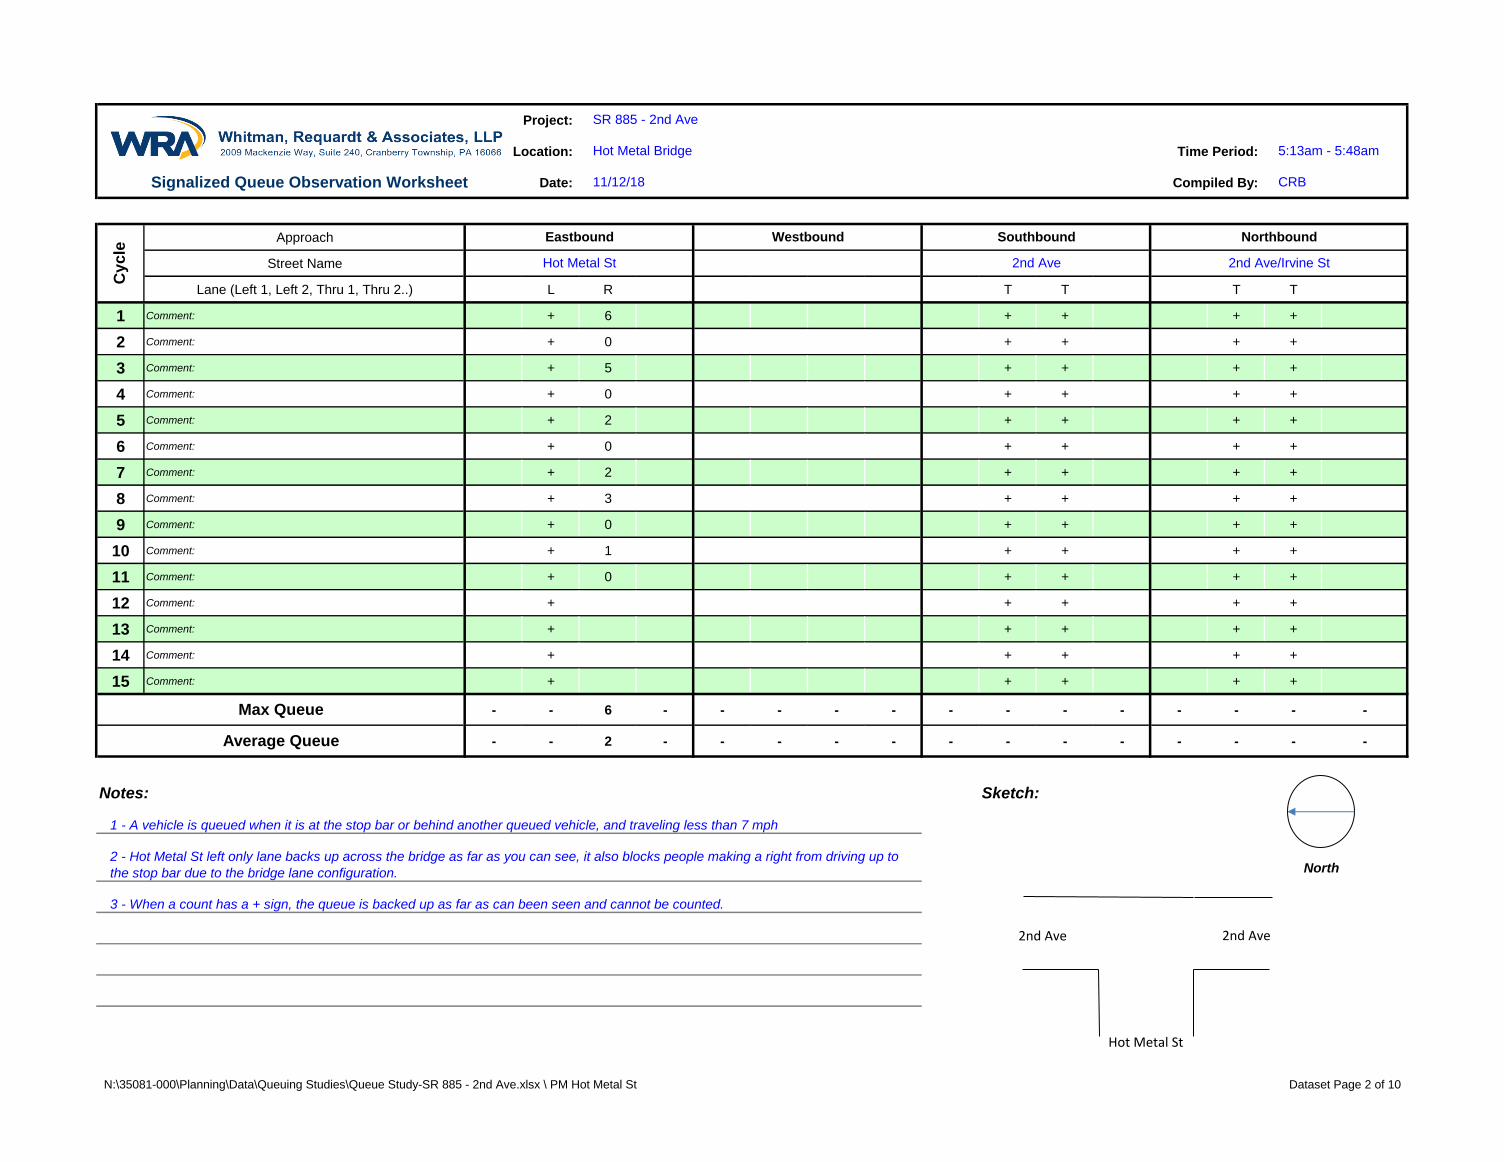
Project:
Location: Time Period:
Date: Compiled By:
Approach
Street Name
Lane (Left 1, Left 2, Thru 1, Thru 2..) L R T T T T
1 Comment: + 6 + + + +
2 Comment: + 0 + + + +
3 Comment: + 5 + + + +
4 Comment: + 0 + + + +
5 Comment: + 2 + + + +
6 Comment: + 0 + + + +
7 Comment: + 2 + + + +
8 Comment: + 3 + + + +
9 Comment: + 0 + + + +
10 Comment: + 1 + + + +
11 Comment: + 0 + + + +
12 Comment: + + + + +
13 Comment: + + + + +
14 Comment: + + + + +
15 Comment: + + + + +
- - 6 - - - - - - - - - - - - -
- - 2 - - - - - - - - - - - - -
Notes: Sketch:
SR 885 - 2nd Ave
Hot Metal Bridge 5:13am - 5:48am
Signalized Queue Observation Worksheet 11/12/18 CRB
Cycle
Eastbound Westbound Southbound Northbound
Hot Metal St 2nd Ave 2nd Ave/Irvine St
Max Queue
Average Queue
1 - A vehicle is queued when it is at the stop bar or behind another queued vehicle, and traveling less than 7 mph
2 - Hot Metal St left only lane backs up across the bridge as far as you can see, it also blocks people making a right from driving up to
the stop bar due to the bridge lane configuration.
3 - When a count has a + sign, the queue is backed up as far as can been seen and cannot be counted.
North
2nd Ave2nd Ave
Hot Metal St
N:\35081-000\Planning\Data\Queuing Studies\Queue Study-SR 885 - 2nd Ave.xlsx \ PM Hot Metal St Dataset Page 2 of 10

Project:
Location: Time Period:
Date: Compiled By:
Approach
Street Name
Lane (Left 1, Left 2, Thru 1, Thru 2..) T L T T R L T
1 Comment: 2 1 2 2 1 7 3
2 Comment: 1 1 4 1 3 1 1
3 Comment: 0 2 5 5 1 9 7
4 Comment: 1 2 4 3 3 11 8
5 Comment: 2 2 5 3 6 15 7
6 Comment: 2 1 3 4 3 13 9
7 Comment: 1 3 2 4 3 14 11
8 Comment: 1 3 2 0 3 12 8
9 Comment: 0 2 3 3 5 9 6
10 Comment: 0 1 2 2 2 5 7
11 Comment: 3 1 6 1 3 10 6
12 Comment: 0 3 2 2 0 7 5
13 Comment: 0 1 4 5 6 16 9
14 Comment: 0 2 5 2 6 10 7
15 Comment: 0 1 12 4 5 15 9
- - 3 - - 3 12 - - 5 6 - - 16 11 -
- - 1 - - 2 4 - - 3 3 - - 10 7 -
Notes: Sketch:
Max Queue
Average Queue
1 - A vehicle is queued when it is at the stop bar or behind another queued vehicle, and traveling less than 7 mph
Cycle
Eastbound Westbound Southbound Northbound
Saline St Greenfield Ave 2nd Ave 2nd Ave/Irvine St
SR 885 - 2nd Ave
Greenfield Ave 7:41am - 8:14am
Signalized Queue Observation Worksheet 11/12/18 CRB
North
Greenfield Ave
2nd Ave/Irvine StSaline St
2nd Ave
N:\35081-000\Planning\Data\Queuing Studies\Queue Study-SR 885 - 2nd Ave.xlsx \ AM Greenfield Ave Dataset Page 3 of 10
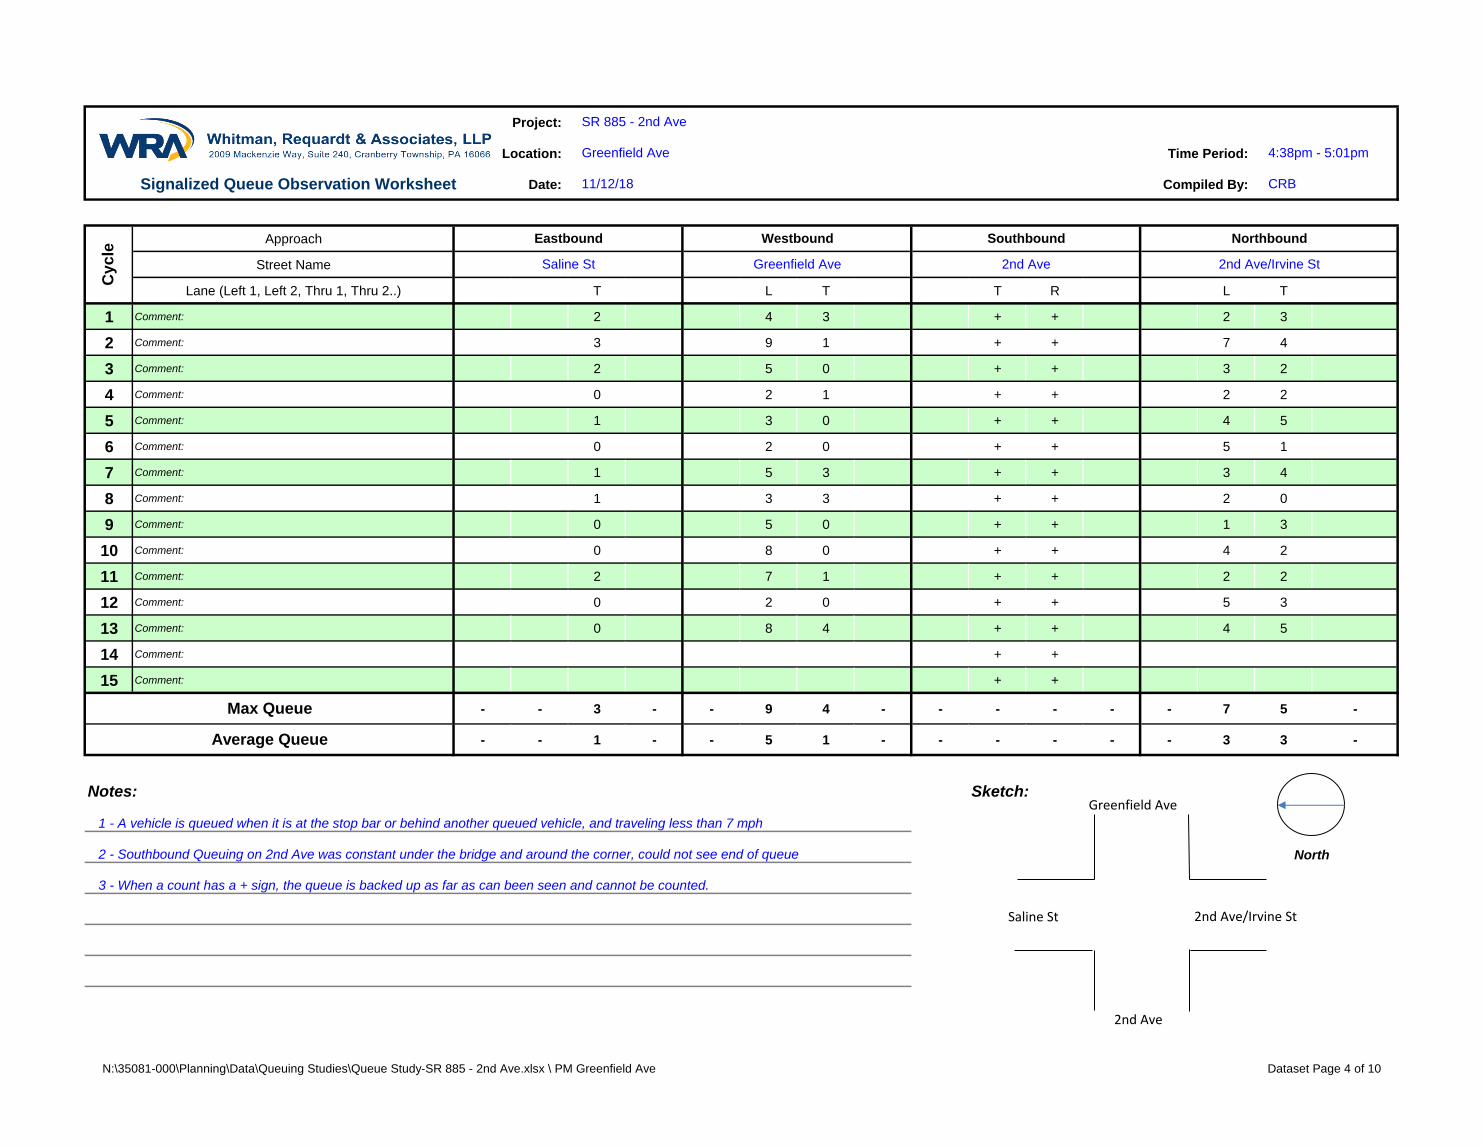
Project:
Location: Time Period:
Date: Compiled By:
Approach
Street Name
Lane (Left 1, Left 2, Thru 1, Thru 2..) T L T T R L T
1 Comment: 2 4 3 + + 2 3
2 Comment: 3 9 1 + + 7 4
3 Comment: 2 5 0 + + 3 2
4 Comment: 0 2 1 + + 2 2
5 Comment: 1 3 0 + + 4 5
6 Comment: 0 2 0 + + 5 1
7 Comment: 1 5 3 + + 3 4
8 Comment: 1 3 3 + + 2 0
9 Comment: 0 5 0 + + 1 3
10 Comment: 0 8 0 + + 4 2
11 Comment: 2 7 1 + + 2 2
12 Comment: 0 2 0 + + 5 3
13 Comment: 0 8 4 + + 4 5
14 Comment: + +
15 Comment: + +
- - 3 - - 9 4 - - - - - - 7 5 -
- - 1 - - 5 1 - - - - - - 3 3 -
Notes: Sketch:
SR 885 - 2nd Ave
Greenfield Ave 4:38pm - 5:01pm
Signalized Queue Observation Worksheet 11/12/18 CRB
Cycle
Eastbound Westbound Southbound Northbound
Saline St Greenfield Ave 2nd Ave 2nd Ave/Irvine St
Max Queue
Average Queue
1 - A vehicle is queued when it is at the stop bar or behind another queued vehicle, and traveling less than 7 mph
2 - Southbound Queuing on 2nd Ave was constant under the bridge and around the corner, could not see end of queue
3 - When a count has a + sign, the queue is backed up as far as can been seen and cannot be counted.
North
Greenfield Ave
2nd Ave/Irvine StSaline St
2nd Ave
N:\35081-000\Planning\Data\Queuing Studies\Queue Study-SR 885 - 2nd Ave.xlsx \ PM Greenfield Ave Dataset Page 4 of 10
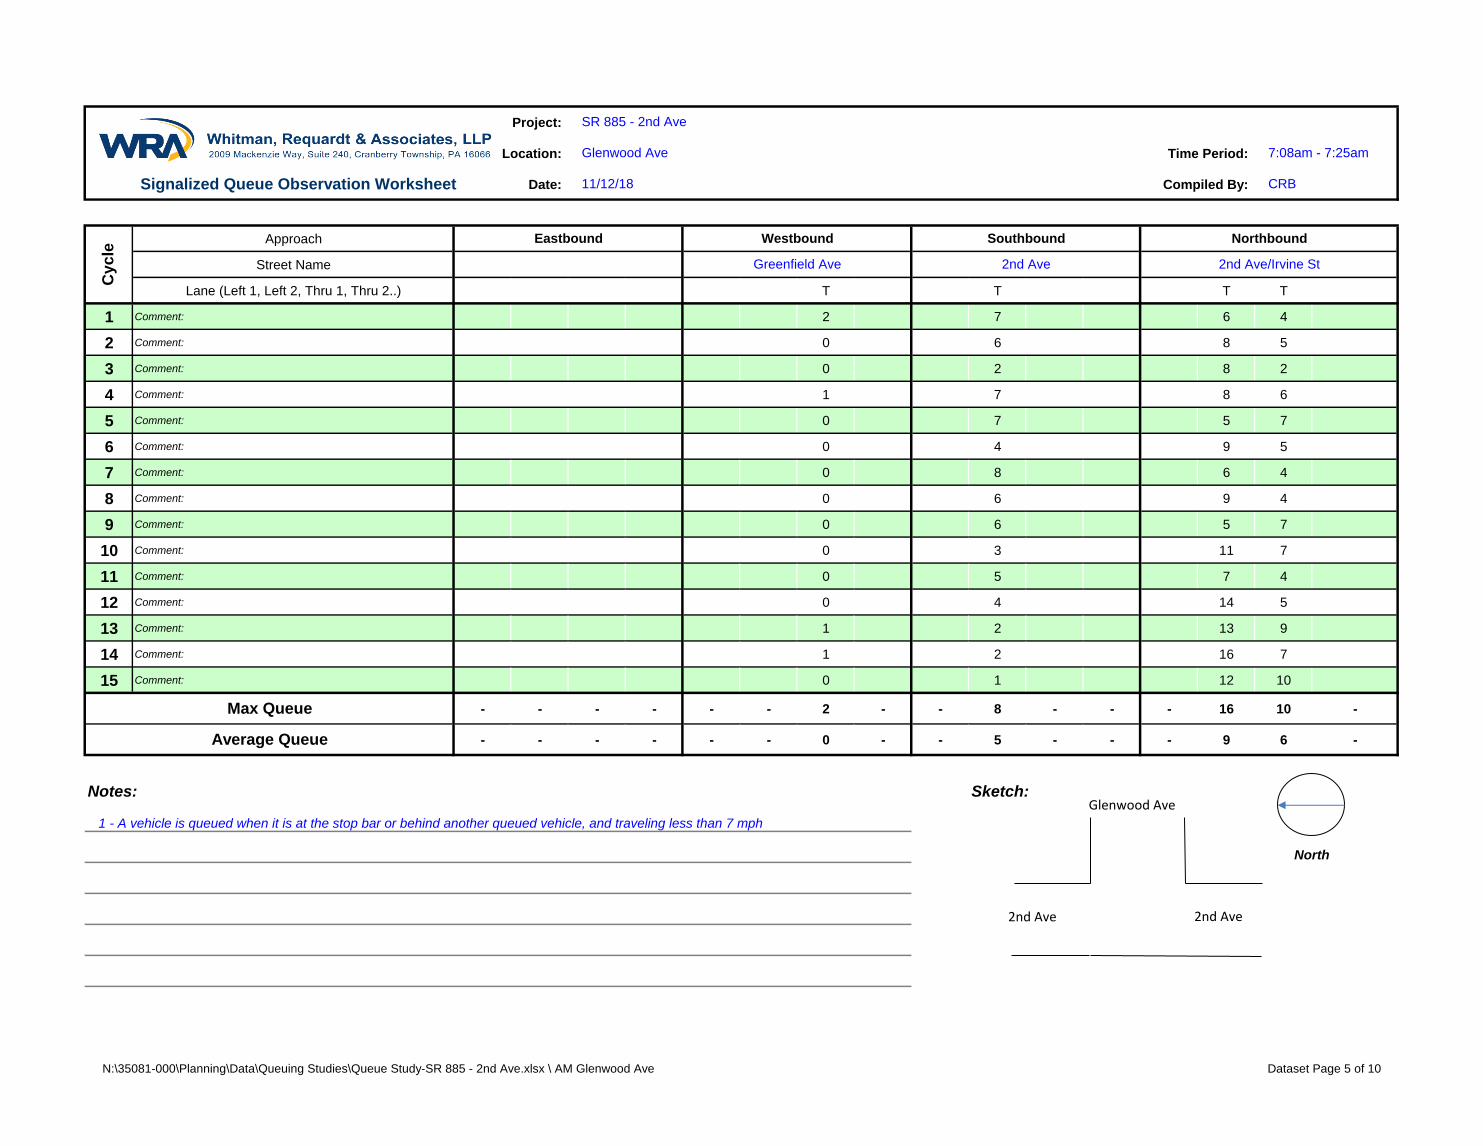
Project:
Location: Time Period:
Date: Compiled By:
Approach
Street Name
Lane (Left 1, Left 2, Thru 1, Thru 2..) T T T T
1 Comment: 2 7 6 4
2 Comment: 0 6 8 5
3 Comment: 0 2 8 2
4 Comment: 1 7 8 6
5 Comment: 0 7 5 7
6 Comment: 0 4 9 5
7 Comment: 0 8 6 4
8 Comment: 0 6 9 4
9 Comment: 0 6 5 7
10 Comment: 0 3 11 7
11 Comment: 0 5 7 4
12 Comment: 0 4 14 5
13 Comment: 1 2 13 9
14 Comment: 1 2 16 7
15 Comment: 0 1 12 10
- - - - - - 2 - - 8 - - - 16 10 -
- - - - - - 0 - - 5 - - - 9 6 -
Notes: Sketch:
SR 885 - 2nd Ave
Glenwood Ave 7:08am - 7:25am
Signalized Queue Observation Worksheet 11/12/18 CRB
Cycle
Eastbound Westbound Southbound Northbound
Greenfield Ave 2nd Ave 2nd Ave/Irvine St
Max Queue
Average Queue
1 - A vehicle is queued when it is at the stop bar or behind another queued vehicle, and traveling less than 7 mph
North
Glenwood Ave
2nd Ave2nd Ave
N:\35081-000\Planning\Data\Queuing Studies\Queue Study-SR 885 - 2nd Ave.xlsx \ AM Glenwood Ave Dataset Page 5 of 10
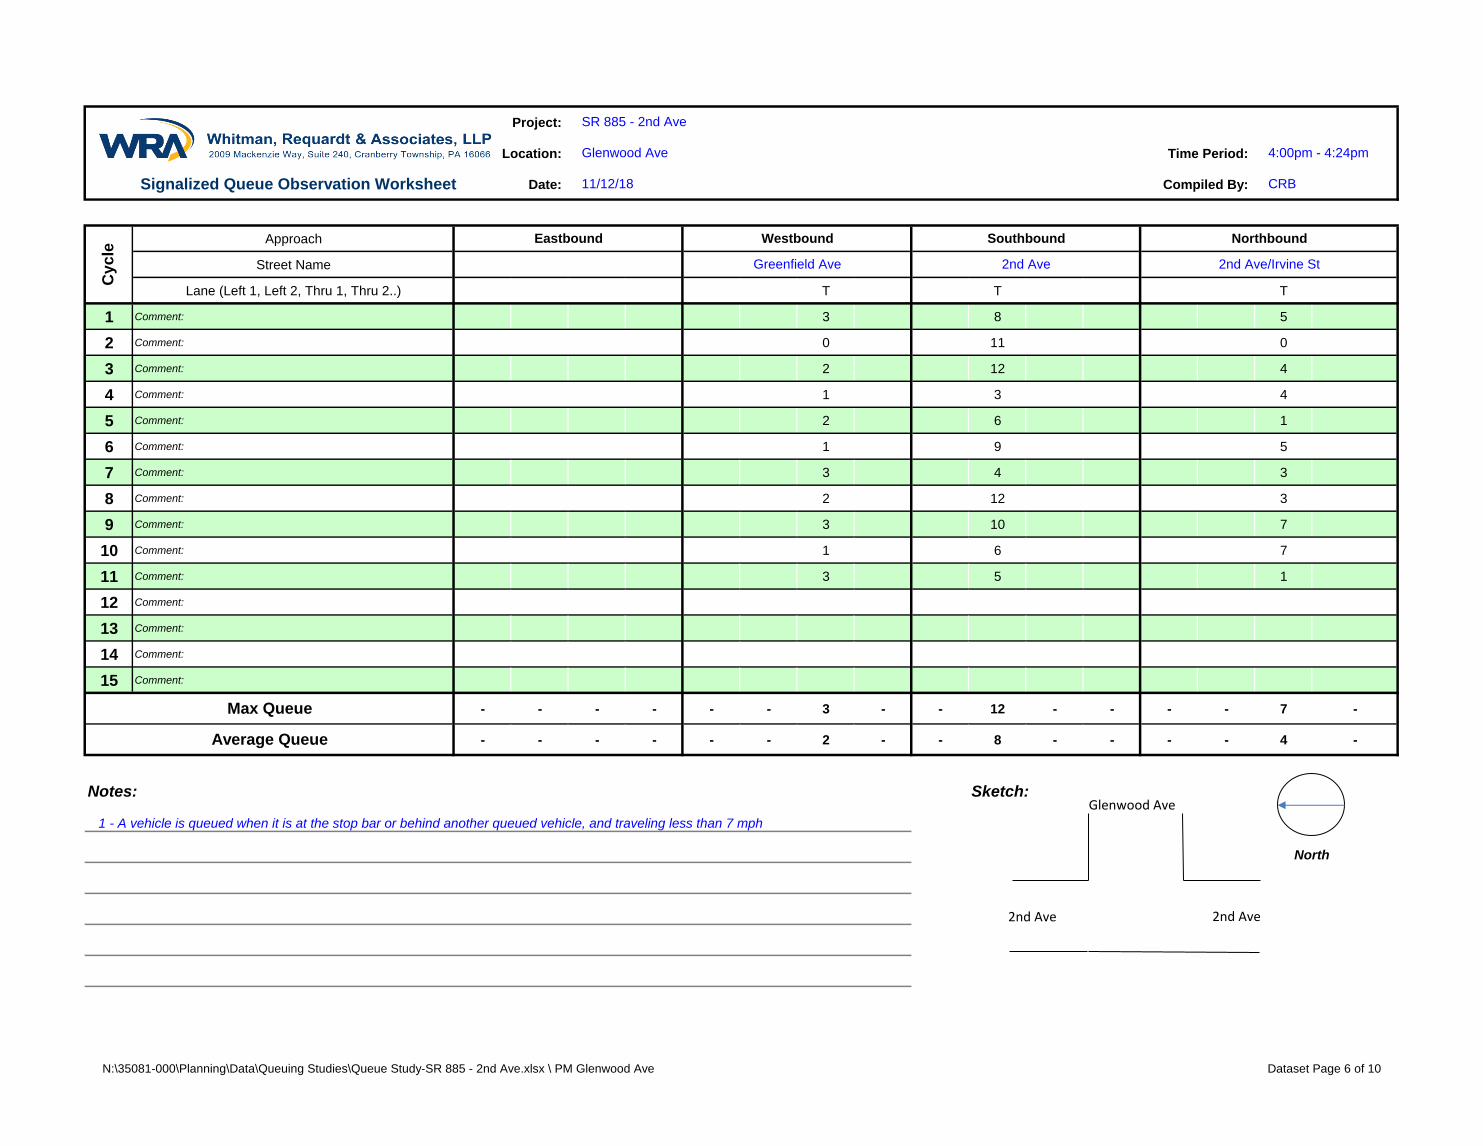
Project:
Location: Time Period:
Date: Compiled By:
Approach
Street Name
Lane (Left 1, Left 2, Thru 1, Thru 2..) T T T
1 Comment: 3 8 5
2 Comment: 0 11 0
3 Comment: 2 12 4
4 Comment: 1 3 4
5 Comment: 2 6 1
6 Comment: 1 9 5
7 Comment: 3 4 3
8 Comment: 2 12 3
9 Comment: 3 10 7
10 Comment: 1 6 7
11 Comment: 3 5 1
12 Comment:
13 Comment:
14 Comment:
15 Comment:
- - - - - - 3 - - 12 - - - - 7 -
- - - - - - 2 - - 8 - - - - 4 -
Notes: Sketch:
SR 885 - 2nd Ave
Glenwood Ave 4:00pm - 4:24pm
Signalized Queue Observation Worksheet 11/12/18 CRB
Cycle
Eastbound Westbound Southbound Northbound
Greenfield Ave 2nd Ave 2nd Ave/Irvine St
Max Queue
Average Queue
1 - A vehicle is queued when it is at the stop bar or behind another queued vehicle, and traveling less than 7 mph
North
Glenwood Ave
2nd Ave2nd Ave
N:\35081-000\Planning\Data\Queuing Studies\Queue Study-SR 885 - 2nd Ave.xlsx \ PM Glenwood Ave Dataset Page 6 of 10
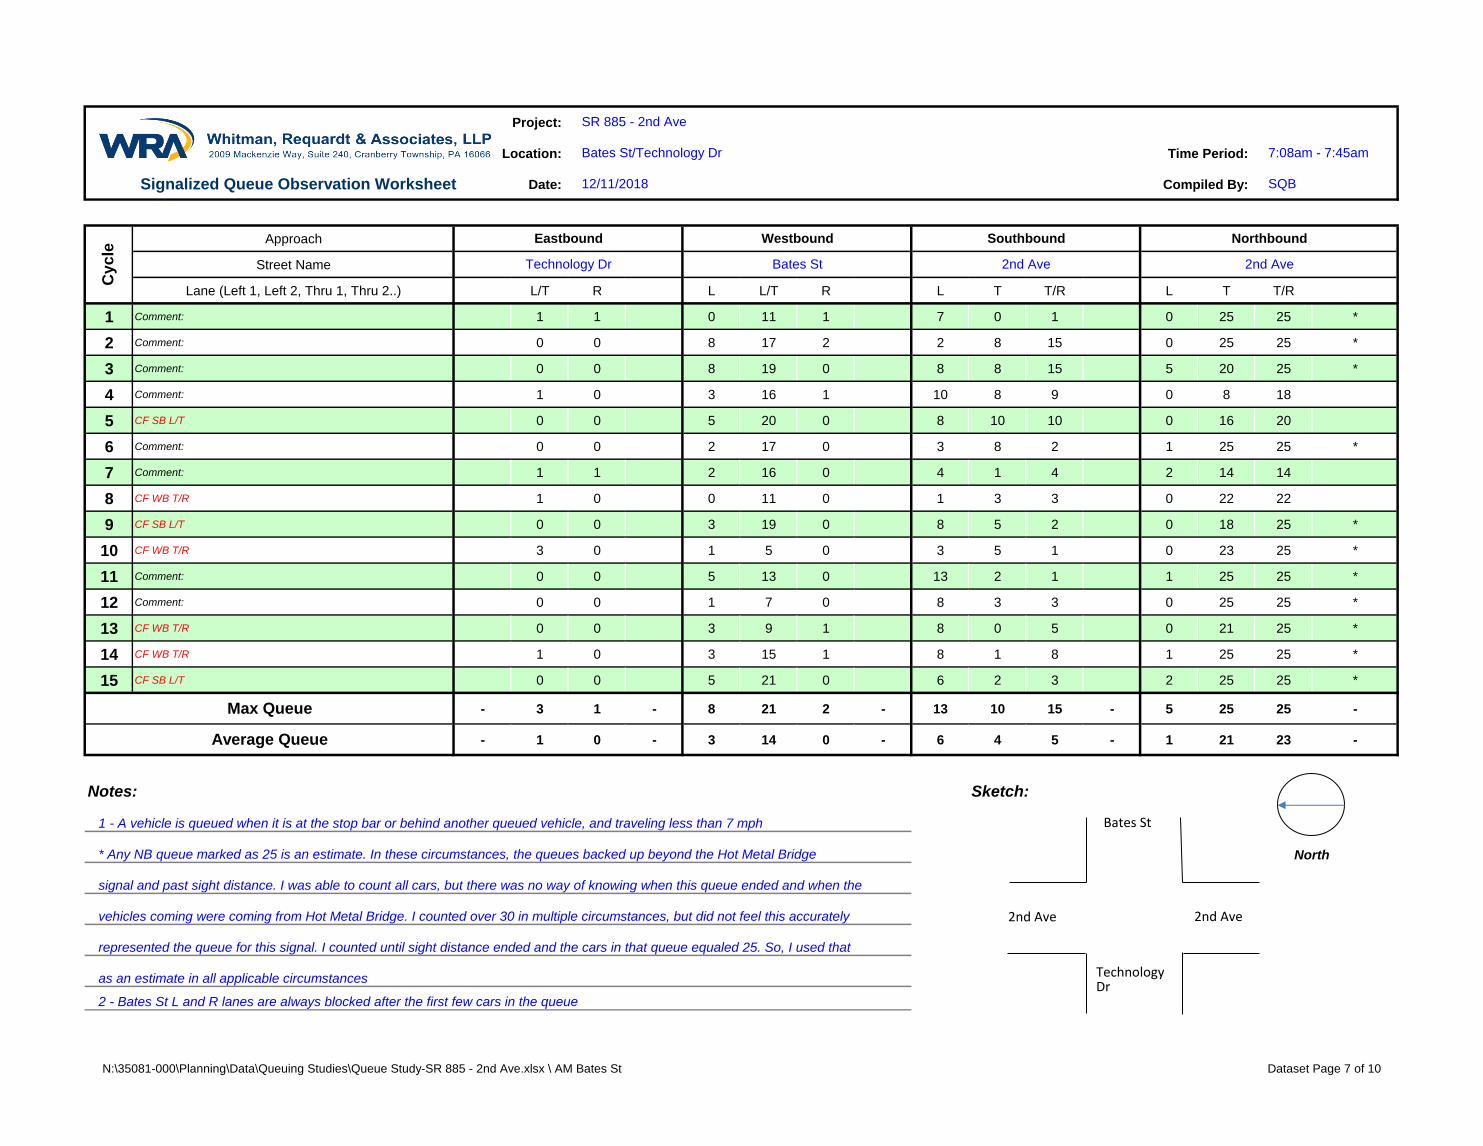
Project:
Location: Time Period:
Date: Compiled By:
Approach
Street Name
Lane (Left 1, Left 2, Thru 1, Thru 2..) L/T R L L/T R L T T/R L T T/R
1 Comment: 1 1 0 11 1 7 0 1 0 25 25 *
2 Comment: 0 0 8 17 2 2 8 15 0 25 25 *
3 Comment: 0 0 8 19 0 8 8 15 5 20 25 *
4 Comment: 1 0 3 16 1 10 8 9 0 8 18
5 CF SB L/T 0 0 5 20 0 8 10 10 0 16 20
6 Comment: 0 0 2 17 0 3 8 2 1 25 25 *
7 Comment: 1 1 2 16 0 4 1 4 2 14 14
8 CF WB T/R 1 0 0 11 0 1 3 3 0 22 22
9 CF SB L/T 0 0 3 19 0 8 5 2 0 18 25 *
10 CF WB T/R 3 0 1 5 0 3 5 1 0 23 25 *
11 Comment: 0 0 5 13 0 13 2 1 1 25 25 *
12 Comment: 0 0 1 7 0 8 3 3 0 25 25 *
13 CF WB T/R 0 0 3 9 1 8 0 5 0 21 25 *
14 CF WB T/R 1 0 3 15 1 8 1 8 1 25 25 *
15 CF SB L/T 0 0 5 21 0 6 2 3 2 25 25 *
- 3 1 - 8 21 2 - 13 10 15 - 5 25 25 -
- 1 0 - 3 14 0 - 6 4 5 - 1 21 23 -
Notes: Sketch:
represented the queue for this signal. I counted until sight distance ended and the cars in that queue equaled 25. So, I used that
as an estimate in all applicable circumstances
2 - Bates St L and R lanes are always blocked after the first few cars in the queue
Max Queue
Average Queue
1 - A vehicle is queued when it is at the stop bar or behind another queued vehicle, and traveling less than 7 mph
* Any NB queue marked as 25 is an estimate. In these circumstances, the queues backed up beyond the Hot Metal Bridge
signal and past sight distance. I was able to count all cars, but there was no way of knowing when this queue ended and when the
vehicles coming were coming from Hot Metal Bridge. I counted over 30 in multiple circumstances, but did not feel this accurately
Cycle
Eastbound Westbound Southbound Northbound
Technology Dr Bates St 2nd Ave 2nd Ave
SR 885 - 2nd Ave
Bates St/Technology Dr 7:08am - 7:45am
Signalized Queue Observation Worksheet 12/11/2018 SQB
North
Bates St
2nd Ave2nd Ave
TechnologyDr
N:\35081-000\Planning\Data\Queuing Studies\Queue Study-SR 885 - 2nd Ave.xlsx \ AM Bates St Dataset Page 7 of 10

Project:
Location: Time Period:
Date: Compiled By:
Approach
Street Name
Lane (Left 1, Left 2, Thru 1, Thru 2..) L/T R L L/T R L T T/R L T T/R
1 CF SB L/T, EB L, WB T/R, WB T 6 0 0 16 0 22 9 5 3 25 25 *
2 CF SB L/T, EB LT, WB T/R 7 0 8 25 0 25 9 13 * 0 23 25 *
3 CF EB L, WB T/R 4 5 8 14 0 25 4 3 * 0 13 25 *
4 CF SB L/T, EB L WB T/R 9 3 3 19 0 25 10 8 * 0 4 25 *
5 CF EB L, WB T/R, WB T 9 1 5 16 0 25 17 17 * 0 25 25 *
6 CF NB L/T, EB L, EB T, EB T/R, WB T/R, WB T 17 4 2 14 0 25 25 25 * 4 25 25 *
7 CF SB L/T, EB L, EB T, EB T/R, WB T/R, WB T 4 0 2 15 0 25 25 15 * 0 25 25 *
8 CF EB L, WB T/R, WB T 6 4 0 16 0 25 15 12 * 0 14 25 *
9 CF SB L,/T, WB T/R - Note 9 6 0 3 20 3 14 9 7 0 10 25 *
10 CF SB L/T 5 1 1 17 0 12 3 0 0 8 15
11 CF SB L/T, EB L, EB T 2 6 5 16 2 15 25 20 * 2 10 25 *
12 CF SB L/T, EB L 3 7 1 18 0 25 11 6 * 0 12 12
13 CF SB L/T, EB L 3 2 3 18 0 25 16 9 * 0 10 15
14 CF SB L/T, EB L, WB T/R 6 0 3 18 0 25 5 12 * 0 15 19
15 CF SB L/T, EB L, WB T/R 5 0 5 20 0 20 12 9 0 7 25 *
- 17 7 - 8 25 3 - 25 25 25 - 4 25 25 -
- 6 2 - 3 17 0 - 22 13 11 - 1 15 22 -
Notes: Sketch:
3 - SB L cycle usually does not fail when it gets an extended green arrow. This is only active when actuated by NB L turns.
9 - Cyclist included as part of the queue.
Max Queue
Average Queue
1 - A vehicle is queued when it is at the stop bar or behind another queued vehicle, and traveling less than 7 mph
* Any queue marked as 25 is an estimate. In these circumstances, the queues were beyond sight distance and I counted until
I couldn't see anymore. The number I got was 25. In reality, the queues are longer than this.
2 - Bates St L and R lanes are always blocked after the first few cars in the queue
Cycle
Eastbound Westbound Southbound Northbound
Technology Dr Bates St 2nd Ave 2nd Ave
SR 885 - 2nd Ave
Bates St/Technology Dr 4:50pm - 5:28pm
Signalized Queue Observation Worksheet 12/11/2018 SQB
North
Bates St
2nd Ave2nd Ave
TechnologyDr
N:\35081-000\Planning\Data\Queuing Studies\Queue Study-SR 885 - 2nd Ave.xlsx \ PM Bates St Dataset Page 8 of 10
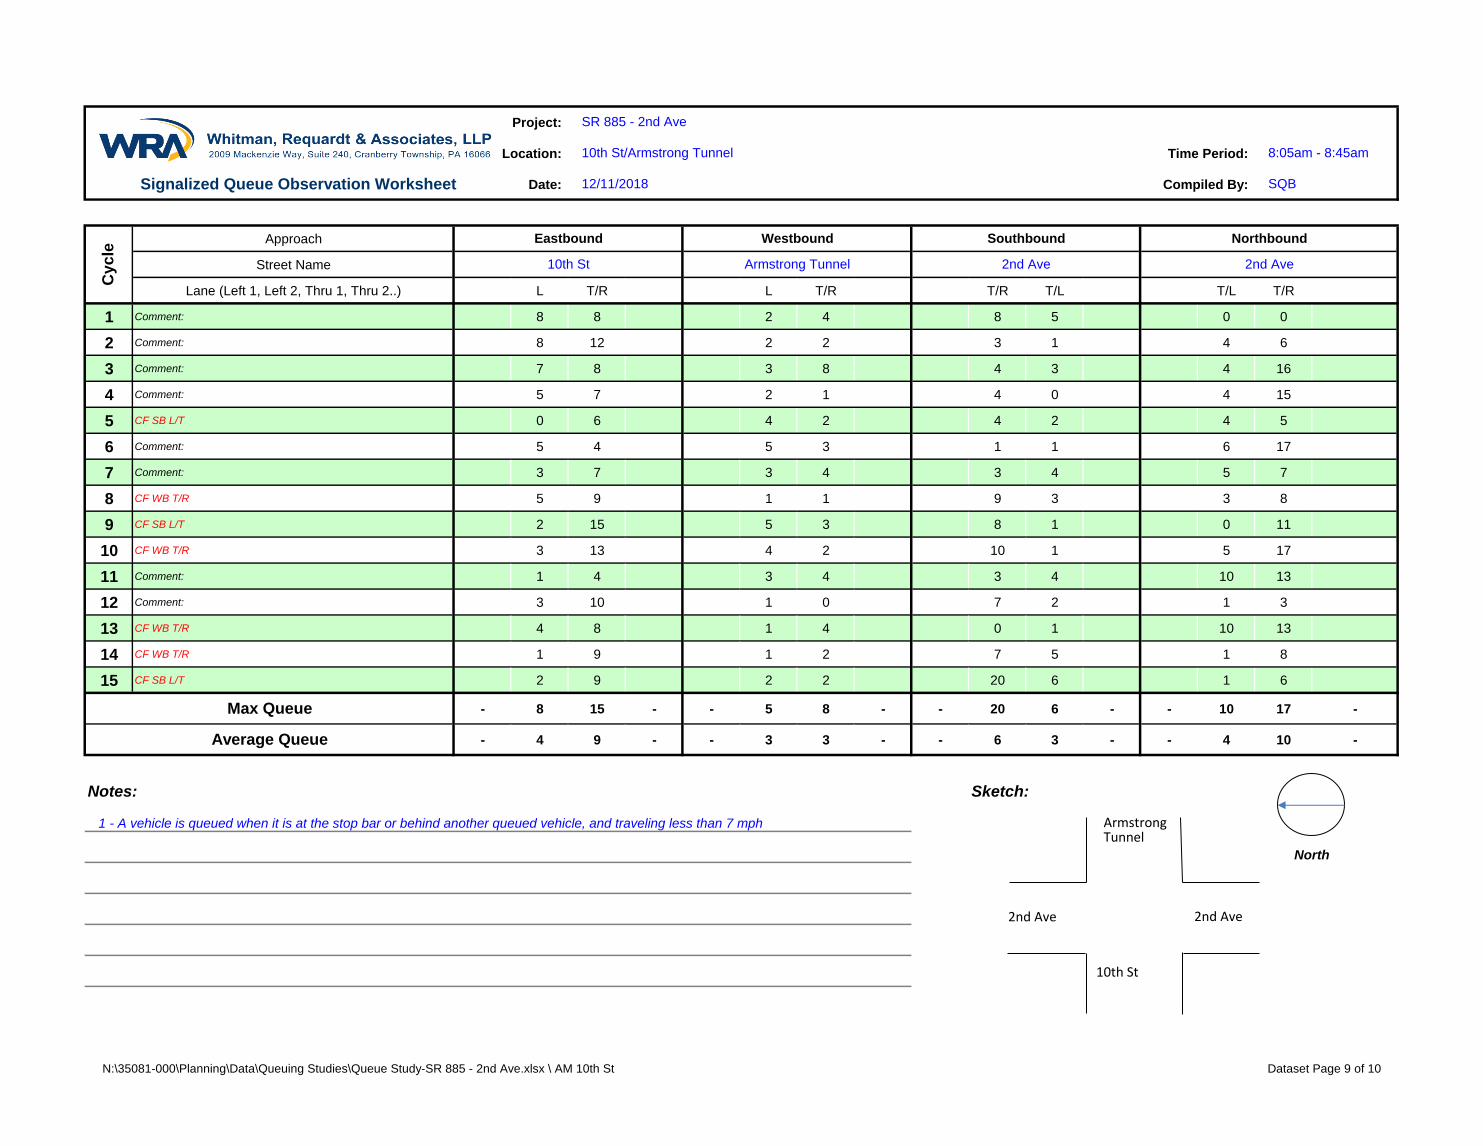
Project:
Location: Time Period:
Date: Compiled By:
Approach
Street Name
Lane (Left 1, Left 2, Thru 1, Thru 2..) L T/R L T/R T/R T/L T/L T/R
1 Comment: 8 8 2 4 8 5 0 0
2 Comment: 8 12 2 2 3 1 4 6
3 Comment: 7 8 3 8 4 3 4 16
4 Comment: 5 7 2 1 4 0 4 15
5 CF SB L/T 0 6 4 2 4 2 4 5
6 Comment: 5 4 5 3 1 1 6 17
7 Comment: 3 7 3 4 3 4 5 7
8 CF WB T/R 5 9 1 1 9 3 3 8
9 CF SB L/T 2 15 5 3 8 1 0 11
10 CF WB T/R 3 13 4 2 10 1 5 17
11 Comment: 1 4 3 4 3 4 10 13
12 Comment: 3 10 1 0 7 2 1 3
13 CF WB T/R 4 8 1 4 0 1 10 13
14 CF WB T/R 1 9 1 2 7 5 1 8
15 CF SB L/T 2 9 2 2 20 6 1 6
- 8 15 - - 5 8 - - 20 6 - - 10 17 -
- 4 9 - - 3 3 - - 6 3 - - 4 10 -
Notes: Sketch:
Max Queue
Average Queue
1 - A vehicle is queued when it is at the stop bar or behind another queued vehicle, and traveling less than 7 mph
Cycle
Eastbound Westbound Southbound Northbound
10th St Armstrong Tunnel 2nd Ave 2nd Ave
SR 885 - 2nd Ave
10th St/Armstrong Tunnel 8:05am - 8:45am
Signalized Queue Observation Worksheet 12/11/2018 SQB
North
ArmstrongTunnel
2nd Ave2nd Ave
10th St
N:\35081-000\Planning\Data\Queuing Studies\Queue Study-SR 885 - 2nd Ave.xlsx \ AM 10th St Dataset Page 9 of 10

Project:
Location: Time Period:
Date: Compiled By:
Approach
Street Name
Lane (Left 1, Left 2, Thru 1, Thru 2..) L T/R L T/R T/R T/L T/L T/R
1 CF SB L/T 4 10 10 3 10 4 4 10
2 CF SB L/T - Comment 2 1 6 2 7 15 5 3 15
3 Comment: 0 6 7 9 14 9 7 10
4 Comment: 4 4 3 3 14 3 3 16
5 CF SB L/T 1 9 3 7 17 9 11 9
6 Comment 6 4 10 * 6 8 10 6 10 15
7 Comment 7 0 13 2 7 15 7 15 20 *
8 CF SB L 0 10 8 8 8 5 8 9
9 Comment: 1 8 5 8 1 3 1 6
10 Comment: 3 1 4 11 10 5 8 13
11 CF EB T/R - Comment 11 2 10 1 6 10 4 8 5
12 Comment: 5 3 5 11 14 8 2 7
13 Comment: 1 3 13 8 6 5 0 0
14 CF SB L - Comment 14 2 8 8 8 9 6 5 12
15 CF SB L 4 5 11 5 12 4 4 8
- 5 13 - - 13 11 - - 17 9 - - 15 20 -
- 2 7 - - 6 7 - - 11 6 - - 6 10 -
Notes: Sketch:
11 - CF occurred due to a bus stopping and dropping off in the middle of the queue
14 - CF occurred due to a dump truck being at the front of the queue and making a very slow turn
Max Queue
Average Queue
1 - A vehicle is queued when it is at the stop bar or behind another queued vehicle, and traveling less than 7 mph
2 - Only 2 cars could be seen. This movement had no protected phase. Much more cars were queued in the tunnel
6 - EB L queue included one bicycle
7 - SB T/R queue was longer than sight distance. I counted 20 cars, but there were more than 20 in the queue.
Cycle
Eastbound Westbound Southbound Northbound
10th St Armstrong Tunnel 2nd Ave 2nd Ave
SR 885 - 2nd Ave
10th St/Armstrong Tunnel 8:05am - 8:45am
Signalized Queue Observation Worksheet 12/11/2018 SQB
North
ArmstrongTunnel
2nd Ave2nd Ave
10th St
N:\35081-000\Planning\Data\Queuing Studies\Queue Study-SR 885 - 2nd Ave.xlsx \ PM 10th St Dataset Page 10 of 10

Appendix E HSM-Based Crash Analysis Detail

Appendix E | State Route 885 / Second Avenue Multimodal Corridor Study p. 1
Notice
"In accordance with PA Consolidated Statutes Title 75-Vehicles (Vehicle Code) Section 3754
and 23 U.S.C. Section 409, this safety study is confidential, and the publication, reproduction,
release, or discussion of these materials is prohibited without the specific written consent of the
Pennsylvania Department of Transportation's Office of Chief Counsel. This safety study is only
provided to official agencies with official duties/responsibilities in the project development."
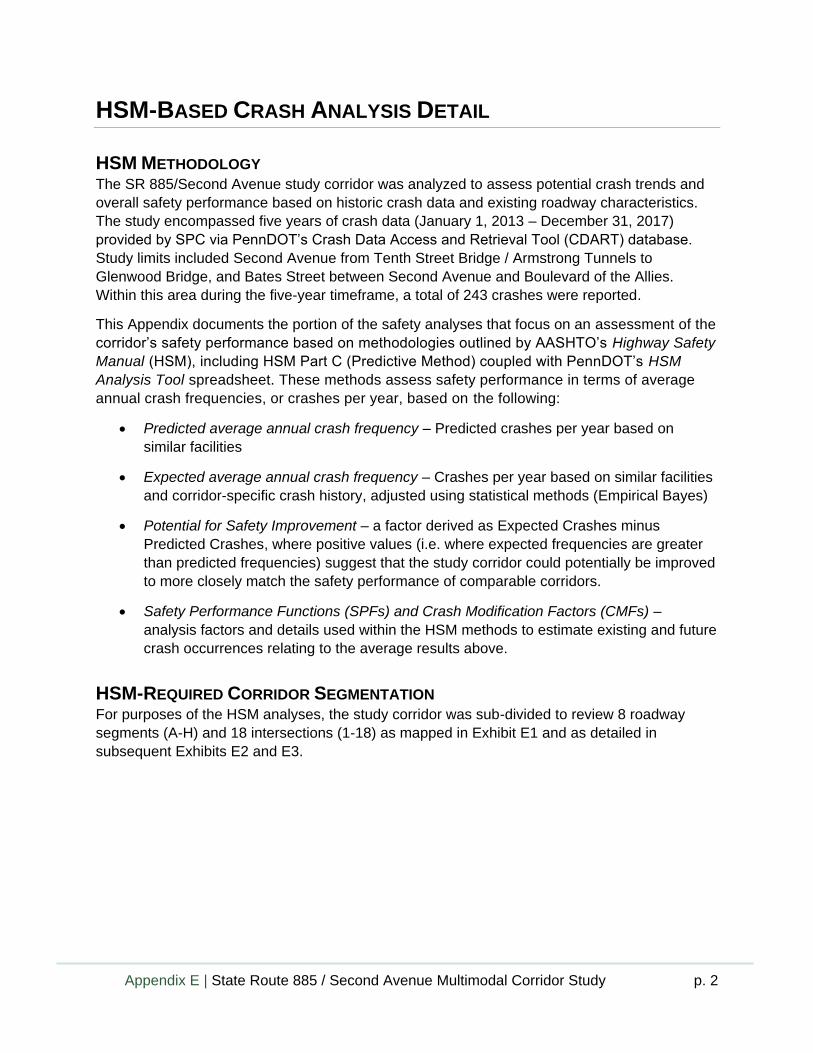
Appendix E | State Route 885 / Second Avenue Multimodal Corridor Study p. 2
HSM-BASED CRASH ANALYSIS DETAIL
HSM METHODOLOGY The SR 885/Second Avenue study corridor was analyzed to assess potential crash trends and
overall safety performance based on historic crash data and existing roadway characteristics.
The study encompassed five years of crash data (January 1, 2013 – December 31, 2017)
provided by SPC via PennDOT’s Crash Data Access and Retrieval Tool (CDART) database.
Study limits included Second Avenue from Tenth Street Bridge / Armstrong Tunnels to
Glenwood Bridge, and Bates Street between Second Avenue and Boulevard of the Allies.
Within this area during the five-year timeframe, a total of 243 crashes were reported.
This Appendix documents the portion of the safety analyses that focus on an assessment of the
corridor’s safety performance based on methodologies outlined by AASHTO’s Highway Safety
Manual (HSM), including HSM Part C (Predictive Method) coupled with PennDOT’s HSM
Analysis Tool spreadsheet. These methods assess safety performance in terms of average
annual crash frequencies, or crashes per year, based on the following:
• Predicted average annual crash frequency – Predicted crashes per year based on
similar facilities
• Expected average annual crash frequency – Crashes per year based on similar facilities
and corridor-specific crash history, adjusted using statistical methods (Empirical Bayes)
• Potential for Safety Improvement – a factor derived as Expected Crashes minus
Predicted Crashes, where positive values (i.e. where expected frequencies are greater
than predicted frequencies) suggest that the study corridor could potentially be improved
to more closely match the safety performance of comparable corridors.
• Safety Performance Functions (SPFs) and Crash Modification Factors (CMFs) –
analysis factors and details used within the HSM methods to estimate existing and future
crash occurrences relating to the average results above.
HSM-REQUIRED CORRIDOR SEGMENTATION For purposes of the HSM analyses, the study corridor was sub-divided to review 8 roadway
segments (A-H) and 18 intersections (1-18) as mapped in Exhibit E1 and as detailed in
subsequent Exhibits E2 and E3.

Appendix E | State Route 885 / Second Avenue Multimodal Corridor Study p. 3
Exhibit E1: HSM-Based Crash Analysis Segments and Intersections
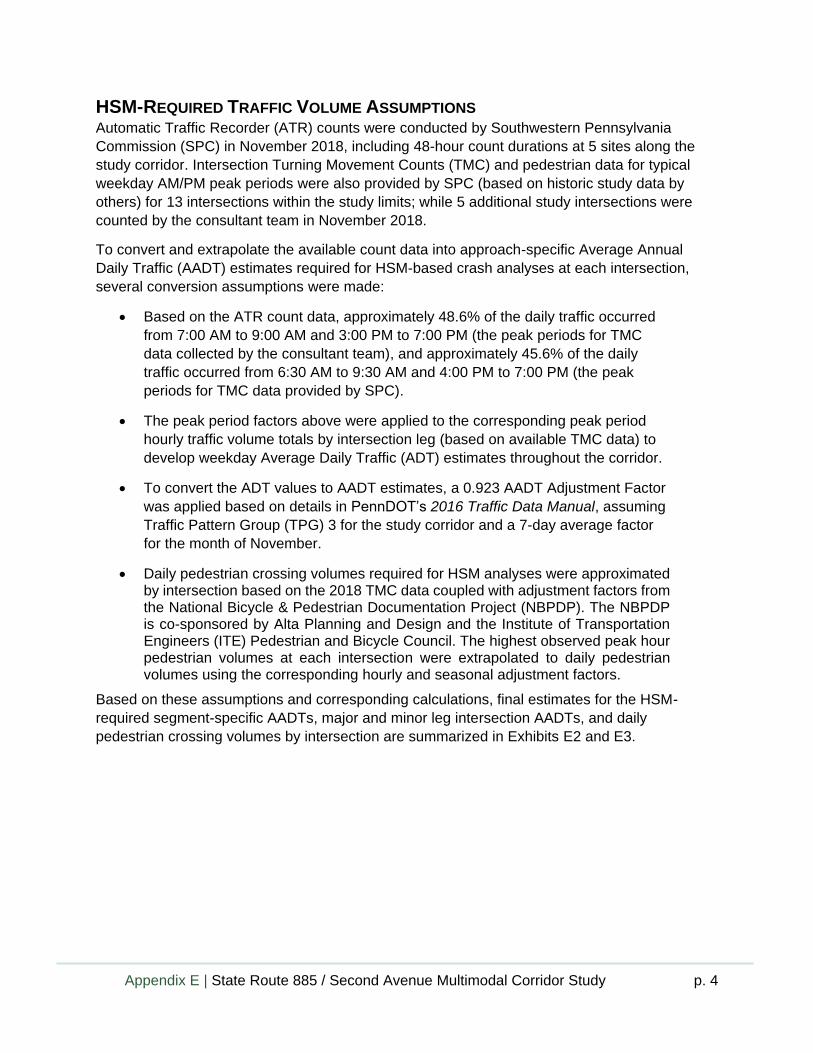
Appendix E | State Route 885 / Second Avenue Multimodal Corridor Study p. 4
HSM-REQUIRED TRAFFIC VOLUME ASSUMPTIONS Automatic Traffic Recorder (ATR) counts were conducted by Southwestern Pennsylvania
Commission (SPC) in November 2018, including 48-hour count durations at 5 sites along the
study corridor. Intersection Turning Movement Counts (TMC) and pedestrian data for typical
weekday AM/PM peak periods were also provided by SPC (based on historic study data by
others) for 13 intersections within the study limits; while 5 additional study intersections were
counted by the consultant team in November 2018.
To convert and extrapolate the available count data into approach-specific Average Annual
Daily Traffic (AADT) estimates required for HSM-based crash analyses at each intersection,
several conversion assumptions were made:
• Based on the ATR count data, approximately 48.6% of the daily traffic occurred
from 7:00 AM to 9:00 AM and 3:00 PM to 7:00 PM (the peak periods for TMC
data collected by the consultant team), and approximately 45.6% of the daily
traffic occurred from 6:30 AM to 9:30 AM and 4:00 PM to 7:00 PM (the peak
periods for TMC data provided by SPC).
• The peak period factors above were applied to the corresponding peak period
hourly traffic volume totals by intersection leg (based on available TMC data) to
develop weekday Average Daily Traffic (ADT) estimates throughout the corridor.
• To convert the ADT values to AADT estimates, a 0.923 AADT Adjustment Factor
was applied based on details in PennDOT’s 2016 Traffic Data Manual, assuming
Traffic Pattern Group (TPG) 3 for the study corridor and a 7-day average factor
for the month of November.
• Daily pedestrian crossing volumes required for HSM analyses were approximated by intersection based on the 2018 TMC data coupled with adjustment factors from the National Bicycle & Pedestrian Documentation Project (NBPDP). The NBPDP is co-sponsored by Alta Planning and Design and the Institute of Transportation Engineers (ITE) Pedestrian and Bicycle Council. The highest observed peak hour pedestrian volumes at each intersection were extrapolated to daily pedestrian volumes using the corresponding hourly and seasonal adjustment factors.
Based on these assumptions and corresponding calculations, final estimates for the HSM-
required segment-specific AADTs, major and minor leg intersection AADTs, and daily
pedestrian crossing volumes by intersection are summarized in Exhibits E2 and E3.
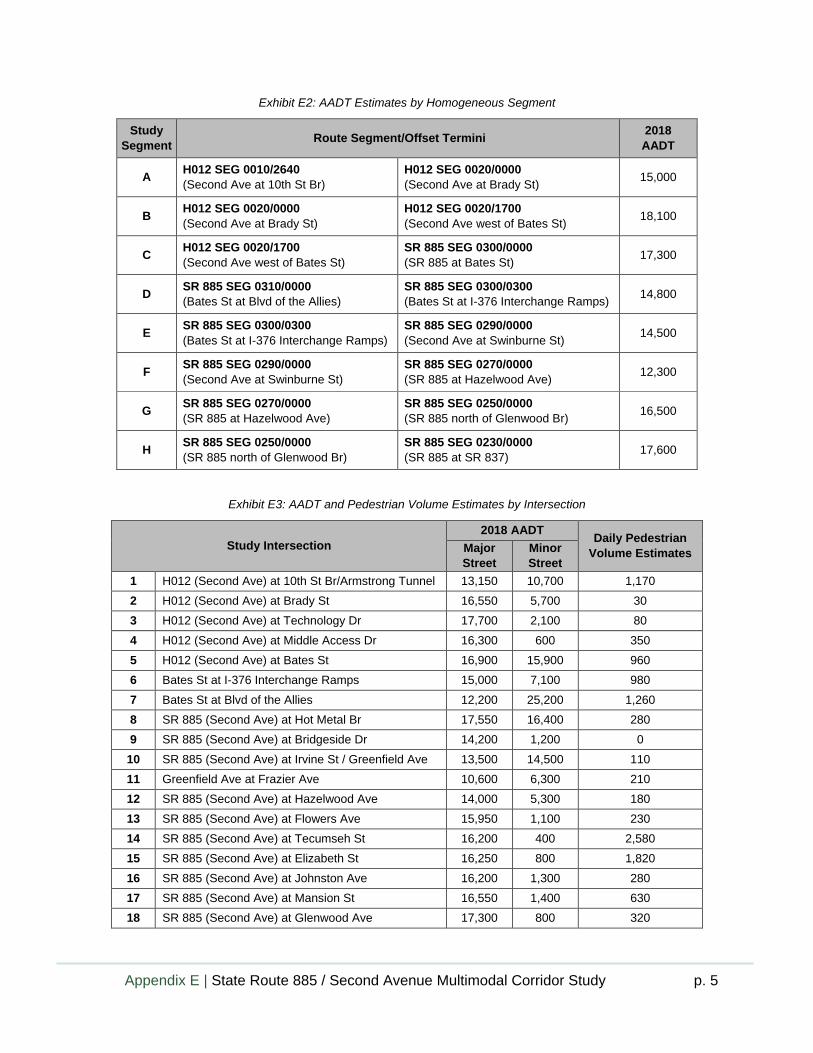
Appendix E | State Route 885 / Second Avenue Multimodal Corridor Study p. 5
Exhibit E2: AADT Estimates by Homogeneous Segment
Study
Segment Route Segment/Offset Termini
2018
AADT
A H012 SEG 0010/2640
(Second Ave at 10th St Br)
H012 SEG 0020/0000
(Second Ave at Brady St) 15,000
B H012 SEG 0020/0000
(Second Ave at Brady St)
H012 SEG 0020/1700
(Second Ave west of Bates St) 18,100
C H012 SEG 0020/1700
(Second Ave west of Bates St)
SR 885 SEG 0300/0000
(SR 885 at Bates St) 17,300
D SR 885 SEG 0310/0000
(Bates St at Blvd of the Allies)
SR 885 SEG 0300/0300
(Bates St at I-376 Interchange Ramps) 14,800
E SR 885 SEG 0300/0300
(Bates St at I-376 Interchange Ramps)
SR 885 SEG 0290/0000
(Second Ave at Swinburne St) 14,500
F SR 885 SEG 0290/0000
(Second Ave at Swinburne St)
SR 885 SEG 0270/0000
(SR 885 at Hazelwood Ave) 12,300
G SR 885 SEG 0270/0000
(SR 885 at Hazelwood Ave)
SR 885 SEG 0250/0000
(SR 885 north of Glenwood Br) 16,500
H SR 885 SEG 0250/0000
(SR 885 north of Glenwood Br)
SR 885 SEG 0230/0000
(SR 885 at SR 837) 17,600
Exhibit E3: AADT and Pedestrian Volume Estimates by Intersection
Study Intersection
2018 AADT Daily Pedestrian
Volume Estimates Major
Street
Minor
Street
1 H012 (Second Ave) at 10th St Br/Armstrong Tunnel 13,150 10,700 1,170
2 H012 (Second Ave) at Brady St 16,550 5,700 30
3 H012 (Second Ave) at Technology Dr 17,700 2,100 80
4 H012 (Second Ave) at Middle Access Dr 16,300 600 350
5 H012 (Second Ave) at Bates St 16,900 15,900 960
6 Bates St at I-376 Interchange Ramps 15,000 7,100 980
7 Bates St at Blvd of the Allies 12,200 25,200 1,260
8 SR 885 (Second Ave) at Hot Metal Br 17,550 16,400 280
9 SR 885 (Second Ave) at Bridgeside Dr 14,200 1,200 0
10 SR 885 (Second Ave) at Irvine St / Greenfield Ave 13,500 14,500 110
11 Greenfield Ave at Frazier Ave 10,600 6,300 210
12 SR 885 (Second Ave) at Hazelwood Ave 14,000 5,300 180
13 SR 885 (Second Ave) at Flowers Ave 15,950 1,100 230
14 SR 885 (Second Ave) at Tecumseh St 16,200 400 2,580
15 SR 885 (Second Ave) at Elizabeth St 16,250 800 1,820
16 SR 885 (Second Ave) at Johnston Ave 16,200 1,300 280
17 SR 885 (Second Ave) at Mansion St 16,550 1,400 630
18 SR 885 (Second Ave) at Glenwood Ave 17,300 800 320
Appendix E | State Route 885 / Second Avenue Multimodal Corridor Study p. 6
HSM-REQUIRED ADDITIONAL INPUT DETAILS In addition to the preceding inputs related to observed crash data, corridor segmentation, traffic
volume estimates, and pedestrian crossing volume estimates, additional input details required to
complete the HSM-based safety analyses include the following:
• Facility Type – SR 885/Second Avenue is classified as an Urban - Other Principal Arterials, Collectors, Local Roads; therefore, the HSM’s Urban/Suburban Arterial module was used.
• Presence of Lighting – Based on field/aerial reviews, corridor lighting is present along the entirety of the SR 885/Second Avenue study corridor.
• Calibration Factor – A Calibration Factor of 1.0 was used based on the selected Pennsylvania County SPFs that are incorporated within PennDOT’s HSM tools.
• Number of Bus Stops within 1,000 feet of signalized intersections – Based on the latest available transit data and field/aerial reviews, numerous bus stops are present along the study corridor and various side streets. Overlaps within 1,000 feet of each intersection are especially notable at, for example, the Second Avenue at Hazelwood Avenue intersection, which accounts for 10 stops spread across Irvine Street at Berwick Street, Second Avenue at Hazelwood Avenue, Hazelwood Avenue at Monongahela Street, Hazelwood Avenue at Sylvan Avenue, and Second Avenue at Flowers Avenue. Similarly, at Elizabeth Street, 10 bus stops are found to overlap the 1,000-foot area spanning Second Avenue at Tecumseh Street, Second Avenue at Tipton Street, Second Avenue at Elizabeth Street, Second Avenue at Johnston Avenue, Johnston Avenue at Second Avenue, and Johnston Avenue at Gertrude Street. Remaining details are recorded on the subsequent input worksheets.
• Number of Schools within 1,000 feet of signalized intersections – Based on field/aerial reviews, Carnegie Mellon University - Entertainment Technology Center is located within 1,000 feet of Second Avenue at Technology Drive and Middle Access Drive. University of Pittsburgh - Center for Biotechnology and Bioengineering is located within 1,000 feet of Second Avenue at Middle Access Drive, Bates Street, and Hot Metal Bridge, as well as Bates Street at the I-376 Interchange Ramps. Three Rivers Village School is located within 1,000 feet of Second Avenue at Tecumseh Street, Elizabeth Street, and Johnston Avenue. Propel Schools – Hazelwood is located within 1,000 feet of Second Avenue at Mansion Street.
• Number of Alcohol Sales Establishments within 1,000 feet of signalized intersections – The number of alcohol sales establishments within 1,000 feet of signalized intersections is based on a review of land uses from Google Earth. Estimate include: Eliza Hot Metal Bistro, XO Café and Lounge, Ironworks, Papa D’s Kitchen & Bar, Bootleggers, Uncle Jimmy’s Bar, Illusion Hookah Lounge, and Zano’s Pub House.
• Number of Driveways within a Segment – Google Earth aerials were reviewed to identify the number of major/minor commercial driveways, major/minor industrial/institutional driveways, major/minor residential driveways, and other driveways throughout the study corridor. Based on HSM Chapter 12, major driveways are defined as those that serve sites with approximately 50 or more parking spaces.
• Roadside Fixed Object Density – The major roadside fixed objects along the study corridor consist of utility poles, lighting poles, signs, landscaping, and/or street furniture located along both sides of SR 885/Second Avenue throughout the study limits. The roadside fixed object density was estimated by dividing the number of utility poles or other major objects along both sides of the roadway by the segment length in miles.
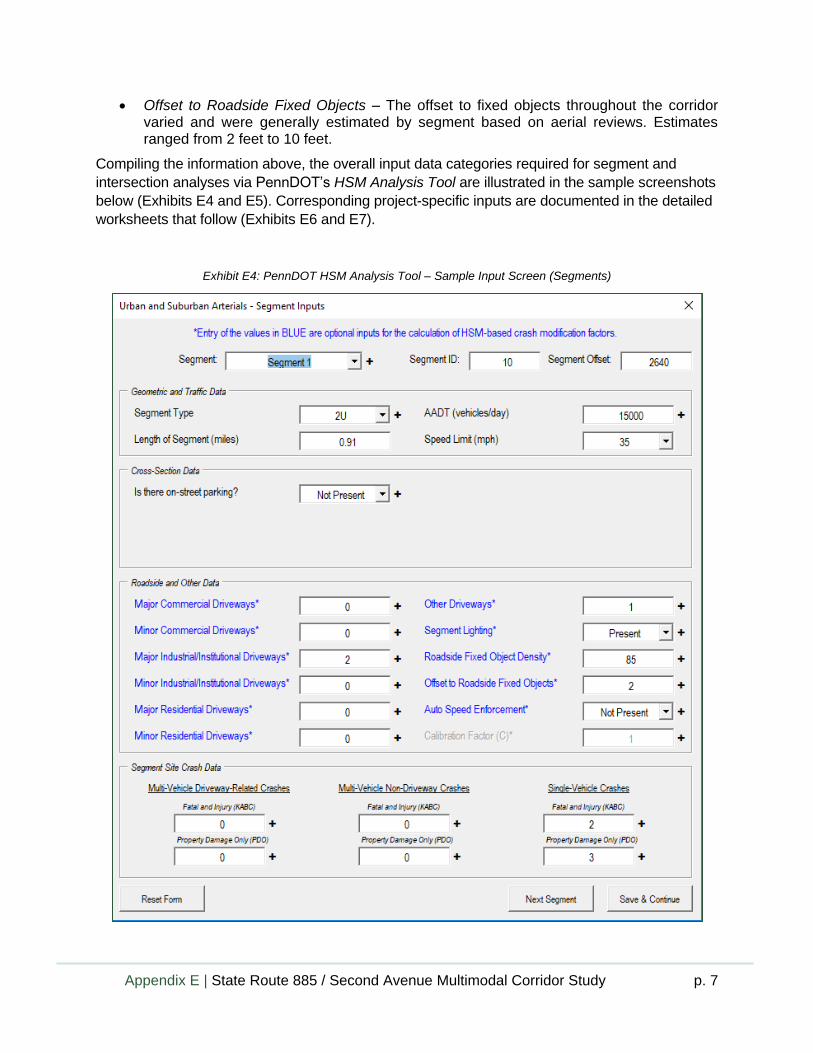
Appendix E | State Route 885 / Second Avenue Multimodal Corridor Study p. 7
• Offset to Roadside Fixed Objects – The offset to fixed objects throughout the corridor varied and were generally estimated by segment based on aerial reviews. Estimates ranged from 2 feet to 10 feet.
Compiling the information above, the overall input data categories required for segment and
intersection analyses via PennDOT’s HSM Analysis Tool are illustrated in the sample screenshots
below (Exhibits E4 and E5). Corresponding project-specific inputs are documented in the detailed
worksheets that follow (Exhibits E6 and E7).
Exhibit E4: PennDOT HSM Analysis Tool – Sample Input Screen (Segments)

Appendix E | State Route 885 / Second Avenue Multimodal Corridor Study p. 8
Exhibit E5: PennDOT HSM Analysis Tool – Sample Input Screen (Intersections)
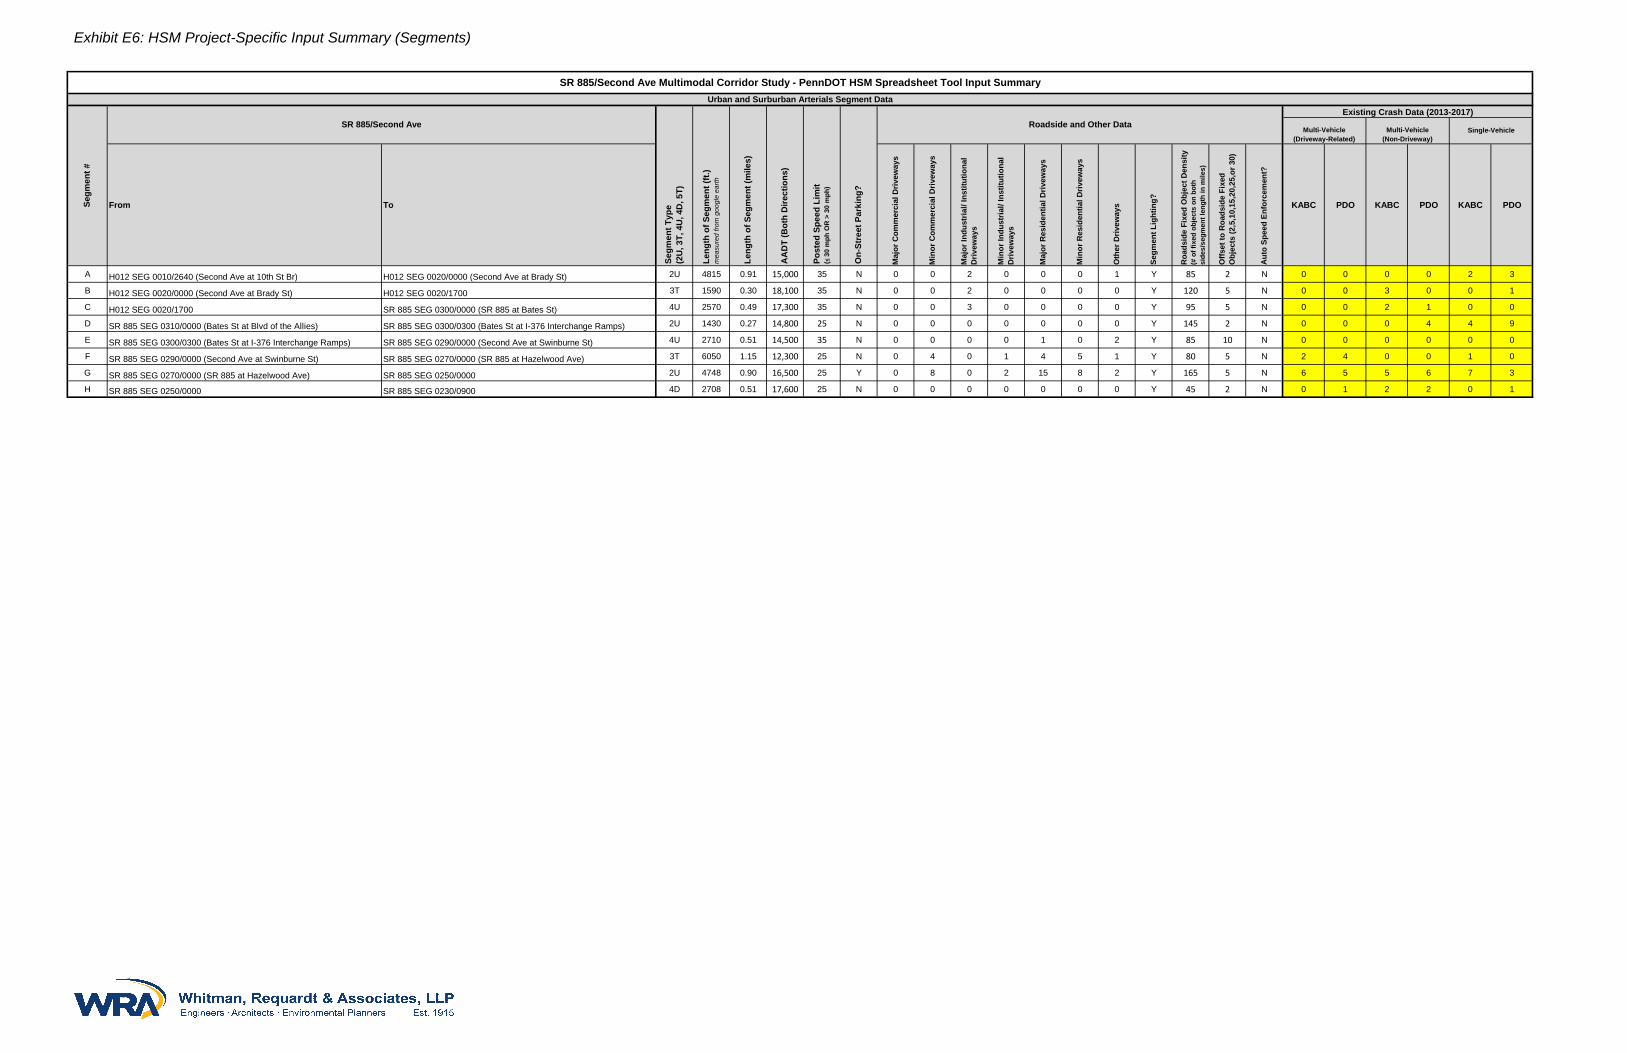
Exhibit E6: HSM Project-Specific Input Summary (Segments)
From To
Maj
or C
omm
erci
al D
rivew
ays
Min
or C
omm
erci
al D
rivew
ays
Maj
or In
dust
rial/
Inst
itutio
nal
Driv
eway
s
Min
or In
dust
rial/
Inst
itutio
nal
Driv
eway
s
Maj
or R
esid
entia
l Driv
eway
s
Min
or R
esid
entia
l Driv
eway
s
Oth
er D
rivew
ays
Segm
ent L
ight
ing?
Road
side
Fix
ed O
bjec
t Den
sity
(# o
f fix
ed o
bjec
ts o
n bo
th
side
s/se
gmen
t len
gth
in m
iles)
Offs
et to
Roa
dsid
e Fi
xed
Obj
ects
(2,5
,10,
15,2
0,25
,or 3
0)
Auto
Spe
ed E
nfor
cem
ent?
KABC PDO KABC PDO KABC PDO
A H012 SEG 0010/2640 (Second Ave at 10th St Br) H012 SEG 0020/0000 (Second Ave at Brady St) 2U 4815 0.91 15,000 35 N 0 0 2 0 0 0 1 Y 85 2 N 0 0 0 0 2 3
B H012 SEG 0020/0000 (Second Ave at Brady St) H012 SEG 0020/1700 3T 1590 0.30 18,100 35 N 0 0 2 0 0 0 0 Y 120 5 N 0 0 3 0 0 1
C H012 SEG 0020/1700 SR 885 SEG 0300/0000 (SR 885 at Bates St) 4U 2570 0.49 17,300 35 N 0 0 3 0 0 0 0 Y 95 5 N 0 0 2 1 0 0
D SR 885 SEG 0310/0000 (Bates St at Blvd of the Allies) SR 885 SEG 0300/0300 (Bates St at I-376 Interchange Ramps) 2U 1430 0.27 14,800 25 N 0 0 0 0 0 0 0 Y 145 2 N 0 0 0 4 4 9
E SR 885 SEG 0300/0300 (Bates St at I-376 Interchange Ramps) SR 885 SEG 0290/0000 (Second Ave at Swinburne St) 4U 2710 0.51 14,500 35 N 0 0 0 0 1 0 2 Y 85 10 N 0 0 0 0 0 0
F SR 885 SEG 0290/0000 (Second Ave at Swinburne St) SR 885 SEG 0270/0000 (SR 885 at Hazelwood Ave) 3T 6050 1.15 12,300 25 N 0 4 0 1 4 5 1 Y 80 5 N 2 4 0 0 1 0
G SR 885 SEG 0270/0000 (SR 885 at Hazelwood Ave) SR 885 SEG 0250/0000 2U 4748 0.90 16,500 25 Y 0 8 0 2 15 8 2 Y 165 5 N 6 5 5 6 7 3
H SR 885 SEG 0250/0000 SR 885 SEG 0230/0900 4D 2708 0.51 17,600 25 N 0 0 0 0 0 0 0 Y 45 2 N 0 1 2 2 0 1
Multi-Vehicle(Driveway-Related)
Multi-Vehicle(Non-Driveway)
Single-Vehicle
SR 885/Second Ave Multimodal Corridor Study - PennDOT HSM Spreadsheet Tool Input SummaryUrban and Surburban Arterials Segment Data
Segm
ent #
SR 885/Second Ave
Segm
ent T
ype
(2U
, 3T,
4U
, 4D
, 5T)
Leng
th o
f Seg
men
t (ft.
)m
easu
red
from
goo
gle
earth
Leng
th o
f Seg
men
t (m
iles)
AA
DT
(Bot
h D
irect
ions
)
Post
ed S
peed
Lim
it(
30
mph
OR
> 3
0 m
ph)
On-
Stre
et P
arki
ng?
Roadside and Other DataExisting Crash Data (2013-2017)
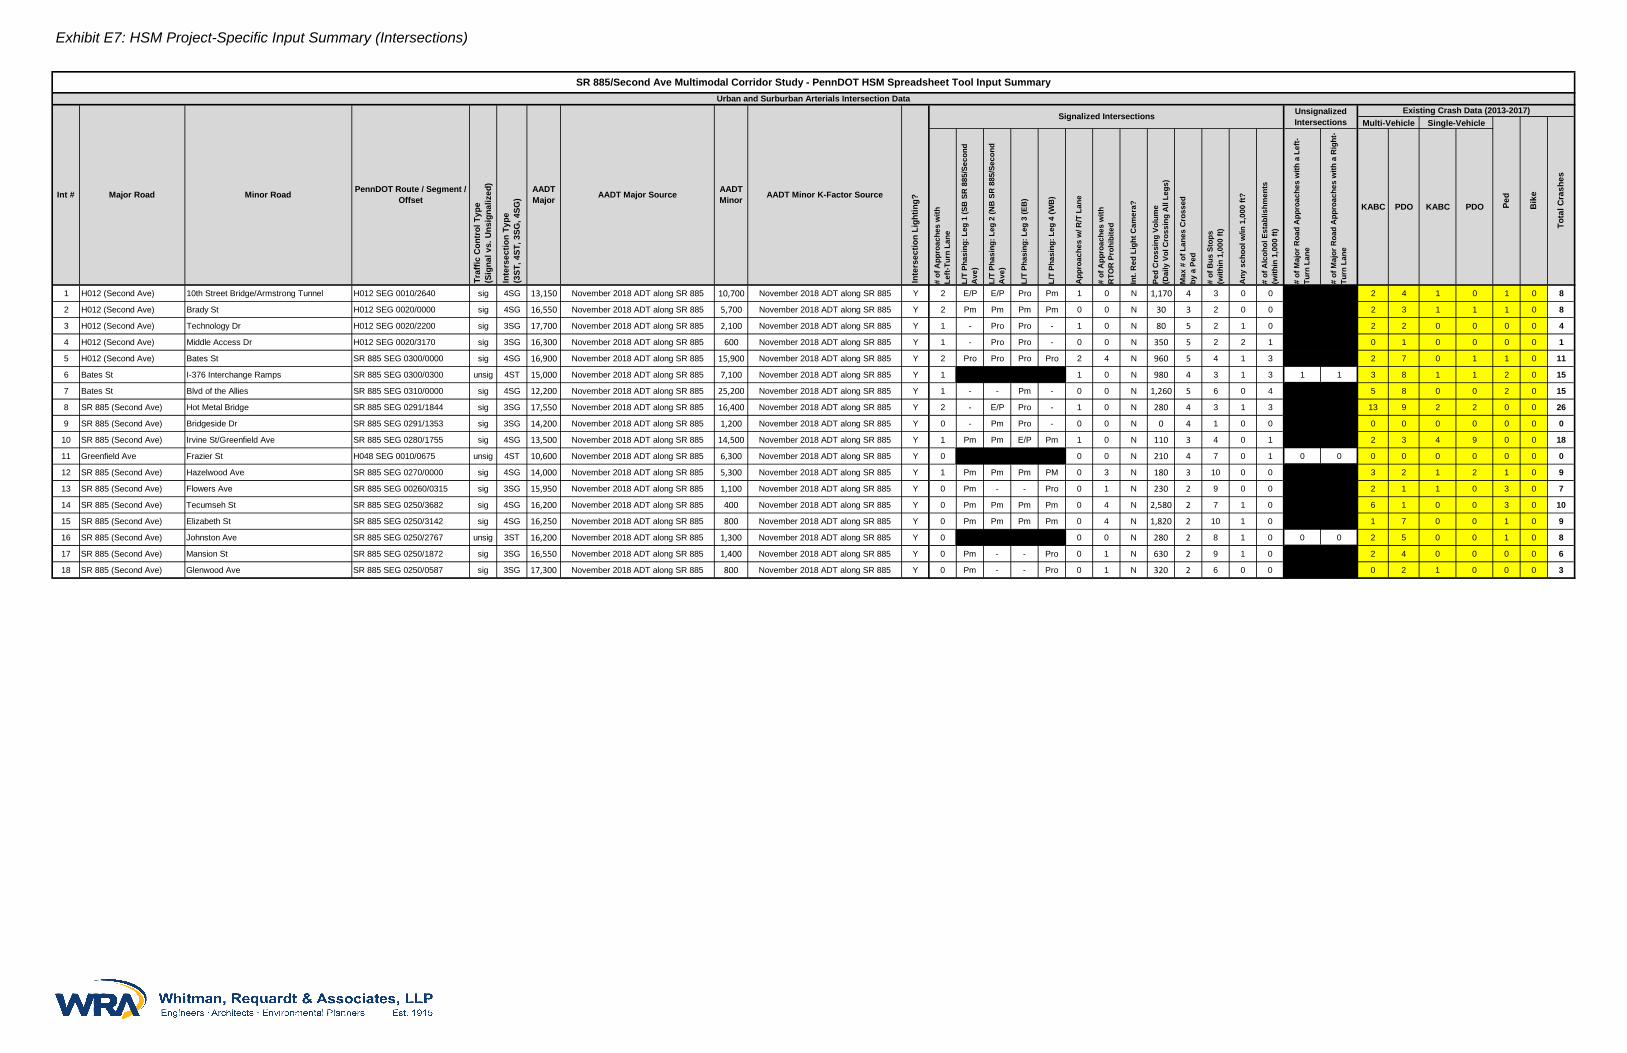
Exhibit E7: HSM Project-Specific Input Summary (Intersections)
# of
App
roac
hes
with
Left-
Turn
Lan
e
L/T
Phas
ing:
Leg
1 (S
B S
R 8
85/S
econ
d A
ve)
L/T
Phas
ing:
Leg
2 (N
B S
R 8
85/S
econ
d A
ve)
L/T
Phas
ing:
Leg
3 (E
B)
L/T
Phas
ing:
Leg
4 (W
B)
App
roac
hes
w/ R
/T L
ane
# of
App
roac
hes
with
RTO
R P
rohi
bite
d
Int.
Red
Lig
ht C
amer
a?
Ped
Cro
ssin
g Vo
lum
e(D
aily
Vol
Cro
ssin
g A
ll Le
gs)
Max
# o
f Lan
es C
ross
edby
a P
ed
# of
Bus
Sto
ps(w
ithin
1,0
00 ft
)
Any
sch
ool w
/in 1
,000
ft?
# of
Alc
ohol
Est
ablis
hmen
ts(w
ithin
1,0
00 ft
)
# of
Maj
or R
oad
App
roac
hes
with
a L
eft-
Turn
Lan
e
# of
Maj
or R
oad
App
roac
hes
with
a R
ight
-Tu
rn L
ane
KABC PDO KABC PDO
1 H012 (Second Ave) 10th Street Bridge/Armstrong Tunnel H012 SEG 0010/2640 sig 4SG 13,150 November 2018 ADT along SR 885 10,700 November 2018 ADT along SR 885 Y 2 E/P E/P Pro Pm 1 0 N 1,170 4 3 0 0 2 4 1 0 1 0 8
2 H012 (Second Ave) Brady St H012 SEG 0020/0000 sig 4SG 16,550 November 2018 ADT along SR 885 5,700 November 2018 ADT along SR 885 Y 2 Pm Pm Pm Pm 0 0 N 30 3 2 0 0 2 3 1 1 1 0 8
3 H012 (Second Ave) Technology Dr H012 SEG 0020/2200 sig 3SG 17,700 November 2018 ADT along SR 885 2,100 November 2018 ADT along SR 885 Y 1 - Pro Pro - 1 0 N 80 5 2 1 0 2 2 0 0 0 0 4
4 H012 (Second Ave) Middle Access Dr H012 SEG 0020/3170 sig 3SG 16,300 November 2018 ADT along SR 885 600 November 2018 ADT along SR 885 Y 1 - Pro Pro - 0 0 N 350 5 2 2 1 0 1 0 0 0 0 1
5 H012 (Second Ave) Bates St SR 885 SEG 0300/0000 sig 4SG 16,900 November 2018 ADT along SR 885 15,900 November 2018 ADT along SR 885 Y 2 Pro Pro Pro Pro 2 4 N 960 5 4 1 3 2 7 0 1 1 0 11
6 Bates St I-376 Interchange Ramps SR 885 SEG 0300/0300 unsig 4ST 15,000 November 2018 ADT along SR 885 7,100 November 2018 ADT along SR 885 Y 1 1 0 N 980 4 3 1 3 1 1 3 8 1 1 2 0 15
7 Bates St Blvd of the Allies SR 885 SEG 0310/0000 sig 4SG 12,200 November 2018 ADT along SR 885 25,200 November 2018 ADT along SR 885 Y 1 - - Pm - 0 0 N 1,260 5 6 0 4 5 8 0 0 2 0 15
8 SR 885 (Second Ave) Hot Metal Bridge SR 885 SEG 0291/1844 sig 3SG 17,550 November 2018 ADT along SR 885 16,400 November 2018 ADT along SR 885 Y 2 - E/P Pro - 1 0 N 280 4 3 1 3 13 9 2 2 0 0 26
9 SR 885 (Second Ave) Bridgeside Dr SR 885 SEG 0291/1353 sig 3SG 14,200 November 2018 ADT along SR 885 1,200 November 2018 ADT along SR 885 Y 0 - Pm Pro - 0 0 N 0 4 1 0 0 0 0 0 0 0 0 0
10 SR 885 (Second Ave) Irvine St/Greenfield Ave SR 885 SEG 0280/1755 sig 4SG 13,500 November 2018 ADT along SR 885 14,500 November 2018 ADT along SR 885 Y 1 Pm Pm E/P Pm 1 0 N 110 3 4 0 1 2 3 4 9 0 0 18
11 Greenfield Ave Frazier St H048 SEG 0010/0675 unsig 4ST 10,600 November 2018 ADT along SR 885 6,300 November 2018 ADT along SR 885 Y 0 0 0 N 210 4 7 0 1 0 0 0 0 0 0 0 0 0
12 SR 885 (Second Ave) Hazelwood Ave SR 885 SEG 0270/0000 sig 4SG 14,000 November 2018 ADT along SR 885 5,300 November 2018 ADT along SR 885 Y 1 Pm Pm Pm PM 0 3 N 180 3 10 0 0 3 2 1 2 1 0 9
13 SR 885 (Second Ave) Flowers Ave SR 885 SEG 00260/0315 sig 3SG 15,950 November 2018 ADT along SR 885 1,100 November 2018 ADT along SR 885 Y 0 Pm - - Pro 0 1 N 230 2 9 0 0 2 1 1 0 3 0 7
14 SR 885 (Second Ave) Tecumseh St SR 885 SEG 0250/3682 sig 4SG 16,200 November 2018 ADT along SR 885 400 November 2018 ADT along SR 885 Y 0 Pm Pm Pm Pm 0 4 N 2,580 2 7 1 0 6 1 0 0 3 0 10
15 SR 885 (Second Ave) Elizabeth St SR 885 SEG 0250/3142 sig 4SG 16,250 November 2018 ADT along SR 885 800 November 2018 ADT along SR 885 Y 0 Pm Pm Pm Pm 0 4 N 1,820 2 10 1 0 1 7 0 0 1 0 9
16 SR 885 (Second Ave) Johnston Ave SR 885 SEG 0250/2767 unsig 3ST 16,200 November 2018 ADT along SR 885 1,300 November 2018 ADT along SR 885 Y 0 0 0 N 280 2 8 1 0 0 0 2 5 0 0 1 0 8
17 SR 885 (Second Ave) Mansion St SR 885 SEG 0250/1872 sig 3SG 16,550 November 2018 ADT along SR 885 1,400 November 2018 ADT along SR 885 Y 0 Pm - - Pro 0 1 N 630 2 9 1 0 2 4 0 0 0 0 6
18 SR 885 (Second Ave) Glenwood Ave SR 885 SEG 0250/0587 sig 3SG 17,300 November 2018 ADT along SR 885 800 November 2018 ADT along SR 885 Y 0 Pm - - Pro 0 1 N 320 2 6 0 0 0 2 1 0 0 0 3
SR 885/Second Ave Multimodal Corridor Study - PennDOT HSM Spreadsheet Tool Input SummaryUrban and Surburban Arterials Intersection Data
Int # Major Road Minor Road
Traf
fic C
ontr
ol T
ype
(Sig
nal v
s. U
nsig
naliz
ed)
Inte
rsec
tion
Type
(3ST
, 4ST
, 3SG
, 4SG
)
AADT Major AADT Major Source AADT
Minor AADT Minor K-Factor Source
Inte
rsec
tion
Ligh
ting?
Signalized Intersections Unsignalized Intersections Single-Vehicle
PennDOT Route / Segment / Offset
Existing Crash Data (2013-2017)
Tota
l Cra
shes
Ped
Bik
e
Multi-Vehicle

Appendix E | State Route 885 / Second Avenue Multimodal Corridor Study p. 11
HSM SUMMARY REPORTS Based on the preceding assumptions and Project Safety Performance Summary Reports
generated by PennDOT’s HSM Analysis Tool, summary findings for the analysis segments and
intersections are highlighted below (and detailed in the attached output worksheets).
On a corridor-wide basis, the summary report for the total project indicates that the overall
expected crashes per year do not exceed the total predicted crashes per year, implying that the
corridor as whole operates similar to or better than comparable facilities (Exhibit E8).
Exhibit E8: HSM Performance Summary (Corridor-Wide)
Category Predicted
Crashes / Yr
Observed
Crashes / Yr
Expected
Crashes / Yr
Potential for
Safety
Improvement
Fatal and Injury Crashes 153.04 21.80 48.21 -104.83
Property Damage Only Crashes 131.61 24.60 25.26 -106.35
Total Crashes 284.65 46.40 73.47 -211.19
On a segment-specific basis, all eight roadway segments were reported as performing similar to
or better than comparable facilities (Exhibit E9).
Exhibit E9: HSM Performance Summary (by Segment)
Study Segment Predicted
Crashes / Yr
Observed
Crashes / Yr
Expected
Crashes / Yr
Potential for
Safety
Improvement
A H012 (Second Ave)
(10th St Br to Brady St) 40.58 1.00 3.88 -36.70
B H012 (Second Ave)
(Brady St to West of Bates St) 16.48 0.80 2.82 -13.67
C H012 (Second Ave)
(West of Bates St to Bates St) 19.45 0.60 2.32 -17.13
D SR 885
(Blvd of the Allies to I-376 Ramps 24.20 3.40 5.54 -18.66
E SR 885
(Bates St at I-376 Ramps to Swinburne St) 12.45 0.00 1.46 -10.98
F SR 885
(Swinburne St to Hazelwood Ave) 32.09 1.40 3.97 -28.12
G SR 885
(Hazelwood Ave to north of Glenwood Br) 81.61 6.40 10.45 -71.16
H SR 885
(north of Glenwood Br to SR 837) 12.41 1.20 2.57 -9.84

Appendix E | State Route 885 / Second Avenue Multimodal Corridor Study p. 12
On an intersection-specific basis, six intersections (highlighted in Exhibit E10) were flagged as
having positive potential for safety improvements.
Exhibit E10: HSM Performance Summary (by Intersection)
Study Intersection Predicted
Crashes / Yr
Observed
Crashes / Yr
Expected
Crashes / Yr
Potential for
Safety
Improvement
1 H012 (Second Ave) at
10th St Br/Armstrong Tunnel 4.58 1.60 3.12 -1.46
2 H012 (Second Ave) at Brady St 3.40 1.60 2.48 -0.92
3 H012 (Second Ave) at Technology Dr 1.64 0.80 1.35 -0.29
4 H012 (Second Ave) at Middle Access Dr 1.24 0.20 0.95 -0.29
5 H012 (Second Ave) at Bates St 4.64 2.20 3.71 -0.93
6 Bates St at I-376 Interchange Ramps 1.78 3.00 2.29 0.51
7 Bates St at Blvd of the Allies 5.24 3.00 4.43 -0.81
8 SR 885 (Second Ave) at Hot Metal Br 3.13 5.20 4.34 1.22
9 SR 885 (Second Ave) at Bridgeside Dr 1.24 0.00 0.85 -0.40
10 SR 885 (Second Ave) at
Irvine St / Greenfield Ave 4.86 3.60 4.24 -0.62
11 Greenfield Ave at Frazier Ave 1.44 0.00 0.96 -0.48
12 SR 885 (Second Ave) at Hazelwood Ave 3.03 1.80 2.50 -0.53
13 SR 885 (Second Ave) at Flowers Ave 1.48 1.40 1.48 0.00
14 SR 885 (Second Ave) at Tecumseh St 1.54 2.00 1.77 0.23
15 SR 885 (Second Ave) at Elizabeth St 1.86 1.80 1.95 0.09
16 SR 885 (Second Ave) at Johnston Ave 1.19 1.60 1.34 0.14
17 SR 885 (Second Ave) at Mansion St 1.64 1.20 1.53 -0.11
18 SR 885 (Second Ave) at Glenwood Ave 1.43 0.60 1.17 -0.26
Table Note: Shading indicates intersections with a potential for safety improvement.

Appendix E | State Route 885 / Second Avenue Multimodal Corridor Study p. 13
Details at the flagged intersection locations include the following:
• Intersection 6 – Bates Street at the I-376 Interchange Ramps: This location is a stop-
controlled, high-volume, and often congested junction for travel between I-376 to/from
the east, the Oakland area to/from the north, and the Second Avenue corridor to/from
the south. During peak periods, it can be impacted by queue spillback from downstream
congestion affecting the I-376 eastbound on-ramps, plus congestion at the nearby Bates
Street intersection with Second Avenue, less than 250’ to the south. Rear End and Angle
crash types were common, and two pedestrian crashes were noted at this location.
• Intersection 8 – Second Avenue at Hot Metal Bridge: This location is a signalized, high-
volume, T-intersection that serves as an important access point not just along the
Second Avenue corridor, but also between the South Side, Oakland area, and I-376 via
nearby connections along Bates Street, less than 500’ to the north. Congestion, queue
spillback, and periodic intersection blockages along Second Avenue between the Hot
Metal Bridge and Bates Street can be significant. The area also provides an important
pedestrian/bicycle linkage to the surrounding trail network via ramp connections to the
Hot Metal Bridge and the related trail overpass above Second Avenue. Rear End and
Angle crash types were common.
• Intersections 13-16 – Second Avenue through Hazelwood at Flowers Avenue,
Tecumseh Street, Elizabeth Street, and Johnston Avenue: This cluster of closely-
spaced intersections is located at the center of Hazelwood’s downtown business stretch.
Multimodal usage through this area involves vehicular traffic along Second Avenue;
Hazelwood residential, commercial, and community activities (e.g. The Hazelwood
Center and library); heavily-used on-street parking; active transit stops; and multiple
signalized and unsignalized pedestrian crossings. Within this 4-6 block area, 11
pedestrian crashes were noted, which accounts for almost 60% of the total pedestrian
crash count for the corridor.
HSM OUTPUT WORKSHEETS Project Safety Performance Summary Reports generated by PennDOT’s HSM Analysis Tool,
including project total findings, segment details, and intersection details, are attached on the
following pages for reference.

125.56 113.71 239.28
6.80 8.00 14.80
24.48 8.53 33.01
27.48 23.25 45.38
15.00 16.60 31.60
23.73 16.73 40.46
153.04 131.61 284.65
21.80 24.60 46.40
48.21 25.26 73.47
Total Project Summary
No Observed Crash Data Provided
Predicted Average Annual Crash Frequency (crashes/yr)
*Note: "Other Crashes" include animal, overturn, parked vehicle, noncollisions, and other single-/multiple-vehicle crashes
Segments Fatal and Injury
Property Damage
OnlyTotal
Property Damage
OnlyTotal
Predicted Average Annual Crash Frequency (crashes/yr)
Observed Average Annual Crash Frequency (crashes/yr)
Expected Average Annual Crash Frequency (crashes/yr)
Potential for Safety Improvement (PSI) -104.83 -106.35 -211.19
Project DescriptionDate
Predicted Average Annual Crash Frequency (crashes/yr)
Observed Average Annual Crash Frequency (crashes/yr)
Expected Average Annual Crash Frequency (crashes/yr)
Intersections Fatal and Injury
Observed Average Annual Crash Frequency (crashes/yr)
Expected Average Annual Crash Frequency (crashes/yr)
Total Fatal and Injury
Property Damage
OnlyTotal
Project Safety Performance Summary Report
SR 885/Second Avenue Multimodal Corridor Study1/11/20192019Site Level AnalysisUrban/Suburban Arterials
153.0421.8048.21
Total CrashesProject Totals
Predicted Average Annual Crash FrequencyObserved Average Annual Crash FrequencyExpected Average Annual Crash Frequency
Fatal and Injury Crashes
131.61 284.6524.60 46.4025.26 73.47
Facility Type(s)
Property Damage Only Crashes
Analysis YearAnalysis Type
153.04131.61
284.65
21.80 24.6046.4048.21
25.26
73.47
0.000
50.000
100.000
150.000
200.000
250.000
300.000
Fatal and Injury Property Damage Only Total
Ave
rage
Ann
ual C
rash
Fre
que
ncy
Summary of Average Safety Performance for the Project (crashes/year)
Predicted Average AnnualCrash Frequency(crashes/year)
Observed Average AnnualCrash Frequency(crashes/year)
Expected Average AnnualCrash Frequency(crashes/year)
Project Total: Observed Crashes by Crash Type
Head-On
Rear-End
Angle
Sideswipe
Fixed Object/Run-Off-RoadOther Object
Driveway-Related
Pedestrian
Bicycle
Other*
Project Total: Predicted Crashes by Crash Type
Head-On
Rear-End
Angle
Sideswipe
Fixed Object/Run-Off-RoadOther Object
Driveway-Related
Pedestrian
Bicycle
Other*

Project DescriptionDateAnalysis YearAnalysis TypeFacility Type(s)
Segment Name
Segment 1Segment 2Segment 3Segment 4Segment 5Segment 6Segment 7Segment 8Segment 9Segment 10Segment 11Segment 12Segment 13Segment 14Segment 15Segment 16Segment 17Segment 18Segment 19Segment 20Segment 21Segment 22Segment 23Segment 24Segment 25Segment 26Segment 27Segment 28Segment 29Segment 30Segment 31Segment 32Segment 33Segment 34Segment 35Segment 36Segment 37Segment 38Segment 39Segment 40Segment 41Segment 42Segment 43Segment 44Segment 45Segment 46Segment 47Segment 48Segment 49Segment 50
19.45 0.60 2.32
0
0.00 0.00
00 0
250 00
0 00 00 00 0
00 00 00 0
0.00 0.0012.41 1.20 2.57
16.48 0.80 2.82
81.61 6.40 10.45
0.00 0.00
2019
0.00 0.00
0.00 0.00
0 00 00 0
0.00 0.00
Site Level AnalysisUrban/Suburban Arterials
00 00 00
24.20 3.40
32.09 1.40 3.9712.45 0.00 1.46
0.00 0.00
0.00 0.00
0.00 0.000.00 0.00
0.00 0.00
0.00 0.000.00 0.000.00 0.00
0.00 0.000.00 0.000.00 0.00
0.00 0.000.00 0.000.00 0.00
0.00 0.00
0.00 0.000.00 0.00
0.00 0.00
0.00 0.00
0.000.00 0.00
0.00 0.00
0.00
0.00 0.00
0.00 0.00
0.00 0.00
0.00 0.000.00
0.00
0
0.00 0.00
0.00
0.00 0.00
0.00 0.000.00 0.000.00 0.00
0 0
Project Safety Performance Detailed ReportUrban and Suburban Arterials
SR 885/Second Avenue Multimodal Corridor Study1/11/2019
0 0
0.00 0.000.00 0.000.00 0.00
0
Urban and Suburban Arterials: Segments
PennDOT Segment
PennDOT Offset
10 264020 020 1700310 0300 300290 0270 0
Potential for Safety Improvement
-36.70-13.67-17.13-18.66
40.58 1.00 3.88
Total Predicted Crashes
Total Observed Crashes
Total Expected Crashes
5.54
00
0 00 00 00 0
-10.98-28.12-71.16-9.84
0 0
0 00 00 00 00 0
0 0
0 0
0 0
0
00 00 00 0
0 00 00 00 00 0
0.00
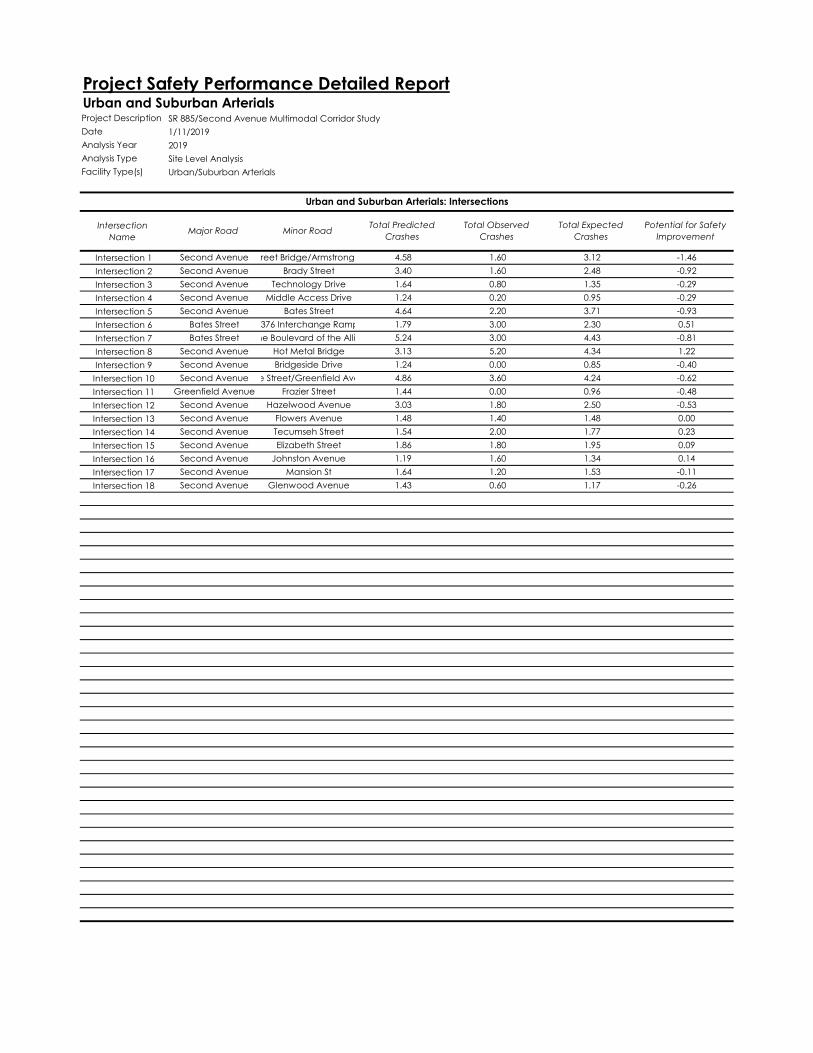
Project DescriptionDateAnalysis YearAnalysis TypeFacility Type(s)
Intersection Name
Intersection 1Intersection 2Intersection 3Intersection 4Intersection 5Intersection 6Intersection 7Intersection 8Intersection 9Intersection 10Intersection 11Intersection 12Intersection 13Intersection 14Intersection 15Intersection 16Intersection 17Intersection 18Intersection 19Intersection 20Intersection 21Intersection 22Intersection 23Intersection 24Intersection 25Intersection 26Intersection 27Intersection 28Intersection 29Intersection 30Intersection 31Intersection 32Intersection 33Intersection 34Intersection 35Intersection 36Intersection 37Intersection 38Intersection 39Intersection 40Intersection 41Intersection 42Intersection 43Intersection 44Intersection 45Intersection 46Intersection 47Intersection 48Intersection 49Intersection 50
1.64 0.80 1.353.40 1.60 2.48
4.64 2.20 3.711.24 0.20 0.95
Total Predicted Crashes
Total Observed Crashes
4.58 1.60 3.12
1.79 3.00
Total Expected Crashes
5.24 3.00 4.43
1.44 0.00 0.964.86 3.60 4.241.24 0.00 0.85
2.30
3.13 5.20 4.34
1.64 1.20 1.531.19 1.60 1.341.86 1.80 1.951.54 2.00 1.771.48 1.40 1.483.03 1.80 2.50
0.00 0.00 0.00
Project Safety Performance Detailed ReportUrban and Suburban Arterials
SR 885/Second Avenue Multimodal Corridor Study
0.00 0.00 0.00
0.00 0.00 0.00
0.00 0.00 0.001.43 0.60 1.17
0.00 0.00
0.00 0.00 0.000.00 0.00 0.000.00 0.00 0.00
0.00 0.00 0.000.00 0.00 0.000.00 0.00
0.00 0.00 0.00
0.00 0.00 0.000.00 0.00 0.00
0.00
1/11/2019
0.00 0.00 0.000.00 0.00 0.00
00 00 0
0 00 00 00 00 0
-0.11-0.260.000.000.000.000.000.000.00
1.22
0.000.00 0.00 0.00
Second Avenue Tecumseh StreetSecond Avenue Elizabeth StreetSecond Avenue Johnston AvenueSecond Avenue Mansion StSecond Avenue Glenwood Avenue
Second Avenue
0.00 0.00
0.00
Bridgeside DriveSecond AvenueIrvine Street/Greenfield Avenue
Greenfield Avenue Frazier StreetSecond Avenue Hazelwood AvenueSecond Avenue Flowers Avenue
0 00 00
0.00 0.00 0.000.00 0.00 0.000.00 0.00 0.000.00 0.00 0.000.00 0.00 0.00
0.00 0.00 0.00
0.00 0.00 0.000.00 0.00 0.00
0.00 0.00 0.00
0.00 0.00 0.00
0.00 0.00 0.000.00 0.00 0.000.00 0.00 0.00
Urban and Suburban Arterials: Intersections
Second Avenue Middle Access DriveSecond Avenue Bates Street
Bates Street
Major Road
0.00 0.00 0.00
Second Avenue Hot Metal Bridge
00 00 00 0
0 00 00 00 00 00 00
0 00 0
0 00 00 00 00 0
0 00 00 00 00 0
0.00
Potential for Safety Improvement
-1.46-0.92-0.29-0.29-0.930.51-0.81
2019Site Level AnalysisUrban/Suburban Arterials
Minor Road
Second Avenue10th Street Bridge/Armstrong TunnelSecond Avenue Brady StreetSecond Avenue Technology Drive
I-376 Interchange RampsBates Street The Boulevard of the Allies
0.00
-0.40-0.62-0.48-0.530.000.230.090.14
0.000.000.000.000.000.000.00
0.000.000.000.000.000.000.000.000.00
0.000.000.000.000.000.000.00

Appendix F Cross-Section Measurements

TRAVEL LANE TRAVEL LANE
SIDEWALK
17'-6" 17'-6"
35'-0"
8"
SLOPE
SIDEWALK
8'-0"
8"
SLOPE
1 - SR 0885 TYPICAL SECTION SB
VESPUCIUS ST TO GLENWOOD BRIDGE
NOT TO SCALE
7'-0"
TO
6'-0"

TRAVEL LANE TRAVEL LANE
SIDEWALK
17'-6" 17'-6"
35'-0"
8"
SLOPE
SIDEWALK
8"
SLOPE
2 - SR 0885 TYPICAL SECTION SB
MELANCTHON ST TO VESPUCIUS ST
NOT TO SCALE
12'-0"
TO
9'-6"
11'-6"
TO
7'-0"
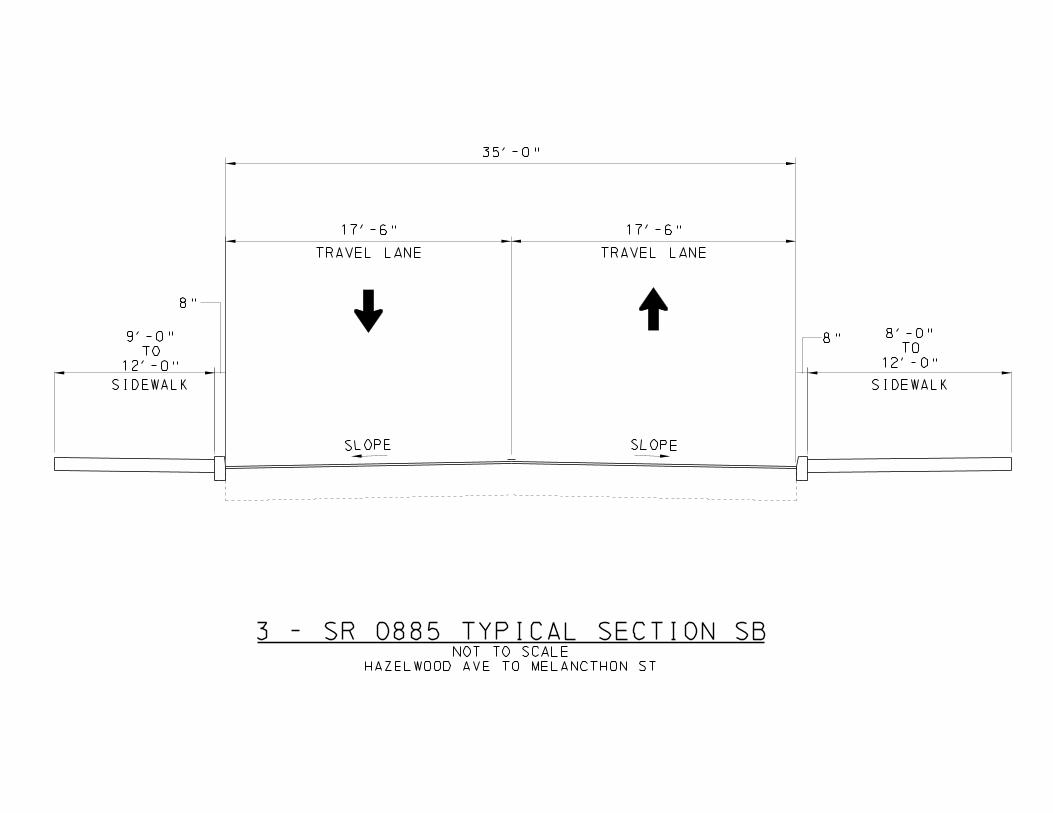
TRAVEL LANE TRAVEL LANE
SIDEWALK
17'-6" 17'-6"
35'-0"
8"
SLOPE
SIDEWALK
8"
SLOPE
3 - SR 0885 TYPICAL SECTION SB
HAZELWOOD AVE TO MELANCTHON ST
NOT TO SCALE
12'-0"
TO
8'-0"
12'-0"
TO
9'-0"

TRAVEL LANE
SIDEWALK
16'-0" 9'-0"
36'-0"
8"
SLOPE
8"
SLOPE
4 - SR 0885 TYPICAL SECTION SB
TURN LANE
11'-0"
TRAVEL LANE
100' BEFORE HAZELWOOD AVE
NOT TO SCALE
10'-0" 3'-0" BERM
OR
7'-0" SIDEWALK

TRAVEL LANE
SIDEWALK
13'-0" 13'-0"
39'-0"
8"
SLOPE
8"
SLOPE
5 - SR 0885 TYPICAL SECTION SB
13'-0"
TRAVEL LANETRAVEL LANE
GUIDERAIL
FENCE OR
TO MINDEN ST
250' EAST OF GREENFIELD AVE
NOT TO SCALE
9'-0"
TO
5'-0"

TRAVEL LANE
SIDEWALK
13'-0" 13'-0"
39'-0"
8"
SLOPE
8"
SLOPE
6 - SR 0885 TYPICAL SECTION SB
13'-0"
TRAVEL LANE
6'-0"
TURN LANE
GREENFIELD AVE TO 250' EAST
NOT TO SCALE
OR BERM
GUIDERAIL
FENCE OR

TRAVEL LANE
12'-6" 10'-6"
SLOPE
SIDEWALK
8"
SLOPE
7 - SR 0885 TYPICAL SECTION SB
10'-0"
TRAVEL LANE
WALL
RETAINING
12"
6'-6"
WALL
4'-6"
LANE
BIKE TRAVEL LANE
SWINBURNE ST TO GREENFIELD AVE
NOT TO SCALE
~38'-0"
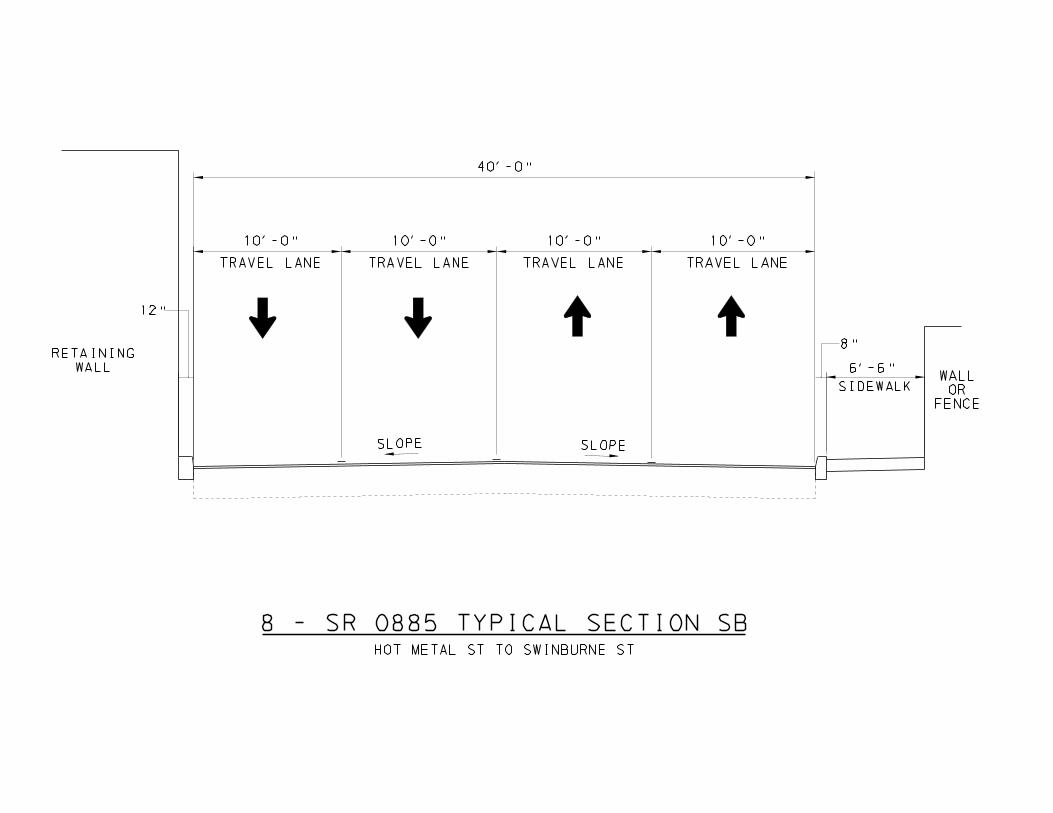
10'-0"
40'-0"
SLOPE
SIDEWALK
8"
SLOPE
8 - SR 0885 TYPICAL SECTION SB
10'-0"
TRAVEL LANE
WALL
RETAINING
12"
6'-6"
TRAVEL LANE
10'-0"
TRAVEL LANE
10'-0"
TRAVEL LANE
FENCE
OR
WALL
HOT METAL ST TO SWINBURNE ST

58'-0"
SLOPE
SIDEWALK
8"
SLOPE
9 - SR 0885 TYPICAL SECTION SB
12'-0"
TRAVEL LANE
WALL
RETAINING
6'-0"
12'-0"
TRAVEL LANE
12'-0"
TRAVEL LANE
SIDEWALK
6'-0"
8"
10'-0"
TO
0'-0"
LEFT TURN LANE
12'-0"
TRAVEL LANE
BATES ST TO HOT METAL ST
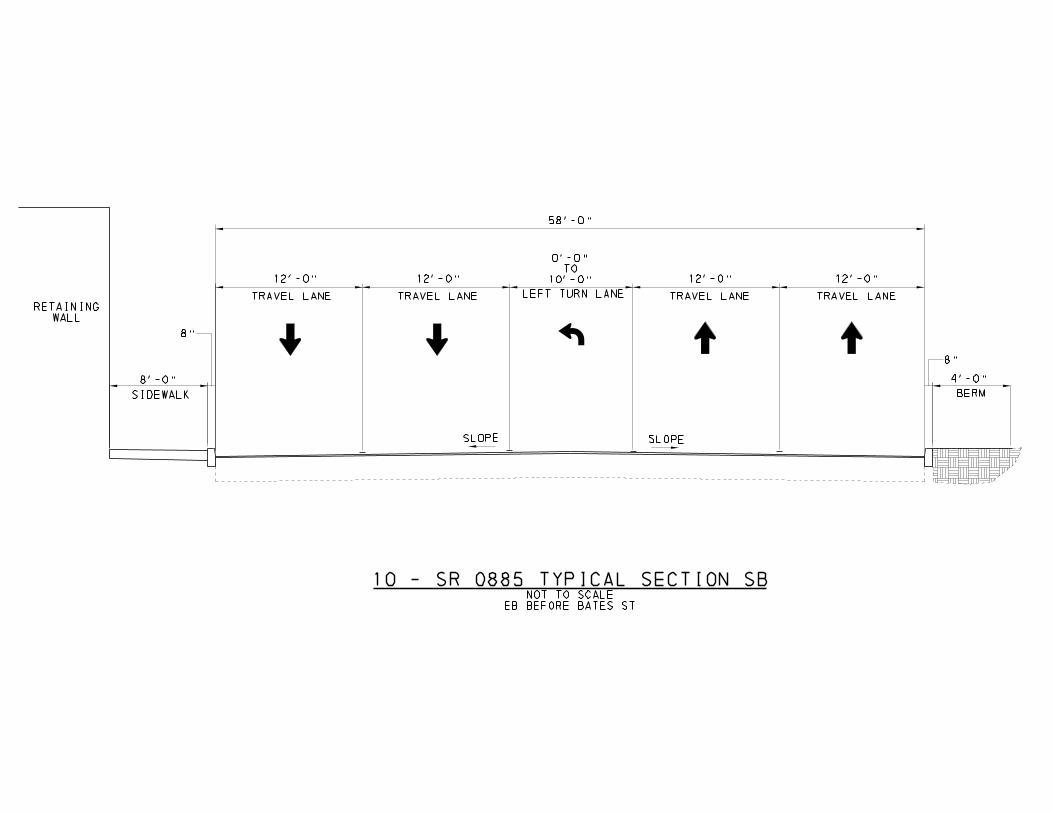
58'-0"
SLOPE
8"
SLOPE
12'-0"
TRAVEL LANE
WALL
RETAINING
4'-0"
12'-0"
TRAVEL LANE
12'-0"
TRAVEL LANE
SIDEWALK
8'-0"
8"
10'-0"
TO
0'-0"
LEFT TURN LANE
12'-0"
TRAVEL LANE
BERM
10 - SR 0885 TYPICAL SECTION SB
EB BEFORE BATES ST
NOT TO SCALE
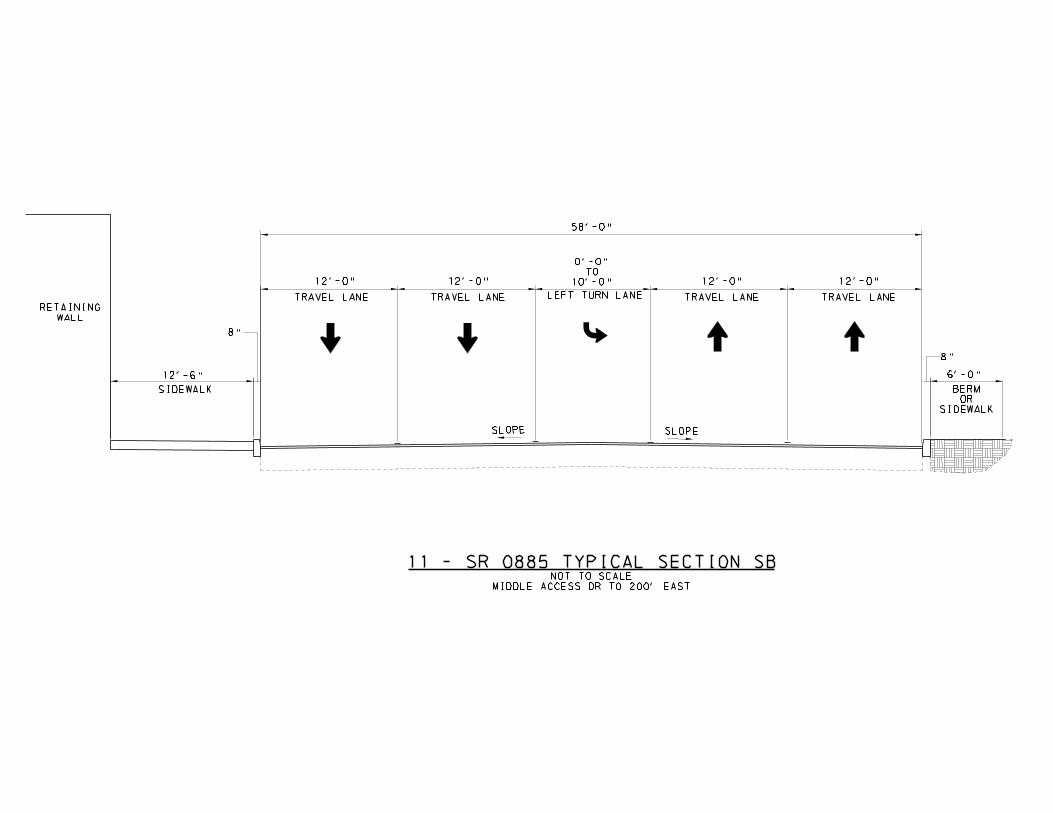
58'-0"
SLOPE
8"
SLOPE
12'-0"
TRAVEL LANE
WALL
RETAINING
6'-0"
12'-0"
TRAVEL LANE
12'-0"
TRAVEL LANE
SIDEWALK
12'-6"
8"
10'-0"
TO
0'-0"
LEFT TURN LANE
12'-0"
TRAVEL LANE
11 - SR 0885 TYPICAL SECTION SB
SIDEWALK
OR
BERM
MIDDLE ACCESS DR TO 200' EAST
NOT TO SCALE
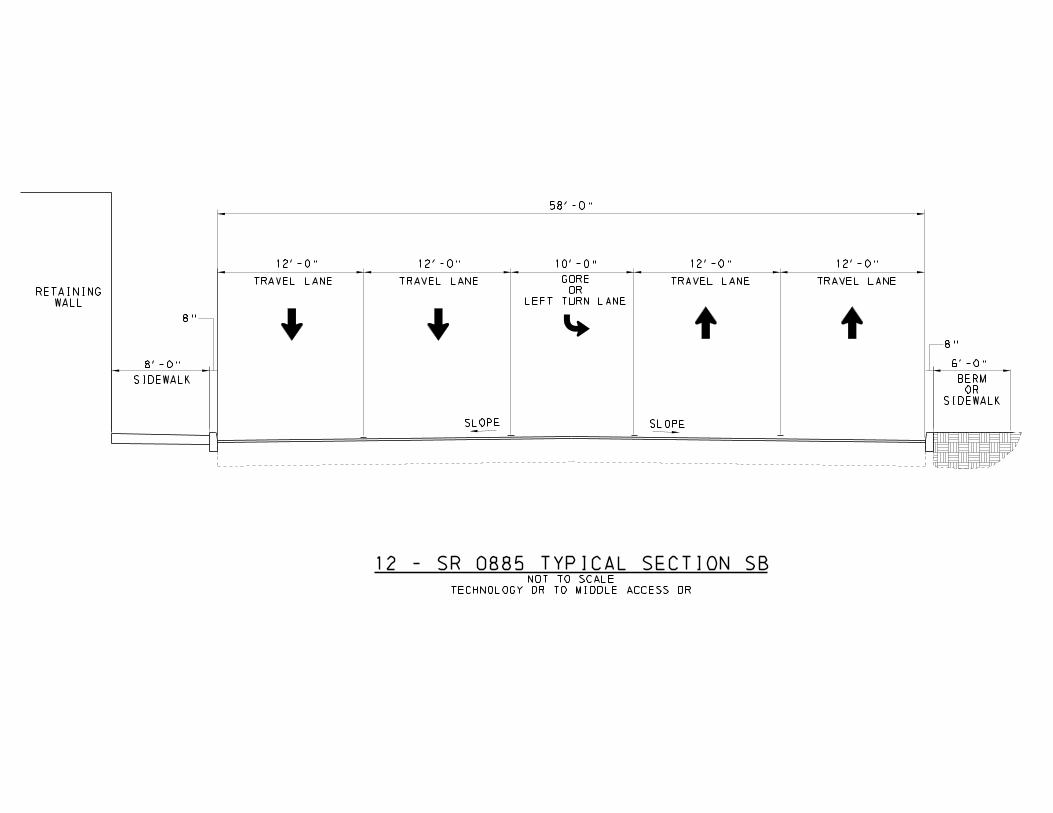
58'-0"
SLOPE
8"
SLOPE
12'-0"
TRAVEL LANE
WALL
RETAINING
6'-0"
12'-0"
TRAVEL LANE
12'-0"
TRAVEL LANE
SIDEWALK
8'-0"
8"
12'-0"
TRAVEL LANE
12 - SR 0885 TYPICAL SECTION SB
SIDEWALK
OR
BERM
TECHNOLOGY DR TO MIDDLE ACCESS DR
NOT TO SCALE
LEFT TURN LANE
OR
GORE
10'-0"
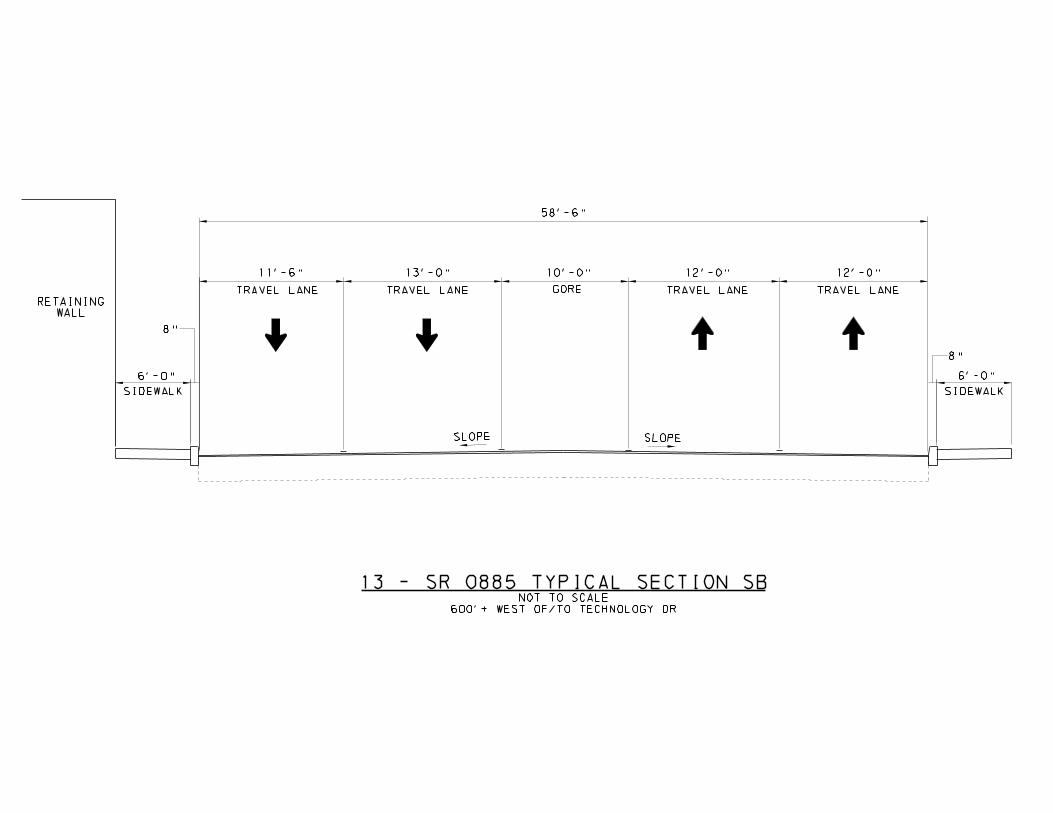
13 - SR 0885 TYPICAL SECTION SB
58'-6"
SLOPE
8"
SLOPE
12'-0"
TRAVEL LANE
WALL
RETAINING
13'-0"
TRAVEL LANE
11'-6"
TRAVEL LANE
SIDEWALK
6'-0"
8"
12'-0"
TRAVEL LANE
10'-0"
GORE
SIDEWALK
6'-0"
600'+ WEST OF/TO TECHNOLOGY DR
NOT TO SCALE
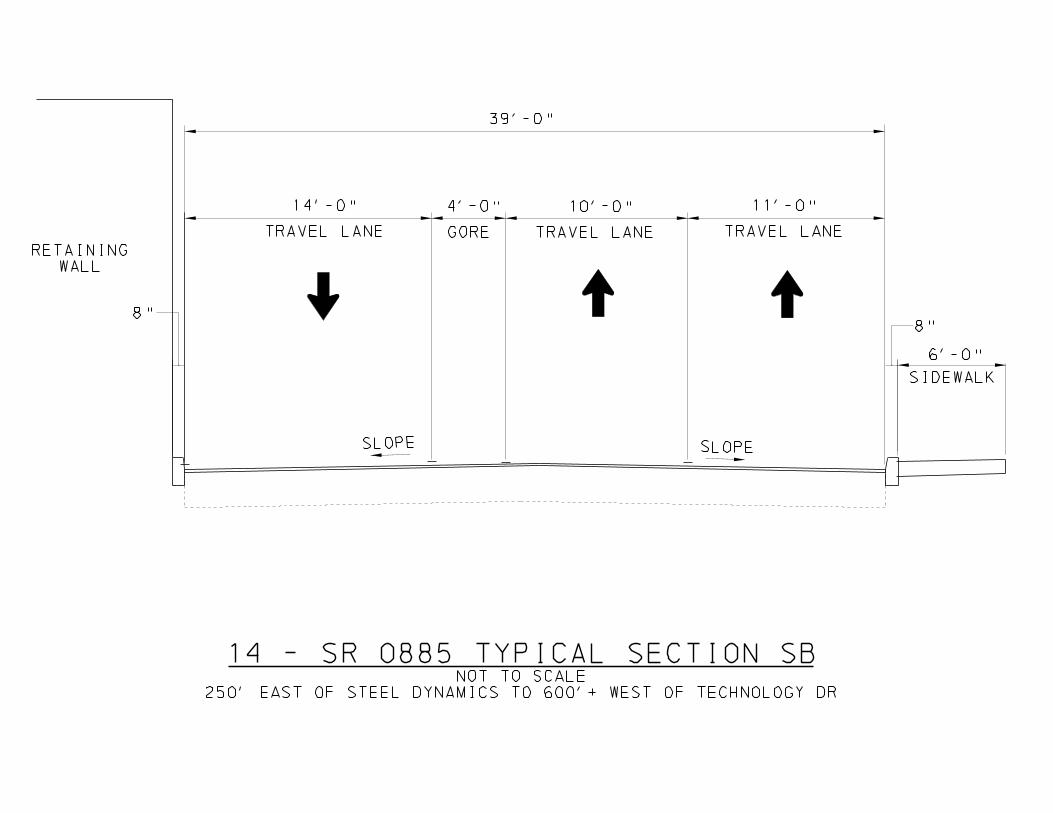
14 - SR 0885 TYPICAL SECTION SB
39'-0"
SLOPE
8"
SLOPE
10'-0"
TRAVEL LANE
WALL
RETAINING
14'-0"
TRAVEL LANE
8"
11'-0"
TRAVEL LANE
4'-0"
GORE
SIDEWALK
6'-0"
250' EAST OF STEEL DYNAMICS TO 600'+ WEST OF TECHNOLOGY DR
NOT TO SCALE

15 - SR 0885 TYPICAL SECTION SB
42'-0"
SLOPE
8"
SLOPE
11'-0"
TRAVEL LANE
WALL
RETAINING
10'-6"
TRAVEL LANE
8"
10'-0"
TRAVEL LANE
SIDEWALK
6'-0"
STEEL DYNAMICS DR TO 250' EAST
NOT TO SCALE
10'-6"
LEFT TURN LANE
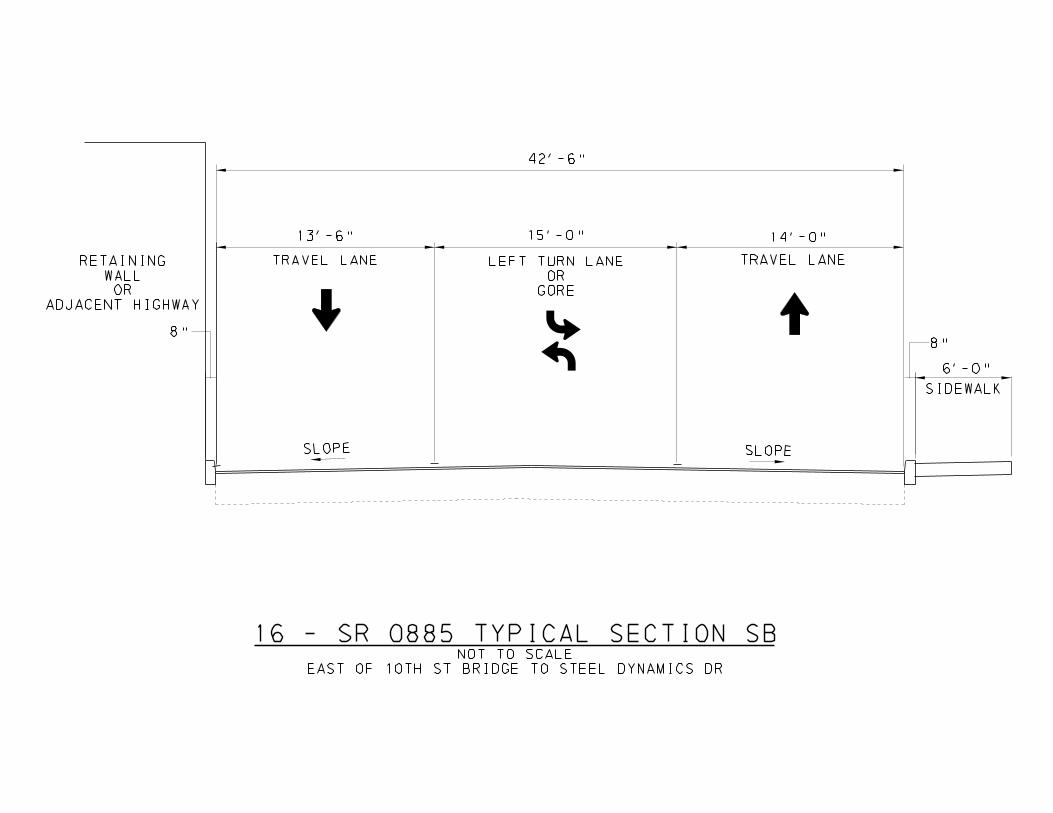
16 - SR 0885 TYPICAL SECTION SB
42'-6"
SLOPE
8"
SLOPE
14'-0"
TRAVEL LANE
13'-6"
TRAVEL LANE
8"
SIDEWALK
6'-0"
GORE
OR
LEFT TURN LANE
15'-0"
ADJACENT HIGHWAY
OR
WALL
RETAINING
EAST OF 10TH ST BRIDGE TO STEEL DYNAMICS DR
NOT TO SCALE