appendix 9.5 flood study report river awbeg at buttevant cpo data/volume 4a - appendices - book...
TRANSCRIPT

M20 Cork-Limerick Motorway Scheme
Environmental Impact Statement Page A9.5.1 of A9.5.14 Appendix 9.5 Flood Study Report, River Awbeg at Buttevant
Appendix 9.5 Flood Study Report, River Awbeg at Buttevant

M20 Cork - Limerick Motorway Scheme
Environmental Impact Statement Page A9.5.2 of A9.5.14 Appendix 9.5 Flood Study Report, River Awbeg at Buttevant
Flood Study Report
River Awbeg, Buttevant
This report has been prepared for Cork County Council, in association with the National Roads Authority in accordance with the terms and
conditions of appointment for consulting engineering services. The consultants, WYG cannot accept any responsibility for any use of or reliance
on the contents of this report by any third party.
Document Title: M20 Preliminary Design Report
Document Ref(s): 997-01-1007d-002
Date Rev Status Originator Checked Approved
19/08/09
- Final
Ailis Power
Seán
FitzSimons
Wolfram
Schluter

M20 Cork - Limerick Motorway Scheme
Environmental Impact Statement Page A9.5.3 of A9.5.14 Appendix 9.5 Flood Study Report, River Awbeg at Buttevant
Table of Contents
Executive Summary ............................................................................................................................................... A9.5.5
1.0 Introduction ................................................................................................................................................ A9.5.5
2.0 Description of Proposed Structure ............................................................................................................. A9.5.5
3.0 Flooding ..................................................................................................................................................... A9.5.6
3.1 Scope of Flooding Problem ................................................................................................................... A9.5.6
3.2 Causes of Flooding ................................................................................................................................ A9.5.6
4.0 Flood Flow Estimation ............................................................................................................................... A9.5.7
4.1 General .................................................................................................................................................. A9.5.7
4.2 Methodology .......................................................................................................................................... A9.5.7
4.3 Un-gauged Flow Estimation .................................................................................................................. A9.5.7
4.4 Donor/Analogue Catchment Analysis .................................................................................................... A9.5.8
4.5 Growth Curve Estimation ..................................................................................................................... A9.5.10
4.6 Design Flow Estimate .......................................................................................................................... A9.5.10
4.7 Outcome .............................................................................................................................................. A9.5.11
5.0 Hydraulic Assessment ............................................................................................................................. A9.5.11
5.1 Background .......................................................................................................................................... A9.5.11
5.2 Inputs ................................................................................................................................................... A9.5.11
5.3 Modelling ............................................................................................................................................. A9.5.12
6.0 Conclusion ............................................................................................................................................... A9.5.13
7.0 Glossary of Terms ................................................................................................................................... A9.5.13
8.0 References .............................................................................................................................................. A9.5.14
Appendix A Drawings ........................................................................................................................................ A9.5.i
Appendix B ............................................................................................................................................................ A9.5.ii
Statistical Flood Frequency Analysis at Station 18004 ...................................................................................... A9.5.ii
Appendix C ........................................................................................................................................................... A9.5.iv
Results ............................................................................................................................................................... A9.5.iv

M20 Cork - Limerick Motorway Scheme
Environmental Impact Statement Page A9.5.4 of A9.5.14 Appendix 9.5 Flood Study Report, River Awbeg at Buttevant
Table of Figures
Figure 3.1 Catchment Area of Awbeg River at Buttevant ..................................................................................... A9.5.6
Figure 3.2 Photos of Flooding of Floodplain of River Awbeg at Buttevant ............................................................ A9.5.6
Figure 4.1 Graph of Irish Growth Factors for Different Return Periods ............................................................... A9.5.10
Figure 5.1 River Reach and Cross Section Plan ................................................................................................. A9.5.11
Figure 5.4 Water Profile Comparison (Pre-motorway v Post-motorway) ............................................................ A9.5.12
Figure 5.4 Floodplain Extents Pre-motorway and Post-motorway ...................................................................... A9.5.12
Table of Tables
Table 4.1 Catchment Characteristic Parameters .................................................................................................. A9.5.8
Table 4.2 Catchment Characteristic Parameters at Gauge 18004 Ballynamona ................................................. A9.5.8
Table 4.3 Annual Maximum data at Gauge 18004 Ballynamona ......................................................................... A9.5.9
Table 4.4 Estimate of Mean Annual flood ............................................................................................................. A9.5.9
Table 4.5 Growth curve derived from the FSR Regional Equation for Ireland.................................................... A9.5.10
Table 4.6 Growth curve derived from the FSR Regional Equation for Ireland.................................................... A9.5.10
Table 4.7 Design Flow Estimate including 95% confidence interval ................................................................... A9.5.11
M20 Cork - Limerick Motorway Scheme
Environmental Impact Statement Page A9.5.5 of A9.5.14 Appendix 9.5 Flood Study Report, River Awbeg at Buttevant
Executive Summary
The proposed motorway crosses the Awbeg River at Buttevant. The river regularly breaches its banks at the location
of the crossing but the river flow and overbank flow is generally contained within the confines of the valley which is
quite well defined. The aim of this flood study is to determine the effect the proposed motorway has on the flow in
the river and to assess if this effect is acceptable or if mitigation is necessary.
The structure identified to convey the watercourse under the road is a multi-span bridge having a total length of
110m.
It was found that flood levels would increase by 10mm as a result of the proposed crossing. Furthermore, it was
found that there was no increased risk of properties flooding due to the structure. It is therefore recommended that
the 110m multi-span bridge will adequately accommodate the design flow and that no further mitigation measures
are necessary.
1.0 Introduction
The proposed M20 Cork-Limerick Motorway Scheme crosses several existing watercourses including the Awbeg
River. The Awbeg River and its tributaries will require structures and/or culverts to carry their flow under the
proposed scheme. This report provides details of the hydraulic assessment of the proposed structure over the
Awbeg River at Buttevant. The structure identified to convey the watercourse under the road is a multi-span bridge
having a total length of 110m.
Approximate coordinates of the proposed structure are:
E156056.92, N108255.36; E156083.49, N108256.77;
E156087.31, N108148.12; E156060.71, N108147.97
A study was undertaken to ensure that this structure was sufficient to adequately convey the design flow without
increasing flood risk on properties or increasing water levels, also known as afflux, outside the limits allowed by
responsible bodies such as the Office of Public Works (OPW) or the National Roads Authority (NRA).
The main elements of the report include:
• Establishing the design flow for the Awbeg River
• Establishing existing flood levels and floodplain extent
• Establishing flood levels and extent due to the proposed development
• Assessing the need for mitigation
This flood study is based on the preliminary design of the M20 Cork-Limerick Motorway scheme. At detail design
stage, this flood study will be reviewed to ensure that any design changes post preliminary design do not cause a
perceptible increase in flood frequency or severity.
The OPW, the Environmental Protection Agency (EPA), the National Parks and Wildlife Service (NPWS), the
Shannon Regional Fisheries Board (ShRFB) and the South Western Regional Fisheries Board (SWRFB) have been
consulted during the design of the M20 scheme.
2.0 Description of Proposed Structure It is anticipated that the Awbeg River Bridge at Ch 43+470 on the proposed M20 motorway will be a multi-span
bridge having a total length of approximately 110m, as shown in drawing 997/01/1700/ST43/2 in Appendix A. The
bridge abutments are located on either side of the flood plain. The typical width of the structure will be 24.2m. For
the purposes of this flood study, a typical pier arrangement of approximately 30m centres is assumed.

M20 Cork - Limerick Motorway Scheme
Environmental Impact Statement Page A9.5.6 of A9.5.14 Appendix 9.5 Flood Study Report, River Awbeg at Buttevant
3.0 Flooding
3.1 Scope of Flooding Problem
The Awbeg River rises in the Ballyhoura Mountains to the east of the proposed M20. It generally flows south-east
picking up a number of tributaries before crossing the existing N20 and subsequently the proposed M20 at Ch.
53+900 near the village of Ballyhea. The catchment area at the proposed Ballyhea crossing point is 42.45km2. A
separate flood study has been prepared for this crossing point. From there the Awbeg winds south and flows
through the town of Buttevant, 13km south of Ballyhea. It crosses the existing N20 again just to the north of
Buttevant and south of Buttevant it takes a sharp turn to the east and crosses the proposed M20 for the second
time. The catchment of the river at the proposed crossing point at Buttevant is estimated to be 193 km2 and the
channel width is approximately 13m. Refer to Figure 3.1 for catchment area map.
Figure 3.1 Catchment Area of Awbeg River at Buttevant
The OPW have indicated that this is a flood prone area. Furthermore, landowner consultation provided evidence of
historical flooding in the area.
3.2 Causes of Flooding
There are a number of reasons for the Awbeg River flooding at Buttevant. The Ballyhoura Mountains overlook the
low lying town of Buttevant. The flat topography to the North of Buttevant leads to difficulties in draining overland
flow to the river. As a result water ponds regularly in the lands adjacent to the river, upstream of the crossing point.
Furthermore the gradient of the river at Buttevant is extremely shallow and estimated to be 1 in 900. During flood
events, this shallow gradient leads to the river overtopping its banks as the increased runoff cannot be conveyed
downstream quickly enough. It should be noted that the flood waters at the crossing point, south of Buttevant town
are contained within the confines of the valley as can be seen in Figure 3.2.
Figure 3.2 Photos of Flooding of Floodplain of River Awbeg at Buttevant

M20 Cork - Limerick Motorway Scheme
Environmental Impact Statement Page A9.5.7 of A9.5.14 Appendix 9.5 Flood Study Report, River Awbeg at Buttevant
4.0 Flood Flow Estimation
4.1 General
The following design criteria have been adopted by the design team in accordance with the Flood Studies Report
(FSR) and the Flood Estimation Handbook (FEH).
If a catchment is gauged and there is a sufficiently long historical flow record then the FSR recommends that flood
flows should be estimated by statistical flood frequency analysis methods such as extreme value distribution to the
data series of annual maximum flows or peaks over threshold (POT) flow series. Annual maximum flow data can be
obtained from the OPW or the EPA. In statistical flow estimation methods, an index flood (mean annual flood) is
calculated and multiplied by a growth factor to obtain the required return period flow.
If a catchment is un-gauged the most appropriate methods for estimating design flows are described in the Flood
Studies Report (1975). The method chosen should be appropriate to the size of the catchment.
Methods include:
• Mean annual flood (Qbar) by catchment characteristics plus growth curve
• FSR Unit Hydrograph and Design Storm Method
The FSR and FEH recommend that estimates of the index flood from catchment characteristics at un-gauged sites
be improved by the use of index flood values calculated from river flow data recorded at gauging stations, wherever
possible. The FEH also recommend that use is made of donor and/or analogue catchments to improve estimates of
the index flood at un-gauged sites. A donor catchment is a catchment with a gauging station that is typically on the
same river as the subject site. An analogue catchment is a catchment which is hydrologically similar to the subject
site but is not necessarily on the same river.
4.2 Methodology
The FSR recommends the use of statistical flood frequency analysis where possible. The closest gauge on the
River Awbeg to the Buttevant site is approximately 12km downstream at Ballynamona Station 18004 (coordinates
E165638, N107560).
The methods used to derive design flow estimates for the Awbeg River at Buttevant were:
• Qbar estimation from un-gauged methods - FSR catchment characteristic equations for un-gauged
catchments
• Donor / Analogue Catchment Analysis
The design flow was then refined by estimating the growth curve for the Awbeg River at Buttevant and applying it to
Qbar.
4.3 Un-gauged Flow Estimation
The catchment area for the Awbeg River at Buttevant is 193 km2. The most appropriate method to estimate Qbar for
a catchment of this size is the FSR 6-variable catchment characteristic equation.
Flood Studies Report, 6 variable equation no.2:
Q = 0.0172AREA0.94STMFRQ0.27S10850.16SOIL1.23RSMD1.03(1+LAKE)-0.85 [Equation1]
where:
AREA is the catchment area (km2).
STMFRQ (stream frequency) is the number of stream junctions per km2 on a 1:25,000 scale map. For Ireland this
can be determined from a 1inch map and converted (using a formula given in the FSR) to an equivalent 1:25,000
(2.5 inch) number.
S1085 is the slope of the main channel between 10% and 85% of its length measured from the catchment outlet
(m/km).
SAAR is long-term mean annual rainfall amount in mm and 1:625,000 mapping of this parameter is available for
Ireland based on meteorological records from 1941 to 1970.
RSMD is a measure of rainfall excess, in mm given by 1-day R5 rainfall reduced by a weighted mean of annual soil
moisture deficit (SMD). In order to obtain this value FSR maps of the 2-day R5 rainfall value and the r value which is
the ratio of 1-hour R5 rainfall to 2-day R5 rainfall are used. The values obtained for the catchment are then used in
conjunction with tables in the FSR for 24-hour R5 rainfall as a fraction of 2-day R5 to obtain the 24-hour (1-day) R5
rainfall. The soil moisture deficit can be determined from maps in the FSR and is subtracted from the 1-day R5
rainfall to give the RSMD.
SOIL is an index of how the soil may accept infiltration and is a measure of the Winter Rainfall Acceptance Potential
(WRAP). It can be determined from FSR mappings at 1:625,000 scale for Ireland. The SOIL index is based on only
five classifications (very high, high, moderate, low and very low WRAP) and the mapping scale and number of
M20 Cork - Limerick Motorway Scheme
Environmental Impact Statement Page A9.5.8 of A9.5.14 Appendix 9.5 Flood Study Report, River Awbeg at Buttevant
categories are regarded as providing a very coarse measure of catchment runoff potential. The Flood Estimation
Handbook in the UK has replaced the SOIL index by a more extensively classified and calibrated variable called
HOST (Hydrology of Soil Types) provided at a grid resolution of 0.5km2.
LAKE is an index defined as the fraction of catchment draining through lakes or reservoirs.
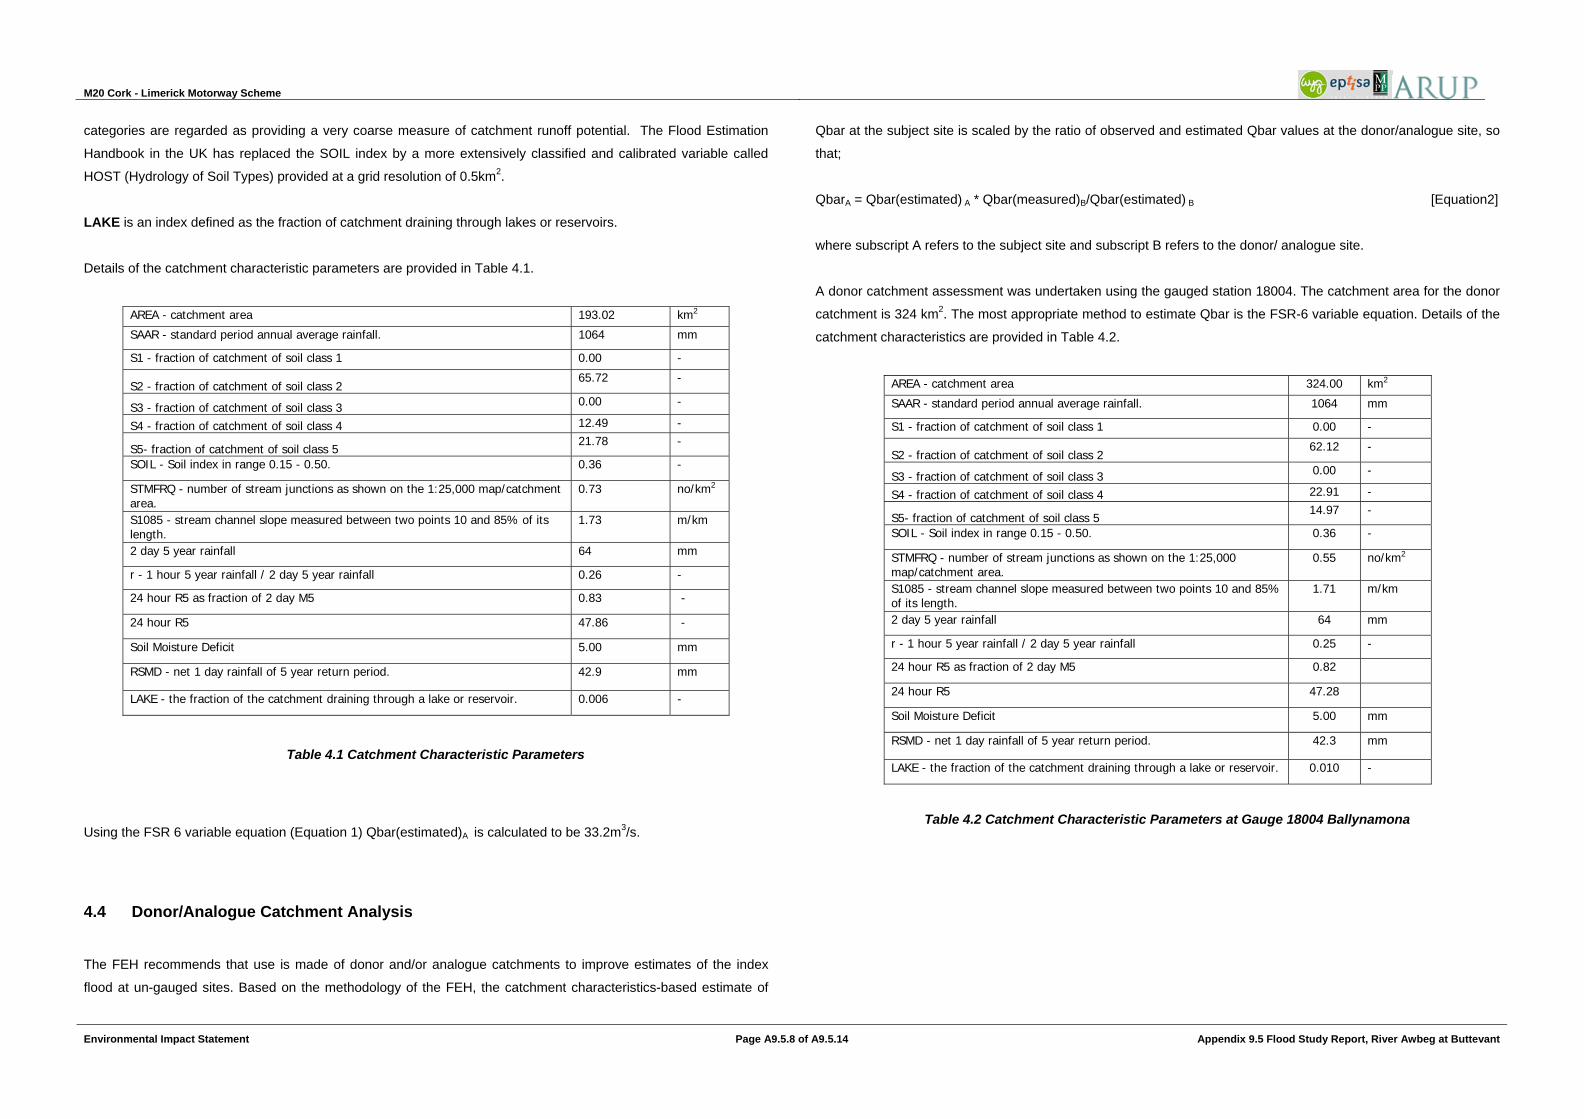
Details of the catchment characteristic parameters are provided in Table 4.1.
AREA - catchment area 193.02 km2
SAAR - standard period annual average rainfall. 1064 mm
S1 - fraction of catchment of soil class 1 0.00 -
S2 - fraction of catchment of soil class 2 65.72 -
S3 - fraction of catchment of soil class 3 0.00 -
S4 - fraction of catchment of soil class 4 12.49 -
S5- fraction of catchment of soil class 5 21.78 -
SOIL - Soil index in range 0.15 - 0.50. 0.36 -
STMFRQ - number of stream junctions as shown on the 1:25,000 map/catchment area.
0.73 no/km2
S1085 - stream channel slope measured between two points 10 and 85% of its length.
1.73 m/km
2 day 5 year rainfall 64 mm
r - 1 hour 5 year rainfall / 2 day 5 year rainfall 0.26 -
24 hour R5 as fraction of 2 day M5 0.83 -
24 hour R5 47.86 -
Soil Moisture Deficit 5.00 mm
RSMD - net 1 day rainfall of 5 year return period. 42.9 mm
LAKE - the fraction of the catchment draining through a lake or reservoir. 0.006 -
Table 4.1 Catchment Characteristic Parameters
Using the FSR 6 variable equation (Equation 1) Qbar(estimated)A is calculated to be 33.2m3/s.
4.4 Donor/Analogue Catchment Analysis
The FEH recommends that use is made of donor and/or analogue catchments to improve estimates of the index
flood at un-gauged sites. Based on the methodology of the FEH, the catchment characteristics-based estimate of
Qbar at the subject site is scaled by the ratio of observed and estimated Qbar values at the donor/analogue site, so
that;
QbarA = Qbar(estimated) A * Qbar(measured)B/Qbar(estimated) B [Equation2]
where subscript A refers to the subject site and subscript B refers to the donor/ analogue site.
A donor catchment assessment was undertaken using the gauged station 18004. The catchment area for the donor
catchment is 324 km2. The most appropriate method to estimate Qbar is the FSR-6 variable equation. Details of the
catchment characteristics are provided in Table 4.2.
AREA - catchment area 324.00 km2
SAAR - standard period annual average rainfall. 1064 mm
S1 - fraction of catchment of soil class 1 0.00 -
S2 - fraction of catchment of soil class 2 62.12 -
S3 - fraction of catchment of soil class 3 0.00 -
S4 - fraction of catchment of soil class 4 22.91 -
S5- fraction of catchment of soil class 5 14.97 -
SOIL - Soil index in range 0.15 - 0.50. 0.36 -
STMFRQ - number of stream junctions as shown on the 1:25,000 map/catchment area.
0.55 no/km2
S1085 - stream channel slope measured between two points 10 and 85% of its length.
1.71 m/km
2 day 5 year rainfall 64 mm
r - 1 hour 5 year rainfall / 2 day 5 year rainfall 0.25 -
24 hour R5 as fraction of 2 day M5 0.82
24 hour R5 47.28
Soil Moisture Deficit 5.00 mm
RSMD - net 1 day rainfall of 5 year return period. 42.3 mm
LAKE - the fraction of the catchment draining through a lake or reservoir. 0.010 -
Table 4.2 Catchment Characteristic Parameters at Gauge 18004 Ballynamona

M20 Cork - Limerick Motorway Scheme
Environmental Impact Statement Page A9.5.9 of A9.5.14 Appendix 9.5 Flood Study Report, River Awbeg at Buttevant
Using the FSR 6 variable equation (Equation2) the Qbar(estimated)B flow is calculated to be 49.5m3/s.
Qbar (measured)B was calculated from the Annual Maximum data sets at station 18004 on the River Awbeg using
the statistical analysis package HyfranPlus. Table 4.3 shows the annual maximum series data. Two distributions are
recommended by the FSR and these are the Gumbel Extreme Value 1 (EV1) and Generalised Extreme Value
(GEV) distributions. The Weibull distribution was also fitted to the data.
HYDROMETRIC*
YEAR WATER LEVEL
(mAOD-Poolbeg) S.G. READING (m) ESTIMATED
FLOWS (m3/s)
DATE RELIABLE LIMIT
(m3/s)
1955 56.77 1.69 32 35 26/09/1956 1956 57.03 1.95 39.8 35 01/01/1957 1957 56.76 1.68 31.8 35 03/09/1958 1958 - - - 35 01/01/1900 1959 56.75 1.67 31.5 35 26/12/1959 1960 56.88 1.8 35.2 35 03/10/1960 1961 56.79 1.71 32.6 35 19/05/1962 1962 56.7 1.62 30.1 35 10/02/1963 1963 56.88 1.8 35.2 35 17/08/1964 1964 - - - 35 13/12/1964 1965 57.03 1.95 39.8 35 20/02/1966 1966 56.73 1.65 30.9 35 23/02/1967 1967 56.62 1.54 27.9 35 09/01/1968 1968 57.42 2.34 52.7 35 13/01/1968 1969 56.73 1.65 30.9 35 17/02/1970 1970 - - - 35 01/01/1900 1971 - - - 35 01/01/1900 1972 56.74 1.66 31.2 35 18/02/1973 1973 56.81 1.73 33.2 35 01/12/1973 1974 56.66 1.59 29.1 35 26/01/1975 1975 56.66 1.58 29 35 30/01/1976 1976 56.59 1.52 27.2 35 23/12/1976 1977 56.63 1.56 28.3 35 22/02/1978 1978 56.74 1.66 31.2 35 07/12/1978 1979 56.78 1.7 32.3 35 24/12/1979 1980 56.73 1.65 30.9 35 03/11/1980 1981 56.69 1.62 29.9 35 29/12/1981 1982 56.75 1.67 31.5 35 09/11/1982 1983 56.83 1.76 33.9 35 16/12/1983 1984 56.62 1.54 27.9 35 09/02/1985 1985 56.35 1.27 21 35 07/08/1986 1986 56.58 1.5 26.8 35 13/12/1986 1987 56.75 1.67 31.5 35 03/02/1988 1988 56.79 1.72 32.8 35 11/10/1988 1989 56.86 1.78 34.6 35 06/02/1990 1990 56.58 1.5 26.8 35 01/01/1991 1991 56.49 1.41 24.5 35 25/11/1991 1992 56.38 1.31 21.8 35 14/09/1991 1993 56.77 1.69 32 35 15/01/1994 1994 56.82 1.74 33.5 35 10/03/1995
HYDROMETRIC* YEAR
WATER LEVEL (mAOD-Poolbeg)
S.G. READING (m) ESTIMATED
FLOWS (m3/s)
DATE RELIABLE LIMIT
(m3/s)
1995 56.77 1.7 32.2 35 08/01/1996 1996 56.62 1.54 27.9 35 05/08/1997 1997 56.74 1.66 31.2 35 08/01/1998 1998 56.78 1.71 32.5 35 30/12/1998 1999 56.62 1.54 27.9 35 25/12/1999 2000 56.92 1.84 36.4 35 06/11/2000 2001 56.59 1.5 26.8 35 02/12/2002 2002 56.66 1.57 28.7 35 27/11/2002 2003 56.19 1.1 17.1 35 12/03/2004 2004 56.79 1.7 32.3 35 29/10/2004 2005 56.49 1.4 24.2 35 03/11/2005 2006 56.54 1.45 25.5 35 30/12/2006
Average 30.7
*The hydrometric year runs from the 1st October to the 30th September the following year. It is used instead of the calendar year because it
generally contains a complete high flow season.
Table 4.3 Annual Maximum data at Gauge 18004 Ballynamona
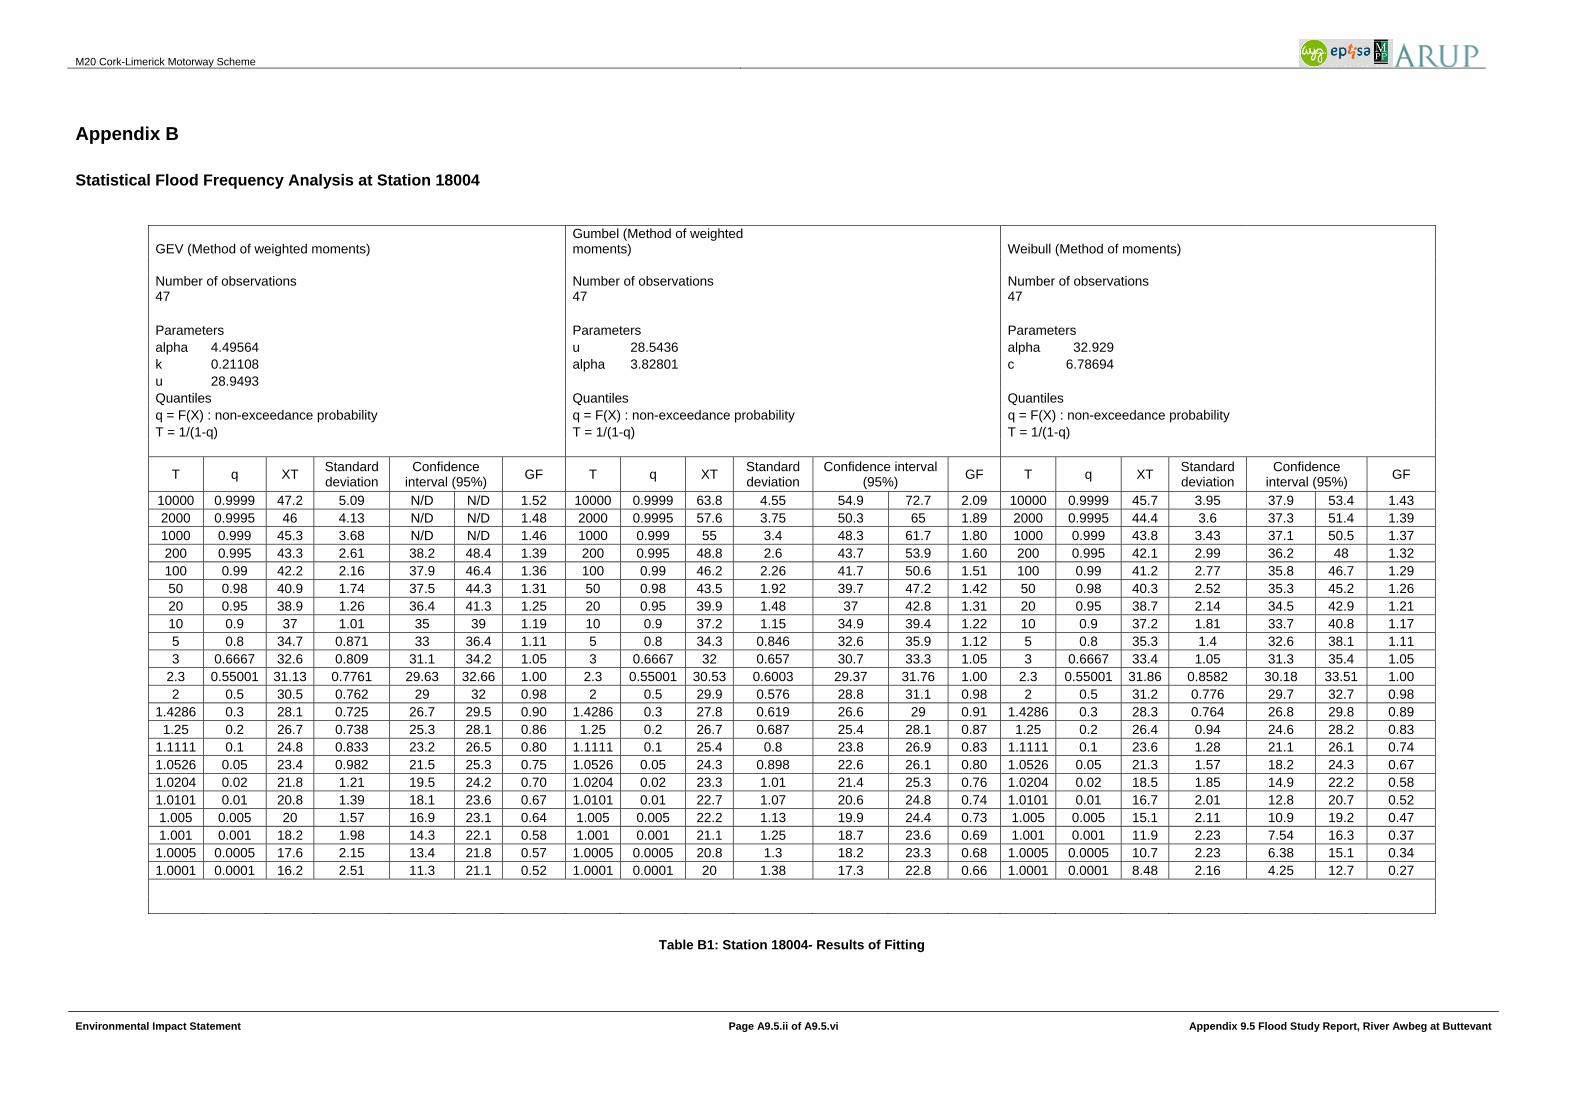
Appendix B provides details of the three distributions fitted to the Annual Maxima dataset at station 18004.
For annual maximum flow records of 48 years the FEH recommends to measure Qbar. Qbar at the subject site was
estimated using Equation 2. Table 4.4 provides details of measured and estimated Qbars at station 18004 and at
the subject site with a 68%-ile confidence interval.
Mean Annual Flood Description
Mean Annual Flood (incl 95%
SFE) 68% SFE 95% SFE
m3/s - m3/s - - 31.20 Qbar(measured)B 30.89 0.99 1.03 33.19 Qbar(estimated)A 48.78 1.47 2.16 49.49 Qbar(estimated)B 72.74 1.47 2.16 20.92 QbarA 20.71
Table 4.4 Estimate of Mean Annual flood

M20 Cork - Limerick Motorway Scheme
Environmental Impact Statement Page A9.5.10 of A9.5.14 Appendix 9.5 Flood Study Report, River Awbeg at Buttevant
4.5 Growth Curve Estimation
Once the index flood, Qbar, was calculated the design flows were adjusted using growth curves for the Awbeg River
in order to allow estimation of less frequent (higher return period) floods. The growth curve was then used in
conjunction with Qbar to estimate flood flows for a range of return periods. There are several ways in which a
growth curve may be derived, and these are described in section 4.5.1 and 4.5.2. 4.5.1 Growth Curve from Regional Equation The FSR provides a regional growth curve for Ireland which may be applied to any river in Ireland to produce an
estimate of flow for a given return period. The growth curve ordinates for the Regional growth curve for Ireland are
given in Table 4.5 and Figure 4.1.
Return period (years): 2 2.3 5 10 25 50 100
Q/Qbar: 0.95 1 1.2 1.37 1.6 1.77 1.96
Table 4.5 Growth curve derived from the FSR Regional Equation for Ireland
Figure 4.1 Graph of Irish Growth Factors for Different Return Periods
4.5.2 Growth curve from Donor Catchment Analysis Where gauged data is available it is possible to estimate growth curves from observed Annual Maximum by the
application of statistical distributions to the population of recorded flows. Growth curves were estimated from the
Annual Maximum data sets at station 18004 on the Awbeg River using the statistical analysis package HyfranPlus.
Two distributions are recommended by the FSR and these are the Gumbel Extreme Value 1 (EV1) and Generalised
Extreme Value (GEV) distributions. The Weibull distribution was also fitted to the data. Table 4.6 provides details of
the various growth curves fitted to the Annual Maximum dataset at station 18004. The growth curves are relatively
flat and it was therefore decided to adopt the more conservative regional growth factor for Ireland as presented in
Figure 4.1.
Return Period GEV
Gumbel (EV1) Weibull
100 1.36 1.51 1.29 50 1.31 1.42 1.26 20 1.25 1.31 1.21 10 1.19 1.22 1.17 5 1.11 1.12 1.11 3 1.05 1.05 1.05
2.3 1.00 1.00 1.00 2 0.98 0.98 0.98
Table 4.6 Growth curve derived from the FSR Regional Equation for Ireland
4.6 Design Flow Estimate
OPW and NRA guidelines indicate that all new watercourse crossings should be designed for 1 in 100 year return
period flows. This involves multiplying the mean annual flood (Qbar) by the appropriate growth factor as described in
section 4.5. The Irish Regional Growth Factor for 1 in 100 year return period is 1.96. Refer to Table 4.5 and Figure
4.1.
Factors for 68% or 95% confidence should also be accounted for in the design flow. The FSR 6 variable catchment
characteristic equation has a factor of 1.47 to allow for 68% confidence and 2.16 to allow for 95% confidence. The
FSR advises that 95% confidence should be used in areas where there is a risk of flooding to properties and the
68% confidence factor should be used elsewhere. As no properties are at risk of flooding at the Buttevant crossing
point, 68% confidence was adopted.
A Drainage District Factors (DDF) of 1.6 was included as the majority of channels in the catchment are located
within a drainage district.

M20 Cork - Limerick Motorway Scheme
Environmental Impact Statement Page A9.5.11 of A9.5.14 Appendix 9.5 Flood Study Report, River Awbeg at Buttevant
In line withOPW and best practice requirements, the determined design flow is subsequently increased by a factor
of 20% to cater for the effects of climate change. The un-gauged FSR design flow with the 68% confidence interval
and 20% climate change is 115m3/s.
Gauged Flows were also estimated using the scaled Mean Annual Flood (QbarA) from the donor catchment analysis
as described in Section 4.2. The Irish Regional Growth Curve was applied to Qbar to allow estimation of less
frequent (higher return period) floods as shown in Table 4.7.
Return period
(years):
Growth Factor
Climate Change
Design Flow
2 0.95 20% 38 2.3 0.99 20% 21
5 1.2 20% 48 10 1.37 20% 55 25 1.6 20% 64 50 1.77 20% 70
100 1.96 20% 78
Table 4.7 Design Flow Estimate including 95% confidence interval
4.7 Outcome
The FSR recommends that if a catchment is gauged then design flows should be calculated from statistical flood
frequency analysis. In the absence of a gauge at the subject site, the FEH recommends that use is made of donor
and/or analogue catchments to improve estimates of the index flood at un-gauged sites. The catchment at the
crossing point is hydraulically similar to that at Ballynamona (Gauging Station 18004). Refer to Tables 4.1 and 4.2
respectively. Based on FSR and FEH recommendations, the close proximity of gauging station 18004 and the
similarity of the catchments hydraulically make it a suitable donor catchment for flow estimations at Buttevant. It was
therefore concluded that the donor catchment estimation method with a resultant flow of 78m3/s at the Buttevant
site was the most suitable design flow estimate.
5.0 Hydraulic Assessment
5.1 Background
A Hydrologic Engineering Centre-River Analysis System (HEC-RAS) 4 was used to assess the flood impact of the
Awbeg River. This software, developed by the US Army Corps of Engineers, allows one-dimensional steady and
unsteady flow calculations to be carried out.
The program requires the following information:
• Topographic survey data of river channel and floodplain in the form of 2 dimensional cross sections
• Dimensions and elevation of relevant structures
• Upstream and downstream flow boundary conditions
• Channel and floodplain roughness coefficients
5.2 Inputs
The HEC-RAS model of the Awbeg River at Buttevant was constructed using survey information and aerial
topography data over a 1.4km reach length.
The river was represented using cross sections that were generated at 10m intervals and include the existing
structure 700m downstream of the proposed M20 crossing at L-5565. Cross sections extended 200-300m either
side of the river channel to include the floodplain. Figure 5.2 illustrates the cross section plan for the analysis area.
Figure 5.1 River Reach and Cross Section Plan
M20 Cork - Limerick Motorway Scheme
Environmental Impact Statement Page A9.5.12 of A9.5.14 Appendix 9.5 Flood Study Report, River Awbeg at Buttevant
A manning’s roughness coefficient (n) of 0.04 was assumed for the main channel and 0.06 for its overbanks based
on guidance in the HEC-RAS Hydraulic Reference Manual (2002).
The HEC-RAS model was run with a 78m3/s design flow using steady flow analysis. The downstream boundary
condition chosen was 0.001 normal depth based on the river slope. There is also an existing structure downstream
of the crossing point included in the analysis: 2 no. 7.7m wide x 2.5m high box structures to carry the local road
L5565.
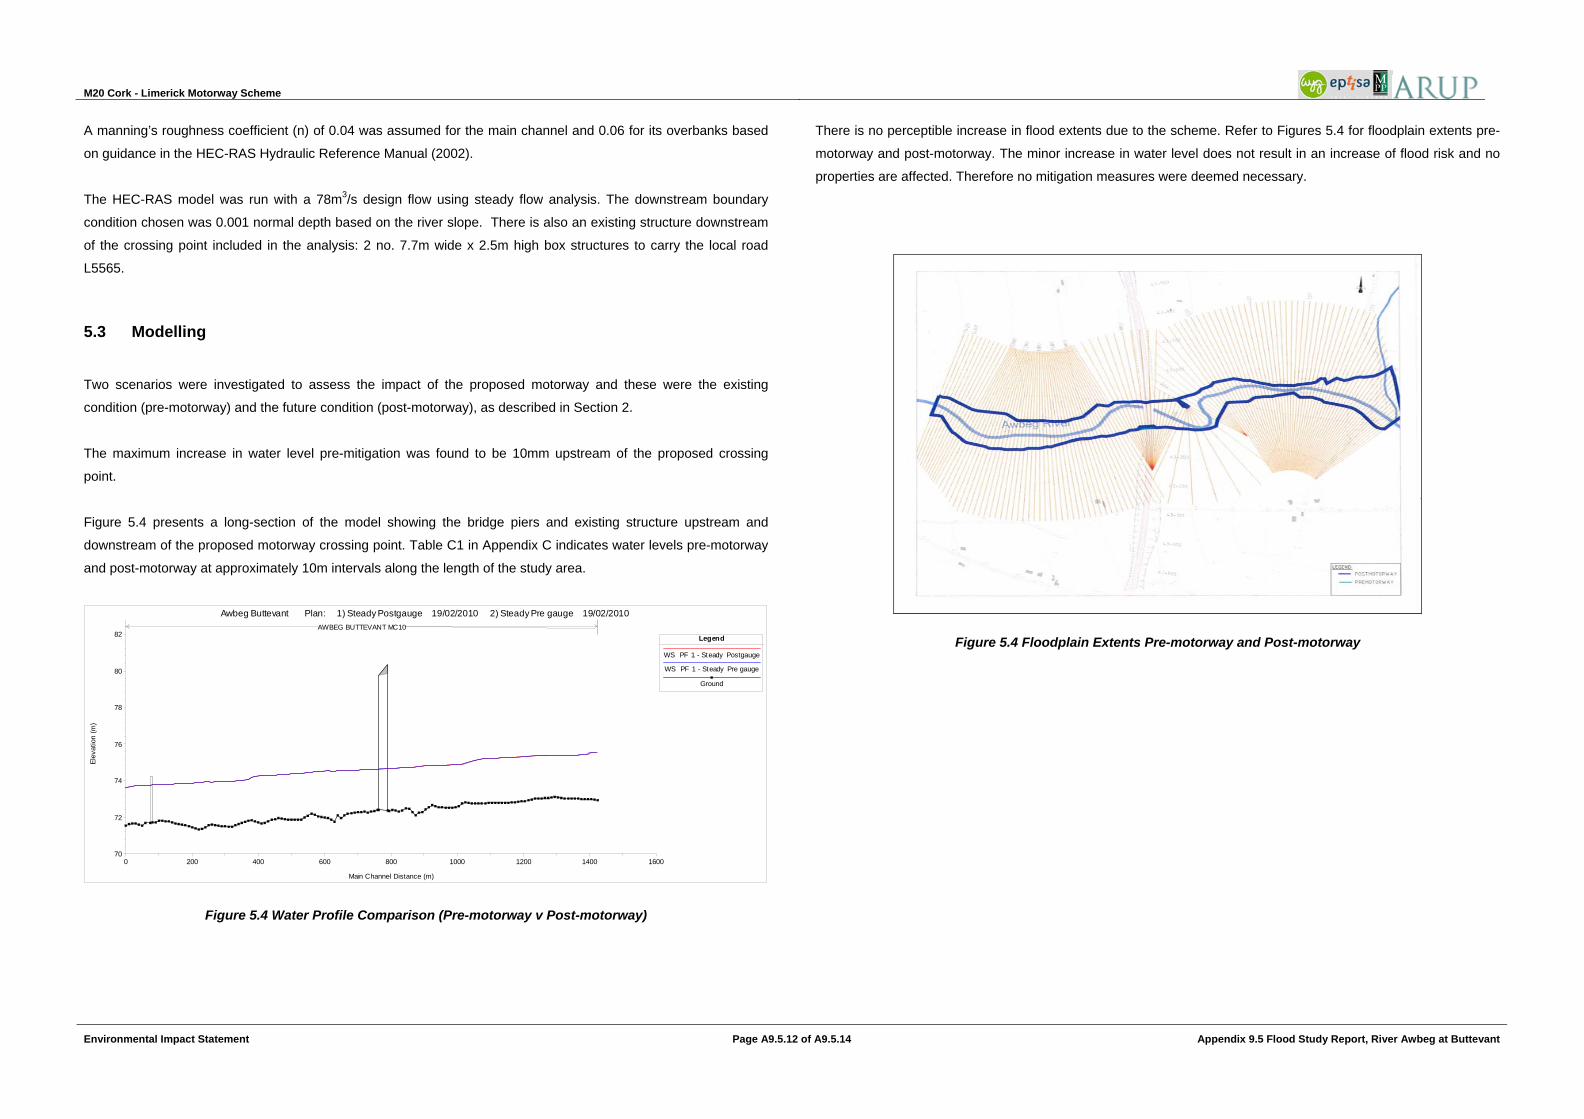
5.3 Modelling
Two scenarios were investigated to assess the impact of the proposed motorway and these were the existing
condition (pre-motorway) and the future condition (post-motorway), as described in Section 2.
The maximum increase in water level pre-mitigation was found to be 10mm upstream of the proposed crossing
point.
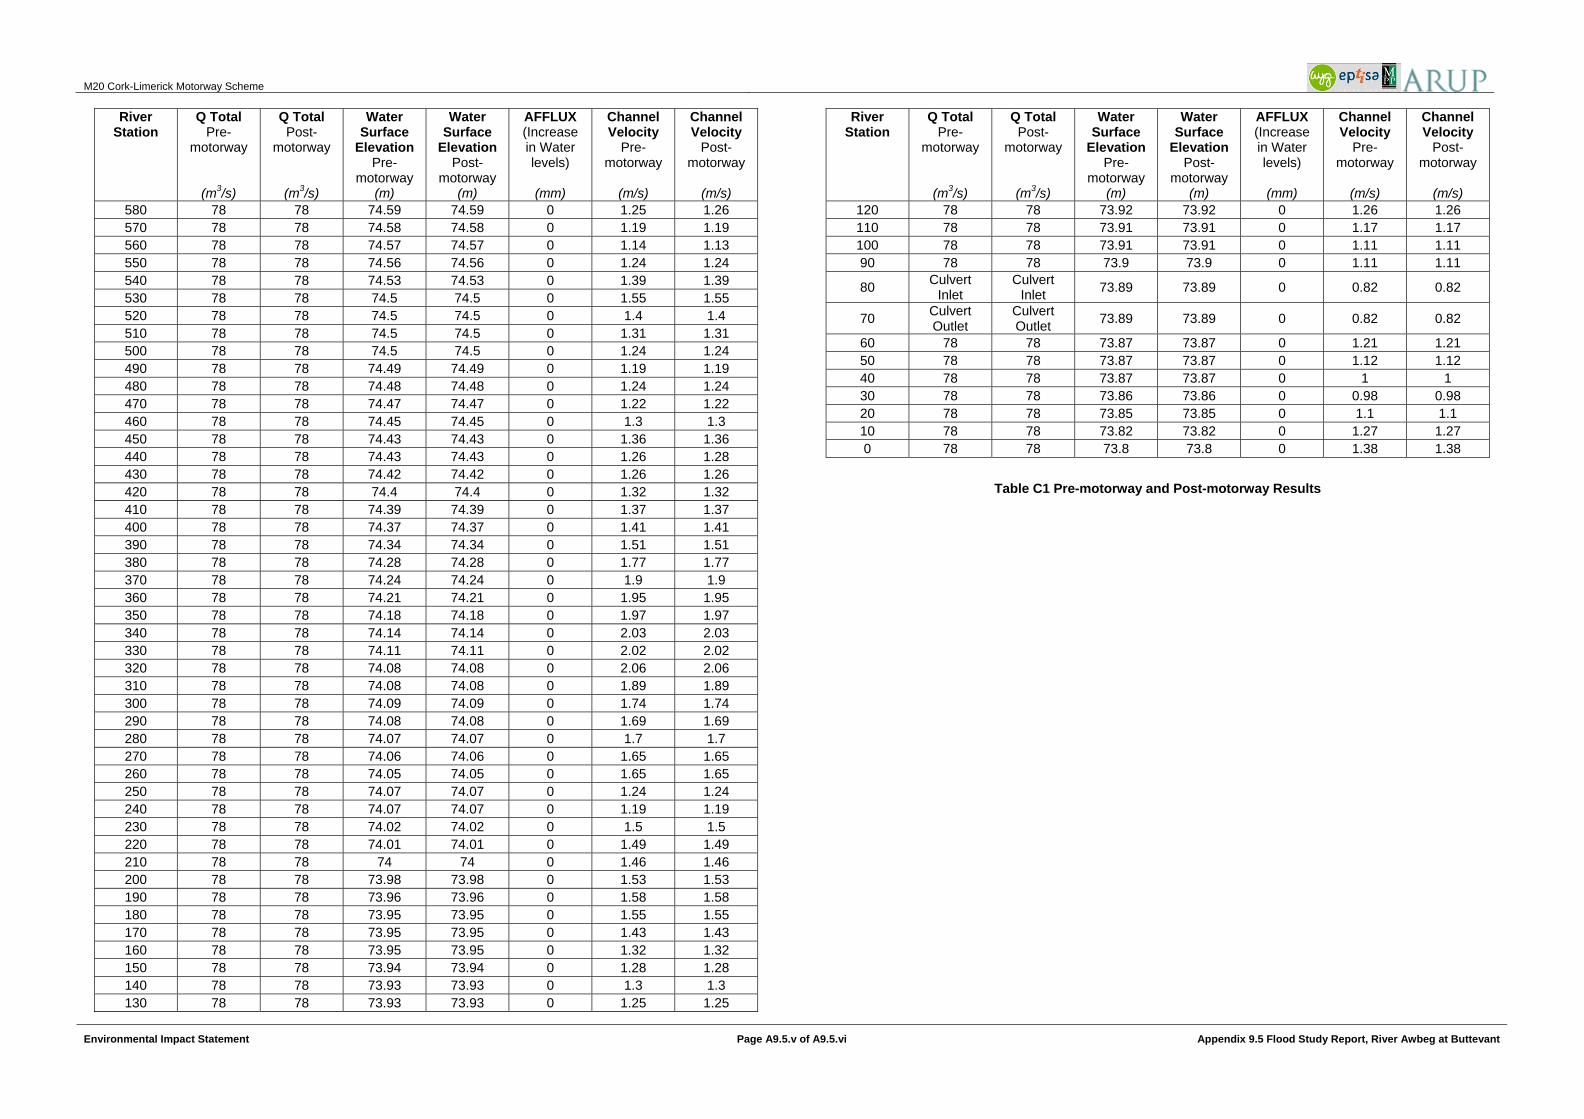
Figure 5.4 presents a long-section of the model showing the bridge piers and existing structure upstream and
downstream of the proposed motorway crossing point. Table C1 in Appendix C indicates water levels pre-motorway
and post-motorway at approximately 10m intervals along the length of the study area.
0 200 400 600 800 1000 1200 1400 160070
72
74
76
78
80
82
Awbeg Buttevant Plan: 1) Steady Postgauge 19/02/2010 2) Steady Pre gauge 19/02/2010
Main Channel Distance (m)
Elev
atio
n (m
)
Legend
WS PF 1 - Steady Postgauge
WS PF 1 - Steady Pre gauge
Ground
AWBEG BUTTEVANT MC10
Figure 5.4 Water Profile Comparison (Pre-motorway v Post-motorway)
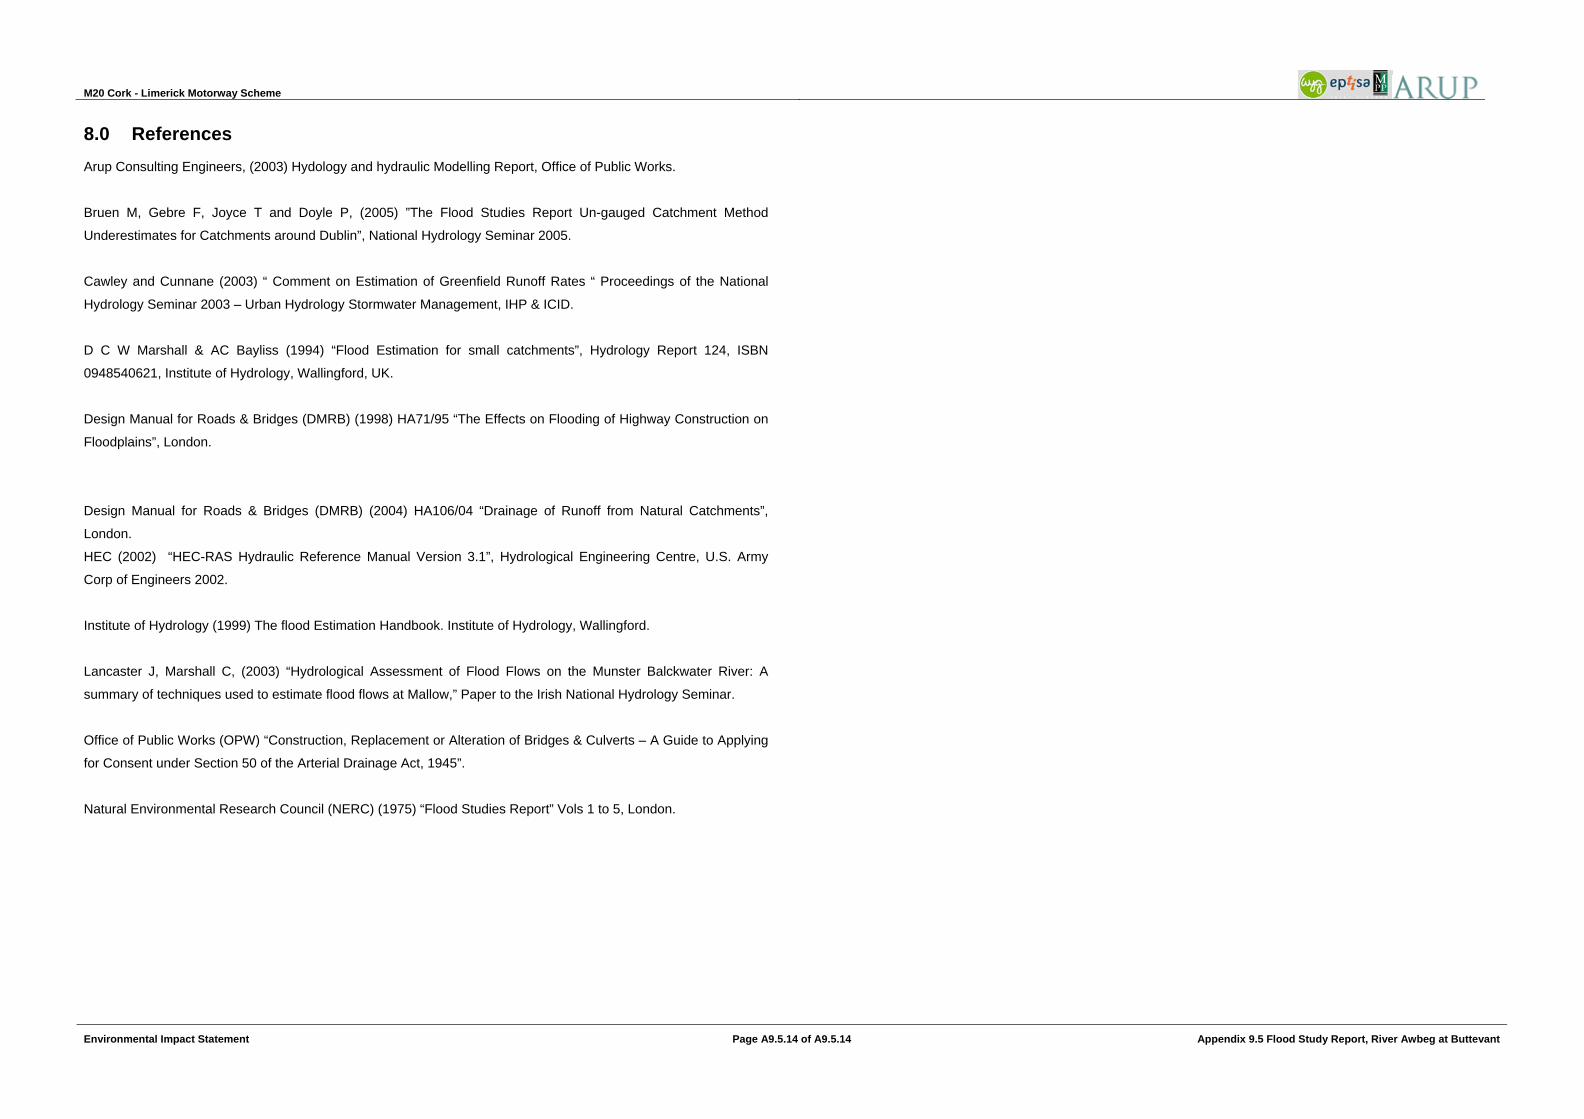
There is no perceptible increase in flood extents due to the scheme. Refer to Figures 5.4 for floodplain extents pre-
motorway and post-motorway. The minor increase in water level does not result in an increase of flood risk and no
properties are affected. Therefore no mitigation measures were deemed necessary.
Figure 5.4 Floodplain Extents Pre-motorway and Post-motorway

M20 Cork - Limerick Motorway Scheme
Environmental Impact Statement Page A9.5.13 of A9.5.14 Appendix 9.5 Flood Study Report, River Awbeg at Buttevant
6.0 Conclusion
The proposed M20 motorway crosses the Awbeg River at Buttevant. The structure identified to convey the
watercourse under the road is a multi-span bridge having a total length of approximately 110m.
Hydrological calculations were undertaken and a design flow of 78m3/s was determined to meet the requirements of
both the FSR and FEH in addition to those of the OPW and the NRA. Hydraulic modelling was subsequently carried
out using this design flow to establish the flood levels and extents of the flood plain.
The hydraulic modelling analysis indicated that flood levels would increase by 10mm as a result of the proposed
motorway and structure This does not cause an increased risk of flooding to properties and is well within the
guidelines outlined by the OPW and the NRA. It was therefore concluded that no additional flood mitigation
measures were required.
7.0 Glossary of Terms
AREA Catchment area (km2) in Equation 1
BFIHOST Base Flow Index as estimated by HOST
DDF District Drainage Factor
EPA Environmental Protection Agency
EV1 Gumbel Extreme Value 1
FEH Flood Estimation Handbook
FSR Flood Study Report
GEV Generalised Extreme Value
HEC-RAS Hydrologic Engineering Centres – River Analysis System
HOST Hydrology of Soil Types
LAKE An index of catchment draining through lakes or reservoirs
NPWS National Parks and Wildlife Service
NRA National Roads Authority
OPW Office of Public Works
POT Peaks Over Threshold
Qbar The Mean Annual Flood
Rsmd A measure of rainfall excess
S1085 The slope of the main channel in Equation 1
SAAR Long-term mean annual rainfall
SHRFB Southern Regional Fisheries Board
SMD Soil Moisture Deficit
SOIL An index of how the soil may accept infiltration
STMFRQ The number of stream junctions per km2 in Equation 1
SWRFB South West Regional Fisheries Board
WRAP Winter Rainfall Acceptance Potential
M20 Cork - Limerick Motorway Scheme
Environmental Impact Statement Page A9.5.14 of A9.5.14 Appendix 9.5 Flood Study Report, River Awbeg at Buttevant
8.0 References Arup Consulting Engineers, (2003) Hydology and hydraulic Modelling Report, Office of Public Works.
Bruen M, Gebre F, Joyce T and Doyle P, (2005) ”The Flood Studies Report Un-gauged Catchment Method
Underestimates for Catchments around Dublin”, National Hydrology Seminar 2005.
Cawley and Cunnane (2003) “ Comment on Estimation of Greenfield Runoff Rates “ Proceedings of the National
Hydrology Seminar 2003 – Urban Hydrology Stormwater Management, IHP & ICID.
D C W Marshall & AC Bayliss (1994) “Flood Estimation for small catchments”, Hydrology Report 124, ISBN
0948540621, Institute of Hydrology, Wallingford, UK.
Design Manual for Roads & Bridges (DMRB) (1998) HA71/95 “The Effects on Flooding of Highway Construction on
Floodplains”, London.
Design Manual for Roads & Bridges (DMRB) (2004) HA106/04 “Drainage of Runoff from Natural Catchments”,
London.
HEC (2002) “HEC-RAS Hydraulic Reference Manual Version 3.1”, Hydrological Engineering Centre, U.S. Army
Corp of Engineers 2002.
Institute of Hydrology (1999) The flood Estimation Handbook. Institute of Hydrology, Wallingford.
Lancaster J, Marshall C, (2003) “Hydrological Assessment of Flood Flows on the Munster Balckwater River: A
summary of techniques used to estimate flood flows at Mallow,” Paper to the Irish National Hydrology Seminar.
Office of Public Works (OPW) “Construction, Replacement or Alteration of Bridges & Culverts – A Guide to Applying
for Consent under Section 50 of the Arterial Drainage Act, 1945”.
Natural Environmental Research Council (NERC) (1975) “Flood Studies Report” Vols 1 to 5, London.

M20 Cork - Limerick Motorway Scheme
Environmental Impact Statement Page A9.5.i of A9.5.v Appendix 9.5 Flood Study Report, River Awbeg at Buttevant
Appendix A - Drawings
M20 Cork-Limerick Motorway Scheme
Environmental Impact Statement Page A9.5.ii of A9.5.vi Appendix 9.5 Flood Study Report, River Awbeg at Buttevant
Appendix B
Statistical Flood Frequency Analysis at Station 18004
GEV (Method of weighted moments) Gumbel (Method of weighted moments) Weibull (Method of moments)
Number of observations 47
Number of observations 47
Number of observations 47
Parameters Parameters Parameters alpha 4.49564 u 28.5436 alpha 32.929 k 0.21108 alpha 3.82801 c 6.78694 u 28.9493 Quantiles Quantiles Quantiles q = F(X) : non-exceedance probability q = F(X) : non-exceedance probability q = F(X) : non-exceedance probability T = 1/(1-q) T = 1/(1-q) T = 1/(1-q)
T q XT Standard deviation
Confidence interval (95%) GF T q XT Standard
deviation Confidence interval
(95%) GF T q XT Standard deviation
Confidence interval (95%) GF
10000 0.9999 47.2 5.09 N/D N/D 1.52 10000 0.9999 63.8 4.55 54.9 72.7 2.09 10000 0.9999 45.7 3.95 37.9 53.4 1.43 2000 0.9995 46 4.13 N/D N/D 1.48 2000 0.9995 57.6 3.75 50.3 65 1.89 2000 0.9995 44.4 3.6 37.3 51.4 1.39 1000 0.999 45.3 3.68 N/D N/D 1.46 1000 0.999 55 3.4 48.3 61.7 1.80 1000 0.999 43.8 3.43 37.1 50.5 1.37 200 0.995 43.3 2.61 38.2 48.4 1.39 200 0.995 48.8 2.6 43.7 53.9 1.60 200 0.995 42.1 2.99 36.2 48 1.32 100 0.99 42.2 2.16 37.9 46.4 1.36 100 0.99 46.2 2.26 41.7 50.6 1.51 100 0.99 41.2 2.77 35.8 46.7 1.29 50 0.98 40.9 1.74 37.5 44.3 1.31 50 0.98 43.5 1.92 39.7 47.2 1.42 50 0.98 40.3 2.52 35.3 45.2 1.26 20 0.95 38.9 1.26 36.4 41.3 1.25 20 0.95 39.9 1.48 37 42.8 1.31 20 0.95 38.7 2.14 34.5 42.9 1.21 10 0.9 37 1.01 35 39 1.19 10 0.9 37.2 1.15 34.9 39.4 1.22 10 0.9 37.2 1.81 33.7 40.8 1.17 5 0.8 34.7 0.871 33 36.4 1.11 5 0.8 34.3 0.846 32.6 35.9 1.12 5 0.8 35.3 1.4 32.6 38.1 1.11 3 0.6667 32.6 0.809 31.1 34.2 1.05 3 0.6667 32 0.657 30.7 33.3 1.05 3 0.6667 33.4 1.05 31.3 35.4 1.05
2.3 0.55001 31.13 0.7761 29.63 32.66 1.00 2.3 0.55001 30.53 0.6003 29.37 31.76 1.00 2.3 0.55001 31.86 0.8582 30.18 33.51 1.00 2 0.5 30.5 0.762 29 32 0.98 2 0.5 29.9 0.576 28.8 31.1 0.98 2 0.5 31.2 0.776 29.7 32.7 0.98
1.4286 0.3 28.1 0.725 26.7 29.5 0.90 1.4286 0.3 27.8 0.619 26.6 29 0.91 1.4286 0.3 28.3 0.764 26.8 29.8 0.89 1.25 0.2 26.7 0.738 25.3 28.1 0.86 1.25 0.2 26.7 0.687 25.4 28.1 0.87 1.25 0.2 26.4 0.94 24.6 28.2 0.83
1.1111 0.1 24.8 0.833 23.2 26.5 0.80 1.1111 0.1 25.4 0.8 23.8 26.9 0.83 1.1111 0.1 23.6 1.28 21.1 26.1 0.74 1.0526 0.05 23.4 0.982 21.5 25.3 0.75 1.0526 0.05 24.3 0.898 22.6 26.1 0.80 1.0526 0.05 21.3 1.57 18.2 24.3 0.67 1.0204 0.02 21.8 1.21 19.5 24.2 0.70 1.0204 0.02 23.3 1.01 21.4 25.3 0.76 1.0204 0.02 18.5 1.85 14.9 22.2 0.58 1.0101 0.01 20.8 1.39 18.1 23.6 0.67 1.0101 0.01 22.7 1.07 20.6 24.8 0.74 1.0101 0.01 16.7 2.01 12.8 20.7 0.52 1.005 0.005 20 1.57 16.9 23.1 0.64 1.005 0.005 22.2 1.13 19.9 24.4 0.73 1.005 0.005 15.1 2.11 10.9 19.2 0.47 1.001 0.001 18.2 1.98 14.3 22.1 0.58 1.001 0.001 21.1 1.25 18.7 23.6 0.69 1.001 0.001 11.9 2.23 7.54 16.3 0.37 1.0005 0.0005 17.6 2.15 13.4 21.8 0.57 1.0005 0.0005 20.8 1.3 18.2 23.3 0.68 1.0005 0.0005 10.7 2.23 6.38 15.1 0.34 1.0001 0.0001 16.2 2.51 11.3 21.1 0.52 1.0001 0.0001 20 1.38 17.3 22.8 0.66 1.0001 0.0001 8.48 2.16 4.25 12.7 0.27
Table B1: Station 18004- Results of Fitting

M20 Cork-Limerick Motorway Scheme
Environmental Impact Statement Page A9.5.iii of A9.5.vi Appendix 9.5 Flood Study Report, River Awbeg at Buttevant
Figure B1: Station 18004 Graph of Fitting

M20 Cork-Limerick Motorway Scheme
Environmental Impact Statement Page A9.5.iv of A9.5.vi Appendix 9.5 Flood Study Report, River Awbeg at Buttevant
Appendix C
Results
River Station
Q Total Pre-
motorway
(m3/s)
Q Total Post-
motorway
(m3/s)
Water Surface
Elevation Pre-
motorway (m)
Water Surface
Elevation Post-
motorway (m)
AFFLUX (Increase in Water levels)
(mm)
Channel Velocity
Pre-motorway
(m/s)
Channel Velocity
Post-motorway
(m/s)
1420 78 78 75.62 75.63 0.01 1.54 1.54 1410 78 78 75.62 75.63 0.01 1.33 1.3 1400 78 78 75.61 75.61 0 1.3 1.29 1390 78 78 75.55 75.55 0 1.82 1.82 1380 78 78 75.54 75.54 0 1.75 1.75 1370 78 78 75.53 75.53 0 1.68 1.68 1360 78 78 75.52 75.52 0 1.6 1.6 1350 78 78 75.51 75.51 0 1.51 1.51 1340 78 78 75.51 75.51 0 1.41 1.41 1330 78 78 75.5 75.5 0 1.34 1.34 1320 78 78 75.5 75.5 0 1.3 1.3 1310 78 78 75.49 75.49 0 1.21 1.21 1300 78 78 75.49 75.49 0 1.1 1.09 1290 78 78 75.49 75.49 0 1 1 1280 78 78 75.48 75.48 0 1.06 1.06 1270 78 78 75.47 75.47 0 1.13 1.13 1260 78 78 75.47 75.47 0 1.09 1.09 1250 78 78 75.46 75.46 0 1.04 1.04 1240 78 78 75.46 75.46 0 1 0.99 1230 78 78 75.45 75.45 0 0.95 0.94 1220 78 78 75.44 75.45 0.01 0.92 0.92 1210 78 78 75.44 75.44 0 0.97 0.97 1200 78 78 75.43 75.43 0 1.09 1.08 1190 78 78 75.41 75.41 0 1.22 1.22 1180 78 78 75.39 75.39 0 1.3 1.29 1170 78 78 75.37 75.37 0 1.33 1.33 1160 78 78 75.36 75.36 0 1.31 1.31 1150 78 78 75.35 75.35 0 1.32 1.32 1140 78 78 75.34 75.34 0 1.35 1.35 1130 78 78 75.33 75.33 0 1.35 1.35 1120 78 78 75.31 75.32 0.01 1.35 1.35 1110 78 78 75.3 75.31 0.01 1.36 1.35 1100 78 78 75.29 75.3 0.01 1.34 1.34 1090 78 78 75.28 75.28 0 1.38 1.38 1080 78 78 75.27 75.27 0 1.36 1.36 1070 78 78 75.26 75.26 0 1.39 1.39 1060 78 78 75.23 75.23 0 1.55 1.55 1050 78 78 75.19 75.19 0 1.75 1.74 1040 78 78 75.15 75.15 0 1.89 1.89
River Station
Q Total Pre-
motorway
(m3/s)
Q Total Post-
motorway
(m3/s)
Water Surface
Elevation Pre-
motorway (m)
Water Surface
Elevation Post-
motorway (m)
AFFLUX (Increase in Water levels)
(mm)
Channel Velocity
Pre-motorway
(m/s)
Channel Velocity
Post-motorway
(m/s)
1030 78 78 75.11 75.11 0 2.06 2.05 1020 78 78 75.05 75.06 0.01 2.21 2.21 1010 78 78 75.02 75.03 0.01 2.17 2.16 1000 78 78 75.01 75.02 0.01 1.94 1.93 990 78 78 75.01 75.01 0 1.77 1.77 980 78 78 74.99 74.99 0 1.74 1.73 970 78 78 74.97 74.98 0.01 1.73 1.73 960 78 78 74.96 74.97 0.01 1.65 1.65 950 78 78 74.96 74.96 0 1.62 1.61 940 78 78 74.94 74.95 0.01 1.61 1.6 930 78 78 74.94 74.94 0 1.45 1.44 920 78 78 74.93 74.94 0.01 1.47 1.46 910 78 78 74.92 74.93 0.01 1.38 1.38 900 78 78 74.92 74.92 0 1.3 1.29 890 78 78 74.9 74.9 0 1.32 1.31 880 78 78 74.88 74.89 0.01 1.37 1.36 870 78 78 74.88 74.88 0 1.3 1.3 860 78 78 74.87 74.87 0 1.37 1.36 850 78 78 74.86 74.86 0 1.39 1.38 840 78 78 74.85 74.85 0 1.37 1.36 830 78 78 74.84 74.84 0 1.37 1.36 820 78 78 74.82 74.82 0 1.42 1.41 810 78 78 74.8 74.81 0.01 1.43 1.42 800 78 78 74.79 74.8 0.01 1.38 1.36 790 78 78 74.78 74.79 0.01 1.36 1.34 780 78 Bridge Inlet - 74.78 - - 0.8
770 78 Bridge Outlet - 74.75 - - 0.79
760 78 78 74.76 74.76 0 1.28 1.27 750 78 78 74.74 74.74 0 1.29 1.27 740 78 78 74.73 74.73 0 1.33 1.31 730 78 78 74.72 74.72 0 1.31 1.3 720 78 78 74.71 74.71 0 1.28 1.28 710 78 78 74.71 74.71 0 1.15 1.15 700 78 78 74.69 74.7 0.01 1.19 1.19 690 78 78 74.68 74.68 0 1.26 1.26 680 78 78 74.67 74.67 0 1.22 1.18 670 78 78 74.66 74.66 0 1.21 1.21 660 78 78 74.65 74.65 0 1.23 1.23 650 78 78 74.65 74.65 0 1.16 1.16 640 78 78 74.64 74.64 0 1.19 1.19 630 78 78 74.64 74.64 0 1.08 1.08 620 78 78 74.63 74.63 0 0.94 0.95 610 78 78 74.64 74.64 0 0.6 0.6 600 78 78 74.63 74.63 0 0.65 0.65 590 78 78 74.61 74.61 0 1.04 1.04
M20 Cork-Limerick Motorway Scheme
Environmental Impact Statement Page A9.5.v of A9.5.vi Appendix 9.5 Flood Study Report, River Awbeg at Buttevant
River Station
Q Total Pre-
motorway
(m3/s)
Q Total Post-
motorway
(m3/s)
Water Surface
Elevation Pre-
motorway (m)
Water Surface
Elevation Post-
motorway (m)
AFFLUX (Increase in Water levels)
(mm)
Channel Velocity
Pre-motorway
(m/s)
Channel Velocity
Post-motorway
(m/s)
580 78 78 74.59 74.59 0 1.25 1.26 570 78 78 74.58 74.58 0 1.19 1.19 560 78 78 74.57 74.57 0 1.14 1.13 550 78 78 74.56 74.56 0 1.24 1.24 540 78 78 74.53 74.53 0 1.39 1.39 530 78 78 74.5 74.5 0 1.55 1.55 520 78 78 74.5 74.5 0 1.4 1.4 510 78 78 74.5 74.5 0 1.31 1.31 500 78 78 74.5 74.5 0 1.24 1.24 490 78 78 74.49 74.49 0 1.19 1.19 480 78 78 74.48 74.48 0 1.24 1.24 470 78 78 74.47 74.47 0 1.22 1.22 460 78 78 74.45 74.45 0 1.3 1.3 450 78 78 74.43 74.43 0 1.36 1.36 440 78 78 74.43 74.43 0 1.26 1.28 430 78 78 74.42 74.42 0 1.26 1.26 420 78 78 74.4 74.4 0 1.32 1.32 410 78 78 74.39 74.39 0 1.37 1.37 400 78 78 74.37 74.37 0 1.41 1.41 390 78 78 74.34 74.34 0 1.51 1.51 380 78 78 74.28 74.28 0 1.77 1.77 370 78 78 74.24 74.24 0 1.9 1.9 360 78 78 74.21 74.21 0 1.95 1.95 350 78 78 74.18 74.18 0 1.97 1.97 340 78 78 74.14 74.14 0 2.03 2.03 330 78 78 74.11 74.11 0 2.02 2.02 320 78 78 74.08 74.08 0 2.06 2.06 310 78 78 74.08 74.08 0 1.89 1.89 300 78 78 74.09 74.09 0 1.74 1.74 290 78 78 74.08 74.08 0 1.69 1.69 280 78 78 74.07 74.07 0 1.7 1.7 270 78 78 74.06 74.06 0 1.65 1.65 260 78 78 74.05 74.05 0 1.65 1.65 250 78 78 74.07 74.07 0 1.24 1.24 240 78 78 74.07 74.07 0 1.19 1.19 230 78 78 74.02 74.02 0 1.5 1.5 220 78 78 74.01 74.01 0 1.49 1.49 210 78 78 74 74 0 1.46 1.46 200 78 78 73.98 73.98 0 1.53 1.53 190 78 78 73.96 73.96 0 1.58 1.58 180 78 78 73.95 73.95 0 1.55 1.55 170 78 78 73.95 73.95 0 1.43 1.43 160 78 78 73.95 73.95 0 1.32 1.32 150 78 78 73.94 73.94 0 1.28 1.28 140 78 78 73.93 73.93 0 1.3 1.3 130 78 78 73.93 73.93 0 1.25 1.25
River Station
Q Total Pre-
motorway
(m3/s)
Q Total Post-
motorway
(m3/s)
Water Surface
Elevation Pre-
motorway (m)
Water Surface
Elevation Post-
motorway (m)
AFFLUX (Increase in Water levels)
(mm)
Channel Velocity
Pre-motorway
(m/s)
Channel Velocity
Post-motorway
(m/s)
120 78 78 73.92 73.92 0 1.26 1.26 110 78 78 73.91 73.91 0 1.17 1.17 100 78 78 73.91 73.91 0 1.11 1.11 90 78 78 73.9 73.9 0 1.11 1.11
80 Culvert Inlet
Culvert Inlet 73.89 73.89 0 0.82 0.82
70 Culvert Outlet
Culvert Outlet 73.89 73.89 0 0.82 0.82
60 78 78 73.87 73.87 0 1.21 1.21 50 78 78 73.87 73.87 0 1.12 1.12 40 78 78 73.87 73.87 0 1 1 30 78 78 73.86 73.86 0 0.98 0.98 20 78 78 73.85 73.85 0 1.1 1.1 10 78 78 73.82 73.82 0 1.27 1.27 0 78 78 73.8 73.8 0 1.38 1.38
Table C1 Pre-motorway and Post-motorway Results

M20 Cork-Limerick Motorway Scheme
Environmental Impact Statement Page A9.5.vi of A9.5.vi Appendix 9.5 Flood Study Report, River Awbeg at Buttevant