appendix 4e full year results for personal use only
TRANSCRIPT

Appendix 4EFull Year Results
For the year ended 30 June 2018Released 13 August 2018
ABN 11 068 049 178
This report comprises information given to the ASX under listing rule 4.3A
For
per
sona
l use
onl
y

THIS PAGE HAS BEEN LEFT BLANK INTENTIONALLY
For
per
sona
l use
onl
y

1 Appendix 4E: Full year results 3 2 Full year results (continued)
1.1 3 2.3 Financial statements 19
1.2 3 2.3.1 Balance sheet metrics 19
1.3 3 2.3.2 Statement of comprehensive income 20
1.4 ASX Appendix 4E table 3 2.3.3 Balance sheet 20
1.5 4 2.3.4 Statement of changes in equity 21
1.6 Key highlights 4 2.3.5 Cash flow statement 22
1.7 4 2.3.6 Lending 23
1.8 4 2.3.7 Asset quality 24
2.3.8 Credit expenses 25
2 Full year results 2.3.9 Deposits and funds under management 26
2.1 Financial summary 5 2.3.10 Capital and shareholder returns 27
2.1.1 Statutory profit results 5 2.3.10.1 Assets and capital 27
2.1.2 Cash earnings results 6 2.3.10.2 Capital adequacy 27
2.1.3 Cash earnings reconciliation 7 2.3.10.3 Shareholder returns 29
2.2 Results commentary 9 2.3.10.4 Dividends 30
2.2.1 Specific items 9 2.4 Additional notes 31
2.2.2 Net interest margin 10 2.4.1 Analysis of intangible assets 31
2.2.3 Income 11 2.4.2 Net tangible assets per share 31
2.2.4 Homesafe Trust 12 2.4.3 Investments accounted for using the equity method 31
2.2.5 Operating expenses 13 2.4.4 Credit ratings 32
2.2.6 Average balance sheet 14 2.4.5 Issued capital 32
2.2.7 Segment results 17 2.4.6 AASB 9 Financial instruments 32
Subsequent events
Highlights
Annual general meeting
Appendix 4E: Full Year Results
Contents
Company details and reporting period
Results for announcement to the market
Cash earnings results
For
per
sona
l use
onl
y

1.1 Company details and reporting period
Bendigo and Adelaide Bank Limited
ABN 11 068 049 178
Reporting period - twelve months ended: 30 June 2018
Previous corresponding period - twelve months ended: 30 June 2017
1.2 Results for announcement to the market
Dividends Date Payable/Paid Amount per security
Current year 2018
Record date for determining entitlements 4 September 2018
Final dividend - fully franked 28 September 2018 35.0 cents
Interim dividend - fully franked 29 March 2018 35.0 cents
Previous year 2017
Final dividend - fully franked 29 September 2017 34.0 cents
Interim dividend - fully franked 31 March 2017 34.0 cents
1.3 Cash earnings results
See note 2.1.2 and 2.3.10.3 for full details
This Appendix 4E: Full year results should be read in conjunction with the media release and results presentation released to the
ASX on 13 August 2018.
1.4 ASX Appendix 4E table Page
Details of reporting period and previous period 3
Results for announcement to the market 3
Commentary on results 9
Net tangible assets per ordinary share 31
Details of individual and total dividends 30
Dividend dates 3
Details of any dividend or distribution reinvestment plans in operation 30
Details of associates and joint arrangement entities 31
Details of entities over which control has been gained or lost during the period
During the financial period there have been no changes to the entities in the Group.
Accounting standards used for foreign entities
Not applicable.
Dispute or qualifications if audited
This report is based on financial accounts that are in the process of being audited by our external auditors, Ernst & Young.
Appendix 4E: Full year results
3Appendix 4E: Full year results
Year ended 30 June 2018
Cash earnings attributable to Owners of the Company 6.4% to $445.1m
Cash earnings per share 4.1% to 92.1 cents
Income from operations 2.1% to $1,643.5m
Profit after tax from ordinary activities 1.1% to $434.5m
Net profit after tax attributable to Owners of the Company 1.1% to $434.5m
For
per
sona
l use
onl
y

1.5 Highlights
1.6 Key highlights
On a statutory basis, net profit was $434.5m compared to $429.6m in June 2017.
Cash earnings 1 was $445.1m compared to $418.3m in June 2017.
On a cash earnings basis:
Net interest income increased $91.6m to $1,323.6m. Net interest margin (before revenue share arrangements) for the year increased
by 14 basis point to 2.36% compared to the prior corresponding period. The net interest margin increased mainly due to
repricing activity both in the lending and deposit portfolio;
Other operating income decreased $28.5m or 9.2% mainly due to a reduction in trading book revaluation income and a reduction
in ATM and transaction fees charged to customers.
Expenses increased by 3.2% or $27.9m mainly due to an increase in staff costs due to salary increases and lower capitalisation rates,
software amortisation and technology costs.
Credit expenses decreased by 1.7% or $1.2m. The expenses for the second half were $24.6m, which was a decrease of $22.0m
from the first half.
Net impaired assets increased by $23.4m or 12.1%.
Great Southern past due 90 days has reduced by $28.5m or 36.1%, other lending past due 90 days has increased by $10.9m or 2.5%.
Common Equity Tier 1 ratio was up 35 basis points to 8.62% compared to June 2017. Total capital was 12.85% compared to 12.46% in June 2017.
The final dividend has been increased by 1 cent to 35 cents compared to the final dividend for June 2017.
1 Specific items cash earnings adjustments are outlined in section 2.2.1.
1.7 Annual general meeting
1.8 Subsequent eventsNo other matters or circumstances have arisen since the end of the financial year to the date of this report which significantly affected or
may significantly affect the operations of the Group, the results of those operations, or the state of affairs of the Group in subsequent
financial periods.
The annual general meeting will be held as follows:
Place: Ulumbarra Theatre, Gaol Road, Bendigo, Victoria
Date: 30 October 2018
Time: 11 a.m. (Australian Eastern Daylight Saving Time)
Appendix 4E: Full year results
Year ended 30 June 2018 4
Statutory profit 1.1% to $434.5m
Statutory earnings per share 1.1% to 89.9 cents
Cash earnings 6.4% to $445.1m
Cash earnings per share 4.1% to 92.1 cents
CET1 ratio of 8.62% 35 basis points compared to June 2017
For
per
sona
l use
onl
y

2.0 Full year results
2.1 Financial summary
2.1.1 Statutory profit results
Jun-18 Jun-17 Jun-18 Dec-17
$m $m $m % $m $m $m %
Net interest income 1,305.2 1,213.6 91.6 7.5 647.5 657.7 (10.2) (1.6)
Other operating income 338.3 395.9 (57.6) (14.5) 153.1 185.2 (32.1) (17.3)
Total income 1,643.5 1,609.5 34.0 2.1 800.6 842.9 (42.3) (5.0)
Credit expenses (70.6) (71.8) 1.2 1.7 (24.3) (46.3) 22.0 47.5
Operating expenses (938.4) (909.4) (29.0) (3.2) (480.9) (457.5) (23.4) (5.1)
Total expenses (1,009.0) (981.2) (27.8) (2.8) (505.2) (503.8) (1.4) (0.3)
Profit before income tax expense 634.5 628.3 6.2 1.0 295.4 339.1 (43.7) (12.9)
Income tax expense (200.0) (198.7) (1.3) (0.7) (92.6) (107.4) 14.8 13.8
434.5 429.6 4.9 1.1 202.8 231.7 (28.9) (12.5)
Jun-18 Dec-17 Total Jun-17 Dec-16 Total
Earnings per ordinary share (cents) cents cents cents cents cents cents
Basic 41.8 48.1 89.9 46.3 44.6 90.9
Diluted 37.6 43.7 81.2 42.4 40.5 82.9
Franked dividends per share 35.0 35.0 70.0 34.0 34.0 68.0
Financial performance ratios % % % % % %
Net interest margin before revenue share arrangements 2.37% 2.36% 2.36% 2.26% 2.17% 2.22%
1.98% 1.98% 1.98% 1.89% 1.82% 1.86%
Financial position ratios % % % % % %
Return on average ordinary equity (after tax) 7.50% 8.57% 8.03% 8.49% 8.15% 8.32%
Return on average tangible equity (after tax) 10.45% 12.05% 11.24% 12.11% 11.74% 11.93%
Return on average assets 0.59% 0.67% 0.63% 0.65% 0.61% 0.63%
Statutory EPS (cents) Net interest margin before
revenue share arrangements (%)
(69)
-
bps change
(29)
bps change
14
Net interest margin after revenue share arrangements 12
Full year ending Six months ending
(1.7)
2.0
Change Change
Profit after income tax expense
(1.0)
cps
Half year Half year
Year on year change
Appendix 4E: Full year results
Year ended 30 June 20185
44.6 46.3 48.1
41.8
31 December
2016
30 June 2017 31 December
2017
30 June 2018
2.17%
2.26%
2.36%2.37%
31 December
2016
30 June 2017 31 December
2017
30 June 2018
For
per
sona
l use
onl
y
2.1 Financial summary (continued)
2.1.2 Cash earnings results
Jun-18 Jun-17 Jun-18 Dec-17
$m $m $m % $m $m $m %
Net interest income 1,323.6 1,232.0 91.6 7.4 655.6 668.0 (12.4) (1.9)
Other operating income 281.2 309.7 (28.5) (9.2) 136.7 144.5 (7.8) (5.4)
Total income 1,604.8 1,541.7 63.1 4.1 792.3 812.5 (20.2) (2.5)
Credit expenses (70.6) (71.8) 1.2 1.7 (24.3) (46.3) 22.0 47.5
Operating expenses (900.9) (873.0) (27.9) (3.2) (455.4) (445.5) (9.9) (2.2)
Total expenses (971.5) (944.8) (26.7) (2.8) (479.7) (491.8) 12.1 2.5
Income tax expense (199.5) (189.7) (9.8) (5.2) (97.8) (101.7) 3.9 3.8
433.8 407.2 26.6 6.5 214.8 219.0 (4.2) (1.9)
Net Homesafe realised income (after tax) 11.3 11.1 0.2 1.8 5.0 6.3 (1.3) (20.6)
445.1 418.3 26.8 6.4 219.8 225.3 (5.5) (2.4)
Jun-18 Dec-17 Total Jun-17 Dec-16 Total
Earnings per ordinary share (cents) cents cents cents cents cents cents
Cash 45.3 46.8 92.1 45.0 43.5 88.5
Financial performance ratios (cash) % % % % % %
Cost to income ratio 57.0% 54.2% 55.6% 55.7% 56.4% 56.1%
Financial position ratios (cash) % % % % % %
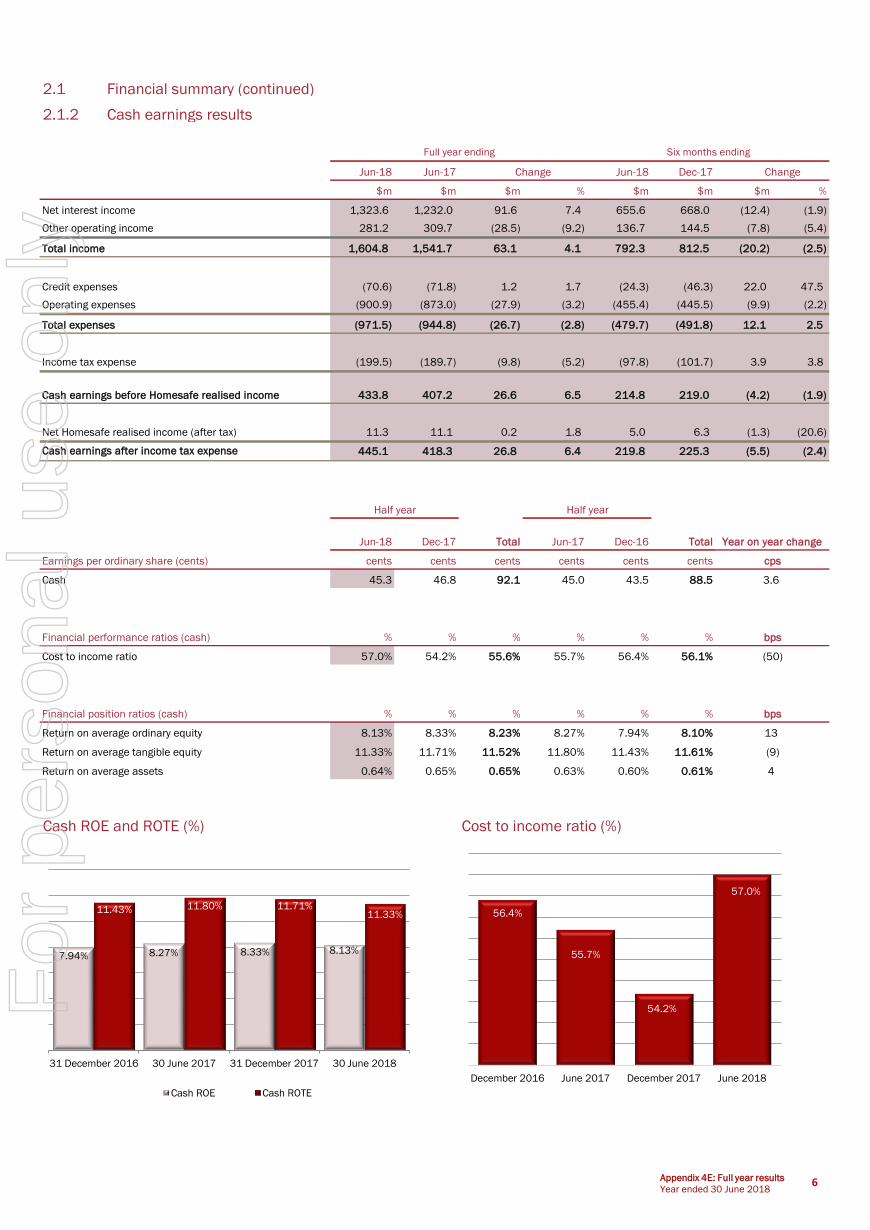
Return on average ordinary equity 8.13% 8.33% 8.23% 8.27% 7.94% 8.10%
Return on average tangible equity 11.33% 11.71% 11.52% 11.80% 11.43% 11.61%
Return on average assets 0.64% 0.65% 0.65% 0.63% 0.60% 0.61%
Cash ROE and ROTE (%) Cost to income ratio (%)
4
13
(9)
bps
cps
(50)
bps
3.6
Half year Half year
Year on year change
Cash earnings after income tax expense
Full year ending Six months ending
Change Change
Cash earnings before Homesafe realised income
Appendix 4E: Full year results
Year ended 30 June 20186
7.94% 8.27% 8.33% 8.13%
11.43% 11.80% 11.71%11.33%
31 December 2016 30 June 2017 31 December 2017 30 June 2018
Cash ROE Cash ROTE
56.4%
55.7%
54.2%
57.0%
December 2016 June 2017 December 2017 June 2018
For
per
sona
l use
onl
y

2.1 Financial summary (continued)
2.1.3 Cash earnings reconciliation
For the year ended 30 June 2018
Statutory
profit
Fair
value
adjust-
ments
Homesafe
unrealised
adjust-
ments
Hedging
income/(
costs)
(Profit)/
loss on
sale of
business
Integrat-
ion costs
Impair-
ment
charge/
(reversal)
Operating
expenses 1
Amortisat-
ion of
intangibles
Cash
earnings
sub-total 2
Homesafe
realised
income
Cash
earnings
$m $m $m $m $m $m $m $m $m $m $m $m
Net interest income 1,305.2 1.2 17.2 - - - - - - 1,323.6 (7.5) 1,316.1
Other income 338.3 - (55.4) (1.7) - - - - - 281.2 23.7 304.9
Total income 1,643.5 1.2 (38.2) (1.7) - - - - - 1,604.8 16.2 1,621.0
Credit expenses (70.6) - - - - - - - - (70.6) - (70.6)
Operating expenses (938.4) - - - 1.6 7.6 0.4 19.7 8.2 (900.9) - (900.9)
Net profit before tax 634.5 1.2 (38.2) (1.7) 1.6 7.6 0.4 19.7 8.2 633.3 16.2 649.5
Tax expense (200.0) (0.4) 11.4 0.5 (0.4) (2.3) - (5.9) (2.4) (199.5) (4.9) (204.4)
434.5 0.8 (26.8) (1.2) 1.2 5.3 0.4 13.8 5.8 433.8 11.3 445.1
For the year ended 30 June 2017
Statutory
profit
Fair
value
adjust-
ments
Homesafe
unrealised
adjust-
ments
Hedge
ineffectiv
e-ness
(Profit)/
loss on
sale of
business
Integrat-
ion costs
Impair-
ment
charge/
(reversal)
Operating
expenses 1
Amortisat-
ion of
intangibles
Cash
earnings
sub-total 2
Homesafe
realised
income
Cash
earnings
$m $m $m $m $m $m $m $m $m $m $m $m
Net interest income 1,213.6 2.6 15.8 - - - - - - 1,232.0 (8.2) 1,223.8
Other income 395.9 - (90.4) 8.1 (3.9) - - - - 309.7 24.0 333.7
Total income 1,609.5 2.6 (74.6) 8.1 (3.9) - - - - 1,541.7 15.8 1,557.5
Credit expenses (71.8) - - - - - - - - (71.8) - (71.8)
Operating expenses (909.4) - - - - 13.2 (0.8) 6.3 17.7 (873.0) - (873.0)
Net profit before tax 628.3 2.6 (74.6) 8.1 (3.9) 13.2 (0.8) 6.3 17.7 596.9 15.8 612.7
Tax expense (198.7) (0.8) 22.4 (2.5) 1.2 (4.0) (0.1) (1.9) (5.3) (189.7) (4.7) (194.4)
429.6 1.8 (52.2) 5.6 (2.7) 9.2 (0.9) 4.4 12.4 407.2 11.1 418.3
1 includes legal, litigation and compensation costs.
2 Cash earnings subtotal is equal to cash earnings before Homesafe realised income.
Statutory profit and cash profit ($m)
Cash earnings adjustments
Net profit after tax
Cash earnings adjustments
Net profit after tax
Appendix 4E: Full year results
Year ended 30 June 20187
$209.0
$220.6
$231.7
$202.8 $203.5
$214.8
$225.3
$219.8
31 December 2016 30 June 2017 31 December 2017 30 June 2018
Statutory profit after tax Cash profit after tax
For
per
sona
l use
onl
y

2.1 Financial summary (continued)
2.1.3 Cash earnings reconciliation
For the half year ended 30 June 2018
Statutory
profit
Fair value
adjust-
ments
Homesafe
unrealised
adjust-
ments
Hedging
income/(
costs)
(Profit)/
loss on
sale of
business
Integrat-
ion costs
Impair-
ment
charge/
(reversal)
Operating
expenses 1
Amortisat-
ion of
intangibles
Cash
earnings
sub-total 2
Homesafe
realised
income
Cash
earnings
$m $m $m $m $m $m $m $m $m $m $m $m
Net interest income 647.5 0.5 7.6 - - - - - - 655.6 (3.0) 652.6
Other income 153.1 - (15.8) (0.6) - - - - - 136.7 10.2 146.9
Total income 800.6 0.5 (8.2) (0.6) - - - - - 792.3 7.2 799.5
Credit expenses (24.3) - - - - - - - - (24.3) - (24.3)
Operating expenses (480.9) - - - 1.6 2.3 - 19.7 1.9 (455.4) - (455.4)
Net profit before tax 295.4 0.5 (8.2) (0.6) 1.6 2.3 - 19.7 1.9 312.6 7.2 319.8
Tax expense (92.6) (0.2) 2.4 0.2 (0.4) (0.7) - (5.9) (0.6) (97.8) (2.2) (100.0)
202.8 0.3 (5.8) (0.4) 1.2 1.6 - 13.8 1.3 214.8 5.0 219.8
For the half year ended 31 December 2017
Statutory
profit
Fair value
adjust-
ments
Homesafe
unrealised
adjust-
ments
Hedging
income/(
costs)
(Profit)/
loss on
sale of
business
Integrat-
ion costs
Impair-
ment
charge/
(reversal)
Operating
expenses 1
Amortisat-
ion of
intangibles
Cash
earnings
sub-total 2
Homesafe
realised
income
Cash
earnings
$m $m $m $m $m $m $m $m $m $m $m $m
Net interest income 657.7 0.7 9.6 - - - - - - 668.0 (4.5) 663.5
Other income 185.2 - (39.6) (1.1) - - - - - 144.5 13.5 158.0
Total income 842.9 0.7 (30.0) (1.1) - - - - - 812.5 9.0 821.5
Credit expenses (46.3) - - - - - - - - (46.3) - (46.3)
Operating expenses (457.5) - - - - 5.3 0.4 - 6.3 (445.5) - (445.5)
Net profit before tax 339.1 0.7 (30.0) (1.1) - 5.3 0.4 - 6.3 320.7 9.0 329.7
Tax expense (107.4) (0.2) 9.0 0.3 - (1.6) - - (1.8) (101.7) (2.7) (104.4)
231.7 0.5 (21.0) (0.8) - 3.7 0.4 - 4.5 219.0 6.3 225.3
1 includes legal, litigation and compensation costs.
2 Cash earnings subtotal is equal to cash earnings before Homesafe realised income.
Cash earnings adjustments
Net profit after tax
Cash earnings adjustments
Net profit after tax
Appendix 4E: Full year results
Year ended 30 June 2018 8
For
per
sona
l use
onl
y
2.2 Results commentary
2.2.1 Specific items
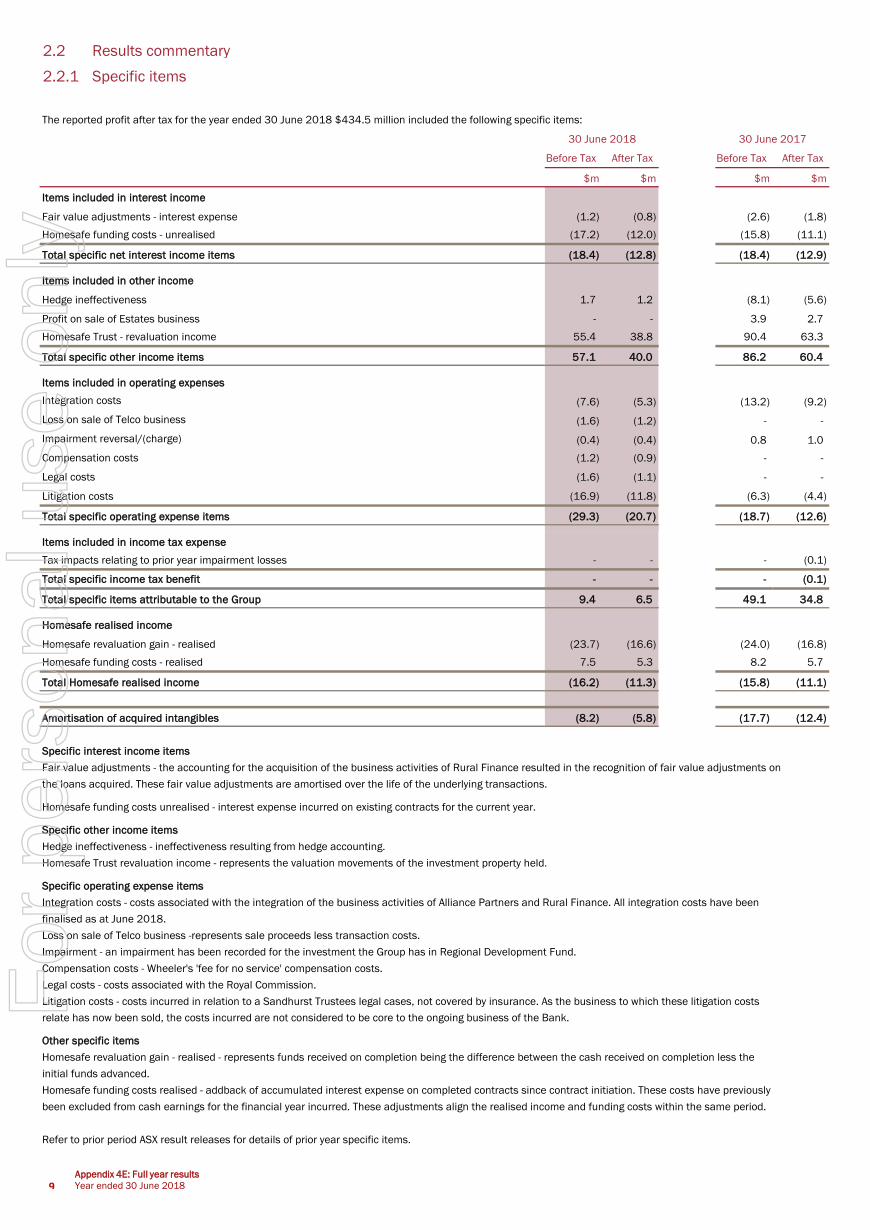
The reported profit after tax for the year ended 30 June 2018 $434.5 million included the following specific items:
Before Tax After Tax Before Tax After Tax
$m $m $m $m
Items included in interest income
Fair value adjustments - interest expense (1.2) (0.8) (2.6) (1.8)
Homesafe funding costs - unrealised (17.2) (12.0) (15.8) (11.1)
Total specific net interest income items (18.4) (12.8) (18.4) (12.9)
Items included in other income
Hedge ineffectiveness 1.7 1.2 (8.1) (5.6)
Profit on sale of Estates business - - 3.9 2.7
Homesafe Trust - revaluation income 55.4 38.8 90.4 63.3
Total specific other income items 57.1 40.0 86.2 60.4
Items included in operating expenses
Integration costs (7.6) (5.3) (13.2) (9.2)
Loss on sale of Telco business (1.6) (1.2) - -
Impairment reversal/(charge) (0.4) (0.4) 0.8 1.0
Compensation costs (1.2) (0.9) - -
Legal costs (1.6) (1.1) - -
Litigation costs (16.9) (11.8) (6.3) (4.4)
Total specific operating expense items (29.3) (20.7) (18.7) (12.6)
Items included in income tax expense
Tax impacts relating to prior year impairment losses - - - (0.1)
Total specific income tax benefit - - - (0.1)
Total specific items attributable to the Group 9.4 6.5 49.1 34.8
Homesafe realised income
Homesafe revaluation gain - realised (23.7) (16.6) (24.0) (16.8)
Homesafe funding costs - realised 7.5 5.3 8.2 5.7
Total Homesafe realised income (16.2) (11.3) (15.8) (11.1)
Amortisation of acquired intangibles (8.2) (5.8) (17.7) (12.4)
Specific interest income items
Fair value adjustments - the accounting for the acquisition of the business activities of Rural Finance resulted in the recognition of fair value adjustments on
the loans acquired. These fair value adjustments are amortised over the life of the underlying transactions.
Homesafe funding costs unrealised - interest expense incurred on existing contracts for the current year.
Specific other income items
Hedge ineffectiveness - ineffectiveness resulting from hedge accounting.
Homesafe Trust revaluation income - represents the valuation movements of the investment property held.
Specific operating expense items
Integration costs - costs associated with the integration of the business activities of Alliance Partners and Rural Finance. All integration costs have been
finalised as at June 2018.
Loss on sale of Telco business -represents sale proceeds less transaction costs.
Impairment - an impairment has been recorded for the investment the Group has in Regional Development Fund.
Compensation costs - Wheeler's 'fee for no service' compensation costs.
Legal costs - costs associated with the Royal Commission.
Litigation costs - costs incurred in relation to a Sandhurst Trustees legal cases, not covered by insurance. As the business to which these litigation costs
relate has now been sold, the costs incurred are not considered to be core to the ongoing business of the Bank.
Other specific items
Homesafe revaluation gain - realised - represents funds received on completion being the difference between the cash received on completion less the
initial funds advanced.
Homesafe funding costs realised - addback of accumulated interest expense on completed contracts since contract initiation. These costs have previously
been excluded from cash earnings for the financial year incurred. These adjustments align the realised income and funding costs within the same period.
Refer to prior period ASX result releases for details of prior year specific items.
30 June 2018 30 June 2017
9Appendix 4E: Full year results
Year ended 30 June 2018
For
per
sona
l use
onl
y

2.2.2 Net interest margin (before revenue share arrangements)
Asset mix - impact of holding lower average liquid asset balances during the year. Higher liquidity was required in FY17 to support the Keystart
portfolio acquistion.
Liability pricing - deposit rate repricing has occurred over the past 12 months, particularly in term deposit rates as the Bank managed its funding
requirements.
Liability mix - the continued strong at call deposit growth has had a positive impact on the total cost of deposit funding.
Asset pricing - pricing pressure continued on variable lending portfolios. This was partially offset by reduced hedging expense.
Asset mix - a reduction in average balance of liquid assets through ongoing management of liquid position.
Liability pricing - rate repricing continued on term deposits as the Bank managed its funding requirements, however this has been partially offset
by the higher cost of wholesale funding due to the increase in BBSW rates.
Liability mix - the continued strong at call deposit growth has had a positive impact on the total cost of deposits funding.
Equity contribution - the contribution to margin from net free liabilities and equity reduced marginally, reflecting lower margins earned by assets
funded by these balances.
Net Interest Income 1
Jun-18 Jun-17 Jun-18 Dec-17
$m $m $m $m
Net interest income including specific items 2
1,305.2 1,213.6 647.5 657.7
Adjustments:
Fair value adjustments 3
1.2 2.6 0.5 0.7
Net interest income used in NIM calculation 1,306.4 1,216.2 648.0 658.4
Average interest earning assets 4
66,007.3 65,418.7 65,868.6 66,109.9
Average interest earning liabilities 4
62,326.1 61,900.9 62,150.6 62,483.6
Net interest margin 1.98% 1.86% 1.98% 1.98%
Net interest margin before revenue share arrangement 2.36% 2.22% 2.37% 2.36%
1 Net interest income includes Homesafe unrealised funding costs.
2 Refer to section 2.1.1 - Statutory net interest income.
3 Fair value adjustments represent entries created on a business acquisition (Rural Finance).
4 Offset products have been reclassified from deposits and netted against the corresponding loan balance
(June 18 FY: $2,551.4m, June 17 FY: $2,303.3m, June 18 HY: $2,596.0m, December 17 HY: $2,511.1m).
Half yearFull year
Net interest margin June 17 to June 18
Net interest margin December 17 to June 18
10Appendix 4E: Full year results
Year ended 30 June 2018
2.22%
2.36%0.03
0.09
0.02
June 2017 Asset mix Liability pricing Liability mix June 2018
2.36% 2.37%
0.01 0.03
0.01
0.03
0.01
December 2017 Asset pricing Asset mix Liability pricing Liability mix Equity
contribution
June 2018
For
per
sona
l use
onl
y

2.2.3 Income
Jun-18 Jun-17 Jun-18 Dec-17
$m $m $m % $m $m $m %
Net interest income 1,323.6 1,232.0 91.6 7.4 655.6 668.0 (12.4) (1.9)
Homesafe funding costs - unrealised (17.2) (15.8) (1.4) (8.9) (7.6) (9.6) 2.0 20.8
Fair value adjustments - interest expense (1.2) (2.6) 1.4 53.8 (0.5) (0.7) 0.2 28.6
Total net interest income including specific items 1,305.2 1,213.6 91.6 7.5 647.5 657.7 (10.2) (1.6)
Other income
Fee Income 167.9 172.2 (4.3) (2.5) 83.2 84.7 (1.5) (1.8)
Commissions 71.7 72.7 (1.0) (1.4) 36.5 35.2 1.3 3.7
Foreign exchange income 18.8 18.0 0.8 4.4 9.6 9.2 0.4 4.3
Trading book income 0.8 19.8 (19.0) (96.0) (2.4) 3.2 (5.6) (175.0)
Other 22.0 27.0 (5.0) (18.5) 9.8 12.2 (2.4) (19.7)
Total other income 281.2 309.7 (28.5) (9.2) 136.7 144.5 (7.8) (5.4)
Specific other income items
Homesafe Trust - income 55.4 90.4 (35.0) (38.7) 15.8 39.6 (23.8) (60.1)
Other income 1.7 (4.2) 5.9 140.5 0.6 1.1 (0.5) (45.5)
Total other specific income 57.1 86.2 (29.1) (33.8) 16.4 40.7 (24.3) (59.7)
Total other income including specific items 338.3 395.9 (57.6) (14.5) 153.1 185.2 (32.1) (17.3)
Total income 1,643.5 1,609.5 34.0 2.1 800.6 842.9 (42.3) (5.0)
Comments on total income when compared to the previous corresponding period:
Net interest income increased by $91.6m, or 7.4%. Refer to 2.2.2 for further analysis.
Fee income decreased by $4.3m, or 2.5%, primarily due to a reduction in fees collected (ATM and transaction fees).
Trading book income decreased by $19.0m, or 96.0% given the stable interest rate environment in the first half, and the second half was impacted by the
elevated cash/bill spread.
Homesafe Trust income was $35.0, or 38.7% lower primarily due to slower growth in residential property prices in the markets of Melbourne and Sydney.
Refer to section 2.2.4 for further detail.
Other income includes factoring income and franchise fees.
Specific items - other income increased by $5.9m. Refer to 2.2.1 for further detail.
Other income ($m)
Change Change
Full year ending Six months ending
11 Appendix 4E: Full year results
Year ended 30 June 2018
172.2
72.7
18.0 19.8 27.0
90.4
(4.2)
167.9
71.7
18.8
0.8
22.0
55.4
1.7
Fee income Commissions Foreign exchange
income
Trading book
income
Other income Homesafe trust
income
Other specific
income
30 June 2017 30 June 2018
For
per
sona
l use
onl
y

2.2.4 Homesafe Trust
Full Year Full Year
Jun-18 Jun-18 Dec-17 Jun-17 Jun-17 Dec-16
Homesafe Income $m $m $m $m $m $m
Discount unwind 20.5 10.1 10.4 18.4 9.4 9.0
Profit on sale 2.3 1.3 1.0 1.7 0.3 1.4
Management fair value adjustment (3.0) (1.1) (1.9) (4.6) (2.1) (2.5)
Property revaluations 35.6 5.5 30.1 74.9 36.4 38.5
Total Income 55.4 15.8 39.6 90.4 44.0 46.4
Homesafe income - This includes the amortisation of the discount, property revaluation movements and any movement in management fair value
adjustment. Profit on sale represents the difference between cash received on completion versus the carrying value at the time of completion.
Full Year Full Year
Jun-18 Jun-18 Dec-17 Jun-17 Jun-17 Dec-16
$m $m $m $m $m $m
Homesafe realised income 23.7 10.2 13.5 24.0 10.6 13.4
Realised - funds received on completion being the difference between the cash received on completion less the initial funds advanced.
Full Year Full Year
Jun-18 Jun-18 Dec-17 Jun-17 Jun-17 Dec-16
Funding Costs $m $m $m $m $m $m
Funding costs - unrealised (17.2) (7.6) (9.6) (15.8) (8.5) (7.3)
Funding costs - realised (7.5) (3.0) (4.5) (8.2) (3.6) (4.6)
Funding costs realised - accumulated interest expense on completed contracts since initial funding.
Funding costs unrealised - interest expense on existing contracts.
As at As at As at As at
Jun-18 Dec-17 Jun-17 Dec-16
Portfolio balance $m $m $m $m
Funded balance 408.1 387.4 370.0 360.9
Property revaluation balance 327.6 322.4 296.3 263.5
Total Investment Portfolio balance 735.7 709.8 666.3 624.4
Total Realised Gains and Realised Funding Costs ($m)
Half Year Half Year
Half Year Half Year
Half Year Half Year
13.4
10.6
13.5
10.2
4.63.6
4.5
3.0
31 December 2016 30 June 2017 31 December 2017 30 June 2018
Total Realised Gains Total Realised Funding Costs
Appendix 4E: Full year results
Year ended 30 June 2018 12
For
per
sona
l use
onl
y

2.2.5 Operating expenses
Jun-18 Jun-17 Jun-18 Dec-17
$m $m $m % $m $m $m %
Staff and related costs 497.3 480.5 16.8 3.5 252.3 245.0 7.3 3.0
Occupancy costs 91.0 92.0 (1.0) (1.1) 46.1 44.9 1.2 2.7
Information technology costs 77.0 71.6 5.4 7.5 39.2 37.8 1.4 3.7
Amortisation of acquired intangibles 8.2 17.7 (9.5) (53.7) 1.9 6.3 (4.4) (69.8)
Amortisation of software intangibles 28.0 20.8 7.2 34.6 14.5 13.5 1.0 7.4
Property, plant and equipment costs 11.5 11.7 (0.2) (1.7) 5.7 5.8 (0.1) (1.7)
Fees and commissions 35.2 33.6 1.6 4.8 17.6 17.6 - -
Communications, postage and stationery 29.8 33.0 (3.2) (9.7) 14.2 15.6 (1.4) (9.0)
Advertising and promotion 28.0 28.3 (0.3) (1.1) 14.0 14.0 - -
Other product and services delivery costs 30.2 33.0 (2.8) (8.5) 14.2 16.0 (1.8) (11.3)
Other administration expenses 72.9 68.5 4.4 6.4 37.6 35.3 2.3 6.5
909.1 890.7 18.4 2.1 457.3 451.8 5.5 1.2
Specific items 29.3 18.7 10.6 56.7 23.6 5.7 17.9 314.0
Total expenses 938.4 909.4 29.0 3.2 480.9 457.5 23.4 5.1
Jun-18 Jun-17 % Jun-18 Dec-17 %
Cost to income 1
55.6% 56.1% (0.5) (0.9) 57.0% 54.2% 2.8 5.2
Expenses to average assets 1.31% 1.28% 0.03 2.30 1.34% 1.28% 0.1 4.7
Number of staff (full-time equivalent) 4,426 4,413 13 0.3 4,426 4,387 39 0.9
Staff and related costs to income 2
30.5% 30.6% (0.1) (0.3) 31.5% 29.6% 1.9 6.4
1 Expenses used in the above ratios are expenses less specific expense items and acquired intangibles amortisation. Income used in the
above ratios is income less specific net interest income items and other specific income items.
2 Excludes redundancy costs.
Comments on individual expense categories when compared to the previous corresponding period are:
Staff and related costs - increased by $16.8m or 3.5% which includes wage and salary increases and lower capitalisation rates.
Salary costs include staff bonuses. Redundancy costs incurred were $2.3m (June 17: $4.2m).
Information technology costs - increased by $5.4m or 7.5% due to an increase in software licence fees.
Amortisation of acquired intangibles decreased by $9.5m or 53.7% due to the completed amortisation period for prior business acquisitions
associated intangibles.
Software amortisation - increased by $7.2m or 34.6%, due to the completion of a number of large technology projects now being amortised.
Other administration expenses - increased by $4.4m or 6.4%, mainly due to an increase in legal costs relating to Great Southern and external
consultancy fees.
Specific items - other expenses - increased by $10.6m or 56.7%. Refer to 2.2.1 for further detail.
Operating expenses ($m)
Change Change
Total operating expenses
Full year ending Six months ending
Change Change
13Appendix 4E: Full year results
Year ended 30 June 2018
480.5
92.0 71.6
33.6 11.7
38.5
162.8
18.7
497.3
91.0 77.0
35.2 11.5
36.2
160.9
29.3
Staff and related
costs
Occupancy costs Information
technology costs
Fees and
commissions
Property, plant
and equipment
costs
Intangibles
amortisation
Other operating
expenses
Other specific
expenses
30 June 2017 30 June 2018
For
per
sona
l use
onl
y

2.2.6 Average balance sheet
For the year ended 30 June 2018
Average Interest Average Average Interest Average
Balance 12 mths Rate Balance 12 mths Rate
$m $m % $m $m %
Average balances and rates 1
Interest earning assets
Cash and investments 7,814.9 138.4 1.77 8,389.5 143.7 1.71
Loans and other receivables 2, 5 58,192.4 2,522.4 4.33 57,029.2 2,504.7 4.39
Total interest earning assets 66,007.3 2,660.8 4.03 65,418.7 2,648.4 4.05
Non interest earning assets
Credit provisions (155.0) (159.2)
Other assets 3,051.0 2,993.5
Total non interest earning assets 2,896.0 2,834.3
Total assets (average balance) 68,903.3 68,253.0
Interest bearing liabilities
Deposits
Retail 5
47,833.4 (951.7) (1.99) 47,764.1 (1,032.0) (2.16)
Wholesale - domestic 7,992.0 (191.8) (2.40) 8,252.0 (204.3) (2.48)
Wholesale - offshore 399.0 (10.5) (2.63) 375.4 (10.1) (2.69)
Repurchase agreements 520.4 (7.9) (1.52) 521.7 (7.9) (1.51)
Notes payable 4,014.4 (122.4) (3.05) 3,509.3 (109.1) (3.11)
Convertible preference shares 857.5 (34.9) (4.07) 827.3 (36.0) (4.35)
Subordinated debt 709.4 (35.2) (4.96) 651.1 (32.8) (5.04)
Total interest bearing liabilities 62,326.1 (1,354.4) (2.17) 61,900.9 (1,432.2) (2.31)
Non interest bearing liabilities and equity
Other liabilities 1,064.4 1,109.3
Equity 5,512.8 5,242.8
6,577.2 6,352.1
Total liabilities and equity (average balance) 68,903.3 68,253.0
Interest margin and interest spread
Interest earning assets 66,007.3 2,660.8 4.03 65,418.7 2,648.4 4.05
Interest bearing liabilities (62,326.1) (1,354.4) (2.17) (61,900.9) (1,432.2) (2.31)
Net interest income and interest spread 3,6
1,306.4 1.86 1,216.2 1.74
Interest free liabilities and equity 0.12 0.12
Net interest margin 4
1.98 1.86
Net interest margin 1.98 1.86
Add: impact of revenue share arrangements 0.38 0.36
Net interest margin before revenue share arrangements 2.36 2.22
1 Average balance is based on monthly closing balances.
2 Loans and receivables excludes fair value specific items (June 2018 $1.2m and June 2017 $2.6m).
3 Interest spread is the difference between the average interest rate earned on assets and the average interest rate paid on funds.
4 Interest margin is the net interest income as a percentage of average interest earning assets.
5 Offset products have been reclassified from deposits and netted against the corresponding loan balance.
6 Net interest income excludes fair value adjustments - refer to section 2.2.2 for net interest income reconciliation.
30 June 2018 30 June 2017
Impact of revenue share arrangements
14Appendix 4E: Full year results
Year ended 30 June 2018
For
per
sona
l use
onl
y
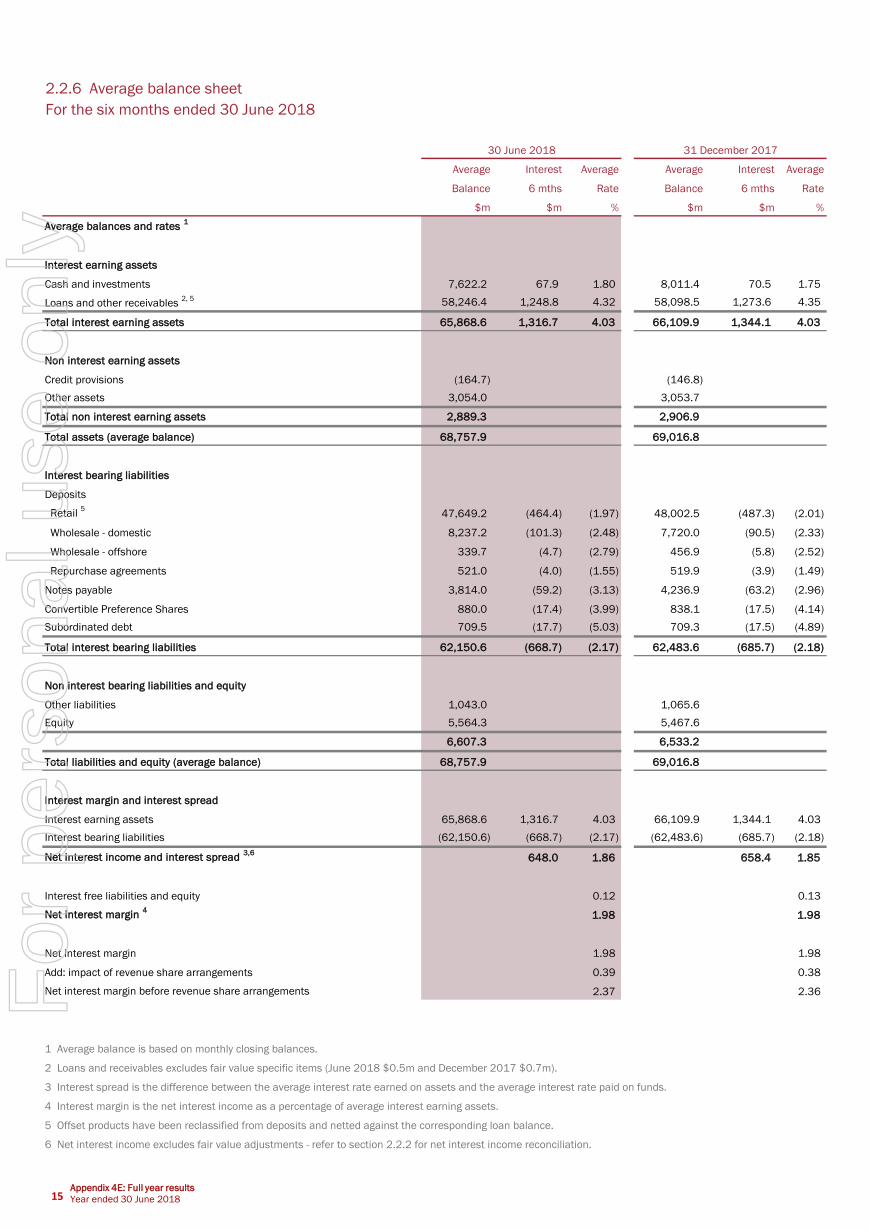
2.2.6 Average balance sheet
For the six months ended 30 June 2018
Average Interest Average Average Interest Average
Balance 6 mths Rate Balance 6 mths Rate
$m $m % $m $m %
Average balances and rates 1
Interest earning assets
Cash and investments 7,622.2 67.9 1.80 8,011.4 70.5 1.75
Loans and other receivables 2, 5 58,246.4 1,248.8 4.32 58,098.5 1,273.6 4.35
Total interest earning assets 65,868.6 1,316.7 4.03 66,109.9 1,344.1 4.03
Non interest earning assets
Credit provisions (164.7) (146.8)
Other assets 3,054.0 3,053.7
Total non interest earning assets 2,889.3 2,906.9
Total assets (average balance) 68,757.9 69,016.8
Interest bearing liabilities
Deposits
Retail 5
47,649.2 (464.4) (1.97) 48,002.5 (487.3) (2.01)
Wholesale - domestic 8,237.2 (101.3) (2.48) 7,720.0 (90.5) (2.33)
Wholesale - offshore 339.7 (4.7) (2.79) 456.9 (5.8) (2.52)
Repurchase agreements 521.0 (4.0) (1.55) 519.9 (3.9) (1.49)
Notes payable 3,814.0 (59.2) (3.13) 4,236.9 (63.2) (2.96)
Convertible Preference Shares 880.0 (17.4) (3.99) 838.1 (17.5) (4.14)
Subordinated debt 709.5 (17.7) (5.03) 709.3 (17.5) (4.89)
Total interest bearing liabilities 62,150.6 (668.7) (2.17) 62,483.6 (685.7) (2.18)
Non interest bearing liabilities and equity
Other liabilities 1,043.0 1,065.6
Equity 5,564.3 5,467.6
6,607.3 6,533.2
Total liabilities and equity (average balance) 68,757.9 69,016.8
Interest margin and interest spread
Interest earning assets 65,868.6 1,316.7 4.03 66,109.9 1,344.1 4.03
Interest bearing liabilities (62,150.6) (668.7) (2.17) (62,483.6) (685.7) (2.18)
Net interest income and interest spread 3,6
648.0 1.86 658.4 1.85
Interest free liabilities and equity 0.12 0.13
Net interest margin 4
1.98 1.98
Net interest margin 1.98 1.98
Add: impact of revenue share arrangements 0.39 0.38
Net interest margin before revenue share arrangements 2.37 2.36
1 Average balance is based on monthly closing balances.
2 Loans and receivables excludes fair value specific items (June 2018 $0.5m and December 2017 $0.7m).
3 Interest spread is the difference between the average interest rate earned on assets and the average interest rate paid on funds.
4 Interest margin is the net interest income as a percentage of average interest earning assets.
5 Offset products have been reclassified from deposits and netted against the corresponding loan balance.
6 Net interest income excludes fair value adjustments - refer to section 2.2.2 for net interest income reconciliation.
30 June 2018 31 December 2017
15Appendix 4E: Full year results
Year ended 30 June 2018
For
per
sona
l use
onl
y

2.2.6 Average balance sheet
For the six months ended 30 June 2017
Average Interest Average Average Interest Average
Balance 6 mths Rate Balance 6 mths Rate
$m $m % $m $m %
Average balances and rates 1
Interest earning assets
Cash and Investments 7,964.6 67.9 1.72 8,754.4 75.8 1.72
Loans and other receivables 2, 5 57,971.4 1,247.6 4.34 56,181.8 1,257.1 4.44
Total interest earning assets 65,936.0 1,315.5 4.02 64,936.2 1,332.9 4.07
Non interest earning assets
Credit provisions (150.1) (168.8)
Other assets 3,024.5 2,980.8
Total non interest earning assets 2,874.4 2,812.0
Total assets (average balance) 68,810.4 67,748.2
Interest bearing liabilities and equity
Deposits
Retail 5
48,274.9 (500.1) (2.09) 47,324.8 (531.9) (2.23)
Wholesale - domestic 8,074.2 (97.5) (2.43) 8,459.4 (106.8) (2.50)
Wholesale - offshore 377.7 (5.0) (2.67) 344.5 (5.1) (2.94)
Repurchase agreements 520.6 (3.8) (1.47) 522.5 (4.1) (1.56)
Notes payable 3,563.1 (55.2) (3.12) 3,430.9 (53.9) (3.12)
Convertible Preference Shares 828.7 (17.7) (4.31) 825.9 (18.3) (4.40)
Subordinated debt 709.2 (17.4) (4.95) 601.3 (15.4) (5.08)
Total interest bearing liabilities 62,348.4 (696.7) (2.25) 61,509.3 (735.5) (2.37)
Non interest bearing liabilities and equity
Other liabilities 1,129.8 1,077.1
Equity 5,332.2 5,161.8
6,462.0 6,238.9
Total liabilities and equity (average balance) 68,810.4 67,748.2
Interest margin and interest spread
Interest earning assets 65,936.0 1,315.5 4.02 64,936.2 1,332.9 4.07
Interest bearing liabilities (62,348.4) (696.7) (2.25) (61,509.3) (735.5) (2.37)
Net interest income and interest spread 3,6
618.8 1.77 597.4 1.70
Interest free liabilities and equity 0.12 0.12
Net interest margin 4
1.89 1.82
Net interest margin 1.89 1.82
Add: impact of revenue share arrangements 0.37 0.35
Net interest margin before revenue share arrangements 2.26 2.17
1 Average balance is based on monthly closing balances.
2 Loans and receivables excludes fair value specific items (June 2017 $1.1m and December 2016 $1.5m).
3 Interest spread is the difference between the average interest rate earned on assets and the average interest rate paid on funds.
4 Interest margin is the net interest income as a percentage of average interest earning assets.
5 Offset products have been reclassified from deposits and netted against the corresponding loan balance.
6 Net interest income excludes fair value adjustments - refer to section 2.2.2 for net interest income reconciliation.
30 June 2017 31 December 2016
16Appendix 4E: Full year results
Year ended 30 June 2018
Year ended 30 June 2018
For
per
sona
l use
onl
y

2.2.7 Segment results
Segment reporting
An operating segment is a component of the Group that engages in business activities from which it may earn revenues and incur expenses. These
operating results are regularly reviewed by the Managing Director, to make decisions about the resourcing for each segment, and to assess its
performance.
The operating segments are identified according to the nature of the products and services they provide. All reporting segments represent an individual
strategic business unit. Each unit offers a different method of delivery, and/or different products and services.
Segment assets and liabilities reflect the value of loans and deposits directly managed by each operating segment. All other assets and liabilities of
the Group are managed centrally.
Segment reporting is consistent with the internal reporting provided to the Managing Director, and the executive management team.
Changes to the internal organisational structure of the Group, can cause the Group’s operating segment results to change.
Where this occurs, the corresponding segment information for the previous financial year is restated.
Types of products and services
Local connection
Contains all local distribution channels, including branch and community banking, business banking, Delphi Bank and financial markets.
Partner connection
Contains all partner distribution channels, including mortgage brokers, mortgage managers, mortgage originators, Alliance Partners, Homesafe,
Leveraged, portfolio funding, financial planning, wealth management, responsible entity activities, other trustee services and custodial services.
The partner connection segment is a combination of the third party and wealth cash generating units.
Agribusiness
Includes the provision of banking services to agribusinesses in rural and regional Australia. Rural Bank and Rural Finance are included within the
agribusiness segment.
Central functions
Functions not relating directly to a reportable operating segment.
Accounting policies and inter-segment transactions
Measurement of segmental assets, liabilities, income and expenses is in accordance with the Group's accounting policies. Segment results are determined
by including all revenue and expenses associated with each business. Transactions between business segments are conducted at arm's length, and are
eliminated on consolidation.
Segment net interest income is recognised based on an internally set funds transfer pricing policy, based on pre-determined market rates of return on the
assets and liabilities of the segment.
Major customers
Revenues from no individual customer amount to greater than 10% of the Group's revenue.
Geographic Information
The allocation of revenue and assets is based on the geographic location of the customer. The Group operates in all Australian states and territories,
providing banking and other financial services.
Local
connection
Partner
connection Agri-business
Total
operating
segments
Central
functions Total
$m $m $m $m $m $m
Net interest income 823.9 317.6 163.7 1,305.2 - 1,305.2
Other income 172.4 144.8 8.8 326.0 12.3 338.3
996.3 462.4 172.5 1,631.2 12.3 1,643.5
Operating expenses (639.3) (210.5) (76.1) (925.9) (12.5) (938.4)
Credit expenses (49.9) (17.9) (2.8) (70.6) - (70.6)
307.1 234.0 93.6 634.7 (0.2) 634.5
Tax expense (96.8) (73.8) (29.5) (200.1) 0.1 (200.0)
Segment result (statutory basis) 210.3 160.2 64.1 434.6 (0.1) 434.5
Cash basis adjustments:
Specific income & expense items 1.2 (11.1) 3.5 (6.4) (0.1) (6.5)
Homesafe net realised income - 11.3 - 11.3 - 11.3
Amortisation of intangibles 2.0 2.6 1.2 5.8 - 5.8
Segment result (cash basis) 213.5 163.0 68.8 445.3 (0.2) 445.1
For the year ended 30 June 2018
Operating segments
Segment result (before tax)
Total segment income
Appendix 4E: Full year results
Year ended 30 June 201817
For
per
sona
l use
onl
y

2.2.7 Segment results (continued)
Local
connection
Partner
connection Agri-business
Total
operating
segments
Central
functions Total
$m $m $m $m $m $m
Net interest income 766.4 283.2 164.0 1,213.6 - 1,213.6
Other income 180.7 182.7 8.4 371.8 24.1 395.9
947.1 465.9 172.4 1,585.4 24.1 1,609.5
Operating expenses (628.7) (190.8) (79.1) (898.6) (10.8) (909.4)
Credit expenses (33.0) (34.6) (4.2) (71.8) - (71.8)
Segment result (before tax expense) 285.4 240.5 89.1 615.0 13.3 628.3
Tax expense (90.0) (75.8) (28.1) (193.9) (4.8) (198.7)
Segment result (statutory basis) 195.4 164.7 61.0 421.1 8.5 429.6
Cash basis adjustments:
Specific income & expense items 0.5 (45.0) 4.1 (40.4) 5.6 (34.8)
Homesafe net realised income - 11.1 - 11.1 - 11.1
Amortisation of intangibles 4.8 3.0 4.6 12.4 - 12.4
Segment result (cash basis) 200.7 133.8 69.7 404.2 14.1 418.3
Local
connection
Partner
connection Agri-business
Total
operating
segments
Central
functions Total
$m $m $m $m $m $m
For the year ended 30 June 2018
Reportable segment assets 33,960.3 21,789.2 6,542.3 62,291.8 9,148.4 71,440.2
Reportable segment liabilities 43,041.7 5,025.9 4,235.5 52,303.1 9,972.9 62,276.0
For the year ended 30 June 2017
Reportable segment assets 33,433.5 21,526.4 6,295.4 61,255.3 10,160.2 71,415.5
Reportable segment liabilities 42,821.5 5,598.3 3,906.8 52,326.6 9,704.9 62,031.5
As at As at
June 2018 June 2017
Total assets for operating segments 71,440.2 71,415.5
Total assets 71,440.2 71,415.5
Total liabilities for operating segments 62,276.0 62,031.5
Securitisation funding 3,544.8 3,958.4
Total liabilities 65,820.8 65,989.9
Operating segments
Operating segments
Reportable segment assets and liabilities
Total segment income
For the year ended 30 June 2017
Appendix 4E: Full year results
Year ended 30 June 2018 18
For
per
sona
l use
onl
y

2.3 Financial statements
2.3.1 Balance sheet metrics
Total Total
Jun-18 Dec-17 FY18 Jun-17 Dec-16 FY17
$m $m $m $m $m $m $m %
Financial position metrics
Ordinary equity 5,505.8 5,444.9 5,505.8 5,321.3 5,206.4 5,321.3 184.5 3.5
Retail deposits 50,614.5 50,308.9 50,614.5 50,743.1 50,579.9 50,743.1 (128.6) (0.3)
Funds under management 5,833.2 5,630.3 5,833.2 5,322.5 4,979.7 5,322.5 510.7 9.6
Loans under management 62,926.9 61,614.8 62,926.9 61,924.1 60,975.7 61,924.1 1,002.8 1.6
New loan approvals 8,089.3 8,110.7 16,200.0 8,330.7 11,724.9 20,055.6 (3,855.6) (19.2)
> Residential 5,437.7 5,881.2 11,318.9 5,419.3 8,710.5 14,129.8 (2,810.9) (19.9)
> Non-residential 2,651.6 2,229.5 4,881.1 2,911.4 3,014.4 5,925.8 (1,044.7) (17.6)
Total provisions and reserves for doubtful debts 307.8 306.2 307.8 282.5 303.3 282.5 25.3 9.0
Total Total
Capital management metrics Jun-18 Dec-17 FY18 Jun-17 Dec-16 FY17 bps
Common Equity Tier 1 (%) 8.62% 8.61% 8.62% 8.27% 7.97% 8.27% 35
$m %
Credit risk weighted assets ($m) 34,367.6 33,754.6 34,367.6 34,263.5 34,549.7 34,263.5 104.1 0.30
Total risk weighted assets ($m) 38,256.4 37,689.6 38,256.4 38,062.3 38,312.1 38,062.3 194.1 0.51
Liquidity risk bps
Liquidity coverage ratio 127.1% 125.3% 126.2% 116.0% 119.3% 117.6% 1,110
Net stable funding ratio 1
110.2%
Impaired assets $m %
Gross impaired assets ($m) 335.8 288.8 335.8 282.6 300.7 282.6 53.2 18.8
Net impaired assets ($m) 217.5 176.3 217.5 194.1 190.5 194.1 23.4 12.1
bps
Net impaired loans to gross loans (%) 0.35% 0.29% 0.35% 0.32% 0.32% 0.32% 3
1 Net stable funding ratio calculated from 1st January 2018.
Year on year change
Year on year changeHalf year
Half year Half year
Half year
Appendix 4E: Full year results
Year ended 30 June 201819
For
per
sona
l use
onl
y

2.3.2 Statement of comprehensive incomeFor the year ended 30 June 2018
As at As at
Jun-18 Jun-17
$m $m
Profit for the period ended 30 June 434.5 429.6
Items which may be reclassified subsequently to profit & loss:
Net gain/(loss) on available for sale - equity investments 0.2 (1.6)
Net gain on cash flow hedges taken to equity 10.9 45.6
Net unrealised (loss)/gain on available for sale - debt securities (0.1) 0.9
Transfer to gain on sale of available for sale assets - debt securities - 0.3
Tax effect on items taken directly to or transferred from equity (3.3) (13.6)
Total items that may be reclassified to profit & loss 7.7 31.6
Items which will not be reclassifed subsequently to profit & loss:
Actuarial gain on superannuation defined benefits plan 0.4 0.3
Revaluation of land and buildings - 0.3
Tax effect on items taken directly to or transferred from equity (0.1) (0.2)
Total items that will not be reclassified to profit & loss 0.3 0.4
Total comprehensive income for the period 442.5 461.6
2.3.3 Balance sheet
As at 30 June 2018As at As at
Jun-18 Jun-17
$m $m
Assets
Cash and cash equivalents ag001 1,137.4 996.6
Due from other financial institutions ag002 283.0 277.8
Financial assets held for trading ag004 4,499.5 5,657.6
Financial assets available for sale ag005 469.0 382.0
Financial assets held to maturity ag006 413.2 378.7
Derivatives ag010 29.7 37.8
Net loans and other receivables ag012 61,601.8 60,776.6
Investments in joint ventures accounted for using the equity method ag013 8.9 8.5
Property, plant and equipment ag015 69.9 77.8
Deferred tax assets ag016 117.0 110.8
Investment property ag017 735.7 666.3
Goodwill and other intangible assets ag019 1,650.0 1,663.8
Other assets ag008 424.7 381.2
Total Assets 71,439.8 71,415.5
Liabilities
Due to other financial institutions ag020 352.5 328.4
Deposits ag021 59,529.5 59,294.1
Notes payable ag022 3,544.8 3,958.4
Derivatives ag023 34.8 59.0
Income tax payable ag026 51.5 21.5
Provisions ag027 136.6 130.8
Deferred tax liabilities ag028 130.9 126.6
Other payables ag024 448.8 532.3
Convertible preference shares ag030 880.9 830.1
Subordinated debt ag031 709.2 708.7
Total Liabilities 65,819.5 65,989.9
Net Assets 5,620.3 5,425.6
Equity
Share capital ag032 4,523.3 4,448.7
Reserves ag036 121.1 112.3
Retained earnings ag037 975.9 864.6
Total Equity 5,620.3 5,425.6
20Appendix 4E: Full year results
Year ended 30 June 2018
For
per
sona
l use
onl
y

2.3.4 Statement of changes in equity
For the year ended 30 June 2018
Issued Other
ordinary issued Retained Total
capital capital earnings Reserves equity
$m $m $m $m $m
Opening balance at 1 July 2017 4,456.7 (8.0) 864.6 112.3 5,425.6
Comprehensive income:
Profit for the period - - 434.5 - 434.5
Other comprehensive income - - 0.3 7.7 8.0
Total comprehensive income for the period - - 434.8 7.7 442.5
Transactions with owners in their capacity as owners:
Shares issued 73.2 - - - 73.2
Transfer from Asset Revaluation reserve - - 0.4 (0.4) -
Reduction in employee share ownership plan (ESOP) shares - 1.4 - - 1.4
Movement in operational risk reserve - - (1.5) 1.4 (0.1)
Movement in share based payment - - 2.6 0.1 2.7
Equity dividends - - (325.0) - (325.0)
Closing balance at 30 June 2018 4,529.9 (6.6) 975.9 121.1 5,620.3
For the year ended 30 June 2017
Issued Other
ordinary issued Retained Total
capital capital earnings Reserves equity
$m $m $m $m $m
Opening balance at 1 July 2016 4,298.4 (10.2) 739.2 87.9 5,115.3
Comprehensive income:
Profit for the period - - 429.6 - 429.6
Other comprehensive income - - 0.2 31.8 32.0
Total comprehensive income for the period - - 429.8 31.8 461.6
Transactions with owners in their capacity as owners:
Shares issued 158.6 - - - 158.6
Share issue expenses (0.3) - - - (0.3)
Reduction in employee share ownership plan (ESOP) shares - 2.2 - - 2.2
Movement in general reserve for credit losses (GRCL) - - 6.6 (6.6) -
Movement in share based payment - - 0.4 (0.8) (0.4)
Equity dividends - - (311.4) - (311.4)
Closing balance at 30 June 2017 4,456.7 (8.0) 864.6 112.3 5,425.6
Attributable to owners of Bendigo and Adelaide Bank Limited
Attributable to owners of Bendigo and Adelaide Bank Limited
21Appendix 4E: Full year results
Year ended 30 June 2018
For
per
sona
l use
onl
y

2.3.5 Cash flow statement
For the year ended 30 June 2018
Jun-18 Jun-17
$m $m
Cash flows from operating activities
Interest and other items of a similar nature received 2,701.8 2,656.0
Interest and other costs of finance paid (1,379.9) (1,417.8)
Receipts from customers (excluding effective interest) 284.8 311.3
Payments to suppliers and employees (995.2) (842.0)
Dividends received 1.3 2.0
Income taxes paid (175.2) (192.7)
Cash flows from operating activities before changes in operating assets and liabilities 437.6 516.8
(Increase)/decrease in operating assets
Net increase in balance of loans and other receivables (904.1) (3,611.7)
Net decrease in balance of investment securities 944.0 775.8
Increase/(decrease) in operating liabilities
Net increase in balance of deposits 235.4 1,717.7
Net increase/(decrease) in balance of notes payable (413.6) 657.7
Cash flows from operating activities 299.3 56.3
Cash flows related to investing activities
Cash paid for purchases of property, plant and equipment (15.4) (10.4)
Cash proceeds from sale of property, plant and equipment 1.4 1.8
Cash paid for purchases of investment property (59.1) (50.2)
Cash proceeds from sale of investment property 45.0 47.7
Cash proceeds from sale of equity investments - 0.5
Cash paid for purchases of equity investments (0.1) (4.4)
Proceeds from return of capital/dividend from JV partners 2.0 -
Cash paid for purchases of intangible assets (2.9) (1.3)
Net cash flows used in investing activities (29.1) (16.3)
Cash flows from financing activities
Proceeds from issue of ordinary/convertible preference shares 52.7 64.4
Proceeds from issue of subordinated debt 0.5 125.3
Dividends paid (251.9) (217.2)
Repayment received for ESOP shares 1.4 2.2
Payment of share issue costs (6.5) (0.3)
Net cash flows from financing activities (203.8) (25.6)
Net increase in cash and cash equivalents 66.4 14.4
Cash and cash equivalents at the beginning of the period 1,001.5 987.1
Cash and cash equivalents at the end of period 1,067.9 1,001.5
22Appendix 4E: Full year results
Year ended 30 June 2018
For
per
sona
l use
onl
y

2.3.6 Lending
Jun-18 Jun-17 Jun-18 Dec-17
$m $m $m % $m $m $m %
Approvals - by security
Residential 11,318.9 14,129.8 (2,810.9) (19.9) 5,437.7 5,881.2 (443.5) (7.5)
Non-residential 4,881.1 5,925.8 (1,044.7) (17.6) 2,651.6 2,229.5 422.1 18.9
Total approvals 16,200.0 20,055.6 (3,855.6) (19.2) 8,089.3 8,110.7 (21.4) (0.3)
As at As at As at As at
Jun-18 Jun-17 Jun-18 Dec-17
$m $m $m % $m $m $m %
Gross loan balance - by security
Residential 44,139.7 43,115.5 1,024.2 2.4 44,139.7 43,262.2 877.5 2.0
Business
Accommodation and food services 350.5 381.6 (31.1) (8.1) 350.5 350.6 (0.1) -
Administrative and support services 33.5 32.6 0.9 2.8 33.5 32.9 0.6 1.8
Agriculture, forestry and fishing 6,229.3 6,019.7 209.6 3.5 6,229.3 5,795.4 433.9 7.5
Arts and recreation services 86.8 94.7 (7.9) (8.3) 86.8 93.4 (6.6) (7.1)
Construction 1,123.6 1,230.0 (106.4) (8.7) 1,123.6 1,134.2 (10.6) (0.9)
Education and training 61.4 69.3 (7.9) (11.4) 61.4 72.5 (11.1) (15.3)
Electricity, gas, water and waste services 20.6 20.9 (0.3) (1.4) 20.6 19.1 1.5 7.9
Financial and insurance services 432.6 374.1 58.5 15.6 432.6 416.4 16.2 3.9
Health care and social assistance 531.6 482.1 49.5 10.3 531.6 514.4 17.2 3.3
Information media & telecommunications 33.2 32.4 0.8 2.5 33.2 31.4 1.8 5.7
Manufacturing 273.6 288.5 (14.9) (5.2) 273.6 282.5 (8.9) (3.2)
Mining 17.4 19.3 (1.9) (9.8) 17.4 16.8 0.6 3.6
Other Services 220.4 216.5 3.9 1.8 220.4 212.8 7.6 3.6
Professional, scientific & technical services 238.4 259.4 (21.0) (8.1) 238.4 238.8 (0.4) (0.2)
Public administration and safety 53.0 73.8 (20.8) (28.2) 53.0 61.4 (8.4) (13.7)
Rental, hiring and real estate services 3,924.6 4,186.4 (261.8) (6.3) 3,924.6 4,100.0 (175.4) (4.3)
Retail trade 434.8 457.8 (23.0) (5.0) 434.8 435.6 (0.8) (0.2)
Transport, postal and warehousing 145.6 141.2 4.4 3.1 145.6 138.7 6.9 5.0
Wholesale trade 168.7 167.4 1.3 0.8 168.7 169.0 (0.3) (0.2)
Other 249.2 246.9 2.3 0.9 249.2 238.3 10.9 4.6
Total business 14,628.8 14,794.6 (165.8) (1.1) 14,628.8 14,354.2 274.6 1.9
Margin lending 1,694.7 1,726.1 (31.4) (1.8) 1,694.7 1,684.0 10.7 0.6
Unsecured 1,017.2 953.5 63.7 6.7 1,017.2 945.3 71.9 7.6
Other 313.1 338.4 (25.3) (7.5) 313.1 333.4 (20.3) (6.1)
Total gross loan balance 61,793.5 60,928.1 865.4 1.4 61,793.5 60,579.1 1,214.4 2.0
Gross loan balance - by purpose
Residential 42,365.9 41,261.8 1,104.1 2.7 42,365.9 41,421.2 944.7 2.3
Consumer 2,559.8 2,571.4 (11.6) (0.5) 2,559.8 2,451.4 108.4 4.4
Margin lending 1,694.7 1,726.1 (31.4) (1.8) 1,694.7 1,684.0 10.7 0.6
Commercial 15,173.1 15,368.8 (195.7) (1.3) 15,173.1 15,022.5 150.6 1.0
Total gross loan balance 61,793.5 60,928.1 865.4 1.4 61,793.5 60,579.1 1,214.4 2.0
On-balance sheet 61,793.5 60,928.1 865.4 1.4 61,793.5 60,579.1 1,214.4 2.0
1,133.4 996.0 137.4 13.8 1,133.4 1,035.7 97.7 9.4
62,926.9 61,924.1 1,002.8 1.6 62,926.9 61,614.8 1,312.1 2.1
Loans under management represent the gross balance of loans held and managed by the Group categorised as follows:
On-balance sheet loans are the gross balance of loans and factoring receivables held by the consolidated Group.
Off-balance sheet loans under management represent the gross balance of off-balance sheet loans managed by wholly-owned subsidiaries
of Bendigo and Adelaide Bank Limited.
Change Change
Change Change
Full year ending Six months ending
Off-balance sheet loans under management
Total Group loans under management
Loans under management (gross balance)
23Appendix 4E: Full year results
Year ended 30 June 2018
For
per
sona
l use
onl
y

2.3.7 Asset quality
As at As at As at As at
Jun-18 Jun-17 Jun-18 Dec-17
Impaired loans 1
$m $m $m % $m $m $m %
Full-performing 2
13.9 0.3 13.6 4,533.3 13.9 0.1 13.8 13,800.0
Part-performing 3
56.6 33.5 23.1 69.0 56.6 33.3 23.3 70.0
Non-performing 261.3 201.6 59.7 29.6 261.3 250.9 10.4 4.1
Restructured loans 4
4.0 47.2 (43.2) (91.5) 4.0 4.5 (0.5) (11.1)
Total impaired assets 335.8 282.6 53.2 18.8 335.8 288.8 47.0 16.3
Less: specific impairment provisions (118.3) (88.5) (29.8) 33.7 (118.3) (112.5) (5.8) 5.2
Net impaired assets 217.5 194.1 23.4 12.1 217.5 176.3 41.2 23.4
Portfolio facilities - past due 90 days, not well secured 4.8 5.8 (1.0) (17.2) 5.8 3.6 2.2 61.1
Less: specific impairment provisions (1.0) (1.0) - 0.0 (1.0) (0.7) (0.3) 42.9
Net portfolio facilities 3.8 4.8 (1.0) (20.8) 4.8 2.9 1.9 65.5
Past due 90 days
414.0 431.6 (17.6) (4.1) 414.0 414.4 (0.4) (0.1)
Great Southern portfolio 50.5 79.0 (28.5) (36.1) 50.5 62.7 (12.2) (19.5)
Ratios % % % % % %
Total impaired loans to gross loans 0.54% 0.46% 0.08% 0.54% 0.48% 0.06%
Total impaired loans to total assets 0.47% 0.40% 0.07% 0.47% 0.41% 0.06%
Net impaired loans to gross loans 0.35% 0.32% 0.03% 0.35% 0.29% 0.06%
Provision coverage 5
91.7% 100.0% (8.3%) 91.7% 106.0% (14.3%)
1 A facility is classified as impaired regardless of whether it is 90 days or more past due (arrears) when there is doubt as to whether the full
amounts due (interest and principal) will be achieved in a timely manner. This is the case even if the full extent of the loss cannot be
clearly determined.
2 Includes loans where the value of the security has reduced below the value of the outstanding loans but repayments are being
made in accordance with the loan contract.
3 Includes loans where the value of the security has reduced below the value of the outstanding loans but partial repayments are being made
in accordance with the loan contract.
4 Restructured loans are facilities in which the original contractual terms have been modified for reasons related to the financial difficulties of the
5 Provision coverage is calculated as total provisions and reserves for doubtful debts - divided by total impaired assets.
customers.
Change Change
Well secured (excluding commercial arrangement loans)
24Appendix 4E: Full year results
Year ended 30 June 2018
For
per
sona
l use
onl
y

2.3.8 Credit expenses
Jun-18 Jun-17 Jun-18 Dec-17
Credit expense $m $m $m % $m $m $m %
Bad debts written off 3.6 15.2 (11.6) (76.3) 1.8 1.8 - -
Provision doubtful debts - expense 75.3 71.4 3.9 5.5 25.3 50.0 (24.7) (49.4)
Less: Bad debts recovered (8.3) (14.8) 6.5 (43.9) (2.8) (5.5) 2.7 (49.1)
Credit expense 70.6 71.8 (1.2) (1.7) 24.3 46.3 (22.0) (47.5)
As at As at As at As at
Jun-18 Jun-17 Jun-18 Dec-17
Provisions and reserves $m $m $m % $m $m $m %
Provision for doubtful debts - specific 119.3 89.5 29.8 33.3 119.3 113.2 6.1 5.4
Provision for doubtful debts - collective 48.2 52.7 (4.5) (8.5) 48.2 52.7 (4.5) (8.5)
General reserve for credit losses 140.3 140.3 - - 140.3 140.3 - -
Total provisions and reserve for doubtful debts 307.8 282.5 25.3 9.0 307.8 306.2 1.6 0.5
As at As at As at As at
Jun-18 Jun-17 Change Jun-18 Dec-17
Ratios % % bps % % bps
Credit expenses to gross loans 0.11% 0.12% (1) 0.08% 0.15% (7)
0.10% 0.08% 2 0.07% 0.13% (6)
Total provision/reserve for doubtful debts to gross loans 0.50% 0.46% 4 0.50% 0.51% (1)
Collective provision and GRCL to risk-weighted assets 0.49% 0.51% (2) 0.49% 0.51% (2)
Specific Collective GRCL Total
Movements in provisions and reserves $m $m $m $m
Balance at July 2017 89.5 52.7 140.3 282.5
Provision for doubtful debts expense to profit and loss 79.8 (4.5) - 75.3
Bad debts written off - previously provided for (50.0) - - (50.0)
Balance at 30 June 2018 119.3 48.2 140.3 307.8
Balance at July 2016 125.3 53.4 146.9 325.6
Provision for doubtful debts expense to profit and loss 72.1 (0.7) - 71.4
Appropriation of movement in general reserve for credit losses - - (6.6) (6.6)
Bad debts written off - previously provided for (107.9) - - (107.9)
Balance at 30 June 2017 89.5 52.7 140.3 282.5
Movements in specific and collective provisions are reflected as an expense in the income statement.
Total provisions and reserves for doubtful debts ($m)
Movements in the general reserve for credit losses are reflected as an appropriation in retained earnings.
Change
Full year ending Six months ending
Change Change
Change
Credit expenses (excluding Great Southern) to gross loans
Change
25Appendix 4E: Full year results
Year ended 30 June 2018
140.3 140.3 140.3
52.7 52.7 48.2
89.5 113.2 119.3
30 June 2017 31 December 2017 30 June 2018
General provisions Collective provisions Specific provisions
282.5 306.2 307.8
For
per
sona
l use
onl
y

2.3.9 Deposits and funds under management
As at As at As at As at
Jun-18 Jun-17 Jun-18 Dec-17
$m $m $m % $m $m $m %
Deposits and funds under management
Deposits 59,529.5 59,294.1 235.4 0.4 59,529.5 59,022.7 506.8 0.9
Securitisation 3,544.8 3,958.4 (413.6) (10.4) 3,544.8 4,169.6 (624.8) (15.0)
Managed funds 5,833.2 5,322.5 510.7 9.6 5,833.2 5,630.3 202.9 3.6
68,907.5 68,575.0 332.5 0.5 68,907.5 68,822.6 84.9 0.1
Deposits dissection - $m
Retail 50,614.5 50,743.1 (128.6) (0.3) 50,614.5 50,308.9 305.6 0.6
Wholesale 8,915.0 8,551.0 364.0 4.3 8,915.0 8,713.8 201.2 2.3
Securitisation 3,544.8 3,958.4 (413.6) (10.4) 3,544.8 4,169.6 (624.8) (15.0)
Total deposits 63,074.3 63,252.5 (178.2) (0.3) 63,074.3 63,192.3 (118.0) (0.2)
Deposits dissection - %
Retail 80.2% 80.2% 80.2% 79.6%
Wholesale 14.1% 13.5% 14.1% 13.8%
Securitisation 5.7% 6.3% 5.7% 6.6%
100.0% 100.0% 100.0% 100.0%
Managed funds dissection
Assets under management 2,200.0 2,152.1 47.9 2.2 2,200.0 2,153.4 46.6 2.2
Other managed funds 3,633.2 3,170.4 462.8 14.6 3,633.2 3,476.9 156.3 4.5
Total managed funds 5,833.2 5,322.5 510.7 9.6 5,833.2 5,630.3 202.9 3.6
Assets under management include those funds deposited in the Sandhurst Trustees Limited Common Funds, which are invested in cash,
cash enhanced and mortgage investments on behalf of investors. These funds are off-balance sheet.
Other managed funds include funds deposited for investment in managed investment products and superannuation funds managed
off-balance sheet by Sandhurst Trustees Limited and Adelaide Managed Funds Limited. Also included are portfolios of loans managed by the
Bank and third parties who contribute to first loss coverage.
Funding mix ($m) Retail deposits and funds under management ($m)
Change Change
Total deposits
Total deposits and funds under management
26Appendix 4E: Full year results
Year ended 30 June 2018
50,743 50,309 50,615
5,323 5,630 5,833
30 June 2017 31 December 2017 30 June 2018
On balance sheet Funds under management
50,743 50,309 50,615
8,551 8,714 8,915
3,958 4,170 3,545
30 June 2017 31 December 2017 30 June 2018
Retail Wholesale SecuritisationFor
per
sona
l use
onl
y

2.3.10 Capital and shareholder returns
2.3.10.1 Assets and capital
As at As at As at As at
Jun-18 Jun-17 Jun-18 Dec-17
$m $m $m % $m $m $m %
Group assets 71,439.8 71,415.5 24.3 - 71,439.8 71,261.9 177.9 0.2
Capital adequacy
Total regulatory capital 4,916.0 4,743.4 172.6 3.6 4,916.0 4,891.7 24.3 0.5
Risk-weighted assets 38,256.4 38,062.3 194.1 0.5 38,256.4 37,689.6 566.8 1.5
% % % % % %
Risk-weighted capital adequacy 12.85% 12.46% 0.39% 3.1 12.85% 12.98% (0.13%) (1.0)
- Tier 1 10.96% 10.49% 0.47% 4.5 10.96% 10.98% (0.02%) (0.2)
- Tier 2 1.89% 1.97% (0.08%) (4.1) 1.89% 2.00% (0.11%) (5.5)
- Common Equity Tier 1 8.62% 8.27% 0.35% 4.2 8.62% 8.61% 0.01% 0.1
2.3.10.2 Capital adequacy
The Australian Prudential Regulation Authority (APRA) guidelines require capital to be allocated against credit, operational and market risk.
Banks must maintain a ratio of qualifying capital (comprising Common Equity Tier 1, Additional Tier 1 and Tier 2 capital), to risk weighted assets.
The Bank adopted the "standard model" approach prescribed by APRA to calculate the Bank's capital position.
Risk weighted capital ratios Jun-18 Dec-17 Jun-17
Tier 1 10.96% 10.98% 10.49%
Tier 2 1.89% 2.00% 1.97%
Total capital ratio 12.85% 12.98% 12.46%
Common Equity Tier 1 8.62% 8.61% 8.27%
Regulatory capital $m $m $m
Common Equity Tier 1
Contributed capital 4,529.9 4,506.8 4,456.8
Retained profits & reserves 707.9 670.7 621.7
Accumulated other comprehensive income (and other reserves) (23.9) (26.0) (31.2)
Less:
Intangible assets, cash flow hedges and capitalised expenses 1,813.2 1,807.9 1,797.4
Net deferred tax assets 64.7 57.5 59.5
Equity exposures 36.8 40.6 40.8
Other adjustments as per APRA advice 1.5 1.6 1.3
Total common equity tier 1 capital 3,297.7 3,243.9 3,148.3
Additional Tier 1 capital instruments 895.9 895.9 843.2
895.9 895.9 843.2
Total Tier 1 Capital 4,193.6 4,139.8 3,991.5
Tier 2
Tier 2 capital instruments 547.4 575.5 575.5
General reserve for credit losses/collective provision (net of tax effect) 175.0 176.4 176.4
Total Tier 2 Capital 722.4 751.9 751.9
Total regulatory capital 4,916.0 4,891.7 4,743.4
Total risk weighted assets 38,256.4 37,689.6 38,062.3
Total Additional Tier 1 Capital
Change Change
27Appendix 4E: Full year results
Year ended 30 June 2018
For
per
sona
l use
onl
y

2.3.10.2 Capital adequacy (continued)
As at As at As at As at
Jun-18 Jun-17 Jun-18 Dec-17
Risk- weighted assets $m $m $m % $m $m $m %
Credit risk 34,367.6 34,263.5 104.1 0.3 34,367.6 33,754.6 613.0 1.8
Market risk 212.4 231.8 (19.4) (8.4) 212.4 293.6 (81.2) (27.7)
Operational risk 3,676.4 3,567.0 109.4 3.1 3,676.4 3,641.4 35.0 1.0
Total risk-weighted assets 38,256.4 38,062.3 194.1 0.5 38,256.4 37,689.6 566.8 1.5
Key movements in the June 2018 year include:
> Common Tier 1
Dividend reinvestment plan increased capital by $73.2m.
Retained earnings net increase of $86.2m net of Homesafe unrealised gains.
> Additional Tier 1
In December 2017 convertible preference share securities BENPD were redeemed and BENPG were issued with an increase to capital of $52.7m.
> Risk weighted assets
Risk weighted assets increased during the year due to loan growth offset by securitisation of residential mortgages of $750.0m.
Capital adequacy (%)
Capital adequacy is calculated in accordance with regulations set down by APRA.
Pillar 3 Disclosures
Details on the market disclosures required under Pillar 3, per prudential standard APS 330 “Public Disclosure”, are provided on the Group’s website at:
http://www.bendigoadelaide.com.au/public/shareholders/announcements/aps_330.asp
Change Change
28Appendix 4E: Full year results
Year ended 30 June 2018
8.27% 8.61% 8.62%
2.22%2.37% 2.34%
1.97%2.00% 1.89%
30 June 2017 31 December 2017 30 June 2018
Common Equity Tier 1 Additional Tier 1 Tier 2
12.85%12.98%12.46%
For
per
sona
l use
onl
y

2.3.10.3 Shareholder returns
Jun-18 Jun-17 Jun-18 Dec-17
Earnings per ordinary share cents cents cents % cents cents cents %
89.9 90.9 (1.0) (1.1) 41.8 48.1 (6.3) (13.1)
92.1 88.5 3.6 4.1 45.3 46.8 (1.5) (3.2)
81.2 82.9 (1.7) (2.1) 37.6 43.7 (6.1) (14.0)
Weighted average number of ordinary shares 000's 000's 000's % 000's 000's 000's %
Weighted average number of ordinary shares -
used in basic and cash basis EPS calculations 483,353 472,416 10,937 2.3 485,176 481,535 3,641 0.8
Weighted average number of ordinary shares -
used in diluted EPS calculations 564,956 548,896 16,059 2.9 572,105 558,104 14,001 2.5
Ratios % % % % % %
Return on average ordinary equity (after tax) 8.03% 8.32% (0.29%) 7.50% 8.57% (1.07%)
Return on average ordinary equity (cash basis) 8.23% 8.10% 0.13% 8.13% 8.33% (0.20%)
Return on average tangible equity (cash basis) 11.52% 11.61% (0.09%) 11.33% 11.71% (0.38%)
Return on average assets (after tax) 0.63% 0.63% 0.00% 0.59% 0.67% (0.08%)
Return on average assets (cash basis) 0.65% 0.61% 0.04% 0.64% 0.65% (0.01%)
Cash earnings used in cash basis earnings per ordinary share is profit after tax adjusted for specific items after tax and amortisation on acquired
intangibles.
Earnings used in the statutory earnings per ordinary share is, profit after tax including specific items.
Dilutive preference shares include convertible preference shares.
Ordinary equity for use in these ratios is represented by total ordinary shares and retained earnings.
Tangible equity for use in these ratios is represented by net assets less intangible assets.
As at As at As at As at
Jun-18 Jun-17 Jun-18 Dec-17
$m $m $m % $m $m $m %
Ordinary issued capital 4,529.9 4,456.7 73.2 1.6 4,529.9 4,506.7 23.2 0.5
Retained earnings 975.9 864.6 111.3 12.9 975.9 938.2 37.7 4.0
Total ordinary equity 5,505.8 5,321.3 184.5 3.5 5,505.8 5,444.9 60.9 1.1
Average ordinary equity 5,408.4 5,162.9 5,451.8 5,365.1
Average tangible ordinary equity 3,864.9 3,601.9 3,914.3 3,815.6
Full year ending Six months ending
Cash earnings per ordinary share (weighted average)
Statutory earnings per ordinary share (weighted average)
Diluted earnings per ordinary share (weighted average)
Change
Change Change
Change
Change Change
Change Change
29Appendix 4E: Full year results
Year ended 30 June 2018
For
per
sona
l use
onl
y

2.3.10.3 Shareholder returns (continued)
Reconciliation of earnings used in the calculation of Jun-18 Jun-17 Jun-18 Dec-17
earnings per ordinary share $m $m $m $m
Net Profit after tax 434.5 429.6 202.8 231.7
Total basic earnings 434.5 429.6 202.8 231.7
Earnings used in calculating basic earnings per ordinary share 434.5 429.6 202.8 231.7
Add back : Dividends accrued and/or paid on dilutive convertible preference shares 24.4 25.2 12.1 12.3
Total diluted earnings 458.9 454.8 214.9 244.0
Earnings used in calculating basic earnings per ordinary share 434.5 429.6 202.8 231.7
Add back: Amortisation of acquired intangibles (after tax) 5.8 12.4 1.3 4.5
Add back: Specific income and expense items (after tax) 4.8 (23.7) 15.7 (10.9)
Total cash earnings 445.1 418.3 219.8 225.3
Statutory and cash return on equity (%) Earnings per share and dividend per share (cents)
2.3.10.4 Dividends
Jun-18 Jun-17 Jun-18 Dec-17
% %
Dividend per share - cents 70.0 68.0 2.0 2.9 35.0 35.0 - -
Dividend amount payable/paid - $m 331.1 316.1 15.0 4.7 166.0 165.1 0.9 0.5
Payout ratio - earnings per ordinary share 1
77.9% 74.8% 3.1% 4.1 83.7% 72.8% 10.9% 15.0
Payout ratio - cash basis per ordinary share 1
76.0% 76.8% (0.8%) (1.0) 77.3% 74.8% 2.5% 3.3
1 Payout ratio is calculated as dividend per share divided by the applicable earnings per ordinary share.
Dividend Reinvestment Plan
The Dividend Reinvestment Plan provides shareholders with the opportunity of converting their entitlement to a dividend into new shares. The issue price of
the shares is equal to the volume weighted average share price of Bendigo and Adelaide Bank shares traded on the Australian Securities Exchange
over the seven trading days commencing 6 September 2018. Shares issued under this Plan rank equally with all other ordinary shares.
Bonus Share Scheme
The Bonus Share Scheme provides shareholders with the opportunity to elect to receive a number of bonus shares issued for no consideration instead of
receiving a dividend. The issue price of the shares is equal to the volume weighted average share price of Bendigo and Adelaide Bank shares traded on the
Australian Securities Exchange over the seven trading days commencing 6 September 2018. Shares issued under this scheme rank equally with all other
ordinary shares.
The last date for the receipt of an election notice for participation in either the Dividend Reinvestment Plan or Bonus Share Scheme
for the 2018 final dividend is 5 September 2018.
Full year ending Half year ending
Change Change
Full year ending Six months ending
30Appendix 4E: Full year results
Year ended 30 June 2018
8.27% 8.33% 8.13%
11.80% 11.71% 11.33%
30 June 2017 31 December
2017
30 June 2018
Cash ROE Cash ROTE
44.646.3
48.1
41.843.5
45.046.8
45.3
34.0 34.0 35.0 35.0
31 December 2016 30 June 2017 31 December 2017 30 June 2018
Statutory EPS Cash EPS Dividend per share
For
per
sona
l use
onl
y

2.4 Additional notes
2.4.1 Analysis of intangible assets
Jun-18 Jun-17 Jun-18 Jun-17
$m $m $m $m
Goodwill 1,442.3 1,442.3 - -
Trustee licence 8.4 8.4 - -
Software 190.4 196.0 28.0 20.8
Customer lists 0.7 2.0 1.4 2.1
Core deposits - 3.2 3.2 8.4
Trade name 1.5 2.0 0.4 0.7
Customer relationship 2.2 4.4 2.2 5.5
Management rights - Adelaide Bank 4.5 5.5 1.0 1.0
Total intangible assets and goodwill ag019 1,650.0 1,663.8 36.2 38.5
2.4.2 Net tangible assets per share
Jun-18 Jun-17
Net tangible assets per ordinary share $8.16 $7.85
$m $m
Net tangible assets
Net assets 5,620.3 5,425.6
Intangibles (1,650.0) (1,663.8)
Net tangible assets attributable to ordinary shareholders 3,970.3 3,761.8
Number of fully paid ordinary shares on issue - 000's 486,418 479,206
2.4.3 Investments accounted for using the equity method
Balance date
June 2018 June 2017
% %
Joint Arrangements
Community Sector Enterprises Pty Ltd 50.0 50.0 30 June
Homesafe Solutions Pty Ltd 50.0 50.0 30 June
50.0 50.0 30 June
Associates
Aegis Group 1
49.5 49.5 30 June
Bendigo Telco Ltd 30.5 30.5 30 June
Dancoor Community Finances Ltd 49.0 49.0 30 June
Homebush Financial Services Ltd 49.0 49.0 30 June
TicToc Online Pty Ltd 32.7 30.7 30 June
1 Aegis Group - economic interest is 23.5%.
All joint arrangements and associates are incorporated in Australia.
Amortisation/
impairment expense
Silver Body Corporate Financial Services Pty Ltd
consolidated entity
Ownership interest held by
Balance sheet
Carrying value
31Appendix 4E: Full year results
Year ended 30 June 2018
For
per
sona
l use
onl
y

2.4.4 Credit ratings
Short term Long term Outlook
Standard & Poor's A-2 BBB+ Stable
Fitch Ratings F2 A- Stable
Moody's P-2 A3 Stable
On 21 December 2017, Standard & Poor's Global Ratings affirmed its long-term counterparty credit rating on Bendigo and Adelaide Bank Limited
at 'BBB+', and affirmed the short-term rating at 'A-2'. The outlook remains stable. Standard and Poor's commented that the issuer credit ratings on
Bendigo and Adelaide Bank Limited reflect the Bank's high degree of business stability, which its upward-trending business growth--both lending and
deposits --shows. The ratings also reflect the Bank's strong capitalisation and very low credit losses, both of which benefit from the Bank's focus on
relatively lower risk residential mortgage lending and a good geographic spread of loans throughout Australia.
On 1 November 2017, Fitch Ratings, the international ratings agency affirmed Bendigo and Adelaide Bank Ltd's long term rating at 'A-',
and affirmed the short term rating of 'F2' and its support rating of '3', and the Bank's viability rating of 'A-'. The outlook remains stable. Fitch commented
that the ratings reflect the Bank's conservative risk appetite, which supports its consistently strong asset quality, while maintaining solid profitability.
On 4 December 2017, Moody’s affirmed its long-term issuer rating at ‘A3’ and short term rating at ‘P-2’, with a stable outlook. Moody’s commented
that the ratings reflect its well-developed franchise centred around community banking that supports its deposit gathering abilities. BEN has
conservative management that has historically focused on low-risk lending, which has contributed to greater asset quality stability over time.
2.4.5 Issued capital
Changes to issued and quoted securities during the period:
Ordinary Shares 1
Number of Shares $m
Fully paid ordinary shares at 30 June 2017 479,206,464 4,456.7
Shares issued:
September 2017 - Dividend reinvestment plan at $11.39 4,390,045 50.0
September 2017 - Bonus share scheme (in lieu of dividend payment) at $11.39 266,098 -
March 2018 - Dividend reinvestment plan at $10.70 2,159,544 23.2
March 2018 - Bonus share scheme (in lieu of dividend payment) at $10.70 396,330 -
Total ordinary shares at 30 June 2018 ag032 486,418,481 4,529.9
2.4.6 AASB 9 Financial instruments
AASB9 Financial Instruments is effective for the Group 1 July 2018, which addresses Classification and Measurement, Impairment and Hedge accounting.
Classification and Measurement
AASB 9 introduces a principles-based approach to the classification of financial assets which is based on our business model for managing the assets
and the contractual cash flow characteristics of the asset.
As a result of the application of the new standard there will be some reclassifications in categories within the balance sheet. A minor adjustment to
retained earnings will be recorded to reflect the changes to remeasurement of some assets.
There are no changes to the classification of financial liabilities.
Hedge Accounting
AASB 9 introduces a new hedge accounting model that expands the scope of hedged items and risks eligible for hedge accounting and aligns hedge
accounting more closely with risk management. The new model no longer specifies quantitative measures for effectiveness testing.
The Group determined that all existing hedge relationships that are currently designated in effective hedging relationships will continue to qualify for
hedge accounting under AASB 9 and as such there will be no change to the existing approach.
1 BEN - ASX code Ordinary Fully Paid Shares
32Appendix 4E: Full year results
Year ended 30 June 2018
For
per
sona
l use
onl
y
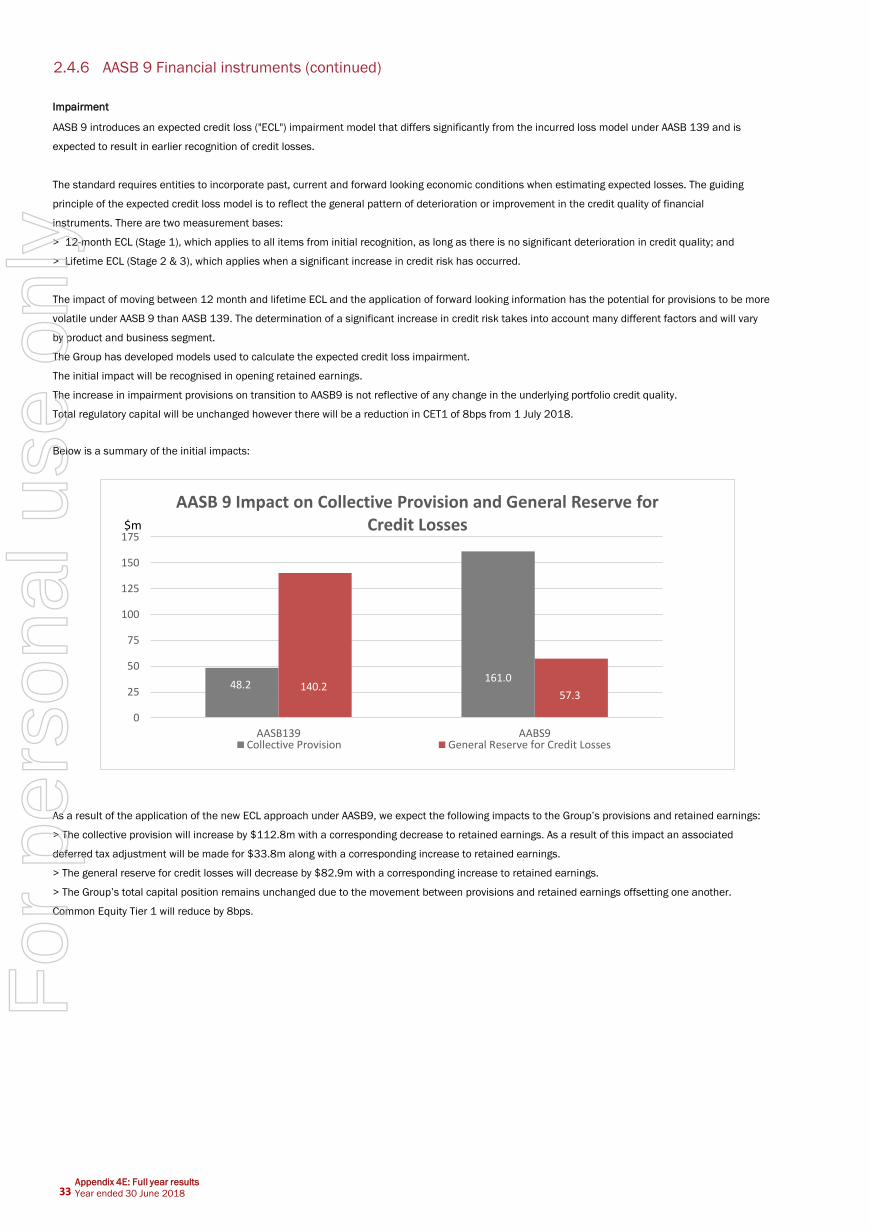
2.4.6 AASB 9 Financial instruments (continued)
Impairment
AASB 9 introduces an expected credit loss ("ECL") impairment model that differs significantly from the incurred loss model under AASB 139 and is
expected to result in earlier recognition of credit losses.
The standard requires entities to incorporate past, current and forward looking economic conditions when estimating expected losses. The guiding
principle of the expected credit loss model is to reflect the general pattern of deterioration or improvement in the credit quality of financial
instruments. There are two measurement bases:
> 12-month ECL (Stage 1), which applies to all items from initial recognition, as long as there is no significant deterioration in credit quality; and
> Lifetime ECL (Stage 2 & 3), which applies when a significant increase in credit risk has occurred.
The impact of moving between 12 month and lifetime ECL and the application of forward looking information has the potential for provisions to be more
volatile under AASB 9 than AASB 139. The determination of a significant increase in credit risk takes into account many different factors and will vary
by product and business segment.
The Group has developed models used to calculate the expected credit loss impairment.
The initial impact will be recognised in opening retained earnings.
The increase in impairment provisions on transition to AASB9 is not reflective of any change in the underlying portfolio credit quality.
Total regulatory capital will be unchanged however there will be a reduction in CET1 of 8bps from 1 July 2018.
Below is a summary of the initial impacts:
As a result of the application of the new ECL approach under AASB9, we expect the following impacts to the Group’s provisions and retained earnings:
> The collective provision will increase by $112.8m with a corresponding decrease to retained earnings. As a result of this impact an associated
deferred tax adjustment will be made for $33.8m along with a corresponding increase to retained earnings.
> The general reserve for credit losses will decrease by $82.9m with a corresponding increase to retained earnings.
> The Group’s total capital position remains unchanged due to the movement between provisions and retained earnings offsetting one another.
Common Equity Tier 1 will reduce by 8bps.
Appendix 4E: Full year results
Year ended 30 June 201833
48.2161.0
140.257.3
0
25
50
75
100
125
150
175
AASB139 AABS9
AASB 9 Impact on Collective Provision and General Reserve for Credit Losses
Collective Provision General Reserve for Credit Losses
$m
For
per
sona
l use
onl
y

THIS PAGE HAS BEEN LEFT BLANK INTENTIONALLY
For
per
sona
l use
onl
y

Bendigo and Adelaide Bank LtdABN 11 068 049 178
For
per
sona
l use
onl
y