appendix-1open_jicareport.jica.go.jp/pdf/12043584_07.pdf · (14) allowable stress abnt nbr 8883 1.2...
TRANSCRIPT

APPENDIX-1 :
Result of measure thickness

Dam Date
Unit:mm
No.1 No.2 No.3 No.4 No.5 AverageA Top 5.4 5.4 6.2 6.3 5.7 5.80
1100 Left 5.4 5.4 5.4 5.8 6.0 5.60Bottom 5.9 6.5 6.5 6.8 6.2 6.38Right - - - - - -
B Top 6.4 6.4 7.3 6.2 6.7 6.60450 Left 6.1 6.2 6.8 6.7 6.2 6.40
Bottom 7.1 6.1 6.8 6.8 5.8 6.52Right - - - - - -
5.93
6.51
12 May, 2011
Result of Measurement Evaluatedthickness
Oeste Dam
PositionMeasurementLocation
No.1 unitupstream
side
No.1 unitDownstream
side
Top
Bottom
Left Right
View fromUpstream
GateA B
Upstream side Downstream side
1230 730 540
φ1500

Dam DateUnit No.
Unit:mm
No.1 No.2 No.3 No.4 No.5 Average Design② - - - - - - 100③ 20.0 - - - - 20.0 20⑤ 65.0 - - - - 65.0 60② 105.0 - - - - 105.0 100③ 20.0 - - - - 20.0 20⑤ 65.0 - - - - 65.0 60① 12.3 12.5 12.2 13.1 12.6 12.5 15② 100.0 - - - - 100.0 100③ 20.0 - - - - 20.0 20④ 12.7 12.6 13.2 12.7 12.8 12.8 15⑤ 65.0 - - - - 65.0 60① 13.1 11.8 11.9 13.1 12.9 12.6 15② 100.0 - - - - 100.0 100③ 20.0 - - - - 20.0 20④ 12.3 12.8 12.3 13.2 12.8 12.7 15⑤ 65.0 - - - - 65.0 60② 100.0 - - - - 100.0 100③ 20.0 - - - - 20.0 20⑤ 65.0 - - - - 65.0 60
G1
G2
Right
Right
Oeste Dam 12 May, 2011
Result of MeasurementMeasurement Location
No.1 Unit
Right
G5 Right
G3 Right
G4
L
Upstream
Downstream
R
D
U
Detail A
Detail A
Front View
G1
G2
G3
G4
G5
G6
G7G8G9G10
①
④
③②
⑤

Unit:mm
No.1 No.2 No.3 No.4 No.5 Average Design② 100.0 - - - - 100.0 100③ 20.0 - - - - 20.0 20⑤ 65.0 - - - - 65.0 60① 10.5 10.6 10.2 10.1 10.6 10.4 15② 95.0 - - - - 95.0 100③ 20.0 - - - - 20.0 20④ 13.8 13.5 13.5 13.6 13.5 13.6 15⑤ 65.0 - - - - 65.0 60② 100.0 - - - - 100.0 100③ 20.0 - - - - 20.0 20⑤ 65.0 - - - - 65.0 60② 100.0 - - - - 100.0 100③ 20.0 - - - - 20.0 20⑤ 65.0 - - - - 65.0 60② 100.0 - - - - 100.0 100③ 20.0 - - - - 20.0 20⑤ 65.0 - - - - 65.0 60
G9 Right
G10 Right
Result of Measurement
G7 Right
Measurement Location
G6 Right
G8 Right

Dam Date
Unit:mm
No.1 No.2 No.3 No.4 No.5 AverageA Top 9.4 9.3 9.3 9.2 9.1 9.26
250 Left 9.2 9.2 9.5 9.2 9.2 9.26Bottom 9.2 9.2 8.7 9.2 8.7 9.00Right - - - - - -
B Top 8.6 8.6 8.5 8.8 8.8 8.66100 Left - - - - - -
Bottom - - - - - -
Right - - - - - -
PositionMeasurementLocation
No. 2 Unitupstream
side
No. 2 UnitDownstream
side
9.17
8.66
12 May, 2011
Result of Measurement Evaluatedthickness
Sul Dam
Top
Bottom
Left Right
View fromUpstream
GateA B
Upstream side Downstream side
580 740 950
φ1500

Dam DateUnit No.
Unit:mm
No.1 No.2 No.3 No.4 No.5 Average Design① 12.5 12.5 12.6 12.6 12.7 12.58 12.7
② 122.0 - - - - 122.00 123
③ 26.0 - - - - 26.00 25.4
④ 16.0 16.0 16.5 16.5 16.0 16.20 16
⑤ 100.0 - - - - 100.00 100
12 May, 2011
Result of MeasurementMeasurement Location
No.2 UnitSul Dam
G1 Upstream
L
Upstream
Downstream
R
D
U
Detail A
Detail A
Front View
G1
G2
G3
G4
G5
G6
G8G9G10G11
①
④
③②
⑤
G7
190
195
200
195
190
200
250
1680

APPENDIX-2 :
Structural calculation for control gates
(After heightning)

1. Strength Calculation for Control Gate in Oeste Dam (After heightning)1.1 Design conditions
(1) Type Slide gate(2) Quantity 7 sets(3) Gate center elevation EL. m(4) Max. water level EL. m (heightning m )(5) Flood water level EL. m(6) Normal water level EL. m(7) Diameter φ m(8) Seismic intensity(9) Sealing system Metal seal at both side of gate leaf(10) Foundation rock elevation EL. m(11) Operation device Hydraulic cylinder(12) Lifting height m(13) Operating system Local(14) Allowable stress ABNT NBR 8883
1.2 Design load(1) CCN (Normal water level Only)
EL m
H= m
EL m
D:Diameter = mLoad of normal water level onlyPs= γo×H×A
= × ×= kN
Where, Ps :Hydrostatic loadγo :Specific gravity of water = kN/m3
H :Design head = m
A :Receiving pressure area = π・Ds2/4 = π × 1.50 2 /4= m2
1.57
339.25364.65362.30340.79
9.811.54
1.77
2.0
337.60
1.500.05
φ1.50
1.77
340.790
1.54
1.540
339.250
9.8126.69
D

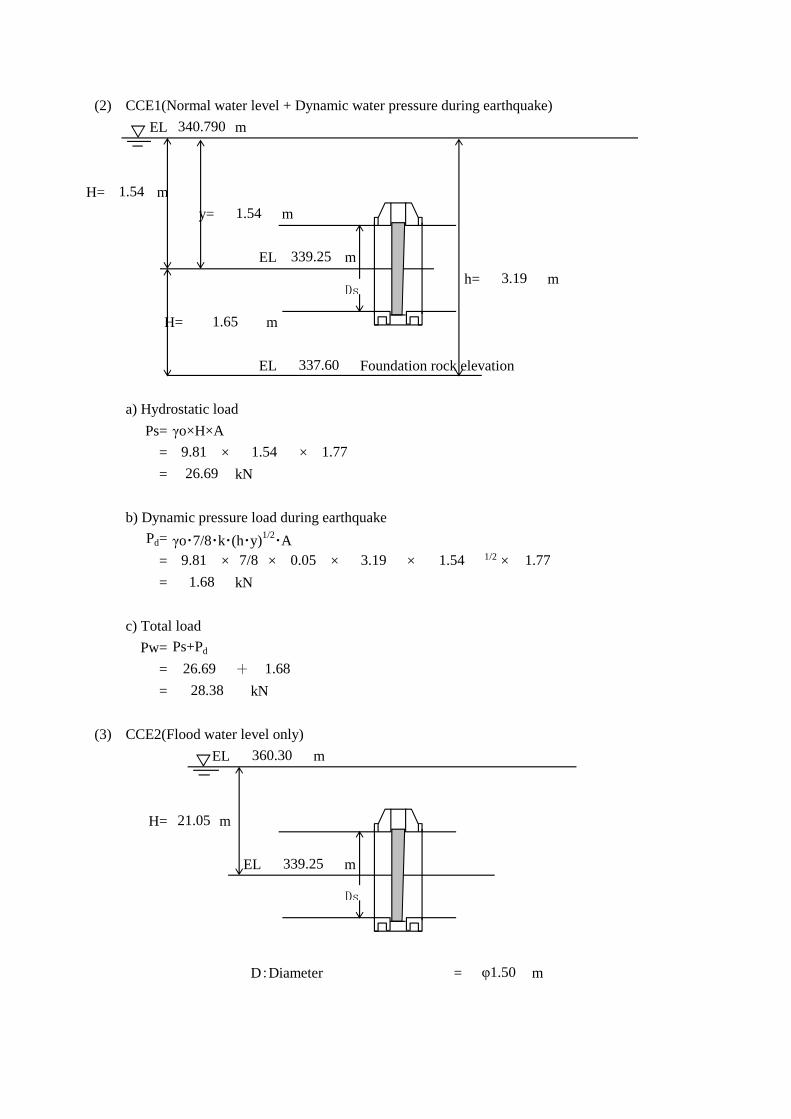
(2) CCE1(Normal water level + Dynamic water pressure during earthquake)EL m
H= my= m
EL mh= m
H= m
EL Foundation rock elevation
a) Hydrostatic loadPs= γo×H×A
= × ×= kN
b) Dynamic pressure load during earthquakePd= γo・7/8・k・(h・y)1/2
・A= × × × × 1/2 ×= kN
c) Total loadPw= Ps+Pd
= +
= kN
(3) CCE2(Flood water level only)EL m
H= m
EL m
D:Diameter = m
26.69
1.54
3.19
337.60
1.65
9.81
1.541.54
340.790
1.54 1.77
1.771.68
9.81 7/8 0.05 3.19
26.69 1.6828.38
362.30
23.05
339.25
339.25
φ1.50
Ds
Ds

Ps= γo×H×A= × ×= kN
Where, Ps :Hydrostatic loadγo :Specific gravity of water = kN/m3
H :Design head = m
A :Receiving pressure area = π・Ds2/4 = π × 2 /4= m2
(4) CCL(Flood water level+ Dynamic water pressure during earthquake)EL
m
ELH= m
H= m
EL Foundation rock elevationa) Hydrostatic load
Ps= γo・H・A= × ×= KN
b) Dynamic pressure load during earthquakePd= γo・7/8・k・(h・y)1/2
・A= × × × × 1/2 ×= kN
c) Total loadPw= Ps+Pd
= +
= kN
362.30
9.81 23.05 1.77399.55
9.8123.05
1.50
1.65
337.60
24.70
1.77
23.05
339.25
9.81 23.05 1.77
417.65
23.05 1.7718.10
399.55 18.10
9.81 7/8 24.700.05
399.55
Ds

(5) Max. water levelEL
H= m
EL
D:Diameter = mPs= γo×H×A
= × ×= kN
Where, Ps :Hydrostatic loadγo :Specific gravity of water = kN/m3
H :Design head = m
A :Receiving pressure area = π・Ds2/4 = π × 2 /4= m2
(5) Comparison of loadsunit:kN
Case
Water level
0.50 0.90 26.69 53.39 28.38 31.53
0.63 0.90 399.55 634.21 417.65 464.06
Max. water level 0.80 440.29 550.36 - -
The strength calculation is made for CCE2 since the maximum converted load acts on the bonnet at CCE2.
Flood water level
Normal water levelCCN CCE1
Hydrostaticload only
Dynamicwater pressure
Actualload
Convertedload
Actualload
364.65
Hydrostatic loadonly
25.40
1.77
9.81 25.40 1.77440.29
-
Coefficient
CCE2
Dynamic waterpressure
CCL
Convertedload
φ1.50
9.8125.40
339.25
1.50
Ds

1.3 Strength calculation of bonnetThe bonnet is calculated as a box ramen as shown in the model figure below.
Where, L0 :Width of bonnet = 1575 mmh0 :Depth of bonnet = 315 mm
(1) Internal pressurepi= γo×H
= 9.81 × = 226.121 kN/m2
= 0.226 N/mm2
pi :Internal pressure (N/mm2)γ0 :Specific gravity of water = 9.81 kN/m3
H :Design head = 23.05 m
(2) Effective width of skin plate
a) Point A b) Point B and Cl/L≦0.02 l/L≦0.05λ= l λ= l
0.02<l/L<0.3 0.05<l/L<0.3λ={1.06-3.2( l/L)+4.5( l /L)2} l λ={1.1-2( l/L)} l
0.3≦l/L 0.3≦l/Lλ= 0.15L λ= 0.15L
Where, λ :Effective width of one side of skin plate mm l :Half of supporting length of skin plate = 315 / 2 = 158 mmL :Equivalent supporting lengthPoint A = 0.2 ( l0+h0) = 0.2 × ( + 315 )= 378 mmPoint B = 0.6 h0 = 0.6 × 315 = 189 mmPoint C = 0.6 L0 = 0.6 × 1575 = 945 mm
The effective width is calculated so that the flange of stiffening girder may support the loadtogether with the skin plate.
1575
23.05
e1e1 L1
C
B
A
Neutral axisStiffening girder
Skin plate of bonnet
L0
A
C
B
A
A
I2
h1h0I1
I2
e2
e2
I1

l mm Lmm l/L λmm 2λmm158 378 0.42 57 114158 189 0.83 28 56158 945 0.17 121 242
(3) Section properties of stiffening girder
t1 :Thickness of skin plate mmt2 :Thickness of web mmt3 :Thickness of flange mmb1:Effective width mmb2:Width of web mmb3:Width of flange mm
Skin plate Web Flangeb1 t2 b2 t3 b3114 12.8 100 20 6556 12.8 100 20 65
242 12.8 100 20 65
(4) Sectional force
1) Acting load
The acting load converts into the design load which is calculated by the ratio of an acting axis and a neutral axis.W = pi・b・(2h0+L0)/(2h1+L1)
= 0.226 × 315 × ( 2 × 315 + 1575 ) / ( 2 × 407 + 1724 )
= 62 N/mm
Effective width of skin plate
It is assumed that the internal design pressure between the stiffeners acts as the distributed load.
A (mm2) Aw(mm2)12804005
Position
At1
12.5I (mm4)
Section properties
10297124Zi (mm3) Zo (mm3)
300735 160462
166083 146058BC
12.512.5
Point APoint B
101580 12968046
e (mm)62743280
128012807547377
13863875 5605
Point C
Position
b2t3
b3 t2
t1
b1=2λλ
λ
e
h1
L0
L1
I2
I1
C
B
A
Neutral axisStiffening girder
Skin plate
A
h0
I2
I1
C
A
B
A

Where, W :Converted acting load N/mmps :Design internal pressure = 0.226 N/mm2
b :Width of receiving pressure = 315 mmh0:Depth of bonnet = 315 mm
h1 :Length of neutral axis = h0+e= 315 + 2 × 46 = 407 mm L0 :Width of bonnet = 1575 mm L1 :Length of neutral axis = L0+2e = 1575 + 2 × 74 = 1724 mm
2) Acting load on each part[Stiffness ratio]
k = (I2・h1)/(I1・L1)= (13863875 × 407 )/ × 1724 ) = 0.434
n = h1/L1= 407 / 1724 = 0.236
[Bending moment]MA=W・L12/12・{(1+n2
・k)/(1+k)}MB=MA-W・h2/8MC=MA-W・L12/8
[Axial force]Section A-B NAB=W・L1/2 (Tensile force)
Section B-C NBC=W・h1/2 (Tensile force)
[Shearing force]Section A-B SAB=W・h1/2Section B-C SAC=W・l1/2
[Result of calculation]MA= N-mm MB= N-mmMC= N-mm
VA= 0 N
NAB= 53330 N NBC= 12599 NSAB= 12599 N SBC= 53330 N
(5) Stress of bonnet1) Stress at "A"
Bending stress
10942410
(7547377
9659805-12037612
B
A
A
A
B
C
C
A

[Bending stress(Inside)]σAi = MA/Zi+NAB/A
= 10942410 / + 53330 / 4005= + 13.3 = 79.2 N/mm2 <σa = 157.5 N/mm2
[Bending stress(Outside)]σAo = -MA/Zo+NAB/A
= / + 53330 / 4005= -74.9 + 13.3 = -61.6 N/mm2 <σa = 157.5 N/mm2
Shearing stressτA = SBC/Aw
= 53330 / 1280= 41.7 N/mm2 <τa= 90.9 N/mm2
2) Stress at "B"Bending stress
[Bending stress(Inside)]σBi = MB/Zi+NAB/A
= 9659805 / + 53330 / 3280= 95.1 + 16.3 = 111.4 N/mm2 <σa = 157.5 N/mm2
[Bending stress(Outside)]σBo = -MB/Zo+NAB/A
= / + 53330 / 3280= -74.5 + 16.3 = -58.2 N/mm2 <σa = 157.5 N/mm2
Shearing stressτB = SAB/Aw
= 12599 / 1280= 9.8 N/mm2 <τa= 90.9 N/mm2
3) Stress at "C"Bending stress
[Bending stress(Inside)]σCi = MC/Zi+NBC/A
= -12037612 / + 12599 / 5605= -40.0 + 2.2 = -37.8 N/mm2 <σa = 157.5 N/mm2
[Bending stress(Outside)]σCo = -MC/Zo+NBC/A
= / + 12599 / 5605= + 2.2 = 77.3 N/mm2 <σa = 157.5 N/mm2
Shearing stressτC = SBC/Aw
= 53330 / 1280= 41.7 N/mm2 <τa= 90.9 N/mm2
75.0160462
300735
12037612
101580
-9659805 129680
16608365.9
-10942410 146058

(6) Allowable stressesAllowable bending stress
Outsideσa= 250 × = 157.5 N/mm2 Material:A36(ASTM)
Insideσa= 250 × = 157.5 N/mm2 Material:A36(ASTM)
Coefficient:Allowable shearing stress
Outsideτa= 90.9 N/mm2 Material:A36(ASTM)
1.4 Operating loadThe operating load is summed up the following loads.(1) Self weight
Gate leaf G1 = × = kNRod of cylinder G2 = kNTotal load G = kN
(2) Friction force of seal plateF2= μ2・P
= 0.4 × 440.290 = 176.12 kNWhere, μ2 :Frictional coefficient of metal seal = 0.4
P :Hydrostatic pressure at operation = 440.29 kN(3) Buoyancy
F3= γ0/W0・G1= 9.81 / 77.0 × 15.70 = 2.00 kN
ここに、 γ0 :Specific gravity of water = 9.81 kN/m3W0 :Specific gravity of steel material = 77.01 kN/m3
(4) Friction force of seal in cylinderF4= d・π・b・n・μ2・P
= 0.090 × π × 0.006 × 1 × 0.7 × 440.290 = 0.523 kNWhere, d :Outside diameter of rod = 0.090 m
b :Contact width of V-packing = 0.006 mn :Quantity of V-packing = 1 piece
μ2 :Frictional coefficient of V-packing = 0.7P :Pressure on V-packing = 440.290 kN
(5) Total operating load(Unit:kN)
Load RaisingSelf weight G ↓ 16.47 ↓ 16.47Friction force of seal plate F2 ↓ 176.12 ↑ 176.12Buoyancy F3 ↑ 2.00 ↑ 2.00Friction force of seal in cylinder F4 ↓ 0.52 ↑ 0.52Total load ↓ 191.11 ↑ 162.17
0.63
0.63
1.6 9.81 15.7
Lowering
0.63
0.7716.47
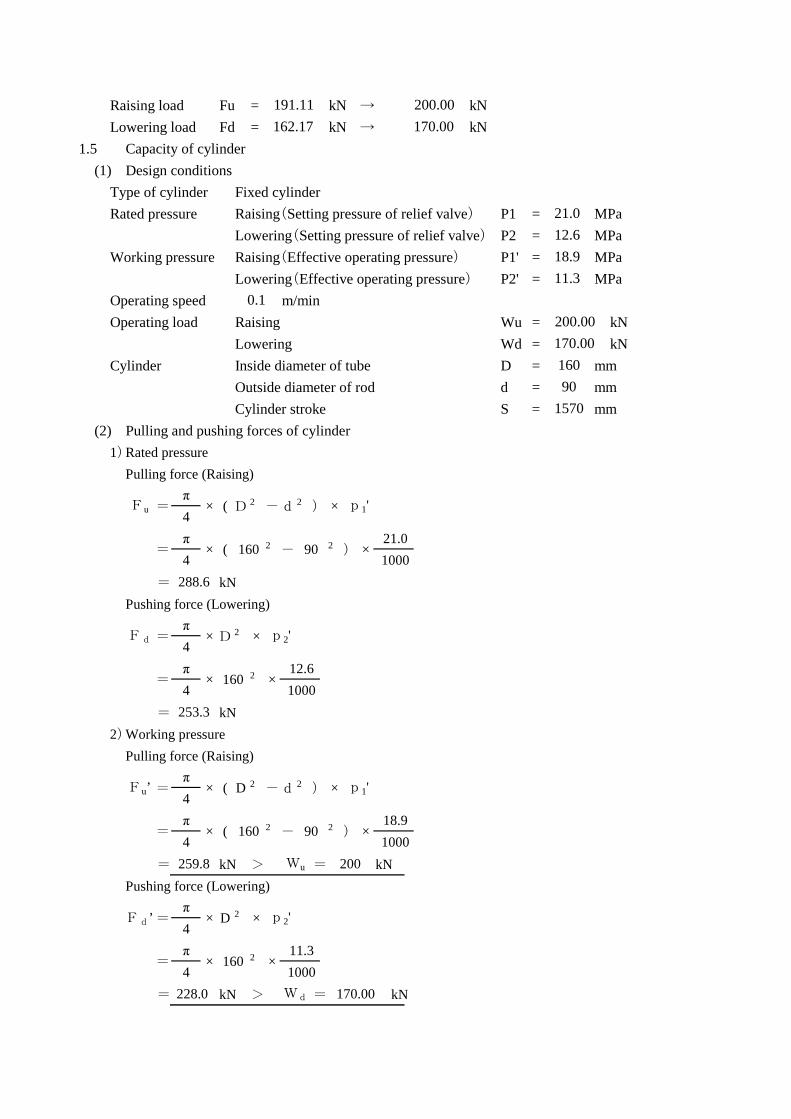
Raising load Fu = kN → kNLowering load Fd = kN → kN
1.5 Capacity of cylinder(1) Design conditions
Type of cylinder Fixed cylinderRated pressure Raising(Setting pressure of relief valve) P1 = MPa
Lowering(Setting pressure of relief valve) P2 = MPaWorking pressure Raising(Effective operating pressure) P1' = MPa
Lowering(Effective operating pressure) P2' = MPaOperating speed m/minOperating load Raising Wu = kN
Lowering Wd = kNCylinder Inside diameter of tube D = mm
Outside diameter of rod d = mmCylinder stroke S = mm
(2) Pulling and pushing forces of cylinder1)Rated pressure
Pulling force (Raising)
= kNPushing force (Lowering)
= kN2)Working pressure
Pulling force (Raising)
= kN > = kN Pushing force (Lowering)
= kN > = kN170.00
162.17191.11
0.1
p1'
160 ) ×21.01000
( D 2 -
2 - 90 2
228.0 Wd
2 ×
(
288.6
2 ×
200.00170.00160
11.3
901570
d 2 ) ×Fu =π
×4
=π
×4
Fd =π
×4
D p2'
=π
× 160 2 ×12.6
4 1000253.3
Fu’ =π
× ( D 2
90
d 2 )- ×
=π
× 160
Fd’
4 1000259.8 Wu
2 ) ×18.9
( 2 -
p1'
× p2'
=π
× 1604 1000
4
11.3
200
=4
× D 2π
12.618.9
200.00170.00
21.0

2. Strength Calculation for control gate in Oeste dam (After heightning)2.1 Design conditions
(1) Type Slide gate(2) Quantity 5 sets(3) Gate center elevation EL. m(4) Max. water level EL. m (heightning m )(5) Flood water level EL. m(6) Normal water level EL. m(7) Diameter φ m(8) Seismic intensity(9) Sealing system Metal seal at both side of gate leaf(10) Basic grand level EL. m(11) Operation device Hydraulic cylinder(12) Lifting height m(13) Operating system Local(14) Allowable stress ABNT NBR 8883
2.2 Design head(1) CCN (Nomal water level Only)
EL m
H= m
EL m
D:Diameter = mLoad of normal water level onlyPs= γo×H×A
= × ×= kN
Where, Ps :Hydrostatic loadγo :Specific gravity of water = kN/m3
H :Design head = m
A :Receiving pressure area = π・Ds2/4 = π × 1.50 2 /4= m2
2.0401.00
368.000
9.81329.35
φ1.50
1.77
387.000
19.00
19.000
368.00408.00
387.001.500.05
357.50
1.57
9.8119.00
1.77
D

(2) CCE1(Normal water level + Dynamic water pressure during earthquake)EL m
H= my= m
EL mh= m
H= m
EL Foundation rock elevation
a) Hydrostatic loadPs= γo×H×A
= × ×= kN
b) Dynamic pressure load during earthquakePd= γo・7/8・k・(h・y)1/2
・A= × × × × 1/2 ×= kN
c) Total loadPw= Ps+Pd
= +
= kN
(3) CCE2(Flood water level only)EL m
H= m
EL m
D:Caliber = mφ1.50
368.00
33.00
368.00
347.31
401.00
1.7717.95
9.81 7/8 0.05 29.50
329.35 17.95
29.50
357.50
10.50
9.81 19.00 1.77
19.0019.00
387.000
329.35
19.00
Ds
Ds

Ps= γo×H×A= × ×= kN
Where, Ps :Hydrostatic loadγo :Specific gravity of water = kN/m3
H :Design head = m
A :Receiving pressure area = π・Ds2/4 = π × 2 /4= m2
(4) CCL(Flood water level+ Dynamic water pressure during earthquake)EL
m
ELH= m
H= m
EL Foundation rock elevationa) Hydrostatic load
Ps= γo・H・A= × ×= KN
b) Dynamic pressure load during earthquakePd= γo・7/8・k・(h・y)1/2
・A= × × × × 1/2 ×= kN
c) Total loadPw= Ps+Pd
= +
= kN600.76
33.00 1.7728.73
572.03 28.73
9.81 7/8 0.05 43.50
9.81 33.00 1.77572.03
368.0043.50
10.50
357.50
33.00
401.00
572.03
9.8133.00
1.50
1.779.81 33.00
1.77
Ds

(5) Max. water levelEL
H= m
EL
D:Diameter = mPs= γo×H×A
= × ×= kN
Where, Ps :Hydrostatic loadγo :Specific gravity of water = kN/m3
H :Design head = m
A :Receiving pressure area = π・Ds2/4 = π × 2 /4= m2
(5) Comparison of loadsunit:kN
Case
水 位
0.50 0.90 329.35 658.70 347.31 385.90
0.63 0.90 572.03 907.99 600.76 667.52
Max. water level 0.80 693.37 866.71 - -
Because the load of "CCE2" becomes the maximum, strength of the load of "CCE2" is checked.
Coefficient
-
Hydrostaticload only
Dynamicwater pressure
1.50
φ1.50
9.8140.00
Hydrostatic loadonly
Dynamic waterpressure
368.00
40.00
1.77
9.81 40.00 1.77693.37
Flood water levelCCE2
408.00
CCL
Convertedload
Normal water levelCCN CCE1
Actualload
Convertedload
Actualload
Ds

2.3 Strength calculation of bonnetThe bonnet is calculated as a box ramen as shown in the model figure below.
Where, L0 :Width of bonnet = 1650 mmh0 :Depth of bonnet = 315 mm
(1) Internal pressurepi= γo×H
= 9.81 × = 323.73 kN/m2
= 0.324 N/mm2
pi :Internal pressure (N/mm2)γ0 :Specific gravity of water = 9.81 kN/m3
H :Design head = 33.00 m
(2) Effective width of skin plate
a) Point of A b) Point of B and Cl/L≦0.02 l/L≦0.05λ= l λ= l
0.02<l/L<0.3 0.05<l/L<0.3λ={1.06-3.2( l/L)+4.5( l /L)2} l λ={1.1-2( l/L)} l
0.3≦l/L 0.3≦l/Lλ= 0.15L λ= 0.15L
Where, λ :Working width in one side of skinplate mm l :Half of skin plate at support intervals = 315 / 2 = 158 mmL :Equivalent support interPoint A = 0.2 ( l0+h0) = 0.2 × ( + 315 )= 393 mmPoint B = 0.6 h0 = 0.6 × 315 = 189 mmPoint C = 0.6 L0 = 0.6 × 1650 = 990 mm
1650
33.00
The effective width is calculated so that the flange of stiffening girder may support the loadtogether with the skin plate.
e1e1 L1
C
B
A
Neutral axisStiffening girder
Skin plate of bonnnet
L0
A
C
B
A
A
I2
h1h0I1
I2
e2
e2
I1

l mm Lmm l/L λmm 2λmm158 393 0.40 59 118158 189 0.83 28 56825 990 0.83 149 298
(3) Section properties of stiffening girder
t1 :Thickness of skin plate mmt2 :Thickness of web mmt3 :Thickness of flange mmb1:Effective width mmb2:Width of web mmb3:Width of flange mm
Skin plate Web Flangeb1 t2 b2 t3 b3118 16.2 122 26 10056 16.2 122 26 100
298 16.2 122 26 100
(4) Sectional force
1) Acting load
The acting load converts into the design load which is calculated by the ratio of an acting axis and a neutral axis.W = pi・b・(2h0+L0)/(2h1+L1)
= 0.324 × 315 × ( 2 × 315 + 1650 ) / ( 2 × 448 + 1852 )
= 85 N/mm
Point C
Position
1610257633413694 8331
52821976.4 66
e (mm)89
1976.4270177
Point APoint B
Position
159431503218
I (mm4)
354710
250164 309396At1
BC
12.612.6
12.6
It is assumed that the internal design pressure between the stiffeners acts as the distributed load.
Section properties
22214599Zi (mm3) Zo (mm3) A (mm2) Aw(mm2)
1976.46063101
Effective width of skin plate
b2t3
b3 t2
t1
b1=2λλ
λ
e
h1
L0
L1
I2
I1
C
B
A
Neutral axisStiffening girder
Skin plate
A
h0
I2
I1
C
A
B
A

Where,W :Converted acting load N/mmps :Design internal pressure = 0.324 N/mm2
b :Width of receiving pressure = 315 mmh0:Depth of bonnet = 315 mm
h1 :Length of neutral axis = h0+e= 315 + 2 × 66 = 448 mm L0 :Width of bonnet = 1650 mm L1 :Length of neutral axis = L0+2e = 1650 + 2 × 101 = 1852 mm
2) Acting load on each part[Stiffness ratio]
k = (I2・h1)/(I1・L1)= (33413694 × 448 )/ × 1852 ) = 0.502
n = h1/L1= 448 / 1852 = 0.242
[Bending moment]MA=W・L12/12・{(1+n2
・k)/(1+k)}MB=MA-W・h2/8MC=MA-W・L12/8
[Axial force]Section A-B NAB=W・L1/2 (Tensile force)
Section B-C NBC=W・h1/2 (Tensile force)
[Shearing force]Section A-B SAB=W・h1/2Section B-C SAC=W・l1/2
[Result of calculation]MA= N-mm MB= N-mmMC= N-mm
VA= 0 N
NAB= 78358 N NBC= 18946 NSAB= 18946 N SBC= 78358 N
(5) Stress of bonnet1) Stress at "A"
Bending stress
14457199-1970170216578259
(16102576
B
A
A
A
B
C
C
A

[Bending stress(Inside)]σAi = MA/Zi+NAB/A
= 16578259 / + 78358 / 6063= + 12.9 = 79.2 N/mm2 <σa = 157.5 N/mm2
[Bending stress(Outside)]σAo = -MA/Zo+NAB/A
= / + 78358 / 6063= -53.6 + 12.9 = -40.7 N/mm2 <σa = 157.5 N/mm2
Shearing stressτA = SBC/Aw
= 78358 / 1976= 39.6 N/mm2 <τa= 90.9 N/mm2
2) Stress of "B"Bending stress
[Bending stress(Inside)]σAi = MB/Zi+NAB/A
= 14457199 / + 78358 / 5282= 90.7 + 14.8 = 105.5 N/mm2 <σa = 157.5 N/mm2
[Bending stress(Outside)]σAo = -MB/Zo+NAB/A
= / + 78358 / 5282= -53.5 + 14.8 = -38.7 N/mm2 <σa = 157.5 N/mm2
Shearing stressτA = SAB/Aw
= 18946 / 1976= 9.6 N/mm2 <τa= 90.9 N/mm2
3) Stress of "C"Bending stress
[Bending stress(Inside)]σAi = MC/Zi+NBC/A
= -19701702 / + 18946 / 8331= -39.2 + 2.3 = -36.9 N/mm2 <σa = 157.5 N/mm2
[Bending stress(Outside)]σAo = -MC/Zo+NBC/A
= / + 18946 / 8331= + 2.3 = 57.8 N/mm2 <σa = 157.5 N/mm2
Shearing stressτA = SBC/Aw
= 78358 / 1976= 39.6 N/mm2 <τa= 90.9 N/mm2
-16578259 309396
354710
66.3250164
270177
503218
1970170255.5
159431
-14457199

(6) Allowable stressesAllowable bending stress
Outsideσa= 250 × = 157.5 N/mm2 Material:A36(ASTM)
Insideσa= 250 × = 157.5 N/mm2 Material:A36(ASTM)
Coefficient:Allowable shearing stress
Outsideτa= 90.9 N/mm2 Material:A36(ASTM)
2.4 Operating loadThe operating load is summed up the following loads.(1) Self weight
Gate leaf G1 = × = kNRod of cylinder G2 = kNTotal load G = kN
(2) Seal frictionF2= μ2・P
= 0.4 × 693.371 = 277.35 kNWhere, μ2 :Frictional coefficient of metal seal = 0.4
P :Hydrostatic pressure at operation = 693.37 kN(3) Buoyancy
F3= γ0/W0・G1= 9.81 / 77.0 × 24.53 = 3.12 kN
ここに、 γ0 :Specific gravity of water = 9.81 kN/m3W0 :Specific gravity of steel material = 77.01 kN/m3
(4) Friction force of seal in cylinderF4= d・π・b・n・μ2・P
= 0.090 × π × 0.006 × 1 × 0.7 × 693.371 = 0.823 kNWhere, d :Rod outside diameter = 0.090 m
b :Width of contact of V-packing = 0.006 mn :Quantity of V-paccking = 1 piece
μ2 :Frictional coefficient of V-packing = 0.7P :Pressure on V-packing = 693.371 kN
(5) Total operating load(Unit:kN)
Load RaisingSelf weight G ↓ 25.30 ↓ 25.30Seal friction F2 ↓ 277.35 ↑ 277.35Buoyancy F3 ↑ 3.12 ↑ 3.12Friction force of seal in cylinder F4 ↓ 0.82 ↑ 0.82Total load ↓ 300.34 ↑ 256.00
0.7725.30
24.53
Lowering
0.63
2.5 9.81
0.63
0.63

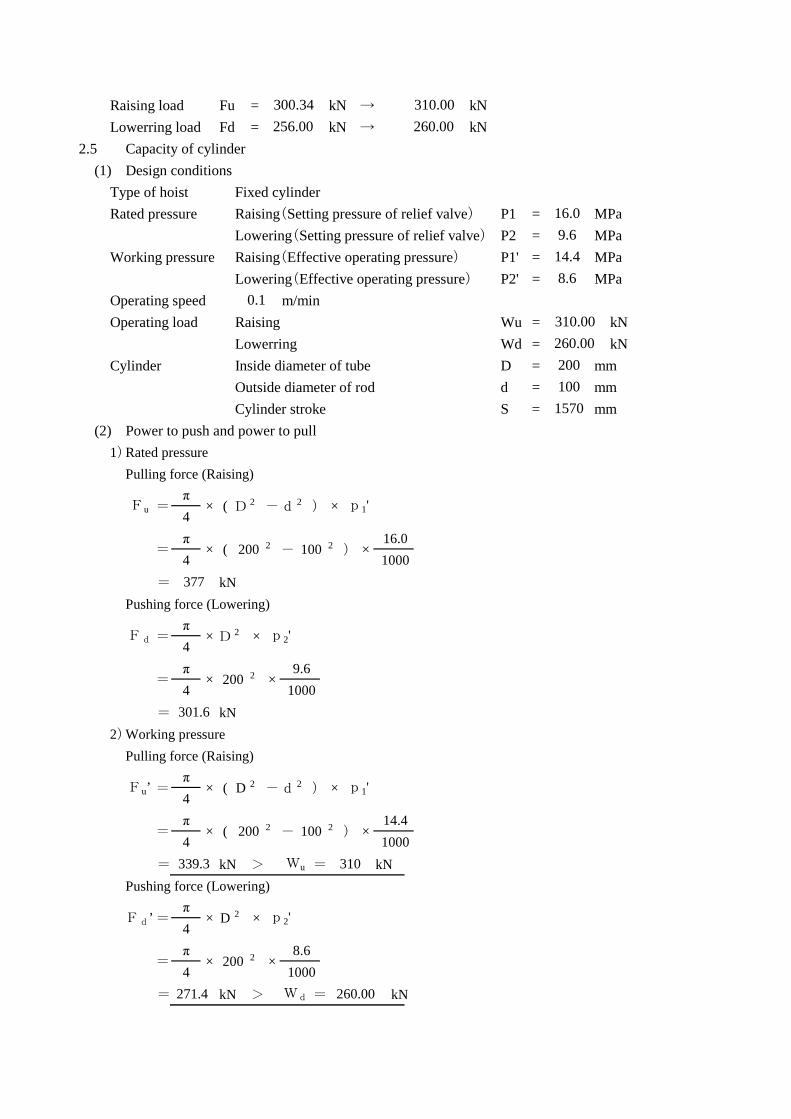
Raising load Fu = kN → kNLowerring load Fd = kN → kN
2.5 Capacity of cylinder(1) Design conditions
Type of hoist Fixed cylinderRated pressure Raising(Setting pressure of relief valve) P1 = MPa
Lowering(Setting pressure of relief valve) P2 = MPaWorking pressure Raising(Effective operating pressure) P1' = MPa
Lowering(Effective operating pressure) P2' = MPaOperating speed m/minOperating load Raising Wu = kN
Lowerring Wd = kNCylinder Inside diameter of tube D = mm
Outside diameter of rod d = mmCylinder stroke S = mm
(2) Power to push and power to pull1)Rated pressure
Pulling force (Raising)
= kNPushing force (Lowering)
= kN2)Working pressure
Pulling force (Raising)
= kN > = kN Pushing force (Lowering)
= kN > = kN
16.09.6
14.4
310.00260.00
8.6
310
=4
× D 2π
p1'
× p2'
=π
× 2004 1000
4
Fd’
4 1000339.3 Wu
2 ) ×14.4
(
×
=π
× 200 2 -
D 2
2
100
d 2 )-
301.6
Fu’ =π
× (
×9.6
4=
π× 200
1000
D 2 × p2'
377
Fd =π
×4
- 100 2=π
× (4
Fu =π
×4
310.00260.00200100
1570
d 2 ) ×
271.4 Wd
2 ×
( D 2 -
8.6
2
260.00
256.00300.34
0.1
p1'
200 ) ×16.01000

APPENDIX-3 :
Structural calculation for control gates
(Before heightning)

1. Strength Calculation for Control Gate in Oeste Dam (Before heightning)1.1 Design conditions
(1) Type Slide gate(2) Quantity 7 sets(3) Gate center elevation EL. m(4) Max. water level EL. m (heightning m )(5) Flood water level EL. m(6) Normal water level EL. m(7) Diameter φ m(8) Seismic intensity(9) Sealing system Metal seal at both side of gate leaf(10) Foundation rock elevation EL. m(11) Operation device Hydraulic cylinder(12) Lifting height m(13) Operating system Local(14) Allowable stress ABNT NBR 8883
1.2 Design load(1) CCN (Normal water level Only)
EL m
H= m
EL m
D:Diameter = mLoad of normal water level onlyPs= γo×H×A
= × ×= kN
Where, Ps :Hydrostatic loadγo :Specific gravity of water = kN/m3
H :Design head = m
A :Receiving pressure area = π・Ds2/4 = π × 1.50 2 /4= m2
340.790
1.54
1.540
339.250
9.8126.69
φ1.50
1.77
0.0
337.60
1.500.05
1.57
339.25362.65360.30340.79
9.811.54
1.77
D
(2) CCE1(Normal water level + Dynamic water pressure during earthquake)EL m
H= my= m
EL mh= m
H= m
EL Foundation rock elevation
a) Hydrostatic loadPs= γo×H×A
= × ×= kN
b) Dynamic pressure load during earthquakePd= γo・7/8・k・(h・y)1/2
・A= × × × × 1/2 ×= kN
c) Total loadPw= Ps+Pd
= +
= kN
(3) CCE2(Flood water level only)EL m
H= m
EL m
D:Diameter = m
339.25
φ1.50
1.6828.38
360.30
21.05
339.25
1.54 1.77
1.771.68
9.81 7/8 0.05 3.19
26.69
1.541.54
340.790
26.69
1.54
3.19
337.60
1.65
9.81
Ds
Ds

Ps= γo×H×A= × ×= kN
Where, Ps :Hydrostatic loadγo :Specific gravity of water = kN/m3
H :Design head = m
A :Receiving pressure area = π・Ds2/4 = π × 2 /4= m2
(4) CCL(Flood water level+ Dynamic water pressure during earthquake)EL
m
ELH= m
H= m
EL Foundation rock elevationa) Hydrostatic load
Ps= γo・H・A= × ×= KN
b) Dynamic pressure load during earthquakePd= γo・7/8・k・(h・y)1/2
・A= × × × × 1/2 ×= kN
c) Total loadPw= Ps+Pd
= +
= kN
22.700.05
364.89
381.46
21.05 1.7716.58
364.89 16.58
9.81 7/8
21.05
339.25
9.81 21.05 1.77
364.89
9.8121.05
1.50
1.65
337.60
22.70
1.77
9.81 21.05 1.77
360.30
Ds

(5) Max. water levelEL
H= m
EL
D:Diameter = mPs= γo×H×A
= × ×= kN
Where, Ps :Hydrostatic loadγo :Specific gravity of water = kN/m3
H :Design head = m
A :Receiving pressure area = π・Ds2/4 = π × 2 /4= m2
(5) Comparison of loadsunit:kN
Case
Water level
0.50 0.90 26.69 53.39 28.38 31.53
0.63 0.90 364.89 579.18 381.46 423.85
Max. water level 0.80 405.62 507.03 - -
The strength calculation is made for CCE2 since the maximum converted load acts on the bonnet at CCE2.
339.25
1.50
φ1.50
9.8123.40
Dynamic waterpressure
CCL
Convertedload
23.40
1.77
9.81 23.40 1.77405.62
-
Coefficient
362.65
Hydrostatic loadonly
Actualload
Convertedload
Actualload
Normal water levelCCN CCE1
Hydrostaticload only
Dynamicwater pressure
Flood water levelCCE2
Ds

1.3 Strength calculation of bonnetThe bonnet is calculated as a box ramen as shown in the model figure below.
Where, L0 :Width of bonnet = 1575 mmh0 :Depth of bonnet = 315 mm
(1) Internal pressurepi= γo×H
= 9.81 × = 206.501 kN/m2
= 0.207 N/mm2
pi :Internal pressure (N/mm2)γ0 :Specific gravity of water = 9.81 kN/m3
H :Design head = 21.05 m
(2) Effective width of skin plate
a) Point A b) Point B and Cl/L≦0.02 l/L≦0.05λ= l λ= l
0.02<l/L<0.3 0.05<l/L<0.3λ={1.06-3.2( l/L)+4.5( l /L)2} l λ={1.1-2( l/L)} l
0.3≦l/L 0.3≦l/Lλ= 0.15L λ= 0.15L
Where, λ :Effective width of one side of skin plate mm l :Half of supporting length of skin plate = 315 / 2 = 158 mmL :Equivalent supporting lengthPoint A = 0.2 ( l0+h0) = 0.2 × ( + 315 )= 378 mmPoint B = 0.6 h0 = 0.6 × 315 = 189 mmPoint C = 0.6 L0 = 0.6 × 1575 = 945 mm
21.05
1575
The effective width is calculated so that the flange of stiffening girder may support the loadtogether with the skin plate.
e1e1 L1
C
B
A
Neutral axisStiffening girder
Skin plate of bonnet
L0
A
C
B
A
A
I2
h1h0I1
I2
e2
e2
I1

l mm Lmm l/L λmm 2λmm158 378 0.42 57 114158 189 0.83 28 56158 945 0.17 121 242
(3) Section properties of stiffening girder
t1 :Thickness of skin plate mmt2 :Thickness of web mmt3 :Thickness of flange mmb1:Effective width mmb2:Width of web mmb3:Width of flange mm
Skin plate Web Flangeb1 t2 b2 t3 b3114 12.8 100 20 6556 12.8 100 20 65
242 12.8 100 20 65
(4) Sectional force
1) Acting load
The acting load converts into the design load which is calculated by the ratio of an acting axis and a neutral axis.W = pi・b・(2h0+L0)/(2h1+L1)
= 0.207 × 315 × ( 2 × 315 + 1575 ) / ( 2 × 407 + 1724 )
= 57 N/mm
Point C
Position
754737713863875 5605 46
e (mm)62743280
12801280
Point APoint B
101580 129680300735 160462
166083 146058BC
12.512.5
Position
At1
12.5I (mm4)
Section properties
10297124Zi (mm3) Zo (mm3) A (mm2) Aw(mm2)
12804005
Effective width of skin plate
It is assumed that the internal design pressure between the stiffeners acts as the distributed load.
b2t3
b3 t2
t1
b1=2λλ
λ
e
h1
L0
L1
I2
I1
C
B
A
Neutral axisStiffening girder
Skin plate
A
h0
I2
I1
C
A
B
A

Where, W :Converted acting load N/mmps :Design internal pressure = 0.207 N/mm2
b :Width of receiving pressure = 315 mmh0:Depth of bonnet = 315 mm
h1 :Length of neutral axis = h0+e= 315 + 2 × 46 = 407 mm L0 :Width of bonnet = 1575 mm L1 :Length of neutral axis = L0+2e = 1575 + 2 × 74 = 1724 mm
2) Acting load on each part[Stiffness ratio]
k = (I2・h1)/(I1・L1)= (13863875 × 407 )/ × 1724 ) = 0.434
n = h1/L1= 407 / 1724 = 0.236
[Bending moment]MA=W・L12/12・{(1+n2
・k)/(1+k)}MB=MA-W・h2/8MC=MA-W・L12/8
[Axial force]Section A-B NAB=W・L1/2 (Tensile force)
Section B-C NBC=W・h1/2 (Tensile force)
[Shearing force]Section A-B SAB=W・h1/2Section B-C SAC=W・l1/2
[Result of calculation]MA= N-mm MB= N-mmMC= N-mm
VA= 0 N
NAB= 48703 N NBC= 11506 NSAB= 11506 N SBC= 48703 N
(5) Stress of bonnet1) Stress at "A"
Bending stress
8821644-109931349992960
(7547377
B
A
A
A
B
C
C
A

[Bending stress(Inside)]σAi = MA/Zi+NAB/A
= 9992960 / + 48703 / 4005= + 12.2 = 72.3 N/mm2 <σa = 157.5 N/mm2
[Bending stress(Outside)]σAo = -MA/Zo+NAB/A
= / + 48703 / 4005= -68.4 + 12.2 = -56.3 N/mm2 <σa = 157.5 N/mm2
Shearing stressτA = SBC/Aw
= 48703 / 1280= 38.0 N/mm2 <τa= 90.9 N/mm2
2) Stress at "B"Bending stress
[Bending stress(Inside)]σBi = MB/Zi+NAB/A
= 8821644 / + 48703 / 3280= 86.8 + 14.8 = 101.7 N/mm2 <σa = 157.5 N/mm2
[Bending stress(Outside)]σBo = -MB/Zo+NAB/A
= / + 48703 / 3280= -68.0 + 14.8 = -53.2 N/mm2 <σa = 157.5 N/mm2
Shearing stressτB = SAB/Aw
= 11506 / 1280= 9.0 N/mm2 <τa= 90.9 N/mm2
3) Stress at "C"Bending stress
[Bending stress(Inside)]σCi = MC/Zi+NBC/A
= -10993134 / + 11506 / 5605= -36.6 + 2.1 = -34.5 N/mm2 <σa = 157.5 N/mm2
[Bending stress(Outside)]σCo = -MC/Zo+NBC/A
= / + 11506 / 5605= + 2.1 = 70.6 N/mm2 <σa = 157.5 N/mm2
Shearing stressτC = SBC/Aw
= 48703 / 1280= 38.0 N/mm2 <τa= 90.9 N/mm2
-9992960 146058
60.2166083
101580
-8821644 129680
160462
300735
1099313468.5

(6) Allowable stressesAllowable bending stress
Outsideσa= 250 × = 157.5 N/mm2 Material:A36(ASTM)
Insideσa= 250 × = 157.5 N/mm2 Material:A36(ASTM)
Coefficient:Allowable shearing stress
Outsideτa= 90.9 N/mm2 Material:A36(ASTM)
1.4 Operating loadThe operating load is summed up the following loads.(1) Self weight
Gate leaf G1 = × = kNRod of cylinder G2 = kNTotal load G = kN
(2) Friction force of seal plateF2= μ2・P
= 0.4 × 405.622 = 162.25 kNWhere, μ2 :Frictional coefficient of metal seal = 0.4
P :Hydrostatic pressure at operation = 405.62 kN(3) Buoyancy
F3= γ0/W0・G1= 9.81 / 77.0 × 14.72 = 1.87 kN
ここに、 γ0 :Specific gravity of water = 9.81 kN/m3W0 :Specific gravity of steel material = 77.01 kN/m3
(4) Friction force of seal in cylinderF4= d・π・b・n・μ2・P
= 0.090 × π × 0.006 × 1 × 0.7 × 405.622 = 0.482 kNWhere, d :Outside diameter of rod = 0.090 m
b :Contact width of V-packing = 0.006 mn :Quantity of V-packing = 1 piece
μ2 :Frictional coefficient of V-packing = 0.7P :Pressure on V-packing = 405.622 kN
(5) Total operating load(Unit:kN)
Load RaisingSelf weight G ↓ 15.49 ↓ 15.49Friction force of seal plate F2 ↓ 162.25 ↑ 162.25Buoyancy F3 ↑ 1.87 ↑ 1.87Friction force of seal in cylinder F4 ↓ 0.48 ↑ 0.48Total load ↓ 176.34 ↑ 149.12
0.7715.49
14.72
Lowering
0.63
1.5 9.81
0.63
0.63

Raising load Fu = kN → kNLowering load Fd = kN → kN
1.5 Capacity of cylinder(1) Design conditions
Type of cylinder Fixed cylinderRated pressure Raising(Setting pressure of relief valve) P1 = MPa
Lowering(Setting pressure of relief valve) P2 = MPaWorking pressure Raising(Effective operating pressure) P1' = MPa
Lowering(Effective operating pressure) P2' = MPaOperating speed m/minOperating load Raising Wu = kN
Lowering Wd = kNCylinder Inside diameter of tube D = mm
Outside diameter of rod d = mmCylinder stroke S = mm
(2) Pulling and pushing forces of cylinder1)Rated pressure
Pulling force (Raising)
= kNPushing force (Lowering)
= kN2)Working pressure
Pulling force (Raising)
= kN > = kN Pushing force (Lowering)
= kN > = kN
21.012.618.9
180.00150.00
11.3
180
=4
× D 2π
p1'
× p2'
=π
× 1604 1000
4
1000259.8 Wu
2 ) ×18.9
(=π
× 160
Fd’
42 - 90
d 2 )- ×
1000253.3
Fu’ =π
× ( D 2
p2'
=π
× 160 2 ×12.6
4
Fd =π
×4
D
Fu =π
×4
=π
×4
180.00150.00160
11.3
901570
d 2 ) ×
90 2
228.0 Wd
2 ×
(
288.6
2 ×
( D 2 -
2 -
150.00
149.12176.34
0.1
p1'
160 ) ×21.01000

2. Strength Calculation for control gate in Oeste dam (Before heightning)2.1 Design conditions
(1) Type Slide gate(2) Quantity 5 sets(3) Gate center elevation EL. m(4) Max. water level EL. m (heightning m )(5) Flood water level EL. m(6) Normal water level EL. m(7) Diameter φ m(8) Seismic intensity(9) Sealing system Metal seal at both side of gate leaf(10) Basic grand level EL. m(11) Operation device Hydraulic cylinder(12) Lifting height m(13) Operating system Local(14) Allowable stress ABNT NBR 8883
2.2 Design head(1) CCN (Nomal water level Only)
EL m
H= m
EL m
D:Diameter = mLoad of normal water level onlyPs= γo×H×A
= × ×= kN
Where, Ps :Hydrostatic loadγo :Specific gravity of water = kN/m3
H :Design head = m
A :Receiving pressure area = π・Ds2/4 = π × 1.50 2 /4= m2
1.57
9.8119.00
1.77
368.00408.00
387.001.500.05
357.50
φ1.50
1.77
387.000
19.00
19.000
368.000
9.81329.35
399.000.0
D

(2) CCE1(Normal water level + Dynamic water pressure during earthquake)EL m
H= my= m
EL mh= m
H= m
EL Foundation rock elevation
a) Hydrostatic loadPs= γo×H×A
= × ×= kN
b) Dynamic pressure load during earthquakePd= γo・7/8・k・(h・y)1/2
・A= × × × × 1/2 ×= kN
c) Total loadPw= Ps+Pd
= +
= kN
(3) CCE2(Flood water level only)EL m
H= m
EL m
D:Caliber = m
329.35
19.0019.00
387.000
29.50
357.50
10.50
9.81 19.00 1.77
19.00 1.7717.95
9.81 7/8 0.05 29.50
329.35 17.95
31.00
368.00
347.31
399.00
φ1.50
368.00
Ds
Ds

Ps= γo×H×A= × ×= kN
Where, Ps :Hydrostatic loadγo :Specific gravity of water = kN/m3
H :Design head = m
A :Receiving pressure area = π・Ds2/4 = π × 2 /4= m2
(4) CCL(Flood water level+ Dynamic water pressure during earthquake)EL
m
ELH= m
H= m
EL Foundation rock elevationa) Hydrostatic load
Ps= γo・H・A= × ×= KN
b) Dynamic pressure load during earthquakePd= γo・7/8・k・(h・y)1/2
・A= × × × × 1/2 ×= kN
c) Total loadPw= Ps+Pd
= +
= kN
1.50
1.779.81 31.00
1.77
399.00
537.36
9.8131.00
368.0041.50
10.50
357.50
31.00
0.05 41.50
9.81 31.00 1.77537.36
564.56
31.00 1.7727.20
537.36 27.20
9.81 7/8
Ds

(5) Max. water levelEL
H= m
EL
D:Diameter = mPs= γo×H×A
= × ×= kN
Where, Ps :Hydrostatic loadγo :Specific gravity of water = kN/m3
H :Design head = m
A :Receiving pressure area = π・Ds2/4 = π × 2 /4= m2
(5) Comparison of loadsunit:kN
Case
水 位
0.50 0.90 329.35 658.70 347.31 385.90
0.63 0.90 537.36 852.96 564.56 627.29
Max. water level 0.80 693.37 866.71 - -
Because the load of "CCE2" becomes the maximum, strength of the load of "CCE2" is checked.
Convertedload
Normal water levelCCN CCE1
Actualload
Convertedload
Actualload
CCL
408.00
368.00
40.00
1.77
9.81 40.00 1.77693.37
Flood water levelCCE2
Hydrostatic loadonly
Dynamic waterpressure
φ1.50
9.8140.00
1.50
Coefficient
-
Hydrostaticload only
Dynamicwater pressure
Ds

2.3 Strength calculation of bonnetThe bonnet is calculated as a box ramen as shown in the model figure below.
Where, L0 :Width of bonnet = 1650 mmh0 :Depth of bonnet = 315 mm
(1) Internal pressurepi= γo×H
= 9.81 × = 304.11 kN/m2
= 0.304 N/mm2
pi :Internal pressure (N/mm2)γ0 :Specific gravity of water = 9.81 kN/m3
H :Design head = 31.00 m
(2) Effective width of skin plate
a) Point of A b) Point of B and Cl/L≦0.02 l/L≦0.05λ= l λ= l
0.02<l/L<0.3 0.05<l/L<0.3λ={1.06-3.2( l/L)+4.5( l /L)2} l λ={1.1-2( l/L)} l
0.3≦l/L 0.3≦l/Lλ= 0.15L λ= 0.15L
Where, λ :Working width in one side of skinplate mm l :Half of skin plate at support intervals = 315 / 2 = 158 mmL :Equivalent support interPoint A = 0.2 ( l0+h0) = 0.2 × ( + 315 )= 393 mmPoint B = 0.6 h0 = 0.6 × 315 = 189 mmPoint C = 0.6 L0 = 0.6 × 1650 = 990 mm
The effective width is calculated so that the flange of stiffening girder may support the loadtogether with the skin plate.
31.00
1650
e1e1 L1
C
B
A
Neutral axisStiffening girder
Skin plate of bonnnet
L0
A
C
B
A
A
I2
h1h0I1
I2
e2
e2
I1

l mm Lmm l/L λmm 2λmm158 393 0.40 59 118158 189 0.83 28 56825 990 0.83 149 298
(3) Section properties of stiffening girder
t1 :Thickness of skin plate mmt2 :Thickness of web mmt3 :Thickness of flange mmb1:Effective width mmb2:Width of web mmb3:Width of flange mm
Skin plate Web Flangeb1 t2 b2 t3 b3118 16.2 122 26 10056 16.2 122 26 100
298 16.2 122 26 100
(4) Sectional force
1) Acting load
The acting load converts into the design load which is calculated by the ratio of an acting axis and a neutral axis.W = pi・b・(2h0+L0)/(2h1+L1)
= 0.304 × 315 × ( 2 × 315 + 1650 ) / ( 2 × 448 + 1852 )
= 79 N/mm
Effective width of skin plate
101
It is assumed that the internal design pressure between the stiffeners acts as the distributed load.
Section properties
22214599Zi (mm3) Zo (mm3) A (mm2) Aw(mm2)
1976.46063
354710
250164 309396At1
BC
12.612.6
12.6
Point APoint B
Position
159431503218
I (mm4)
52821976.4 66
e (mm)89
1976.42701771610257633413694 8331
Point C
Position
b2t3
b3 t2
t1
b1=2λλ
λ
e
h1
L0
L1
I2
I1
C
B
A
Neutral axisStiffening girder
Skin plate
A
h0
I2
I1
C
A
B
A

Where,W :Converted acting load N/mmps :Design internal pressure = 0.304 N/mm2
b :Width of receiving pressure = 315 mmh0:Depth of bonnet = 315 mm
h1 :Length of neutral axis = h0+e= 315 + 2 × 66 = 448 mm L0 :Width of bonnet = 1650 mm L1 :Length of neutral axis = L0+2e = 1650 + 2 × 101 = 1852 mm
2) Acting load on each part[Stiffness ratio]
k = (I2・h1)/(I1・L1)= (33413694 × 448 )/ × 1852 ) = 0.502
n = h1/L1= 448 / 1852 = 0.242
[Bending moment]MA=W・L12/12・{(1+n2
・k)/(1+k)}MB=MA-W・h2/8MC=MA-W・L12/8
[Axial force]Section A-B NAB=W・L1/2 (Tensile force)
Section B-C NBC=W・h1/2 (Tensile force)
[Shearing force]Section A-B SAB=W・h1/2Section B-C SAC=W・l1/2
[Result of calculation]MA= N-mm MB= N-mmMC= N-mm
VA= 0 N
NAB= 73609 N NBC= 17798 NSAB= 17798 N SBC= 73609 N
(5) Stress of bonnet1) Stress at "A"
Bending stress
15573516
(16102576
13581005-18507660
B
A
A
A
B
C
C
A

[Bending stress(Inside)]σAi = MA/Zi+NAB/A
= 15573516 / + 73609 / 6063= + 12.1 = 74.4 N/mm2 <σa = 157.5 N/mm2
[Bending stress(Outside)]σAo = -MA/Zo+NAB/A
= / + 73609 / 6063= -50.3 + 12.1 = -38.2 N/mm2 <σa = 157.5 N/mm2
Shearing stressτA = SBC/Aw
= 73609 / 1976= 37.2 N/mm2 <τa= 90.9 N/mm2
2) Stress of "B"Bending stress
[Bending stress(Inside)]σAi = MB/Zi+NAB/A
= 13581005 / + 73609 / 5282= 85.2 + 13.9 = 99.1 N/mm2 <σa = 157.5 N/mm2
[Bending stress(Outside)]σAo = -MB/Zo+NAB/A
= / + 73609 / 5282= -50.3 + 13.9 = -36.3 N/mm2 <σa = 157.5 N/mm2
Shearing stressτA = SAB/Aw
= 17798 / 1976= 9.0 N/mm2 <τa= 90.9 N/mm2
3) Stress of "C"Bending stress
[Bending stress(Inside)]σAi = MC/Zi+NBC/A
= -18507660 / + 17798 / 8331= -36.8 + 2.1 = -34.6 N/mm2 <σa = 157.5 N/mm2
[Bending stress(Outside)]σAo = -MC/Zo+NBC/A
= / + 17798 / 8331= + 2.1 = 54.3 N/mm2 <σa = 157.5 N/mm2
Shearing stressτA = SBC/Aw
= 73609 / 1976= 37.2 N/mm2 <τa= 90.9 N/mm2
503218
1850766052.2
159431
-13581005 270177
62.3250164
354710
-15573516 309396

(6) Allowable stressesAllowable bending stress
Outsideσa= 250 × = 157.5 N/mm2 Material:A36(ASTM)
Insideσa= 250 × = 157.5 N/mm2 Material:A36(ASTM)
Coefficient:Allowable shearing stress
Outsideτa= 90.9 N/mm2 Material:A36(ASTM)
2.4 Operating loadThe operating load is summed up the following loads.(1) Self weight
Gate leaf G1 = × = kNRod of cylinder G2 = kNTotal load G = kN
(2) Seal frictionF2= μ2・P
= 0.4 × 693.371 = 277.35 kNWhere, μ2 :Frictional coefficient of metal seal = 0.4
P :Hydrostatic pressure at operation = 693.37 kN(3) Buoyancy
F3= γ0/W0・G1= 9.81 / 77.0 × 24.53 = 3.12 kN
ここに、 γ0 :Specific gravity of water = 9.81 kN/m3W0 :Specific gravity of steel material = 77.01 kN/m3
(4) Friction force of seal in cylinderF4= d・π・b・n・μ2・P
= 0.090 × π × 0.006 × 1 × 0.7 × 693.371 = 0.823 kNWhere, d :Rod outside diameter = 0.090 m
b :Width of contact of V-packing = 0.006 mn :Quantity of V-paccking = 1 piece
μ2 :Frictional coefficient of V-packing = 0.7P :Pressure on V-packing = 693.371 kN
(5) Total operating load(Unit:kN)
Load RaisingSelf weight G ↓ 25.30 ↓ 25.30Seal friction F2 ↓ 277.35 ↑ 277.35Buoyancy F3 ↑ 3.12 ↑ 3.12Friction force of seal in cylinder F4 ↓ 0.82 ↑ 0.82Total load ↓ 300.34 ↑ 256.00
0.63
0.63
2.5 9.81 24.53
Lowering
0.63
0.7725.30
Raising load Fu = kN → kNLowerring load Fd = kN → kN
2.5 Capacity of cylinder(1) Design conditions
Type of hoist Fixed cylinderRated pressure Raising(Setting pressure of relief valve) P1 = MPa
Lowering(Setting pressure of relief valve) P2 = MPaWorking pressure Raising(Effective operating pressure) P1' = MPa
Lowering(Effective operating pressure) P2' = MPaOperating speed m/minOperating load Raising Wu = kN
Lowerring Wd = kNCylinder Inside diameter of tube D = mm
Outside diameter of rod d = mmCylinder stroke S = mm
(2) Power to push and power to pull1)Rated pressure
Pulling force (Raising)
= kNPushing force (Lowering)
= kN2)Working pressure
Pulling force (Raising)
= kN > = kN Pushing force (Lowering)
= kN > = kN260.00
256.00300.34
0.1
p1'
200 ) ×16.01000
271.4 Wd
2 ×
( D 2 -
8.6
1001570
d 2 ) ×Fu =π
×4
310.00260.00200
2 - 100 2=π
× (4
D 2 × p2'
377
Fd =π
×4
×9.6
4=
π× 200
1000301.6
Fu’ =π
× ( D 2
2
100
d 2 )- ×
=π
× 200 2 -
Fd’
4 1000339.3 Wu
2 ) ×14.4
(
p1'
× p2'
=π
× 2004 1000
4
8.6
310
=4
× D 2π
9.614.4
310.00260.00
16.0

APPENDIX-4 :
Structural calculation for conduit pipes
(After heightning)

1. Strength Calculation for Conduit Pipe in Oeste Dam (After heightning)1.1 Design Conditions
(1) Type Circular section embedded steel pipe(Exposed pipe at control gate chamber)
(2) Quantity 7 lanes(3) Diameter mm(4) Pipe center elevation EL. m(5) Max. water level EL. m (heightning m )(6) Flood water level EL. m(7) Normal water level EL. m(8) Material ASTM A36(equivalent to SS400 of JIS G3101)(9) Allowable stress ABNT NBR 8883:2008(10) Young's modulus Es= kN/mm2
1.2 Allowable Stress
Allowable stress
1.3 Strength Calculation for Conduit Pipe
σ1 = (N/mm2)
Where,D : Internal diameter(mm)P : Hydraulic pressure(MPa)t : Shell thickness(mm)
Upstream Max. water levelFlood water levelNormal water level
Downstream Max. water levelFlood water levelNormal water level 125.0
D
(mm)1500.01500.01500.01500.01500.01500.0
Allowable stress
(N/mm2)
125.0
157.5
2.828.726.1
0.2490.2260.022 2.5
σ1
(N/mm2)31.528.6
(N/mm2)
P
(MPa)0.2490.2260.022
Safety factorAllowable stress
HCase
250
(m)
0.63
5.93
6.51
6.51 25.4023.056.512.25
0.50 0.80
5.93
200.0
157.5200.025.40
23.052.255.93
σa
Location
157.5 200.0
(mm)t
A36125.0
2×t
P×D
MaterialYield point
σy(N/mm2)
341.50
CCNσa
(N/mm2)
ABNTNBR8883
206
2.0
1500339.25364.65
(N/mm2)
362.30
CCLσa
CCE

2. Strength Calculation for Conduit Pipe in Sul dam (After heightning)2.1 design conditions
(1) Type Circular section embedded steel pipe(Exposed pipe at control gate chamber)
(2) Quantity 5 lanes(3) Diameter φ mm(4) Pipe center elevation EL. m(5) Max. water level EL. m (heightning m )(6) Flood water level EL. m(7) Normal water level EL. m(8) Material ASTM A36(equivalent to SS400 of JIS G3101)(9) Allowable stress ABNT NBR 8883:2008(10) Young's modulus Es= kN/mm2
2.2 Allowable Stress
Arrowed stress
2.3 Strength Calculation for Conduit Pipe
σ1 = (N/mm2)
Where,D : Internal diameter(mm)P : Hydraulic pressure(MPa)t : Shell thickness(mm)
Upstream Max. water levelFlood water levelNormal water level
Downstream Max. water levelFlood water levelNormal water level
2.0
1500368.00408.00
MaterialYield point
σy(N/mm2)
387.00
CCNσa
(N/mm2)
206
CCLσa
CCEσa
(N/mm2)
401.00
Location
157.5 200.0
(mm)t
A36125.0
2×t
P×D
0.50 0.80
9.17
200.0
157.5200.040.00
33.0019.009.17
9.17
8.66
8.66 40.0033.008.6619.00
ABNTNBR8883
Safety factorAllowable stress
HCase
250
(m)
0.63(N/mm2)
P
0.186 16.1
(MPa)0.3920.3240.186
σ1
(N/mm2)32.126.5
0.3920.324
(N/mm2)
125.0
157.5
15.234.028.0
125.0
D
(mm)1500.01500.01500.01500.01500.01500.0
Allowable stress

APPENDIX-5 :
Structural calculation for conduit pipes
(Before heightning)

1. Strength Calculation for Conduit Pipe in Oeste Dam (Before heightning)1.1 Design Conditions
(1) Type Circular section embedded steel pipe(Exposed pipe at control gate chamber)
(2) Quantity 7 lanes(3) Diameter mm(4) Pipe center elevation EL. m(5) Max. water level EL. m (heightning m )(6) Flood water level EL. m(7) Normal water level EL. m(8) Material ASTM A36(equivalent to SS400 of JIS G3101)(9) Allowable stress ABNT NBR 8883:2008(10) Young's modulus Es= kN/mm2
1.2 Allowable Stress
Allowable stress
1.3 Strength Calculation for Conduit Pipe
σ1 = (N/mm2)
Where,D : Internal diameter(mm)P : Hydraulic pressure(MPa)t : Shell thickness(mm)
Upstream Max. water levelFlood water levelNormal water level
Downstream Max. water levelFlood water levelNormal water level
0.0
1500339.25362.65
MaterialYield point
σy(N/mm2)
341.50
CCNσa
(N/mm2)
206
CCLσa
CCEσa
(N/mm2)
360.30
Location
157.5 200.0
(mm)t
A36125.0
2×t
P×D
0.50 0.80
5.93
200.0
157.5200.023.40
21.052.255.93
5.93
6.51
6.51 23.4021.056.512.25
ABNTNBR8883
Safety factorAllowable stress
HCase
250
(m)
0.63(N/mm2)
P
0.022 2.5
(MPa)0.2300.2070.022
σ1
(N/mm2)29.026.1
0.2300.207
(N/mm2)
125.0
157.5
2.826.423.8
125.0
D
(mm)1500.01500.01500.01500.01500.01500.0
Allowable stress

2. Strength Calculation for Conduit Pipe in Sul dam (Before heightning)2.1 design conditions
(1) Type Circular section embedded steel pipe(Exposed pipe at control gate chamber)
(2) Quantity 5 lanes(3) Diameter φ mm(4) Pipe center elevation EL. m(5) Max. water level EL. m (heightning m )(6) Flood water level EL. m(7) Normal water level EL. m(8) Material ASTM A36(equivalent to SS400 of JIS G3101)(9) Allowable stress ABNT NBR 8883:2008(10) Young's modulus Es= kN/mm2
2.2 Allowable Stress
Arrowed stress
2.3 Strength Calculation for Conduit Pipe
σ1 = (N/mm2)
Where,D : Internal diameter(mm)P : Hydraulic pressure(MPa)t : Shell thickness(mm)
Upstream Max. water levelFlood water levelNormal water level
Downstream Max. water levelFlood water levelNormal water level 125.0
D
(mm)1500.01500.01500.01500.01500.01500.0
Allowable stress
(N/mm2)
125.0
157.5
15.234.026.3
0.3920.3040.186 16.1
σ1
(N/mm2)32.124.9
(N/mm2)
P
(MPa)0.3920.3040.186
Safety factorAllowable stress
HCase
250
(m)
0.63
9.17
8.66
8.66 40.0031.008.6619.00
0.50 0.80
9.17
200.0
157.5200.040.00
31.0019.009.17
σa
Location
157.5 200.0
(mm)t
A36125.0
2×t
P×D
MaterialYield point
σy(N/mm2)
387.00
CCNσa
(N/mm2)
ABNTNBR8883
206
0.0
1500368.00408.00
(N/mm2)
399.00
CCLσa
CCE

APPENDIX-6 :
Stability Analysis of Oeste dam

(1) Existing
1) Design Condition
Design condition of Dam stability analysis is considered as shown in the table 1 below.
Table 1 Design condition of Existing
Bulkhead section Spillway section Fig 1 Typical section of Existing
Bulkhead section Spillway sectionElevation of Top of Dam EL.m 363.150 -----Basic triangle Top Elevation EL.m 363.900 362.900Upstream Slope 1:n 0.030 -----Downstream Slope 1:n 0.730 0.780Upper surface of the downstream slope 1:n 0.030 -----Dam base elevation EL.m 337.600 337.600Crest width of non-overflow section m 2.900 -----Reservoir sediment level EL.m 338.500 ←Reservoir water level [ CCN ] EL.m 340.790 ← [ CCE ] EL.m 362.650 ← [ CCL ] EL.m 360.300 ←Downstream water level [ CCN ] EL.m 340.090 ← [ CCE ] EL.m 347.740 ← [ CCL ] EL.m 341.950 ←
Unit weight of concrete dams kN/m3 23.5 ←
Weight of sediment in the water kN/m3 8.5 ←
Unit weight of water kN/m3 10.0 ←
Seismic Coefficient: Horizontal (kh) --- 0.050 ←Seismic Coefficient: Vertical (kv) --- 0.030 ←Coefficient of earth pressure (Rankine coefficient of earth pressure) --- 0.40 ←Uplift pressure coefficient --- 1/3 ←
Shear strength of foundation kN/m2 1,000.0 ←
Friction angle of foundation deg 38.00 ←Internal friction coefficient --- 0.78 ←

2) Stability Analysis of Existing dam
[Bulkhead section]
- CCN: Normal water
Resume of Acting Force and Moment[CCN : Normal water ]
--- V(kN) H(kN) X(m) Y(m) Me(kN.m) Mt(kN.m) RemarkDead load 6,251.14 13.103 81,905.56
W/O Dead Load 0.00 0.000 0.00Seismic
W/O Seismic 0.00 0.000 0.00U/S Water weight 1.53 19.934 30.50D/S Water weight 22.63 0.605 13.70
U/S Water Pressure 50.88 1.063 54.09D/S Water Pressure -31.00 0.830 -25.73
Dynamic Water PressureEarth Pressure 0.10 19.957 2.00
Soil weight 1.38 0.300 0.41Uplift -520.43 10.132 -5,272.78Total 5,754.97 21.26 76,678.98 28.77
Control of Stability [CCN]- Barycentric position
76,650.21 13.328975,754.97
- Excentricity19.966 -3.34621667
21.3
- Safety factor due to Lifting6,275.40520.43 > 1.30 … -OK-
1.5- Safety factor due to overturning
76,678.9828.77 > 1.50 … -OK-
- Safety factor due to sliding 48V= 5,754.97 kN FSD-φ 1.50H= 21.26 kN FSD-c 3.00L= 19.966 m tanφ 0.78
> 1.0 … -OK-3
- Safety factor due to bearing power
5,754.97 6×3.33619.966 19.966
vertical stress of upstream = 577.220 kN/㎡ ≧ 0 kN/㎡ (Tensile force not occur) vertical stress of downstream = -0.729 kN/㎡ < 0 kN/㎡ (Tensile force occur) but downstream side -OK-
=12.058
=2,665.241
=13.319 m
×(1.0± )
- 13.319 =|-3.336 m|
2,992.58+6,655.33 =453.80621.26
5,754.97*0.78 =2,992.581.50
=6,655.333.001,000.0*19.966
VFSFU
Σ= =Σ
MeFSTMt
Σ= =Σ
tanc
V c lFSD FSD
FSDH
φ
φΣ ⋅ ⋅+
= =Σ
tanVFSDφ
φΣ ⋅=
c
c lFSD⋅
=
61V eqB B
×⎛ ⎞= × ± =⎜ ⎟⎝ ⎠
Mx MyxV+
= =
-2Be x= =

- CCE: Maximum Flood water
Resume of Acting Force and Moment[CCE : Maximum Flood water]
--- V(kN) H(kN) X(m) Y(m) Me(kN.m) Mt(kN.m) RemarkDead load 6,251.14 13.103 81,905.56
W/O Dead Load 0.00 0.000 0.00Seismic 0.00 0.00 →
W/O Seismic 0.00 0.000 0.00 →U/S Water weight 94.13 19.716 1,855.82D/S Water weight 375.29 2.467 926.03
U/S Water Pressure 3,137.51 8.350 26,198.21D/S Water Pressure -514.10 3.380 -1,737.66
Dynamic Water Pressure 0.000 0.00Earth Pressure 0.10 19.957 2.00
Soil weight 1.38 0.300 0.41Uplift -2,520.64 10.638 -26,813.31Total 4,200.02 2,624.79 57,876.10 24,460.96
Control of Stability [CCE]- Barycentric position
33,415.14 19.603974,200.02
- Excentricity19.966 -9.621218553
21.1
- Safety factor due to Lifting6,720.662,520.64 > 1.10 … -OK-
1.2- Safety factor due to overturning
57,876.1024,460.96 > 1.20 … -OK-
- Safety factor due to sliding 49V= 4,200.02 kN FSD-φ 1.10H= 2,624.79 kN FSD-c 1.50L= 19.966 m tanφ 0.78
> 1.0 … -OK-2
- Safety factor due to bearing power
4,200.02 6×2.02719.966 19.966
vertical stress of upstream = 82.221 kN/㎡ ≧ 0 kN/㎡ (Tensile force not occur) vertical stress of downstream = 338.507 kN/㎡ ≧ 0 kN/㎡ (Tensile force not occur) -OK-
=2,978.20
×(1.0± )
- 7.956 =|2.027 m|
=7.956 m
=2.666
=2.366
4,200.02*0.781.10
1,000.0*19.966
2,978.20+13,310.67 =6.2062,624.79
=13,310.671.50
VFSFU
Σ= =Σ
MeFSTMt
Σ= =Σ
tanc
V c lFSD FSD
FSDH
φ
φΣ ⋅ ⋅+
= =Σ
tanVFSDφ
φΣ ⋅=
c
c lFSD⋅
=
61V eqB B
×⎛ ⎞= × ± =⎜ ⎟⎝ ⎠
Mx MyxV+
= =
-2Be x= =

- CCL: Flood water + Seismic
Resume of Acting Force and Moment[CCL : Flood water + Seismic ]
--- V(kN) H(kN) X(m) Y(m) Me(kN.m) Mt(kN.m) RemarkDead load 6,251.14 13.103 81,905.56 0.00
W/O Dead Load 0.00 0.000 0.00 0.00Seismic -187.53 312.56 13.103 8.977 -2,457.17 2,805.86
W/O Seismic 0.00 0.00U/S Water weight 77.29 19.739 1,525.59 0.00D/S Water weight 69.07 1.059 73.18 0.00
U/S Water Pressure 2,576.45 7.567 0.00 19,496.00D/S Water Pressure -94.61 1.450 0.00 -137.18
Dynamic Water Pressure 150.29 9.080 0.00 1,364.63Earth Pressure 0.10 19.957 2.00 0.00
Soil weight 1.38 0.300 0.00 0.41Uplift -1,479.11 11.357 -16,797.51 0.00Total 4,730.96 2,946.07 64,251.65 23,529.72
Control of Stability [CCL]- Barycentric position
40,721.93 18.554684,730.96
- Excentricity19.966 -8.571929012
21.1
- Safety factor due to Lifting6,210.071,479.11 > 1.10 … -OK-
1.1- Safety factor due to overturning
64,251.6523,529.72 > 1.10 … -OK-
- Safety factor due to sliding 50V= 4,730.96 kN FSD-φ 1.10H= 2,946.07 kN FSD-c 1.30L= 19.966 m tanφ 0.78
> 1.0 … -OK-1.5
- Safety factor due to bearing power
4,730.96 6×1.37519.966 19.966
vertical stress of upstream = 139.043 kN/㎡ ≧ 0 kN/㎡ (Tensile force not occur) vertical stress of downstream = 334.870 kN/㎡ ≧ 0 kN/㎡ (Tensile force not occur) -OK-
×(1.0± )
=8.608 m
4,730.96*0.78 =3,354.681.10
- 8.608 =|1.375 m|
=2.731
=6.3522,946.07
=4.199
1,000.0*19.966
3,354.68+15,358.46
1.30 =15,358.46
VFSFU
Σ= =Σ
MeFSTMt
Σ= =Σ
tanc
V c lFSD FSD
FSDH
φ
φΣ ⋅ ⋅+
= =Σ
tanVFSDφ
φΣ ⋅=
c
c lFSD⋅
=
61V eqB B
×⎛ ⎞= × ± =⎜ ⎟⎝ ⎠
Mx MyxV+
= =
-2Be x= =

- CCC: Construction
Resume of Acting Force and Moment[CCC : Construction ]
--- V(kN) H(kN) X(m) Y(m) Me(kN.m) Mt(kN.m) RemarkDead load 6,251.14 13.103 81,905.56
W/O Dead Load 0.00 0.000 0.00Seismic 0.00
W/O Seismic 0.00U/S Water weight 0.00D/S Water weight 0.00
U/S Water Pressure 0.00D/S Water Pressure 0.00
Dynamic Water Pressure 0.00Earth Pressure 0.00
Soil weight 0.00Uplift 0.00Total 6,251.14 0.00 81,905.56 0.00
Control of Stability [CCC]- Barycentric position
81,905.56 13.10256,251.14
- Excentricity19.966 -3.119749704
21.2
- Safety factor due to Lifting6,251.14
0.00 > 1.20 … -OK-1.3
- Safety factor due to overturning81,905.56
0.00 > 1.30 … -OK-
- Safety factor due to sliding 51V= 6,251.14 kN FSD-φ 1.30H= 0.00 kN FSD-c 2.00L= 19.966 m tanφ 0.78
> 1.0 … -OK-1.3
- Safety factor due to bearing power
6,251.14 6×3.11919.966 19.966
vertical stress of upstream = 606.568 kN/㎡ ≧ 0 kN/㎡ (Tensile force not occur) vertical stress of downstream = 19.626 kN/㎡ ≧ 0 kN/㎡ (Tensile force not occur) -OK-
=3,750.68
=13.102 m
=|-3.119 m|- 13.102
= ∞
= ∞
6,251.14*0.78
×(1.0± )
3,750.68+9,983.00 = ∞0.00
1.30
1,000.0*19.966 =9,983.002.00
VFSFU
Σ= =Σ
MeFSTMt
Σ= =Σ
tanc
V c lFSD FSD
FSDH
φ
φΣ ⋅ ⋅+
= =Σ
tanVFSDφ
φΣ ⋅=
c
c lFSD⋅
=
61V eqB B
×⎛ ⎞= × ± =⎜ ⎟⎝ ⎠
Mx MyxV+
= =
-2Be x= =

[Spillway section]
- CCN: Normal water
Resume of Acting Force and Moment[CCN : Normal water ]
--- V(kN) H(kN) X(m) Y(m) Me(kN.m) Mt(kN.m) RemarkDead load 5,866.42 13.156 77,178.62
W/O Dead Load -14.69 7.934 -116.55Seismic
W/O SeismicU/S Water weight 0.00 0.000 0.00D/S Water weight 24.18 0.647 15.64
U/S Water Pressure 50.88 1.063 54.09D/S Water Pressure -31.00 0.830 -25.73
Dynamic Water PressureEarth Pressure 0.00 0.000 0.00
Soil weight 1.38 0.300 0.41Uplift -514.40 10.014 -5,151.20Total 5,361.51 21.26 71,926.51 28.77
Control of Stability [CCN]- Barycentric position
71,897.745,361.51
- Excentricity19.734
21.3
- Safety factor due to Lifting5,875.91514.40 > 1.30 … -OK-
1.5- Safety factor due to overturning
71,926.5128.77 > 1.50 … -OK-
- Safety factor due to sliding 48V= 5,361.51 kN FSD-φ 1.50H= 21.26 kN FSD-c 3.00L= 19.734 m tanφ 0.78
> 1.0 … -OK-3
- Safety factor due to bearing power
5,361.51 6×3.54319.734 19.734
vertical stress of upstream = 564.360 kN/㎡ ≧ 0 kN/㎡ (Tensile force not occur) vertical stress of downstream = -20.982 kN/㎡ < 0 kN/㎡ (Tensile force occur) but downstream side -OK-
=13.410 m
×(1.0± )
- 13.410
=11.423
=2,500.052
=6,578.00
=|-3.543 m|
2,787.99+6,578.00 =440.54521.26
5,361.51*0.78 =2,787.991.50
1,000.0*19.7343.00
VFSFU
Σ= =Σ
MeFSTMt
Σ= =Σ
tanc
V c lFSD FSD
FSDH
φ
φΣ ⋅ ⋅+
= =Σ
tanVFSDφ
φΣ ⋅=
c
c lFSD⋅
=
61V eqB B
×⎛ ⎞= × ± =⎜ ⎟⎝ ⎠
Mx MyxV+
= =
-2Be x= =

- CCE: Maximum flood water
Resume of Acting Force and Moment[CCE : Maximum Flood water ]
--- V(kN) H(kN) X(m) Y(m) Me(kN.m) Mt(kN.m) RemarkDead load 5,866.42 13.156 77,178.62
W/O Dead Load -14.69 7.934 -116.55Seismic 0.00 0.00
W/O Seismic 0.000 0.000 0.00 0.00U/S Water weight 0.00 0.000 0.00D/S Water weight 401.00 2.637 1,057.44
U/S Water Pressure 3,137.51 8.350 26,198.21D/S Water Pressure -514.10 3.380 -1,737.66
Dynamic Water Pressure 0.00Earth Pressure 0.00 0.000 0.00
Soil weight 1.38 0.300 0.41Uplift -2,491.42 10.514 -26,194.79Total 3,761.31 2,624.79 51,924.72 24,460.96
Control of Stability [CCE]- Barycentric position
27,463.763,761.31
- Excentricity19.734
21.1
- Safety factor due to Lifting6,252.732,491.42 > 1.10 … -OK-
1.2- Safety factor due to overturning
51,924.7224,460.96 > 1.20 … -OK-
- Safety factor due to sliding 49V= 3,761.31 kN FSD-φ 1.10H= 2,624.79 kN FSD-c 1.50L= 19.734 m tanφ 0.78
> 1.0 … -OK-2
- Safety factor due to bearing power
3,761.31 6×2.56519.734 19.734
vertical stress of upstream = 41.956 kN/㎡ ≧ 0 kN/㎡ (Tensile force not occur) vertical stress of downstream = 339.245 kN/㎡ ≧ 0 kN/㎡ (Tensile force not occur) -OK-
=2,667.11
2,667.11+13,156.00 =6.0282,624.79
×(1.0± )
- 7.302 =|2.565 m|
=7.302 m
=2.510
=2.123
3,761.31*0.781.10
1,000.0*19.734 =13,156.001.50
VFSFU
Σ= =Σ
MeFSTMt
Σ= =Σ
tanc
V c lFSD FSD
FSDH
φ
φΣ ⋅ ⋅+
= =Σ
tanVFSDφ
φΣ ⋅=
c
c lFSD⋅
=
61V eqB B
×⎛ ⎞= × ± =⎜ ⎟⎝ ⎠
Mx MyxV+
= =
-2Be x= =

- CCL: Flood water + Seismic
Resume of Acting Force and Moment[CCL : Flood water + Seismic ]
--- V(kN) H(kN) X(m) Y(m) Me(kN.m) Mt(kN.m) RemarkDead load 5,866.42 13.156 77,178.62 0.00
W/O Dead Load -14.69 7.934 -116.55 0.00Seismic -175.99 293.32 13.156 8.433 -2,315.36 2,473.67
W/O Seismic 0.44 -0.73 7.934 32.047 3.50 -23.54U/S Water weight 0.00 0.000 0.00 0.00D/S Water weight 73.80 1.132 83.54 0.00
U/S Water Pressure 2,576.45 7.567 0.00 19,496.00D/S Water Pressure -94.61 1.450 0.00 -137.18
Dynamic Water Pressure 150.29 9.080 0.00 1,364.63Earth Pressure 0.00 0.000 0.00 0.00
Soil weight 1.38 0.300 0.00 0.41Uplift -1,461.96 11.225 -16,410.50 0.00Total 4,288.02 2,926.10 58,423.25 23,173.99
Control of Stability [CCL]- Barycentric position
35,249.264,288.02
- Excentricity19.734
21.1
- Safety factor due to Lifting5,749.981,461.96 > 1.10 … -OK-
1.1- Safety factor due to overturning
58,423.2523,173.99 > 1.10 … -OK-
- Safety factor due to sliding 50V= 4,288.02 kN FSD-φ 1.10H= 2,926.10 kN FSD-c 1.30L= 19.734 m tanφ 0.78
> 1.0 … -OK-1.5
- Safety factor due to bearing power
4,288.02 6×1.64719.734 19.734
vertical stress of upstream = 108.480 kN/㎡ ≧ 0 kN/㎡ (Tensile force not occur) vertical stress of downstream = 326.101 kN/㎡ ≧ 0 kN/㎡ (Tensile force not occur) -OK-
×(1.0± )
=8.220 m
=|1.647 m|
=2.521
- 8.220
=6.2272,926.10
=3.933
1,000.0*19.734
3,040.60+15,180.00
4,288.02*0.78 =3,040.601.10
=15,180.001.30
VFSFU
Σ= =Σ
MeFSTMt
Σ= =Σ
tanc
V c lFSD FSD
FSDH
φ
φΣ ⋅ ⋅+
= =Σ
tanVFSDφ
φΣ ⋅=
c
c lFSD⋅
=
61V eqB B
×⎛ ⎞= × ± =⎜ ⎟⎝ ⎠
Mx MyxV+
= =
-2Be x= =

- CCC: Construction
Resume of Acting Force and Moment[CCC : Construction ]
--- V(kN) H(kN) X(m) Y(m) Me(kN.m) Mt(kN.m) RemarkDead load 5,866.42 13.156 77,178.62
W/O Dead Load -14.69 7.934 -116.55Seismic 0.00
W/O Seismic 0.00U/S Water weight 0.00D/S Water weight 0.00
U/S Water Pressure 0.00D/S Water Pressure 0.00
Dynamic Water Pressure 0.00Earth Pressure 0.00
Soil weight 0.00Uplift 0.00Total 5,851.73 0.00 77,062.07 0.00
Control of Stability [CCC]- Barycentric position
77,062.075,851.73
- Excentricity19.734
21.2
- Safety factor due to Lifting5,851.73
0.00 > 1.20 … -OK-1.3
- Safety factor due to overturning77,062.07
0.00 > 1.30 … -OK-
- Safety factor due to sliding 51V= 5,851.73 kN FSD-φ 1.30H= 0.00 kN FSD-c 2.00L= 19.734 m tanφ 0.78
> 1.0 … -OK-1.3
- Safety factor due to bearing power
5,851.73 6×3.30219.734 19.734
vertical stress of upstream = 594.233 kN/㎡ ≧ 0 kN/㎡ (Tensile force not occur) vertical stress of downstream = -1.172 kN/㎡ < 0 kN/㎡ (Tensile force occur) but downstream side -OK-
=3,511.04
=13.169 m
=|-3.302 m|- 13.169
= ∞
= ∞
5,851.73*0.781.30
×(1.0± )
3,511.04+9,867.00 = ∞0.00
=9,867.002.001,000.0*19.734
VFSFU
Σ= =Σ
MeFSTMt
Σ= =Σ
tanc
V c lFSD FSD
FSDH
φ
φΣ ⋅ ⋅+
= =Σ
tanVFSDφ
φΣ ⋅=
c
c lFSD⋅
=
61V eqB B
×⎛ ⎞= × ± =⎜ ⎟⎝ ⎠
Mx MyxV+
= =
-2Be x= =

(2) After heightening
1) Design Condition
Design condition of Dam stability analysis is considered as shown in the table 2 below.
Table 2 Design condition of After heightening
Determinatimg Bulkhead Section Determinatimg Spillway section Fig 2 After heightening Bulkhead section
Bulkhead section Spillway sectionElevation of Top of Dam EL.m 365.160 -----Basic triangle Top Elevation EL.m 363.900 364.900Upstream Slope 1:n 0.030 -----Downstream Slope 1:n 0.730 0.780Upper surface of the downstream slope 1:n ----- -----Dam base elevation EL.m 337.600 337.600Crest width of non-overflow section m 2.900 -----Reservoir sediment level EL.m 338.500 ←Reservoir water level [ CCN ] EL.m 340.790 ← [ CCE ] EL.m 364.660 ← [ CCL ] EL.m 362.300 ←Downstream water level [ CCN ] EL.m 340.090 ← [ CCE ] EL.m 347.740 ← [ CCL ] EL.m 342.060 ←
Unit weight of concrete dams kN/m3 23.5 ←
Weight of sediment in the water kN/m3 8.5 ←
Unit weight of water kN/m3 10.0 ←
Seismic Coefficient: Horizontal (kh) --- 0.050 ←Seismic Coefficient: Vertical (kv) --- 0.030 ←Coefficient of earth pressure (Rankine coefficient of earth pressure) --- 0.40 ←Uplift pressure coefficient --- 1/3 ←Downstream cover thickness m ----- 1.83Concrete mat elevation (Top point) EL.m 342.500 -----Concrete mat length (Base point) m 1.000 -----Shear strength of foundation kN/m2 1,000.0 ←
Friction angle of foundation deg 38.00 ←Internal friction coefficient --- 0.78 ←

2) Stability Analysis of after heightening
[Bulkhead section] - CCN: Normal water
Resume of Acting Force and Moment[CCN : Normal water ]
--- V(kN) H(kN) X(m) Y(m) Me(kN.m) Mt(kN.m) RemarkDead load 6,384.34 13.201 84,276.48
Mat section 0.00 0.00W/O Dead Load 0.00 0.000 0.00
SeismicSeismic of matW/O Seismic 0.00 0.000 0.00
U/S Water weight 1.53 19.934 30.50D/S Water weight 22.63 19.360 438.12
U/S Water Pressure 50.88 1.063 54.09D/S Water Pressure -31.00 0.830 -25.73
Dynamic Water PressureEarth Pressure 0.10 19.957 2.00
Soil weight 1.38 0.300 0.41Uplift -520.43 10.132 -5,272.78Total 5,888.17 21.26 79,474.32 28.77
Control of Stability [CCN]- Barycentric position
79,445.55 13.502185,888.17
- Excentricity19.966 -3.519432174
21.3
- Safety factor due to Lifting6,408.60520.43 > 1.30 … -OK-
1.5- Safety factor due to overturning
79,474.3228.77 > 1.50 … -OK-
- Safety factor due to sliding 49V= 5,888.17 kN FSD-φ 1.50H= 21.26 kN FSD-c 3.00L= 19.966 m tanφ 0.78
> 1.0 … -OK-3
- Safety factor due to bearing power
5,888.17 6×3.50919.966 19.966
vertical stress of upstream = 605.913 kN/㎡ ≧ 0 kN/㎡ (Tensile force not occur) vertical stress of downstream = -16.079 kN/㎡ < 0 kN/㎡ (Tensile force occur) but downstream side -OK-
1,000.0*19.9663.00
3,061.85+6,655.33 =457.06421.26
5,888.17*0.78 =3,061.851.50
=6,655.33
=|-3.509 m|
×(1.0± )
- 13.492
=2,762.403
=13.492 m
=12.314VFSFU
Σ= =Σ
MeFSTMt
Σ= =Σ
tanc
V c lFSD FSD
FSDH
φ
φΣ ⋅ ⋅+
= =Σ
tanVFSDφ
φΣ ⋅=
c
c lFSD⋅
=
61V eqB B
×⎛ ⎞= × ± =⎜ ⎟⎝ ⎠
Mx MyxV+
= =
-2Be x= =

- CCE: Maximum flood water
Resume of Acting Force and Moment[CCE : Maximum Flood water ]
--- V(kN) H(kN) X(m) Y(m) Me(kN.m) Mt(kN.m) RemarkDead load 6,384.34 13.201 84,276.48
Mat section 0.00 0.00W/O Dead Load 0.00 0.000 0.00
Seismic 0.00 0.00Seismic of mat 0.00 0.00W/O Seismic 0.00 0.000 0.00
U/S Water weight 109.50 19.697 2,156.77D/S Water weight 375.29 17.498 6,566.82
U/S Water Pressure 3,661.22 9.020 33,024.20D/S Water Pressure -514.10 3.380 -1,737.66
Dynamic Water Pressure 0.00Earth Pressure 0.10 19.957 2.00
Soil weight 1.38 0.300 0.41Uplift -2,587.53 10.707 -27,703.39Total 4,281.70 3,148.50 65,298.68 31,286.95
Control of Stability [CCE]- Barycentric position
34,011.73 22.557784,281.70
- Excentricity19.966 -12.57502612
21.1
- Safety factor due to Lifting6,869.232,587.53 > 1.10 … -OK-
1.2- Safety factor due to overturning
65,298.6831,286.95 > 1.20 … -OK-
- Safety factor due to sliding 50V= 4,281.70 kN FSD-φ 1.10H= 3,148.50 kN FSD-c 1.50L= 19.966 m tanφ 0.78
> 1.0 … -OK-2
- Safety factor due to bearing power
4,281.70 6×2.03919.966 19.966
vertical stress of upstream = 83.046 kN/㎡ ≧ 0 kN/㎡ (Tensile force not occur) vertical stress of downstream = 345.864 kN/㎡ ≧ 0 kN/㎡ (Tensile force not occur) -OK-
=13,310.671.50
3,036.11+13,310.67 =5.1923,148.50
=7.944 m
=2.655
=2.087
4,281.70*0.781.10
1,000.0*19.966
- 7.944 =|2.039 m|
×(1.0± )
=3,036.11
VFSFU
Σ= =Σ
MeFSTMt
Σ= =Σ
tan
c
V c lFSD FSD
FSDH
φ
φΣ ⋅ ⋅+
= =Σ
tanVFSDφ
φΣ ⋅=
c
c lFSD⋅
=
61V eqB B
×⎛ ⎞= × ± =⎜ ⎟⎝ ⎠
Mx MyxV+
= =
-2Be x= =

- CCL: Flood water + Seismic
Resume of Acting Force and Moment[CCL : Flood water + Seismic ]
--- V(kN) H(kN) X(m) Y(m) Me(kN.m) Mt(kN.m) RemarkDead load 6,384.34 13.201 84,276.48 0.00
Mat section 0.00 0.00W/O Dead Load 0.00 0.000 0.00 0.00
Seismic -191.53 319.22 13.201 9.346 -2,528.29 2,983.40 →
Seismic of mat 0.00 0.00 0.000 0.000 0.00 0.00 →W/O Seismic 0.00 0.00 →
U/S Water weight 91.51 19.719 1,804.44 0.00D/S Water weight 72.60 18.881 1,370.76 0.00
U/S Water Pressure 3,050.45 8.233 0.00 25,114.35D/S Water Pressure -99.46 1.487 0.00 -147.90
Dynamic Water Pressure 177.94 9.880 0.00 1,758.05Earth Pressure 0.10 19.957 2.00 0.00
Soil weight 1.38 0.300 0.00 0.41Uplift -1,563.96 11.416 -17,853.39 0.00Total 4,793.06 3,449.53 67,072.00 29,708.31
Control of Stability [CCL]- Barycentric position
37,363.69 20.191764,793.06
- Excentricity19.966 -10.2090085
21.1
- Safety factor due to Lifting6,357.021,563.96 > 1.10 … -OK-
1.1- Safety factor due to overturning
67,072.0029,708.31 > 1.10 … -OK-
- Safety factor due to sliding 51V= 4,793.06 kN FSD-φ 1.10H= 3,449.53 kN FSD-c 1.30L= 19.966 m tanφ 0.78
> 1.0 … -OK-1.5
- Safety factor due to bearing power
4,793.06 6×2.18819.966 19.966
vertical stress of upstream = 82.215 kN/㎡ ≧ 0 kN/㎡ (Tensile force not occur) vertical stress of downstream = 397.919 kN/㎡ ≧ 0 kN/㎡ (Tensile force not occur) -OK-
=15,358.461.30
3,398.72+15,358.46 =5.4383,449.53
=4.065
1,000.0*19.966
=|2.188 m|
=2.258
4,793.06*0.78 =3,398.721.10
- 7.795
=7.795 m
×(1.0± )
VFSFU
Σ= =Σ
MeFSTMt
Σ= =Σ
tan
c
V c lFSD FSD
FSDH
φ
φΣ ⋅ ⋅+
= =Σ
tanVFSDφ
φΣ ⋅=
c
c lFSD⋅
=
61V eqB B
×⎛ ⎞= × ± =⎜ ⎟⎝ ⎠
Mx MyxV+
= =
-2Be x= =

- CCC: Construction
Resume of Acting Force and Moment[CCC : Construction ]
--- V(kN) H(kN) X(m) Y(m) Me(kN.m) Mt(kN.m) RemarkDead load 6,384.34 13.201 84,276.48
Mat section 0.00 0.00W/O Dead Load 0.00 0.000 0.00
Seismic 0.00Seismic of matW/O Seismic 0.00
U/S Water weight 0.00D/S Water weight 0.00
U/S Water Pressure 0.00D/S Water Pressure 0.00
Dynamic Water Pressure 0.00Earth Pressure 0.00
Soil weight 0.00Uplift 0.00Total 6,384.34 0.00 84,276.48 0.00
Control of Stability [CCC]- Barycentric position
84,276.48 13.20056,384.34
- Excentricity19.966 -3.217749973
21.2
- Safety factor due to Lifting6,384.34
0.00 > 1.20 … -OK-1.3
- Safety factor due to overturning84,276.48
0.00 > 1.30 … -OK-
- Safety factor due to sliding 52V= 6,384.34 kN FSD-φ 1.30H= 0.00 kN FSD-c 2.00L= 19.966 m tanφ 0.78
> 1.0 … -OK-1.3
- Safety factor due to bearing power
6,384.34 6×3.21719.966 19.966
vertical stress of upstream = 628.911 kN/㎡ ≧ 0 kN/㎡ (Tensile force not occur) vertical stress of downstream = 10.627 kN/㎡ ≧ 0 kN/㎡ (Tensile force not occur) -OK-
=9,983.002.00
1.30
1,000.0*19.966
×(1.0± )
3,830.60+9,983.00 = ∞0.00
= ∞
= ∞
6,384.34*0.78
=|-3.217 m|- 13.200
=3,830.60
=13.200 m
VFSFU
Σ= =Σ
MeFSTMt
Σ= =Σ
tan
c
V c lFSD FSD
FSDH
φ
φΣ ⋅ ⋅+
= =Σ
tanVFSDφ
φΣ ⋅=
c
c lFSD⋅
=
61V eqB B
×⎛ ⎞= × ± =⎜ ⎟⎝ ⎠
Mx MyxV+
= =
-2Be x= =

[Spillway section]
- CCC: Construction
Resume of Acting Force and Moment[CCC : Construction ]
--- V(kN) H(kN) X(m) Y(m) Me(kN.m) Mt(kN.m) RemarkDead load 5,851.74 13.169 77,061.56Seismic 0.00 0.00
U/S Water pressure,weight 0.00 45.00 19.734 1.000 0.00 45.00D/S Water pressure,weight 0.00 0.00Dynamic Water Pressure 0.00 0.00
Earth Pressure 0.00 19.734 0.00 0.00Soil weight 1.38 0.300 0.00 0.41
Uplift -98.67 0.00 13.156 0.000 -1,298.10 0.00Total 5,753.07 46.38 75,763.46 45.41
傾斜角:0.00° 5,753.07 46.38
Control of Stability [CCC]- Barycentric position
75,718.05 13.161335,753.07
- Excentricity19.734 -3.294329516
1.2 2- Safety factor due to Lifting
5,851.741.3 98.67 > 1.20 … -OK-
- Safety factor due to overturning75,763.46
45.41 > 1.30 … -OK-- Safety factor due to sliding 55
V= 5,753.07 kN FSD-φ 1.30H= 46.38 kN FSD-c 2.00L= 19.734 m tanφ 0.78
> 1.0 … -OK-
- Safety factor due to bearing power
5,753.07 6×3.29419.734 19.734
vertical stress of upstream = 583.505 kN/㎡ ≧ 0 kN/㎡ (Tensile force not occur) vertical stress of downstream = -0.443 kN/㎡ < 0 kN/㎡ (Tensile force occur)
but downstream side -OK-
=9,867.002.00
3,451.84+9,867.00 =287.16846.38
=3,451.84
×(1.0± )
=|-3.294 m|
=13.161 m
- 13.161
=59.306
=1,668.431
5,753.07*0.781.30
1,000.0*19.734
VFSFU
Σ= =Σ
MeFSTMt
Σ= =Σ
tanc
V c lFSD FSD
FSDH
φ
φΣ ⋅ ⋅+
= =Σ
tanVFSDφ
φΣ ⋅=
c
c lFSD⋅
=
61V eqB B
×⎛ ⎞= × ± =⎜ ⎟⎝ ⎠
Mx MyxV+
= =
-2Be x= =

- CCN: Normal water
Resume of Acting Force and Moment[CCN : Normal water ]
--- V(kN) H(kN) X(m) Y(m) Me(kN.m) Mt(kN.m) RemarkDead load 993.39 11.287 11,212.39Seismic
U/S Water pressure,weight 0.00 31.05 21.294 1.730 0.00 53.72D/S Water pressure,weight 24.96 32.00 0.658 0.843 16.42 26.99Dynamic Water Pressure
Earth PressureSoil weight
Uplift -488.69 0.00 10.179 0.000 -4,974.15 0.00Total 529.66 63.05 6,254.66 80.71
傾斜角:0.00° 529.66 63.05
V(kN) U(kN) H(kN) Me(kN.m) Mt(kN.m)[CCC] 5,851.74 -98.67 46.38 75,763.46 45.41[CCN] 1,018.35 -488.69 63.05 6,254.66 80.71
6,870.09 -587.36 109.43 82,018.12 126.12
Control of Stability [CCN]- Barycentric position
6,173.95 11.65644529.66
- Safety factor due to Lifting21.294 -1.00943998
1.3 2- Safety factor due to Lifting
6,870.091.5 587.36 > 1.30 … -OK-
- Safety factor due to overturning82,018.12
126.12 > 1.50 … -OK-- Safety factor due to sliding 52
V= 6,282.73 kN FSD-φ 1.50H= 109.43 kN FSD-c 3.00L= 21.294 m tanφ 0.78
> 1.0 … -OK-
- Safety factor due to bearing power
529.66 6×1.00921.294 21.294
(Stress during to construction)vertical stress of upstream = 31.95 kN/㎡ + 583.51 kN/㎡ = 615.46 kN/㎡ ≧ 0 kN/㎡
Existing dam downstream part (-)= 18.83 kN/㎡ + -0.44 kN/㎡ = 18.39 kN/㎡ ≧ 0 kN/㎡ Existing dam downstream part (+)= (17.79-31.95)×19.734/21.294+31.95 = 18.83 kN/㎡ ≧ 0 kN/㎡
vertical stress of downstream = = 17.79 kN/㎡ ≧ 0 kN/㎡ -OK-
3,267.02+7,098.00109.43
=7,098.00
=94.714
=3,267.02
=|-1.009 m|
)× ( 1.0 ±
1,000.0*21.2943.00
=11.656 m
1.50
=11.697
- 11.656
=650.318
6,282.73*0.78
VFSFU
Σ= =Σ
MeFSTMt
Σ= =Σ
tan
c
V c lFSD FSD
FSDH
φ
φΣ ⋅ ⋅+
= =Σ
tanVFSDφ
φΣ ⋅=
c
c lFSD⋅
=
Mx MyxV+
= =
-2Be x= =
61V eqB B
×⎛ ⎞= × ± =⎜ ⎟⎝ ⎠

- CCE: Maximum flood water
Resume of Acting Force and Moment[CCE : Maximum Flood water ]
--- V(kN) H(kN) X(m) Y(m) Me(kN.m) Mt(kN.m) RemarkDead load 993.39 11.287 11,212.39Seismic
U/S Water pressure,weight 0.00 3,616.22 21.294 9.120 0.00 32,979.93D/S Water pressure,weight 401.00 514.10 2.636 3.380 1,057.19 1,737.65Dynamic Water Pressure
Earth PressureSoil weight
Uplift -2,661.03 0.00 11.297 0.000 -30,061.67 0.00Total -1,266.65 4,130.32 -17,792.09 34,717.58
傾斜角:0.00° -1,266.65 4,130.32
V(kN) U(kN) H(kN) Me(kN.m) Mt(kN.m)[CCC] 5,851.74 -98.67 46.38 75,763.46 45.41[CCE] 1,394.39 -2,661.03 4,130.32 -17,792.09 34,717.58
7,246.13 -2,759.70 4,176.70 57,971.37 34,762.99
Control of Stability [CCE]- Barycentric position
-52,509.67 41.45555-1,266.65
- Safety factor due to Lifting21.294 -30.8085481
1.1 2- Safety factor due to Lifting
7,246.131.2 2,759.70 > 1.10 … -OK-
- Safety factor due to overturning57,971.3734,762.99 > 1.20 … -OK-
- Safety factor due to sliding 53V= 4,486.42 kN FSD-φ 1.10H= 4,176.70 kN FSD-c 1.50L= 21.294 m tanφ 0.78
> 1.0 … -OK-
- Safety factor due to bearing power
-1,266.65 6×30.80921.294 21.294
(Stress during to construction)vertical stress of upstream = -575.88 kN/㎡ + 583.51 kN/㎡ = 7.63 kN/㎡ ≧ 0 kN/㎡
Existing dam downstream part (-)= 381.25 kN/㎡ + -0.44 kN/㎡ = 380.81 kN/㎡ ≧ 0 kN/㎡ Existing dam downstream part (+)= (456.91-575.88)×19.734/21.294-575.88 = 381.25 kN/㎡ ≧ 0 kN/㎡
vertical stress of downstream = = 456.91 kN/㎡ ≧ 0 kN/㎡ -OK-
=|-30.809 m|
=3,181.281.104,486.42*0.78
=41.456 m
- 41.456
=1.668
× ( 1.0 ±
=2.626
)
1,000.0*21.294 =14,196.001.50
3,181.28+14,196.00 =4.1614,176.70
VFSFU
Σ= =Σ
MeFSTMt
Σ= =Σ
tan
c
V c lFSD FSD
FSDH
φ
φΣ ⋅ ⋅+
= =Σ
tanVFSDφ
φΣ ⋅=
c
c lFSD⋅
=
Mx MyxV+
= =
-2Be x= =
61V eqB B
×⎛ ⎞= × ± =⎜ ⎟⎝ ⎠

- CCL: Flood water + Seismic
Resume of Acting Force and Moment[CCL : Flood water + Seismic ]
--- V(kN) H(kN) X(m) Y(m) Me(kN.m) Mt(kN.m) RemarkDead load 993.39 11.287 11,212.39Seismic -205.35 342.26 14.229 9.084 -2,921.93 3,109.09 →
U/S Water pressure,weight 0.00 3,005.45 21.294 8.340 0.00 25,065.45D/S Water pressure,weight 84.33 108.11 1.209 1.550 101.95 167.57Dynamic Water Pressure 0.00 177.94 21.294 9.880 0.00 1,758.05
Earth PressureSoil weight
Uplift -1,603.08 0.00 11.972 0.000 -19,191.84 0.00Total -730.71 3,633.76 -10,799.43 30,100.16
傾斜角:0.00° -730.71 3,633.76
V(kN) U(kN) H(kN) Me(kN.m) Mt(kN.m)[CCC] 5,851.74 -98.67 46.38 75,763.46 45.41[CCL] 872.37 -1,603.08 3,633.76 -10,799.43 30,100.16
6,724.11 -1,701.75 3,680.14 64,964.03 30,145.57
Control of Stability [CCL]- Barycentric position
-40,899.59 55.9724730.7
- Safety factor due to Lifting21.294 -45.32539671
1.1 2- Safety factor due to Lifting
6,724.111.1 1,701.75 > 1.10 … -OK-
- Safety factor due to overturning64,964.0330,145.57 > 1.10 … -OK-
- Safety factor due to sliding 54V= 5,022.36 kN FSD-φ 1.10H= 3,680.14 kN FSD-c 1.30L= 21.294 m tanφ 0.78
> 1.0 … -OK-
- Safety factor due to bearing power
-730.71 6×45.32521.294 21.294
(Stress during to construction)vertical stress of upstream = -472.51 kN/㎡ + 583.51 kN/㎡ = 111.00 kN/㎡ ≧ 0 kN/㎡
Existing dam downstream part (-)= 339.68 kN/㎡ + -0.44 kN/㎡ = 339.24 kN/㎡ ≧ 0 kN/㎡ Existing dam downstream part (+)= (403.88-472.51)×19.734/21.294-472.51 = 339.68 kN/㎡ ≧ 0 kN/㎡
vertical stress of downstream = = 403.88 kN/㎡ ≧ 0 kN/㎡ -OK-
× ( 1.0 ± )
=3.951
=-55.972 m
- 55.972 =|-45.325 m|
=2.155
3,561.31+16,380.00 =5.4193,680.14
5,022.36*0.78 =3,561.311.10
1,000.0*21.294 =16,380.001.30
VFSFU
Σ= =Σ
MeFSTMt
Σ= =Σ
tan
c
V c lFSD FSD
FSDH
φ
φΣ ⋅ ⋅+
= =Σ
tanVFSDφ
φΣ ⋅=
c
c lFSD⋅
=
Mx MyxV+
= =
-2Be x= =
61V eqB B
×⎛ ⎞= × ± =⎜ ⎟⎝ ⎠

APPENDIX-7 :
Stability Analysis of Sul dam

(1) Design condition
Design condition of Dam Spillway stability analysis is considered as shown in the table 1 below.
Table 1 Design condition of Existing
Fig 1 Typical section of Existing
Existing After heighteningElevation of Top of Dam EL.m 399.000 401.000Upstream Slope 1:n 0.030 ←Downstream Slope 1:n 1.100 ←Dam base elevation EL.m 383.800 383.800Reservoir sediment level EL.m 394.510 ←Reservoir water level [ CCN ] EL.m 383.800 ← [ CCE ] EL.m 406.000 408.000 [ CCL ] EL.m 399.000 401.000Unit weight of concrete dams kN/m3 23.5 ←
Weight of sediment in the water kN/m3 8.5 ←
Unit weight of water kN/m3 10.0 ←
Seismic Coefficient: Horizontal (kh) --- 0.050 ←Seismic Coefficient: Vertical (kv) --- 0.030 ←Coefficient of earth pressure (Rankine coefficient of earth pressure) --- 0.40 ←Uplift pressure coefficient --- 1/3 ←
Shear strength of foundation kN/m2 1,000.0 ←
Friction angle of foundation deg 38.00 ←Internal friction coefficient --- 0.78 ←

(2) Stability Analysis
1) Existing dam
- CCN: Normal water
Resume of Acting Force and Moment[CCN : Normal water ]
--- V(kN) H(kN) X(m) Y(m) Me(kN.m) Mt(kN.m) RemarkDead load 5,590.16 15.131 84,584.66 0.00Seismic 0.00 0.00
U/S Water Pressure 0.00 0.00Dynamic Water Pressure 0.00 0.00
Earth Pressure 401.46 3.570 0.00 1,433.23Uplift 0.00 0.00Total 5,590.16 401.46 84,584.66 1,433.23
Control of Stability [CCN]- Barycentric position
83,151.43 15.387385,590.16
- Excentricity24.590 -3.092384951
21.3
- Safety factor due to Lifting5,590.16
0.00 > 1.30 … -OK-1.5
- Safety factor due to overturning84,584.661,433.23 > 1.50 … -OK-
- Safety factor due to sliding 35V= 5,590.16 kN FSD-φ 1.50H= 401.46 kN FSD-c 3.00L= 24.590 m tanφ 0.78
> 1.0 … -OK-3
- Safety factor due to bearing power
5,590.16 6×2.58024.590 24.590
vertical stress of upstream = 370.447 kN/㎡ ≧ 0 kN/㎡ (Tensile force not occur) vertical stress of downstream = 84.222 kN/㎡ ≧ 0 kN/㎡ (Tensile force not occur) -OK-
=8,196.673.00
)
2,906.88+8,196.67 =27.658401.46
×(1.0±
1.50
1,000.0*24.590
=|-2.580 m|- 14.875
= ∞
=59.017
5,590.16*0.78 =2,906.88
=14.875 m
VFSFU
Σ= =Σ
MeFSTMt
Σ= =Σ
tan
c
V c lFSD FSD
FSDH
φ
φΣ ⋅ ⋅+
= =Σ
tanVFSDφ
φΣ ⋅=
c
c lFSD⋅
=
61V eqB B
×⎛ ⎞= × ± =⎜ ⎟⎝ ⎠
Mx MyxV+
= =
-2Be x= =
tanc
V c lFSD FSD
FSDH
φ
φΣ ⋅ ⋅+
= =Σ
Mx MyxV+
= =

- CCE: Maximum flood water
Resume of Acting Force and Moment[CCE : Maximum Flood water ]
--- V(kN) H(kN) X(m) Y(m) Me(kN.m) Mt(kN.m) RemarkDead load 5,590.16 15.131 84,584.66 0.00Seismic 0.00 0.00
U/S Water Pressure 2,219.20 6.281 0.00 13,939.41Dynamic Water Pressure 0.00 0.00
Earth Pressure 195.00 3.570 0.00 696.14Uplift -909.83 16.393 -14,915.15 0.00Total 4,680.33 2,414.20 69,669.51 14,635.55
Control of Stability [CCE]- Barycentric position
55,033.96 18.012654,680.33
- Excentricity24.590 -5.717645058
21.1
- Safety factor due to Lifting5,590.16909.83 > 1.10 … -OK-
1.2- Safety factor due to overturning
69,669.5114,635.55 > 1.20 … -OK-
- Safety factor due to sliding 36V= 4,680.33 kN FSD-φ 1.10H= 2,414.20 kN FSD-c 1.50L= 24.590 m tanφ 0.78
> 1.0 … -OK-2
- Safety factor due to bearing power
4,680.33 6×0.53624.590 24.590
vertical stress of upstream = 165.442 kN/㎡ ≧ 0 kN/㎡ (Tensile force not occur) vertical stress of downstream = 215.227 kN/㎡ ≧ 0 kN/㎡ (Tensile force not occur) -OK-
1,000.0*24.590 =16,393.331.50
3,318.78+16,393.33 =8.1652,414.20
=|0.536 m|
×(1.0± )
4,680.33*0.78 =3,318.781.10
=6.144
=4.760
=11.759 m
- 11.759
VFSFU
Σ= =Σ
MeFSTMt
Σ= =Σ
tan
c
V c lFSD FSD
FSDH
φ
φΣ ⋅ ⋅+
= =Σ
tanVFSDφ
φΣ ⋅=
c
c lFSD⋅
=
61V eqB B
×⎛ ⎞= × ± =⎜ ⎟⎝ ⎠
Mx MyxV+
= =
-2Be x= =

- CCL: Flood water + Seismic
Resume of Acting Force and Moment[CCL : Flood water + Seismic ]
--- V(kN) H(kN) X(m) Y(m) Me(kN.m) Mt(kN.m) RemarkDead load 5,590.16 15.131 84,584.66 0.00Seismic -167.70 279.51 15.131 5.732 -2,537.54 1,602.14
U/S Water Pressure 1,155.20 5.067 0.00 5,853.01Dynamic Water Pressure 67.39 6.080 0.00 409.71
Earth Pressure 195.00 3.570 0.00 696.14Uplift -622.95 16.393 -10,212.17 0.00Total 4,799.51 1,697.09 71,834.95 8,561.00
Control of Stability [CCL]- Barycentric position
63,273.95 16.750884,799.51
- Excentricity24.590 -4.455883202
21.1
- Safety factor due to Lifting5,422.45622.95 > 1.10 … -OK-
1.1- Safety factor due to overturning
71,834.958,561.00 > 1.10 … -OK-
- Safety factor due to sliding 37V= 4,799.51 kN FSD-φ 1.10H= 1,697.09 kN FSD-c 1.30L= 24.590 m tanφ 0.78
> 1.0 … -OK-
1.5ctor due to bearing power
4,799.51 6×0.88824.590 24.590
vertical stress of upstream = 237.472 kN/㎡ ≧ 0 kN/㎡ (Tensile force not occur) vertical stress of downstream = 152.891 kN/㎡ ≧ 0 kN/㎡ (Tensile force not occur) -OK-
=18,915.381.30
=3,403.291.10
3,403.29+18,915.38 =13.1511,697.09
=8.705
1,000.0*24.590
- 13.183 =|-0.888 m|
=8.391
=13.183 m
4,799.51*0.78
×(1.0± )
VFSFU
Σ= =Σ
MeFSTMt
Σ= =Σ
tan
c
V c lFSD FSD
FSDH
φ
φΣ ⋅ ⋅+
= =Σ
tanVFSDφ
φΣ ⋅=
c
c lFSD⋅
=
61V eqB B
×⎛ ⎞= × ± =⎜ ⎟⎝ ⎠
Mx MyxV+
= =
-2Be x= =
tanc
V c lFSD FSD
FSDH
φ
φΣ ⋅ ⋅+
= =Σ
Mx MyxV+
= =

2) After heightening of dam
- CCN: Normal water
Resume of Acting Force and Moment[CCN : Normal water ]
--- V(kN) H(kN) X(m) Y(m) Me(kN.m) Mt(kN.m) RemarkDead load 6,258.17 15.192 95,074.08 0.00Seismic 0.00 0.00
U/S Water Pressure 0.00 0.00Dynamic Water Pressure 0.00 0.00
Earth Pressure 401.46 3.570 0.00 1,433.23Uplift 0.00 0.00Total 6,258.17 401.46 95,074.08 1,433.23
Control of Stability [CCN]- Barycentric position
93,640.85 15.421026,258.17
- Excentricity24.590 -3.126017414
21.3
- Safety factor due to Lifting6,258.17
0.00 > 1.30 … -OK-1.5
- Safety factor due to overturning95,074.081,433.23 > 1.50 … -OK-
- Safety factor due to sliding 35V= 6,258.17 kN FSD-φ 1.50H= 401.46 kN FSD-c 3.00L= 24.590 m tanφ 0.78
> 1.0 … -OK-
3ctor due to bearing power
6,258.17 6×2.66824.590 24.590
vertical stress of upstream = 420.179 kN/㎡ ≧ 0 kN/㎡ (Tensile force not occur) vertical stress of downstream = 88.822 kN/㎡ ≧ 0 kN/㎡ (Tensile force not occur) -OK-
=3,254.25
=14.963 m
=|-2.668 m|- 14.963
= ∞
=66.336
6,258.17*0.78
×(1.0±
1.50
1,000.0*24.590
)
3,254.25+8,196.67 =28.523401.46
=8,196.673.00
VFSFU
Σ= =Σ
MeFSTMt
Σ= =Σ
tanc
V c lFSD FSD
FSDH
φ
φΣ ⋅ ⋅+
= =Σ
tanVFSDφ
φΣ ⋅=
c
c lFSD⋅
=
61V eqB B
×⎛ ⎞= × ± =⎜ ⎟⎝ ⎠
Mx MyxV+
= =
-2Be x= =
tan
c
V c lFSD FSD
FSDH
φ
φΣ ⋅ ⋅+
= =Σ
61V eqB B
×⎛ ⎞= × ± =⎜ ⎟⎝ ⎠
Mx MyxV+
= =
tanc
V c lFSD FSD
FSDH
φ
φΣ ⋅ ⋅+
= =Σ
Mx MyxV+
= =Mx Myx
V+
= =

- CCE: Maximum flood water
Resume of Acting Force and Moment[CCE : Maximum Flood water ]
--- V(kN) H(kN) X(m) Y(m) Me(kN.m) Mt(kN.m) RemarkDead load 6,258.17 15.192 95,074.08 0.00Seismic 0.00 0.00
U/S Water Pressure 2,683.20 7.020 0.00 18,835.15Dynamic Water Pressure 0.00 0.00
Earth Pressure 195.00 3.570 0.00 696.14Uplift -991.80 16.393 -16,258.85 0.00Total 5,266.37 2,878.20 78,815.23 19,531.29
Control of Stability [CCE]- Barycentric position
59,283.94 18.674445,266.37
- Excentricity24.590 -6.379438833
21.1
- Safety factor due to Lifting6,258.17991.80 > 1.10 … -OK-
1.2- Safety factor due to overturning
78,815.2319,531.29 > 1.20 … -OK-
- Safety factor due to sliding 36V= 5,266.37 kN FSD-φ 1.10H= 2,878.20 kN FSD-c 1.50L= 24.590 m tanφ 0.78
> 1.0 … -OK-
2ctor due to bearing power
5,266.37 6×1.03824.590 24.590
vertical stress of upstream = 159.924 kN/㎡ ≧ 0 kN/㎡ (Tensile force not occur) vertical stress of downstream = 268.410 kN/㎡ ≧ 0 kN/㎡ (Tensile force not occur) -OK-
=11.257 m
=6.310
×(1.0± )
- 11.257
5,266.37*0.78
=4.035
=3,734.34
=|1.038 m|
3,734.34+16,393.33 =6.9932,878.20
1.10
=16,393.331.501,000.0*24.590
VFSFU
Σ= =Σ
MeFSTMt
Σ= =Σ
tan
c
V c lFSD FSD
FSDH
φ
φΣ ⋅ ⋅+
= =Σ
tanVFSDφ
φΣ ⋅=
c
c lFSD⋅
=
61V eqB B
×⎛ ⎞= × ± =⎜ ⎟⎝ ⎠
Mx MyxV+
= =
-2Be x= =
tan
c
V c lFSD FSD
FSDH
φ
φΣ ⋅ ⋅+
= =Σ
61V eqB B
×⎛ ⎞= × ± =⎜ ⎟⎝ ⎠
Mx MyxV+
= =
tan
c
V c lFSD FSD
FSDH
φ
φΣ ⋅ ⋅+
= =Σ
Mx MyxV+
= =

- CCL: Flood water + Seismic
Resume of Acting Force and Moment[CCL : Flood water + Seismic ]
--- V(kN) H(kN) X(m) Y(m) Me(kN.m) Mt(kN.m) RemarkDead load 6,258.17 15.192 95,074.08 0.00Seismic -187.75 312.91 15.192 6.462 -2,852.22 2,022.01
U/S Water Pressure 1,479.20 5.733 0.00 8,480.75Dynamic Water Pressure 86.29 6.880 0.00 593.65
Earth Pressure 195.00 3.570 0.00 696.14Uplift -704.91 16.393 -11,555.88 0.00Total 5,365.51 2,073.39 80,665.98 11,792.55
Control of Stability [CCL]- Barycentric position
68,873.43 17.232015,365.51
- Excentricity24.590 -4.937014252
21.1
- Safety factor due to Lifting6,070.42704.91 > 1.10 … -OK-
1.1- Safety factor due to overturning
80,665.9811,792.55 > 1.10 … -OK-
- Safety factor due to sliding 37V= 5,365.51 kN FSD-φ 1.10H= 2,073.39 kN FSD-c 1.30L= 24.590 m tanφ 0.78
> 1.0 … -OK-
1.5ctor due to bearing power
5,365.51 6×0.54124.590 24.590
vertical stress of upstream = 247.002 kN/㎡ ≧ 0 kN/㎡ (Tensile force not occur) vertical stress of downstream = 189.396 kN/㎡ ≧ 0 kN/㎡ (Tensile force not occur) -OK-
×(1.0± )
=12.836 m
5,365.51*0.78 =3,804.631.10
- 12.836 =|-0.541 m|
=6.840
=8.612
1,000.0*24.590
=10.9582,073.39
1.30
3,804.63+18,915.38
=18,915.38
VFSFU
Σ= =Σ
MeFSTMt
Σ= =Σ
tan
c
V c lFSD FSD
FSDH
φ
φΣ ⋅ ⋅+
= =Σ
tanVFSDφ
φΣ ⋅=
c
c lFSD⋅
=
61V eqB B
×⎛ ⎞= × ± =⎜ ⎟⎝ ⎠
Mx MyxV+
= =
-2Be x= =
tan
c
V c lFSD FSD
FSDH
φ
φΣ ⋅ ⋅+
= =Σ
61V eqB B
×⎛ ⎞= × ± =⎜ ⎟⎝ ⎠
Mx MyxV+
= =
tan
c
V c lFSD FSD
FSDH
φ
φΣ ⋅ ⋅+
= =Σ
Mx MyxV+
= =Mx Myx
V+
= =

Supporting Report (H)
Economic Evaluation

i
PREPARATORY SURVEY FOR
THE PROJECT ON DISASTER PREVENTION AND
MITIGATION MEASURES FOR THE ITAJAI RIVER BASIN
FINAL REPORT
VOLUME III : SUPPORTING REPORT ANNEX H: ECONOMIC EVALUATION
Table of Contents
Page
CHAPTER 1 METHODOLOGY OF ECONOMIC & FINANCIAL EVALUATION 1.1 Evaluation Criteria ........................................................................................................ H-1 1.2 Tax ................................................................................................................................. H-1 1.3 Conversion Rate (Economic Evaluation) ...................................................................... H-2 1.4 Discount Rate ................................................................................................................ H-3
CHAPTER 2 ECONOMIC & FINANCIAL EVALUATION FOR MASTER PLAN
2.1 Cost ............................................................................................................................... H-4 2.1.1 Cost in a Market Price ................................................................................... H-4 2.1.2 Economic Cost – Economic Values ............................................................... H-5
2.2 Benefit ........................................................................................................................... H-5 2.2.1 Accounting Method of Benefit ...................................................................... H-5 2.2.2 Benefit at market price ................................................................................... H-7 2.2.3 Economic Benefit .......................................................................................... H-9
2.3 Financial and Economical Evaluation ......................................................................... H-11 2.3.1 Financial Evaluation .................................................................................... H-11 2.3.2 Economic Evaluation ................................................................................... H-16 2.3.3 Total evaluation ............................................................................................ H-20
CHAPTER 3 FEASIBILITY STUDY PROJECT EVALUATION 3.1 Methodology of Economic Evaluation ....................................................................... H-21 3.2 Cost and Benefit .......................................................................................................... H-21
3.2.1 Cost .............................................................................................................. H-21 3.2.2 Benefit .......................................................................................................... H-22
3.3 Project Evaluation ....................................................................................................... H-28 3.3.1 Cash Flow .................................................................................................... H-28 3.3.2 Results of Evaluation ................................................................................... H-39
3.4 Total Evaluation .......................................................................................................... H-29

ii
Table
Page
Table 1.2.1 Rate of Tax ......................................................................................................... H-1 Table 1.3.1 Applied Tax rate in a Construction works ........................................................... H-2 Table 1.4.1 Tax of CDI & TJLP ............................................................................................. H-3 Table 1.4.2 Discount Rare ...................................................................................................... H-3 Table 2.1.1 Cost for each return period .................................................................................. H-4 Table 2.1.2 Annual Cost for Return Period ............................................................................ H-4 Table 2.1.3 Maintenance Cost (R$ Thousand) ....................................................................... H-5 Table 2.2.4 Application of annual cost in economic price ..................................................... H-5 Table 2.1.5 Estimated Operational Cost (R$ Thousand) ........................................................ H-5 Table 2.2.1 Emergencies Expenses and reconstruction cost (R$ millions) ............................ H-7 Table 2.2.2 Estimated economic loss values in a Agricultural sector (R$ thousand) ............. H-7 Table 2.2.3 Economic Loss (R$ thousand) ............................................................................. H-7 Table 2.2.4 Economic Loss by Flood (Unit; R$ millions) ...................................................... H-8 Table 2.2.5 Estimation of Economic Loss (R$ millions) ....................................................... H-8 Table 2.2.6 Expected Annual values by Mitigation of Economic Loss (unit;
R$ millions) ......................................................................................................... H-8 Table 2.2.7 Emergencies Expenses and Reconstruction Cost in a Implementation of
measure for possible flood (Unit; R$ millions) ................................................... H-9 Tables2.2.8 Estimated Economic loss without tax and without compensation
(R$ millions) ........................................................................................................ H-9 Table 2.2.9 Expected Annual values of the Mitigation measure of Economic loss (unit:
R$ millions) ......................................................................................................... H-9 Table 2.2.10 Emergencies Expenses and Reconstruction Cost in a Implementation of
measure for possible flood (Unit; R$ millions) ................................................. H-10 Table 2.3.1 Cash flow (5 years safety level Plan) ................................................................ H-11 Table 2.3.2 Cash flow (10 years safety level Plan) .............................................................. H-12 Table 2.3.3 Cash flow (25 years safety level Plan) .............................................................. H-13 Table 2.3.4 Cash flow (50 years safety level Plan) .............................................................. H-14 Table 2.3.5 Results of Financial Evaluation ......................................................................... H-15 Table 2.3.6 Cash flow at economic price (5 years safety level Plan) ................................... H-16 Table 2.3.7 Cash flow at economic price (10 years safety level Plan) ................................. H-17 Table 2.3.8 Cash flow at economic price (25 years safety level Plan) ................................. H-18 Table 2.3.9 Cash flow at economic price (50 years safety level Plan) ................................. H-19 Table 2.3.10 Results of the Economic Evaluation .................................................................. H-20 Table 3.1.1 Evaluated Project ............................................................................................... H-21 Table 3.2.1 Proposed Project Cost ........................................................................................ H-21 Table 3.2.2 Expected Impact of the Project .......................................................................... H-22 Table 3.2.3 Benefit by flood mitigation measure ................................................................. H-24 Table 3.2.4 Benefit by Installation of Flood Gate at Itajaí City ........................................... H-26 Table 3.2.5 Benefit by Economic Loss of Itajaí City ........................................................... H-26

iii
Table3.2.6 Benefit of the Structure measure of landslide .................................................... H-26 Table 3.2.7 Disaster in Human resources by the Disaster November 2008 ......................... H-27 Table 3.2.8 Project Benefit ................................................................................................... H-27 Table 3.3.1 Cash flow of FS Project ..................................................................................... H-28 Table 3.3.2 Results of Evaluation ......................................................................................... H-29
Figure
Figure 2.2.1 Concept of loss in a Disaster ............................................................................... H-6 Figure 3.2.1 Present situation of flood damage of Taio city ................................................. H -23 Figure 3.2.2 Present situation of Flood damage at Timbo City ............................................ H -23 Figure 3.2.3 Present Situation of Flood Damage at Rio do Sul City .................................... H -24 Figure 3.2.4 Present situation of Flood damage and impact of project at Itajai City ............ H -25

Preparatory Survey for the Project on Disaster Prevention and Final Report Mitigation Measures for the Itajai River Basin Supporting Report Annex H
Nippon Koei Co., Ltd. November 2011 H - 1
CHAPTER 1 METHODOLOGY OF ECONOMIC EVALUATION 1.1 Evaluation Criteria
In economical and financial evaluations, the followings criteria were applied;
Applied price for the cost and benefit estimation is of a base of year 2010.
The evaluation will be made for whole program for each return period of 5, 10, 25 and 50 years.
The evaluation period is of 50 years.
The evaluations will be carried out as a total program of the mitigation measure for disasters of flood, flashflood and prevention / alert / alarm.
The evaluation will be carried out the financial and economical point of view. In the financial evaluation, the market price will be applied and for the economical evaluation, the discounted price excluded the taxes and the compensations fees, will be applied.
In an evaluation, the concept of the Net Present Value (NPV), Internal Rate of Return (IRR), and Benefit/Cost Ratio (B/C) will be used.
As a discount rate for the estimation of NPV and B/C, the commonly used rate of 12%, rate calculated from the Certificate of Interbanking Deposit’s Rate and the rate of the long term Interest (TJLP) in last 9 years will be utilized.
The estimated benefit values for each safety level will be calculated by statistic method, on the basis of the registered disaster’s damages value published by the State Government. The medium annual benefit will be considered multiplying the probabilities of each inundation and the damages caused by each safety level. Besides this, also, the benefit from land valorizations with improvement of safety level will be possible. However, this kind of benefit, in this evaluation, will not be considered.
The values used as bases of damages estimation for each safety level were of flood damages registered at October, 2001 and November, 2008.
The flood at October, 2001 was considered equivalent to the one of 7 years Safety level, and the flood of November, 2008 was considered as of 50 years of Safety level.
1.2 Tax
The taxes included in a cost are as followings items;
Table 1.2.1 Rate of Tax Tax Tax objective Rate Federal Tax Physical Person Income Tax IRPF. Percentage for each salary 7.5%、15%、22%、27,5%
Judicial Person Income Tax IRPJ. Companies Profit 15% / 25%
Industries Product Tax (IPI)
Charged for the industrialized products, national and foreigners. The field of incidence of the tax includes all of the products with index allocation, although, it reduce to zero, observed the dispositions contained in the
Related in the Table of Incidence of IPI (TIPI)
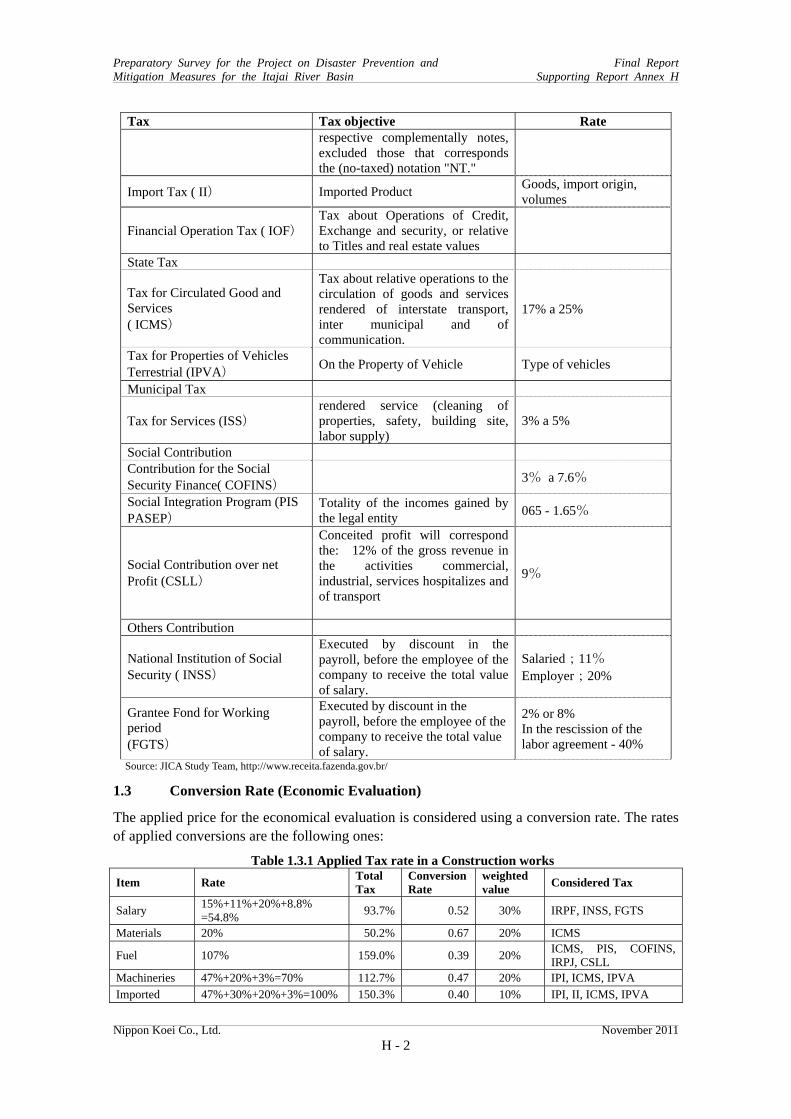
Preparatory Survey for the Project on Disaster Prevention and Final Report Mitigation Measures for the Itajai River Basin Supporting Report Annex H
Nippon Koei Co., Ltd. November 2011 H - 2
Tax Tax objective Rate respective complementally notes, excluded those that corresponds the (no-taxed) notation "NT."
Import Tax ( II) Imported Product Goods, import origin, volumes
Financial Operation Tax ( IOF) Tax about Operations of Credit, Exchange and security, or relative to Titles and real estate values
State Tax
Tax for Circulated Good and Services ( ICMS)
Tax about relative operations to the circulation of goods and services rendered of interstate transport, inter municipal and of communication.
17% a 25%
Tax for Properties of Vehicles Terrestrial (IPVA) On the Property of Vehicle Type of vehicles
Municipal Tax
Tax for Services (ISS) rendered service (cleaning of properties, safety, building site, labor supply)
3% a 5%
Social Contribution Contribution for the Social Security Finance( COFINS) 3% a 7.6%
Social Integration Program (PIS PASEP)
Totality of the incomes gained by the legal entity 065 - 1.65%
Social Contribution over net Profit (CSLL)
Conceited profit will correspond the: 12% of the gross revenue in the activities commercial, industrial, services hospitalizes and of transport
9%
Others Contribution
National Institution of Social Security ( INSS)
Executed by discount in the payroll, before the employee of the company to receive the total value of salary.
Salaried;11% Employer;20%
Grantee Fond for Working period (FGTS)
Executed by discount in the payroll, before the employee of the company to receive the total value of salary.
2% or 8% In the rescission of the labor agreement - 40%
Source: JICA Study Team, http://www.receita.fazenda.gov.br/
1.3 Conversion Rate (Economic Evaluation)
The applied price for the economical evaluation is considered using a conversion rate. The rates of applied conversions are the following ones:
Table 1.3.1 Applied Tax rate in a Construction works Item Rate Total
TaxConversion Rate
weighted value Considered Tax
Salary 15%+11%+20%+8.8% =54.8% 93.7% 0.52 30% IRPF, INSS, FGTS
Materials 20% 50.2% 0.67 20% ICMS
Fuel 107% 159.0% 0.39 20% ICMS, PIS, COFINS, IRPJ, CSLL
Machineries 47%+20%+3%=70% 112.7% 0.47 20% IPI, ICMS, IPVA Imported 47%+30%+20%+3%=100% 150.3% 0.40 10% IPI, II, ICMS, IPVA

Preparatory Survey for the Project on Disaster Prevention and Final Report Mitigation Measures for the Itajai River Basin Supporting Report Annex H
Nippon Koei Co., Ltd. November 2011 H - 3
Machineries Administration
1.5%+5%+7.6%+1.65%+9%+0.38% =25.13% IRPJ, ISS, COFINS,
CSLL, PIS Weighted 0.50
Source: JICA Study Team
According to the table above, the taxation of taxes in the works can be estimated in 50%. In this study, the conversion rate for the estimation of economical price, the conversion value of 0.5 is used.
1.4 Discount Rate
The discount rate applied for the financial evaluation is considered the rate of Certificate of Inerbanking Deposit (CDI) and for the economical evaluation, the Tax of Interest the Long term was considered. The annual medium taxes of the considered respective years are the following ones:
Table 1.4.1 Tax of CDI & TJLP Year CDI TJLP
2009 9.88% 6.00% 2008 12.38% 6.00% 2007 11.81% 6.50% 2006 15.04% 9.00% - 6.85% 2005 19.00% 9.75% 2004 16.16% 10.00% - 9.75% 2003 23.26% 11.00%- 12.00% 2002 19.10% 9.50% - 10.00% 2001 17.27% 9.25% - 10.00%
Source: Dados de BACEN http://www.portalbrasil.net/indices_cdi.htm
On the base of the indicated rate above, the discounts rate used are the following ones
Table 1.4.2 Discount Rate
Financial Evaluation Economical Evaluation
Discount rate (1) 10.0 % 6.0% Discount rate (2) 23.0 % 12.0 %
Referred Discount Rate 12.0 % 12.0 %
Source: JICA Study Team
The discount rate (1) is the value when the economy of Brazil is stable. The discount rate (2) is the value for the economy of Brazil is in situation of high interest rate.

Preparatory Survey for the Project on Disaster Prevention and Final Report Mitigation Measures for the Itajai River Basin Supporting Report Annex H
Nippon Koei Co., Ltd. November 2011 H - 4
CHAPTER 2 ECONOMIC & FINANCIAL EVALUATION FOR MASTER PLAN
2.1 Cost
The measures required for the mitigations of the disasters are the following ones:
Table 2.1.1 Cost for each return period 5 year 10 year 25 year 50 year
Floo
d M
itiga
tion
Mea
sure
Direct Cost 99,000 155,000 399,000 831,000 Land Compensation 72,000 296,000 435,000 779,000 Engineering 7,000 12,000 37,000 80,000 Administration 3,000 10,000 20,000 41,000 Physical Contingency 14,000 43,000 86,000 170,000 Price Escalation 8,000 24,000 47,000 94,000 Subtotal 202,000 541,000 1,025,000 1,996,000
Land
Slid
e M
itiga
tions
M
easu
res
Direct Cost 42,000 42,000 42,000 42,000 Engineering 4,200 4,200 4,200 4,200 Administration 1,500 1,500 1,500 1,500 Physical Contingency 4,200 4,200 4,200 4,200 Price Escalation 2,100 2,100 2,100 2,100 Subtotal 54,000 54,000 54,000 54,000
Floo
d Pr
even
tion
and
Ale
rt
Equipment 2,400 2,400 2,400 2,400 Inventory Study 900 900 900 900 Training 300 300 300 300 Engendering 400 400 400 400 Subtotal 4,000 4,000 4,000 4,000
Land
Sl
ide
Prev
enti
on a
nd Installation and Equipments 2,300 2,300 2,300 2.300
Program 1,700 1,700 1,700 1.700 Subtotal 4,000 4,000 4,000 4.000
Total 264.000 603,000 1,087,000 2,058,000 Source: JICA Study Team
2.1.1 Cost in a Market Price
(1) Cost for each return period
As presupposition for the evaluation, the following financial schedule was applied for each Return period.
The annual Cost for each Return period is considered the following ones;
Table 2.1.2 Annual Cost for Return Period TR Total cost 1st year 2nd year 3 rd year 4th year 5tj year
5 year 264,000 88,000 88,000 88,000 10 year 603,000 201,000 201,000 201,000 25 year 1,087,000 271,750 271,750 271,750 271,750
50 year 2,058,000 411,600 411,600 411,600 411,600 411,600 Source: JICA Study Team

Preparatory Survey for the Project on Disaster Prevention and Final Report Mitigation Measures for the Itajai River Basin Supporting Report Annex H
Nippon Koei Co., Ltd. November 2011 H - 5
(2) Maintenance Cost
The maintenance cost for Return period is considered 5% of the total construction cost;
Table 2.1.3 Maintenance Cost (R$ Thousand) Total Cost Maintenance Cost
5 year 264,000 13,200 10 year 603,000 30,200 25 year 1,087,000 54,400 50 year 2,058,000 102,900
Source: JICA Study Team
2.1.2 Economic Cost – Economic Values
(1) Economic cost for each return period
The economic cost to be applied for the economical evaluation is considered discounting the taxes and the lands compensations cost of the works at market prices. The schedule of cost application is considered in the following;
Table 2.2.4 Application of annual cost in economic price Total de
Works 1st year 2nd year 3rd year 4th year 5th year
5 year 91,000 30,333 30,333 30,333 10 year 141,000 47,000 47,000 47,000 25 year 303,000 75,750 75,750 75,750 75,750 50 year 594,000 118,800 118,800 118,800 118,800 118,800
Source: JICA Study Team
(2) Maintenance cost
The maintenance cost is considered 5% of the total construction cost;
Table 2.1.5 Estimated Operational Cost (R$ Thousand) Total Cost Operational Cost
5 year 91,000 4,600 10 year 141,000 7,100 25 year 303,000 15,200 50 year 594,000 29,700
Source: JICA Study Team
2.2 Benefit
2.2.1 Accounting Method of Benefit
In this Study, as a benefit, the estimated damages that will be caused by disasters for each return period as the effect of the adopted measures are considered. The damages caused by the disasters are considered the following ones:

Preparatory Survey for the Project on Disaster Prevention and Final Report Mitigation Measures for the Itajai River Basin Supporting Report Annex H
Nippon Koei Co., Ltd. November 2011 H - 6
Total Losses
Losse ofSocial Capital
Expense ofEmergencyActivities
EconomicActivityLosses
SocialActivityLosses
Damage toAccumlatedProperties
Damage toInventry &Products
OpportunityLosses
Damage to House
Damage toInfrastructure
Agriculture Industry Services
Irrigation, Pump,Other Structure
Factory,Equipment,Installation
Store, Funiture,Installation
Products (Crop)Under Cultivation
Raw Materials &Products
Good & RawMaterials
Expected Profitfrom Products
Expected Profitfrom Products
Expected Profitfrom Services
Oportunity Losses of Production Activity/Business ActivityDuring period of Suspension
Residence & House Holds Effects
Social InfrastrutureSchool, Hospital, Clinic Church, Public Oofice & Hall
Physical Infrastruture, Road, Water Supply, Electricity, Telehone,Port, Park, River Structure
Evacuation of Flood Victims
Relief Activity of Food & Medical services
Reinforcement of Public Hygiene
Reinforcement of Crime Prevention
Damageable Properties & Activities
Source: JICA Study Team
Figure 2.2.1 Concept of loss in a Disaster
The mentioned losses will be minimized by the implementation of the measures for inundations. With this concept, the benefits of the measures were considered, classified as
Emergency Expenses
Cost of Works of Reconstructions
Losses in the Economical Activities (Agricultural section, Trade, Industry and Transport)
Besides the listed benefits, the possibility of land valorization exists with the improvement of safety's degree, however, this valorization was not considered.
The human damages by death and wounded, were not considered as a benefit, due to the accountancy difficulties.
The emergencies expenses are those applied in the public calamities, rescue, expenses with shelters, health, feeding, etc.
The expenses of the reconstructions are those expenses with the works of reconstructions in the affected areas for the catastrophe, as ports, highways, electrification, sanitation, school, hospital, etc.
The economical losses were estimated for the differences among the normality time and with disaster. The items considered to estimate the economical loss were of agricultural production, service and transport. The economical losses in the agricultural production were estimated for

Preparatory Survey for the Project on Disaster Prevention and Final Report Mitigation Measures for the Itajai River Basin Supporting Report Annex H
Nippon Koei Co., Ltd. November 2011 H - 7
lost cereals for the disaster. The economical losses in the industry, transport and services were estimated with base in the data of ICMS.
The details of the estimates of economical losses are suitable in the section 3.4. For the benefits, for each Return period, the inundation of the October of 2001 was used as equivalent to 7 years of Return period and the inundation of November of 2008, equivalent to 50 years of Return period.
2.2.2 Benefit at market price
(1) Emergencies Expenses and reconstruction cost
The expenses and the costs of reconstructions in the inundations of October of 2001 and of November of 2008 were the following ones:
Table2.2.1 Emergencies Expenses and reconstruction cost (R$ millions) Flood at 2001 (1) Flood at 2008 (2)
Emergencies Expenses 12.6 656.5 Reconstruction Cost 2,065.8
Total 2001/2008 Conversion Rate 2.78 1
Values at year 2008 34.9 2,065.8 Source: (1) Plano de Recursos Hídricos da Bacia Hidrográfica do Rio Itajaí 2010, elaborado pela JICA Study Team
(2) Relatório “Reconstrução das Áreas Afetadas Catástrofe Novembro/2008” Gov. SC novembro de 2009.
The estimated value of the agricultural section was calculated with base in the data of production of rice. The estimated values in time of normality and time of disaster:
Table 2.2.2 Estimated economic loss values in a Agricultural sector (R$ thousand) Flood 2001 Flood 2008 2000 2001 2002 2008 2009 Difference Blumenau 67 68 67 140 140 0 Brusque 95 202 293 630 630 0 Gaspar 6,912 7,168 7,654 13,940 8,500 (5,440) Ilhota 3,640 3,120 6,119 13,312 5,857 (7,455) Itajaí 3,360 4,742 5,824 9,660 6,048 (3,612)Subtotal of 5 municipalities 14,074 15,300 19,957 37,682 21,175 (16,507)
Medium of 2000 & 2002 17,016 Estimated loss (1,716) (16,507)Values 2009 (4,770) (16,507)
Source: JICA Study Team
(3) Economical loss in Services and Transports
The economical losses in the services and transports were estimated using the data of variations of ICMS.
Table 2.2.3 Economic Loss (R$ thousand) Flood of year 2001 Flood of year 2008 2000 2001 2002 Real Without flood Blumenau 178,604 173,034 185,664 292,980 451,285 Brusque 44,489 42,867 44,276 90,124 140,728 Ilhota 313 424 442 476 1,132 Itajaí 62,180 76,397 164,634 366,299 575,301 Subtotal of 4 cities 301,955 309,209 410,748 749,880 1,168,447 Mediums of 2000 & 2002 356,352 Economic Loss (23,789) (418,567) Price in 2009 (66,135)
Source: JICA Study Team

Preparatory Survey for the Project on Disaster Prevention and Final Report Mitigation Measures for the Itajai River Basin Supporting Report Annex H
Nippon Koei Co., Ltd. November 2011 H - 8
(4) Estimated Economic Loss
The economical losses considered by the inundations of October of 2001 (Return period 7 years) and of November of 2008 (Return period 50 years) can be estimate in accordance:
Table2.2.4 Economic Loss by Flood (Unit; R$ millions) Return Period
Emergencies Expenses &
Reconstruction Agriculture ICMS Service Total PIB Basin
7 year 34.9 4.4 66.1 661.3 700.7 34,110 50 year 2,722.3 19.5 418.0 4.180.0 6.921.8 34,110
Source: JICA Study Team
(5) Estimated Economic loss for each Return period
The estimates of the economical losses for each Return period are indicated the following:
Table 2.2.5 Estimation of Economic Loss (R$ millions)
Return Period
Emergencies Expenses & Reconstructi
on
Agriculture ICMS Service Total PIB Basin %
2 year 2.2 1.7 20.4 204.1 208.0 34,110.0 0.6%5 year 16.6 3.5 48.2 482.1 502.1 34,110.0 1.5%7 year 34.9 4.4 66.1 661.0 700.3 34,110.0 2.1%
10 year 76.9 5.8 92.4 923.7 1,006.4 34,110.0 3.0%25 year 585.9 11.6 218.2 2,181.8 2,779.3 34,110.0 8.1%50 year 2,721.8 19.5 418.0 4,180.4 6,921.7 34,110.0 20.3%
100 year 12,643.9 32.9 801.0 8,009.6 20,686.4 34,110.0 60.6%Source: JICA Study Team
(6) Expected Annual value of economical losses by the interventions for each Return period
The expected annual Value of the economical losses for the interventions for each Return period was esteemed considering the probabilities of occurrences for each Return period. The expected annual value of the economical losses is the following ones:
Table2.2.6 Expected Annual values by Mitigation of Economic Loss (unit; R$ millions) Return Period
Flood Economic Loss 5 year 10 year 25 year 50 year 100 year
2 208.0 67.8 62.9 61.0 60.1 59.7 5 502.1 75.4 69.9 67.9 66.9 66.4
10 1,006.4 73.6 71.4 70.4 69.9 25 2,779.3 81.3 80.1 79.5 50 6,921.7 100.7 100.0
100 20,686.4 150.1 Annual Expected Values of the
mitigation of Economic Loss 143.2 206.3 281.5 378.1 525.5
Source: JICA Study Team
(7) Annual value of emergencies expenses and cost of reconstructions in the implementations of the interventions for the possible inundations
The annual Value in emergencies expenses and cost of reconstructions in the implementations of the interventions for the possible inundations was esteemed considering the probabilities of occurrences of inundations for each Time of Return. The expected annual value of the emergencies expenses and cost of reconstructions the following ones:

Preparatory Survey for the Project on Disaster Prevention and Final Report Mitigation Measures for the Itajai River Basin Supporting Report Annex H
Nippon Koei Co., Ltd. November 2011 H - 9
Table 2.2.7 Emergencies Expenses and Reconstruction Cost in a Implementation of measure for possible flood (Unit; R$ millions)
Return Period
Emergencies Expenses &
Reconstruction5 year 10 year 25 year 50 year
1 0.0 2 2.2 5 16.6 2.2
10 76.9 5.4 5.4 25 585.9 16.9 16.9 16.9 50 2,721.8 39.6 39.6 39.6 39,6
Annual Expected Values of the mitigation of Economic Loss 64.1 61.9 56.5 39.6
Source: JICA Study Team
2.2.3 Economic Benefit
(1) Estimates of the Economical Losses for each Return Period(in economical value)
The Estimated value of the losses in economical value for each Return period was converted using the conversion factor above described (13.1). The economical losses for each Return period are considered the following ones:
Tables2.2.8 Estimated Economic loss without tax and without compensation (R$ millions) Return Period
Emergencies Expenses &
Reconstruction Agriculture ICMS Service Total PIB Basin %
Conversion Factor 0,5 0,8 1 0.5 0.8
2 year 0.0 0.0 0.0 0.0 0.0 27,288.0 0.0%5 year 1.1 1.4 20.4 102.0 104.5 27,288.0 0.4%7 year 8.3 2.8 48.2 241.0 252.1 27,288.0 0.9%
10 year 17.5 3.6 66.1 330.5 351.5 27,288.0 1.3%25 year 38.5 4.7 92.4 461.8 504.9 27,288.0 1.9%50 year 293.0 9.3 218.2 1,090.9 1,393.1 27,288.0 5.1%
100 year 1,360.9 15.6 418.0 2,090.2 3,466.7 27,288.0 12.7%Source: JICA Study Team
(2) Expected annual value of the mitigations of the economical losses for the interventions for each Return period (Price without tax and without compensation)
The value annual expectation of the mitigations of the economical losses for the interventions for each Return period was estimated considering the probabilities of occurrences for each Return period. The value annual expectation of the mitigations of the economical losses is the following:
Table 2.2.9 Expected Annual values of the Mitigation measure of Economic loss (unit: R$ millions)
Flood Economic Loss 5 year 10 year 25 year 50 year 100 year
2 104.5 34.1 31.6 30.7 30.2 30,0 5 252.1 37.9 35.1 34.1 33.6 33,3
10 504.9 36.9 35.8 35.3 35,0 25 1,393.1 40.7 40.1 39,8 50 3,466.7 50.4 50,1
100 16,675.0 121,0 Annual Expected Values of the
mitigation of Economic Loss 71.9 103.6 141.3 189.7 309.3
Source: JICA Study Team

Preparatory Survey for the Project on Disaster Prevention and Final Report Mitigation Measures for the Itajai River Basin Supporting Report Annex H
Nippon Koei Co., Ltd. November 2011 H - 10
(3) Annual value required for emergencies expenses and cost of reconstructions in the implementations of the interventions for possible inundations (without tax and without compensation)
The annual Value required for emergencies expenses and cost of reconstructions in the implementations of the interventions for the possible inundations was estimated considering the probabilities of occurrences of inundations for each Return period. The expected annual value of the expenses emergencies and cost of reconstructions the following ones:
Table 2.2.10 Emergencies Expenses and Reconstruction Cost in a Implementation of measure for possible flood
(Unit; R$ millions)
Emergencies Expenses &
Reconstruction 5 year 10 year 25 year 50 year
1 0.0 2 104.5 5 252.1 1.1
10 504.9 2.7 2.7 25 1,393.1 8.4 8.4 8.4 50 3,466.7 19.8 19.8 19.8 19,8
Annual Expected Values of the mitigation of Economic Loss 32.0 30.9 28.2 19.8
Source: JICA Study Team

Preparatory Survey for the Project on Disaster Prevention and Final Report Mitigation Measures for the Itajai River Basin Supporting Report Annex H
Nippon Koei Co., Ltd. November 2011 H - 11
2.3 Financial and Economical Evaluation
2.3.1 Financial Evaluation
(1) Cash Flow for 5 years safety level
The cash flow of the Master Plan for 5 years safety level is as follow;
Table 2.3.1 Cash flow (5 years safety level Plan) Unit (R$ million) Year Cost Maintenance
Cost Emergencies
Expense Benefit Balance
1 88.0 -88.0 2 88.0 -88.0 3 88.0 -88.0 4 13.2 37.7 143.2 92.3 5 13.2 37.7 143.2 92.3 6 13.2 37.7 -50.9 7 13.2 37.7 143.2 92.3 8 13.2 37.7 143.2 92.3 9 13.2 37.7 143.2 92.3
10 13.2 37.7 143.2 92.3 11 13.2 37.7 -50.9 12 13.2 37.7 143.2 92.3 13 13.2 37.7 143.2 92.3 14 13.2 37.7 143.2 92.3 15 13.2 37.7 143.2 92.3 16 13.2 37.7 -50.9 17 13.2 37.7 143.2 92.3 18 13.2 37.7 143.2 92.3 19 13.2 37.7 143.2 92.3 20 13.2 37.7 143.2 92.3 21 13.2 37.7 -50.9 22 13.2 37.7 143.2 92.3 23 13.2 37.7 143.2 92.3 24 13.2 37.7 143.2 92.3 25 13.2 37.7 143.2 92.3 26 13.2 37.7 -50.9 27 13.2 37.7 143.2 92.3 28 13.2 37.7 143.2 92.3 29 13.2 37.7 143.2 92.3 30 13.2 37.7 143.2 92.3 31 13.2 37.7 -50.9 32 13.2 37.7 143.2 92.3 33 13.2 37.7 143.2 92.3 34 13.2 37.7 143.2 92.3 35 13.2 37.7 143.2 92.3 36 13.2 37.7 -50.9 37 13.2 37.7 143.2 92.3 38 13.2 37.7 143.2 92.3 39 13.2 37.7 143.2 92.3 40 13.2 37.7 143.2 92.3 41 13.2 37.7 -50.9 42 13.2 37.7 143.2 92.3 43 13.2 37.7 143.2 92.3 44 13.2 37.7 143.2 92.3 45 13.2 37.7 143.2 92.3 46 13.2 37.7 -50.9 47 13.2 37.7 143.2 92.3 48 13.2 37.7 143.2 92.3 49 13.2 37.7 143.2 92.3 50 13.2 37.7 143.2 92.3
Source: JICA Study Team

Preparatory Survey for the Project on Disaster Prevention and Final Report Mitigation Measures for the Itajai River Basin Supporting Report Annex H
Nippon Koei Co., Ltd. November 2011 H - 12
(2) Cash Flow for 10 years safety level
The cash flow of the Master Plan for 10 years safety level is as follow;
Table 2.3.2 Cash flow (10 years safety level Plan) Unit (R$ million)
Year Cost Maintenance Cost
Emergencies Expense Benefit Balance
1 201.0 -201.0 2 201.0 -201.0 3 201.0 -201.0 4 30.2 36.4 206.3 176.2 5 30.2 36.4 206.3 176.2 6 30.2 36.4 206.3 176.2 7 30.2 36.4 206.3 176.2 8 30.2 36.4 206.3 176.2 9 30.2 36.4 206.3 176.2
10 30.2 36.4 206.3 176.2 11 30.2 36.4 -30.2 12 30.2 36.4 206.3 176.2 13 30.2 36.4 206.3 176.2 14 30.2 36.4 206.3 176.2 15 30.2 36.4 206.3 176.2 16 30.2 36.4 206.3 176.2 17 30.2 36.4 206.3 176.2 18 30.2 36.4 206.3 176.2 19 30.2 36.4 206.3 176.2 20 30.2 36.4 206.3 176.2 21 30.2 36.4 -30.2 22 30.2 36.4 206.3 176.2 23 30.2 36.4 206.3 176.2 24 30.2 36.4 206.3 176.2 25 30.2 36.4 206.3 176.2 26 30.2 36.4 206.3 176.2 27 30.2 36.4 206.3 176.2 28 30.2 36.4 206.3 176.2 29 30.2 36.4 206.3 176.2 30 30.2 36.4 206.3 176.2 31 30.2 36.4 -30.2 32 30.2 36.4 206.3 176.2 33 30.2 36.4 206.3 176.2 34 30.2 36.4 206.3 176.2 35 30.2 36.4 206.3 176.2 36 30.2 36.4 206.3 176.2 37 30.2 36.4 206.3 176.2 38 30.2 36.4 206.3 176.2 39 30.2 36.4 206.3 176.2 40 30.2 36.4 206.3 176.2 41 30.2 36.4 -30.2 42 30.2 36.4 206.3 176.2 43 30.2 36.4 206.3 176.2 44 30.2 36.4 206.3 176.2 45 30.2 36.4 206.3 176.2 46 30.2 36.4 206.3 176.2 47 30.2 36.4 206.3 176.2 48 30.2 36.4 206.3 176.2 49 30.2 36.4 206.3 176.2 50 30.2 36.4 206.3 176.2

Preparatory Survey for the Project on Disaster Prevention and Final Report Mitigation Measures for the Itajai River Basin Supporting Report Annex H
Nippon Koei Co., Ltd. November 2011 H - 13
(3) Cash Flow for 25 years safety level
The cash flow of the Master Plan for 25 years safety level is as follow;
Table 2.3.3 Cash flow (25 years safety level Plan) Unit (R$ million)
Year Cost Maintenance Cost
Emergencies Expense Benefit Balance
1 271.8 -271.8 2 271.8 -271.8 3 271.8 -271.8 4 271.8 30.2 36.4 206.3 -95.6 5 54.4 33.2 281.5 227.2 6 54.4 33.2 281.5 227.2 7 54.4 33.2 281.5 227.2 8 54.4 33.2 281.5 227.2 9 54.4 33.2 281.5 227.2
10 54.4 33.2 281.5 227.2 11 54.4 33.2 281.5 227.2 12 54.4 33.2 281.5 227.2 13 54.4 33.2 281.5 227.2 14 54.4 33.2 281.5 227.2 15 54.4 33.2 281.5 227.2 16 54.4 33.2 281.5 227.2 17 54.4 33.2 281.5 227.2 18 54.4 33.2 281.5 227.2 19 54.4 33.2 281.5 227.2 20 54.4 33.2 281.5 227.2 21 54.4 33.2 281.5 227.2 22 54.4 33.2 281.5 227.2 23 54.4 33.2 281.5 227.2 24 54.4 33.2 281.5 227.2 25 54.4 33.2 281.5 227.2 26 54.4 33.2 -54.4 27 54.4 33.2 281.5 227.2 28 54.4 33.2 281.5 227.2 29 54.4 33.2 281.5 227.2 30 54.4 33.2 281.5 227.2 31 54.4 33.2 281.5 227.2 32 54.4 33.2 281.5 227.2 33 54.4 33.2 281.5 227.2 34 54.4 33.2 281.5 227.2 35 54.4 33.2 281.5 227.2 36 54.4 33.2 281.5 227.2 37 54.4 33.2 281.5 227.2 38 54.4 33.2 281.5 227.2 39 54.4 33.2 281.5 227.2 40 54.4 33.2 281.5 227.2 41 54.4 33.2 281.5 227.2 42 54.4 33.2 281.5 227.2 43 54.4 33.2 281.5 227.2 44 54.4 33.2 281.5 227.2 45 54.4 33.2 281.5 227.2 46 54.4 33.2 281.5 227.2 47 54.4 33.2 281.5 227.2 48 54.4 33.2 281.5 227.2 49 54.4 33.2 281.5 227.2 50 54.4 33.2 281.5 227.2

Preparatory Survey for the Project on Disaster Prevention and Final Report Mitigation Measures for the Itajai River Basin Supporting Report Annex H
Nippon Koei Co., Ltd. November 2011 H - 14
(4) Cash Flow for 50 years safety level
The cash flow of the Master Plan for 50 years safety level is as follow;
Table 2.3.4 Cash flow (50 years safety level Plan) Unit (R$ million)
Year Cost Maintenance Cost
Emergencies Expense Benefit Balance
1 411.6 -411.6 2 411.6 -411.6 3 411.6 -411.6 4 411.6 30.2 36.4 206.3 -235.4 5 411.6 54.4 33.2 281.5 -184.4 6 102.9 23.3 378.1 275.2 7 102.9 23.3 378.1 275.2 8 102.9 23.3 378.1 275.2 9 102.9 23.3 378.1 275.2
10 102.9 23.3 378.1 275.2 11 102.9 23.3 378.1 275.2 12 102.9 23.3 378.1 275.2 13 102.9 23.3 378.1 275.2 14 102.9 23.3 378.1 275.2 15 102.9 23.3 378.1 275.2 16 102.9 23.3 378.1 275.2 17 102.9 23.3 378.1 275.2 18 102.9 23.3 378.1 275.2 19 102.9 23.3 378.1 275.2 20 102.9 23.3 378.1 275.2 21 102.9 23.3 378.1 275.2 22 102.9 23.3 378.1 275.2 23 102.9 23.3 378.1 275.2 24 102.9 23.3 378.1 275.2 25 102.9 23.3 378.1 275.2 26 102.9 23.3 378.1 275.2 27 102.9 23.3 378.1 275.2 28 102.9 23.3 378.1 275.2 29 102.9 23.3 378.1 275.2 30 102.9 23.3 378.1 275.2 31 102.9 23.3 378.1 275.2 32 102.9 23.3 378.1 275.2 33 102.9 23.3 378.1 275.2 34 102.9 23.3 378.1 275.2 35 102.9 23.3 378.1 275.2 36 102.9 23.3 378.1 275.2 37 102.9 23.3 378.1 275.2 38 102.9 23.3 378.1 275.2 39 102.9 23.3 378.1 275.2 40 102.9 23.3 378.1 275.2 41 102.9 23.3 378.1 275.2 42 102.9 23.3 378.1 275.2 43 102.9 23.3 378.1 275.2 44 102.9 23.3 378.1 275.2 45 102.9 23.3 378.1 275.2 46 102.9 23.3 378.1 275.2 47 102.9 23.3 378.1 275.2 48 102.9 23.3 378.1 275.2 49 102.9 23.3 378.1 275.2 50 102.9 23.3 378.1 275.2

Preparatory Survey for the Project on Disaster Prevention and Final Report Mitigation Measures for the Itajai River Basin Supporting Report Annex H
Nippon Koei Co., Ltd. November 2011 H - 15
(5) Results of financial evaluation
The results of the financial evaluations are the following ones:
Table 2.3.5 Results of Financial Evaluation Evaluation Index 5 years 10 years 25 years 50 years
FIRR 20.1% 22.2% 18.1% 12.4% Discount Rate
10% B/C 1.43 1.43 1.35 1.08
FNPV(^106) 282.4 465.7 570.6 218.4 Discount Rate
23% B/C 0.91 0.82 0.72 0.55
FNPV(^106) -31.2 -125.4 -291.7 -780.9 Discount Rate
12% B/C 1.33 1.29 1.20 0.95
FNPV(^106) 187.0 286.5 302.7 -112.8 Source: JICA Study Team
The result of the evaluation for the indicator FIRR (Financial Internal Rate of Return), is indicated 20.1% in the intervention in Return period 10 years, and 12.4% in the intervention of Return period 50 years.
In the cost-benefit (B/C) ratio with the discount rate of 10%/year, the indicator shows positive results. But, with the discount rate of 23%/year, the indicator shows low profitability. However, the discount rate of 23%/year is considered very high in a current economical scenery of Brazil.
In the relationship of Net Present Value (NPV), with the discount rate of 23%/year the result is shown negative. However, if taking in consideration the last tendencies of CDI, having varied among 10%/year to 12%/year, the possibility of the high rate to return is low. Considering these circumstances, it is considered viable the implementation of the interventions presented in this report with the Return period 50 years. Besides, to be considered the valorizations of the lands with less disaster risk, the economical viability would be getting better abruptly.

Preparatory Survey for the Project on Disaster Prevention and Final Report Mitigation Measures for the Itajai River Basin Supporting Report Annex H
Nippon Koei Co., Ltd. November 2011 H - 16
2.3.2 Economic Evaluation
(1) Cash Flow for 5 years safety level
The cash flow of the Master Plan for 5 years safety level is as follow;
Table 2.3.6 Cash flow at economic price (5 years safety level Plan) Unit (R$ million)
Year Cost Maintenance Cost
Emergencies Expense Benefit Balance
1 30.3 -30.3 2 30.3 -30.3 3 30.3 -30.3 4 4.6 18.8 71.9 48.5 5 4.6 18.8 71.9 48.5 6 4.6 18.8 -23.4 7 4.6 18.8 71.9 48.5 8 4.6 18.8 71.9 48.5 9 4.6 18.8 71.9 48.5
10 4.6 18.8 71.9 48.5 11 4.6 18.8 -23.4 12 4.6 18.8 71.9 48.5 13 4.6 18.8 71.9 48.5 14 4.6 18.8 71.9 48.5 15 4.6 18.8 71.9 48.5 16 4.6 18.8 -23.4 17 4.6 18.8 71.9 48.5 18 4.6 18.8 71.9 48.5 19 4.6 18.8 71.9 48.5 20 4.6 18.8 71.9 48.5 21 4.6 18.8 -23.4 22 4.6 18.8 71.9 48.5 23 4.6 18.8 71.9 48.5 24 4.6 18.8 71.9 48.5 25 4.6 18.8 71.9 48.5 26 4.6 18.8 -23.4 27 4.6 18.8 71.9 48.5 28 4.6 18.8 71.9 48.5 29 4.6 18.8 71.9 48.5 30 4.6 18.8 71.9 48.5 31 4.6 18.8 -23.4 32 4.6 18.8 71.9 48.5 33 4.6 18.8 71.9 48.5 34 4.6 18.8 71.9 48.5 35 4.6 18.8 71.9 48.5 36 4.6 18.8 -23.4 37 4.6 18.8 71.9 48.5 38 4.6 18.8 71.9 48.5 39 4.6 18.8 71.9 48.5 40 4.6 18.8 71.9 48.5 41 4.6 18.8 -23.4 42 4.6 18.8 71.9 48.5 43 4.6 18.8 71.9 48.5 44 4.6 18.8 71.9 48.5 45 4.6 18.8 71.9 48.5 46 4.6 18.8 -23.4 47 4.6 18.8 71.9 48.5 48 4.6 18.8 71.9 48.5 49 4.6 18.8 71.9 48.5 50 4.6 18.8 71.9 48.5

Preparatory Survey for the Project on Disaster Prevention and Final Report Mitigation Measures for the Itajai River Basin Supporting Report Annex H
Nippon Koei Co., Ltd. November 2011 H - 17
(2) Cash Flow for 10 years safety level
The cash flow of the Master Plan for 10 years safety level is as follow;
Table 2.3.7 Cash flow at economic price (10 years safety level Plan) Unit (R$ million)
Year Cost Maintenance Cost
Emergencies Expense Benefit Balance
1 47.0 -47.0 2 47.0 -47.0 3 47.0 -47.0 4 7.1 18.2 103.6 78.3 5 7.1 18.2 103.6 78.3 6 7.1 18.2 103.6 78.3 7 7.1 18.2 103.6 78.3 8 7.1 18.2 103.6 78.3 9 7.1 18.2 103.6 78.3
10 7.1 18.2 103.6 78.3 11 7.1 18.2 -25.2 12 7.1 18.2 103.6 78.3 13 7.1 18.2 103.6 78.3 14 7.1 18.2 103.6 78.3 15 7.1 18.2 103.6 78.3 16 7.1 18.2 103.6 78.3 17 7.1 18.2 103.6 78.3 18 7.1 18.2 103.6 78.3 19 7.1 18.2 103.6 78.3 20 7.1 18.2 103.6 78.3 21 7.1 18.2 -25.2 22 7.1 18.2 103.6 78.3 23 7.1 18.2 103.6 78.3 24 7.1 18.2 103.6 78.3 25 7.1 18.2 103.6 78.3 26 7.1 18.2 103.6 78.3 27 7.1 18.2 103.6 78.3 28 7.1 18.2 103.6 78.3 29 7.1 18.2 103.6 78.3 30 7.1 18.2 103.6 78.3 31 7.1 18.2 -25.2 32 7.1 18.2 103.6 78.3 33 7.1 18.2 103.6 78.3 34 7.1 18.2 103.6 78.3 35 7.1 18.2 103.6 78.3 36 7.1 18.2 103.6 78.3 37 7.1 18.2 103.6 78.3 38 7.1 18.2 103.6 78.3 39 7.1 18.2 103.6 78.3 40 7.1 18.2 103.6 78.3 41 7.1 18.2 -25.2 42 7.1 18.2 103.6 78.3 43 7.1 18.2 103.6 78.3 44 7.1 18.2 103.6 78.3 45 7.1 18.2 103.6 78.3 46 7.1 18.2 103.6 78.3 47 7.1 18.2 103.6 78.3 48 7.1 18.2 103.6 78.3 49 7.1 18.2 103.6 78.3 50 7.1 18.2 103.6 78.3

Preparatory Survey for the Project on Disaster Prevention and Final Report Mitigation Measures for the Itajai River Basin Supporting Report Annex H
Nippon Koei Co., Ltd. November 2011 H - 18
(3) Cash Flow for 25 years safety level
The cash flow of the Master Plan for 25 years safety level is as follow;
Table 2.3.8 Cash flow at economic price (25 years safety level Plan) Unit (R$ million)
Year Cost Maintenance Cost
Emergencies Expense Benefit Balance
1 75.8 -75.8 2 75.8 -75.8 3 75.8 -75.8 4 75.8 7.1 18.2 103.6 2.6 5 15.2 16.6 141.3 109.5 6 15.2 16.6 141.3 109.5 7 15.2 16.6 141.3 109.5 8 15.2 16.6 141.3 109.5 9 15.2 16.6 141.3 109.5
10 15.2 16.6 141.3 109.5 11 15.2 16.6 141.3 109.5 12 15.2 16.6 141.3 109.5 13 15.2 16.6 141.3 109.5 14 15.2 16.6 141.3 109.5 15 15.2 16.6 141.3 109.5 16 15.2 16.6 141.3 109.5 17 15.2 16.6 141.3 109.5 18 15.2 16.6 141.3 109.5 19 15.2 16.6 141.3 109.5 20 15.2 16.6 141.3 109.5 21 15.2 16.6 141.3 109.5 22 15.2 16.6 141.3 109.5 23 15.2 16.6 141.3 109.5 24 15.2 16.6 141.3 109.5 25 15.2 16.6 141.3 109.5 26 15.2 16.6 -31.8 27 15.2 16.6 141.3 109.5 28 15.2 16.6 141.3 109.5 29 15.2 16.6 141.3 109.5 30 15.2 16.6 141.3 109.5 31 15.2 16.6 141.3 109.5 32 15.2 16.6 141.3 109.5 33 15.2 16.6 141.3 109.5 34 15.2 16.6 141.3 109.5 35 15.2 16.6 141.3 109.5 36 15.2 16.6 141.3 109.5 37 15.2 16.6 141.3 109.5 38 15.2 16.6 141.3 109.5 39 15.2 16.6 141.3 109.5 40 15.2 16.6 141.3 109.5 41 15.2 16.6 141.3 109.5 42 15.2 16.6 141.3 109.5 43 15.2 16.6 141.3 109.5 44 15.2 16.6 141.3 109.5 45 15.2 16.6 141.3 109.5 46 15.2 16.6 141.3 109.5 47 15.2 16.6 141.3 109.5 48 15.2 16.6 141.3 109.5 49 15.2 16.6 141.3 109.5 50 15.2 16.6 141.3 109.5

Preparatory Survey for the Project on Disaster Prevention and Final Report Mitigation Measures for the Itajai River Basin Supporting Report Annex H
Nippon Koei Co., Ltd. November 2011 H - 19
(4) Cash Flow for 50 years safety level
The cash flow of the Master Plan for 50 years safety level is as follow;
Table 2.3.9 Cash flow at economic price (50 years safety level Plan) Unit (R$ million)
Year Cost Maintenance Cost
Emergencies Expense Benefit Balance
1 118.8 -118.8 2 118.8 -118.8 3 118.8 -118.8 4 118.8 7.1 18.2 103.6 -40.5 5 118.8 15.2 16.6 141.3 -9.3 6 29.7 11.6 189.7 148.3 7 29.7 11.6 189.7 148.3 8 29.7 11.6 189.7 148.3 9 29.7 11.6 189.7 148.3
10 29.7 11.6 189.7 148.3 11 29.7 11.6 189.7 148.3 12 29.7 11.6 189.7 148.3 13 29.7 11.6 189.7 148.3 14 29.7 11.6 189.7 148.3 15 29.7 11.6 189.7 148.3 16 29.7 11.6 189.7 148.3 17 29.7 11.6 189.7 148.3 18 29.7 11.6 189.7 148.3 19 29.7 11.6 189.7 148.3 20 29.7 11.6 189.7 148.3 21 29.7 11.6 189.7 148.3 22 29.7 11.6 189.7 148.3 23 29.7 11.6 189.7 148.3 24 29.7 11.6 189.7 148.3 25 29.7 11.6 189.7 148.3 26 29.7 11.6 189.7 148.3 27 29.7 11.6 189.7 148.3 28 29.7 11.6 189.7 148.3 29 29.7 11.6 189.7 148.3 30 29.7 11.6 189.7 148.3 31 29.7 11.6 189.7 148.3 32 29.7 11.6 189.7 148.3 33 29.7 11.6 189.7 148.3 34 29.7 11.6 189.7 148.3 35 29.7 11.6 189.7 148.3 36 29.7 11.6 189.7 148.3 37 29.7 11.6 189.7 148.3 38 29.7 11.6 189.7 148.3 39 29.7 11.6 189.7 148.3 40 29.7 11.6 189.7 148.3 41 29.7 11.6 189.7 148.3 42 29.7 11.6 189.7 148.3 43 29.7 11.6 189.7 148.3 44 29.7 11.6 189.7 148.3 45 29.7 11.6 189.7 148.3 46 29.7 11.6 189.7 148.3 47 29.7 11.6 189.7 148.3 48 29.7 11.6 189.7 148.3 49 29.7 11.6 189.7 148.3 50 29.7 11.6 189.7 148.3

Preparatory Survey for the Project on Disaster Prevention and Final Report Mitigation Measures for the Itajai River Basin Supporting Report Annex H
Nippon Koei Co., Ltd. November 2011 H - 20
The Economical Evaluation takes place converting to the economical price that discounts the taxes. The results of the economical evaluations are the following ones:
Table 2.3.10 Results of the Economic Evaluation Evaluation Index 5 years 10 years 25 years 50 years
Economic IRR 29.2% 37.5% 28.7% 21.2% Discount Rate
6% B/C 1.95 2.73 2.61 2.24
ENPV(^106) 390.4 1,087.9 1,332.3 1,427.9
Discount Rate 10%
B/C 1.72 2.34 2.07 1.65 ENPV(^106
) 197.5 596.6 658.3 582.2
Discount Rate 12%
B/C 1.62 2.17 1.85 1.43 ENPV(^106
) 145.6 463.1 477.8 362.4
Source: JICA Study Team
The results of the evaluation without tax and of compensation show the positive indicators in all of the aspects. These results indicate high economical viability of the implementations of the interventions presented in this report.
2.3.3 Total evaluation
The Itajaí basin shows a positive tendency of development, especially in the areas of mouth of the river Itajaí, with great attractiveness to new investments. Every year, the need to structure this area of strategic importance for the State is big, mainly in what refers to the prevention of disasters.
In the results of the evaluations high economical viability is shown, even with the implementations aiming at the Return period 50 years.

Preparatory Survey for the Project on Disaster Prevention and Final Report Mitigation Measures for the Itajai River Basin Supporting Report Annex H
Nippon Koei Co., Ltd. November 2011 H - 21
CHAPTER 3 FEASIBILITY STUDY PROJECT EVALUATION
3.1 Methodology of Economic Evaluation
The economical evaluation in this Feasibility Study was carried out for the following projects;
Table-3.1.1 Evaluated Project Project Outlook of Project
Water storage in paddy fields Paddy fields ridge heightening (5,000ha)Change of current dam operation method and heightening of the dam(Oeste)
Heightening of dam (2 m)
Change of current dam operation method and heightening of the dam(Sul)
2 m de Heightening of dam
Utilization of the existing hydropower generation dam for flood control
2 Dam
Installation of floodgate and improving Itajai Mirim River in Itajai City
2 nos、0.95km
Strengthening the existing flood forecasting and warning system
1 Unit
Installation of early warning system for land slide and flush flood
1Unit
Source; JICA survey team
The evaluation period is of 50 years. The benefits are considered that the differences between the potential value of disasters that can be caused by the existent infrastructures and the potential value to be mitigated with the implantation of the project proposed as a mitigation measure. The reaches of disasters were estimated through hydrological simulation of each flood in safety level and it was transformed to values. The benefit is accounted with base in the damages record caused by flood damages history. The accountancies of the damages for each "flood safety level" is considered through the registered data and statistical data published in the State. The annual medium benefit is considered multiplying the probabilities of each flood and the damages caused by each safety level. Besides this, there is benefit of valorizations of the lands through improvement of safety. However, this benefit, in this evaluation, was not considered.
3.2 Cost and Benefit
3.2.1 Cost
The Cost proposed by the in this FS Study are the following ones; The details of project costs are indicated in Chapter 10.
Table3.2.1 Proposed Project Cost
Unit;R$ 1,000
Item Direct Cost(Loan)
Administration Expenses Expropriation Subtotal
I. Direct Cost of Measure
(1) Basin Storage Measures
Water storage in paddy fields 18,000 3,600 21,600
Heightening of dams(Oeste) 27,200 800 1,110 29,110
Heightening of dams(Sul) 22,500 700 23,200
(2) River Improvement Measures
Floodgates in Itajaí Mirim River (Upper stream) 17,800 500 10 18,310
Floodgates in Itajaí Mirim River (Lower stream) 14,000 400 14,400
(3) Structural Measures for Sediment Disaster Prevention 25,800 800 50 26,650

Preparatory Survey for the Project on Disaster Prevention and Final Report Mitigation Measures for the Itajai River Basin Supporting Report Annex H
Nippon Koei Co., Ltd. November 2011 H - 22
(4) Strengthening of the Existing Flood Forecasting and Warning System (FFWS) 4,000 120 4,120
(5) Formation of Early Warning System for Sediment Disaster and Flash Flood 4,000 120 4,120
II. Subtotal 133,300 7,040 1,170 141,510 III. Engineering Services 25,100 750 25,850IV. II+III 158,400 7,790 1,170 167,360V. Physical Contingency (10% of IV ) 15,800 15,800VI. Price Escalation 19,700 70 19,770VII. Project Cost 193,900 7,790 1,240 202,930
Source; JICA survey team
3.2.2 Benefit
As the result of the implementations of the measure proposed in this FS Study, it is foreseen to obtain the following benefits;
Table 3.2.2 Expected Impact of the Project Item Results of Measure Water storage in paddy fields Increase of rice production (10%) Heightening of the dam(Oeste) Heightening of the dam(Sul)
Flood disaster mitigation in Taio city (10 years safety level) Flood disaster mitigation in Rio do Sul (4 years safety level)
Utilization of the existing hydropower generation dam for flood control Flood disaster mitigation in Timbó city (10 years safety level)
Installation of floodgate and improving Itajai Mirim River in Itajai City
Flood disaster mitigation in Itajaí City (25 years safety level) Mitigation of Economic loss in Itajaí city
Strengthening the existing flood forecasting and warning system & Installation of Early Warning system for Landslide and Flush flood
Mitigation of scarified (Injured and death)
Source; JICA survey team
The benefits counted in the proposed project in this FS study were estimated in the following forms;
(1) Increase of rice production
The impact of the Project "Water storage in paddy fields" will be obtained in the increase of the productivities and of improvement of the quality of the products through the improvement of the paddy fields infrastructures. The expected value of the benefit were estimated the value of R$ 2,5000,000 / year.
(2) Benefit of the Project “Change of current dam operation method and heightening of the dam”
The impact of the disaster mitigations was estimated through the hydrological calculations for each beneficiary main city though the basin storage measure.
The present situation of flood damage for main beneficiary city are ahown in followings;

Preparatory Survey for the Project on Disaster Prevention and Final Report Mitigation Measures for the Itajai River Basin Supporting Report Annex H
Nippon Koei Co., Ltd. November 2011 H - 23
Fig 3.2.1 Present situation of flood damage of Taio city
Figure 3.2.2 Present situation of Flood damage at Timbo City

Preparatory Survey for the Project on Disaster Prevention and Final Report Mitigation Measures for the Itajai River Basin Supporting Report Annex H
Nippon Koei Co., Ltd. November 2011 H - 24
Figure 3.2.3 Present Situation of Flood Damage at Rio do Sul City
The results of the estimated impact of disaster mitigation were the following ones;
Table3.2.3 Benefit by flood mitigation measure
City Number of housing
Number of affected housing (Estimate) 5year 10 year 25 year 50 year
Taio (present) 2,541 250 300 400 500Taio (with project) - 250 350 500Timbo (present) 8,297 150 200 250 300Timbo (with project) - - 200 300Rio do Sul 15,504 100 500 1,000 1,500Rio do Sul (with project) 50 480 1,000 1,500Total 500 1,000 1,650 2,300 With project 50 730 1,550 2,300 Effect of project 450 270 100 0 Annual Benefit(R$1,000) 9,000 10,400 2,000 Beneficio anual esperado(R$1,000) 1,800 970 248 20 Total de beneficio esperado(R$1,000) 3,038
Source; JICA survey team
The disaster value was estimated, presupposing of R$ 20.0000 value of disasters for each housing affected by flood disaster. The numbers of affected housing for the flood were calculated for each safety level, being used the existent reports in this theme.
(3) Benefit by disaster mitigation in the Itajaí City
In case of the Itajaí city, being used the detailed topographical maps, it was estimated the reaches of the flood for each safety level.

Preparatory Survey for the Project on Disaster Prevention and Final Report Mitigation Measures for the Itajai River Basin Supporting Report Annex H
Nippon Koei Co., Ltd. November 2011 H - 25
Figure 3.2.4 Present situation of Flood damage and impact of project at Itajai City
The results of the flood simulations for each safety level are;

Preparatory Survey for the Project on Disaster Prevention and Final Report Mitigation Measures for the Itajai River Basin Supporting Report Annex H
Nippon Koei Co., Ltd. November 2011 H - 26
Table 3.2.4 Benefit by Installation of Flood Gate at Itajaí City 5 year 10 year 25 year 50 year
Number of affected housing
< 0.5m 512 1,552 1,632 1,596 >0.5 232 940 2,637 3,911 Subtotal 744 2,492 4,269 5,506
Economic gain (R$ 1,000)
< 0.5m 2,562 7,759 8,161 7,978 >0.5 4,633 18,795 52,732 78,214 Subtotal 7,196 26,555 60,894 86,193
Annual expected gain(R$ 1000) 1,439 968 687 253 Total benefit (R$ 1000) 3,347
Source; JICA survey team
2) Benefit by mitigation of economic loss by flood
The economical flood damages by this project was estimated through the existent companies number (% of itajai City) in a beneficiary area protected by floodgate installation, in the preposition that this portion of companies contribute the economy in a same percentage. The economical amount was estimated from the sequential data of ICMS of Itajai City. The results of the estimation are as follows;
Table 3.2.5 Benefit by Economic Loss of Itajaí City 5 year 10 year 25 year 50 year
ICMS (R$ 1,000,000)
Decrease of ICMS 11.8 19.3 36.8 59.9Economic Decrease 118.0 193.0 368.0 599.0
Benefit Annual
23.6 3.75 3.5 2.31Annual Expected Benefit 33.16
Source; JICA survey team
(4) Benefit by structure measure of landslide
The benefit originated by structure measure of landslide was estimated as follows;
Table3.2.6 Benefit of the Structure measure of landslide
No.
of p
rior
ity
orde
r
Site Potential annual
loss (R$ x 103/year)
Total cost (direct and
indirect)
(R$ x 103)
Benefit: decrease in
potential annual loss
(R$ x 103/year)
1 Road SC 302 Taio-Passo Manso-5 1,255 551 1,0622 Road SC470 Gaspar River Bank 1,095 2,810 5813 Blumenau -Av Pres Castelo Branco 1,021 3,883 6544 Road SC418 Blumenau - Pomerode 989 2,522 841
5 Road SC474 Blumenau-Massaranduba 2 907 5,077 641
6 Road Gaspar - Luiz Alves, Gaspar 9 774 4,664 6537 Road Gaspar - Luiz Alves, Luiz Alves 6 700 1,974 5918 Road SC470 Gaspar Bypass 689 3,772 402
9 Road SC477 Benedito Novo - Doutor Pedrinho 1 680 1,399 575
10 Road SC418 Pomerode- Jaragua do Sul 1 651 1,187 553
11 Road Gaspar - Luiz Alves, Luiz Alves 4 629 5,078 532
12 Road SC474 Blumenau - Massaranduba 1 601 702 425
13 Road SC 302 Taio - Passo Manso 4 526 1,599 446Total of the 13 risk sites 10,516 35,219 7,956
Source: JICA Survey Team

Preparatory Survey for the Project on Disaster Prevention and Final Report Mitigation Measures for the Itajai River Basin Supporting Report Annex H
Nippon Koei Co., Ltd. November 2011 H - 27
(5) Benefit of Alarm/alert system
The benefit of the installation of the alarm/alert system for flood and early warning system of landslide and flashflood can be estimated as follows, in accordance with the disaster happened November of 2008:
Table 3.2.7 Disaster in Human resources by the Disaster November 2008 Injured Death
2008/11 Flood 4,637 89 With project - -
Source:AVADAMs enviados pelos munincipios á Defesa Civil de Santa Catarina, nos dias 24 e 25 de novembro de 2008.
But, in this study, the values were not counted by the difficulties.
(6) Expected Annual Benefit of the Project
The annual expected benefit of the project was estimated as follows;
Table 3.2.8 Project Benefit Annual Benefit(R$ 1,000,000)
Project Impact After Project 1st year 2do year 3do year 4th yearIncrease of rice production (10%) 2.5 0.83 1.67 Flood Disaster mitigation in the Taio, Timbó e Rio do Sul 3.0 1.01 2.03
Flood disaster mitigation in the Itajaí City 3.4 1.67 Flood disaster mitigation in economic loss in the Itajaí City 33.2 16.58
Structure measure for landslide 8.0 2.65 5.30 Annual Benefit 58.6 0.00 0.00 7.33 32.92 Source; JICA survey team

Preparatory Survey for the Project on Disaster Prevention and Final Report Mitigation Measures for the Itajai River Basin Supporting Report Annex H
Nippon Koei Co., Ltd. November 2011 H - 28
3.3 Project Evaluation
3.3.1 Cash Flow
The cash flow of the Project is as follow;
Table 3.3.1 Cash flow of FS Project Unit (R$ million)
Year Cost Maintenance Cost
Emergencies Expense Benefit Balance
1 26.5 -26.5 2 57.5 -57.5 3 65.1 4.4 -60.7 4 18.3 8.4 1.6 27.0 -1.2 5 8.4 1.6 49.7 39.7 6 8.4 1.6 49.7 39.7 7 8.4 1.6 49.7 39.7 8 8.4 1.6 49.7 39.7 9 8.4 1.6 49.7 39.7
10 8.4 1.6 49.7 39.7 11 8.4 1.6 -10.0 12 8.4 1.6 49.7 39.7 13 8.4 1.6 49.7 39.7 14 8.4 1.6 49.7 39.7 15 8.4 1.6 49.7 39.7 16 8.4 1.6 49.7 39.7 17 8.4 1.6 49.7 39.7 18 8.4 1.6 49.7 39.7 19 8.4 1.6 49.7 39.7 20 8.4 1.6 49.7 39.7 21 8.4 1.6 -10.0 22 8.4 1.6 49.7 39.7 23 8.4 1.6 49.7 39.7 24 8.4 1.6 49.7 39.7 25 8.4 1.6 49.7 39.7 26 8.4 1.6 49.7 39.7 27 8.4 1.6 49.7 39.7 28 8.4 1.6 49.7 39.7 29 8.4 1.6 49.7 39.7 30 8.4 1.6 49.7 39.7 31 8.4 1.6 -10.0 32 8.4 1.6 49.7 39.7 33 8.4 1.6 49.7 39.7 34 8.4 1.6 49.7 39.7 35 8.4 1.6 49.7 39.7 36 8.4 1.6 49.7 39.7 37 8.4 1.6 49.7 39.7 38 8.4 1.6 49.7 39.7 39 8.4 1.6 49.7 39.7 40 8.4 1.6 49.7 39.7 41 8.4 1.6 -10.0 42 8.4 1.6 49.7 39.7 43 8.4 1.6 49.7 39.7 44 8.4 1.6 49.7 39.7 45 8.4 1.6 49.7 39.7 46 8.4 1.6 49.7 39.7 47 8.4 1.6 49.7 39.7 48 8.4 1.6 49.7 39.7 49 8.4 1.6 49.7 39.7 50 8.4 1.6 49.7 39.7

Preparatory Survey for the Project on Disaster Prevention and Final Report Mitigation Measures for the Itajai River Basin Supporting Report Annex H
Nippon Koei Co., Ltd. November 2011 H - 29
3.3.2 Results of evaluation
The results of the economic evaluation are as follows;
Table 3.3.2 Results of Evaluation Evaluation Index Indicator
IRR 18.3%
Discount rate(10%) B/C 1.44
NPV(^106) 94.5
Discount Rate(23%) B/C 0.71
NPV(^106) - 41.7
Discount Rate(12%) B/C 1.27
NPV(^106) 51.8 Source; JICA survey team
The result of the evaluation by the indicator IRR (Internal Rate of Return), is indicated 18.3% in the measure. In the cost-benefit (B/C) relationship with the discount rate of 10%/year, the indicator shows positive results. But, with the discount rate of 23%/year, the indicator shows low profitability. However, the discount rate of 23%/year is considered very high in the current Brazilian economical scenery. In the relationship of the Net Present value (NPV), with the discount rate of 23%/year, the result is shown negative. However, if taking in consideration the last tendencies of CDI, having varied among 10%/year to 12%/year, the possibility of the high rate to return is low. Besides, to be considered the valorizations of the lands with less disaster risk, the economical feasibility would be getting better abruptly.
It is necessary to implement the proposed projects gradually in the Master plan, due to that this proposed projects form one part of the Master plan.
3.4 Total Evaluation
This Project, starting from the flood in the November of 2008, with the consensus of taking the preventive measures for the flood, were formulated the Master plan and were selected the priority projects for the FS Study.
The economical importance in the basin is being more and more significant inside of the economical scenery of the State, with the tendencies of new investments, especially in the Itajai Port area. As well as it exists big quantities of investments more and more inside of the basin, it needs to assure the protections of the installed goods, through the disasters mitigation measure. It is notable that the economical activity in the lower Itajaí basin had 5 times of economical growth in the 8 years of periods (from 1999 to 2008), being significant that the needs to protect the basin from disaster are more and more important.