appendix 1—locations and dissolved solids … · appendix 1—locations and dissolved solids...
TRANSCRIPT

Appendix 1—Locations and Dissolved Solids Concentrations of Existing Wells

Blank Page

Appendix 1. Locations and dissolved solids concentrations of existing wells, Barton Springs segment of the Edwards aquifer, Travis and Hays Counties, Texas. Link to Excel file
Data Definitions:
Column 1, State well number—Unique identifier assigned by the State of Texas to location in study area where measurements or samples were taken.
Column 2, Northing—North State Plane Coordinate of north-south distance, in feet.
Column 3, Easting—North State Plane Coordinate of east-west distance, in feet.
Column 4, Altitude of land surface—Altitude of wells, in feet above NGVD 29 (--, not available).
Column 5, Dissolved solids concentration—Measured dissolved solids concentration, in milligrams per liter, in samples from wells; concen-trations in bold computed from conductivity [dissolved solids = 0.6208(conductivity) – 33.317].
Column 6, Source of data—TWDB, Texas Water Development Board (2006); BSEACD, Barton Springs Edwards Aquifer Conservation District (Hunt and others, 2006 [well locations]; Barton Springs/Edwards Aquifer Conservation District Well Database, unpublished, 2006 [dissolved solids concentrations]; USGS, U.S. Geological Survey (2006).
Appendix 1 1–3

Blank Page

Appendix 2Appendix 2—Geophysical Borehole Logs, Swinney Well

Blank Page

Appendix 2. Geophysical borehole logs, Swinney Well. Link to pdf file.
Data Definitions:
BSEACD—Barton Springs/Edwards Aquifer Conservation District
LSD—land surface datum
m—meters
GPS—Global Positioning System
cm—centimeters
N/A—not applicable
in—inch
Geol.—geologic
GAM(NAT)—natural gamma
CPS—counts per second
MS/M—millisiemens per second
I_Res—induction resistivity
OHM-M—ohm-meters
TDEM res—time-domain electromagnetic resistivity
DEL TEMP—delta temperature
DEG F—degrees Fahrenheit
RES(FL)—fluid resistivity
SP COND—specific conductance
US/CM—microsiemens per centimeter
Appendix 2 2–3

Blank Page

Appendix 3Appendix 3—Global Positioning System Online User Service (OPUS) Solutions

Blank Page

Appendix 3. Global Positioning System Online Positioning User Service (OPUS) solutions, Travis and Hays Counties, Barton Springs segment of the Edwards aquifer—Continued.FILE: BS200 NGS OPUS SOLUTION REPORT ======================== USER: [email protected] DATE: September 26, 2006 RINEX FILE: bs20265o.06o TIME: 12:10:40 UTC SOFTWARE: page5 0601.10 master30.pl START: 2006/09/22 14:55:00 EPHEMERIS: igr13935.eph [rapid] STOP: 2006/09/22 15:30:00 NAV FILE: brdc2650.06n OBS USED: 935 / 963 : 97% ANT NAME: TRM5800 NONE # FIXED AMB: 13 / 15 : 87% ARP HEIGHT: 2.25 OVERALL RMS: 0.012(m) REF FRAME: NAD_83(CORS96)(EPOCH:2002.0000) ITRF00 (EPOCH:2006.7250) X: -751254.551(m) 0.253(m) -751255.228(m) 0.253(m) Y: -5470133.040(m) 0.287(m) -5470131.588(m) 0.287(m) Z: 3182416.624(m) 0.290(m) 3182416.448(m) 0.290(m) LAT: 30 7 28.72829 0.169(m) 30 7 28.74529 0.169(m) E LON: 262 10 48.21565 0.278(m) 262 10 48.18322 0.278(m) W LON: 97 49 11.78435 0.278(m) 97 49 11.81678 0.278(m) EL HGT: 167.536(m) 0.359(m) 166.283(m) 0.359(m) ORTHO HGT: 193.304(m) 0.360(m) [Geoid03 NAVD88] UTM COORDINATES STATE PLANE COORDINATES UTM (Zone 14) SPC (4203 TX C) Northing (Y) [meters] 3333184.923 3053506.978 Easting (X) [meters] 613675.561 942183.207 Convergence [degrees] 0.59231543 1.29454551 Point Scale 0.99975942 0.99999788 Combined Factor 0.99973312 0.99997157 US NATIONAL GRID DESIGNATOR: 14RPU1367633185(NAD 83) BASE STATIONS USED PID DESIGNATION LATITUDE LONGITUDE DISTANCE(m) DG5767 TXSM SAN MARCOS CORS ARP N295240.525 W0975409.650 28491.9 DF4373 TXAU AUSTIN RRP2 CORS ARP N301842.088 W0974522.713 21621.8 DG5761 TXBS BASTROP CORS ARP N300646.244 W0971726.172 51030.5 NEAREST NGS PUBLISHED CONTROL POINT BM0659 Z 328 N300700. W0974956. 1479.1 This position and the above vector components were computed without any knowledge by the National Geodetic Survey regarding the equipment or field operating procedures used.
Appendix 3 3–3
Appendix 3. Global Positioning System Online Positioning User Service (OPUS) solutions, Travis and Hays Counties, Barton Springs segment of the Edwards aquifer.

Appendix 3. Global Positioning System Online Positioning User Service (OPUS) solutions, Travis and Hays Counties, Barton Springs segment of the Edwards aquifer—Continued.FILE: BS240 NGS OPUS SOLUTION REPORT ======================== USER: [email protected] DATE: September 26, 2006 RINEX FILE: bs24255q.06o TIME: 11:56:44 UTC SOFTWARE: page5 0601.10 master10.pl START: 2006/09/12 16:27:00 EPHEMERIS: igr13922.eph [rapid] STOP: 2006/09/12 16:55:00 NAV FILE: brdc2550.06n OBS USED: 830 / 867 : 96% ANT NAME: TRM5800 NONE # FIXED AMB: 13 / 16 : 81% ARP HEIGHT: 2.25 OVERALL RMS: 0.014(m) REF FRAME: NAD_83(CORS96)(EPOCH:2002.0000) ITRF00 (EPOCH:2006.6978) X: -750057.149(m) 0.035(m) -750057.826(m) 0.035(m) Y: -5471105.770(m) 0.031(m) -5471104.318(m) 0.031(m) Z: 3181100.566(m) 0.103(m) 3181100.390(m) 0.103(m) LAT: 30 6 38.70941 0.075(m) 30 6 38.72640 0.075(m) E LON: 262 11 37.46781 0.037(m) 262 11 37.43539 0.037(m) W LON: 97 48 22.53219 0.037(m) 97 48 22.56461 0.037(m) EL HGT: 199.962(m) 0.076(m) 198.709(m) 0.076(m) ORTHO HGT: 225.769(m) 0.080(m) [Geoid03 NAVD88] UTM COORDINATES STATE PLANE COORDINATES UTM (Zone 14) SPC (4203 TX C) Northing (Y) [meters] 3331658.850 3051997.016 Easting (X) [meters] 615009.666 943536.243 Convergence [degrees] 0.59893360 1.30159211 Point Scale 0.99976319 1.00000158 Combined Factor 0.99973179 0.99997018 US NATIONAL GRID DESIGNATOR: 14RPU1501031659(NAD 83) BASE STATIONS USED PID DESIGNATION LATITUDE LONGITUDE DISTANCE(m) DG5767 TXSM SAN MARCOS CORS ARP N295240.525 W0975409.650 27436.1 DF4373 TXAU AUSTIN RRP2 CORS ARP N301842.088 W0974522.713 22789.2 DG5761 TXBS BASTROP CORS ARP N300646.244 W0971726.172 49699.5 NEAREST NGS PUBLISHED CONTROL POINT BM0753 R 1305 N300645. W0974825. 205.4 This position and the above vector components were computed without any knowledge by the National Geodetic Survey regarding the equipment or field operating procedures used.
3–4 Geophysical Delineation of the Freshwater/Saline-Water Transition Zone, Barton Springs Segment, Edwards Aquifer

Appendix 3. Global Positioning System Online Positioning User Service (OPUS) solutions, Travis and Hays Counties, Barton Springs segment of the Edwards aquifer—Continued.FILE: BS245 NGS OPUS SOLUTION REPORT ======================== USER: [email protected] DATE: September 26, 2006 RINEX FILE: bs24257s.06o TIME: 12:08:16 UTC SOFTWARE: page5 0601.10 master25.pl START: 2006/09/14 18:22:00 EPHEMERIS: igr13924.eph [rapid] STOP: 2006/09/14 18:56:00 NAV FILE: brdc2570.06n OBS USED: 1256 / 1389 : 90% ANT NAME: TRM5800 NONE # FIXED AMB: 16 / 22 : 73% ARP HEIGHT: 2.25 OVERALL RMS: 0.015(m) REF FRAME: NAD_83(CORS96)(EPOCH:2002.0000) ITRF00 (EPOCH:2006.7035) X: -749588.005(m) 0.280(m) -749588.682(m) 0.280(m) Y: -5471283.236(m) 0.315(m) -5471281.784(m) 0.315(m) Z: 3180886.643(m) 0.137(m) 3180886.467(m) 0.137(m) LAT: 30 6 30.87327 0.053(m) 30 6 30.89027 0.053(m) E LON: 262 11 55.72855 0.263(m) 262 11 55.69614 0.263(m) W LON: 97 48 4.27145 0.263(m) 97 48 4.30386 0.263(m) EL HGT: 189.639(m) 0.365(m) 188.386(m) 0.365(m) ORTHO HGT: 215.457(m) 0.366(m) [Geoid03 NAVD88] UTM COORDINATES STATE PLANE COORDINATES UTM (Zone 14) SPC (4203 TX C) Northing (Y) [meters] 3331422.743 3051766.896 Easting (X) [meters] 615500.932 944030.485 Convergence [degrees] 0.60143975 1.30420471 Point Scale 0.99976459 1.00000217 Combined Factor 0.99973481 0.99997239 US NATIONAL GRID DESIGNATOR: 14RPU1550131423(NAD 83) BASE STATIONS USED PID DESIGNATION LATITUDE LONGITUDE DISTANCE(m) DG5767 TXSM SAN MARCOS CORS ARP N295240.525 W0975409.650 27380.5 DF4373 TXAU AUSTIN RRP2 CORS ARP N301842.088 W0974522.713 22928.0 DG5761 TXBS BASTROP CORS ARP N300646.244 W0971726.172 49213.1 NEAREST NGS PUBLISHED CONTROL POINT BM0753 R 1305 N300645. W0974825. 705.9 This position and the above vector components were computed without any knowledge by the National Geodetic Survey regarding the equipment or field operating procedures used.
Appendix 3 3–5

Appendix 3. Global Positioning System Online Positioning User Service (OPUS) solutions, Travis and Hays Counties, Barton Springs segment of the Edwards aquifer—Continued.FILE: BS247 NGS OPUS SOLUTION REPORT ========================
USER: [email protected] DATE: September 26, 2006RINEX FILE: bs21255n.06o TIME: 00:22:19 UTC
SOFTWARE: page5 0601.10 master4.pl START: 2006/09/12 13:55:00 EPHEMERIS: igr13922.eph [rapid] STOP: 2006/09/12 14:59:00 NAV FILE: brdc2550.06n OBS USED: 2257 / 2298 : 98% ANT NAME: TRM5800 NONE # FIXED AMB: 18 / 22 : 82%ARP HEIGHT: 2.25 OVERALL RMS: 0.014(m)
REF FRAME: NAD_83(CORS96)(EPOCH:2002.0000) ITRF00 (EPOCH:2006.6975)
X: -751045.987(m) 0.067(m) -751046.664(m) 0.067(m) Y: -5470860.979(m) 0.233(m) -5470859.527(m) 0.233(m) Z: 3181247.926(m) 0.089(m) 3181247.750(m) 0.089(m)
LAT: 30 6 44.61050 0.043(m) 30 6 44.62749 0.043(m) E LON: 262 10 59.63300 0.038(m) 262 10 59.60057 0.038(m) W LON: 97 49 0.36700 0.038(m) 97 49 0.39943 0.038(m) EL HGT: 180.360(m) 0.251(m) 179.107(m) 0.251(m) ORTHO HGT: 206.146(m) 0.252(m) [Geoid03 NAVD88]
UTM COORDINATES STATE PLANE COORDINATES UTM (Zone 14) SPC (4203 TX C)Northing (Y) [meters] 3331829.970 3052155.720Easting (X) [meters] 613995.169 942519.480Convergence [degrees] 0.59368874 1.29617901Point Scale 0.99976032 1.00000114Combined Factor 0.99973200 0.99997282
US NATIONAL GRID DESIGNATOR: 14RPU1399531830(NAD 83)
BASE STATIONS USEDPID DESIGNATION LATITUDE LONGITUDE DISTANCE(m)DG5767 TXSM SAN MARCOS CORS ARP N295240.525 W0975409.650 27282.0DF4373 TXAU AUSTIN RRP2 CORS ARP N301842.088 W0974522.713 22848.2DG5761 TXBS BASTROP CORS ARP N300646.244 W0971726.172 50711.5
NEAREST NGS PUBLISHED CONTROL POINTBM0753 R 1305 N300645. W0974825. 946.1
This position and the above vector components were computed without any knowledge by the National Geodetic Survey regarding the equipment or field operating procedures used.
3–6 Geophysical Delineation of the Freshwater/Saline-Water Transition Zone, Barton Springs Segment, Edwards Aquifer

Appendix 3. Global Positioning System Online Positioning User Service (OPUS) solutions, Travis and Hays Counties, Barton Springs segment of the Edwards aquifer—Continued.FILE: BS250 NGS OPUS SOLUTION REPORT ======================== USER: [email protected] DATE: September 26, 2006 RINEX FILE: bs25255t.06o TIME: 12:11:25 UTC SOFTWARE: page5 0601.10 master30.pl START: 2006/09/12 19:27:00 EPHEMERIS: igr13922.eph [rapid] STOP: 2006/09/12 20:04:00 NAV FILE: brdc2550.06n OBS USED: 1118 / 1237 : 90% ANT NAME: TRM5800 NONE # FIXED AMB: 17 / 20 : 85% ARP HEIGHT: 2.25 OVERALL RMS: 0.023(m) REF FRAME: NAD_83(CORS96)(EPOCH:2002.0000) ITRF00 (EPOCH:2006.6981) X: -749115.591(m) 0.841(m) -749116.268(m) 0.841(m) Y: -5471322.845(m) 1.158(m) -5471321.393(m) 1.158(m) Z: 3180914.083(m) 0.541(m) 3180913.907(m) 0.541(m) LAT: 30 6 32.04913 0.157(m) 30 6 32.06612 0.157(m) E LON: 262 12 13.41109 0.709(m) 262 12 13.37868 0.709(m) W LON: 97 47 46.58891 0.709(m) 97 47 46.62132 0.709(m) EL HGT: 181.898(m) 1.349(m) 180.645(m) 1.349(m) ORTHO HGT: 207.724(m) 1.349(m) [Geoid03 NAVD88] UTM COORDINATES STATE PLANE COORDINATES UTM (Zone 14) SPC (4203 TX C) Northing (Y) [meters] 3331463.919 3051813.881 Easting (X) [meters] 615973.819 944502.943 Convergence [degrees] 0.60391047 1.30673459 Point Scale 0.99976594 1.00000208 Combined Factor 0.99973738 0.99997352 US NATIONAL GRID DESIGNATOR: 14RPU1597431464(NAD 83) BASE STATIONS USED PID DESIGNATION LATITUDE LONGITUDE DISTANCE(m) DG5767 TXSM SAN MARCOS CORS ARP N295240.525 W0975409.650 27587.0 DF4373 TXAU AUSTIN RRP2 CORS ARP N301842.088 W0974522.713 22808.0 DG5761 TXBS BASTROP CORS ARP N300646.244 W0971726.172 48738.6 NEAREST NGS PUBLISHED CONTROL POINT BM0753 R 1305 N300645. W0974825. 1102.8 This position and the above vector components were computed without any knowledge by the National Geodetic Survey regarding the equipment or field operating procedures used.
Appendix 3 3–7

Appendix 3. Global Positioning System Online Positioning User Service (OPUS) solutions, Travis and Hays Counties, Barton Springs segment of the Edwards aquifer—Continued.FILE: BS260 NGS OPUS SOLUTION REPORT ======================== USER: [email protected] DATE: September 26, 2006 RINEX FILE: bs26256o.06o TIME: 12:04:29 UTC SOFTWARE: page5 0601.10 master2.pl START: 2006/09/13 14:38:00 EPHEMERIS: igr13923.eph [rapid] STOP: 2006/09/13 15:08:00 NAV FILE: brdc2560.06n OBS USED: 1093 / 1119 : 98% ANT NAME: TRM5800 NONE # FIXED AMB: 18 / 21 : 86% ARP HEIGHT: 2.25 OVERALL RMS: 0.015(m) REF FRAME: NAD_83(CORS96)(EPOCH:2002.0000) ITRF00 (EPOCH:2006.7003) X: -748587.495(m) 0.182(m) -748588.172(m) 0.182(m) Y: -5471472.458(m) 0.179(m) -5471471.006(m) 0.179(m) Z: 3180772.105(m) 0.154(m) 3180771.929(m) 0.154(m) LAT: 30 6 26.81242 0.083(m) 30 6 26.82942 0.083(m) E LON: 262 12 33.71133 0.203(m) 262 12 33.67893 0.203(m) W LON: 97 47 26.28867 0.203(m) 97 47 26.32107 0.203(m) EL HGT: 176.959(m) 0.203(m) 175.706(m) 0.203(m) ORTHO HGT: 202.796(m) 0.204(m) [Geoid03 NAVD88] UTM COORDINATES STATE PLANE COORDINATES UTM (Zone 14) SPC (4203 TX C) Northing (Y) [meters] 3331308.453 3051665.077 Easting (X) [meters] 616518.856 945049.975 Convergence [degrees] 0.60671362 1.30963898 Point Scale 0.99976750 1.00000247 Combined Factor 0.99973972 0.99997468 US NATIONAL GRID DESIGNATOR: 14RPU1651931308(NAD 83) BASE STATIONS USED PID DESIGNATION LATITUDE LONGITUDE DISTANCE(m) DG5767 TXSM SAN MARCOS CORS ARP N295240.525 W0975409.650 27645.9 DF4373 TXAU AUSTIN RRP2 CORS ARP N301842.088 W0974522.713 22882.2 DG5761 TXBS BASTROP CORS ARP N300646.244 W0971726.172 48197.7 NEAREST NGS PUBLISHED CONTROL POINT BM0753 R 1305 N300645. W0974825. 1668.2 This position and the above vector components were computed without any knowledge by the National Geodetic Survey regarding the equipment or field operating procedures used.
3–8 Geophysical Delineation of the Freshwater/Saline-Water Transition Zone, Barton Springs Segment, Edwards Aquifer

Appendix 3. Global Positioning System Online Positioning User Service (OPUS) solutions, Travis and Hays Counties, Barton Springs segment of the Edwards aquifer—Continued.FILE: BS320 NGS OPUS SOLUTION REPORT ======================== USER: [email protected] DATE: September 26, 2006 RINEX FILE: bs32264m.06o TIME: 11:57:41 UTC SOFTWARE: page5 0601.10 master10.pl START: 2006/09/21 12:26:00 EPHEMERIS: igr13934.eph [rapid] STOP: 2006/09/21 13:07:00 NAV FILE: brdc2640.06n OBS USED: 1289 / 1344 : 96% ANT NAME: TRM5800 NONE # FIXED AMB: 16 / 20 : 80% ARP HEIGHT: 2.25 OVERALL RMS: 0.015(m) REF FRAME: NAD_83(CORS96)(EPOCH:2002.0000) ITRF00 (EPOCH:2006.7220) X: -752455.687(m) 0.055(m) -752456.364(m) 0.055(m) Y: -5472190.085(m) 0.171(m) -5472188.633(m) 0.171(m) Z: 3178663.181(m) 0.107(m) 3178663.004(m) 0.107(m) LAT: 30 5 7.42235 0.145(m) 30 5 7.43929 0.145(m) E LON: 262 10 14.23138 0.070(m) 262 10 14.19895 0.070(m) W LON: 97 49 45.76862 0.070(m) 97 49 45.80105 0.070(m) EL HGT: 189.322(m) 0.117(m) 188.068(m) 0.117(m) ORTHO HGT: 215.107(m) 0.120(m) [Geoid03 NAVD88] UTM COORDINATES STATE PLANE COORDINATES UTM (Zone 14) SPC (4204 TXSC) Northing (Y) [meters] 3328825.634 4250159.529 Easting (X) [meters] 612810.717 712844.264 Convergence [degrees] 0.58688231 0.57350143 Point Scale 0.99975701 0.99994882 Combined Factor 0.99972728 0.99991909 US NATIONAL GRID DESIGNATOR: 14RPU1281128826(NAD 83) BASE STATIONS USED PID DESIGNATION LATITUDE LONGITUDE DISTANCE(m) DG5767 TXSM SAN MARCOS CORS ARP N295240.525 W0975409.650 24062.5 DF4373 TXAU AUSTIN RRP2 CORS ARP N301842.088 W0974522.713 26055.1 DG5761 TXBS BASTROP CORS ARP N300646.244 W0971726.172 52023.1 NEAREST NGS PUBLISHED CONTROL POINT BM0750 G 1304 N300450. W0974920. 875.0 This position and the above vector components were computed without any knowledge by the National Geodetic Survey regarding the equipment or field operating procedures used.
Appendix 3 3–9

Appendix 3. Global Positioning System Online Positioning User Service (OPUS) solutions, Travis and Hays Counties, Barton Springs segment of the Edwards aquifer—Continued.FILE: BS330 NGS OPUS SOLUTION REPORT ======================== USER: [email protected] DATE: September 26, 2006 RINEX FILE: bs33258o.06o TIME: 12:05:12 UTC SOFTWARE: page5 0601.10 master2.pl START: 2006/09/15 14:18:00 EPHEMERIS: igr13925.eph [rapid] STOP: 2006/09/15 14:52:00 NAV FILE: brdc2580.06n OBS USED: 1292 / 1384 : 93% ANT NAME: TRM5800 NONE # FIXED AMB: 16 / 22 : 73% ARP HEIGHT: 2.25 OVERALL RMS: 0.020(m) REF FRAME: NAD_83(CORS96)(EPOCH:2002.0000) ITRF00 (EPOCH:2006.7058) X: -751713.405(m) 0.409(m) -751714.082(m) 0.409(m) Y: -5472755.512(m) 0.211(m) -5472754.060(m) 0.211(m) Z: 3177900.360(m) 0.058(m) 3177900.183(m) 0.058(m) LAT: 30 4 38.51401 0.108(m) 30 4 38.53095 0.108(m) E LON: 262 10 44.56495 0.383(m) 262 10 44.53253 0.383(m) W LON: 97 49 15.43505 0.383(m) 97 49 15.46747 0.383(m) EL HGT: 204.239(m) 0.224(m) 202.985(m) 0.224(m) ORTHO HGT: 230.047(m) 0.226(m) [Geoid03 NAVD88] UTM COORDINATES STATE PLANE COORDINATES UTM (Zone 14) SPC (4204 TXSC) Northing (Y) [meters] 3327944.077 4249277.613 Easting (X) [meters] 613631.953 713665.450 Convergence [degrees] 0.59096453 0.57762943 Point Scale 0.99975930 0.99994699 Combined Factor 0.99972724 0.99991492 US NATIONAL GRID DESIGNATOR: 14RPU1363227944(NAD 83) BASE STATIONS USED PID DESIGNATION LATITUDE LONGITUDE DISTANCE(m) DG5767 TXSM SAN MARCOS CORS ARP N295240.525 W0975409.650 23474.1 DF4373 TXAU AUSTIN RRP2 CORS ARP N301842.088 W0974522.713 26712.8 DG5761 TXBS BASTROP CORS ARP N300646.244 W0971726.172 51275.2 NEAREST NGS PUBLISHED CONTROL POINT BM0750 G 1304 N300450. W0974920. 375.6 This position and the above vector components were computed without any knowledge by the National Geodetic Survey regarding the equipment or field operating procedures used.
3–10 Geophysical Delineation of the Freshwater/Saline-Water Transition Zone, Barton Springs Segment, Edwards Aquifer

Appendix 3. Global Positioning System Online Positioning User Service (OPUS) solutions, Travis and Hays Counties, Barton Springs segment of the Edwards aquifer—Continued.FILE: BS340 NGS OPUS SOLUTION REPORT ======================== USER: [email protected] DATE: September 26, 2006 RINEX FILE: bs34258r.06o TIME: 12:05:23 UTC SOFTWARE: page5 0601.10 master2.pl START: 2006/09/15 17:51:00 EPHEMERIS: igr13925.eph [rapid] STOP: 2006/09/15 18:22:00 NAV FILE: brdc2580.06n OBS USED: 1170 / 1354 : 86% ANT NAME: TRM5800 NONE # FIXED AMB: 18 / 21 : 86% ARP HEIGHT: 2.25 OVERALL RMS: 0.020(m) REF FRAME: NAD_83(CORS96)(EPOCH:2002.0000) ITRF00 (EPOCH:2006.7062) X: -751003.512(m) 0.127(m) -751004.189(m) 0.127(m) Y: -5472745.096(m) 0.165(m) -5472743.644(m) 0.165(m) Z: 3178078.449(m) 0.103(m) 3178078.272(m) 0.103(m) LAT: 30 4 45.25798 0.022(m) 30 4 45.27492 0.022(m) E LON: 262 11 10.77253 0.104(m) 262 11 10.74011 0.104(m) W LON: 97 48 49.22747 0.104(m) 97 48 49.25989 0.104(m) EL HGT: 201.011(m) 0.208(m) 199.757(m) 0.208(m) ORTHO HGT: 226.831(m) 0.210(m) [Geoid03 NAVD88] UTM COORDINATES STATE PLANE COORDINATES UTM (Zone 14) SPC (4204 TXSC) Northing (Y) [meters] 3328158.941 4249492.354 Easting (X) [meters] 614331.456 714365.134 Convergence [degrees] 0.59464773 0.58119594 Point Scale 0.99976127 0.99994742 Combined Factor 0.99972971 0.99991585 US NATIONAL GRID DESIGNATOR: 14RPU1433128159(NAD 83) BASE STATIONS USED PID DESIGNATION LATITUDE LONGITUDE DISTANCE(m) DG5767 TXSM SAN MARCOS CORS ARP N295240.525 W0975409.650 23912.9 DF4373 TXAU AUSTIN RRP2 CORS ARP N301842.088 W0974522.713 26355.0 DG5761 TXBS BASTROP CORS ARP N300646.244 W0971726.172 50559.2 NEAREST NGS PUBLISHED CONTROL POINT BM0750 G 1304 N300450. W0974920. 836.4 This position and the above vector components were computed without any knowledge by the National Geodetic Survey regarding the equipment or field operating procedures used.
Appendix 3 3–11

Appendix 3. Global Positioning System Online Positioning User Service (OPUS) solutions, Travis and Hays Counties, Barton Springs segment of the Edwards aquifer—Continued.FILE: BS350 NGS OPUS SOLUTION REPORT ======================== USER: [email protected] DATE: September 26, 2006 RINEX FILE: bs35258u.06o TIME: 12:12:36 UTC SOFTWARE: page5 0601.10 master29.pl START: 2006/09/15 20:19:00 EPHEMERIS: igr13925.eph [rapid] STOP: 2006/09/15 20:54:00 NAV FILE: brdc2580.06n OBS USED: 1212 / 1350 : 90% ANT NAME: TRM5800 NONE # FIXED AMB: 18 / 23 : 78% ARP HEIGHT: 2.25 OVERALL RMS: 0.019(m) REF FRAME: NAD_83(CORS96)(EPOCH:2002.0000) ITRF00 (EPOCH:2006.7065) X: -750242.458(m) 1.321(m) -750243.135(m) 1.321(m) Y: -5472666.592(m) 0.527(m) -5472665.140(m) 0.527(m) Z: 3178377.809(m) 0.197(m) 3178377.632(m) 0.197(m) LAT: 30 4 56.61938 0.212(m) 30 4 56.63632 0.212(m) E LON: 262 11 38.52848 1.236(m) 262 11 38.49607 1.236(m) W LON: 97 48 21.47152 1.236(m) 97 48 21.50393 1.236(m) EL HGT: 194.267(m) 0.705(m) 193.013(m) 0.705(m) ORTHO HGT: 220.098(m) 0.706(m) [Geoid03 NAVD88] UTM COORDINATES STATE PLANE COORDINATES UTM (Zone 14) SPC (4204 TXSC) Northing (Y) [meters] 3328516.425 4249849.730 Easting (X) [meters] 615070.901 715104.801 Convergence [degrees] 0.59857013 0.58497316 Point Scale 0.99976336 0.99994813 Combined Factor 0.99973286 0.99991763 US NATIONAL GRID DESIGNATOR: 14RPU1507128516(NAD 83) BASE STATIONS USED PID DESIGNATION LATITUDE LONGITUDE DISTANCE(m) DG5767 TXSM SAN MARCOS CORS ARP N295240.525 W0975409.650 24512.9 DF4373 TXAU AUSTIN RRP2 CORS ARP N301842.088 W0974522.713 25865.6 DG5761 TXBS BASTROP CORS ARP N300646.244 W0971726.172 49791.6 NEAREST NGS PUBLISHED CONTROL POINT BM0751 T 1305 N300520. W0974907. 1416.6 This position and the above vector components were computed without any knowledge by the National Geodetic Survey regarding the equipment or field operating procedures used.
3–12 Geophysical Delineation of the Freshwater/Saline-Water Transition Zone, Barton Springs Segment, Edwards Aquifer

Appendix 3. Global Positioning System Online Positioning User Service (OPUS) solutions, Travis and Hays Counties, Barton Springs segment of the Edwards aquifer—Continued.FILE: BS360 NGS OPUS SOLUTION REPORT ======================== USER: [email protected] DATE: September 26, 2006 RINEX FILE: bs36259m.06o TIME: 12:09:51 UTC SOFTWARE: page5 0601.10 master24.pl START: 2006/09/16 12:24:00 EPHEMERIS: igr13926.eph [rapid] STOP: 2006/09/16 13:05:00 NAV FILE: brdc2590.06n OBS USED: 1286 / 1327 : 97% ANT NAME: TRM5800 NONE # FIXED AMB: 18 / 20 : 90% ARP HEIGHT: 2.25 OVERALL RMS: 0.013(m) REF FRAME: NAD_83(CORS96)(EPOCH:2002.0000) ITRF00 (EPOCH:2006.7083) X: -749357.298(m) 0.064(m) -749357.975(m) 0.064(m) Y: -5472722.947(m) 0.080(m) -5472721.495(m) 0.080(m) Z: 3178506.760(m) 0.020(m) 3178506.583(m) 0.020(m) LAT: 30 5 1.28984 0.049(m) 30 5 1.30679 0.049(m) E LON: 262 12 11.56094 0.074(m) 262 12 11.52853 0.074(m) W LON: 97 47 48.43906 0.074(m) 97 47 48.47147 0.074(m) EL HGT: 203.251(m) 0.057(m) 201.997(m) 0.057(m) ORTHO HGT: 229.097(m) 0.062(m) [Geoid03 NAVD88] UTM COORDINATES STATE PLANE COORDINATES UTM (Zone 14) SPC (4204 TXSC) Northing (Y) [meters] 3328669.474 4250002.597 Easting (X) [meters] 615953.726 715987.825 Convergence [degrees] 0.60319450 0.58946844 Point Scale 0.99976588 0.99994843 Combined Factor 0.99973397 0.99991651 US NATIONAL GRID DESIGNATOR: 14RPU1595428669(NAD 83) BASE STATIONS USED PID DESIGNATION LATITUDE LONGITUDE DISTANCE(m) DG5767 TXSM SAN MARCOS CORS ARP N295240.525 W0975409.650 24995.1 DF4373 TXAU AUSTIN RRP2 CORS ARP N301842.088 W0974522.713 25574.6 DG5761 TXBS BASTROP CORS ARP N300646.244 W0971726.172 48899.9 NEAREST NGS PUBLISHED CONTROL POINT BM0751 T 1305 N300520. W0974907. 2180.1 This position and the above vector components were computed without any knowledge by the National Geodetic Survey regarding the equipment or field operating procedures used.
Appendix 3 3–13

Appendix 3. Global Positioning System Online Positioning User Service (OPUS) solutions, Travis and Hays Counties, Barton Springs segment of the Edwards aquifer—Continued.FILE: BS370 NGS OPUS SOLUTION REPORT ======================== USER: [email protected] DATE: September 26, 2006 RINEX FILE: bs37259o.06o TIME: 12:09:55 UTC SOFTWARE: page5 0601.10 master22.pl START: 2006/09/16 14:56:00 EPHEMERIS: igr13926.eph [rapid] STOP: 2006/09/16 15:17:00 NAV FILE: brdc2590.06n OBS USED: 604 / 627 : 96% ANT NAME: TRM5800 NONE # FIXED AMB: 13 / 17 : 76% ARP HEIGHT: 2.25 OVERALL RMS: 0.017(m) REF FRAME: NAD_83(CORS96)(EPOCH:2002.0000) ITRF00 (EPOCH:2006.7086) X: -748679.099(m) 0.286(m) -748679.776(m) 0.286(m) Y: -5472628.919(m) 0.441(m) -5472627.467(m) 0.441(m) Z: 3178826.874(m) 0.229(m) 3178826.697(m) 0.229(m) LAT: 30 5 13.29841 0.138(m) 30 5 13.31537 0.138(m) E LON: 262 12 36.17608 0.343(m) 262 12 36.14369 0.343(m) W LON: 97 47 23.82392 0.343(m) 97 47 23.85631 0.343(m) EL HGT: 203.536(m) 0.421(m) 202.282(m) 0.421(m) ORTHO HGT: 229.391(m) 0.422(m) [Geoid03 NAVD88] UTM COORDINATES STATE PLANE COORDINATES UTM (Zone 14) SPC (4203 TX C) Northing (Y) [meters] 3329046.102 3049403.463 Easting (X) [meters] 616608.796 945167.699 Convergence [degrees] 0.60668403 1.30999162 Point Scale 0.99976776 1.00000804 Combined Factor 0.99973580 0.99997608 US NATIONAL GRID DESIGNATOR: 14RPU1660929046(NAD 83) BASE STATIONS USED PID DESIGNATION LATITUDE LONGITUDE DISTANCE(m) DG5767 TXSM SAN MARCOS CORS ARP N295240.525 W0975409.650 25606.2 DF4373 TXAU AUSTIN RRP2 CORS ARP N301842.088 W0974522.713 25115.9 DG5761 TXBS BASTROP CORS ARP N300646.244 W0971726.172 48217.9 NEAREST NGS PUBLISHED CONTROL POINT BM0752 S 1305 N300605. W0974840. 2590.2 This position and the above vector components were computed without any knowledge by the National Geodetic Survey regarding the equipment or field operating procedures used.
3–14 Geophysical Delineation of the Freshwater/Saline-Water Transition Zone, Barton Springs Segment, Edwards Aquifer

Appendix 3. Global Positioning System Online Positioning User Service (OPUS) solutions, Travis and Hays Counties, Barton Springs segment of the Edwards aquifer—Continued.FILE: BS410 NGS OPUS SOLUTION REPORT ======================== USER: [email protected] DATE: September 26, 2006 RINEX FILE: bs41265n.06o TIME: 12:05:58 UTC SOFTWARE: page5 0601.10 master4.pl START: 2006/09/22 13:07:00 EPHEMERIS: igr13935.eph [rapid] STOP: 2006/09/22 13:34:00 NAV FILE: brdc2650.06n OBS USED: 765 / 796 : 96% ANT NAME: TRM5800 NONE # FIXED AMB: 8 / 15 : 53% ARP HEIGHT: 2.25 OVERALL RMS: 0.010(m) REF FRAME: NAD_83(CORS96)(EPOCH:2002.0000) ITRF00 (EPOCH:2006.7248) X: -754700.271(m) 0.122(m) -754700.948(m) 0.122(m) Y: -5473850.616(m) 0.526(m) -5473849.164(m) 0.526(m) Z: 3175315.378(m) 0.299(m) 3175315.201(m) 0.299(m) LAT: 30 3 1.58820 0.119(m) 30 3 1.60511 0.119(m) E LON: 262 8 59.66887 0.060(m) 262 8 59.63643 0.060(m) W LON: 97 51 0.33113 0.060(m) 97 51 0.36357 0.060(m) EL HGT: 200.597(m) 0.613(m) 199.343(m) 0.613(m) ORTHO HGT: 226.375(m) 0.614(m) [Geoid03 NAVD88] UTM COORDINATES STATE PLANE COORDINATES UTM (Zone 14) SPC (4204 TXSC) Northing (Y) [meters] 3324931.758 4246265.353 Easting (X) [meters] 610853.574 710885.867 Convergence [degrees] 0.57588931 0.56335446 Point Scale 0.99975161 0.99994102 Combined Factor 0.99972011 0.99990952 US NATIONAL GRID DESIGNATOR: 14RPU1085424932(NAD 83) BASE STATIONS USED PID DESIGNATION LATITUDE LONGITUDE DISTANCE(m) DG5767 TXSM SAN MARCOS CORS ARP N295240.525 W0975409.650 19786.6 DF4373 TXAU AUSTIN RRP2 CORS ARP N301842.088 W0974522.713 30337.6 DG5761 TXBS BASTROP CORS ARP N300646.244 W0971726.172 54381.8 NEAREST NGS PUBLISHED CONTROL POINT BM0661 A 329 N300328. W0975124. 1033.6 This position and the above vector components were computed without any knowledge by the National Geodetic Survey regarding the equipment or field operating procedures used.
Appendix 3 3–15

Appendix 3. Global Positioning System Online Positioning User Service (OPUS) solutions, Travis and Hays Counties, Barton Springs segment of the Edwards aquifer—Continued.FILE: BS420 NGS OPUS SOLUTION REPORT ======================== USER: [email protected] DATE: September 26, 2006 RINEX FILE: bs42261p.06o TIME: 11:58:53 UTC SOFTWARE: page5 0601.10 master10.pl START: 2006/09/18 15:07:00 EPHEMERIS: igr13931.eph [rapid] STOP: 2006/09/18 15:51:00 NAV FILE: brdc2610.06n OBS USED: 1130 / 1185 : 95% ANT NAME: TRM5800 NONE # FIXED AMB: 11 / 15 : 73% ARP HEIGHT: 2.25 OVERALL RMS: 0.012(m) REF FRAME: NAD_83(CORS96)(EPOCH:2002.0000) ITRF00 (EPOCH:2006.7141) X: -752373.060(m) 0.334(m) -752373.737(m) 0.334(m) Y: -5474326.208(m) 0.305(m) -5474324.756(m) 0.305(m) Z: 3175019.614(m) 0.178(m) 3175019.437(m) 0.178(m) LAT: 30 2 50.77355 0.072(m) 30 2 50.79047 0.072(m) E LON: 262 10 28.14890 0.359(m) 262 10 28.11649 0.359(m) W LON: 97 49 31.85110 0.359(m) 97 49 31.88351 0.359(m) EL HGT: 185.616(m) 0.316(m) 184.362(m) 0.316(m) ORTHO HGT: 211.447(m) 0.316(m) [Geoid03 NAVD88] UTM COORDINATES STATE PLANE COORDINATES UTM (Zone 14) SPC (4204 TXSC) Northing (Y) [meters] 3324622.917 4245955.931 Easting (X) [meters] 613226.508 713259.174 Convergence [degrees] 0.58814748 0.57539542 Point Scale 0.99975817 0.99994037 Combined Factor 0.99972903 0.99991122 US NATIONAL GRID DESIGNATOR: 14RPU1322724623(NAD 83) BASE STATIONS USED PID DESIGNATION LATITUDE LONGITUDE DISTANCE(m) DG5767 TXSM SAN MARCOS CORS ARP N295240.525 W0975409.650 20213.7 DF4373 TXAU AUSTIN RRP2 CORS ARP N301842.088 W0974522.713 30043.6 DG5761 TXBS BASTROP CORS ARP N300646.244 W0971726.172 52078.2 NEAREST NGS PUBLISHED CONTROL POINT BM0747 W 1305 N300255. W0975018. 1242.1 This position and the above vector components were computed without any knowledge by the National Geodetic Survey regarding the equipment or field operating procedures used.
3–16 Geophysical Delineation of the Freshwater/Saline-Water Transition Zone, Barton Springs Segment, Edwards Aquifer

Appendix 3. Global Positioning System Online Positioning User Service (OPUS) solutions, Travis and Hays Counties, Barton Springs segment of the Edwards aquifer—Continued.FILE: BS440 NGS OPUS SOLUTION REPORT ======================== USER: [email protected] DATE: September 26, 2006 RINEX FILE: bs44262s.06o TIME: 12:06:15 UTC SOFTWARE: page5 0601.10 master3.pl START: 2006/09/19 18:18:00 EPHEMERIS: igr13932.eph [rapid] STOP: 2006/09/19 18:48:00 NAV FILE: brdc2620.06n OBS USED: 1025 / 1077 : 95% ANT NAME: TRM5800 NONE # FIXED AMB: 17 / 20 : 85% ARP HEIGHT: 2.25 OVERALL RMS: 0.016(m) REF FRAME: NAD_83(CORS96)(EPOCH:2002.0000) ITRF00 (EPOCH:2006.7172) X: -753919.996(m) 0.185(m) -753920.673(m) 0.185(m) Y: -5473805.046(m) 0.230(m) -5473803.594(m) 0.230(m) Z: 3175573.909(m) 0.155(m) 3175573.732(m) 0.155(m) LAT: 30 3 11.32162 0.010(m) 30 3 11.33854 0.010(m) E LON: 262 9 28.29104 0.169(m) 262 9 28.25861 0.169(m) W LON: 97 50 31.70896 0.169(m) 97 50 31.74139 0.169(m) EL HGT: 198.791(m) 0.297(m) 197.537(m) 0.297(m) ORTHO HGT: 224.582(m) 0.298(m) [Geoid03 NAVD88] UTM COORDINATES STATE PLANE COORDINATES UTM (Zone 14) SPC (4204 TXSC) Northing (Y) [meters] 3325239.117 4246572.603 Easting (X) [meters] 611617.049 711649.554 Convergence [degrees] 0.57991919 0.56724956 Point Scale 0.99975370 0.99994161 Combined Factor 0.99972249 0.99991039 US NATIONAL GRID DESIGNATOR: 14RPU1161725239(NAD 83) BASE STATIONS USED PID DESIGNATION LATITUDE LONGITUDE DISTANCE(m) DG5767 TXSM SAN MARCOS CORS ARP N295240.525 W0975409.650 20284.0 DF4373 TXAU AUSTIN RRP2 CORS ARP N301842.088 W0974522.713 29830.5 DG5761 TXBS BASTROP CORS ARP N300646.244 W0971726.172 53582.9 NEAREST NGS PUBLISHED CONTROL POINT BM0747 W 1305 N300255. W0975018. 624.0 This position and the above vector components were computed without any knowledge by the National Geodetic Survey regarding the equipment or field operating procedures used.
Appendix 3 3–17

Appendix 3. Global Positioning System Online Positioning User Service (OPUS) solutions, Travis and Hays Counties, Barton Springs segment of the Edwards aquifer—Continued.FILE: BS450 NGS OPUS SOLUTION REPORT ======================== USER: [email protected] DATE: September 26, 2006 RINEX FILE: bs45254q.06o TIME: 12:10:43 UTC SOFTWARE: page5 0601.10 master23.pl START: 2006/09/11 16:56:00 EPHEMERIS: igr13921.eph [rapid] STOP: 2006/09/11 19:42:00 NAV FILE: brdc2540.06n OBS USED: 6301 / 6667 : 95% ANT NAME: TRM5800 NONE # FIXED AMB: 35 / 35 : 100% ARP HEIGHT: 2.25 OVERALL RMS: 0.020(m) REF FRAME: NAD_83(CORS96)(EPOCH:2002.0000) ITRF00 (EPOCH:2006.6952) X: -753467.735(m) 0.011(m) -753468.411(m) 0.011(m) Y: -5474026.250(m) 0.017(m) -5474024.798(m) 0.017(m) Z: 3175283.445(m) 0.003(m) 3175283.268(m) 0.003(m) LAT: 30 3 0.59648 0.009(m) 30 3 0.61340 0.009(m) E LON: 262 9 46.14212 0.013(m) 262 9 46.10973 0.013(m) W LON: 97 50 13.85788 0.013(m) 97 50 13.89027 0.013(m) EL HGT: 189.615(m) 0.013(m) 188.361(m) 0.013(m) ORTHO HGT: 215.420(m) 0.028(m) [Geoid03 NAVD88] UTM COORDINATES STATE PLANE COORDINATES UTM (Zone 14) SPC (4204 TXSC) Northing (Y) [meters] 3324913.809 4246247.128 Easting (X) [meters] 612098.447 712130.970 Convergence [degrees] 0.58235093 0.56967885 Point Scale 0.99975503 0.99994096 Combined Factor 0.99972526 0.99991119 US NATIONAL GRID DESIGNATOR: 14RPU1209824914(NAD 83) BASE STATIONS USED PID DESIGNATION LATITUDE LONGITUDE DISTANCE(m) DG5767 TXSM SAN MARCOS CORS ARP N295240.525 W0975409.650 20113.3 DF4373 TXAU AUSTIN RRP2 CORS ARP N301842.088 W0974522.713 30020.5 DG5761 TXBS BASTROP CORS ARP N300646.244 W0971726.172 53151.6 NEAREST NGS PUBLISHED CONTROL POINT BM0747 W 1305 N300255. W0975018. 205.5 This position and the above vector components were computed without any knowledge by the National Geodetic Survey regarding the equipment or field operating procedures used.
3–18 Geophysical Delineation of the Freshwater/Saline-Water Transition Zone, Barton Springs Segment, Edwards Aquifer

Appendix 3. Global Positioning System Online Positioning User Service (OPUS) solutions, Travis and Hays Counties, Barton Springs segment of the Edwards aquifer—Continued.FILE: BS460 NGS OPUS SOLUTION REPORT ======================== USER: [email protected] DATE: September 26, 2006 RINEX FILE: bs46260m.06o TIME: 12:06:42 UTC SOFTWARE: page5 0601.10 master3.pl START: 2006/09/17 12:57:00 EPHEMERIS: igr13930.eph [rapid] STOP: 2006/09/17 13:28:00 NAV FILE: brdc2600.06n OBS USED: 890 / 933 : 95% ANT NAME: TRM5800 NONE # FIXED AMB: 12 / 15 : 80% ARP HEIGHT: 2.25 OVERALL RMS: 0.011(m) REF FRAME: NAD_83(CORS96)(EPOCH:2002.0000) ITRF00 (EPOCH:2006.7111) X: -752836.478(m) 0.147(m) -752837.155(m) 0.147(m) Y: -5474103.708(m) 0.620(m) -5474102.256(m) 0.620(m) Z: 3175290.520(m) 0.341(m) 3175290.343(m) 0.341(m) LAT: 30 3 0.94669 0.597(m) 30 3 0.96361 0.597(m) E LON: 262 10 9.88032 0.196(m) 262 10 9.84790 0.196(m) W LON: 97 49 50.11968 0.196(m) 97 49 50.15210 0.196(m) EL HGT: 185.103(m) 0.348(m) 183.849(m) 0.348(m) ORTHO HGT: 210.921(m) 0.348(m) [Geoid03 NAVD88] UTM COORDINATES STATE PLANE COORDINATES UTM (Zone 14) SPC (4204 TXSC) Northing (Y) [meters] 3324931.070 4246264.250 Easting (X) [meters] 612734.054 712766.698 Convergence [degrees] 0.58565566 0.57290931 Point Scale 0.99975680 0.99994098 Combined Factor 0.99972773 0.99991192 US NATIONAL GRID DESIGNATOR: 14RPU1273424931(NAD 83) BASE STATIONS USED PID DESIGNATION LATITUDE LONGITUDE DISTANCE(m) DG5765 TXJC JOHNSON CITY CORS ARP N301559.202 W0982350.395 59626.3 DF4373 TXAU AUSTIN RRP2 CORS ARP N301842.088 W0974522.713 29851.8 DG5761 TXBS BASTROP CORS ARP N300646.244 W0971726.172 52519.9 NEAREST NGS PUBLISHED CONTROL POINT BM0747 W 1305 N300255. W0975018. 768.6 This position and the above vector components were computed without any knowledge by the National Geodetic Survey regarding the equipment or field operating procedures used.
Appendix 3 3–19

Appendix 3. Global Positioning System Online Positioning User Service (OPUS) solutions, Travis and Hays Counties, Barton Springs segment of the Edwards aquifer—Continued.FILE: BS470 NGS OPUS SOLUTION REPORT ======================== USER: [email protected] DATE: September 26, 2006 RINEX FILE: bs47261s.06o TIME: 12:06:53 UTC SOFTWARE: page5 0601.10 master3.pl START: 2006/09/18 18:12:00 EPHEMERIS: igr13931.eph [rapid] STOP: 2006/09/18 18:52:00 NAV FILE: brdc2610.06n OBS USED: 1409 / 1481 : 95% ANT NAME: TRM5800 NONE # FIXED AMB: 14 / 23 : 61% ARP HEIGHT: 2.25 OVERALL RMS: 0.015(m) REF FRAME: NAD_83(CORS96)(EPOCH:2002.0000) ITRF00 (EPOCH:2006.7144) X: -754292.657(m) 0.314(m) -754293.334(m) 0.314(m) Y: -5473402.507(m) 0.044(m) -5473401.055(m) 0.044(m) Z: 3176176.643(m) 0.033(m) 3176176.466(m) 0.033(m) LAT: 30 3 33.92172 0.029(m) 30 3 33.93864 0.029(m) E LON: 262 9 12.45850 0.317(m) 262 9 12.42606 0.317(m) W LON: 97 50 47.54150 0.317(m) 97 50 47.57394 0.317(m) EL HGT: 199.542(m) 0.028(m) 198.289(m) 0.028(m) ORTHO HGT: 225.317(m) 0.037(m) [Geoid03 NAVD88] UTM COORDINATES STATE PLANE COORDINATES UTM (Zone 14) SPC (4204 TXSC) Northing (Y) [meters] 3325930.542 4247264.254 Easting (X) [meters] 611186.046 711218.622 Convergence [degrees] 0.57782541 0.56509496 Point Scale 0.99975252 0.99994299 Combined Factor 0.99972119 0.99991165 US NATIONAL GRID DESIGNATOR: 14RPU1118625931(NAD 83) BASE STATIONS USED PID DESIGNATION LATITUDE LONGITUDE DISTANCE(m) DG5767 TXSM SAN MARCOS CORS ARP N295240.525 W0975409.650 20836.9 DF4373 TXAU AUSTIN RRP2 CORS ARP N301842.088 W0974522.713 29285.2 DG5761 TXBS BASTROP CORS ARP N300646.244 W0971726.172 53921.1 NEAREST NGS PUBLISHED CONTROL POINT BM0661 A 329 N300328. W0975124. 992.8 This position and the above vector components were computed without any knowledge by the National Geodetic Survey regarding the equipment or field operating procedures used.
3–20 Geophysical Delineation of the Freshwater/Saline-Water Transition Zone, Barton Springs Segment, Edwards Aquifer
Appendix 3. Global Positioning System Online Positioning User Service (OPUS) solutions, Travis and Hays Counties, Barton Springs segment of the Edwards aquifer—Continued.FILE: BS520 NGS OPUS SOLUTION REPORT ======================== USER: [email protected] DATE: September 26, 2006 RINEX FILE: bs52262m.06o TIME: 12:11:07 UTC SOFTWARE: page5 0601.10 master25.pl START: 2006/09/19 12:54:00 EPHEMERIS: igr13932.eph [rapid] STOP: 2006/09/19 13:29:00 NAV FILE: brdc2620.06n OBS USED: 1016 / 1046 : 97% ANT NAME: TRM5800 NONE # FIXED AMB: 15 / 15 : 100% ARP HEIGHT: 2.25 OVERALL RMS: 0.012(m) REF FRAME: NAD_83(CORS96)(EPOCH:2002.0000) ITRF00 (EPOCH:2006.7166) X: -755767.091(m) 0.022(m) -755767.768(m) 0.022(m) Y: -5474684.986(m) 0.047(m) -5474683.534(m) 0.047(m) Z: 3173615.223(m) 0.051(m) 3173615.046(m) 0.051(m) LAT: 30 1 57.98577 0.019(m) 30 1 58.00266 0.019(m) E LON: 262 8 24.47919 0.017(m) 262 8 24.44675 0.017(m) W LON: 97 51 35.52081 0.017(m) 97 51 35.55325 0.017(m) EL HGT: 191.168(m) 0.068(m) 189.914(m) 0.068(m) ORTHO HGT: 216.945(m) 0.073(m) [Geoid03 NAVD88] UTM COORDINATES STATE PLANE COORDINATES UTM (Zone 14) SPC (4204 TXSC) Northing (Y) [meters] 3322964.434 4244297.857 Easting (X) [meters] 609930.697 709962.392 Convergence [degrees] 0.57068857 0.55856560 Point Scale 0.99974910 0.99993722 Combined Factor 0.99971908 0.99990720 US NATIONAL GRID DESIGNATOR: 14RPU0993122964(NAD 83) BASE STATIONS USED PID DESIGNATION LATITUDE LONGITUDE DISTANCE(m) DG5767 TXSM SAN MARCOS CORS ARP N295240.525 W0975409.650 17656.4 DF4373 TXAU AUSTIN RRP2 CORS ARP N301842.088 W0974522.713 32489.5 DG5761 TXBS BASTROP CORS ARP N300646.244 W0971726.172 55600.3 NEAREST NGS PUBLISHED CONTROL POINT BM0662 B 329 N300214. W0975151. 645.7 This position and the above vector components were computed without any knowledge by the National Geodetic Survey regarding the equipment or field operating procedures used.
Appendix 3 3–21

Appendix 3. Global Positioning System Online Positioning User Service (OPUS) solutions, Travis and Hays Counties, Barton Springs segment of the Edwards aquifer—Continued.FILE: BS522 NGS OPUS SOLUTION REPORT ======================== USER: [email protected] DATE: September 26, 2006 RINEX FILE: bs52264t.06o TIME: 12:11:20 UTC SOFTWARE: page5 0601.10 master23.pl START: 2006/09/21 19:14:00 EPHEMERIS: igr13934.eph [rapid] STOP: 2006/09/21 20:14:00 NAV FILE: brdc2640.06n OBS USED: 2159 / 2309 : 94% ANT NAME: TRM5800 NONE # FIXED AMB: 21 / 24 : 88% ARP HEIGHT: 2.25 OVERALL RMS: 0.020(m) REF FRAME: NAD_83(CORS96)(EPOCH:2002.0000) ITRF00 (EPOCH:2006.7228) X: -755605.997(m) 0.481(m) -755606.674(m) 0.481(m) Y: -5474517.701(m) 0.486(m) -5474516.249(m) 0.486(m) Z: 3173949.627(m) 0.252(m) 3173949.450(m) 0.252(m) LAT: 30 2 10.43875 0.056(m) 30 2 10.45565 0.056(m) E LON: 262 8 29.58146 0.410(m) 262 8 29.54902 0.410(m) W LON: 97 51 30.41854 0.410(m) 97 51 30.45098 0.410(m) EL HGT: 196.012(m) 0.600(m) 194.758(m) 0.600(m) ORTHO HGT: 221.788(m) 0.600(m) [Geoid03 NAVD88] UTM COORDINATES STATE PLANE COORDINATES UTM (Zone 14) SPC (4204 TXSC) Northing (Y) [meters] 3323349.139 4244682.606 Easting (X) [meters] 610063.537 710095.339 Convergence [degrees] 0.57145780 0.55925996 Point Scale 0.99974946 0.99993796 Combined Factor 0.99971868 0.99990718 US NATIONAL GRID DESIGNATOR: 14RPU1006423349(NAD 83) BASE STATIONS USED PID DESIGNATION LATITUDE LONGITUDE DISTANCE(m) DG5767 TXSM SAN MARCOS CORS ARP N295240.525 W0975409.650 18061.4 DF4373 TXAU AUSTIN RRP2 CORS ARP N301842.088 W0974522.713 32082.7 DG5761 TXBS BASTROP CORS ARP N300646.244 W0971726.172 55404.5 NEAREST NGS PUBLISHED CONTROL POINT BM0662 B 329 N300214. W0975151. 561.9 This position and the above vector components were computed without any knowledge by the National Geodetic Survey regarding the equipment or field operating procedures used.
3–22 Geophysical Delineation of the Freshwater/Saline-Water Transition Zone, Barton Springs Segment, Edwards Aquifer

Appendix 3. Global Positioning System Online Positioning User Service (OPUS) solutions, Travis and Hays Counties, Barton Springs segment of the Edwards aquifer—Continued.FILE: BS524 NGS OPUS SOLUTION REPORT ======================== USER: [email protected] DATE: September 26, 2006 RINEX FILE: bs52264q.06o TIME: 12:00:15 UTC SOFTWARE: page5 0601.10 master13.pl START: 2006/09/21 16:58:00 EPHEMERIS: igr13934.eph [rapid] STOP: 2006/09/21 17:34:00 NAV FILE: brdc2640.06n OBS USED: 1474 / 1731 : 85% ANT NAME: TRM5800 NONE # FIXED AMB: 20 / 28 : 71% ARP HEIGHT: 2.25 OVERALL RMS: 0.020(m) REF FRAME: NAD_83(CORS96)(EPOCH:2002.0000) ITRF00 (EPOCH:2006.7225) X: -755225.737(m) 0.183(m) -755226.414(m) 0.183(m) Y: -5474536.875(m) 0.085(m) -5474535.423(m) 0.085(m) Z: 3174024.952(m) 0.179(m) 3174024.775(m) 0.179(m) LAT: 30 2 13.09255 0.132(m) 30 2 13.10945 0.132(m) E LON: 262 8 43.73871 0.193(m) 262 8 43.70628 0.193(m) W LON: 97 51 16.26129 0.193(m) 97 51 16.29372 0.193(m) EL HGT: 205.161(m) 0.131(m) 203.908(m) 0.131(m) ORTHO HGT: 230.945(m) 0.133(m) [Geoid03 NAVD88] UTM COORDINATES STATE PLANE COORDINATES UTM (Zone 14) SPC (4204 TXSC) Northing (Y) [meters] 3323434.621 4244768.023 Easting (X) [meters] 610441.907 710473.798 Convergence [degrees] 0.57343960 0.56118657 Point Scale 0.99975049 0.99993812 Combined Factor 0.99971827 0.99990590 US NATIONAL GRID DESIGNATOR: 14RPU1044223435(NAD 83) BASE STATIONS USED PID DESIGNATION LATITUDE LONGITUDE DISTANCE(m) DG5767 TXSM SAN MARCOS CORS ARP N295240.525 W0975409.650 18233.9 DF4373 TXAU AUSTIN RRP2 CORS ARP N301842.088 W0974522.713 31890.4 DG5761 TXBS BASTROP CORS ARP N300646.244 W0971726.172 55017.2 NEAREST NGS PUBLISHED CONTROL POINT BM0746 J 1307 N300208. W0975043. 904.2 This position and the above vector components were computed without any knowledge by the National Geodetic Survey regarding the equipment or field operating procedures used.
Appendix 3 3–23

Appendix 3. Global Positioning System Online Positioning User Service (OPUS) solutions, Travis and Hays Counties, Barton Springs segment of the Edwards aquifer—Continued.FILE: BS530 NGS OPUS SOLUTION REPORT ======================== USER: [email protected] DATE: September 26, 2006 RINEX FILE: bs53262p.06o TIME: 12:00:27 UTC SOFTWARE: page5 0601.10 master13.pl START: 2006/09/19 15:42:00 EPHEMERIS: igr13932.eph [rapid] STOP: 2006/09/19 16:10:00 NAV FILE: brdc2620.06n OBS USED: 755 / 788 : 96% ANT NAME: TRM5800 NONE # FIXED AMB: 12 / 15 : 80% ARP HEIGHT: 2.25 OVERALL RMS: 0.012(m) REF FRAME: NAD_83(CORS96)(EPOCH:2002.0000) ITRF00 (EPOCH:2006.7169) X: -754478.677(m) 0.323(m) -754479.354(m) 0.323(m) Y: -5474468.612(m) 0.445(m) -5474467.160(m) 0.445(m) Z: 3174309.206(m) 0.196(m) 3174309.029(m) 0.196(m) LAT: 30 2 23.84181 0.032(m) 30 2 23.85872 0.032(m) E LON: 262 9 11.01278 0.381(m) 262 9 10.98035 0.381(m) W LON: 97 50 48.98722 0.381(m) 97 50 49.01965 0.381(m) EL HGT: 200.575(m) 0.441(m) 199.321(m) 0.441(m) ORTHO HGT: 226.371(m) 0.442(m) [Geoid03 NAVD88] UTM COORDINATES STATE PLANE COORDINATES UTM (Zone 14) SPC (4204 TXSC) Northing (Y) [meters] 3323772.854 4245106.164 Easting (X) [meters] 611169.076 711201.176 Convergence [degrees] 0.57728508 0.56489821 Point Scale 0.99975247 0.99993876 Combined Factor 0.99972098 0.99990726 US NATIONAL GRID DESIGNATOR: 14RPU1116923773(NAD 83) BASE STATIONS USED PID DESIGNATION LATITUDE LONGITUDE DISTANCE(m) DG5767 TXSM SAN MARCOS CORS ARP N295240.525 W0975409.650 18750.6 DF4373 TXAU AUSTIN RRP2 CORS ARP N301842.088 W0974522.713 31363.6 DG5761 TXBS BASTROP CORS ARP N300646.244 W0971726.172 54244.0 NEAREST NGS PUBLISHED CONTROL POINT BM0746 J 1307 N300208. W0975043. 515.4 This position and the above vector components were computed without any knowledge by the National Geodetic Survey regarding the equipment or field operating procedures used.
3–24 Geophysical Delineation of the Freshwater/Saline-Water Transition Zone, Barton Springs Segment, Edwards Aquifer

Appendix 3. Global Positioning System Online Positioning User Service (OPUS) solutions, Travis and Hays Counties, Barton Springs segment of the Edwards aquifer—Continued.FILE: BS540 NGS OPUS SOLUTION REPORT ======================== USER: [email protected] DATE: September 26, 2006 RINEX FILE: bs54263n.06o TIME: 12:07:50 UTC SOFTWARE: page5 0601.10 master2.pl START: 2006/09/20 13:46:00 EPHEMERIS: igr13933.eph [rapid] STOP: 2006/09/20 14:18:00 NAV FILE: brdc2630.06n OBS USED: 1176 / 1234 : 95% ANT NAME: TRM5800 NONE # FIXED AMB: 16 / 21 : 76% ARP HEIGHT: 2.25 OVERALL RMS: 0.014(m) REF FRAME: NAD_83(CORS96)(EPOCH:2002.0000) ITRF00 (EPOCH:2006.7194) X: -754171.866(m) 0.038(m) -754172.543(m) 0.038(m) Y: -5474636.901(m) 0.519(m) -5474635.449(m) 0.519(m) Z: 3174076.660(m) 0.215(m) 3174076.483(m) 0.215(m) LAT: 30 2 15.27498 0.101(m) 30 2 15.29188 0.101(m) E LON: 262 9 23.21451 0.033(m) 262 9 23.18208 0.033(m) W LON: 97 50 36.78549 0.033(m) 97 50 36.81792 0.033(m) EL HGT: 192.234(m) 0.557(m) 190.980(m) 0.557(m) ORTHO HGT: 218.040(m) 0.557(m) [Geoid03 NAVD88] UTM COORDINATES STATE PLANE COORDINATES UTM (Zone 14) SPC (4204 TXSC) Northing (Y) [meters] 3323512.436 4244845.626 Easting (X) [meters] 611498.540 711530.645 Convergence [degrees] 0.57894075 0.56655871 Point Scale 0.99975338 0.99993825 Combined Factor 0.99972320 0.99990806 US NATIONAL GRID DESIGNATOR: 14RPU1149923512(NAD 83) BASE STATIONS USED PID DESIGNATION LATITUDE LONGITUDE DISTANCE(m) DG5767 TXSM SAN MARCOS CORS ARP N295240.525 W0975409.650 18595.9 DF4373 TXAU AUSTIN RRP2 CORS ARP N301842.088 W0974522.713 31528.5 DG5761 TXBS BASTROP CORS ARP N300646.244 W0971726.172 53961.8 NEAREST NGS PUBLISHED CONTROL POINT BM0746 J 1307 N300208. W0975043. 279.8 This position and the above vector components were computed without any knowledge by the National Geodetic Survey regarding the equipment or field operating procedures used.
Appendix 3 3–25

Appendix 3. Global Positioning System Online Positioning User Service (OPUS) solutions, Travis and Hays Counties, Barton Springs segment of the Edwards aquifer—Continued.FILE: BS550 NGS OPUS SOLUTION REPORT ======================== USER: [email protected] DATE: September 26, 2006 RINEX FILE: bs55263q.06o TIME: 12:07:58 UTC SOFTWARE: page5 0601.10 master.pl START: 2006/09/20 16:16:00 EPHEMERIS: igr13933.eph [rapid] STOP: 2006/09/20 16:53:00 NAV FILE: brdc2630.06n OBS USED: 1371 / 1468 : 93% ANT NAME: TRM5800 NONE # FIXED AMB: 18 / 21 : 86% ARP HEIGHT: 2.25 OVERALL RMS: 0.016(m) REF FRAME: NAD_83(CORS96)(EPOCH:2002.0000) ITRF00 (EPOCH:2006.7197) X: -753528.138(m) 0.405(m) -753528.815(m) 0.405(m) Y: -5474787.827(m) 0.392(m) -5474786.374(m) 0.392(m) Z: 3173958.472(m) 0.279(m) 3173958.295(m) 0.279(m) LAT: 30 2 10.94930 0.029(m) 30 2 10.96622 0.029(m) E LON: 262 9 47.78468 0.348(m) 262 9 47.75225 0.348(m) W LON: 97 50 12.21532 0.348(m) 97 50 12.24775 0.348(m) EL HGT: 186.492(m) 0.524(m) 185.237(m) 0.524(m) ORTHO HGT: 212.314(m) 0.524(m) [Geoid03 NAVD88] UTM COORDINATES STATE PLANE COORDINATES UTM (Zone 14) SPC (4204 TXSC) Northing (Y) [meters] 3323385.947 4244718.970 Easting (X) [meters] 612157.973 712190.172 Convergence [degrees] 0.58233710 0.56990238 Point Scale 0.99975520 0.99993799 Combined Factor 0.99972592 0.99990870 US NATIONAL GRID DESIGNATOR: 14RPU1215823386(NAD 83) BASE STATIONS USED PID DESIGNATION LATITUDE LONGITUDE DISTANCE(m) DG5767 TXSM SAN MARCOS CORS ARP N295240.525 W0975409.650 18683.2 DF4373 TXAU AUSTIN RRP2 CORS ARP N301842.088 W0974522.713 31488.7 DG5761 TXBS BASTROP CORS ARP N300646.244 W0971726.172 53332.9 NEAREST NGS PUBLISHED CONTROL POINT BM0746 J 1307 N300208. W0975043. 829.1 This position and the above vector components were computed without any knowledge by the National Geodetic Survey regarding the equipment or field operating procedures used.
3–26 Geophysical Delineation of the Freshwater/Saline-Water Transition Zone, Barton Springs Segment, Edwards Aquifer

Appendix 3. Global Positioning System Online Positioning User Service (OPUS) solutions, Travis and Hays Counties, Barton Springs segment of the Edwards aquifer—Continued.FILE: BS560 NGS OPUS SOLUTION REPORT ======================== USER: [email protected] DATE: September 26, 2006 RINEX FILE: bs56263s.06o TIME: 12:15:13 UTC SOFTWARE: page5 0601.10 master29.pl START: 2006/09/20 18:40:00 EPHEMERIS: igr13933.eph [rapid] STOP: 2006/09/20 19:05:00 NAV FILE: brdc2630.06n OBS USED: 675 / 731 : 92% ANT NAME: TRM5800 NONE # FIXED AMB: 12 / 16 : 75% ARP HEIGHT: 2.25 OVERALL RMS: 0.013(m) REF FRAME: NAD_83(CORS96)(EPOCH:2002.0000) ITRF00 (EPOCH:2006.7200) X: -753327.144(m) 0.061(m) -753327.821(m) 0.061(m) Y: -5474682.990(m) 0.448(m) -5474681.538(m) 0.448(m) Z: 3174204.266(m) 0.348(m) 3174204.089(m) 0.348(m) LAT: 30 2 19.99304 0.081(m) 30 2 20.00995 0.081(m) E LON: 262 9 54.68306 0.082(m) 262 9 54.65064 0.082(m) W LON: 97 50 5.31694 0.082(m) 97 50 5.34936 0.082(m) EL HGT: 195.897(m) 0.555(m) 194.643(m) 0.555(m) ORTHO HGT: 221.720(m) 0.556(m) [Geoid03 NAVD88] UTM COORDINATES STATE PLANE COORDINATES UTM (Zone 14) SPC (4204 TXSC) Northing (Y) [meters] 3323666.223 4244999.258 Easting (X) [meters] 612339.905 712372.198 Convergence [degrees] 0.58334079 0.57084116 Point Scale 0.99975570 0.99993853 Combined Factor 0.99972494 0.99990776 US NATIONAL GRID DESIGNATOR: 14RPU1234023666(NAD 83) BASE STATIONS USED PID DESIGNATION LATITUDE LONGITUDE DISTANCE(m) DG5767 TXSM SAN MARCOS CORS ARP N295240.525 W0975409.650 19008.3 DF4373 TXAU AUSTIN RRP2 CORS ARP N301842.088 W0974522.713 31173.6 DG5761 TXBS BASTROP CORS ARP N300646.244 W0971726.172 53106.5 NEAREST NGS PUBLISHED CONTROL POINT BM0746 J 1307 N300208. W0975043. 1074.8 This position and the above vector components were computed without any knowledge by the National Geodetic Survey regarding the equipment or field operating procedures used.
Appendix 3 3–27

Blank Page

Appendix 4Appendix 4—Raw Time-Domain Electromagnetic Voltages and Computed Standard Deviations

Blank Page

Appendix 4. Raw time-domain electromagnetic voltages and computed standard deviations for soundings, Barton Springs segment of the Edwards aquifer, Travis and Hays Counties, Texas. Link to Excel file.
[Voltages in nanovolts; ms, milliseconds; h, high; m, medium; l, low; u, ultra-high; v, very high]
Appendix 4 4–3

4–4 Geophysical Delineation of the Freshwater/Saline-Water Transition Zone, Barton Springs Segment, Edwards Aquifer
Figure 4.1. Percentage standard deviation of the average voltages of the ultra-high, very-high, high, medium, and low frequency data collected from time-domain electromagnetic soundings along profile 2, Barton Springs segment of the Edwards aquifer, Travis and Hays Counties, Texas.
0
10
20
30
40
50
60
70
80
90
100
0
10
20
30
40
50
60
70
80
90
100
0
10
20
30
40
50
60
70
80
90
100
0
10
20
30
40
50
60
70
80
90
100
0
10
20
30
40
50
60
70
80
90
100
0 5 10 15 20
STA
ND
ARD
DEV
IATI
ON
, IN
PER
CEN
T
GATES
ULTRA-HIGH FREQUENCY
VERY-HIGH FREQUENCY
HIGH FREQUENCY
MEDIUM FREQUENCY
LOW FREQUENCY
EXPLANATION
Sounding number
Soundings for each frequency

Appendix 4 4–5
Figure 4.2. Percentage standard deviation of the average voltages of the ultra-high, very-high, high, medium, and low frequency data collected from time-domain electromagnetic soundings along profile 3, Barton Springs segment of the Edwards aquifer, Travis and Hays Counties, Texas.
STA
ND
ARD
DEV
IATI
ON
, IN
PER
CEN
T
GATES
0
10
20
30
40
50
60
70
80
90
100
0
10
20
30
40
5060
70
80
90
100
0
10
20
30
40
50
60
70
80
90
100
0
10
20
30
40
50
60
70
80
90
100
0
20
40
60
80
100
120
140
160
0 5 10 15 20
EXPLANATION
Sounding number
Soundings for each frequency

4–6 Geophysical Delineation of the Freshwater/Saline-Water Transition Zone, Barton Springs Segment, Edwards Aquifer
Figure 4.3. Percentage standard deviation of the average voltages of the ultra-high, very-high, high, medium, and low frequency data collected from time-domain electromagnetic soundings along profile 4, Barton Springs segment of the Edwards aquifer, Travis and Hays Counties, Texas.
STA
ND
ARD
DEV
IATI
ON
, IN
PER
CEN
T
GATES
01020
3040506070
8090100
01020
3040506070
8090100
01020
3040506070
8090100
01020
3040506070
8090100
01020
3040506070
8090100
0 5 10 15 20
ULTRA-HIGH FREQUENCY
VERY-HIGH FREQUENCY
HIGH FREQUENCY
MEDIUM FREQUENCY
LOW FREQUENCY
EXPLANATION
Sounding number
Soundings for each frequency

Appendix 4 4–7
Figure 4.4. Percentage standard deviation of the average voltages of the ultra-high, very-high, high, medium, and low frequency data collected from time-domain electromagnetic soundings along profile 5, Barton Springs segment of the Edwards aquifer, Travis and Hays Counties, Texas.
STA
ND
ARD
DEV
IATI
ON
, IN
PER
CEN
T
GATES
0
10
20
30
40
50
60
70
80
90
100
0
10
20
30
40
50
60
70
80
90
100
0
10
20
30
40
50
60
70
80
90
100
0
10
20
30
40
50
60
70
80
90
100
0
10
20
30
40
50
60
70
80
90
100
0 2 4 6 8 10 12 14 16 18 20
ULTRA-HIGH FREQUENCY
VERY-HIGH FREQUENCY
HIGH FREQUENCY
MEDIUM FREQUENCY
LOW FREQUENCY
EXPLANATION
Sounding number
Soundings for each frequency

Blank Page

Appendix 5Appendix 5—Graphs Showing Time-Domain Electromagnetic Resistivity From Field Measurements as a Function of Time and Inverse Modeling Results (Smooth Models)

Blank Page

Figu
re 5
.1.
Soun
ding
site
200
: (A)
tim
e-do
mai
n el
ectro
mag
netic
(TDE
M) s
ound
ing
raw
dat
a (a
ppar
ent r
esis
tivity
from
fiel
d m
easu
rem
ents
) as
a fu
nctio
n of
tim
e; (B
) TDE
M
soun
ding
sm
ooth
dat
a (a
ppar
ent r
esis
tivity
from
fiel
d m
easu
rem
ents
) as
a fu
nctio
n of
tim
e; a
nd (C
) inv
erse
mod
elin
g re
sults
(sm
ooth
mod
el o
f est
imat
ed tr
ue re
sist
ivity
as
a fu
nctio
n of
dep
th).
0.001
0.01
0.11
10
10100
1000
ApparentResistivity(Ohm-m)
110
100
1,00
0
200
1000
Depth(m)
APPARENT RESISTIVITY, IN OHM-METERS
DEPTH, IN METERS
RES
ISTI
VITY
, IN
OH
M-M
ETER
STI
ME,
IN M
ILLI
SEC
ON
DS
0.001
0.01
0.11
1010
0
10100
1000
ApparentResistivity(Ohm-m) APPARENT RESISTIVITY, IN OHM-METERS
TIM
E, IN
MIL
LISE
CO
ND
S
(A)
(B)
(C)
Appendix 5 5–3
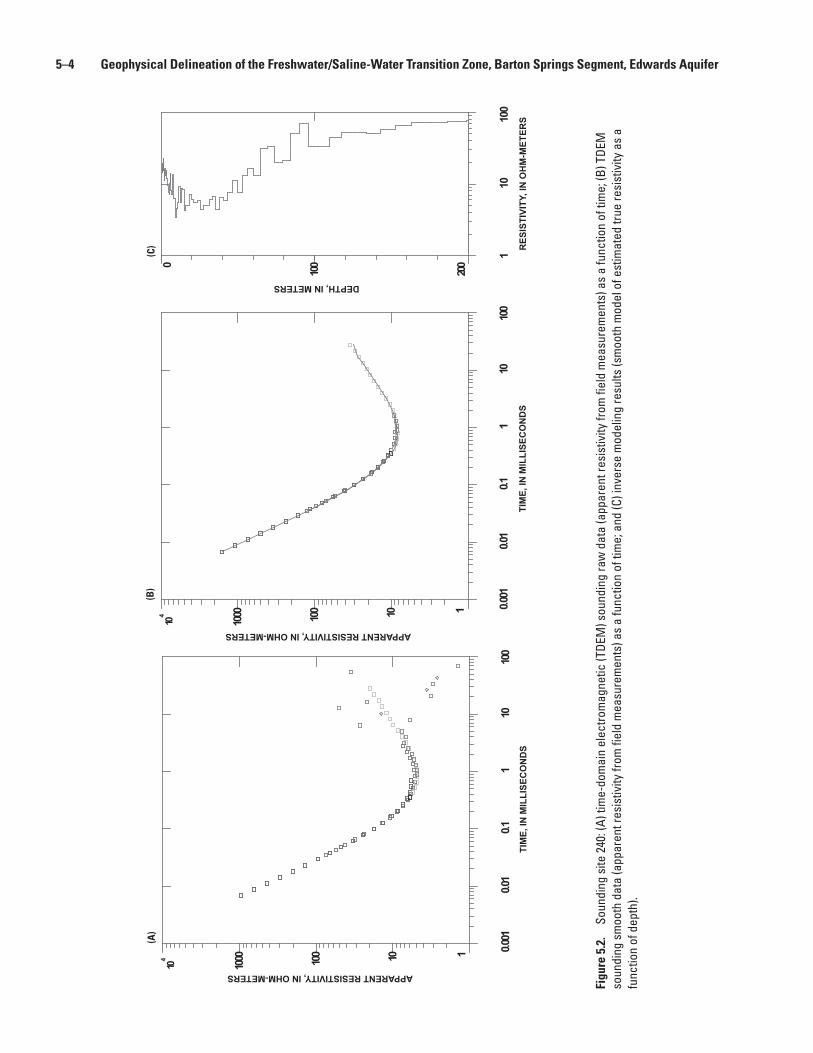
Figu
re 5
.2.
Soun
ding
site
240
: (A)
tim
e-do
mai
n el
ectro
mag
netic
(TDE
M) s
ound
ing
raw
dat
a (a
ppar
ent r
esis
tivity
from
fiel
d m
easu
rem
ents
) as
a fu
nctio
n of
tim
e; (B
) TDE
M
soun
ding
sm
ooth
dat
a (a
ppar
ent r
esis
tivity
from
fiel
d m
easu
rem
ents
) as
a fu
nctio
n of
tim
e; a
nd (C
) inv
erse
mod
elin
g re
sults
(sm
ooth
mod
el o
f est
imat
ed tr
ue re
sist
ivity
as
a fu
nctio
n of
dep
th).
0.001
0.01
0.11
101 0
0
110100
10004
10
ApparentResistivity(Ohm-m)
Time
(ms)
110
100
200
1000
Depth(m) DEPTH, IN METERS
RES
ISTI
VITY
, IN
OH
M-M
ETER
STI
ME,
IN M
ILLI
SEC
ON
DS
APPARENT RESISTIVITY, IN OHM-METERS
0.001
0.01
0.11
1010
0
110100
10004
10
ApparentResistivity(Ohm-m)
Time
(ms)
TIM
E, IN
MIL
LISE
CO
ND
S
APPARENT RESISTIVITY, IN OHM-METERS
(A)
(B)
(C)
5–4 Geophysical Delineation of the Freshwater/Saline-Water Transition Zone, Barton Springs Segment, Edwards Aquifer

Figu
re 5
.3.
Soun
ding
site
245
: (A)
tim
e-do
mai
n el
ectro
mag
netic
(TDE
M) s
ound
ing
raw
dat
a (a
ppar
ent r
esis
tivity
from
fiel
d m
easu
rem
ents
) as
a fu
nctio
n of
tim
e; (B
) TDE
M
soun
ding
sm
ooth
dat
a (a
ppar
ent r
esis
tivity
from
fiel
d m
easu
rem
ents
) as
a fu
nctio
n of
tim
e; a
nd (C
) inv
erse
mod
elin
g re
sults
(sm
ooth
mod
el o
f est
imat
ed tr
ue re
sist
ivity
as
a fu
nctio
n of
dep
th).
APPARENT RESISTIVITY, IN OHM-METERS
0.001
0.01
0.11
101 0
0
110100
1000
ApparentResistivity(Ohm-m)
Time
(ms)
110
100
200
1000
Depth(m)
0.001
0.01
0.11
1010
0
110100
1000
ApparentResistivity(Ohm-m)
Time
(ms)
TIM
E, IN
MIL
LISE
CO
ND
STI
ME,
IN M
ILLI
SEC
ON
DS
APPARENT RESISTIVITY, IN OHM-METERS
DEPTH, IN METERS
RES
ISTI
VITY
, IN
OH
M-M
ETER
S
(A)
(B)
(C)
Appendix 5 5–5

Figu
re 5
.4.
Soun
ding
site
247
: (A)
tim
e-do
mai
n el
ectro
mag
netic
(TDE
M) s
ound
ing
raw
dat
a (a
ppar
ent r
esis
tivity
from
fiel
d m
easu
rem
ents
) as
a fu
nctio
n of
tim
e; (B
) TDE
M
soun
ding
sm
ooth
dat
a (a
ppar
ent r
esis
tivity
from
fiel
d m
easu
rem
ents
) as
a fu
nctio
n of
tim
e; a
nd (C
) inv
erse
mod
elin
g re
sults
(sm
ooth
mod
el o
f est
imat
ed tr
ue re
sist
ivity
as
a fu
nctio
n of
dep
th).
0.001
0.01
0.11
101 0
0
110100
10004
10
ApparentResistivity(Ohm-m)
Time
(ms)
110
100
200
1000
Depth(m)
APPARENT RESISTIVITY, IN OHM-METERS
DEPTH, IN METERS
TIM
E, IN
MIL
LISE
CO
ND
SR
ESIS
TIVI
TY, I
N O
HM
-MET
ERS
0.001
0.01
0.11
1010
0
110100
10004
10
ApparentResistivity(Ohm-m)
Time
(ms)
TIM
E, IN
MIL
LISE
CO
ND
S
APPARENT RESISTIVITY, IN OHM-METERS
(A)
(B)
(C)
5–6 Geophysical Delineation of the Freshwater/Saline-Water Transition Zone, Barton Springs Segment, Edwards Aquifer

Figu
re 5
.5.
Soun
ding
site
250
: (A)
tim
e-do
mai
n el
ectro
mag
netic
(TDE
M) s
ound
ing
raw
dat
a (a
ppar
ent r
esis
tivity
from
fiel
d m
easu
rem
ents
) as
a fu
nctio
n of
tim
e; (B
) TDE
M
soun
ding
sm
ooth
dat
a (a
ppar
ent r
esis
tivity
from
fiel
d m
easu
rem
ents
) as
a fu
nctio
n of
tim
e; a
nd (C
) inv
erse
mod
elin
g re
sults
(sm
ooth
mod
el o
f est
imat
ed tr
ue re
sist
ivity
as
a fu
nctio
n of
dep
th).
0.001
0.01
0.11
101 0
0
110100
_50
ApparentResistivity(Ohm-m)
Time
(ms)
110
100
200
1000
Depth(m)
APPARENT RESISTIVITY, IN OHM-METERS
DEPTH, IN METERS
TIM
E, IN
MIL
LISE
CO
ND
SR
ESIS
TIVI
TY, I
N O
HM
-MET
ERS
0.001
0.01
0.11
1010
0
110100
ApparentResistivity(Ohm-m)
Time
(ms)
APPARENT RESISTIVITY, IN OHM-METERS
TIM
E, IN
MIL
LISE
CO
ND
S
(A)
(B)
(C)
Appendix 5 5–7

Figu
re 5
.6.
Soun
ding
site
260
: (A)
tim
e-do
mai
n el
ectro
mag
netic
(TDE
M) s
ound
ing
raw
dat
a (a
ppar
ent r
esis
tivity
from
fiel
d m
easu
rem
ents
) as
a fu
nctio
n of
tim
e; (B
) TDE
M
soun
ding
sm
ooth
dat
a (a
ppar
ent r
esis
tivity
from
fiel
d m
easu
rem
ents
) as
a fu
nctio
n of
tim
e; a
nd (C
) inv
erse
mod
elin
g re
sults
(sm
ooth
mod
el o
f est
imat
ed tr
ue re
sist
ivity
as
a fu
nctio
n of
dep
th).
0.001
0.01
0.11
101 0
0
110100
10004
10
ApparentResistivity(Ohm-m)
Time
(ms)
110
100
200
1000
Depth(m)
Resis
tivity
(Ohm
-m)
APPARENT RESISTIVITY, IN OHM-METERS
DEPTH, IN METERS
TIM
E, IN
MIL
LISE
CO
ND
SR
ESIS
TIVI
TY, I
N O
HM
-MET
ERS
0.001
0.01
0.11
1010
0
110100
10004
10
ApparentResistivity(Ohm-m)
Time
(ms)
APPARENT RESISTIVITY, IN OHM-METERS
TIM
E, IN
MIL
LISE
CO
ND
S
(A)
(B)
(C)
5–8 Geophysical Delineation of the Freshwater/Saline-Water Transition Zone, Barton Springs Segment, Edwards Aquifer

Figu
re 5
.7.
Soun
ding
site
320
: (A)
tim
e-do
mai
n el
ectro
mag
netic
(TDE
M) s
ound
ing
raw
dat
a (a
ppar
ent r
esis
tivity
from
fiel
d m
easu
rem
ents
) as
a fu
nctio
n of
tim
e; (B
) TDE
M
soun
ding
sm
ooth
dat
a (a
ppar
ent r
esis
tivity
from
fiel
d m
easu
rem
ents
) as
a fu
nctio
n of
tim
e; a
nd (C
) inv
erse
mod
elin
g re
sults
(sm
ooth
mod
el o
f est
imat
ed tr
ue re
sist
ivity
as
a fu
nctio
n of
dep
th).
0.001
0.01
0.11
101 0
0
110100
1000
ApparentResistivity(Ohm-m)
Time
(ms)
110
100
200
1000
Depth(m)
APPARENT RESISTIVITY, IN OHM-METERS
DEPTH, IN METERS
TIM
E, IN
MIL
LISE
CO
ND
SR
ESIS
TIVI
TY, I
N O
HM
-MET
ERS
0.001
0.01
0.11
1010
0
110100
1000
ApparentResistivity(Ohm-m)
Time
(ms)
APPARENT RESISTIVITY, IN OHM-METERS
TIM
E, IN
MIL
LISE
CO
ND
S
(A)
(B)
(C)
Appendix 5 5–9

Figu
re 5
.8.
Soun
ding
site
330
: (A)
tim
e-do
mai
n el
ectro
mag
netic
(TDE
M) s
ound
ing
raw
dat
a (a
ppar
ent r
esis
tivity
from
fiel
d m
easu
rem
ents
) as
a fu
nctio
n of
tim
e; (B
) TDE
M
soun
ding
sm
ooth
dat
a (a
ppar
ent r
esis
tivity
from
fiel
d m
easu
rem
ents
) as
a fu
nctio
n of
tim
e; a
nd (C
) inv
erse
mod
elin
g re
sults
(sm
ooth
mod
el o
f est
imat
ed tr
ue re
sist
ivity
as
a fu
nctio
n of
dep
th).
0.001
0.01
0.11
101 0
0
110100
1000
ApparentResistivity(Ohm-m)
Time
(ms)
110
100
200
1000
Depth(m)
Resis
tivity
(Ohm
-m)
APPARENT RESISTIVITY, IN OHM-METERS
DEPTH, IN METERS
RES
ISTI
VITY
, IN
OH
M-M
ETER
S
0.001
0.01
0.11
1010
0
110100
1000
ApparentResistivity(Ohm-m)
Time
(ms)
TIM
E, IN
MIL
LISE
CO
ND
S
APPARENT RESISTIVITY, IN OHM-METERS
TIM
E, IN
MIL
LISE
CO
ND
S
(A)
(B)
(C)
5–10 Geophysical Delineation of the Freshwater/Saline-Water Transition Zone, Barton Springs Segment, Edwards Aquifer

Figu
re 5
.9.
Soun
ding
site
340
: (A)
tim
e-do
mai
n el
ectro
mag
netic
(TDE
M) s
ound
ing
raw
dat
a (a
ppar
ent r
esis
tivity
from
fiel
d m
easu
rem
ents
) as
a fu
nctio
n of
tim
e; (B
) TDE
M
soun
ding
sm
ooth
dat
a (a
ppar
ent r
esis
tivity
from
fiel
d m
easu
rem
ents
) as
a fu
nctio
n of
tim
e; a
nd (C
) inv
erse
mod
elin
g re
sults
(sm
ooth
mod
el o
f est
imat
ed tr
ue re
sist
ivity
as
a fu
nctio
n of
dep
th).
(A)
(B)
(C)
0.001
0.01
0.11
1010
0
110100
1000
ApparentResistivity(Ohm-m)
Time
(ms)
110
100
200
1000
Depth(m)
APPARENT RESISTIVITY, IN OHM-METERS
DEPTH, IN METERS
TIM
E, IN
MIL
LISE
CO
ND
SR
ESIS
TIVI
TY, I
N O
HM
-MET
ERS
0.001
0.01
0.11
1010
0
110100
1000
ApparentResistivity(Ohm-m)
Time
(ms)
APPARENT RESISTIVITY, IN OHM-METERS
TIM
E, IN
MIL
LISE
CO
ND
S
Appendix 5 5–11

Figu
re 5
.10.
So
undi
ng s
ite 3
50: (
A) ti
me-
dom
ain
elec
trom
agne
tic (T
DEM
) sou
ndin
g ra
w d
ata
(app
aren
t res
istiv
ity fr
om fi
eld
mea
sure
men
ts) a
s a
func
tion
of ti
me;
(B) T
DEM
so
undi
ng s
moo
th d
ata
(app
aren
t res
istiv
ity fr
om fi
eld
mea
sure
men
ts) a
s a
func
tion
of ti
me;
and
(C) i
nver
se m
odel
ing
resu
lts (s
moo
th m
odel
of e
stim
ated
true
resi
stiv
ity a
s a
func
tion
of d
epth
).
0.001
0.01
0.11
101 0
0
110100
1000
ApparentResistivity(Ohm-m)
Time
(ms)
110
100
200
1000
Depth(m)
APPARENT RESISTIVITY, IN OHM-METERS
DEPTH, IN METERS
TIM
E, IN
MIL
LISE
CO
ND
SR
ESIS
TIVI
TY, I
N O
HM
-MET
ERS
0.001
0.01
0.11
1010
0
110100
1000
ApparentResistivity(Ohm-m)
Time
(ms)
APPARENT RESISTIVITY, IN OHM-METERS
TIM
E, IN
MIL
LISE
CO
ND
S
(A)
(B)
(C)
5–12 Geophysical Delineation of the Freshwater/Saline-Water Transition Zone, Barton Springs Segment, Edwards Aquifer

Figu
re 5
.11.
So
undi
ng s
ite 3
60: (
A) ti
me-
dom
ain
elec
trom
agne
tic (T
DEM
) sou
ndin
g ra
w d
ata
(app
aren
t res
istiv
ity fr
om fi
eld
mea
sure
men
ts) a
s a
func
tion
of ti
me;
(B) T
DEM
so
undi
ng s
moo
th d
ata
(app
aren
t res
istiv
ity fr
om fi
eld
mea
sure
men
ts) a
s a
func
tion
of ti
me;
and
(C) i
nver
se m
odel
ing
resu
lts (s
moo
th m
odel
of e
stim
ated
true
resi
stiv
ity a
s a
func
tion
of d
epth
).
0.001
0.01
0.11
101 0
0
110100
1000
ApparentResistivity(Ohm-
Time
(ms)
0.00
10
0.1
110
100
1000
4 105
10
200
1000
APPARENT RESISTIVITY, IN OHM-METERS
DEPTH, IN METERS
TIM
E, IN
MIL
LISE
CO
ND
SR
ESIS
TIVI
TY, I
N O
HM
-MET
ERS
0.001
0.01
0.11
1010
0
110100
1000
ApparentResistivity(Ohm-m)
Time
(ms)
APPARENT RESISTIVITY, IN OHM-METERS
TIM
E, IN
MIL
LISE
CO
ND
S
(A)
(B)
(C) 0.
010
Appendix 5 5–13

Figu
re 5
.12.
So
undi
ng s
ite 3
70: (
A) ti
me-
dom
ain
elec
trom
agne
tic (T
DEM
) sou
ndin
g ra
w d
ata
(app
aren
t res
istiv
ity fr
om fi
eld
mea
sure
men
ts) a
s a
func
tion
of ti
me;
(B) T
DEM
so
undi
ng s
moo
th d
ata
(app
aren
t res
istiv
ity fr
om fi
eld
mea
sure
men
ts) a
s a
func
tion
of ti
me;
and
(C) i
nver
se m
odel
ing
resu
lts (s
moo
th m
odel
of e
stim
ated
true
resi
stiv
ity a
s a
func
tion
of d
epth
).
0.001
0.01
0.11
101 0
0
110100
1000
ApparentResistivity(Ohm-m)
Time
(ms)
110
100
200
1000
Depth(m)
APPARENT RESISTIVITY, IN OHM-METERS
DEPTH, IN METERS
TIM
E, IN
MIL
LISE
CO
ND
SR
ESIS
TIVI
TY, I
N O
HM
-MET
ERS
0.001
0.01
0.11
1010
0
110100
1000
ApparentResistivity(Ohm-m)
Time
(ms)
APPARENT RESISTIVITY, IN OHM-METERS
TIM
E, IN
MIL
LISE
CO
ND
S
(A)
(B)
(C)
5–14 Geophysical Delineation of the Freshwater/Saline-Water Transition Zone, Barton Springs Segment, Edwards Aquifer

Figu
re 5
.13.
So
undi
ng s
ite 4
10: (
A) ti
me-
dom
ain
elec
trom
agne
tic (T
DEM
) sou
ndin
g ra
w d
ata
(app
aren
t res
istiv
ity fr
om fi
eld
mea
sure
men
ts) a
s a
func
tion
of ti
me;
(B) T
DEM
so
undi
ng s
moo
th d
ata
(app
aren
t res
istiv
ity fr
om fi
eld
mea
sure
men
ts) a
s a
func
tion
of ti
me;
and
(C) i
nver
se m
odel
ing
resu
lts (s
moo
th m
odel
of e
stim
ated
true
resi
stiv
ity a
s a
func
tion
of d
epth
).
0.001
0.01
0.11
101 0
0
10100
1000
ApparentResistivity(Ohm-m)
Time
(ms)
110
100
200
1000
Depth(m)
APPARENT RESISTIVITY, IN OHM-METERS
DEPTH, IN METERS
TIM
E, IN
MIL
LISE
CO
ND
SR
ESIS
TIVI
TY, I
N O
HM
-MET
ERS
0.001
0.01
0.11
1010
0
10100
1000
ApparentResistivity(Ohm-m)
Time
(ms)
APPARENT RESISTIVITY, IN OHM-METERS
TIM
E, IN
MIL
LISE
CO
ND
S
(A)
(B)
(C)
Appendix 5 5–15

Figu
re 5
.14.
So
undi
ng s
ite 4
20: (
A) ti
me-
dom
ain
elec
trom
agne
tic (T
DEM
) sou
ndin
g ra
w d
ata
(app
aren
t res
istiv
ity fr
om fi
eld
mea
sure
men
ts) a
s a
func
tion
of ti
me;
(B) T
DEM
so
undi
ng s
moo
th d
ata
(app
aren
t res
istiv
ity fr
om fi
eld
mea
sure
men
ts) a
s a
func
tion
of ti
me;
and
(C) i
nver
se m
odel
ing
resu
lts (s
moo
th m
odel
of e
stim
ated
true
resi
stiv
ity a
s a
func
tion
of d
epth
).
0.001
0.01
0.11
101 0
0
10100
1000
ApparentResistivity(Ohm-m)
Time
(ms)
110
100
200
1000
Depth(m)
APPARENT RESISTIVITY, IN OHM-METERS
DEPTH, IN METERS
TIM
E, IN
MIL
LISE
CO
ND
SR
ESIS
TIVI
TY, I
N O
HM
-MET
ERS
0.001
0.01
0.11
1010
0
110100
1000
ApparentResistivity(Ohm-m)
Time
(ms)
APPARENT RESISTIVITY, IN OHM-METERS
TIM
E, IN
MIL
LISE
CO
ND
S
(A)
(B)
(C)
5–16 Geophysical Delineation of the Freshwater/Saline-Water Transition Zone, Barton Springs Segment, Edwards Aquifer

Figu
re 5
.15.
So
undi
ng s
ite 4
40: (
A) ti
me-
dom
ain
elec
trom
agne
tic (T
DEM
) sou
ndin
g ra
w d
ata
(app
aren
t res
istiv
ity fr
om fi
eld
mea
sure
men
ts) a
s a
func
tion
of ti
me;
(B) T
DEM
so
undi
ng s
moo
th d
ata
(app
aren
t res
istiv
ity fr
om fi
eld
mea
sure
men
ts) a
s a
func
tion
of ti
me;
and
(C) i
nver
se m
odel
ing
resu
lts (s
moo
th m
odel
of e
stim
ated
true
resi
stiv
ity a
s a
func
tion
of d
epth
).
0.001
0.01
0.11
10
10100
1000
ApparentResistivity(Ohm-m)
Time
(ms)
110
100
200
1000
Depth(m)
APPARENT RESISTIVITY, IN OHM-METERS
DEPTH, IN METERS
TIM
E, IN
MIL
LISE
CO
ND
SR
ESIS
TIVI
TY, I
N O
HM
-MET
ERS
0.001
0.01
0.11
1010
0
10100
1000
ApparentResistivity(Ohm-m)
Time
(ms)
APPARENT RESISTIVITY, IN OHM-METERS
TIM
E, IN
MIL
LISE
CO
ND
S
(A)
(B)
(C)
Appendix 5 5–17

Figu
re 5
.16.
So
undi
ng s
ite 4
50: (
A) ti
me-
dom
ain
elec
trom
agne
tic (T
DEM
) sou
ndin
g ra
w d
ata
(app
aren
t res
istiv
ity fr
om fi
eld
mea
sure
men
ts) a
s a
func
tion
of ti
me;
(B) T
DEM
so
undi
ng s
moo
th d
ata
(app
aren
t res
istiv
ity fr
om fi
eld
mea
sure
men
ts) a
s a
func
tion
of ti
me;
and
(C) i
nver
se m
odel
ing
resu
lts (s
moo
th m
odel
of e
stim
ated
true
resi
stiv
ity a
s a
func
tion
of d
epth
).
0.001
0.01
0.11
101 0
0
110100
1000
ApparentResistivity(Ohm-m)
Time
(ms)
110
100
200
1000
Depth(m)
APPARENT RESISTIVITY, IN OHM-METERS
DEPTH, IN METERS
TIM
E, IN
MIL
LISE
CO
ND
SR
ESIS
TIVI
TY, I
N O
HM
-MET
ERS
0.001
0.01
0.11
1010
0
110100
1000
ApparentResistivity(Ohm-m)
Time
(ms)
TIM
E, IN
MIL
LISE
CO
ND
S
APPARENT RESISTIVITY, IN OHM-METERS
(A)
(B)
(C)
5–18 Geophysical Delineation of the Freshwater/Saline-Water Transition Zone, Barton Springs Segment, Edwards Aquifer

Figu
re 5
.17.
So
undi
ng s
ite 4
60: (
A) ti
me-
dom
ain
elec
trom
agne
tic (T
DEM
) sou
ndin
g ra
w d
ata
(app
aren
t res
istiv
ity fr
om fi
eld
mea
sure
men
ts) a
s a
func
tion
of ti
me;
(B) T
DEM
so
undi
ng s
moo
th d
ata
(app
aren
t res
istiv
ity fr
om fi
eld
mea
sure
men
ts) a
s a
func
tion
of ti
me;
and
(C) i
nver
se m
odel
ing
resu
lts (s
moo
th m
odel
of e
stim
ated
true
resi
stiv
ity a
s a
func
tion
of d
epth
).
0.001
0.01
0.11
101 0
0
110100
1000
ApparentResistivity(Ohm-m)
Time
(ms)
110
100
200
1000
Depth(m)
APPARENT RESISTIVITY, IN OHM-METERS
DEPTH, IN METERS
TIM
E, IN
MIL
LISE
CO
ND
SR
ESIS
TIVI
TY, I
N O
HM
-MET
ERS
0.001
0.01
0.11
1010
0
110100
1000
ApparentResistivity(Ohm-m)
Time
(ms)
APPARENT RESISTIVITY, IN OHM-METERS
TIM
E, IN
MIL
LISE
CO
ND
S
(A)
(B)
(C)
Appendix 5 5–19

Figu
re 5
.18.
So
undi
ng s
ite 4
70: (
A) ti
me-
dom
ain
elec
trom
agne
tic (T
DEM
) sou
ndin
g ra
w d
ata
(app
aren
t res
istiv
ity fr
om fi
eld
mea
sure
men
ts) a
s a
func
tion
of ti
me;
(B) T
DEM
so
undi
ng s
moo
th d
ata
(app
aren
t res
istiv
ity fr
om fi
eld
mea
sure
men
ts) a
s a
func
tion
of ti
me;
and
(C) i
nver
se m
odel
ing
resu
lts (s
moo
th m
odel
of e
stim
ated
true
resi
stiv
ity a
s a
func
tion
of d
epth
).
0.001
0.01
0.11
101 0
0
110100
1000
ApparentResistivity(Ohm-m)
Time
(ms)
110
100
200
1000
Depth(m)
APPARENT RESISTIVITY, IN OHM-METERS
DEPTH, IN METERS
TIM
E, IN
MIL
LISE
CO
ND
SR
ESIS
TIVI
TY, I
N O
HM
-MET
ERS
0.001
0.01
0.11
1010
0
110100
1000
ApparentResistivity(Ohm-m)
Time
(ms)
APPARENT RESISTIVITY, IN OHM-METERS
TIM
E, IN
MIL
LISE
CO
ND
S
(A)
(B)
(C)
5–20 Geophysical Delineation of the Freshwater/Saline-Water Transition Zone, Barton Springs Segment, Edwards Aquifer

Figu
re 5
.19.
So
undi
ng s
ite 5
20: (
A) ti
me-
dom
ain
elec
trom
agne
tic (T
DEM
) sou
ndin
g ra
w d
ata
(app
aren
t res
istiv
ity fr
om fi
eld
mea
sure
men
ts) a
s a
func
tion
of ti
me;
(B) T
DEM
so
undi
ng s
moo
th d
ata
(app
aren
t res
istiv
ity fr
om fi
eld
mea
sure
men
ts) a
s a
func
tion
of ti
me;
and
(C) i
nver
se m
odel
ing
resu
lts (s
moo
th m
odel
of e
stim
ated
true
resi
stiv
ity a
s a
func
tion
of d
epth
).
0.001
0.01
0.11
101 0
0
10100
1000
ApparentResistivity(Ohm-m)
Time
(ms)
110
100
200
1000
Depth(m)
APPARENT RESISTIVITY, IN OHM-METERS
DEPTH, IN METERS
TIM
E, IN
MIL
LISE
CO
ND
SR
ESIS
TIVI
TY, I
N O
HM
-MET
ERS
0.001
0.01
0.11
1010
0
10100
1000
ApparentResistivity(Ohm-m)
Time
(ms)
APPARENT RESISTIVITY, IN OHM-METERS
TIM
E, IN
MIL
LISE
CO
ND
S
(A)
(B)
(C)
Appendix 5 5–21

Figu
re 5
.20.
So
undi
ng s
ite 5
22: (
A) ti
me-
dom
ain
elec
trom
agne
tic (T
DEM
) sou
ndin
g ra
w d
ata
(app
aren
t res
istiv
ity fr
om fi
eld
mea
sure
men
ts) a
s a
func
tion
of ti
me;
(B) T
DEM
so
undi
ng s
moo
th d
ata
(app
aren
t res
istiv
ity fr
om fi
eld
mea
sure
men
ts) a
s a
func
tion
of ti
me;
and
(C) i
nver
se m
odel
ing
resu
lts (s
moo
th m
odel
of e
stim
ated
true
resi
stiv
ity a
s a
func
tion
of d
epth
).
0.001
0.01
0.11
101 0
0
10100
1000
ApparentResistivity(Ohm-m)
Time
(ms)
110
100
200
1000
Depth(m)
APPARENT RESISTIVITY, IN OHM-METERS
DEPTH, IN METERS
TIM
E, IN
MIL
LISE
CO
ND
SR
ESIS
TIVI
TY, I
N O
HM
-MET
ERS
0.001
0.01
0.11
1010
0
10100
1000
ApparentResistivity(Ohm-m)
Time
(ms)
APPARENT RESISTIVITY, IN OHM-METERS
TIM
E, IN
MIL
LISE
CO
ND
S
(A)
(B)
(C)
5–22 Geophysical Delineation of the Freshwater/Saline-Water Transition Zone, Barton Springs Segment, Edwards Aquifer

Figu
re 5
.21.
So
undi
ng s
ite 5
24: (
A) ti
me-
dom
ain
elec
trom
agne
tic (T
DEM
) sou
ndin
g ra
w d
ata
(app
aren
t res
istiv
ity fr
om fi
eld
mea
sure
men
ts) a
s a
func
tion
of ti
me;
(B) T
DEM
so
undi
ng s
moo
th d
ata
(app
aren
t res
istiv
ity fr
om fi
eld
mea
sure
men
ts) a
s a
func
tion
of ti
me;
and
(C) i
nver
se m
odel
ing
resu
lts (s
moo
th m
odel
of e
stim
ated
true
resi
stiv
ity a
s a
func
tion
of d
epth
).
0.001
0.01
0.11
10
110100
1000
ApparentResistivity(Ohm-m)
Time
(ms)
110
100
200
1000
Depth(m)
APPARENT RESISTIVITY, IN OHM-METERS
DEPTH, IN METERS
TIM
E, IN
MIL
LISE
CO
ND
SR
ESIS
TIVI
TY, I
N O
HM
-MET
ERS
0.001
0.01
0.11
1010
0
110100
1000
ApparentResistivity(Ohm-m)
Time
(ms)
APPARENT RESISTIVITY, IN OHM-METERS
TIM
E, IN
MIL
LISE
CO
ND
S
(A)
(B)
(C)
Appendix 5 5–23

Figu
re 5
.22.
So
undi
ng s
ite 5
30: (
A) ti
me-
dom
ain
elec
trom
agne
tic (T
DEM
) sou
ndin
g ra
w d
ata
(app
aren
t res
istiv
ity fr
om fi
eld
mea
sure
men
ts) a
s a
func
tion
of ti
me;
(B) T
DEM
so
undi
ng s
moo
th d
ata
(app
aren
t res
istiv
ity fr
om fi
eld
mea
sure
men
ts) a
s a
func
tion
of ti
me;
and
(C) i
nver
se m
odel
ing
resu
lts (s
moo
th m
odel
of e
stim
ated
true
resi
stiv
ity a
s a
func
tion
of d
epth
).
0.01
0.11
10
10100
1000
ApparentResistivity(Ohm-m)
Time
(ms)
110
100
200
1000
Depth(m)
APPARENT RESISTIVITY, IN OHM-METERS
DEPTH, IN METERS
TIM
E, IN
MIL
LISE
CO
ND
SR
ESIS
TIVI
TY, I
N O
HM
-MET
ERS
0.001
0.01
0.11
1010
0
10100
1000
ApparentResistivity(Ohm-m)
Time
(ms)
APPARENT RESISTIVITY, IN OHM-METERS
TIM
E, IN
MIL
LISE
CO
ND
S
(A)
(B)
(C)
5–24 Geophysical Delineation of the Freshwater/Saline-Water Transition Zone, Barton Springs Segment, Edwards Aquifer

Figu
re 5
.23.
So
undi
ng s
ite 5
40: (
A) ti
me-
dom
ain
elec
trom
agne
tic (T
DEM
) sou
ndin
g ra
w d
ata
(app
aren
t res
istiv
ity fr
om fi
eld
mea
sure
men
ts) a
s a
func
tion
of ti
me;
(B) T
DEM
so
undi
ng s
moo
th d
ata
(app
aren
t res
istiv
ity fr
om fi
eld
mea
sure
men
ts) a
s a
func
tion
of ti
me;
and
(C) i
nver
se m
odel
ing
resu
lts (s
moo
th m
odel
of e
stim
ated
true
resi
stiv
ity a
s a
func
tion
of d
epth
).
0.001
0.01
0.11
101 0
0
10100
10004
10
ApparentResistivity(Ohm-m)
Time
(ms)
110
100
200
1000
Depth(m)
APPARENT RESISTIVITY, IN OHM-METERS
DEPTH, IN METERS
TIM
E, IN
MIL
LISE
CO
ND
SR
ESIS
TIVI
TY, I
N O
HM
-MET
ERS
0.001
0.01
0.11
1010
0
110100
10004
10
ApparentResistivity(Ohm-m)
Time
(ms)
APPARENT RESISTIVITY, IN OHM-METERS
TIM
E, IN
MIL
LISE
CO
ND
S
(A)
(B)
(C)
Appendix 5 5–25

Figu
re 5
.24.
So
undi
ng s
ite 5
50: (
A) ti
me-
dom
ain
elec
trom
agne
tic (T
DEM
) sou
ndin
g ra
w d
ata
(app
aren
t res
istiv
ity fr
om fi
eld
mea
sure
men
ts) a
s a
func
tion
of ti
me;
(B) T
DEM
so
undi
ng s
moo
th d
ata
(app
aren
t res
istiv
ity fr
om fi
eld
mea
sure
men
ts) a
s a
func
tion
of ti
me;
and
(C) i
nver
se m
odel
ing
resu
lts (s
moo
th m
odel
of e
stim
ated
true
resi
stiv
ity a
s a
func
tion
of d
epth
).
0.001
0.01
0.11
101 0
0
110100
10004
10
ApparentResistivity(Ohm-m)
Time
(ms)
110
100
200
1000
Depth(m)
APPARENT RESISTIVITY, IN OHM-METERS
DEPTH, IN METERS
TIM
E, IN
MIL
LISE
CO
ND
SR
ESIS
TIVI
TY, I
N O
HM
-MET
ERS
0.001
0.01
0.11
1010
0
110100
10004
10
ApparentResistivity(Ohm-m)
Time
(ms)
APPARENT RESISTIVITY, IN OHM-METERS
TIM
E, IN
MIL
LISE
CO
ND
S
(A)
(B)
(C)
5–26 Geophysical Delineation of the Freshwater/Saline-Water Transition Zone, Barton Springs Segment, Edwards Aquifer
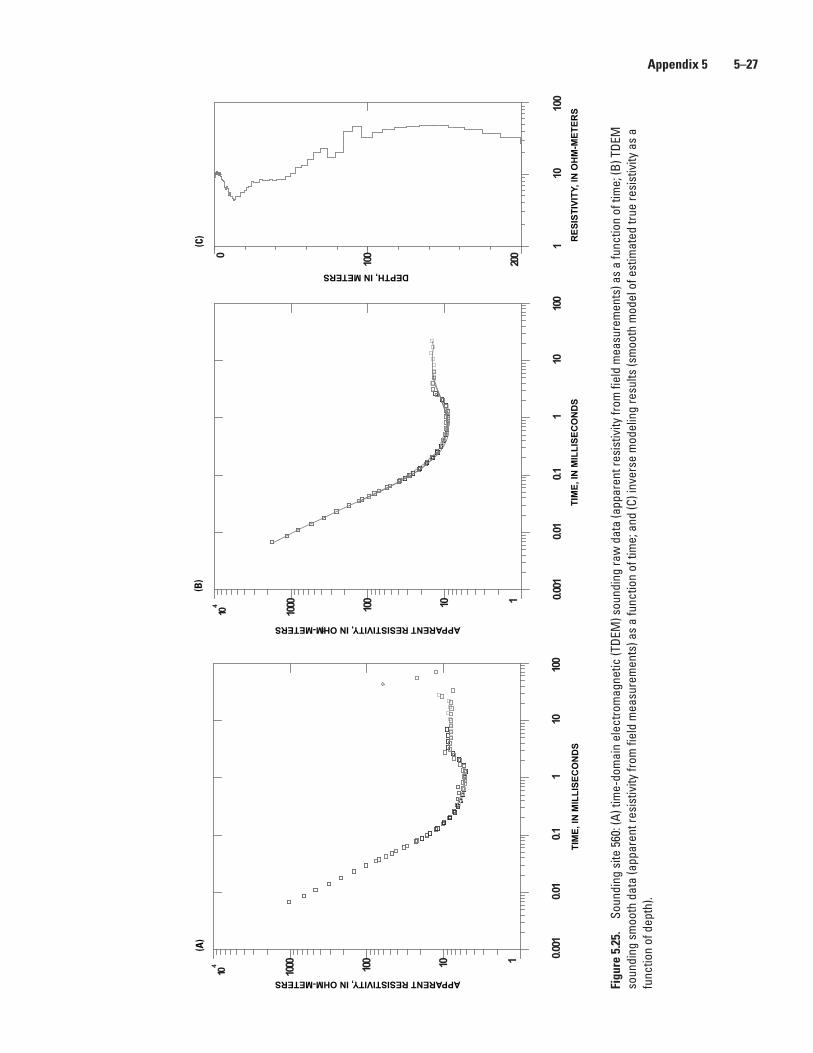
Figu
re 5
.25.
So
undi
ng s
ite 5
60: (
A) ti
me-
dom
ain
elec
trom
agne
tic (T
DEM
) sou
ndin
g ra
w d
ata
(app
aren
t res
istiv
ity fr
om fi
eld
mea
sure
men
ts) a
s a
func
tion
of ti
me;
(B) T
DEM
so
undi
ng s
moo
th d
ata
(app
aren
t res
istiv
ity fr
om fi
eld
mea
sure
men
ts) a
s a
func
tion
of ti
me;
and
(C) i
nver
se m
odel
ing
resu
lts (s
moo
th m
odel
of e
stim
ated
true
resi
stiv
ity a
s a
func
tion
of d
epth
).
0.001
0.01
0.11
101 0
0
110100
10004
10
ApparentResistivity(Ohm-m)
Time
(ms)
110
100
200
1000
Depth(m)
APPARENT RESISTIVITY, IN OHM-METERS
DEPTH, IN METERS
TIM
E, IN
MIL
LISE
CO
ND
SR
ESIS
TIVI
TY, I
N O
HM
-MET
ERS
0.001
0.01
0.11
1010
0
110100
10004
10
ApparentResistivity(Ohm-m)
Time
(ms)
APPARENT RESISTIVITY, IN OHM-METERS
TIM
E, IN
MIL
LISE
CO
ND
S
(A)
(B)
(C)
Appendix 5 5–27

Blank Page

Appendix 6Appendix 6—Datasets of Raw and Processed Time-Domain Electromagnetic Data

Blank Page

Appendix 6. Datasets of raw and processed time-domain electromagnetic data.
Data Files:
Raw_TEM—Includes all .TEM files created using the program TEM2IX1D. A .TEM file was created for each duty cycle of the Protem 47 and 57. Link to zipped Raw_TEM files.
Processed_TEM—Includes the .IXP file that can be opened in IX1D. The files include all final inversion figures of each sounding. Also included for each sounding is the .usf file that can be imported into IX1D as raw data. Link to zipped Processed_TEM files.
Appendix 6 6–3
Prepared by the USGS Lafayette Publishing Service Center. Information regarding water resources in Texas is available at http: //tx.usgs.gov/