appendix 1: physical and analytical methodology 1a.1
TRANSCRIPT

Appendix
204
Appendix 1: Physical and Analytical Methodology
1A.1 Physical Chemistry
1A.1.1 pH
A Radiometer-Copenhagen: TTA80 instrument equipped with a combined glass-calomel
electrode was used to measure the pH of porewaters and column leachates. The electrode was
calibrated using pH 7 and pH 4 buffer solutions.
1A.1.2 Electrical Conductivity (EC)
A Radiometer-Copenhagen CDM 83 Conductivity Meter was used for EC measurements.
The meter is equipped with 3 platinum electrodes. The cell constant was calibrated with
standard KCl solutions of varying concentrations (0.01, 0.1 and 1.0 N) that were selected in
accordance with the expected conductivity of the porewater or leachate sample.
1A.1.3 Redox Potential
Redox Potential (Eh) was measured with an IONODE combined platinum/silver – silver
chloride electrode connected to a HANNA HI 8521 pH/Eh meter. All readings were adjusted
to the standard hydrogen electrode reference. The electrode was calibrated with Zobell’s
solution. This solution is prepared by first mixing 1/300 M potassium ferricyanide in 0.1 M
potassium chloride (solution 1). A second solution comprising 1/300 M potassium
ferrocyanide in 0.1 M potassium chloride is also prepared separately then combined with
solution 1 in equal volumes before calibration.
The potential of platinum against a calomel reference should be + 186 mV at 25°C and + 186
± 10 mV against 1 M potassium chloride/silver-silver chloride.
1A.2 Mineralogy
1A.2.1 X-ray Powder Diffraction
Finely ground powders of samples were lightly pressed into aluminium sample holders to
achieve random orientation of the mineral particles for XRD analysis. Measurements were
made using a Philips PW1800 microprocessor-controlled diffractometer with Co K alpha

Appendix
205
radiation, variable divergence slit and a graphite monochromator. The diffraction patterns
were acquired in steps of 0.05° 2θ with a 1 second count time per step. Data were logged to
permanent files on an IBM - compatible PC and subsequently analysed using a software
package XPLOT developed by Raven and Self (1988).
1A.2.2 Scanning Electron Microscopy
Selected tailings solids were carbon coated and examined in a Cambridge Stereoscan 250
Scanning Electron Microscope (SEM) operating at 20 kV. The elemental composition of
particles identified with the SEM were determined with a Link energy-dispersive X-ray
(EDX) microanalyser.
1A.2.3 Quantitative Electron Microscopy – SEM
QEMSEM is an automatic system for the rapid determination and quantification of mineral
matter. Specifically the method provides quantitative data on the petrographic, mineralogical
and chemical composition of all phases present including particle size and shape, grain size
and textural associations. The instrument comprises of a Leo SEM equipped with 4 light
element Gresham X-ray detectors. The instrument uses image analysis to interpret back
scattered electron and energy dispersive x-ray signals collected at a pre-determined stepping
rate. These are then converted into colour coded digital images. The images are stored on a
computer and statistically analysed to obtain mineralogical, chemical and textural parameters.
The instrument can process 100,000 pixels/hour with a spatial resolution of up to 0.3 µm.
Sample preparation included desliming at 20 µm, with the plus 20 µm fraction being sized to
45 and 106 µm. The minus 20 µm fraction was cyclosized to obtain both the plus and minus
10 µm fractions. Acetone instead of water was used in the cyclosizer to prevent the leaching
of salts and other soluble metals.

Appendix
206
1A.3 Water and Solids Chemistry
1A.3.1 Inductively Coupled Plasma Atomic Emission and Mass Spectrometry
The dissolved major and trace metals (including U) for all porewaters and leachates were
analysed by inductively coupled plasma atomic emission spectrometry (ICPAES) and ICP –
mass spectrometry (ICPMS). Analytical detection limits for ICPAES are summarised in
Table 1A.1. ICPMS detection limits are generally < 1 µg/L.
Table 1A.1: Analytical detection limits for ICPAES
Element Detection Limit (mg/L) Al 0.005 B 0.005 Ba 0.005 Be 0.002 Ca 0.05 Cd 0.01 Co 0.01 Cr 0.005 Cu 0.005 Fe 0.02 K 0.20 Li 0.005 Mg 0.01 Mn 0.002 Mo 0.01 Na 0.20 Ni 0.01 P 0.05 Pb 0.02 S 0.02 Si 0.10 Sr 0.002 Ti 0.005 V 0.005 Zn 0.05

Appendix
207
Porewaters and column leachates were filtered through a 0.45 µm membrane filter and the
filtrate acidified to pH < 2 with nitric acid. Prior to ICPAES or MS analysis, the filtrates were
subjected to acid digestion in accordance with US EPA methods 3005/3010 (1996). This
method destroys colloidal complexes and provides a total dissolved metal concentration.
1A.3.2 Ion Chromatography
The unacidified filtrates generated from porewaters and column leachates were analyzed for
Cl-, NO3-, NO2
- and NH4+ by a DioneX 4500I series ion chromatograph.
1A.3.3 Radium Determination
The analysis of 226Ra by alpha spectrometry involved co-precipitation of radium (and 133Ba)
with colloidal barium sulfate on a < 0.2 µm filter membrane. The activity of 226Ra was
determined by counting the alpha particles with an Ortec 676A Alpha-King spectrometer
coupled to a multi-channel analyser and emulation software (Maestro II). The gravimetric
yield or recovery of precipitated radium was inferred by the yield tracer 133Ba, which was
counted by gamma spectrometry.
Other radionuclides (230Th and 210Pb) were also determined in porewaters however these data
were not evaluated as part of this research project. Thorium-230 was determined by alpha
spectrometry and lead-210 by beta spectrometry.
1A.3.4 X-Ray Fluorescence Major and Trace Elemental Analysis
The ‘grab’ weight method was employed in the preparation of the samples for major and
trace element analysis. This involved accurately weighing approximately 1 g of each of the
finely ground oven dried (105°C) powders into glass vials with approximately 0.3 g NaNO3.
The mixture was transferred to a Pt-Au crucible and preoxidised in an oven set to 750°C for
15 minutes. The preoxidised material was then fused into a homogeneous glass over an oxy-
propane flame at a temperature of approximately 1050°C and the molten material was poured
into a 32 mm diameter Pt-Au mould heated to a similar temperature. The melt was then
cooled by air jets for approximately 30 seconds. The resulting glass disks were analysed on a
Philips PW1480 XRF system using a control program developed by Philips. Table 1A.2
summarises the analytical detection limits.
Appendix
208
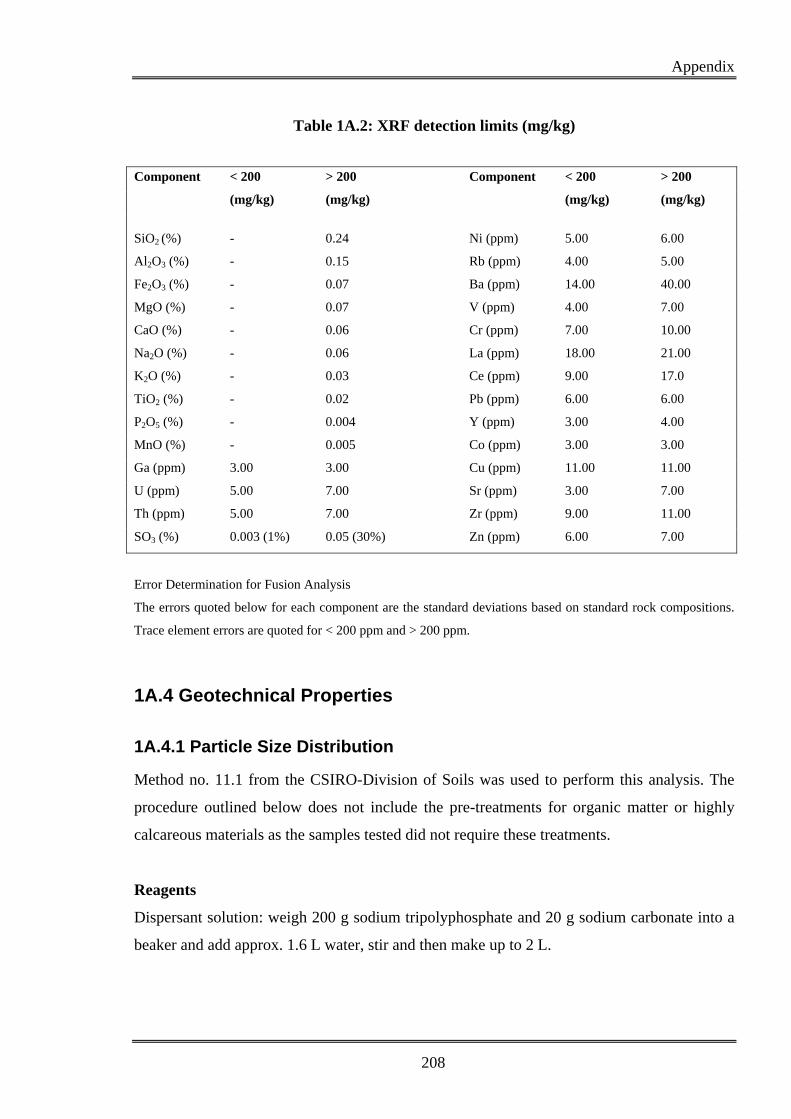
Table 1A.2: XRF detection limits (mg/kg)
Component < 200 > 200 Component < 200 > 200 (mg/kg) (mg/kg) (mg/kg) (mg/kg)
SiO2 (%) - 0.24 Ni (ppm) 5.00 6.00
Al2O3 (%) - 0.15 Rb (ppm) 4.00 5.00
Fe2O3 (%) - 0.07 Ba (ppm) 14.00 40.00
MgO (%) - 0.07 V (ppm) 4.00 7.00
CaO (%) - 0.06 Cr (ppm) 7.00 10.00
Na2O (%) - 0.06 La (ppm) 18.00 21.00
K2O (%) - 0.03 Ce (ppm) 9.00 17.0
TiO2 (%) - 0.02 Pb (ppm) 6.00 6.00
P2O5 (%) - 0.004 Y (ppm) 3.00 4.00
MnO (%) - 0.005 Co (ppm) 3.00 3.00
Ga (ppm) 3.00 3.00 Cu (ppm) 11.00 11.00
U (ppm) 5.00 7.00 Sr (ppm) 3.00 7.00
Th (ppm) 5.00 7.00 Zr (ppm) 9.00 11.00
SO3 (%) 0.003 (1%) 0.05 (30%) Zn (ppm) 6.00 7.00
Error Determination for Fusion Analysis
The errors quoted below for each component are the standard deviations based on standard rock compositions.
Trace element errors are quoted for < 200 ppm and > 200 ppm.
1A.4 Geotechnical Properties
1A.4.1 Particle Size Distribution
Method no. 11.1 from the CSIRO-Division of Soils was used to perform this analysis. The
procedure outlined below does not include the pre-treatments for organic matter or highly
calcareous materials as the samples tested did not require these treatments.
Reagents
Dispersant solution: weigh 200 g sodium tripolyphosphate and 20 g sodium carbonate into a
beaker and add approx. 1.6 L water, stir and then make up to 2 L.

Appendix
209
Apparatus
Shaking bottles and machine
Sedimentation cylinder
Glass vials
Sand vials
25 mL pipette and pipetus (holder and pump)
Glass siphon and U-tube
Sand washing beakers
Sand sieve
Procedure
Weigh 10 g soil into a 250 mL shaking bottle, add 10 mL dispersant and half fill the bottle
with water. Place bottles in an end-over-end shaker for 64 hrs. After shaking, transfer the
dispersed material into 500 mL sedimentation cylinders in a 20°C constant temperature room.
Make up to 500 mL with water and allow to equilibrate.
Determination of Silt and Clay Particle (< 20µm) fraction
Prepare the pipetus by inserting a 25 mL pipette and switch on. Prepare and pre-weigh a 30
mL glass vial. Paddle the cylinder for 30 seconds vigorously at first to dislodge the soil pad at
the bottom, then continuously up and down with the upward stroke reaching no higher than
the 400 mL mark. Insert the pipette carefully into the cylinder and hold it so the 104 mm
graduation is level with the surface of the suspension. At time 5 minutes draw up 25 mL of
solution. Dispense the sample into the glass vial A. When all samples have been removed,
clean the pipette, paddle the blank cylinder, sample 25 mL and dispense into a Blank vial.
Place the vials into an oven at 105°C.
Determination of Clay Particles (< 2µm)
Using the pipetus, place the pipette at the 75 mm graduation mark level with the top of the
soil suspension in the cylinder and take a 25 mL sample 6 hours after paddling the cylinder
for silt and clay. Dispense the sample into a glass vial Q and place in 105°C oven.
Determination of Coarse and Fine Sand (> 20µm)

Appendix
210
Pour or siphon off the remaining soil suspension from the 1st batch and use a wash bottle to
transfer the remaining residue to 600 mL tall beakers. Place a 0-50°C thermometer into the
beaker and fill with tap water. The settling time is temperature dependent so temperature
measurements must be made e.g. at 16°C the settling time is 5 min 20 sec. After the required
time has passed, siphon off the top 100 mm of suspension. Repeat this timed washing until all
the supernatant liquid is clear at the time when it should be siphoned off. With a smaller
siphon, take off half of the remaining supernatant. Transfer the remainder of sample into the
sieve and collection system. Place the retained contents into a pre-weighed polycarbonate
Vial C and transfer the fine sand from the base into F vial. With the small siphon remove
most of the supernatant in the vials and when all are complete, place in an oven at 80°C and
leave until dry.
Calculations
After all sub-samples are oven dried, record their weights.
For 10 g soil in 500 mL sedimentation cylinder taking 25 mL aliquot:
Wt clay fraction = (wt of Q vial + fraction) – wt Q vial
% clay = (wt clay fraction – wt blank) x 200
wt silt + clay fraction = (wt of A vial + fraction) – wt A vial
% silt = (wt silt + clay fraction – wt clay fraction) x 200
wt fine sand = (wt of F vial + fraction) – wt F vial
% fine sand = wt fine sand x 10
wt coarse sand = (wt of C vial + fraction) – wt C vial
% coarse sand = wt coarse sand x 10
1A.4.2 Gravimetric Water Content
Tailings were sub-sampled directly after exposure or extrusion. The sub-sample was weighed
(Ww) and placed in an oven at 105°C for 24 hrs. The sample was then re-weighed after
equilibrating in a desiccator for 24 hours (Wd). The water content expressed as a percentage
of the oven dry weight was then calculated using the formula:
w = [(Ww – Wd) / Wd] x 100
Appendix
211
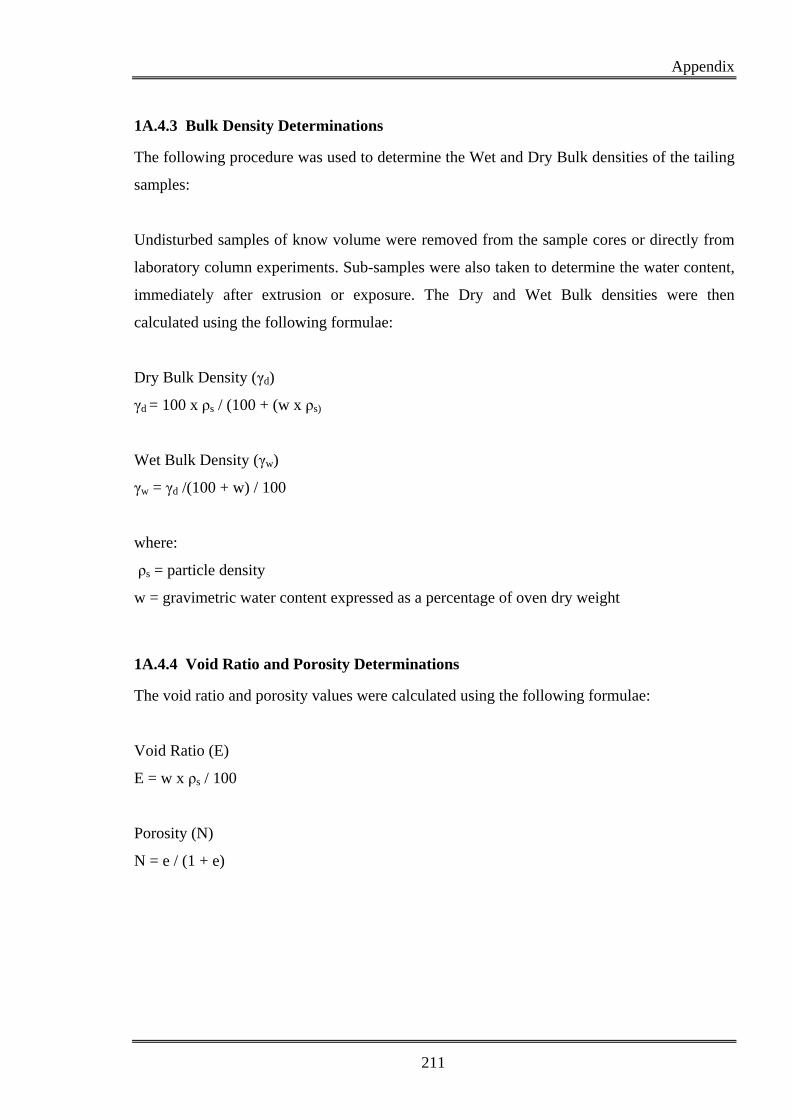
1A.4.3 Bulk Density Determinations
The following procedure was used to determine the Wet and Dry Bulk densities of the tailing
samples:
Undisturbed samples of know volume were removed from the sample cores or directly from
laboratory column experiments. Sub-samples were also taken to determine the water content,
immediately after extrusion or exposure. The Dry and Wet Bulk densities were then
calculated using the following formulae:
Dry Bulk Density (γd)
γd = 100 x ρs / (100 + (w x ρs)
Wet Bulk Density (γw)
γw = γd /(100 + w) / 100
where:
ρs = particle density
w = gravimetric water content expressed as a percentage of oven dry weight
1A.4.4 Void Ratio and Porosity Determinations
The void ratio and porosity values were calculated using the following formulae:
Void Ratio (E)
E = w x ρs / 100
Porosity (N)
N = e / (1 + e)

Appendix
212
Appendix 2: Tailings Core Mineralogy, Geochemistry and Porewater Chemistry
Table 2A.1: Modal percentages of mineral assemblages as a function of grain size for
selected tailings samples
Site 4 (11.38-11.39m)
Mineral % wt/wt
+106 (µm)
+45 (µm)
+20 (µm)
+10 (µm)
-10 (µm)
(1)HEAD
Gypsum 1.1 7.8 10.5 12.2 13.0 10.3 Chalcopyrite 0.0 0.0 0.0 0.6 0.5 0.3 Galena 0.0 0.0 0.0 0.0 0.0 0.0 Jarosite 0.0 0.0 0.0 0.0 0.0 0.0 Barite 0.0 0.0 0.0 0.0 0.0 0.0 Pyrite 0.0 0.0 0.0 1.4 1.2 0.7 Fe-Sphalerite 0.0 0.0 0.0 0.0 0.0 0.0 Fe-Oxide 2.3 2.6 3.3 3.5 1.8 3.5 Ilmenite 0.3 0.0 0.0 0.0 0.0 0.0 Rutile 1.0 0.3 0.7 0.9 0.8 0.7 Quartz 51.8 44.9 40.8 25.1 19.6 33.1 Chlorite 30.0 30.7 31.3 34.0 36.8 33.1 Mica 12.0 10.9 10.4 13.1 14.6 12.4 Al-Silicates 1.4 2.4 2.7 5.8 6.6 4.3 Zircon <0.2 <0.2 <0.2 <0.2 <0.2 <0.2 U-Phases 0.006 0.006 0.009 0.02 0.023 0.0 Rhodochrosite <0.1 <0.1 <0.1 <0.1 <0.1 <0.1 Pyrolusite 0.2 0.2 0.3 0.9 1.3 0.7 Calcite <0.2 <0.2 <0.2 <0.2 <0.2 <0.2 Mg-Phases 0.2 0.2 0.2 1.5 1.0 0.7 Apatite 0.1 0.1 0.2 0.5 0.0 0.2 Other <0.1 <0.1 <0.1 0.5 0.1 0.2 Total 100 100 100 100 100 100
Site 5 (7.1-7.11m)
Mineral % wt/wt
+106 (µm)
+45 (µm)
+20 (µm)
+10 (µm)
-10 (µm)
(1)HEAD
Gypsum (2)ns 1.5 5.9 14.1 15.0 9.4 Chalcopyrite ns 0.0 0.0 0.0 0.0 0.0 Galena ns 0.0 0.0 0.0 0.0 0.0 Jarosite ns 0.0 0.0 0.0 0.0 0.0 Barite ns 0.0 0.0 0.0 0.0 0.0 Pyrite ns 0.0 0.0 1.3 0.0 0.6 Fe-Sphalerite ns 0.0 0.0 0.0 0.0 0.0 Fe-Oxide ns 3.7 4.2 5.3 7.9 4.9 Ilmenite ns 0.0 0.0 0.0 0.0 0.0 Rutile ns 0.6 0.9 0.9 0.5 0.8

Appendix
213
Quartz ns 48.5 43.1 22.7 19.2 32.7 Chlorite ns 35.6 35.3 42.1 43.0 39.3 Mica ns 6.9 6.7 9.2 9.7 8.2 Al-Silicates ns 2.8 2.9 3.9 4.2 3.5 Zircon ns <0.2 <0.2 <0.2 <0.2 <0.2 U-Phases ns 0.015 0.012 0.028 0.034 0.0 Rhodochrosite ns <0.1 <0.1 <0.1 <0.1 <0.1 Pyrolusite ns 0.2 0.2 0.5 0.6 0.4 Calcite ns <0.2 <0.2 <0.2 <0.2 <0.2 Mg-Phases ns <0.2 <0.2 <0.2 <0.2 0.0 Apatite ns 0.2 0.9 0.0 0.0 0.2 Other ns <0.2 <0.2 <0.2 <0.2 0.0 Total ns 100 100 100 100 100
Site 5 (10.34-10.38)
Mineral % wt/wt
+106 (µm)
+45 (µm)
+20 (µm)
+10 (µm)
-10 (µm)
(1)HEAD
Gypsum 1.5 1.4 5.1 14.2 15.2 8.2 Chalcopyrite 0.0 0.0 0.0 0.0 0.0 0.0 Galena 0.0 0.0 0.0 0.0 0.0 0.0 Jarosite 0.0 0.0 0.0 0.0 0.0 0.0 Barite 0.0 0.0 0.0 0.0 0.0 0.0 Pyrite 0.0 0.0 0.0 1.2 1.3 0.6 Fe-Sphalerite 0.0 0.0 0.0 0.0 0.0 0.0 Fe-Oxide 3.8 5.2 6.7 9.5 9.3 7.2 Ilmenite 0.0 0.0 0.0 0.0 0.0 0.0 Rutile 0.2 1.6 <0.1 <0.1 <0.1 0.4 Quartz 42.1 42.2 38.7 19.4 19.4 31.0 Chlorite 32.8 35.5 36.4 38.9 38.4 36.8 Mica 15.2 10.2 9.9 11.2 10.8 11.1 Al-Silicates 2.1 2.8 3.7 4.3 4.5 4.0 Zircon <0.2 <0.2 <0.2 <0.2 <0.2 <0.2 U-Phases 0.015 0.011 0.01 0.027 0.028 0.0 Rhodochrosite <0.1 <0.1 <0.1 <0.1 <0.1 <0.1 Pyrolusite 0.2 0.2 0.2 0.5 0.5 0.3 Calcite <0.2 <0.2 <0.2 <0.2 <0.2 <0.2 Mg-Phases 0.2 0.2 0.2 0.3 0.3 0.1 Apatite 0.2 0.0 -0.4 0.0 0.0 0.0 Other <0.1 <0.1 <0.1 0.2 0.3 0.1 Total 98 99 100 100 100 100
Site 5 (11.12-11.15m)
Mineral % wt/wt
+106 (µm)
+45 (µm)
+20 (µm)
+10 (µm)
-10 (µm)
(1)HEAD
Gypsum (2)ns 2.3 6.3 11.7 13.4 9.7 Chalcopyrite ns 0.0 0.0 1.4 0.9 0.8 Galena ns 0.0 0.0 0.0 0.0 0.0
Appendix
214
Jarosite ns 0.0 0.0 0.0 0.0 0.0 Barite ns 0.0 0.0 0.0 0.0 0.0 Pyrite ns 0.0 0.0 0.9 0.6 0.5 Fe-Sphalerite ns 0.0 0.0 0.0 0.0 0.0 Fe-Oxide ns 2.9 3.5 4.3 4.5 4.0 Ilmenite ns 0.0 0.0 0.0 0.0 0.0 Rutile ns 3.4 2.5 1.7 1.5 2.1 Quartz ns 47.6 44.6 24.8 23.8 31.6 Chlorite ns 30.8 31.2 38.2 37.1 35.5 Mica ns 11.9 11.3 13.0 13.3 12.6 Al-Silicates ns 2.1 2.9 3.8 4.5 3.3 Zircon ns <0.2 <0.2 <0.2 <0.2 <0.2 U-Phases ns 0.008 0.007 0.018 0.018 0.0 Rhodochrosite ns <0.1 <0.1 <0.1 <0.1 <0.1 Pyrolusite ns 0.3 0.3 0.7 0.7 0.6 Calcite ns <0.2 <0.2 <0.2 <0.2 <0.2 Mg-Phases ns 0.3 <0.1 1.1 2.3 1.1 Apatite ns 0.2 0.0 1.0 0.0 0.4 Other ns 0.2 <0.1 0.9 1.5 0.8 Total ns 102 102 103 104 103
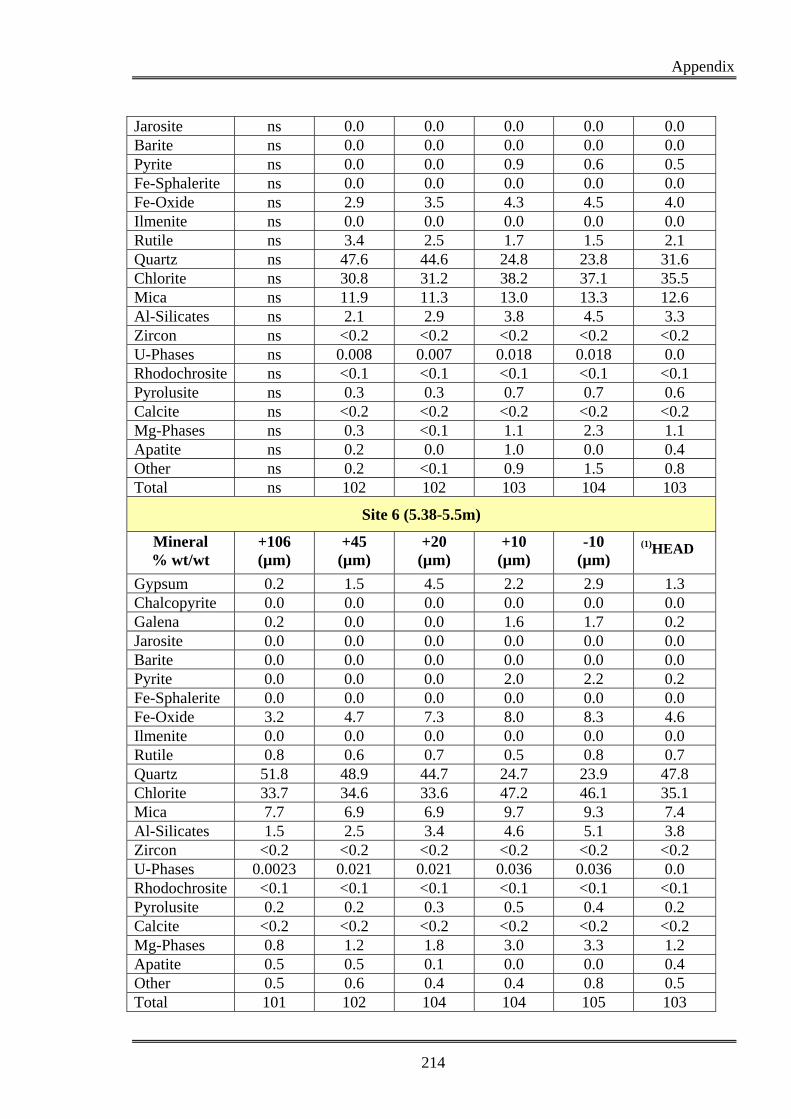
Site 6 (5.38-5.5m)
Mineral % wt/wt
+106 (µm)
+45 (µm)
+20 (µm)
+10 (µm)
-10 (µm)
(1)HEAD
Gypsum 0.2 1.5 4.5 2.2 2.9 1.3 Chalcopyrite 0.0 0.0 0.0 0.0 0.0 0.0 Galena 0.2 0.0 0.0 1.6 1.7 0.2 Jarosite 0.0 0.0 0.0 0.0 0.0 0.0 Barite 0.0 0.0 0.0 0.0 0.0 0.0 Pyrite 0.0 0.0 0.0 2.0 2.2 0.2 Fe-Sphalerite 0.0 0.0 0.0 0.0 0.0 0.0 Fe-Oxide 3.2 4.7 7.3 8.0 8.3 4.6 Ilmenite 0.0 0.0 0.0 0.0 0.0 0.0 Rutile 0.8 0.6 0.7 0.5 0.8 0.7 Quartz 51.8 48.9 44.7 24.7 23.9 47.8 Chlorite 33.7 34.6 33.6 47.2 46.1 35.1 Mica 7.7 6.9 6.9 9.7 9.3 7.4 Al-Silicates 1.5 2.5 3.4 4.6 5.1 3.8 Zircon <0.2 <0.2 <0.2 <0.2 <0.2 <0.2 U-Phases 0.0023 0.021 0.021 0.036 0.036 0.0 Rhodochrosite <0.1 <0.1 <0.1 <0.1 <0.1 <0.1 Pyrolusite 0.2 0.2 0.3 0.5 0.4 0.2 Calcite <0.2 <0.2 <0.2 <0.2 <0.2 <0.2 Mg-Phases 0.8 1.2 1.8 3.0 3.3 1.2 Apatite 0.5 0.5 0.1 0.0 0.0 0.4 Other 0.5 0.6 0.4 0.4 0.8 0.5 Total 101 102 104 104 105 103

Appendix
215
Site 6 (12.36-12.4m) Mineral % wt/wt
+106 (µm)
+45 (µm)
+20 (µm)
+10 (µm)
-10 (µm)
(1)HEAD
Gypsum ns ns 0.5 5.8 6.9 7.0 Chalcopyrite ns ns 0.0 0.5 0.5 0.5 Galena ns ns 0.0 0.0 0.0 0.0 Jarosite ns ns 0.0 0.0 0.0 0.0 Barite ns ns 0.0 0.0 0.0 0.0 Pyrite ns ns 0.0 0.6 0.6 0.5 Fe-Sphalerite ns ns 0.0 0.0 0.0 0.0 Fe-Oxide ns ns 2.6 3.8 3.6 3.6 Ilmenite ns ns 0.0 <0.1 <0.1 0.0 Rutile ns ns 0.8 1.1 0.8 1.0 Quartz ns ns 39.6 30.1 30.1 31.6 Chlorite ns ns 24.3 32.2 32.1 31.4 Mica ns ns 17.3 20.5 19.7 19.9 Al-Silicates ns ns 3.1 3.9 4.2 3.5 Zircon ns ns <0.2 <0.2 <0.2 <0.2 U-Phases ns ns 0.01 0.021 0.02 0.0 Rhodochrosite ns ns <0.1 <0.1 <0.1 <0.1 Pyrolusite ns ns 0.2 0.7 0.4 0.5 Calcite ns ns <0.2 <0.2 <0.2 <0.2 Mg-Phases ns ns 2.1 2.1 2.8 2.3 Apatite ns ns <0.2 0.4 0.3 0.3 Other ns ns 0.9 1.8 2.1 1.7 Total ns ns 91 103 104 104 1HEAD: Whole sample 2ns: Not sufficient sample for analysis
Table 2A.2: Bulk phase geochemistry of tailings solids
Core Sample Major Elements
(% wt/wt)
Site 3 RL (m)
Midpoint SiO2 Al2O3 Fe2O3 MnO MgO CaO K2O SO3
4-4.5 39.5 53.8 12.0 8.2 0.16 10.0 3.10 0.68 4.7
5-5.5 38.5 61.6 12.0 7.1 0.17 11.0 0.75 0.87 0.72
6-6.5 37.5 56.1 14.0 9.3 0.30 12.0 0.72 1.01 1.3
7-7.5 36.5 52.0 14.0 8.2 0.24 10.0 2.90 1.23 4.0
8-8.5 35.6 63.0 12.0 6.6 0.33 8.9 1.50 1.16 2.2

Appendix
216
9-9.5 34.6 69.0 11.0 4.3 0.27 7.9 1.50 1.23 2.0
Site 4 RL (m)
Midpoint SiO2 Al2O3 Fe2O3 MnO MgO CaO K2O SO3
7-7.5 37.6 54.0 13.0 9.5 0.32 12.0 0.71 0.97 2.3
8-8.5 36.4 52.0 15.0 7.7 0.28 11.0 1.10 1.57 3.2
9-9.5 35.2 56.0 12.0 6.0 0.25 10.0 2.60 1.14 4.8
10-10.5 34.0 50.0 14.0 6.3 0.39 9.4 3.10 1.61 6.5
11-11.5 32.8 47.0 14.0 6.4 0.59 8.6 4.40 1.49 8.0
12-12.5 31.7 50.0 16.0 6.5 0.21 9.4 3.20 1.93 5.3
13-13.5 30.5 52.0 16.0 6.4 0.25 8.9 3.00 1.69 4.8
14-14.5 29.3 53.0 15.0 6.8 0.37 8.4 2.70 1.65 4.2
Site 5 RL (m)
Midpoint SiO2 Al2O3 Fe2O3 MnO MgO CaO K2O SO3
2-2.5 40.6 48.0 13.0 11.0 0.36 11.0 3.00 0.78 5.3
3-3.5 39.8 41.0 10.0 8.0 0.49 8.5 2.90 0.76 5.2
4-4.5 38.9 48.0 13.0 11.0 0.31 11.0 2.90 0.84 5.3
5-5.5 38.0 52.0 14.0 8.5 0.28 11.0 1.30 1.18 4.0
6-6.5 37.1 56.0 12.0 6.7 0.26 10.0 2.60 1.10 4.5
7-7.5 36.2 53.0 11.0 6.4 0.23 9.9 2.10 0.10 3.6
8-8.5 35.2 60.0 12.0 6.7 0.28 10.0 1.80 0.10 3.1
9-9.5 34.4 58.0 12.0 7.8 0.44 9.7 2.00 1.12 4.2
10-10.5 33.4 56.0 13.0 7.0 0.35 10.0 2.40 1.23 4.5
11-11.5 32.5 61.0 12.0 5.5 0.32 8.9 2.30 1.22 3.8
12-12.5 31.6 58.0 13.0 4.9 0.36 7.8 1.90 1.68 3.3
13-13.5 30.7 60.0 13.0 5.2 0.23 7.9 2.10 1.31 3.4
Site 6 RL (m)
Midpoint SiO2 Al2O3 Fe2O3 MnO MgO CaO K2O SO3
4-4.5 38.6 56.0 12.0 8.2 0.22 9.4 2.30 0.95 4.1
5-5.5 37.8 64.0 11.0 7.2 0.21 10.0 0.60 0.78 1.1
6-6.5 36.9 65.0 11.0 6.9 0.14 11.0 0.63 0.66 0.77
7-7.5 36.0 58.0 13.0 8.2 0.19 11.0 0.64 1.13 1.8
8-8.5 35.2 51.0 14.0 8.0 0.25 11.0 1.90 1.48 4.1

Appendix
217
9-9.5 34.2 53.0 14.0 6.8 0.27 9.5 3.10 1.46 5.7
10-10.5 33.4 61.0 12.0 6.6 0.46 9.1 2.10 1.15 3.6
11-11.5 32.6 52.0 16.0 6.2 0.23 9.2 2.50 1.86 4.4
12-12.5 31.5 58.0 14.0 5.4 0.27 8.2 2.30 1.78 3.7
12.5-13 30.8 56.0 15.0 5.5 0.24 8.2 2.60 1.81 4.5
Site 9 RL (m)
Midpoint SiO2 Al2O3 Fe2O3 MnO MgO CaO K2O SO3
6-6.5 38.3 53.0 13.0 7.0 0.32 11.0 2.20 1.25 4.9
7-7.5 37.2 58.0 13.0 5.7 0.23 9.5 2.10 1.40 4.2
8-8.5 36.1 56.0 12.0 7.8 0.31 9.99 2.40 1.11 4.3
9-9.5 34.9 56.0 12.0 6.8 0.30 10.0 2.16 1.05 4.1
10-10.5 33.8 51.0 13.0 10.0 0.50 11.0 2.20 1.11 4.9
11-11.5 32.6 50.0 15.0 7.0 0.34 9.6 2.90 1.79 5.5
12-12.5 31.5 55.0 14.0 6.9 0.30 10.0 2.50 1.33 4.2
13-13.5 30.3 62.0 13.0 4.7 0.24 8.4 2.30 1.51 3.4
Table 2A.3: Multi-element composition of tailings solids
Core Sample
Trace Elements
(mg/kg)
Site 3 RL (m)
Midpoint Ba Zn Pb Cu Sr Th U Co Ni
4-4.5 37.5 70 73 645 188 19 115 548 24 64
5-5.5 38.5 77 75 811 85 24 94 360 25 72
6-6.5 37.5 180 79 989 102 25 98 386 28 80
7-7.5 36.5 268 65 967 240 30 109 416 25 71
8-8.5 35.6 144 47 814 149 69 98 358 21 59
9-9.5 34.6 115 43 511 168 52 94 298 18 55
Site 4 RL (m)
Midpoint Ba Zn Pb Cu Sr Th U Co Ni
7-7.5 37.6 176 63 938 117 23 105 430 29 72
8-8.5 36.4 226 65 1164 306 25 107 383 29 72

Appendix
218
9-9.5 35.2 143 61 473 232 15 94 295 28 58
10-10.5 34.0 186 59 800 304 29 118 373 22 65
11-11.5 32.8 182 83 760 369 40 111 440 29 71
12-12.5 31.7 398 54 1333 308 96 102 382 34 69
13-13.5 30.5 314 56 1123 306 34 108 395 31 73
14-14.5 29.3 291 53 1021 409 35 112 435 28 72
Site 5 RL (m)
Midpoint Ba Zn Pb Cu Sr Th U Co Ni
2-2.5 40.6 188 80 737 279 14 82 542 28 66
3-3.5 39.8 222 65 721 383 21 120 717 31 60
4-4.5 38.9 223 88 772 304 19 102 578 29 97
5-5.5 38.0 209 65 984 257 29 107 444 28 73
6-6.5 37.1 206 59 807 288 78 88 336 25 58
7-7.5 36.2 128 40 636 165 75 98 342 21 54
8-8.5 35.2 172 52 760 262 65 92 432 26 63
9-9.5 34.4 146 38 921 174 77 113 432 24 107
10-10.5 33.4 199 59 1125 288 100 101 403 28 63
11-11.5 32.5 155 43 596 200 96 87 260 22 56
12-12.5 31.6 193 39 846 296 71 91 285 18 56
13-13.5 30.7 193 39 644 256 25 107 334 23 63
Site 6 RL (m)
Midpoint Ba Zn Pb Cu Sr Th U Co Ni
4-4.5 38.6 171 63 763 281 20 98 507 24 61
5-5.5 37.8 124 55 889 127 23 94 451 24 61
6-6.5 36.9 78 50 512 89 16 79 421 21 57
7-7.5 36.0 166 64 770 201 18 94 349 24 61
8-8.5 35.2 245 69 1203 254 20 103 359 29 65
9-9.5 34.2 227 74 1050 342 60 121 388 31 74
10-10.5 33.4 164 56 865 214 87 101 356 27 58
11-11.5 32.6 301 47 939 320 110 112 426 26 75
12-12.5 31.5 278 51 1215 321 34 92 348 22 64
12.5-13 30.8 242 45 1383 338 52 111 414 23 69

Appendix
219
Site 9 RL (m)
Midpoint Ba Zn Pb Cu Sr Th U Co Ni
6-6.5 38.3 202 71 793 264 21 105 338 24 66
7-7.5 37.2 141 51 765 346 54 111 341 21 58
8-8.5 36.1 162 43 913 220 98 99 448 20 57
9-9.5 34.9 121 46 678 253 70 108 407 22 53
10-10.5 33.8 263 52 970 194 91 101 459 33 59
11-11.5 32.6 302 59 1487 279 127 112 421 28 72
12-12.5 31.5 263 63 819 272 38 113 314 28 72
13-13.5 30.3 236 35 950 268 23 100 282 23 64

220
Table 2A.4: Porewater pH, Eh and Multi-element Composition as determined by ICP-AES (mg/L)
Sample RL (m) midpoint
pH Eh (mV)
EC (mS/cm)
Al B Ca Cr Fe K Li Mg Mn Na P S Si Sr Ti V Zn
Site 3 5-5.5 38.5 7.95 340 13.3 0.010 0.065 412 <0.005 22 85 0.017 2257 14 94 <0.05 3894 1.7 0.426 <0.005 <0.005 0.05 6-6.5 37.5 7.26 394 10.4 <0.005 0.654 349 0.007 18 89 0.018 1160 125 96 <0.05 2600 3.4 0.315 <0.005 <0.005 0.13 7-7.5 36.5 7.24 379 5.2 0.006 0.464 444 <0.005 6 43 0.058 142 36 69 <0.05 1077 6.1 2.32 <0.005 <0.005 0.08 8-8.5 35.6 8.4 321 4 0.013 0.153 417 <0.005 0.01 77 0.008 37 4.2 69 0.07 737 1.2 3.97 <0.005 <0.005 <0.03 9-9.5 34.6 9.45 276 3 0.034 0.112 523 <0.005 0.01 163 0.006 0.98 0.17 72 0.24 627 5.4 4.50 <0.005 0.013 <0.03
Site 4 7-7.5 37.6 6.85 183 26.5 0.019 0.755 442 0.020 23 114 0.041 6776 456 101 <0.05 10365 5.7 0.343 <0.005 <0.005 2.5 8-8.5 36.4 6.78 194 20.4 0.023 0.695 407 0.022 56 124 0.114 4384 433 113 <0.05 7250 6.3 0.592 <0.005 <0.005 0.49 9-9.5 35.2 6.53 202 26.7 0.006 0.719 446 0.035 33 159 0.182 6472 760 176 <0.05 10451 8.7 1.17 <0.005 <0.005 0.77
10-10.5 34 6.58 241 24.6 0.019 0.762 425 0.036 13 153 0.213 5206 772 166 <0.05 8864 10 1.67 <0.005 <0.005 1.6 11-11.5 32.8 6.66 131 17.7 0.034 0.868 423 0.027 7 120 0.190 3010 542 116 <0.05 5622 9.1 3.34 <0.005 <0.005 0.51 12-12.5 31.7 6.85 103 10.1 0.038 0.526 398 0.019 4 61 0.074 1540 369 52 <0.05 3037 9.9 0.887 <0.005 <0.005 0.54 13-13.5 30.5 7.57 321 8.1 0.029 0.461 456 0.015 0.01 42 0.023 1371 259 41 0.51 2577 11 0.546 <0.005 <0.005 0.13 14-14.5 29.3 7.56 309 7.3 <0.005 0.396 452 0.005 0.01 37 0.057 1064 91 38 0.09 2030 7.8 0.689 <0.005 <0.005 0.07
Site 5 2-2.5 40.6 6.52 241 20.8 0.005 1.81 432 0.058 4.4 59 0.123 4553 1367 55 <0.05 7873 16 0.550 <0.005 <0.005 1.4 3-3.5 39.8 6.32 228 22.3 <0.005 0.694 448 0.053 98 59 0.083 5170 1175 60 <0.05 8746 7.4 0.318 <0.005 <0.005 0.42 4-4.5 38.9 6.77 326 19.8 <0.005 1.79 414 0.058 35 60 0.127 4418 1310 58 <0.05 7643 16 0.554 <0.005 <0.005 1.3 5-5.5 38 6.9 346 29.6 <0.005 0.724 454 0.032 0.01 138 0.126 7424 744 199 <0.05 11614 5.5 2.89 <0.005 <0.005 0.59 6-6.5 37.1 7.48 315 22.3 <0.005 0.928 419 0.015 0.01 189 0.105 3315 289 247 <0.05 6973 4.6 6.8 <0.005 <0.005 0.15 7-7.5 36.2 7.27 391 17.7 0.009 0.746 413 0.013 0.01 152 0.095 2620 269 203 <0.05 5529 4.6 6.8 <0.005 <0.005 0.14 8-8.5 35.2 7.46 335 25.1 0.008 0.546 403 0.011 0.01 157 0.110 4765 224 223 <0.05 8369 2.5 7.6 <0.005 <0.005 0.19 9-9.5 34.4 7.2 381 29.1 <0.005 0.824 417 0.037 0.01 193 0.114 6032 860 249 0.36 11002 4.3 7.3 <0.005 <0.005 0.37
10-10.5 33.4 7.22 369 16 <0.005 0.776 402 0.022 0.01 157 0.189 2212 438 166 0.14 4848 5.8 5.7 <0.005 <0.005 0.39 11-11.5 32.5 8 336 15 0.005 0.407 409 0.007 0.01 128 0.095 2630 167 129 <0.05 4828 1.7 9.4 <0.005 <0.005 0.06 12-12.5 31.6 7.3 246 11.8 0.012 0.548 409 0.021 0.02 70 0.071 1950 415 69 <0.05 3696 8.2 3.78 <0.005 <0.005 0.23 13-13.5 30.7 7.54 323 6.3 0.006 0.351 455 <0.005 0.02 47 0.037 945 39 46 0.09 1926 7.4 0.935 <0.005 <0.005 0.07
221
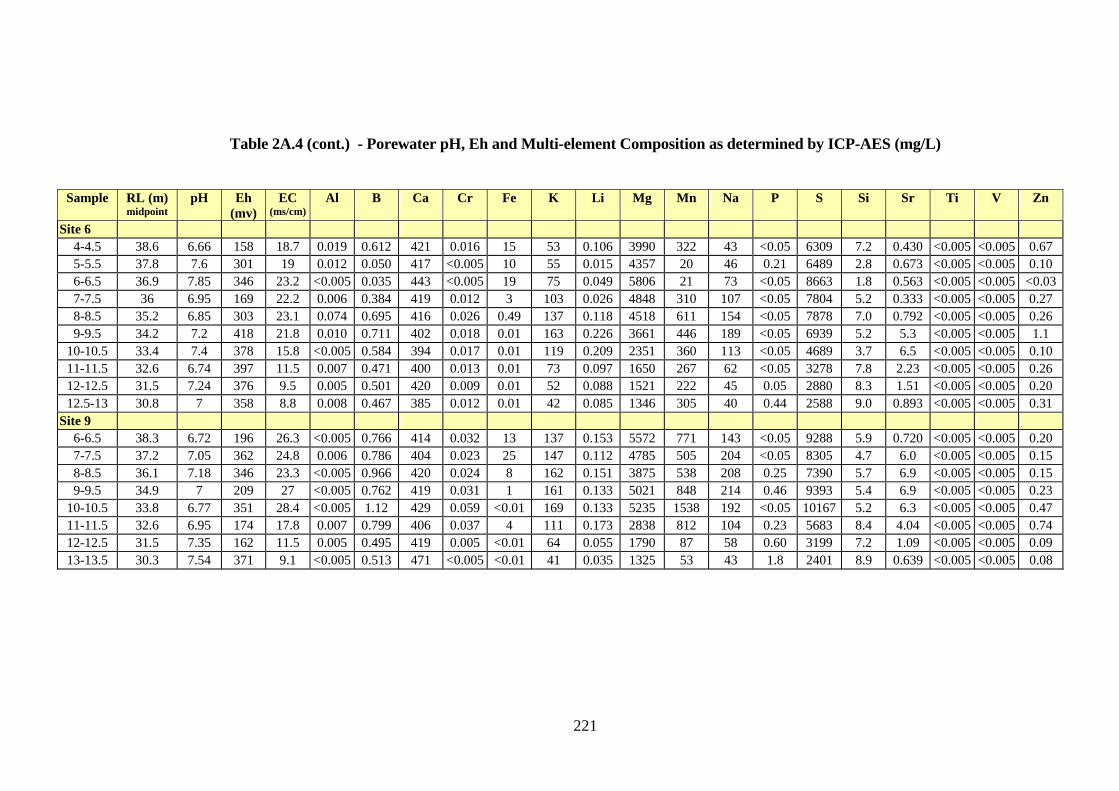
Table 2A.4 (cont.) - Porewater pH, Eh and Multi-element Composition as determined by ICP-AES (mg/L)
Sample RL (m) midpoint
pH Eh (mv)
EC (ms/cm)
Al B Ca Cr Fe K Li Mg Mn Na P S Si Sr Ti V Zn
Site 6 4-4.5 38.6 6.66 158 18.7 0.019 0.612 421 0.016 15 53 0.106 3990 322 43 <0.05 6309 7.2 0.430 <0.005 <0.005 0.67 5-5.5 37.8 7.6 301 19 0.012 0.050 417 <0.005 10 55 0.015 4357 20 46 0.21 6489 2.8 0.673 <0.005 <0.005 0.10 6-6.5 36.9 7.85 346 23.2 <0.005 0.035 443 <0.005 19 75 0.049 5806 21 73 <0.05 8663 1.8 0.563 <0.005 <0.005 <0.03 7-7.5 36 6.95 169 22.2 0.006 0.384 419 0.012 3 103 0.026 4848 310 107 <0.05 7804 5.2 0.333 <0.005 <0.005 0.27 8-8.5 35.2 6.85 303 23.1 0.074 0.695 416 0.026 0.49 137 0.118 4518 611 154 <0.05 7878 7.0 0.792 <0.005 <0.005 0.26 9-9.5 34.2 7.2 418 21.8 0.010 0.711 402 0.018 0.01 163 0.226 3661 446 189 <0.05 6939 5.2 5.3 <0.005 <0.005 1.1
10-10.5 33.4 7.4 378 15.8 <0.005 0.584 394 0.017 0.01 119 0.209 2351 360 113 <0.05 4689 3.7 6.5 <0.005 <0.005 0.10 11-11.5 32.6 6.74 397 11.5 0.007 0.471 400 0.013 0.01 73 0.097 1650 267 62 <0.05 3278 7.8 2.23 <0.005 <0.005 0.26 12-12.5 31.5 7.24 376 9.5 0.005 0.501 420 0.009 0.01 52 0.088 1521 222 45 0.05 2880 8.3 1.51 <0.005 <0.005 0.20 12.5-13 30.8 7 358 8.8 0.008 0.467 385 0.012 0.01 42 0.085 1346 305 40 0.44 2588 9.0 0.893 <0.005 <0.005 0.31
Site 9 6-6.5 38.3 6.72 196 26.3 <0.005 0.766 414 0.032 13 137 0.153 5572 771 143 <0.05 9288 5.9 0.720 <0.005 <0.005 0.20 7-7.5 37.2 7.05 362 24.8 0.006 0.786 404 0.023 25 147 0.112 4785 505 204 <0.05 8305 4.7 6.0 <0.005 <0.005 0.15 8-8.5 36.1 7.18 346 23.3 <0.005 0.966 420 0.024 8 162 0.151 3875 538 208 0.25 7390 5.7 6.9 <0.005 <0.005 0.15 9-9.5 34.9 7 209 27 <0.005 0.762 419 0.031 1 161 0.133 5021 848 214 0.46 9393 5.4 6.9 <0.005 <0.005 0.23
10-10.5 33.8 6.77 351 28.4 <0.005 1.12 429 0.059 <0.01 169 0.133 5235 1538 192 <0.05 10167 5.2 6.3 <0.005 <0.005 0.47 11-11.5 32.6 6.95 174 17.8 0.007 0.799 406 0.037 4 111 0.173 2838 812 104 0.23 5683 8.4 4.04 <0.005 <0.005 0.74 12-12.5 31.5 7.35 162 11.5 0.005 0.495 419 0.005 <0.01 64 0.055 1790 87 58 0.60 3199 7.2 1.09 <0.005 <0.005 0.09 13-13.5 30.3 7.54 371 9.1 <0.005 0.513 471 <0.005 <0.01 41 0.035 1325 53 43 1.8 2401 8.9 0.639 <0.005 <0.005 0.08

222
Table 2A.5 - Porewater Trace Metals and Radionuclides
Sample RL (m)
midpoint Ba
(µg/L)Ni
(µg/L) Cu
(µg/L) Co
(µg/L)Ga
(µg/L)Ge
(µg/L)Rb
(µg/L)Y
(µg/L)Mo
(µg/L)Cd
(µg/L) Sb
(µg/L)Cs
(µg/L)La
(µg/L)Gd
(µg/L)Pb
(µg/L)Bi
(µg/L)U
(µg/L)226Ra
(Bq/L)230Th
(Bq/L) 210Pb
(Bq/L) Site 3
5-5.5 38.5 5 45 59 20 1 2 283 <1 120 3 1 42 <1 <1 2 <1 209 9.4 0.4 1 6-6.5 37.5 5 57 19 15 10 2 253 <1 130 4 <1 31 <1 <1 2 <1 158 2.1 0.5 1 7-7.5 36.5 9 31 48 8 2 <1 150 <1 40 1 <1 14 <1 <1 <1 <1 291 6 0.1 1 8-8.5 35.6 7 10 34 2 <1 <1 92 <1 480 3 <1 11 <1 <1 <1 <1 86 1.8 0.1 1 9-9.5 34.6 15 2 34 3 <1 <1 99 <1 450 1 <1 4 <1 <1 <1 <1 6 6.5 0.3 0.5
Site 4 7-7.5 37.6 5 50 8 32 55 9 447 13 80 9 2 57 <1 2 3 <1 707 3.7 1.1 0.5 8-8.5 36.4 78 280 <5 107 53 4 397 <1 170 45 2 43 <1 <1 4 <1 343 3.3 0.035 0.9 9-9.5 35.2 5 290 <5 79 107 16 629 33 20 2 <1 57 5 4 <1 <1 136 3.7 0.9 0.3
10-10.5 34 12 130 16 20 81 7 536 23 60 120 <1 52 4 2 46 <1 122 2.9 1.7 0.9 11-11.5 32.8 5 40 15 12 53 18 376 11 70 11 <1 36 2 <1 5 <1 51 3.1 0.3 2 12-12.5 31.7 15 8 5 5 38 8 187 2 30 10 <1 15 <1 <1 <1 <1 89 7 2.9 0.8 13-13.5 30.5 5 3 5 2 28 2 113 1 110 12 <1 9 <1 <1 <1 <1 367 2.8 0.8 2 14-14.5 29.3 5 3 7 2 12 2 99 <1 230 13 <1 9 <1 <1 5 <1 230 0.9 0.7 1
Site 5 2-2.5 40.6 11 110 14 194 172 14 250 51 10 13 <1 30 3 9 4 <1 50 4.5 0.31 2 3-3.5 39.8 5 20 <5 134 128 33 306 71 10 6 <1 35 1 12 2 <1 24 4.7 0.04 0.3 4-4.5 38.9 43 140 31 178 161 5 237 33 10 21 <1 28 3 5 42 <1 14 3.5 0.8 0.8 5-5.5 38 <5 50 10 14 106 5 619 18 80 4 <1 76 2 4 1 <1 268 3.1 0.2 2 6-6.5 37.1 <5 20 157 8 58 3 930 3 150 7 <1 99 <1 <1 10 <1 342 2.7 0.2 0.05 7-7.5 36.2 <5 2 36 4 40 4 650 4 290 4 <1 75 <1 <1 2 <1 282 5.2 0.003 0.1 8-8.5 35.2 <5 2 83 6 45 3 814 2 110 11 <1 104 <1 <1 9 <1 642 4.7 0.7 0.8 9-9.5 34.4 <5 2 22 6 142 4 904 4 90 9 <1 99 <1 <1 13 <1 64 5.8 1 0.1
10-10.5 33.4 15 2 32 6 58 2 522 4 120 6 <1 54 <1 <1 1 <1 59 6.5 0.13 0.2 11-11.5 32.5 5 2 18 3 23 2 445 <1 180 5 <1 44 <1 <1 2 <1 58 3.1 0.17 0.2 12-12.5 31.6 11 2 <5 7 59 2 218 2 100 3 <1 23 <1 <1 2 <1 232 2.7 1.6 2 13-13.5 30.7 12 2 35 1 1 <1 82 <1 140 2 <1 7 <1 <1 3 <1 240 4.6 1.2 0.7

223
Table 2A.5 (cont.): Porewater Trace Metals and Radionuclides
Sample RL (m) midpoint
Ba (µg/L)
Ni (µg/L)
Cu (µg/L)
Co (µg/L)
Ga (µg/L)
Ge (µg/L)
Rb (µg/L)
Y (µg/L)
Mo (µg/L)
Cd (µg/L)
Sb (µg/L)
Cs (µg/L)
La (µg/L)
Gd (µg/L)
Pb (µg/L)
Bi (µg/L)
U (µg/L)
226Ra (Bq/L)
230Th (Bq/L)
210Pb (Bq/L)
Site 6 4-4.5 38.6 7 39 22 28 41 7 251 3 110 3 1 34 <1 <1 3 <1 551 5.3 0.2 0.9 5-5.5 37.8 7 38 139 115 2 2 243 3 220 4 2 33 <1 <1 5 <1 560 6.9 0.008 1 6-6.5 36.9 5 37 12 85 2 1 356 <1 340 3 1 43 <1 <1 4 <1 590 2.9 0.2 1 7-7.5 36 24 36 29 33 31 2 359 3 200 4 1 48 <1 <1 4 <1 900 14 0.24 1 8-8.5 35.2 <5 35 19 15 48 3 396 5 110 6 2 43 <1 <1 16 <1 141 3.6 1.1 2 9-9.5 34.2 <5 34 1182 5 36 3 512 3 50 5 <1 54 <1 <1 6 <1 398 7.8 0.3 0.7
10-10.5 33.4 <5 33 28 3 25 1 403 1 130 2 <1 41 <1 <1 3 <1 123 4.3 0.07 0.6 11-11.5 32.6 <5 33 263 2 17 <1 192 2 40 3 <1 18 <1 <1 <1 <1 75 4.2 0.17 0.7 12-12.5 31.5 <5 32 49 2 14 1 124 2 110 3 <1 12 <1 <1 3 <1 780 4.5 0.026 0.4 12.5-13 30.8 6 31 114 1 20 1 106 1 30 4 <1 11 <1 <1 3 <1 26 4.1 0.028 1
Site 9 6-6.5 38.3 <5 38 9 18 63 6 445 8 120 2 <1 47 1 <1 4 <1 159 5.5 0.2 1 7-7.5 37.2 <5 37 <5 24 46 3 572 4 150 3 <1 67 <1 <1 4 <1 111 2.8 0.32 0.9 8-8.5 36.1 <5 36 246 12 47 4 646 3 200 3 1 76 <1 <1 5 <1 127 5.8 0.23 0.2 9-9.5 34.9 <5 35 8 4 73 3 644 5 120 3 <1 83 <1 <1 3 1 50 3.6 0.08 1
10-10.5 33.8 <5 34 152 3 115 2 726 5 30 3 <1 81 <1 <1 5 3 23 3.7 0.27 1 11-11.5 32.6 <5 33 <5 2 56 3 325 5 30 2 <1 35 <1 <1 2 <1 29 2.4 0.8 3 12-12.5 31.5 <5 32 <5 3 8 1 167 1 30 3 1 14 <1 <1 3 <1 240 1.8 0.4 3 13-13.5 30.3 <5 30 154 3 4 <1 114 2 10 1 <1 9 <1 <1 4 <1 262 2.3 0.23 1

Appendix
224
Table 2A.6 Porewater Ammonia, Nitrate and Chloride concentrations for selected cores
Sample RL (m) midpoint
NH4+
(mg/L) NO3
- (mg/L)
Cl- (mg/L)
Site 3 5-5.5 38.5 279 0.45 588 7-7.5 36.5 206 0.78 40 9-9.5 34.6 66 7.33 60
Site 4 7-7.5 37.6 404 1.67 60 8-8.5 36.4 441 1.67 78 9-9.5 35.2 625 1.23 80
10-10.5 34 588 1.23 138 14-14.5 29.3 147 0.78 31
Site 5 2-2.5 40.6 331 1.11 55 3-3.5 39.8 360 0.78 51 5-5.5 38 551 1.44 102 6-6.5 37.1 721 0.45 262
13-13.5 30.7 147 0.67 33 Site 6
5-5.5 37.8 103 0.22 116 6-6.5 36.9 294 0.22 122
12-12.5 31.5 169 0.67 53 Site 9
6-6.5 38.3 500 1.11 78 7-7.5 37.2 603 1.67 107 8-8.5 36.1 633 1.78 93
10-10.5 33.8 691 2.67 78 13-13.5 30.3 147 0.56 31
Appendix
225
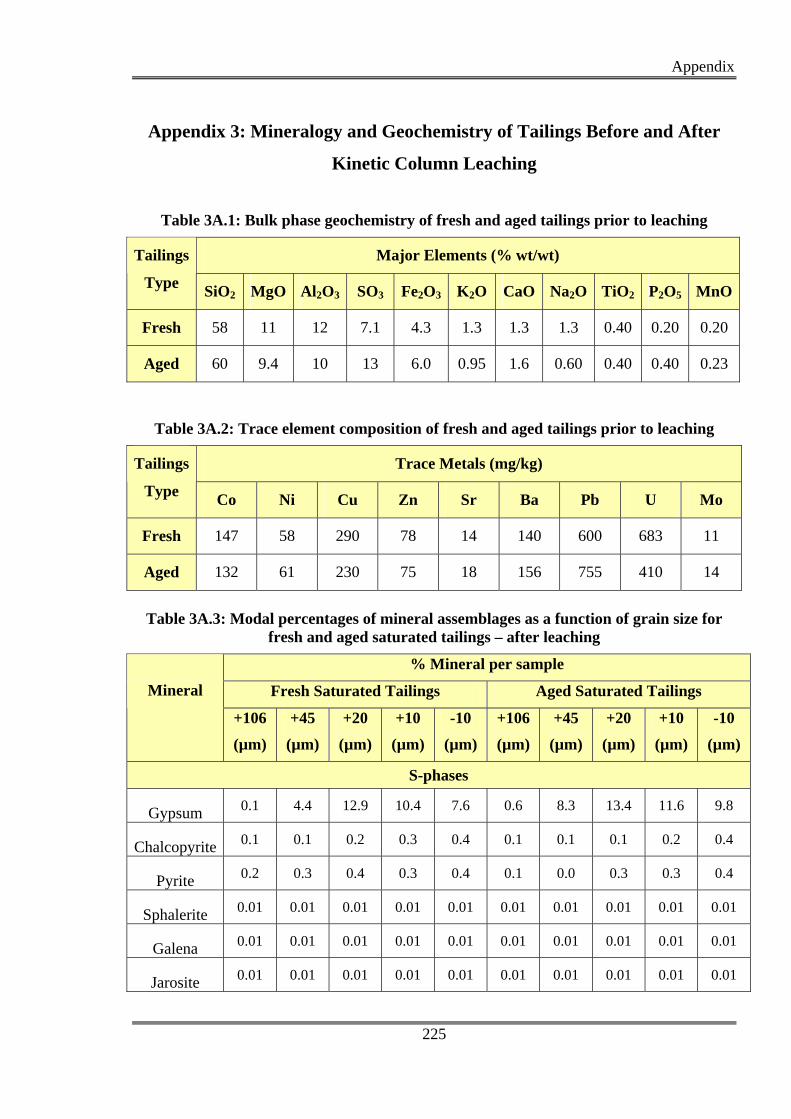
Appendix 3: Mineralogy and Geochemistry of Tailings Before and After
Kinetic Column Leaching
Table 3A.1: Bulk phase geochemistry of fresh and aged tailings prior to leaching
Major Elements (% wt/wt) Tailings
Type SiO2 MgO Al2O3 SO3 Fe2O3 K2O CaO Na2O TiO2 P2O5 MnO
Fresh 58 11 12 7.1 4.3 1.3 1.3 1.3 0.40 0.20 0.20
Aged 60 9.4 10 13 6.0 0.95 1.6 0.60 0.40 0.40 0.23
Table 3A.2: Trace element composition of fresh and aged tailings prior to leaching
Trace Metals (mg/kg) Tailings
Type Co Ni Cu Zn Sr Ba Pb U Mo
Fresh 147 58 290 78 14 140 600 683 11
Aged 132 61 230 75 18 156 755 410 14
Table 3A.3: Modal percentages of mineral assemblages as a function of grain size for
fresh and aged saturated tailings – after leaching
% Mineral per sample
Fresh Saturated Tailings Aged Saturated Tailings
Mineral
+106
(µm)
+45
(µm)
+20
(µm)
+10
(µm)
-10
(µm)
+106
(µm)
+45
(µm)
+20
(µm)
+10
(µm)
-10
(µm)
S-phases
Gypsum 0.1 4.4 12.9 10.4 7.6 0.6 8.3 13.4 11.6 9.8
Chalcopyrite 0.1 0.1 0.2 0.3 0.4 0.1 0.1 0.1 0.2 0.4
Pyrite 0.2 0.3 0.4 0.3 0.4 0.1 0.0 0.3 0.3 0.4
Sphalerite 0.01 0.01 0.01 0.01 0.01 0.01 0.01 0.01 0.01 0.01
Galena 0.01 0.01 0.01 0.01 0.01 0.01 0.01 0.01 0.01 0.01
Jarosite 0.01 0.01 0.01 0.01 0.01 0.01 0.01 0.01 0.01 0.01

Appendix
226
Barite 0.01 0.01 0.01 0.01 0.01 0.01 0.01 0.01 0.01 0.01
Silicates
Chlorite 43.3 46.2 38.1 29.2 31.3 37.5 34.4 32.4 37.2 35.1
Quartz 37.6 33.0 28.6 43.1 41.6 42.4 43.3 34.6 32.0 33.9
Muscovite 12.8 8.0 7.0 7.5 9.9 13.8 6.1 7.2 7.0 8.0
Mica 3.5 2.3 1.7 1.7 2.2 1.9 1.5 1.3 1.1 1.1
Al-Silicates 1.2 2.1 3.2 3.9 4.5 0.8 1.5 2.7 3.6 4.1
Other
U Phases 0.002 0.011 0.028 0.024 0.019 0.002 0.018 0.03 0.027 0.025
Mn Ox/Carb 0.3 2.1 5.2 4.4 3.5 0.4 3.2 5.5 5.0 4.5
Calcite 0.01 0.01 0.20 0.40 0.60 0.10 0.15 0.60 0.60 0.50
Mg-Phases < 0.01 < 0.01 < 0.01 < 0.01 < 0.01 < 0.01 <0.01 <0.01 <0.01 <0.01
FeOxide 0.9 0.4 1.7 1.0 1.6 0.7 0.3 2.1 2.0 2.9
Other* 0.3 0.5 0.5 0.5 0.3 0.1 0.5 0.4 0.2 0.2
Total 101 100 100 103 104 99 99 101 101 101
*Other includes Rutile, Ilmenite and Apatite
Table 3A.4: Bulk phase geochemistry of fresh and aged tailings at the cessation of
leaching
Major Elements (% wt/wt)
SiO2 MgO Al2O3 SO3 Fe2O3 K2O CaO Na2O TiO2 P2O5 MnO
Fresh
Upper 1 54.35 10.36 13.00 5.61 4.64 1.48 1.21 0.81 0.42 0.21 0.06
Upper 2 54.35 10.31 12.60 3.87 4.43 1.40 0.66 0.47 0.38 0.21 0.06
Ave Upper 54.35 10.34 12.80 4.74 4.54 1.44 0.94 0.64 0.40 0.21 0.06
Lower top 55.00 8.78 13.30 7.85 7.06 2.01 2.34 0.61 0.43 0.30 0.09
Lower mid 54.89 8.74 13.20 8.35 7.09 2.00 2.49 0.43 0.43 0.34 0.10

Appendix
227
Lower base 57.54 9.08 12.62 5.23 6.79 1.87 1.54 0.66 0.43 0.27 0.06
Ave Lower 55.81 8.87 13.04 7.14 6.98 1.96 2.12 0.57 0.43 0.30 0.08
Aged
Upper 1 54.61 9.76 12.90 7.62 8.20 1.25 2.41 0.58 0.53 0.48 0.14
Upper 2 55.08 9.58 13.08 6.68 7.80 1.24 2.13 0.62 0.53 0.45 0.11
Ave Upper 54.85 9.67 12.99 7.15 8.00 1.25 2.27 0.60 0.53 0.47 0.12
Lower top 50.29 9.20 13.30 11.00 11.20 1.33 3.66 0.69 0.52 0.46 0.22
Lower mid 49.56 9.25 13.86 13.00 11.60 1.35 4.45 0.50 0.52 0.43 0.25
Lower base 52.75 9.20 11.50 6.87 10.10 1.17 2.08 0.58 0.53 0.43 0.16
Ave Lower 50.87 9.22 12.89 10.29 10.97 1.28 3.40 0.59 0.52 0.44 0.21
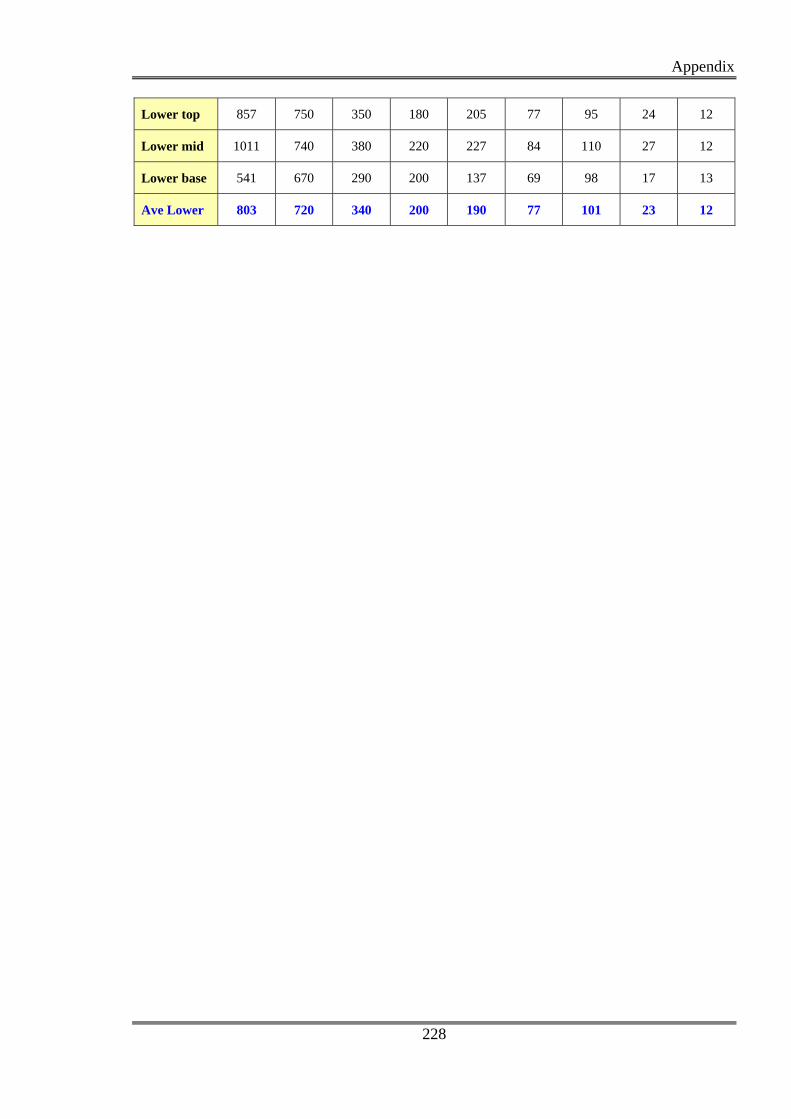
Table 3A.5: Multi-element composition of fresh and aged tailings at the cessation of
leaching
Trace Metals (mg/kg)
Pb U Cu Co Ba Zn Ni Sr Mo
Fresh
Upper 1 630 282 250 169 145 91 80 14 18
Upper 2 559 240 280 163 133 84 74 13 15
Ave Upper 594 261 265 166 139 87.5 77 13.5 16.5
Lower top 610 400 509 220 144 71 85 17 10
Lower mid 592 400 470 260 142 70 98 17 11
Lower base 442 410 450 235 114 65 92 15 11
Ave Lower 548 403 476 238 133 69 92 16 11
Aged
Upper 1 761 600 242 120 164 70 58 22 13
Upper 2 713 610 214 135 158 70 76 20 13
Ave Upper 737 605 228 128 161 70 67 21 13
Appendix
228
Lower top 857 750 350 180 205 77 95 24 12
Lower mid 1011 740 380 220 227 84 110 27 12
Lower base 541 670 290 200 137 69 98 17 13
Ave Lower 803 720 340 200 190 77 101 23 12

Bibliography
229
BIBLIOGRAPHY ABARE, 2004. Australian Bureau of Agriculture and Resource Economics. Website:
www.abare.gov.au 2004. Abdelouas, A., Lutze, W., Nuttall, H.E., 1999. Oxidative dissolution of uraninite precipitated
on Navajo sandstone. Journal of Contaminant Hydrology 36 (1999) 353-375. Abdelouas, A., Yongming, Lu, Lutz,e W. and Nuttall, H.E., 1998. Reduction of U(VI) to U(IV)
by indigenous bacteria in contaminated ground water. Journal of Contaminant Hydrology 35 (1998) 217-233.
Agbenin, J.O., 2003. Soil saturation extract composition and sulfate solubility in a tropical
semiarid soil. Soil Sci. Soc. Am. J. 67, 1133-1139. AGC Woodward-Clyde Pty Ltd, 1994. Hydrogeological impacts of tailings disposal to the
Ranger #1 pit. Report for ERA Ltd, Project No. 2635/1 July 1994. Airey, P. L., 1986. Radionuclide migration around uranium ore bodies in the Alligator Rivers
Region of the Northern Territory of Australia – Analogues of radioactive waste repositories – A review, Chemical Geology 55, 255-268.
Al-Farawati, R. and Van Den Berg, C.M.G., 1999. Metal-sulfide complexation in seawater.
Marine Chemistry 63 (1999) 331-352 Anderson, R.F., 1982. Concentration, vertical flux and re-mineralisation of particulate uranium
in seawater. Geochim. Cosmochim. Acta 46, 1293-1299. Anderson, R.F., 1985. Redox behaviour of uranium in an anoxic marine basin. In
Concentration Mechanisms of Uranium in Geological Environments. Elsevier, Pre-print. Anderson, R.F., Fleisher, M.Q., and LeHuray, A.P., 1989. Concentration, oxidation state, and
particulate flux of uranium in the Black Sea. Geochim. Cosmochim. Acta 53, 2215-2224. Andrew, R.L., 1980. Supergene alteration and gossan textures of base-metal ores in Southern
Africa. Miner. Sci. Eng., 12 pp. 193-215 A.N.Z.E.C.C./A.R.M.C.A.N.Z., 2000. Australian and New Zealand Guidelines for fresh and
marine water quality, Vol. 2, Aquatic ecosystems – Rationale and background information (Ch. 8). Paper No. 4 Vol. 2 (Chapter 8), October 2000.
APHA, 1995. Standard methods fro the examination of water and wastewater. 19th ed.,
American Public Health Board. Washington, DC. Atomic Energy Control Board (AECB), Canada., 1987. Regulatory objectives, requirements
and guidelines for the disposal of radioactive wastes – long term aspects. Regulatory Document R-104, Ottawa. 1987.
Bibliography
230
Australia. Supervising Scientist for the Alligator Rivers Region. Alligator Rivers Region Research Institute annual research summary for 2001-02.
Australian Bureau of Meteorology. Website: www.bom.gov.au 2004 Australian Government, 1982, Revision 1983. Code of practice on the management of
radioactive wastes from the mining and milling of radioactive ores (1982). Guideline: Tailings Impoundment for Uranium Mines. Australian Government Publishing Service. 1983.
Australian Government, 1982, revision 1987. Code of practice on the management of
radioactive wastes from the mining and milling of radioactive ores (1982). Guideline: Decommissioning and Rehabilitation of Uranium Mine, Mill and Waste Disposal Sites. Australian Government Publishing Service. 1987.
Australian Government Publishing Service (AGPS), 1987. Guidelines for the Australian code
of practice on the management of radioactive wastes from the mining and milling of radioactive ores. Canberra.
Australian Groundwater Consultants Pty Ltd (AGC) and Australian Atomic Energy
Commission (AAEC), 1982. A study of radionuclides in the tailings at the Mary Kathleen Uranium Mine. Report 726/1, October 1982.
Balkau, F., 1998. Environmental issues in tailings management. In Proceedings of a
Symposium on Case Studies in Tailings Management. UNEP/ICME, 1998. Benes, P., 1982. Physico-chemical forms and migration in continental waters of radium from
uranium mining and milling in environmental migration of long-lived radionuclides: Vienna, International Atomic Agency, p. 3-23.
Benes, P., 1984. Migration of radium in the terrestrial hydrosphere in the behaviour of radium
in waterways and aquifers. IAEA Rep. IAEA-TECDOC-301, 119. Benes, P., Sedlacek, F., Sandrik, R. and John, J., 1981. Method of selective dissolution for
characterization of particulate forms of radium and barium in natural and waste waters. Water Research 15: 1299-1304.
Benes, P., Strejc, P. and Lukavec, Z., 1984. Interaction of radium with freshwater sediments
and their mineral components I. Ferric oxide and quartz. J. Radioanal. Nucl. Chem. Articles, 82, 275-3-285.
Bennett, D.G. and Read, D., (Eds.) 1992. Geochemical Data Bases. Alligator Rivers Analogue
Project, ANSTO. Vol. 10, 56pp. Benning, L.G., Wilkin, R.T. and Barnes, H.L., 2000. Reaction pathways in the FE-S system
below 100°C. Chemical Geology 167, 25-51. Berner, R.A., 1980. Early diagenesis: A theoretical approach. Princeton: Princeton University
Press.

Bibliography
231
Bertine, K.K., 1972. The deposition of molybdenum in anoxic waters. Mar. Chem., 1: 43-53. Blowes, D.W., Al, J.A., Lortie, L., Gould, W.D. and Jambor, J.L., 1995. Microbiological,
chemical, mineralogical characterization of the Kidd Creek mine tailings impoundment, Timmins area, Ontario, Geomicrobiology J., 13, 13-31.
Blowes, D.W., Cherry, J.A. and Reardon, E.J., 1988. Field observations of the rate of tailings
pore-water evolution at the Heath Steele mine, New Brunswick. Proc. Int. Assoc. Hydrogeologists. pp. 1-15.
Blowes, D.W., Cherry, J.A., Reardon, E.J. and Jambor, J.L., 1991. The formation and potential
importance of cemented layers in inactive sulfide mine tailings. Geochim. Cosmochim. Acta., 55, 965-978.
Blowes, D.W. and Jambor, J.L., 1990. The pore-water geochemistry and mineralogy of the
vadose zone of the sulphide tailings, Waite Amulet, Quebec, Canada. Appl. Geochem., 5, pp. 327-346, 1990.
Blowes, D.W., Jambor, J.L., Appleyard, E.C., Reardon, E.J. and Cherry, J.A., 1991. Temporal
observations of the geochemistry and mineralogy of a sulfide-rich mine tailings impoundment. Explor. Mining Geol., 1, 251-264.
Blowes, D.W., Jambor, J.L., Reardon, E.J., Cherry, J.A. and Appleyard, E.C., 1996. The
geochemical evolution of a high-sulfide mine tailings impoundment. Appl. Geochem. (in press).
Blowes, D.W. and Ptacek, C.J., 1994. Acid-neutralization mechanisms in inactive mine
tailings. in. J.L. Jambor and D.W. Blowes (eds.) Environmental Geochemistry of Sulphide Mine Wastes. Geol. Assoc. Canada. Short Course Vol. 22. pp. 271-292.
Bond, K.A., Heath, T.G. and Tweed, C.J., 1997. HATCHES: A referenced thermodynamic
database for chemical equilibrium studies. Nirex Report, NSS/R379. Brown, P. L., Haworth, A., Sharland, S. M. and Tweed, C. J., 1991. HARPHRQ: A
geochemical speciation program based on PHREEQE. Nirex Safety Studies Report NSS/R18.
Brown, P.L. and Lowson, R.T., 1997. The use of kinetic modelling as a tool in the assessment
of contaminant release during rehabilitation of a uranium mine. Journal of Contaminant Hydrology 26, 27-34.
Brown, P.L., Ritchie, A.I.M., Bennett, J.W., Comarmond, M.J. and Timms, G.P., 2000.
Geochemical kinetic modelling of acid rock drainage. Proceedings from the Fifth International Conference on Acid Rock Drainage, Society for Mining, Metallurgy and Exploration Inc., Littleton, pp 289-296.
Brownlow, A.H., 1979. Geochemistry. Prentice Hall, 1979. Calvert, S.E., 1976. The mineralogy and geochemistry of near shore sediments. In Chemical
Oceanography. Academic Press, London.

Bibliography
232
Calvert, S. E. and Pedersen, T. F., 1996. Sedimentary geochemistry of manganese: Implications
for the environment of formation of manganiferous black shales. Econ. Geol., 91. Carroll, J., Falkner, K. K., Brown, E. T. and Moore, W. S., 1993. The role of the ganges-
brahmaputra mixing zone in supplying barium and 226ra to the Bay of Bengal. Geochim. Cosmochim. Acta 57, 2981-2990.
Cochran, J. K., Carey, A. E., Sholkovitz, E. R. and Surprenant, L. D., 1986. The geochemistry
of uranium and thorium in coastal marine sediments and sediment porewaters. Geochim. Cosmochim. Acta 50, 663-680.
Coffey and Hollingsworth Pty Ltd, 1973. Ranger I Project, Tailings retention scheme study.
Vol. 2, Part B - Regional study of alternative sites, Part C - Geology of the tailings area, Part D – Sources of construction materials in the proposed lease area, November, 1973.
Criscenti, L. J., Laniak, G. F. and Erikson, R. L., 1996. Propagation of uncertainty through
geochemical code calculations. Geochemica et Cosmochimica Acta. 60, 3551-3568. Davis, J. A., James, R. O. and Leckie, J. O., 1978. Colloid Interface Sci. 63, 480-499. Davis, J. A. and Hayes, K. F., 1986. Geochemical processes at mineral surfaces: An overview.
American Chemical Society Symposium Series 323, Washington, D. C. Chap 1. Davison, W., 1991. The solubility of iron sulphides in synthetic and natural waters at ambient
temperature. Aqua. Sci. 53, 302-329. Dawn, C.G. and Stocks, J., 1997 Methods of tailings disposal. Mining Magazine 136, pp345-
349, May 1997. Deer, W.A., Howie, R.A. and Zussman, J., 1966. An Introduction to the Rock Forming
Minerals. Longman Group Ltd, London. Dzombak, D. A. and Morel, F. M. M., 1990. Surface Complexation Modelling: Hydrous Ferric
Hydroxide. Wiley. Eary, L.E., 1999. Geochemical and equilibrium trends in mine pit lakes. Applied Geochemistry
14 (1999) 963-987. Edis, R., Cao, L., Cashion, J., Klessa, D., Koppi, A.J., Murakami, T., Nightingale, T., Payne,
T., Snelling, A. and Yanase, N., 1992. Chemistry and mineralogy of rocks and soil. Alligator Rivers Analogue Project Final Report Volume 8. ISBN 0-642-59934-3.
Emerson, W. W., Peter P., McClure, J. and Weissmann D., 1994. Neutralised tailings and
sulphates: settlement, drying and consolidation. Geotechnique 44, 503-512. Environment Australia, 2000. Website: http://www.deh.gov.au/parks/kakadu/index.html

Bibliography
233
Eupene, G.S, Fee, P.H. and Coville, R.G., 1975. Ranger ore uranium deposits. In Knight, C.L., ed, Economic Geology of Australia and Papua New Guinea. 1. Metals. Parkville, Australian Institute Mining and Metallurgy Monograph 5, 308-317, 1975.
Ewers, Y. and Ferguson, J., 1980. Mineralogy of the Jabiluka, Ranger, Koongarra and Nabarlek
uranium deposits. In Ferguson, J. and Goleby, A.B. (eds.) Uranium in the Pine Creek Geosyncline. International Atomic Energy Agency, Vienna. pp. 363-374.
Falck, W.E., 1996. Technical Report WE/91/6C. Brit. Geol.Surv. Feasby, D.G., Tremblay, G.A., and Weatherell, C.S., 1997. A decade of technology
improvement to the challenge of acid drainage – A Canadian Perspective. In the Proceedings of the fourth international conference on acid rock drainage. Vancouver. pp. I-X.
Fedorak, P.M., Donald, W.S., Westlake, S., Anders, C., Kratochvil, B., Motkosky, N.,
Anderson, W.B. and Huck, P.M., 1986. Microbial release of 226Ra2+ from (Ba, Ra,)SO4 sludges from uranium mine wastes. Applied and Environmental Microbiology, Aug. 1986 pp. 262-268.
Felmy, R., Peterson, S. R. and Serne, R. J., 1987. Interactions of acidic uranium mill tailings
solution with sediments: Predictive modeling of precipitation/dissolution reactions. Uranium 4, 25-41.
Fiedler, V.A. and Pilgrim, D.L., 1993. Tailings dam core data: July 1993 testwork. Energy
Resources of Australia Ltd, September 1993. Fordham, A.W., 1993. Porewater quality of uranium tailings during laboratory aging and its
relation to the solid phase. Aust J. Soil Res., 31, 365-90. Fordham, A.W., and Beech, T.A., 1989. Chemical changes in variously treated tailings with
time. Report 1: Chemical compositions of the solution phase in acid and neutralised tailings, CSIRO Minesite Rehabilitation Research Group, July 1989.
Fordham, A.W., Peter, P. and Milnes, A.R., 1992. Review of information relating to
densification of tailings and deposition of acidic tailings in the tailings dam, plus recommendations for further investigations. CSIRO Minesite Rehabilitation Research Group, May 1992.
Fordham, A.W., Riley, G.G., Nefiodovas, A. and Martin, R., 1993. Examination of tailings
from Ranger tailings dam. CSIRO Minesite Rehabilitation Research Program, June 1993. Framson, P. E. and Leckie, J. O. 1978. Limits of coprecipitation of cadmium and ferrous
sulfides. Env. Sci. Technol., 12: 465-469. Fredrickson, J. K., Zachara, J. M., Kennedy, D. W., Duff, M. C., Gorby, Y. A., Li, S. W., and
Krupka, K. M., 2000. Reduction Of U(Vi) in goethite (γ-FeOOH) suspensions by a dissimilatory metal-reducing bacterium. Geochim. Cosmochim. Acta.
Freeze, R.A. and Cherry, J.A., 1979. Ground Water. Prentice-hall. Englewood Cliffs, NJ, 604

Bibliography
234
Froelich, P. N., Klinkhammer, G. P., Bender, M. L., Luedtke, N. A., Heath, G. R., Cullen, D.,
Dauphin, P., Hammond, D., and Hartman, B., 1979. Early oxidation of organic matter in pelagic sediments of the Eastern Equatorial Atlantic: Suboxic diagenesis. Geochim. Et Cosmochim. Acta. 43, 1075-1090.
Furrer, G., Westall, J. and Sollins, P., 1989. The study of soil chemistry through quasi-steady-
state models. I Mathematical definition of the model. Geochim. Cosmochim. Acta 53, 595-601.
Furrer, G., Westall, J. and Sollins, P., 1990. The study of soil chemistry through quasi-steady-
state models. II. Acidity of soil solution. Geochim. Cosmochim. Acta 54, 2363-2374. Garrels, R. M. and Christ, C.L., 1965. Solutions, Minerals and Equilibria. Freeman, Cooper and
Co., 1965. Gorby, Y.A. and Lovely, D.R., 1992. Enzymatic uranium precipitation. Environ. Sci. Technol.
26, 205-207. Goulden, W.D., Hendry, M.J., Clifton, A.W. and Barbour, S.L., 1998. Characterization of
Radium-226 in uranium mill tailings, tailings and mine waste '98. Balkema, Pp. 561-570. Gray, D., 1986. The geochemistry of uranium and thorium during weathering of chloritic
schists at the Alligator Rivers Uranium Province, N.T., Australia. PhD Thesis, The University of Sydney.
Grenthe, I., Fuger, J., Konings, R.J.M., Lemire, R.J., Muller, A.B., Nguwen-Trung, C. and
Wanner, H., 1992. Chemical thermodynamics of uranium. North-Holland 1992. Grill, E.V., 1982. Kinetic and thermodynamic factors controlling manganese concentrations in
oceanic waters. Geochim. Cosmochim. Acta, 46: 2435-2446. Guillaumont, R., Fanghänel, T., Neck, V., Fuger, J., Palmer, D.A., Grenthe, I. and Rand, M.H.,
2003. Update on chemical thermodynamics of uranium, neptunium, plutonium, americium and technetium. Elsevier 2003.
Hanshaw, B.B. and Back, W., 1979. Major geochemical processes in the evolution of
carbonate-aquifer systems. Journal of Hydrology, 43 (1979) 287-312. Hem, J.D., 1978. Reactions of metal ions at surfaces of hydrous iron oxide. Geochim.
Cosmochim. Acta 41, 527-538. Huang, P.M., 1980. Adsorption processes in soil. The Handbook of Environmental Chemistry.
Vol 2, Part A. Adited by O. Hutzinger. Springer-Verlag, 1980. Huerta-Diaz, M. A. and Morse, J. W., 1992. Pyritization of trace metals in
anoxic marine sediments. Geochim. Cosmocim. Acta 56: 2681-2702. Hutchison, I. P. G., and Ellison, R. D., 1992. Mine waste management/ California Mining
Association. Lewis Publishers 1992. ISBN 0-87371-746-5.

Bibliography
235
International Atomic Energy Agency (IAEA), 1981. Current practices and options for
confinement of uranium mill tailings. Technical Report Series No. 209. International Atomic Energy Agency, Vienna. 1981.
International Atomic Energy Agency (IAEA), 1992. Current practices fro the management and
confinement of uranium mill tailings. Tech Report No. 335. Vienna. International Atomic Energy Agency (IAEA), 1997. Closeout of uranium mines and mills: A
review of current practices. IAEA-TECDOC-939, Vienna, 1997. ICOLD-International Commission on Large Dams, 1996. A Guide to tailings dams and
impoundment. Design, construction, use and rehabilitation. ICOLD, Paris/CIGB Bulletin No. 106, 239pp. Commission Internatiionale des Grandes Barrages, Paris. 1996.
Jambor, J.L., 1994. Mineralogy of sulfide-rich tailings and their oxidation products. in J.L.
Jambor and D.W. Blowes (Eds.) Short Course Handbook on Environmental Geochemistry of Sulfide Mine-Wastes. Min. Assoc. Can. pp. 59-102.
Jean, G.E. and Bancroft, G. M., 1986. Heavy metal adsorption by sulfide mineral surfaces.
Geochim. Acta, 49: 1433-1444. Jeffery, J.J. and Lowson, R.T., 1990. An A.N.S.T.O. report to Ranger Uranium Mines on
stratification in a uranium tailings dam – Effects on water contaminant movement. Jenne, E. A., 1979. Chemical Modeling – Goals, Problems, Approaches and Priorities.
Chemical Modeling in Aqueous Systems: Speciation, Sorption, Solubility and Kinetics. ACS Symposium Series 93, 3-21.
Jenne, E. A., 1981. PNL Report No. PNL-35871. Jewell, R.J., 1996. Tailings storage – the long term view. Western Australia Chamber of Mines
and Energy. 18pp. 1996 Australian Gold Conference, January 1996. Kendall, C.J., 1990. Ranger uranium deposits. In Geology of the Mineral Deposits of Australia
and Papua New Guinea (ED: F. E. Hughes), pp799-805. The Australasian Institute of Mining and Metallurgy, Melbourne. 1990.
Kimber, R.W.L. and Moen R., 1992. An investigation of the microbiology and organic
chemistry of tailings. Report to Ranger Uranium Mines Pty Ltd by CSIRO Minesite Rehabilitation Research Group. June 12, 1992.
Khoe, G. H. and Sinclair, G., 1991. Chemical modelling of the neutralising process for acid
uranium mill tailings. Proceedings, Hydrometallurgy and Aqueous Processing Symposium. Annual Meeting of the Metallurgical Society of AIME, New Orleans, LA.
Klinkhammer, G.P., 1980. Early diagenesis in sediments from the Eastern Equatorial Pacific,
II. Pore water metal results. Earth and Planetary Science Letters, 49:pp 81-101.

Bibliography
236
Klinkhammer, G. P. and Palmer M. R., 1991. Uranium in the oceans: Where it goes and why. Geochim. Cosmochim. Acta 55, 1799-1806.
Kolodny, Y. and Kaplan, I.R., 1973. Deposit of uranium in the sediment and interstitial water
of an anoxic fjord. In Proc. Symp. Hydrogeochem. 1: Hydrogeochem. Pp. 418-442. Clarke Co.. Washington, D.C.
Krauskopf, K. B. and Bird D. K., 1995. Introduction to Geochemistry. McGraw-Hill, Inc Third
Edition. Landa, E. R., 1982. Leaching of radionuclides from uranium ore and mill tailings. Uranium, 1
(1982) pp 53-64. Landa, E. R., 1986. Leaching of 226Ra from uranium mill tailings by sulfate-reducing bacteria.
Health Physics, 514 pp. 509-518. Landa, E.R. and Bush, C.A., 1990. Geochemical hosts of solubilized radionuclides in uranium
mill tailings. Hydrometallurgy, 24 (1990) 361-372. Landa, E.R., Miller C.L. and Updegraff, D.M., 1986. Leaching of 226Ra from U mill tailings by
sulfate-reducing bacteria. Health Physics Vol. 51 No. 4 (October). Pp. 509-518, 1986. Langmuir, D., 1978. Uranium solution-mineral equilibria at low temperatures with applications
to sedimentary ore deposits. Geochim. Cosmochim. Acta 42, 547-569. Lapakko, L., 1987. Prediction of ARD from duluth complex mine waste in north eastern
Minnesota. Acid Mine Drainage Workshop. DSS Cat. No. En. 40-11-7 11987E. 1987. 187-221.
Legeleux, F., Reyss, J.L., Bonte, P. and Organo, C., 1994. Concomitant enrichments of
uranium, molybdenum and arsenic in suboxic continental margin sediments. Oceanologica Acta – Vol. 17 - No. 4.
LeGras, C., 1992. Vertical gradients in the chemical and sulphur-isotope composition of
Ranger tailings pore water, Part 1 – Gradients in non-radionuclide chemical species, Supervising Scientist for the Alligator Rivers Region, Internal Report 70, June 1992.
LeGras, C.A., Akber, R.A and Andrew, A.S., 1993. The sulphur-isotope composition pf pore
water, seepage and infiltration samples from the tailings dam, Ranger Uranium Mine, Northern Territory. Office of the Supervising Scientist Internal Report, Jabiru, N.T., pp.126.
Levins, D.M., Ryan, R.K. and Strong, K.P., 1978. Leaching of radium from uranium tailings, in
management, stabilisation and environmental impact of uranium mill tailings: OECD Nuclear Energy Agency (Paris) Seminar, Albuquerque, 1978, Proceedings, p. 271 – 286.
Levinson, A.A., 1974. Introduction to Exploration Geochemistry. Applied Publishing Calgary. Light, T.S., 1972. Standard solution for redox potential measurements, Anal. Chem. 44: 1038.

Bibliography
237
Lorens, R. B. 1981. Sr, Cd, Mn and Co distribution coefficients in calcite as a function of calcite precipitation rate. Geochim. Cosmochim. Acta, 45: 553-561.
Lottermoser, B.G., Costelloe, M.T., and Ashley, P.M., 2003. Tailings dam seepage at the rehabilitated Mary Kathleen uranium mine, northwest Queensland, Australia. In the Proceedings of the Sixth International Conference on Acid Rock Drainage 14-17 July 2003 Cairns, QLD.
Lovely, D. R., Phillips, E. J. P., Gorby, Y. A., and Landa, E. R., 1991. Microbial reduction of uranium. Nature 350, 413-416.
Lovley, D.R., Roden, E.E., Phillips, E.J.P. and Woodward, J.C., 1993. Enzymatic iron and
uranium reduction by sulfate-reducing bacteria, Marine Geol. 113, 41-53. Lowson, R. T., Comarmond, J. M., Rajaratnam, G. and Brown, P. L., In press. The kinetics of
the dissolution of chlorite as a function of pH and at 25◦C, Geochemica Cosmochemica Acta (2005).
Luther, G. W. and Tsamakis, E., 1989. Concentration and form of dissolved sulfide in the oxic
water column of the ocean. Mar. Chem., 27: 165-177. Markich, S.J and Brown, P.L., 1999. Thermochemical data (log K) for environmentally
relevant elements, H, Na, K, Ca, Mg, Fe, Mn, U, Al, Pb, Zn, Cu and Cd with model fulvic acid (asparate, citrate, malonate, salicylate and tricarballyate). Australian Nuclear Science and Technology Organisation, Technical Report, ANSTO/E735.
Markos, G., 1979. Geochemical mobility and transfer of contaminants in uranium mill tailings.
Symposium on Uranium Mill Tailings Management. Pp55-63. Proceedings at a Symposium Colorado State University, Ft Collins, Colorado. November 19-20, 1979.
Martin, A. J., Crusius, J., Mcnee, J. J. and Yanful, E. K., 2003. The mobility of Radium-226
and trace metals in pre-oxidized subaqueous uranium mill tailings. Appl. Geochem 18: 1095-1110.
Martin, A. J., Mcnee, J. J. and Pedersen, T. F., 2001. The reactivity of sediments impacted by
metal-mining in Lago Junin, Peru. J. Geochem. Explor. 74(1-3), 179-191. McCarty, D. K., Moore, J .N. and Marcus, W. A., 1998. Mineralogy and trace element
association in an acid mine drainage iron oxide precipitate; comparison of selective extractions. Applied Chemistry, Vol. 13, pp. 165-176, 1998.
McCreadie, H., Blowes, D. W., Ptacek, C. and Jambor, J. L., 2000. Influence of reduction
reactions and solid-phase composition on porewater concentrations of arsenic. Env. Sci. Tech. 34, 3159-3166.
McDonald, R., Isbell, R., Speignt, J., Walker, J. and Hopkins, M., 1984. Australian soil and
land survey field handbook. Inkata Press, Melbourne. 160pp. McManus, J., Berelson, W.M., Klinkhammer, G.P., Johnson, K.S., Coale, K.H., Anderson,
R.F., Kumar, N., Burdige, D., Hammond, D.E., Brumsack, H.J., McCorkle, D.C. and

Bibliography
238
Rushdi, A. 1998. Geochemistry of barium in marine sediments: implications for its use as a paleoproxy. Geochim. Cosmochim. Acta 62, 3453-3473.
McNeil, M.B. and Little, B.J., 1990. Mackinawite formation during microbial corrosion.
Corrosion 46, p 599. McQuade, C.V., Johnston, J.F., and Innes, S.M., 1995. Review of historical literature and data
on the sources and quality of effluent from the Mount Lyell lease site. Mount Lyell remediation and resource and demonstration program. Supervising Scientist Report 104, Supervising Scientist, Canberra.
Meehan, Burgess and Yates, 1984. Report on Stage 2 construction of the Ranger tailings dam:
Design, quality control and groundwater monitoring. June, 1984. Mend, 1998. Wet barriers on pyritic uranium tailings. Part Iii. Laboratory diffusion lysimeter
studies of uranium tailings deposited under a shallow water cover. Mend Project 2.13.1b. Merritt, R.C., 1971. The extractive metallurgy of uranium. 576pp. Colorado School of Mines
Research Institute: Golden, Colo. 1971. Mining Journal Research Services, 1996. Environmental and safety incidents concerning
tailings dams at mines. Results of a survey for the years 1980-1996. Report prepared for United Nations Environment Programme and Department of Human Affairs Environment Unit, May 1996. 51pp plus appendix 78pp.
Moliere, D., 2004. Unpublished data. Office of the Supervising Scientist, ERISS. Moore, W. S., 1997. High fluxes of radium and barium from the mouth of the Ganges-
Brahmaputra river during low river discharge suggest a large groundwater source. Earth and Planet. Sci. Letters 150, 141-150.(Iaea-Sm 262/26). Proceedings of a symposium, Alburquerque, 10-14 May, 1982. IAEA, Vienna.
Morin, K. A., 1983. Prediction of subsurface contaminant transport in acidic seepage from
uranium tailings impoundments, Vol. I and II. Ph.D. thesis, Department of Earth Sciences, University of Waterloo, Waterloo, Ont., 713 pp.
Morse, J. W. and Luther, Iii G. W., 1999. Chemical influences on trace metal-sulfide
interactions in anoxic sediments. Geochim. Cosmochim. Acta 63(19/20), 3373-3378. Mucci, A., 1988. Manganese uptake during calcite precipitation from seawater: Conditions
leading to the formation of a pseudokutnahorite. Geochim. Cosmochim. Acta, 52: 1859-1868.
Murakami, T., Isobe, H., Ohnuki, T., Yanase, N., Sato, T., Kimura, H., Sekine, K., Edis, R.,
Koppi, A.J., Klessa, D.A., Conoley, C., Nagano, T., Nakashima, S. and Ewing, R.C., 1992. Weathering and its effects on uranium distribution. Alligator Rivers Analogue Project, ANSTO. 9, 136pp.

Bibliography
239
Nesbitt, H.W. and Jambor, J.L., 1998. Role of mafic minerals in neutralizing ARD, demonstrated using a chemical weathering methodology. From: Modern Approaches to Ore and Environmental Mineralogy, Mineralogical Association of Canada, v. 27, 1998.
Noller, B.N., Currey, N.A., Ayers, G.P. and Gillett, R.W., 1990. Chemical composition and
acidity of rainfall in the Alligator Rivers Region, Northern Territory, Australia. The Science of the Total Environment, 92, 129-144, 1990.
Noller, B.N. and Hart, B.T., 1992. Uranium in sediments from the Magela Creek Catchment,
Northern Territory, Australia. Nordstrom, D.K., 1982. The effect of sulfate on aluminium concentrations in natural waters:
some stability relations in the system Al2O3-SO3-H2O at 298K. Geochimica et Cosmochimica Acta, 46, pp681-692.
Northern Territory of Australia 1979. Uranium Mining (Environmental Control) Act, plus
amendments No 61 0f 1981, and No 50 of 1987. Government Printer of the Northern Territory.
Page, R.W., Compston, W. and Needham, R.S., 1980. Geochronology and evolution of the
Late-Archaean basement and Proterozoic rocks in the Alligator Rivers uranium field. Northern Territory, Australia, in the Uranium in the Pine Creek Geosyncline (Eds J. Ferguson and A.B. Goleby), pp 39-68 (International Atomic Energy Agency: Vienna).
Paige, C.R., Kornicker, W.A., Hileman, O.E. and Snodgrass, W.J., 1998. Solution equilibria for
uranium ore processing: the BaSO4-H2SO4-H2O system and the RaSO4-H2SO4-H2O system. Geochim. Cosmochim. Acta 62, 15-23.
Parkhurst, D. L., Thorstenson, D.C. and Plummer, L.N., 1980. PHREEQE – a computer
program for geochemical calculations; U.S. Geol. Surv. Water –Resources Investigation Report 80-96. (1980).
Payne, T. E. and Waite, T. D., 1990. Surface complexation modeling of uranium sorption data
obtained by isotope exchange techniques. Radiochim. Acta 52/53, 487-493. Peacey, V., Yanful, E.K. and Payne, R., 2002. Field study of geochemistry and solute fluxes in
flooded uranium mine tailings. Can. Geotech. J. 39, 357-376. Pedersen, T.F. and Losher, A.J., 1988. Diagenetic processes in aquatic mine tailings deposits in
British Columbia. In: Forstner, W. (Ed.), Chemistry and Biology of Solid Waste. Springer-Verlag, Berlin, pp. 238-258.
Pedersen, T. F., Mueller, B., and Mcnee, J. J., 1993. The early diagenesis of submerged
sulphide-rich mine tailings in Anderson Lake, Manitoba. Can. J. Earth Sci. 30, 1099-1109. Pedersen, T.F., Vogel, J.S. and Southon, J.R., 1986. Copper and manganese in hemipalegic
sediments at 2l¡N, east Pacific rise: diagenic contrasts. Geochim. Cosmochim. Acta, 50: 353-369.

Bibliography
240
Peter, P., Wright, M. and Richards, B.G., 1994. Quantification of the permeability of materials at and below the base of the tailings dam. CSIRO Minesite Rehabilitation Research Program, August 1994.
Pidgeon, R.T., 1982. Review of the non-radiological contaminants in the long-term
management of uranium mine and mill wastes. In Proceedings of a symposium on Management of Wastes from Uranium Mining and Milling.
Postma, D. and Jakobsen, R., 1996. Redox zonation: Equilibrium constraints on the Fe(III)/
S042- -reduction interface. Geochim. Cosmochim. Acta., 48:, 903-910.
Ranger Mine, 1996. Personal communication – Mill Superintendent. Ranger Mine, 2000. Personal communication – Mill Superintendent. Raven, M. and Self, P.G., 1988. XPLOT User Manual – Manipulation of powder X-ray
diffraction data. CSIRO, Div. of Soils, Technical Memorandum 30/1988. Read, D., 1990. CEC Report EUR 13124EN. Read, D. and Broyd, T.W., 1988. Radiochim. Acta. Special Issue 44/45: 407-415 Reid, P.D., Comarmond, M.J., McIntyre, M.G. and Sinclair, D.J., 1993. Natural leachates of
potential railway ballast material. A Report to Energy Resources of Australia, 1993. Ribet, I., Ptacek, C.J., Blowes, D.W. and Jambor, J.L., 1995. The Potential for metal release by
reductive dissolution of weathered mine tailings. Journal of Contaminant Hydrology. 17, (1995) pp. 239-273.
Richards, B.G. and Peter, P., 1990. Sedimentation and consolidation of acid tailings: Summary
of progress. CSIRO Minesite Rehabilitation Research Group, March 1990. Richards, B.G., Peter, P. and Fordham, A.W., 1990. Field characterisation of Ranger No. 1
tailings in the tailings dam, based on specially designed piezometer installations – Summary of progress. Confidential report to Ranger Uranium Mines Pty Ltd, CSIRO Minesite Rehabilitation Research Group, April 1990.
Richards, B.G., Peter, P. and Martin, R., 1989. Physical, hydraulic and geotechnical properties
of the tailings in the Ranger No. 1 tailings dam – Stage 1. Final Report to Ranger Uranium Mines, CSIRO Division of Soils, May 1989.
Ring, R.J., (1979). Leaching characteristics of Australian uranium ores. The Australasian
Institute of Mining and Metallurgy. December, 1979. Ring, R.S., Levins, D.M., and Gee, F.J., 1982. Radionuclides in process and waste streams at
an operating uranium mill. In proceeds of a symposium on management of wastes from uranium mining and milling (IAEA-SM 262/26). Proceedings of a symposium, Alburquerque, 10-14 May, 1982. IAEA, Vienna. Ritcey, G.M., 1989. Tailings Management Process Metallurgy NO. 6. Elsevier, Amsterdam.

Bibliography
241
Ritcey, G.M., 1989. Tailings management process. Metallurgy No. 6. Elsevier, Amsterdam. Ritcey, G.M., 1990. Weathering processes in uranium tailings and the migration of
contaminants. In the Environmental Behaviour of Radium pp. 27-82. Vienna: International Atomic Energy Agency.
Ritcey, G.M. and Silver, M., 1982. Lysimeter investigation of uranium tailings at CANMET.
CIM Bull. 75:134-143. Savory, P. J., 1994. Geology and grade control at ERA – Ranger Mine, Northern Territory,
Australia. In Proceedings Australasian Institute for Mining and Metalurgy Annual Conference, Darwin, pp 97-101. 1994.
Shepherd, T.A. and Cherry, J.A., 1980. Contamination migration in seepage from uranium mill
tailings impoundment, an overview. Uranium Mill Tailings Management, Proceedings if the Third Symposium, Fort Collins, Colorado. Nov 24-25, 1980.
Shimmield, G.B. and Price, N.B 1986. The behaviour of molybdenum and manganese during
early sediment diagenesis – offshore Baja California, Mexico. Mar. Chem., 19: 261-280. Sholkovitz, E.R., 1973. Interstitial water chemistry of the Santa Barbara Basin sediments.
Geochim. Cosmochim. Acta, 37: 2043-2073. Sholkovitz, E.R., 1978. The flocculation of dissolved Fe, Mn, Al, Cu, Ni, Co and Cd during
estuarine mixing. Earth Planet. Sci. Lett., 41: 77-86. Sinclair, G., 1992. Hydrological and geochemical assessment of the tailings dam seepage
collector system. Energy Resources of Australia, 1992. Skei, J. M.., 1988. Formation of framboidal iron sulfide in the water of a
permanently anoxic fjord - Framvaren, South Norway. Mar. Chem. 23: 345-352. Snodgrass W. J. and Hileman O. E., 1985. On the geochemical mechanism controlling ra-226
dissolution in uranium mill wastes (tailings). In Rep. Nat. Uranium Tailings Program Energy Mines and Resources. Government of Canada.
Snodgrass W. I., Lush D. L. and Capobianco J., 1982. Implications of alternative geochemical
controls on the tempered behaviour of Elliot Lake tailings. Proceedings of an International Symposium on management of wastes from uranium mining and milling. Jointly organised by the International Atomic Energy Agency and the OECD Nuclear Energy Agency Albuquerque 10 – 14 May 1982. IAEA-SM-262/54.
Stromberg, B. and Banwart, S., 1994. Kinetic modelling of geochemical processes at the Aitik
mining waste rock site in northern Sweden. Applied Geochem. 9:583-95 Stumm W. and Morgan J. J., 1981. Aquatic Chemistry. Wiley-Interscience. Stumm W. and Morgan J. J., 1996. Aquatic Chemistry 3rd Edn. Wiley-Interscience.

Bibliography
242
Suess, E., 1980. Particulate organic carbon flux in the oceans – surface productivity and oxygen utilisation. Nature, 288: 260-263.
Suksi, J., Ruskeeniemi, T. and Saarinen, L., 1996. Selective extrcations in uranium migration
studies – findings from a natural analogue study at Palmottu, southern Finland. Contaminant Hydrology, 21: 47-58.
Syme, G.J., Nancarrow, B.E., Bishop, B.J., Blyth, D., and Milech, D., 1992. A benchmark
survey of community perceptions of the mining industry. A report to the Chamber of Mines and Energy, Western Australia. 75pp plus appendices. CSIRO Industrial Risk Management Pty Ltd, University of Western Australia. January, 1992.
Taylor, G.F. and Thornber, M.R., 1992. Gossan Formation and Gossan Surveys. In handbook
of exporation geochemistry. Butt, C.RM. and Zeegers, H. (eds). Elsevier, Amsterdam, Vol 4. pp. 115-201.
Tessier, A., Campbell, P.G.C. and Bisson, M., 1979. Sequential extraction procedure for the
speciation of particulate trace metals. Analytical Chemistry, 51: 844-851. Tessier, A., Fortin, D., Belzile, N., DeVitre, R.R. and Leppard, G.G., 1996. Metal sorption to
diagenetic Fe and Mn oxyhydroxides and associated organic matter: narrowing the gap between field and laboratory measurements. Geochem. Cosmochim. Acta, 60: 387-404.
Thornber, M.J., 1992. The chemical mobility and transport of elements in the weathering
environment. In C.R.M. Butt and H. Zeegers (eds.) Regolith Exploration Geochemistry in Tropical and Subtropical Terrains. Elsevier, Amsterdam, pp. 79-114.
Turner, J.V. and Dillon, P.J., 1988. Migration of solutes from the Ranger mines tailings dam in
relation to seepage collectors and groundwater – Stage 1, Report to Ranger Uranium Mines Pty Ltd, CSIRO Division of Water Resources, May, 1988.
UMTRA, 1991. Uranium Mill Tailings Remediation Action Project. Questions and Answers
(Brochure). Public Affairs. Department of Energy Field Office. Alburquerque, New Mexico. 1991.
Uranium Institute, 1991. The management of radioactive wastes. A report by an international
group of experts. The Uranium Institute, London. ISBN 0 946 777 217. UIC, 2004. Uranium Information Centre Ltd. Website: www.uic.com.au. 2004. UIL, 2004. Uranium Institute London. Website: www.uilondon.org. 2004. U.S. EPA, 1996. Test methods for evaluating solid waste. U.S. Environmental Protection
Agency, Washington, DC., Report Nos: EPA/SW-846, Vol. 1, pp Monty Python - 3005-1-3005-4, 3010-1-3010-5, 3050-1-3050-5.
Van der Weijden, C. H., 1992. Early diagenesis and marine pore water. In G.V. Wolf K.H. and
Chilingarian (Eds.), Diagenesis III (pp. 13-133). Elsevier.

Bibliography
243
Verhoeven, T.J., 1988. Rum Jungle rehabilitation project. Proceedings Australian Minerals Council 3rd International Environmental Workshop, Darwin. September, 1988.
Vigneault, B., Campbell P., Tessier A. and De Vitre R., 2001. Geochemical changes in sulfidic
mine tailings stored under a shallow water cover. Wat. Res. 35(4), 1066-1076. Wagener, F., Strydom, K., Craig, H. and Blight, G., 1997. The tailings dam flow failure at
Merriespruit, South Africa: causes and consequences. In Tailings and Mine Waste ’97, 657-666. Proceedings 4th International Conference on Tailings and Mine Waste, Fort Collins, Colorado, USA, 13-17 January 1997. Balkema, Rotterdam.
Waggitt, P., 1994. A Review of worldwide practices for disposal of uranium mill tailings.
Supervising Scientist for the Alligator Rivers Region Technical Memorandum 48. 44pp AGPS, Canberra. 1994.
Weast, R.C., 1990. CRC Handbook of Chemistry and Physics (70th edn), p. B104 (CRC Press:
Florida. Westall, J., 1979. MICROQL, a chemical equilibrium program in basic. Swiss federal Institute
of Technolgy Report. Williams, E.G., 1982. Factors controlling the generation of acid mine drainage. Report to the
United States Bureau of Mines, Research Grant No. G5105086. 1982. 256 World Nuclear Association, 2004: http://www.world-nuclear.org Yanase, N., Nightingale, T. and Duerden, P., 1991. Uranium distribution in mineral phases of
rock by sequential extraction procedure. Radiochimica Acta, 52/53: 387-393.