appendices - new jersey h...sobra for aged and disabled ..... 220,421 219,552 234,262 239,088...
TRANSCRIPT
Appendices

APPENDIX
H-1
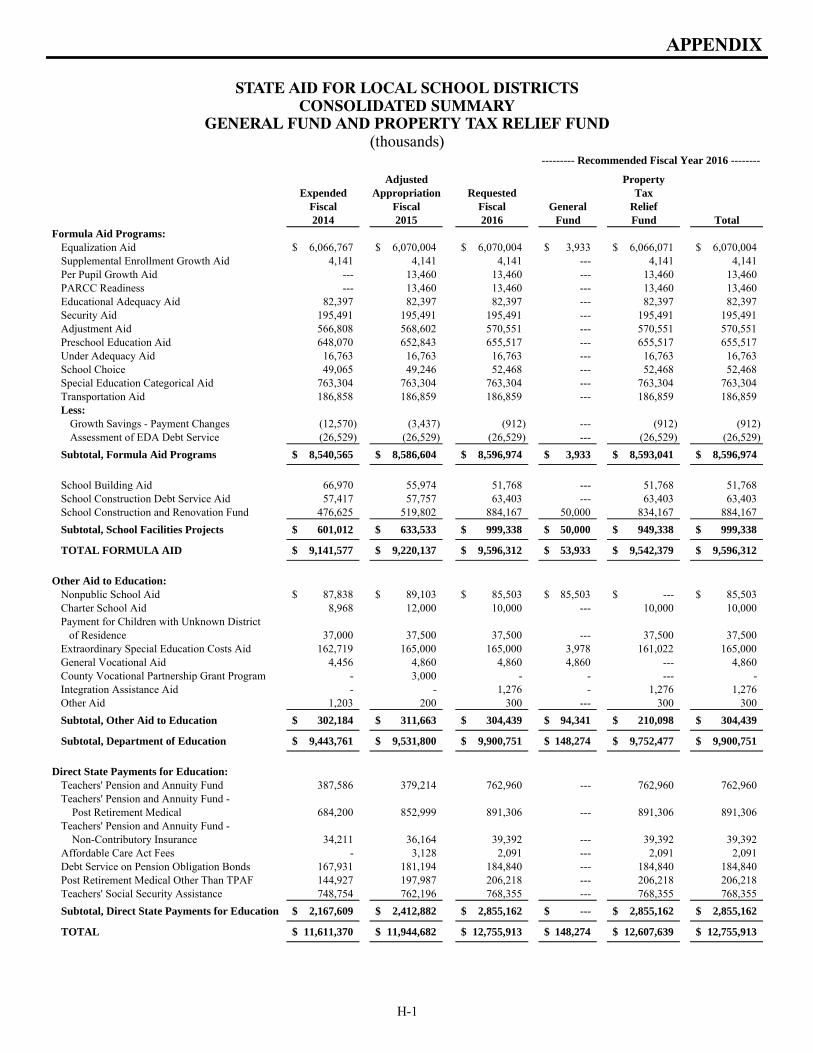
STATE AID FOR LOCAL SCHOOL DISTRICTSCONSOLIDATED SUMMARY
GENERAL FUND AND PROPERTY TAX RELIEF FUND(thousands)
Adjusted PropertyExpended Appropriation Requested Tax
Fiscal Fiscal Fiscal General Relief2014 2015 2016 Fund Fund Total
Formula Aid Programs:Equalization Aid 6,066,767$ 6,070,004$ 6,070,004$ 3,933$ 6,066,071$ 6,070,004$ Supplemental Enrollment Growth Aid 4,141 4,141 4,141 --- 4,141 4,141 Per Pupil Growth Aid --- 13,460 13,460 --- 13,460 13,460 PARCC Readiness --- 13,460 13,460 --- 13,460 13,460 Educational Adequacy Aid 82,397 82,397 82,397 --- 82,397 82,397 Security Aid 195,491 195,491 195,491 --- 195,491 195,491 Adjustment Aid 566,808 568,602 570,551 --- 570,551 570,551 Preschool Education Aid 648,070 652,843 655,517 --- 655,517 655,517 Under Adequacy Aid 16,763 16,763 16,763 --- 16,763 16,763 School Choice 49,065 49,246 52,468 --- 52,468 52,468 Special Education Categorical Aid 763,304 763,304 763,304 --- 763,304 763,304 Transportation Aid 186,858 186,859 186,859 --- 186,859 186,859 Less:
Growth Savings - Payment Changes (12,570) (3,437) (912) --- (912) (912) Assessment of EDA Debt Service (26,529) (26,529) (26,529) --- (26,529) (26,529)
Subtotal, Formula Aid Programs 8,540,565$ 8,586,604$ 8,596,974$ 3,933$ 8,593,041$ 8,596,974$
School Building Aid 66,970 55,974 51,768 --- 51,768 51,768 School Construction Debt Service Aid 57,417 57,757 63,403 --- 63,403 63,403 School Construction and Renovation Fund 476,625 519,802 884,167 50,000 834,167 884,167 Subtotal, School Facilities Projects 601,012$ 633,533$ 999,338$ 50,000$ 949,338$ 999,338$
TOTAL FORMULA AID 9,141,577$ 9,220,137$ 9,596,312$ 53,933$ 9,542,379$ 9,596,312$
Other Aid to Education:Nonpublic School Aid 87,838$ 89,103$ 85,503$ 85,503$ ---$ 85,503$ Charter School Aid 8,968 12,000 10,000 --- 10,000 10,000 Payment for Children with Unknown District of Residence 37,000 37,500 37,500 --- 37,500 37,500 Extraordinary Special Education Costs Aid 162,719 165,000 165,000 3,978 161,022 165,000 General Vocational Aid 4,456 4,860 4,860 4,860 --- 4,860 County Vocational Partnership Grant Program - 3,000 - - --- - Integration Assistance Aid - - 1,276 - 1,276 1,276 Other Aid 1,203 200 300 --- 300 300 Subtotal, Other Aid to Education 302,184$ 311,663$ 304,439$ 94,341$ 210,098$ 304,439$
Subtotal, Department of Education 9,443,761$ 9,531,800$ 9,900,751$ 148,274$ 9,752,477$ 9,900,751$
Direct State Payments for Education:
Teachers' Pension and Annuity Fund 387,586 379,214 762,960 --- 762,960 762,960 Teachers' Pension and Annuity Fund - Post Retirement Medical 684,200 852,999 891,306 --- 891,306 891,306 Teachers' Pension and Annuity Fund - Non-Contributory Insurance 34,211 36,164 39,392 --- 39,392 39,392 Affordable Care Act Fees - 3,128 2,091 --- 2,091 2,091 Debt Service on Pension Obligation Bonds 167,931 181,194 184,840 --- 184,840 184,840 Post Retirement Medical Other Than TPAF 144,927 197,987 206,218 --- 206,218 206,218 Teachers' Social Security Assistance 748,754 762,196 768,355 --- 768,355 768,355 Subtotal, Direct State Payments for Education 2,167,609$ 2,412,882$ 2,855,162$ ---$ 2,855,162$ 2,855,162$
TOTAL 11,611,370$ 11,944,682$ 12,755,913$ 148,274$ 12,607,639$ 12,755,913$
--------- Recommended Fiscal Year 2016 --------
APPENDIX
H-2
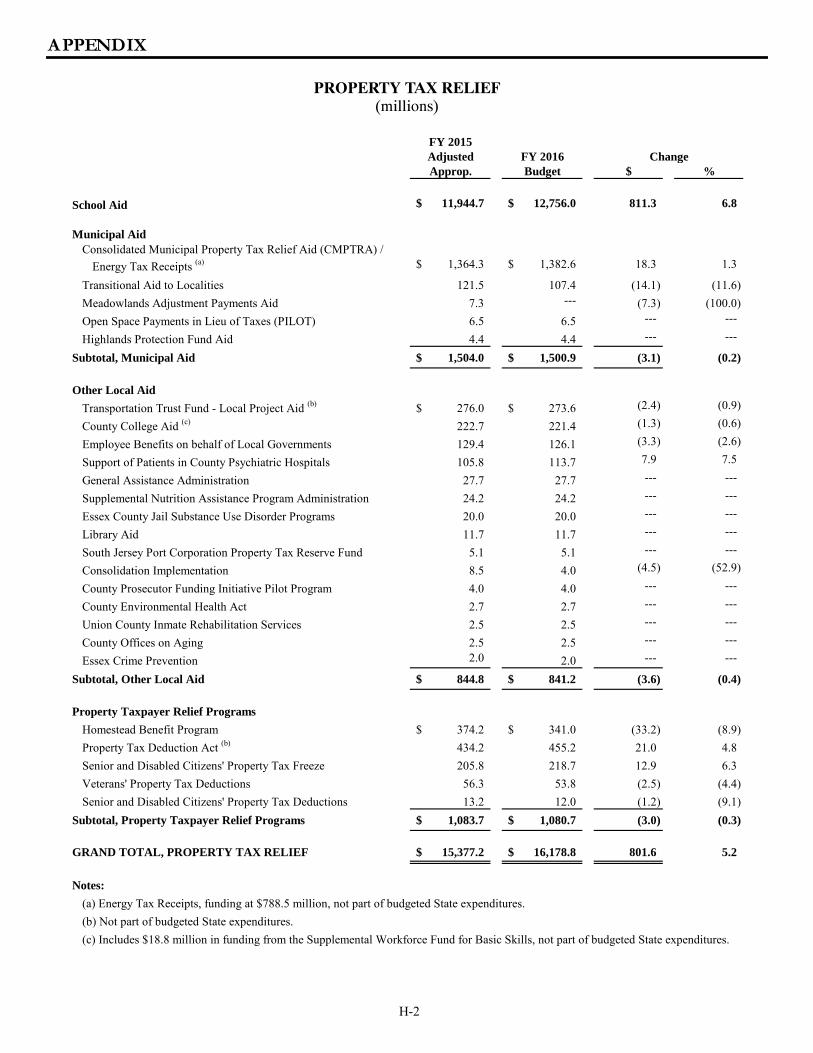
PROPERTY TAX RELIEF(millions)
FY 2015Adjusted FY 2016 ChangeApprop. Budget $ %
School Aid 11,944.7$ 12,756.0$ 811.3 6.8
Municipal Aid Consolidated Municipal Property Tax Relief Aid (CMPTRA) /
Energy Tax Receipts (a) 1,364.3$ 1,382.6$ 18.3 1.3
Transitional Aid to Localities 121.5 107.4 (14.1) (11.6) Meadowlands Adjustment Payments Aid 7.3 --- (7.3) (100.0) Open Space Payments in Lieu of Taxes (PILOT) 6.5 6.5 --- ---
Highlands Protection Fund Aid 4.4 4.4 --- ---
Subtotal, Municipal Aid 1,504.0$ 1,500.9$ (3.1) (0.2)
Other Local Aid
Transportation Trust Fund - Local Project Aid (b) 276.0$ 273.6$ (2.4) (0.9)
County College Aid (c) 222.7 221.4 (1.3) (0.6)
Employee Benefits on behalf of Local Governments 129.4 126.1 (3.3) (2.6)
Support of Patients in County Psychiatric Hospitals 105.8 113.7 7.9 7.5
General Assistance Administration 27.7 27.7 --- ---
Supplemental Nutrition Assistance Program Administration 24.2 24.2 --- ---
Essex County Jail Substance Use Disorder Programs 20.0 20.0 --- ---
Library Aid 11.7 11.7 --- ---
South Jersey Port Corporation Property Tax Reserve Fund 5.1 5.1 --- ---
Consolidation Implementation 8.5 4.0 (4.5) (52.9)
County Prosecutor Funding Initiative Pilot Program 4.0 4.0 --- ---
County Environmental Health Act 2.7 2.7 --- ---
Union County Inmate Rehabilitation Services 2.5 2.5 --- ---
County Offices on Aging 2.5 2.5 --- ---
Essex Crime Prevention 2.0 2.0 --- ---
Subtotal, Other Local Aid 844.8$ 841.2$ (3.6) (0.4)
Property Taxpayer Relief Programs
Homestead Benefit Program 374.2$ 341.0$ (33.2) (8.9) Property Tax Deduction Act (b) 434.2 455.2 21.0 4.8 Senior and Disabled Citizens' Property Tax Freeze 205.8 218.7 12.9 6.3 Veterans' Property Tax Deductions 56.3 53.8 (2.5) (4.4) Senior and Disabled Citizens' Property Tax Deductions 13.2 12.0 (1.2) (9.1)
Subtotal, Property Taxpayer Relief Programs 1,083.7$ 1,080.7$ (3.0) (0.3)
GRAND TOTAL, PROPERTY TAX RELIEF 15,377.2$ 16,178.8$ 801.6 5.2
Notes:
(a) Energy Tax Receipts, funding at $788.5 million, not part of budgeted State expenditures.(b) Not part of budgeted State expenditures.(c) Includes $18.8 million in funding from the Supplemental Workforce Fund for Basic Skills, not part of budgeted State expenditures.
APPENDIX
H-3
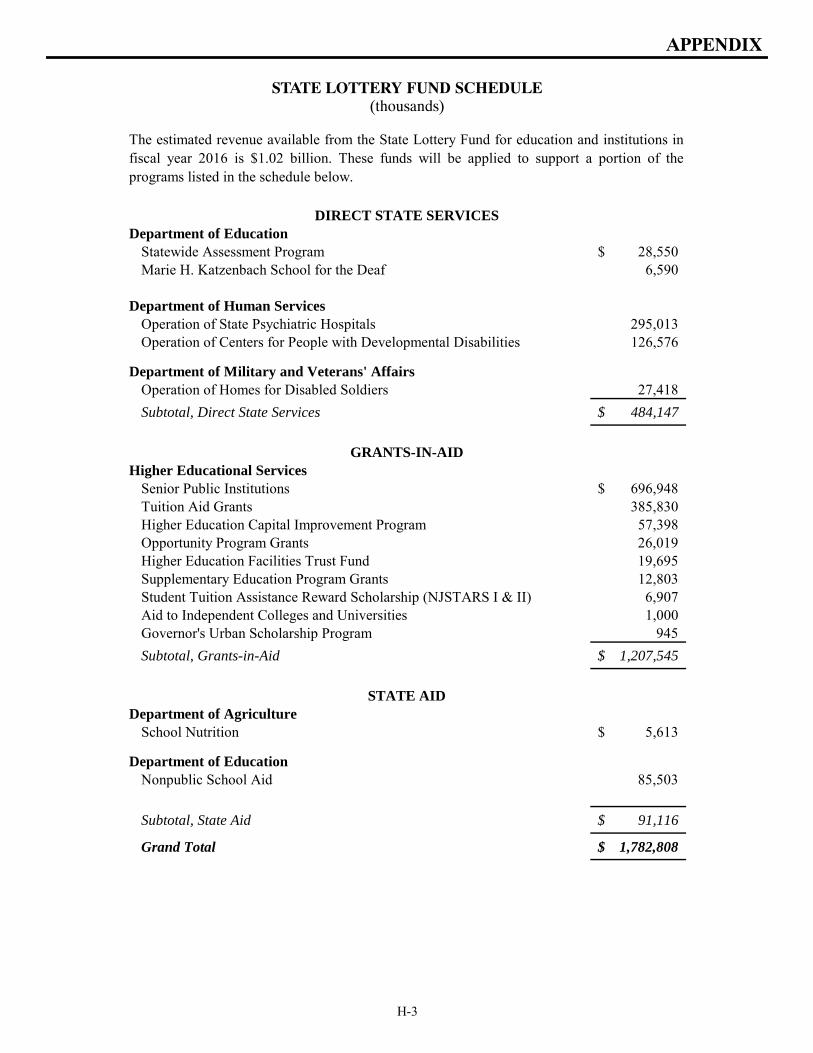
STATE LOTTERY FUND SCHEDULE(thousands)
Department of EducationStatewide Assessment Program 28,550$ Marie H. Katzenbach School for the Deaf 6,590
Department of Human Services Operation of State Psychiatric Hospitals 295,013 Operation of Centers for People with Developmental Disabilities 126,576
Department of Military and Veterans' AffairsOperation of Homes for Disabled Soldiers 27,418 Subtotal, Direct State Services 484,147$
Higher Educational ServicesSenior Public Institutions 696,948$ Tuition Aid Grants 385,830 Higher Education Capital Improvement Program 57,398 Opportunity Program Grants 26,019 Higher Education Facilities Trust Fund 19,695 Supplementary Education Program Grants 12,803 Student Tuition Assistance Reward Scholarship (NJSTARS I & II) 6,907 Aid to Independent Colleges and Universities 1,000 Governor's Urban Scholarship Program 945 Subtotal, Grants-in-Aid 1,207,545$
Department of AgricultureSchool Nutrition 5,613$
Department of EducationNonpublic School Aid 85,503
Subtotal, State Aid 91,116$
Grand Total 1,782,808$
The estimated revenue available from the State Lottery Fund for education and institutions infiscal year 2016 is $1.02 billion. These funds will be applied to support a portion of theprograms listed in the schedule below.
GRANTS-IN-AID
STATE AID
DIRECT STATE SERVICES
APPENDIX
H-4
CASINO REVENUE FUND
The Casino Revenue Fund (CRF) was established in 1976 with the provision that State revenues derived from casino gambling would be applied solely for the purpose of “providing funding for reductions in property taxes, rental, telephone, gas, electric, and municipal utilities charges of eligible senior citizens and disabled residents of the State in accordance with such formulae as the Legislature shall by law provide.” The Fund’s authorized use was expanded in 1981 to include additional or expanded health services or benefits, transportation services or benefits to eligible senior and disabled residents. Total CRF resources of $205 million, including $175,000 from the Casino Simulcasting Fund, are projected for fiscal 2016. This total also includes revenues from Internet gaming, launched in November 2013. The Pharmaceutical Assistance to the Aged and Disabled (PAAD) program, which at one point in time consumed a majority of the revenues in the CRF, has become less costly as most recipients now receive medications through the federally funded Medicare Part D program. This has allowed greater CRF support for expanded community based services for residents with developmental disabilities. The summary and projection table on the following page displays CRF revenues and the programs receiving Fund
appropriations over the past several years. Some CRF appropriations have been shifted to the General Fund during that time (see the “General Fund Support” section of the table).
BUDGET INITIATIVES AND ONGOING PROGRAMS
The following programs are currently receiving significant funding through the Casino Revenue Fund: Developmental Disabilities Residential Care
— $154.4 million Transportation Assistance to Seniors and Disabled
— $18.8 million Community Based Senior Programs
— $14.7 million Pharmaceutical Assistance to the Aged and Disabled (PAAD)
— $9.4 million Disability Services Personal Assistance
— $3.7 million Sheltered Workshop Transportation
— $2.2 million

APPENDIX
H-5
CASINO REVENUE FUND SUMMARY AND PROJECTION(thousands)
Fiscal Fiscal Fiscal Revised Budget
2012 2013 2014 2015 2016
Opening Surplus ............................................................... ---$ ---$ ---$ ---$ ---$ Revenues .......................................................................... 238,986 214,596 221,226 211,562 204,825 Lapses and Adjustments (a) .............................................. 5,994 69,244 162,308 58,610 175
TOTAL RESOURCES ................................................... 244,980$ 283,840$ 383,534$ 270,172$ 205,000$
MEDICAL ASSISTANCE
Community Based Senior Programs ............................. 14,677 14,748 14,747 14,748 14,748 Disability Services Waivers (b) .................................... 16,502 16,502 16,502 --- --- Global Budget for Long Term Care (b) ........................ 20,000 100,000 37,850 --- --- Hearing Aid Assistance ................................................ 40 30 25 120 120 Human Services Administration ................................... 724 824 902 871 871 PAAD -- Expanded ....................................................... 51,145 63,038 50,000 9,440 9,440 Personal Assistance ...................................................... 3,734 3,734 3,734 3,734 3,734 Personal Care (b) .......................................................... 77,705 --- --- --- --- Statewide Birth Defects Registry .................................. 528 528 528 529 529
TRANSPORTATION ASSISTANCE
Senior Citizens and Disabled Residents ....................... 25,121 24,632 20,343 18,264 18,824 Sheltered Workshop Transportation ............................. 2,196 2,196 2,196 2,196 2,196
HOUSING PROGRAMS
Developmental Disabilities ........................................... 32,516 57,516 236,615 220,178 154,446
OTHER PROGRAMS
Home Health Aide Certification ................................... 92 92 92 92 92
TOTAL APPROPRIATIONS ........................................ 244,980$ 283,840$ 383,534$ 270,172$ 205,000$
ENDING SURPLUS ....................................................... 0.0$ 0.0$ 0.0$ 0.0$ 0.0$
GENERAL FUND SUPPORT
Developmental Disabilities ........................................... 485,700 454,646 311,652 395,418 471,458 Global Budget and Waivers (b) .................................... 104,000 27,175 106,297 --- --- Managed Long Term Services and Supports (b) .......... --- --- --- 282,284 393,520 PAAD -- Expanded ....................................................... --- 16,524 33,005 62,900 59,424 Personal Care/Community Programs (b) ...................... 111,700 55,198 63,170 44,303 41,352 Senior and Disabled Citizens' Property Tax Freeze ...... 212,200 220,983 211,635 205,800 218,700 SOBRA for Aged and Disabled .................................... 220,421 219,552 234,262 239,088 244,034
TOTAL GENERAL FUND SUPPORT ........................ 1,134,021$ 994,078$ 960,021$ 1,229,793$ 1,428,488$
Notes:
program.
(a) Lapses and Adjustments include Interest Earnings, Casino Simulcasting Funds, and General Fund support in years that CRF revenue is less than expenditures.
(b) Global Budget, Personal Care and Waiver services are now provided through the Managed Long Term Services and Support

APPENDIX
H-6
9--1--1 SYSTEM AND EMERGENCY RESPONSE FEE(thousands)
Department of Law and Public SafetyEmergency Operations Center and Hamilton TechPlex Maintenance 3,773$ Office of Homeland Security and Preparedness 3,884 Rural Section Policing 53,398 Urban Search and Rescue 1,000 Division of State Police - Remaining Operating Budget 217,640
Department of Military and Veterans' AffairsMilitary Services - National Guard Support Services 3,807
Department of the TreasuryOffice of Emergency Telecommunication Services (OETS) 900 Statewide 9-1-1 Emergency Telecommunication System 13,122
Total, State Appropriations 297,524$
The estimated revenue from the mobile telecommunications service and telephone exchange service fee in fiscal year2016 totals $121.6 million. In accordance with the enabling legislation (P.L.2004, c.48), these funds will be depositedinto the 9-1-1 System and Emergency Response Trust Fund account and applied to offset a portion of the cost of relatedprograms listed below:
APPENDIX
H-7
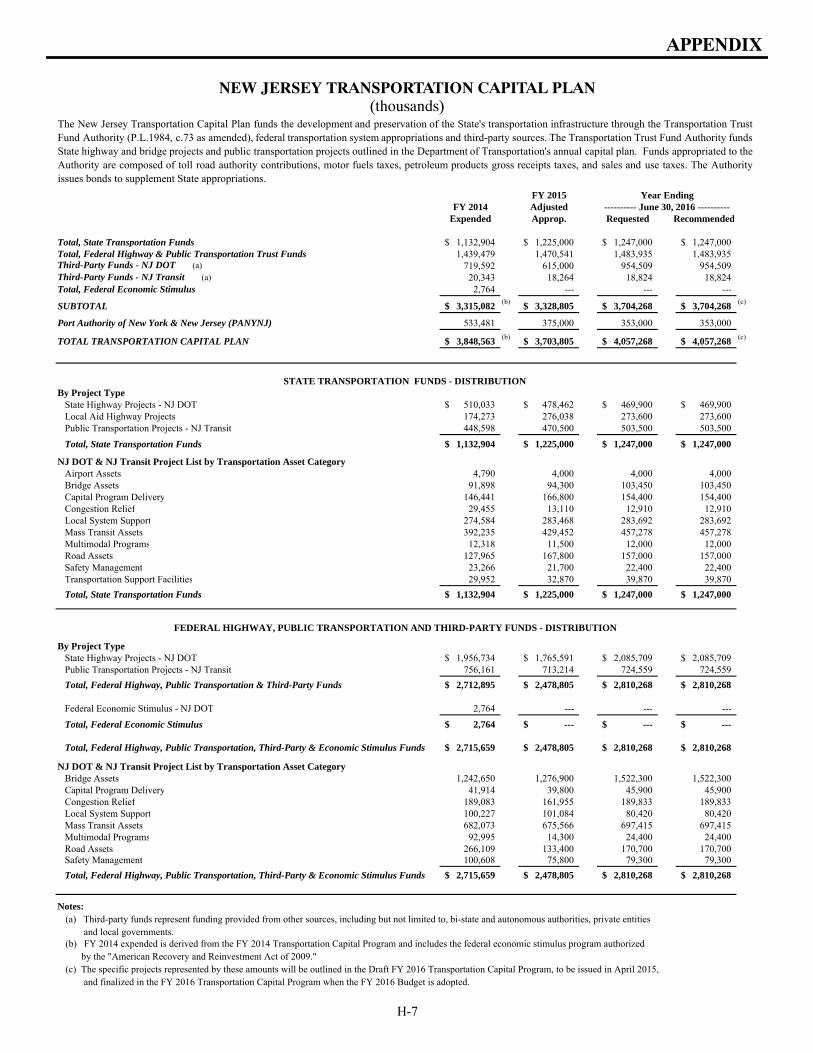
NEW JERSEY TRANSPORTATION CAPITAL PLAN(thousands)
FY 2015FY 2014 Adjusted
Expended Approp. Requested Recommended
Total, State Transportation Funds 1,132,904$ 1,225,000$ 1,247,000$ 1,247,000$ Total, Federal Highway & Public Transportation Trust Funds 1,439,479 1,470,541 1,483,935 1,483,935 Third-Party Funds - NJ DOT (a) 719,592 615,000 954,509 954,509 Third-Party Funds - NJ Transit (a) 20,343 18,264 18,824 18,824 Total, Federal Economic Stimulus 2,764 --- --- ---
SUBTOTAL 3,315,082$ (b) 3,328,805$ 3,704,268$ 3,704,268$ (c)
Port Authority of New York & New Jersey (PANYNJ) 533,481 375,000 353,000 353,000
TOTAL TRANSPORTATION CAPITAL PLAN 3,848,563$ (b) 3,703,805$ 4,057,268$ 4,057,268$ (c)
STATE TRANSPORTATION FUNDS - DISTRIBUTION
By Project Type State Highway Projects - NJ DOT 510,033$ 478,462$ 469,900$ 469,900$ Local Aid Highway Projects 174,273 276,038 273,600 273,600 Public Transportation Projects - NJ Transit 448,598 470,500 503,500 503,500
Total, State Transportation Funds 1,132,904$ 1,225,000$ 1,247,000$ 1,247,000$
NJ DOT & NJ Transit Project List by Transportation Asset Category Airport Assets 4,790 4,000 4,000 4,000 Bridge Assets 91,898 94,300 103,450 103,450 Capital Program Delivery 146,441 166,800 154,400 154,400 Congestion Relief 29,455 13,110 12,910 12,910 Local System Support 274,584 283,468 283,692 283,692 Mass Transit Assets 392,235 429,452 457,278 457,278 Multimodal Programs 12,318 11,500 12,000 12,000 Road Assets 127,965 167,800 157,000 157,000 Safety Management 23,266 21,700 22,400 22,400 Transportation Support Facilities 29,952 32,870 39,870 39,870 Total, State Transportation Funds 1,132,904$ 1,225,000$ 1,247,000$ 1,247,000$
FEDERAL HIGHWAY, PUBLIC TRANSPORTATION AND THIRD-PARTY FUNDS - DISTRIBUTION
By Project Type State Highway Projects - NJ DOT 1,956,734$ 1,765,591$ 2,085,709$ 2,085,709$ Public Transportation Projects - NJ Transit 756,161 713,214 724,559 724,559 Total, Federal Highway, Public Transportation & Third-Party Funds 2,712,895$ 2,478,805$ 2,810,268$ 2,810,268$
Federal Economic Stimulus - NJ DOT 2,764 --- --- ---
Total, Federal Economic Stimulus 2,764$ ---$ ---$ ---$
Total, Federal Highway, Public Transportation, Third-Party & Economic Stimulus Funds 2,715,659$ 2,478,805$ 2,810,268$ 2,810,268$
NJ DOT & NJ Transit Project List by Transportation Asset Category Bridge Assets 1,242,650 1,276,900 1,522,300 1,522,300 Capital Program Delivery 41,914 39,800 45,900 45,900 Congestion Relief 189,083 161,955 189,833 189,833 Local System Support 100,227 101,084 80,420 80,420 Mass Transit Assets 682,073 675,566 697,415 697,415 Multimodal Programs 92,995 14,300 24,400 24,400 Road Assets 266,109 133,400 170,700 170,700 Safety Management 100,608 75,800 79,300 79,300 Total, Federal Highway, Public Transportation, Third-Party & Economic Stimulus Funds 2,715,659$ 2,478,805$ 2,810,268$ 2,810,268$
Notes:
and local governments.
by the "American Recovery and Reinvestment Act of 2009."
and finalized in the FY 2016 Transportation Capital Program when the FY 2016 Budget is adopted.
The New Jersey Transportation Capital Plan funds the development and preservation of the State's transportation infrastructure through the Transportation TrustFund Authority (P.L.1984, c.73 as amended), federal transportation system appropriations and third-party sources. The Transportation Trust Fund Authority fundsState highway and bridge projects and public transportation projects outlined in the Department of Transportation's annual capital plan. Funds appropriated to theAuthority are composed of toll road authority contributions, motor fuels taxes, petroleum products gross receipts taxes, and sales and use taxes. The Authorityissues bonds to supplement State appropriations.
Year Ending---------- June 30, 2016 ----------
(b) FY 2014 expended is derived from the FY 2014 Transportation Capital Program and includes the federal economic stimulus program authorized
(c) The specific projects represented by these amounts will be outlined in the Draft FY 2016 Transportation Capital Program, to be issued in April 2015,
(a) Third-party funds represent funding provided from other sources, including but not limited to, bi-state and autonomous authorities, private entities
APPENDIX
H-8
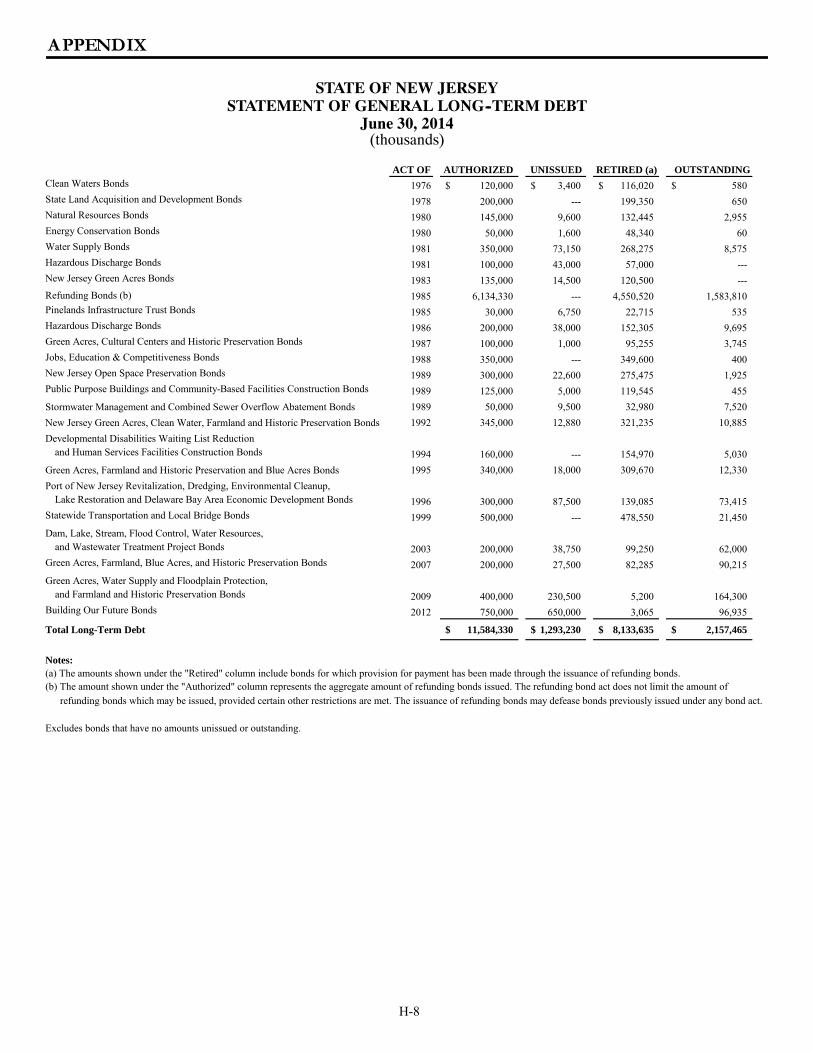
STATE OF NEW JERSEYSTATEMENT OF GENERAL LONG--TERM DEBT
June 30, 2014(thousands)
ACT OF AUTHORIZED UNISSUED RETIRED (a) OUTSTANDINGClean Waters Bonds 1976 120,000$ 3,400$ 116,020$ 580$ State Land Acquisition and Development Bonds 1978 200,000 --- 199,350 650 Natural Resources Bonds 1980 145,000 9,600 132,445 2,955 Energy Conservation Bonds 1980 50,000 1,600 48,340 60 Water Supply Bonds 1981 350,000 73,150 268,275 8,575 Hazardous Discharge Bonds 1981 100,000 43,000 57,000 --- New Jersey Green Acres Bonds 1983 135,000 14,500 120,500 --- Refunding Bonds (b) 1985 6,134,330 --- 4,550,520 1,583,810 Pinelands Infrastructure Trust Bonds 1985 30,000 6,750 22,715 535 Hazardous Discharge Bonds 1986 200,000 38,000 152,305 9,695 Green Acres, Cultural Centers and Historic Preservation Bonds 1987 100,000 1,000 95,255 3,745 Jobs, Education & Competitiveness Bonds 1988 350,000 --- 349,600 400 New Jersey Open Space Preservation Bonds 1989 300,000 22,600 275,475 1,925 Public Purpose Buildings and Community-Based Facilities Construction Bonds 1989 125,000 5,000 119,545 455 Stormwater Management and Combined Sewer Overflow Abatement Bonds 1989 50,000 9,500 32,980 7,520 New Jersey Green Acres, Clean Water, Farmland and Historic Preservation Bonds 1992 345,000 12,880 321,235 10,885 Developmental Disabilities Waiting List Reduction
and Human Services Facilities Construction Bonds 1994 160,000 --- 154,970 5,030 Green Acres, Farmland and Historic Preservation and Blue Acres Bonds 1995 340,000 18,000 309,670 12,330 Port of New Jersey Revitalization, Dredging, Environmental Cleanup,
Lake Restoration and Delaware Bay Area Economic Development Bonds 1996 300,000 87,500 139,085 73,415 Statewide Transportation and Local Bridge Bonds 1999 500,000 --- 478,550 21,450 Dam, Lake, Stream, Flood Control, Water Resources,
and Wastewater Treatment Project Bonds 2003 200,000 38,750 99,250 62,000 Green Acres, Farmland, Blue Acres, and Historic Preservation Bonds 2007 200,000 27,500 82,285 90,215 Green Acres, Water Supply and Floodplain Protection,
and Farmland and Historic Preservation Bonds 2009 400,000 230,500 5,200 164,300 Building Our Future Bonds 2012 750,000 650,000 3,065 96,935
Total Long-Term Debt 11,584,330$ 1,293,230$ 8,133,635$ 2,157,465$
Notes:
Excludes bonds that have no amounts unissued or outstanding.
refunding bonds which may be issued, provided certain other restrictions are met. The issuance of refunding bonds may defease bonds previously issued under any bond act.
(a) The amounts shown under the "Retired" column include bonds for which provision for payment has been made through the issuance of refunding bonds.(b) The amount shown under the "Authorized" column represents the aggregate amount of refunding bonds issued. The refunding bond act does not limit the amount of

APPENDIX
H-9
STATE APPROPRIATIONS LIMITATION ACT(CAP Law)
The State Appropriations Limitation Act (P.L.1990, c.94), commonly called the CAP Law, limits the growth of appropriations in the Direct State Services section of the budget, which encompasses the operations of State government. Exempt from the limitation are Grants-In-Aid; State Aid to counties, municipalities, local school districts and other instrumentalities; federal funds appropriations; Capital Construction; Debt Service; and monies deposited in and expended from the Property Tax Relief Fund, the Casino Control Fund, the Casino Revenue Fund and the Gubernatorial Elections Fund.
The State may exceed the maximum appropriations if a bill making an appropriation is agreed to by a two-thirds vote of all members of each legislative body.
Under the formula in the law, the maximum appropriation for fiscal year 2016 is computed by multiplying the base year appropriation (fiscal 2015) subject to the percentage limitation by the average three-year growth rate in per capita personal income calculated on a fiscal basis. The fiscal 2016 CAP is calculated using 2.49%.
The calculation results in a maximum increase of $156.5 million over the fiscal 2015 Adjusted Appropriation, or a maximum appropriation of $6.44 billion for Direct State Services for fiscal 2016. The Governor’s recommendation for fiscal 2016, for items under the CAP, is $6.215 billion, or $224.3 million under the CAP limit. Data used to compute the appropriation limit are presented in the accompanying tables.
STATE INCOME
(in millions)
Fiscal 2011 $459,363 Fiscal 2012 $478,760 Fiscal 2013 $493,390 Fiscal 2014 $499,405
Source: United States Department of Commerce, Bureau of Economic Analysis
STATE POPULATION
Fiscal 2011 8,836,639 Fiscal 2012 8,867,749 Fiscal 2013 8,899,339 Fiscal 2014 8,938,175
Source: United States Department of Commerce, Census Bureau
STATE PER CAPITA PERSONAL INCOME Personal Income
Percentage Change
Fiscal 2011 51,984 Fiscal 2012 53,989 3.86% Fiscal 2013 55,441 2.69% Fiscal 2014 55,873 0.78%
Three-Year Average 2.49%
Source: United States Department of Commerce,
Census Bureau

APPENDIX
H-10
COMPUTATION OF FISCAL 2016 CAPSUBJECT TO EXPENDITURE LIMITATION LAW PERCENTAGE
(thousands)
Adjusted Appropriations for Fiscal 2015 $ 32,825,924
Adjustment: Balances Available in the State Health Benefits Fund* 37,000
Less Statutory Exemptions: Grants-In-Aid (9,378,895) State Aid (1,121,021) Capital Construction (1,573,695) Debt Service (404,832) Property Tax Relief Fund (13,074,574) Casino Control Fund (60,408) Casino Revenue Fund (270,172) Gubernatorial Elections Fund --- Less: Defined Benefit Pension Contributions (216,020) Less: Funding In Accordance with Court Settlements (365,956) Less: Federal Funds Support of Employee Benefits (114,210)
Fiscal 2015 Base Subject to Percentage Limitation $ 6,283,141
Per Capita Personal Income Growth Rate 2.49%
Maximum Increase in Appropriation for Fiscal 2016 $ 156,450 Maximum Appropriation for Fiscal 2016 6,439,591
Fiscal 2016 Recommendation 7,106,522 Less: Defined Benefit Pension Contributions (426,232) Less: Funding In Accordance with Court Settlements (315,549) Less: Federal Funds Support of Employee Benefits (149,439)
Amount of Fiscal 2016 Appropriation Subject to the CAP Limitation $ 6,215,302
Amount Over/(Under) the CAP Limitation $ (224,289)
* For the purposes of the "State Appropriations Limitation Act," P.L.1990, c.94 (C.52:9H-24 et seq.), amounts representing balances deemed available in the State Health Benefits Fund shall be deemed a "Base Year Appropriation" in accordance with the Appropriations Act, P.L.2012, c.18.

APPENDIX
H-11
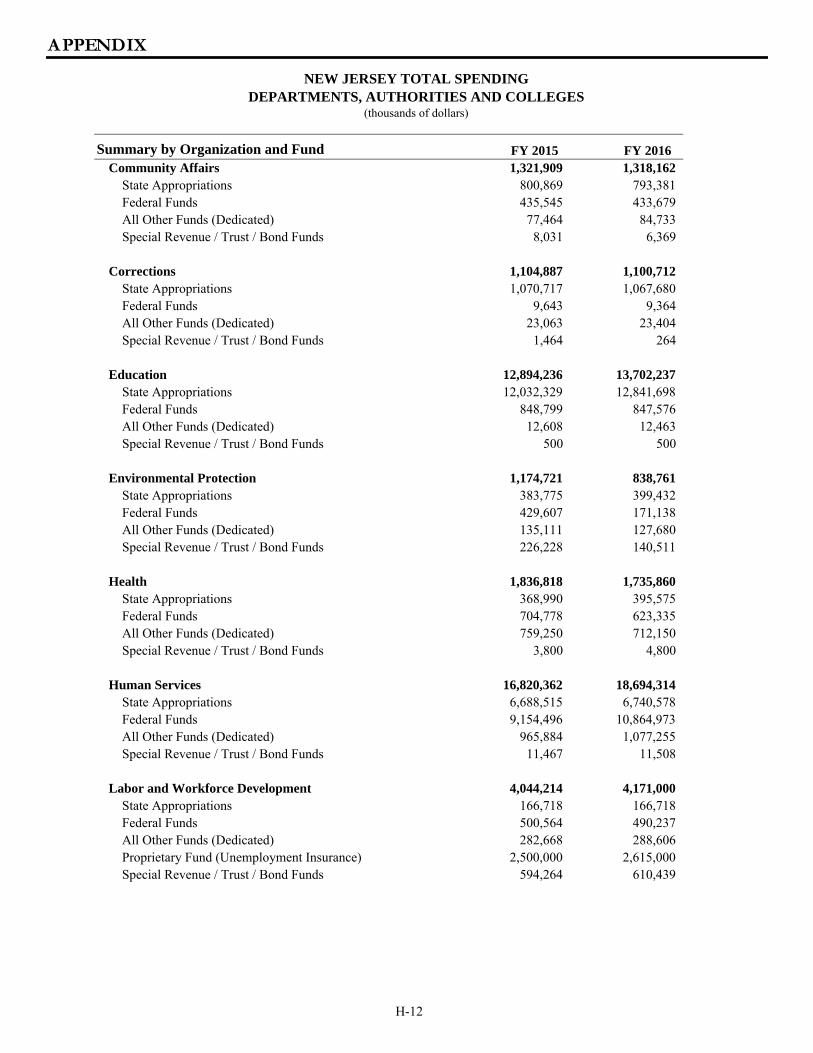
NEW JERSEY TOTAL SPENDINGDEPARTMENTS, AUTHORITIES AND COLLEGES
(thousands of dollars)
DataSummary by Fund FY 2015 FY 2016
State, Federal and DedicatedState Appropriations 32,825,924 33,843,771Federal Funds 13,512,742 14,939,640All Other Funds (Dedicated) 4,968,551 5,031,623Transportation Trust Fund 2,000,591 2,025,200
Special Revenue / Trust / Bonds / Proprietary FundsSpecial Revenue / Trust / Bond Funds 2,011,474 2,087,418Proprietary Fund (Unemployment Insurance) 2,500,000 2,615,000Proprietary Fund (Lottery) 1,975,299 2,091,689
Independent Authorities, Colleges and Universities 10,944,730 10,957,197
Grand Total 70,739,312 73,591,538
Data
Summary by Organization and Fund FY 2015 FY 2016Legislature 78,864 77,136
State Appropriations 78,864 77,136
Chief Executive 7,497 7,497State Appropriations 6,722 6,722All Other Funds (Dedicated) 775 775
Agriculture 547,319 599,094State Appropriations 19,749 19,742Federal Funds 468,655 512,907All Other Funds (Dedicated) 9,830 9,891Special Revenue / Trust / Bond Funds 49,085 56,554
Banking and Insurance 64,783 65,423State Appropriations 64,013 64,013Federal Funds 295 885All Other Funds (Dedicated) 440 490Special Revenue / Trust / Bond Funds 35 35
Children and Families 1,687,262 1,694,955State Appropriations 1,110,337 1,100,470Federal Funds 524,901 542,209All Other Funds (Dedicated) 52,024 52,276
The following financial data is provided in accordance with the provisions of Executive Order 8, signed by GovernorChristie on January 20, 2010. It reflects amounts, by fund source, that are represented in the fiscal 2016 Governor'sbudget. Separately, it also includes revenues that are uniquely available to State authorities and colleges and universitiesfor which the State is financially accountable. The bottom line of this report shows the full value of services provided byState government and its associated entities.
APPENDIX
H-12
NEW JERSEY TOTAL SPENDINGDEPARTMENTS, AUTHORITIES AND COLLEGES
(thousands of dollars)Data
Summary by Organization and Fund FY 2015 FY 2016Community Affairs 1,321,909 1,318,162
State Appropriations 800,869 793,381Federal Funds 435,545 433,679All Other Funds (Dedicated) 77,464 84,733Special Revenue / Trust / Bond Funds 8,031 6,369
Corrections 1,104,887 1,100,712State Appropriations 1,070,717 1,067,680Federal Funds 9,643 9,364All Other Funds (Dedicated) 23,063 23,404Special Revenue / Trust / Bond Funds 1,464 264
Education 12,894,236 13,702,237State Appropriations 12,032,329 12,841,698Federal Funds 848,799 847,576All Other Funds (Dedicated) 12,608 12,463Special Revenue / Trust / Bond Funds 500 500
Environmental Protection 1,174,721 838,761State Appropriations 383,775 399,432Federal Funds 429,607 171,138All Other Funds (Dedicated) 135,111 127,680Special Revenue / Trust / Bond Funds 226,228 140,511
Health 1,836,818 1,735,860State Appropriations 368,990 395,575Federal Funds 704,778 623,335All Other Funds (Dedicated) 759,250 712,150Special Revenue / Trust / Bond Funds 3,800 4,800
Human Services 16,820,362 18,694,314State Appropriations 6,688,515 6,740,578Federal Funds 9,154,496 10,864,973All Other Funds (Dedicated) 965,884 1,077,255Special Revenue / Trust / Bond Funds 11,467 11,508
Labor and Workforce Development 4,044,214 4,171,000State Appropriations 166,718 166,718Federal Funds 500,564 490,237All Other Funds (Dedicated) 282,668 288,606Proprietary Fund (Unemployment Insurance) 2,500,000 2,615,000Special Revenue / Trust / Bond Funds 594,264 610,439
APPENDIX
H-13
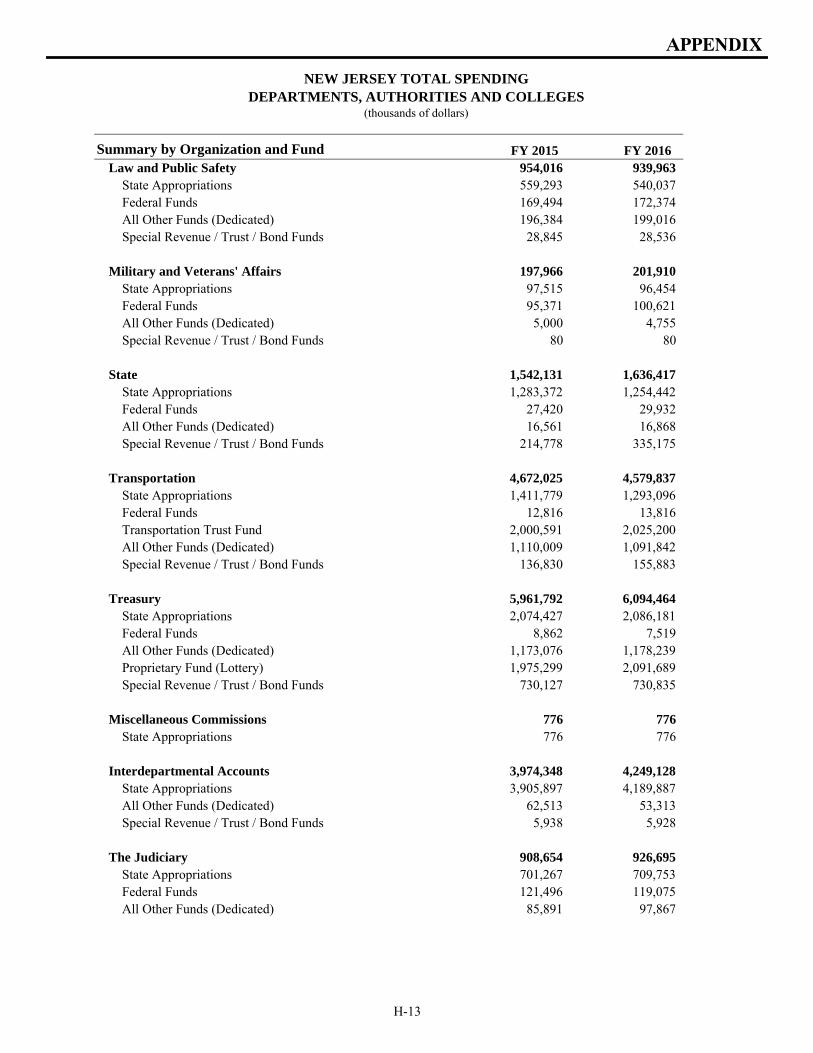
NEW JERSEY TOTAL SPENDINGDEPARTMENTS, AUTHORITIES AND COLLEGES
(thousands of dollars)Data
Summary by Organization and Fund FY 2015 FY 2016Law and Public Safety 954,016 939,963
State Appropriations 559,293 540,037Federal Funds 169,494 172,374All Other Funds (Dedicated) 196,384 199,016Special Revenue / Trust / Bond Funds 28,845 28,536
Military and Veterans' Affairs 197,966 201,910State Appropriations 97,515 96,454Federal Funds 95,371 100,621All Other Funds (Dedicated) 5,000 4,755Special Revenue / Trust / Bond Funds 80 80
State 1,542,131 1,636,417State Appropriations 1,283,372 1,254,442Federal Funds 27,420 29,932All Other Funds (Dedicated) 16,561 16,868Special Revenue / Trust / Bond Funds 214,778 335,175
Transportation 4,672,025 4,579,837State Appropriations 1,411,779 1,293,096Federal Funds 12,816 13,816Transportation Trust Fund 2,000,591 2,025,200All Other Funds (Dedicated) 1,110,009 1,091,842Special Revenue / Trust / Bond Funds 136,830 155,883
Treasury 5,961,792 6,094,464State Appropriations 2,074,427 2,086,181Federal Funds 8,862 7,519All Other Funds (Dedicated) 1,173,076 1,178,239Proprietary Fund (Lottery) 1,975,299 2,091,689Special Revenue / Trust / Bond Funds 730,127 730,835
Miscellaneous Commissions 776 776State Appropriations 776 776
Interdepartmental Accounts 3,974,348 4,249,128State Appropriations 3,905,897 4,189,887All Other Funds (Dedicated) 62,513 53,313Special Revenue / Trust / Bond Funds 5,938 5,928
The Judiciary 908,654 926,695State Appropriations 701,267 709,753Federal Funds 121,496 119,075All Other Funds (Dedicated) 85,891 97,867

APPENDIX
H-14
NEW JERSEY TOTAL SPENDINGDEPARTMENTS, AUTHORITIES AND COLLEGES
(thousands of dollars)Data
Summary by Organization and Fund FY 2015 FY 2016Independent Authorities (a) 6,741,569 6,750,290
Higher Education Student Assistance Authority 2,041,818 2,141,114New Jersey Transit Corporation 1,780,043 1,826,411New Jersey Turnpike Authority (b) 1,553,155 1,597,686University Hospital 466,662 466,239New Jersey Housing and Mortgage Finance Agency 340,165 250,766Casino Reinvestment Development Authority (b) 159,787 120,882South Jersey Transportation Authority (b) 113,263 114,392Economic Development Authority (b) 121,880 99,295New Jersey Sports and Exposition Authority (b)(c) 93,947 63,060New Jersey Water Supply Authority 27,053 27,684South Jersey Port Corporation (b) 24,600 25,088New Jersey Environmental Infrastructure Trust 8,300 8,300New Jersey Health Care Facilities Financing Authority (b) 5,895 3,930New Jersey Educational Facilities Authority 3,584 3,405New Jersey Redevelopment Authority (b) 1,417 2,038
Colleges and Universities (a) 4,203,161 4,206,907Rutgers, The State University 1,844,681 1,844,681Rowan University 348,902 348,902New Jersey Institute of Technology 320,649 320,469Montclair State University 311,278 316,817Rutgers, The State University - Newark 259,754 259,754The College of New Jersey 178,404 176,292Kean University 161,774 161,774William Paterson University of New Jersey 150,336 150,449Stockton University 149,905 149,905Rutgers, The State University - Camden 144,139 144,139Ramapo College of New Jersey 104,716 105,102New Jersey City University 103,991 103,991Thomas Edison State College 66,282 66,282New Jersey Agricultural Experiment Station 58,350 58,350
Grand Total 70,739,312 73,591,538
Notes:
(a) Revenues do not include State appropriations or bond proceeds.(b) Authority operates on a calendar year budget. In these instances, FY 2015 represents calendar-year ending 12/31/2014,
and FY 2016 represents calendar-year ending 12/31/2015.(c) Pursuant to P.L.2015, c.19, the New Jersey Meadowlands Commission was dissolved, and the New Jersey
Sports and Exposition Authority absorbed the powers and assets of the New Jersey Meadowlands Commission.
APPENDIX
H-15
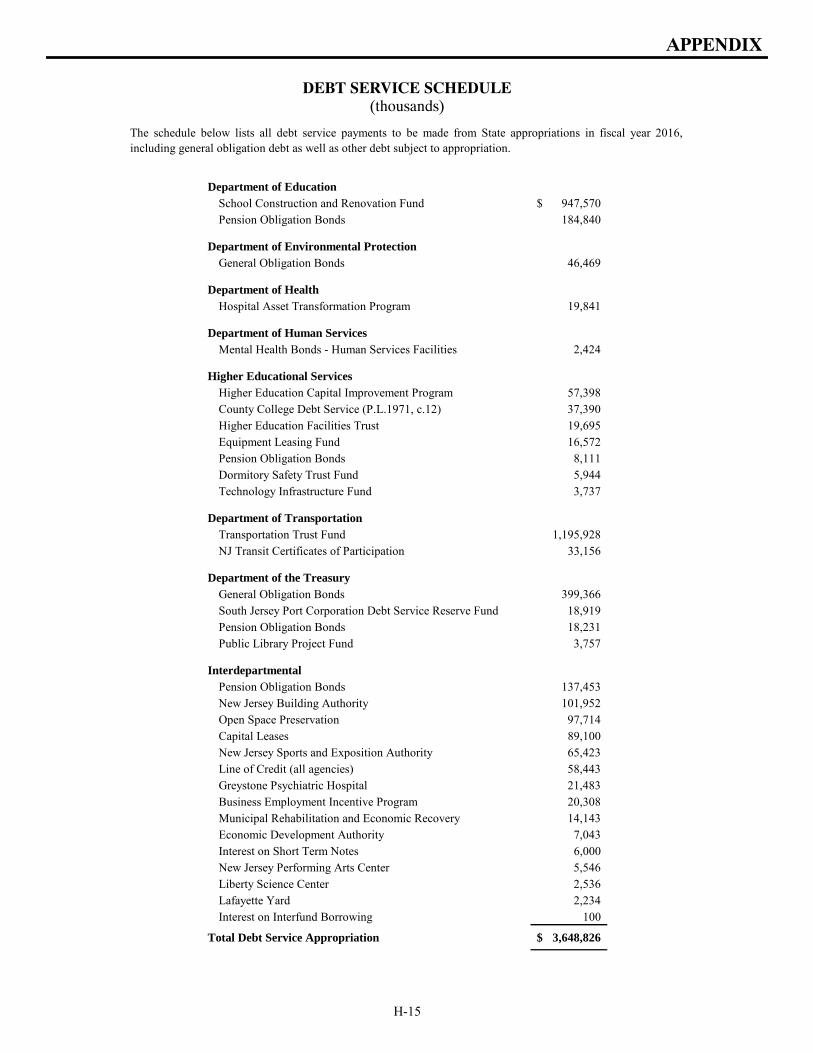
DEBT SERVICE SCHEDULE(thousands)
Department of EducationSchool Construction and Renovation Fund 947,570$ Pension Obligation Bonds 184,840
Department of Environmental ProtectionGeneral Obligation Bonds 46,469
Department of Health Hospital Asset Transformation Program 19,841
Department of Human Services Mental Health Bonds - Human Services Facilities 2,424
Higher Educational ServicesHigher Education Capital Improvement Program 57,398 County College Debt Service (P.L.1971, c.12) 37,390 Higher Education Facilities Trust 19,695 Equipment Leasing Fund 16,572 Pension Obligation Bonds 8,111 Dormitory Safety Trust Fund 5,944 Technology Infrastructure Fund 3,737
Department of TransportationTransportation Trust Fund 1,195,928 NJ Transit Certificates of Participation 33,156
Department of the TreasuryGeneral Obligation Bonds 399,366 South Jersey Port Corporation Debt Service Reserve Fund 18,919 Pension Obligation Bonds 18,231 Public Library Project Fund 3,757
InterdepartmentalPension Obligation Bonds 137,453 New Jersey Building Authority 101,952 Open Space Preservation 97,714 Capital Leases 89,100 New Jersey Sports and Exposition Authority 65,423 Line of Credit (all agencies) 58,443 Greystone Psychiatric Hospital 21,483 Business Employment Incentive Program 20,308 Municipal Rehabilitation and Economic Recovery 14,143 Economic Development Authority 7,043 Interest on Short Term Notes 6,000 New Jersey Performing Arts Center 5,546 Liberty Science Center 2,536 Lafayette Yard 2,234 Interest on Interfund Borrowing 100
Total Debt Service Appropriation 3,648,826$
The schedule below lists all debt service payments to be made from State appropriations in fiscal year 2016,including general obligation debt as well as other debt subject to appropriation.

APPENDIX
H-16
HEALTH CARE SUBSIDY FUND(thousands)
Actual Actual Revised Budget
FY 2013 FY 2014 FY 2015 FY 2016
FUND BALANCE JULY 1 687$ 135$ 10,036$ 17,000$
REVENUES
Provider TaxesHMO Premiums Assessment 151,827 144,790 170,000 195,000 .53% Hospital Assessment 101,576 106,264 109,332 113,138 Ambulatory Care Facility Assessment 54,213 55,873 56,439 58,132 Cosmetic Medical Procedures Tax (a) 7,745 4,128 239 ---
Other Revenue SourcesCigarette Tax 396,500 396,500 396,500 396,500 NJ MMRA Fund Transfer (b) 6,000 - 3,500 - Alcohol Excise Tax 22,000 22,000 22,000 22,000 Investment Earnings 47 31 200 200
TOTAL REVENUES 739,908$ 729,586$ 758,210$ 784,970$
TOTAL RESOURCES 740,595$ 729,722$ 768,246$ 801,970$
EXPENDITURES
Charity Care 538,475 541,402 550,000 502,000 Children's Health Insurance Program (CHIP) 115,759 118,797 131,326 68,081 Federally Qualified Health Centers 48,052 39,326 31,500 32,300 Health Care Stabilization Fund 15,000 --- --- --- Hospital Mental Health Offset Payments 12,087 12,106 12,327 12,327 Hospital Health Care Subsidy Payments 30,323 --- --- --- Delivery System Reform Incentive Payments --- 30,602 28,835 28,835 NJ FamilyCare --- --- --- 175,772
TOTAL EXPENDITURES 759,695$ 742,233$ 753,988$ 819,315$
General Fund Support (19,235) (22,547) (2,742) (19,345)
NET EXPENDITURES 740,460$ 719,686$ 751,246$ 799,970$
Projected Surplus/Deficit 135$ 10,036$ 17,000$ 2,000$
Federal Funds Appropriated to Programs Above
Charity Care 136,525 133,598 100,000 --- Health Care Stabilization Fund 15,000 --- --- --- Children's Health Insurance Program (CHIP) 205,060 207,944 246,773 341,412 Hospital Mental Health Offset Payments 12,087 12,106 12,327 12,237 Hospital Health Care Subsidy Payments (c) 73,632 --- --- --- Delivery System Reform Incentive Payments (c) --- 73,353 75,120 75,120
Notes:(a) The tax rate on cosmetic surgery procedures was lowered from 6% to 4% in FY13 and 2% in FY14.
The tax is eliminated in FY15 and beyond.
(b) In fiscal year 2013, the Property-Liability Insurance Guaranty Association (PLIGA) was deactivated. The New JerseyMedical Malpractice Reinsurance Association (NJMMRA) donated the remaining PLIGA funds to support charity care.
(c) Total federal amounts include funding used to match General Fund appropriations not included on this chart.
APPENDIX
H-17
WORKFORCE
Full-time employees have been reduced by approximately 8,500 between the beginning of the Christie Administration and January 9, 2015. State funded positions will decline by another 428 during fiscal year 2016.
The Department of Children and Families funded growth of 79 (all fund sources) is required to meet increases in clients and caseload supervision requirements.
The Department of Education State funded increase of 31 is needed to support critical backfills to continue the Governor’s priority of Education Reform.
The Department of Environmental Protection’s State funded reduction of 110 positions is largely attributable to a shift of 307 previously State funded park positions to non-State Corporation Business Tax (CBT) resources and 166 previously CBT funded Water Resources and Public Cleanup program staff to State support. The growth in non-State funding also largely reflects this shift of positions.
The Department of Human Services reflects a reduction of 710 combined State and non-State funded positions, most notably due to the closure of the Woodbridge Developmental Center during fiscal 2015. The closure of the North Jersey and Woodbridge Developmental Centers was the result of the binding recommendation of the Task Force for the Closure of Developmental Centers and will result in increased community placements being made, which is consistent with the U.S. Supreme Court’s Olmstead decision. The closure of these facilities allowed the Christie Administration to dedicate $51.1 million of new
State and federal funding to provide home and community care in fiscal 2015 and fiscal 2016.
State funded growth of 120, net of attrition, within the Department of Law and Public Safety, is due to the graduation of the 155th and 156th State Trooper classes. In addition, the fiscal 2016 budget provides funding in support of the 157th class. After this class graduates during fiscal 2017, the expected Trooper level will be at its highest since 2011, and will be the seventh new class trained since 2010.
APPENDIX
H-18
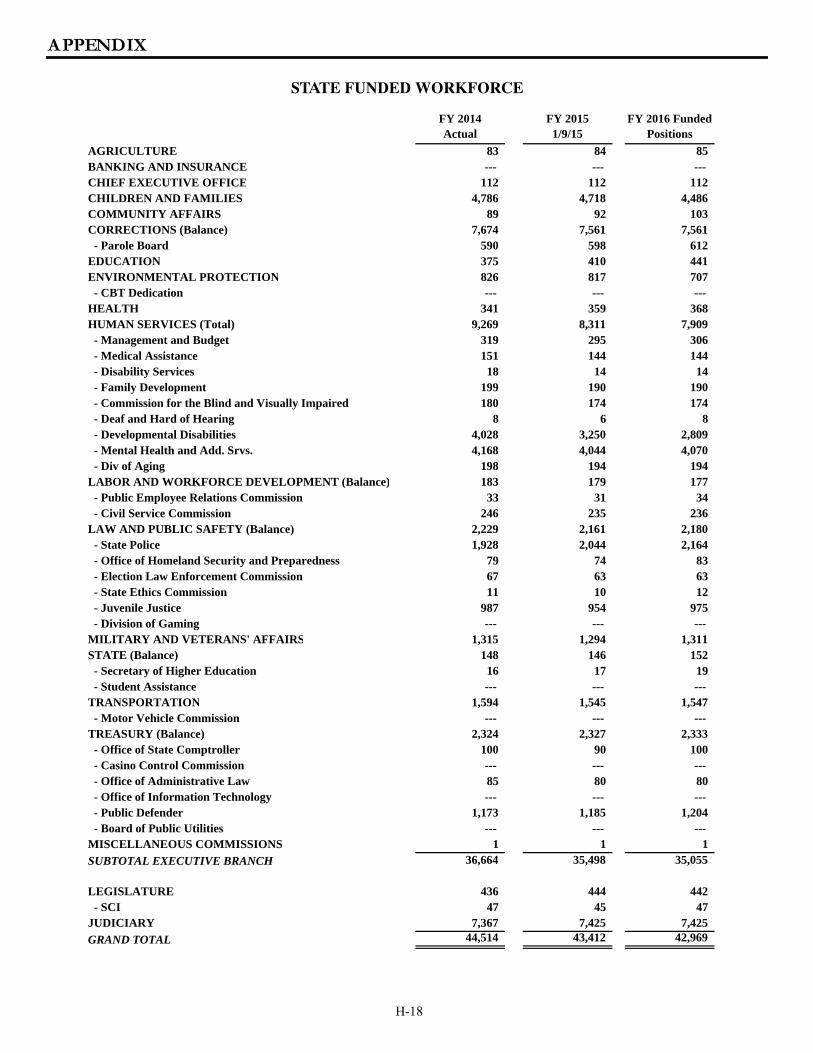
STATE FUNDED WORKFORCE
FY 2014Actual
FY 20151/9/15
FY 2016 Funded Positions
AGRICULTURE 83 84 85 BANKING AND INSURANCE --- --- --- CHIEF EXECUTIVE OFFICE 112 112 112 CHILDREN AND FAMILIES 4,786 4,718 4,486 COMMUNITY AFFAIRS 89 92 103 CORRECTIONS (Balance) 7,674 7,561 7,561 - Parole Board 590 598 612 EDUCATION 375 410 441 ENVIRONMENTAL PROTECTION 826 817 707 - CBT Dedication --- --- --- HEALTH 341 359 368 HUMAN SERVICES (Total) 9,269 8,311 7,909 - Management and Budget 319 295 306 - Medical Assistance 151 144 144 - Disability Services 18 14 14 - Family Development 199 190 190 - Commission for the Blind and Visually Impaired 180 174 174 - Deaf and Hard of Hearing 8 6 8 - Developmental Disabilities 4,028 3,250 2,809 - Mental Health and Add. Srvs. 4,168 4,044 4,070 - Div of Aging 198 194 194 LABOR AND WORKFORCE DEVELOPMENT (Balance) 183 179 177 - Public Employee Relations Commission 33 31 34 - Civil Service Commission 246 235 236 LAW AND PUBLIC SAFETY (Balance) 2,229 2,161 2,180 - State Police 1,928 2,044 2,164 - Office of Homeland Security and Preparedness 79 74 83 - Election Law Enforcement Commission 67 63 63 - State Ethics Commission 11 10 12 - Juvenile Justice 987 954 975 - Division of Gaming --- --- --- MILITARY AND VETERANS' AFFAIRS 1,315 1,294 1,311 STATE (Balance) 148 146 152 - Secretary of Higher Education 16 17 19 - Student Assistance --- --- --- TRANSPORTATION 1,594 1,545 1,547 - Motor Vehicle Commission --- --- --- TREASURY (Balance) 2,324 2,327 2,333 - Office of State Comptroller 100 90 100 - Casino Control Commission --- --- --- - Office of Administrative Law 85 80 80 - Office of Information Technology --- --- --- - Public Defender 1,173 1,185 1,204 - Board of Public Utilities --- --- --- MISCELLANEOUS COMMISSIONS 1 1 1
SUBTOTAL EXECUTIVE BRANCH 36,664 35,498 35,055
LEGISLATURE 436 444 442 - SCI 47 45 47 JUDICIARY 7,367 7,425 7,425
GRAND TOTAL 44,514 43,412 42,969
APPENDIX
H-19
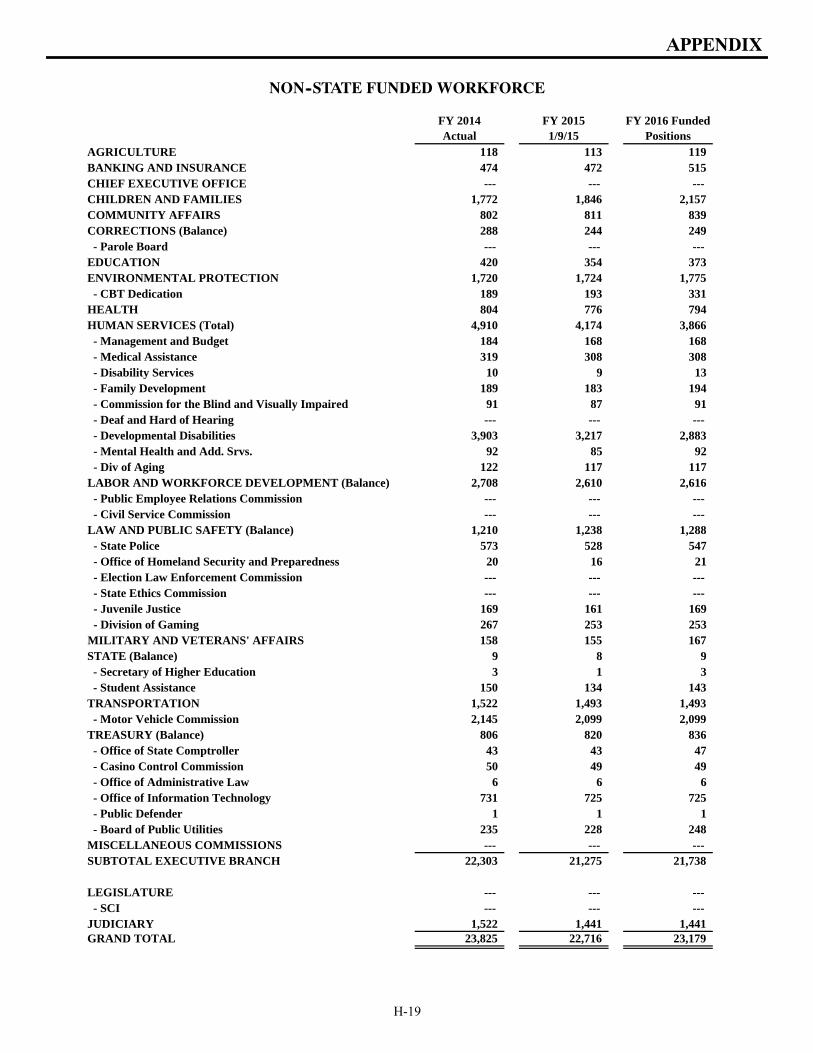
NON--STATE FUNDED WORKFORCE
FY 2014Actual
FY 20151/9/15
FY 2016 Funded Positions
AGRICULTURE 118 113 119 BANKING AND INSURANCE 474 472 515 CHIEF EXECUTIVE OFFICE --- --- --- CHILDREN AND FAMILIES 1,772 1,846 2,157 COMMUNITY AFFAIRS 802 811 839 CORRECTIONS (Balance) 288 244 249 - Parole Board --- --- --- EDUCATION 420 354 373 ENVIRONMENTAL PROTECTION 1,720 1,724 1,775 - CBT Dedication 189 193 331 HEALTH 804 776 794 HUMAN SERVICES (Total) 4,910 4,174 3,866 - Management and Budget 184 168 168 - Medical Assistance 319 308 308 - Disability Services 10 9 13 - Family Development 189 183 194 - Commission for the Blind and Visually Impaired 91 87 91 - Deaf and Hard of Hearing --- --- --- - Developmental Disabilities 3,903 3,217 2,883 - Mental Health and Add. Srvs. 92 85 92 - Div of Aging 122 117 117 LABOR AND WORKFORCE DEVELOPMENT (Balance) 2,708 2,610 2,616 - Public Employee Relations Commission --- --- --- - Civil Service Commission --- --- --- LAW AND PUBLIC SAFETY (Balance) 1,210 1,238 1,288 - State Police 573 528 547 - Office of Homeland Security and Preparedness 20 16 21 - Election Law Enforcement Commission --- --- --- - State Ethics Commission --- --- --- - Juvenile Justice 169 161 169 - Division of Gaming 267 253 253 MILITARY AND VETERANS' AFFAIRS 158 155 167 STATE (Balance) 9 8 9 - Secretary of Higher Education 3 1 3 - Student Assistance 150 134 143 TRANSPORTATION 1,522 1,493 1,493 - Motor Vehicle Commission 2,145 2,099 2,099 TREASURY (Balance) 806 820 836 - Office of State Comptroller 43 43 47 - Casino Control Commission 50 49 49 - Office of Administrative Law 6 6 6 - Office of Information Technology 731 725 725 - Public Defender 1 1 1 - Board of Public Utilities 235 228 248 MISCELLANEOUS COMMISSIONS --- --- --- SUBTOTAL EXECUTIVE BRANCH 22,303 21,275 21,738
LEGISLATURE --- --- --- - SCI --- --- --- JUDICIARY 1,522 1,441 1,441 GRAND TOTAL 23,825 22,716 23,179

APPENDIX
H-20
A supplementary display of Other Governmental Funds andProprietary Funds can be found online at the following address:
www.state.nj.us/treasury/omb/publications/16budget

APPENDIX
NOTES