appendices final report - theicct.org fuel... · aviation fuel efficiency technology assessment...
TRANSCRIPT

Appendices Final Report Aviation Fuel Efficiency Technology Assessment (AFETA) Study
Date: December 26, 2015
PREPARED FOR The International Council on Clean Transportation 1225 I Street NW Suite 900 Washington DC 20005
TECOLOTE RESEARCH, INC. CORPORATE HEADQUARTERS
420 S. Fairview Ave, Suite 201
Goleta, CA 93117
TECOLOTE RESEARCH, INC.
NASA OPERATIONS
2120 E Grand Avenue, Suite 200
El Segundo, CA 90245
DISTRIBUTION LIMITATION
This document was prepared for and submitted to the International Council on Clean Transportation (ICCT) under the Tecolote Research, Inc. (Tecolote) ICCT Contract. Further distribution of this document is subject to any distribution restrictions set forth in the Contract and consent of the ICCT Contracting Official.
AVIATION FUEL EFFICIENCY TECHNOLOGY ASSESSMENT—APPENDICES TECOLOTE RESEARCH
PG ii
Table of Contents
APPENDIX
APPENDIX A—Market Forecast Analysis Model
APPENDIX B—Candidate Technology Evaluation Datasheet
APPENDIX C—Candidate Technology Evaluation
APPENDIX D—Engine Technology Component Matrix
APPENDIX E—Subsystem Improvements
APPENDIX F—Maintenance Assessment of Technology Candidates
APPENDIX G—Piano 5 User Factor Parameters
APPENDIX H—Piano 5 User Factor By Configuration
APPENDIX I—Design Heritage Factors
APPENDIX J—Development Complexity Factors
APPENDIX K—Production Complexity Factors
APPENDIX L—Derivation of Composite Material Fraction for Reference Aircraft
APPENDIX M—Deployment Scenario Composite Material Fraction
APPENDIX N—Technology Maturation Cost Estimation Model
APPENDIX O—Cost Assessment Results
APPENDIX P—Sensitivity Analyses Results
AVIATION FUEL EFFICIENCY TECHNOLOGY ASSESSMENT —APPENDICES TECOLOTE RESEARCH
PG A-1
APPENDIX A—Market Forecast Analysis Model
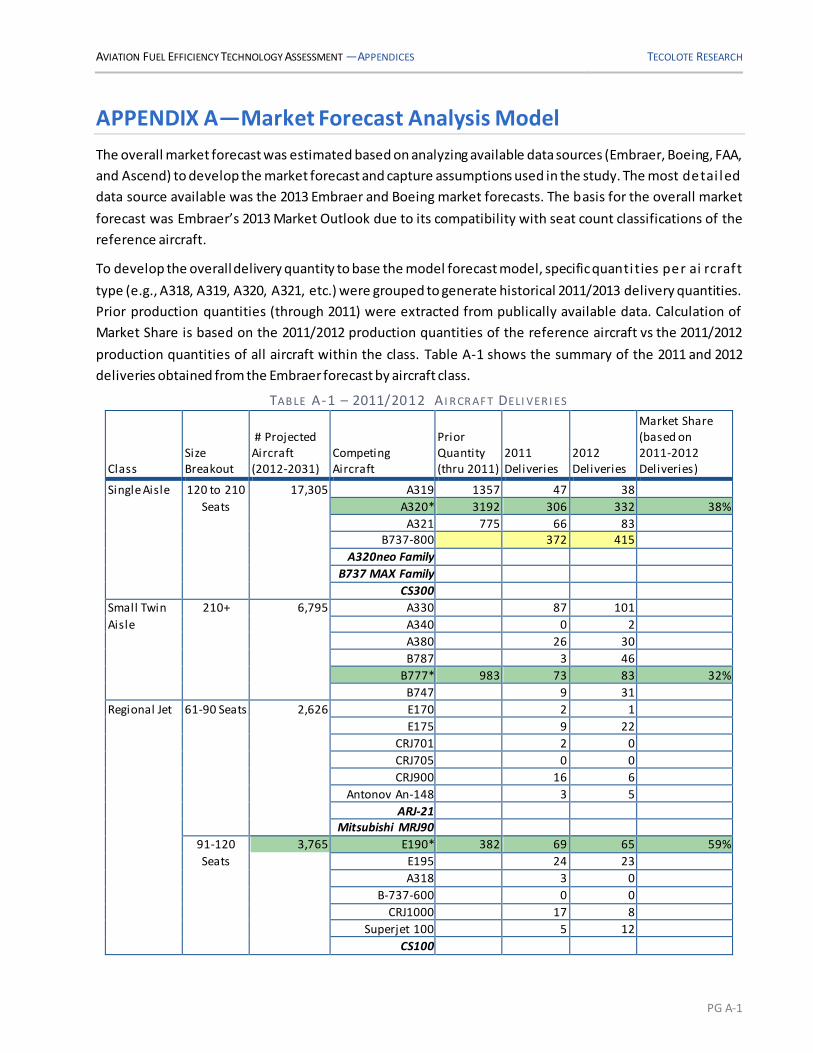
The overall market forecast was estimated based on analyzing available data sources (Embraer, Boeing, FAA,
and Ascend) to develop the market forecast and capture assumptions used in the study. The most detai led
data source available was the 2013 Embraer and Boeing market forecasts. The basis for the overall market
forecast was Embraer’s 2013 Market Outlook due to its compatibility with seat count classifications of the
reference aircraft.
To develop the overall delivery quantity to base the model forecast model, specific quanti ties per ai rcraft
type (e.g., A318, A319, A320, A321, etc.) were grouped to generate historical 2011/2013 delivery quantities.
Prior production quantities (through 2011) were extracted from publically available data. Calculation of
Market Share is based on the 2011/2012 production quantities of the reference aircraft vs the 2011/2012
production quantities of all aircraft within the class. Table A-1 shows the summary of the 2011 and 2012
deliveries obtained from the Embraer forecast by aircraft class.
TAB LE A-1 – 2011/2012 A I R CR AF T DELI VER I ES
Class Size Breakout
# Projected Aircraft (2012-2031)
Competing Aircraft
Prior Quantity (thru 2011)
2011 Deliveries
2012 Deliveries
Market Share (based on 2011-2012 Deliveries)
Single Aisle 120 to 210 17,305 A319 1357 47 38
Seats A320* 3192 306 332 38%
A321 775 66 83 B737-800 372 415
A320neo Family
B737 MAX Family
CS300
Small Twin 210+ 6,795 A330 87 101
Aisle A340 0 2
A380 26 30
B787 3 46
B777* 983 73 83 32%
B747 9 31
Regional Jet 61-90 Seats 2,626 E170 2 1
E175 9 22
CRJ701 2 0
CRJ705 0 0
CRJ900 16 6
Antonov An-148 3 5
ARJ-21 Mitsubishi MRJ90
91-120 3,765 E190* 382 69 65 59%
Seats E195 24 23
A318 3 0
B-737-600 0 0
CRJ1000 17 8
Superjet 100 5 12
CS100

AVIATION FUEL EFFICIENCY TECHNOLOGY ASSESSMENT —APPENDICES TECOLOTE RESEARCH
PG A-2
This data set identified fleet size in 2011, projected deliveries in 2012, and estimated fleet size in 2031. From
this data, fleet attrition rate was obtained from Embraer by vehicle class and the data was used to forecast
the average annual fleet growth required to obtain the 2031 fleet size. An annual forecast model was then
constructed from this data to estimate fleet size, annual attrition quantity, and estimated purchase quantity
by year. This was done by building a model that estimated replacement of the fleet due to attrition and then
assuming an initial purchase quantity in 2013 and applying a flat annual percent increase to achieve the
overall fleet size. This results in a market forecast that grows over the years from 2013 through 2031. These
resulting annual purchase buy quantities were used as the overall market forecast.
Table A-2 summarizes the 2011-2013 Embraer information the calculated and identified attrition, and the
underlying growth and attrition rates used develop the overall market forecast based on the attrition
methodology.
TAB LE A-2 – ATTR I TI ON METH OD (B AS ED ON EMB R AER MAR KET OUTLOOK)
SA STA RJ
2011 Fleet 10,215 3,180 1,435 2031 Fleet 18,900 7,085 4,020
2012-2031 New Aircraft 17,305 6,185 3,765
2034-2032 Attrition (Embraer) 8,620 2,280 1,180
2012-2032 Attrition (Calculated) 8,621 2,279 1,178
Calculated Fleet Growth Rate 3.124% 4.087% 5.286%
Assumed Fleet Attrition Rate 3.102% 2.385% 2.409%
Market share for modeled type 38% 32% 59%
The model assumptions of annual sales increase and attrition where then continued out to the year 2043 to
allow for calculation of three time periods: 1) time period before 2024 EIS (2013-2023); 2) ten-year
procurement period for the 2024 EIS (2024-2033); and ten-year procurement period for the 2034 EIS (2034-
2043). Tables A-3.1 through A-3.4 show the overall forecasted demand and fleet size by aircraft class over
the timeframe of the analysis. This table covers the timeframe from 2011 through 2043 and provides the
overall market demand for the aircraft class. The highlighted items in the below tables are those that are
used in the study to drive prior quantities and annual procurement demand for each aircraf t class. This used
with the assumed market capture is the basis for determining the single vendor forecasted buy quantity.
TAB LE A-3.1 – MAR KET TOTAL DEMAND (2011-2018)
MARKET TOTAL DEMAND
1 2 3 4 5 6 7
2011 2012 2013 2014 2015 2016 2017 2018
Single Aisle
Fleet Size 10,215 10,534 10,863 11,202 11,552 11,913 12,285 12,669 Fleet Attri tion
317 327 337 347 358 370 381
Tota l Demand (w/Attrition)
636 656 676 697 719 742 765
Tota l Buy Quantity
242 249 257 265 273 282 291
Cumulative Buy Quantity 3,192 3,434 3,683 3,940 4,205 4,478 4,760 5,051
Medium Small Twin Aisle
Fleet Size 3180 3310 3445 3586 3733 3886 4045 4210
Fleet Attri tion
76 79 82 86 89 93 96 Tota l Demand (w/Attrition)
206 214 223 233 242 252 261
Tota l Buy Quantity
66 68 71 75 77 81 84

AVIATION FUEL EFFICIENCY TECHNOLOGY ASSESSMENT —APPENDICES TECOLOTE RESEARCH
PG A-3
MARKET TOTAL DEMAND
1 2 3 4 5 6 7
2011 2012 2013 2014 2015 2016 2017 2018
Cumulative Buy Quantity 983 1,049 1,117 1,188 1,263 1,340 1,421 1,505
Regional Jet
Fleet Size 1,435 1511 1591 1675 1764 1857 1955 2058
Fleet Attri tion
35 36 38 40 42 45 47 Tota l Demand (w/Attrition)
111 116 122 129 135 143 150
Tota l Buy Quantity
65 68 72 76 80 84 89
Cumulative Buy Quantity 382 447 515 587 663 743 827 916
TAB LE A-3.2 – MAR KET TOTAL DEMAND (2019-2027)
MARKET TOTAL DEMAND 8 9 10 11 12 13 14 15 16
2019 2020 2021 2022 2023 2024 2025 2026 2027
Single Aisle
Fleet Size 13,065 13,473 13,894 14,328 14,776 15,238 15,714 16,205 16,711
Fleet Attri tion 393 405 418 431 444 458 473 487 503
Tota l Demand (w/Attrition) 789 813 839 865 892 920 949 978 1,009 Tota l Buy Quantity 300 309 319 329 339 350 361 372 383
Cumulative Buy Quantity 5,351 5,660 5,979 6,308 6,647 6,997 7,358 7,730 8,113 Medium Small Twin Aisle
Fleet Size 4382 4561 4747 4941 5143 5353 5572 5800 6037
Fleet Attri tion 100 104 109 113 118 123 128 133 138
Tota l Demand (w/Attrition) 272 283 295 307 320 333 347 361 375 Tota l Buy Quantity 87 91 94 98 102 107 111 116 120
Cumulative Buy Quantity 1,592 1,683 1,777 1,875 1,977 2,084 2,195 2,311 2,431 Regional Jet
Fleet Size 2167 2282 2403 2530 2664 2805 2953 3109 3273
Fleet Attri tion 50 52 55 58 61 64 68 71 75
Tota l Demand (w/Attrition) 159 167 176 185 195 205 216 227 239
Tota l Buy Quantity 94 99 104 109 115 121 127 134 141 Cumulative Buy Quantity 1,010 1,109 1,213 1,322 1,437 1,558 1,685 1,819 1,960
TAB LE A-3.3 – MAR KET TOTAL DEMAND (2028-2035)
MARKET TOTAL DEMAND
17 18 19 20 21 22 23 24
2028 2029 2030 2031 2032 2033 2034 2035
Single Aisle
Fleet Size 17,233 17,771 18,326 18,899 19,489 20,098 20,726 21,374 Fleet Attri tion 518 535 551 568 586 604 623 643
Tota l Demand (w/Attrition) 1,040 1,073 1,106 1,141 1,176 1,213 1,251 1,291
Tota l Buy Quantity 395 408 420 434 447 461 475 491 Cumulative Buy Quantity 8,508 8,916 9,336 9,770 10,217 10,678 11,153 11,644
Medium Small Twin Aisle
Fleet Size 6284 6541 6808 7086 7376 7677 7991 8318
Fleet Attri tion 144 150 156 162 169 176 183 191 Tota l Demand (w/Attrition) 391 407 423 440 459 477 497 518
Tota l Buy Quantity 125 130 135 141 147 153 159 166
Cumulative Buy Quantity 2,556 2,686 2,821 2,962 3,109 3,262 3,421 3,587
Regional Jet
Fleet Size 3446 3628 3820 4022 4235 4459 4695 4943 Fleet Attri tion 79 83 87 92 97 102 107 113
Tota l Demand (w/Attrition) 252 265 279 294 310 326 343 361
Tota l Buy Quantity 149 156 165 173 183 192 202 213 Cumulative Buy Quantity 2,109 2,265 2,430 2,603 2,786 2,978 3,180 3,393

AVIATION FUEL EFFICIENCY TECHNOLOGY ASSESSMENT —APPENDICES TECOLOTE RESEARCH
PG A-4
TAB LE A-3.4 – MAR KET TOTAL DEMAND (2036-2043)
MARKET TOTAL DEMAND 25 26 27 28 29 30 31 32
2036 2037 2038 2039 2040 2041 2042 2043
Single Aisle Fleet Size 22,042 22,731 23,441 24,173 24,928 25,707 26,510 27,338
Fleet Attri tion 663 684 705 727 750 773 797 822 Tota l Demand (w/Attrition) 1,331 1,373 1,415 1,459 1,505 1,552 1,600 1,650
Tota l Buy Quantity 506 522 538 554 572 590 608 627
Cumulative Buy Quantity 12,150 12,672 13,210 13,764 14,336 14,926 15,534 16,161 Medium Small Twin Aisle
Fleet Size 8658 9012 9380 9763 10162 10577 11009 11459 Fleet Attri tion 198 206 215 224 233 242 252 263
Tota l Demand (w/Attrition) 538 560 583 607 632 657 684 713
Tota l Buy Quantity 172 179 187 194 202 210 219 228 Cumulative Buy Quantity 3,759 3,938 4,125 4,319 4,521 4,731 4,950 5,178
Regional Jet
Fleet Size 5204 5479 5769 6074 6395 6733 7089 7464
Fleet Attri tion 119 125 132 139 146 154 162 171 Tota l Demand (w/Attrition) 380 400 422 444 467 492 518 546
Tota l Buy Quantity 224 236 249 262 276 290 306 322 Cumulative Buy Quantity 3,617 3,853 4,102 4,364 4,640 4,930 5,236 5,558
A recent data from ASCEND showing 2014 deliveries was made available during the course of the study. This
data was obtained and reviewed to identify if any changes in the market forecast needed to be
implemented. Comparisons of the market forecast with ASCEND 2014 deliveries and out-years indicated
that the overall market forecast assumptions in this study were reasonable. Table A-4 displays the 2014
ASCEND delivery data by Aircraft.
TAB LE A-4 – AS CEND 2014 DELI VER Y COUNT
Count of Aircraft Manufacturer Row Labels Total
737 (NG) 470 700 11 800 386 900 70
BBJ 3 A319 34 100 33
ACJ 1 A3320 302 200 302 A321 150
200 150
Grand Total 956

AVIATION FUEL EFFICIENCY TECHNOLOGY ASSESSMENT —APPENDICES TECOLOTE RESEARCH
PG B-1
APPENDIX B—Candidate Technology Evaluation Datasheet
The following subsections provide a breakdown of each major section of the questionnaire used by the
SMEs for the technology evaluation.
Technology Summary Information 1. Title (common name)
2. Area of Impact: Propulsion, Aerodynamics, Structure, Operations
3. Brief Description
4. Baseline availability date for TRL 7
5. Baseline availability date in a production aircraft (TRL 9+)
6. Estimated performance % improvement for component
7. Estimated performance % improvement for aircraft
8. Source/references
9. ROM cost to develop and implement
10. Applicable Aircraft (SA/STA): Y/N
Technology Readiness Level (TRL) Progression 1. Current TRL: _______
2. Expected time (months) from Current TRL to TRL7: _______ ; +/- months for 75% confidence _______.
3. Expected time (months) from TRL7 to TRL9: _______ ; +/- months for 75% confidence _______.
Technology Maturation 1. What scope of work is needed to go from Current TRL to TRL6: ___________.
2. Est. Number and Types of Tests from Current TRL to TRL6: _________.
3. Est. level of effort* from Current TRL to TRL6: __________.
4. What scope of work is needed to go from TRL6 to TRL7: _________________.
5. Est. Number and Types of Tests from TRL6 to TRL7: ________.
6. Est. level of effort (labor hours) from TRL6 to TRL7 (if possible, separate effort levels by skill areas, e.g., engineering vs. manufacturing): ________.
7. What scope of work is needed to go from TRL7 to TRL9: _________________.
8. Est. level of effort from TRL7 to TRL9 (if possible, separate effort levels by skill areas, e.g., engineering vs. manufacturing): ______.
9. Est. Number and Types of Tests from TRL7 to TRL9: ______.
AVIATION FUEL EFFICIENCY TECHNOLOGY ASSESSMENT —APPENDICES TECOLOTE RESEARCH
PG B-2
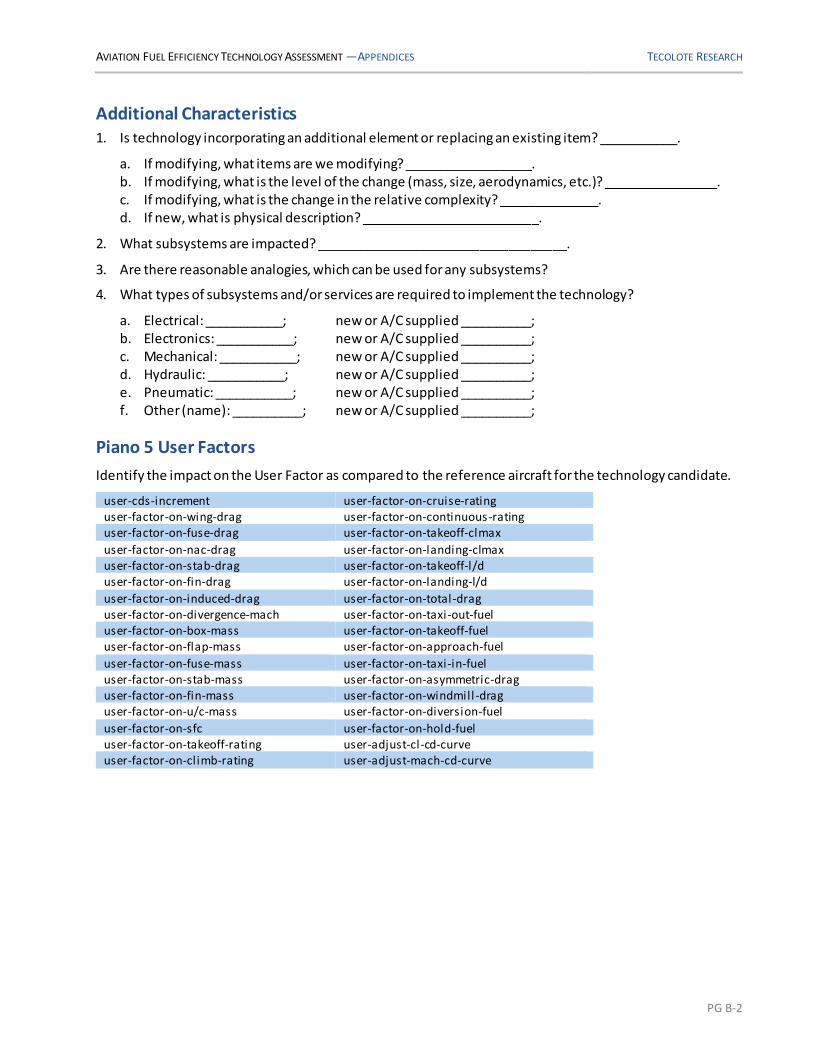
Additional Characteristics 1. Is technology incorporating an additional element or replacing an existing item? ___________.
a. If modifying, what items are we modifying? __________________. b. If modifying, what is the level of the change (mass, size, aerodynamics, etc.)? ________________. c. If modifying, what is the change in the relative complexity? ______________. d. If new, what is physical description? _________________________.
2. What subsystems are impacted? ___________________________________.
3. Are there reasonable analogies, which can be used for any subsystems?
4. What types of subsystems and/or services are required to implement the technology?
a. Electrical: ___________; new or A/C supplied __________; b. Electronics: ___________; new or A/C supplied __________; c. Mechanical: ___________; new or A/C supplied __________; d. Hydraulic: ___________; new or A/C supplied __________; e. Pneumatic: ___________; new or A/C supplied __________; f. Other (name): __________; new or A/C supplied __________;
Piano 5 User Factors
Identify the impact on the User Factor as compared to the reference aircraft for the technology candidate.
user-cds-increment user-factor-on-cruise-rating user-factor-on-wing-drag user-factor-on-continuous-rating user-factor-on-fuse-drag user-factor-on-takeoff-clmax
user-factor-on-nac-drag user-factor-on-landing-clmax user-factor-on-stab-drag user-factor-on-takeoff-l/d user-factor-on-fin-drag user-factor-on-landing-l/d
user-factor-on-induced-drag user-factor-on-total-drag user-factor-on-divergence-mach user-factor-on-taxi-out-fuel user-factor-on-box-mass user-factor-on-takeoff-fuel user-factor-on-flap-mass user-factor-on-approach-fuel
user-factor-on-fuse-mass user-factor-on-taxi-in-fuel user-factor-on-stab-mass user-factor-on-asymmetric-drag user-factor-on-fin-mass user-factor-on-windmill-drag user-factor-on-u/c-mass user-factor-on-diversion-fuel
user-factor-on-sfc user-factor-on-hold-fuel user-factor-on-takeoff-rating user-adjust-cl-cd-curve user-factor-on-climb-rating user-adjust-mach-cd-curve

AVIATION FUEL EFFICIENCY TECHNOLOGY ASSESSMENT —APPENDICES TECOLOTE RESEARCH
PG C-1
APPENDIX C—Candidate Technology Evaluation
The following details a summary of the list of candidate technologies assessed in the study . The data shows
by Technology Candidate a summary of the entry TRL level as of the time of the study, the forecasted
complete TRL by 2017 and the overall forecasted improvement for each Technology Deployment Scenario .
TAB LE C-1A – SA CAND I D ATE TECH NOLOG Y LI S T
Single Aisle 2024 2034
Technology Group Technology Code Starting
TRL
Est. TRL yr 2017
(Evol. Scenario) Evol. Mod. Aggr. Evol. Mod. Aggr.
Aerodynamic Efficiency (Viscous) % Improvement values are in drag component, 100% deployment
Natural laminar flow on nacelles AV-1 TRL 9 TRL 9 1% 1.25% 1.50% 1.25% 1.50% 1.50%
Hybrid laminar flow on empennage AV-2 TRL 4 TRL 6 2% 2% 2% 2% 2%
Natural laminar flow on wings AV-3 TRL 5 TRL 7 5% 5%
Hybrid laminar flow on wing AV-4 TRL 5 TRL 7 8%
Laminar flow coating/riblets AV-5 TRL 5 TRL 7 2% 2% 2%
Low friction paint coating AV-6 TRL 5 TRL 7 2% 2% 2%
Aerodynamic Efficiency (Non-viscous)
Improved aero/transonic design ANV-1 TRL 6 TRL 7 2% 2% 3% 2% 3% 4%
Wingtip technologies (for fixed span) ANV-2 TRL 9 TRL 9 1% 2% 2% 2% 2% 3%
Variable camber with existing control
ANV-3 TRL 6 TRL 7 1% 1% 1% 1% 1% 1%
Adaptive compliant trailing edge ANV-4 TRL 5 TRL 6 1.50% 2% 1.50% 2% 2%
Active stability control (reduced static)
ANV-5 TRL 4 TRL 6 1% 1% 1% 1% 1%
Reduction of loads
(active smart wing) ANV-6 TRL 4 TRL 5 1.5% 1.5% 2% 1.5% 2% 3%
Increased wing span ANV-7 TRL 7 TRL 7 3% 3% 3% 3% 3% 3%
Structures, Materials and Manufacturing
1. All composite aircraft S-0 TRL 8 TRL 9 10% 10% 10% 10% 10%
1A. All composite fuselage S-1 TRL 9 TRL 9 5% 5% 5% 5% 5% 5%
1B. All composite wing S-2 TRL 9 TRL 9 3% 3% 3% 3% 3% 3%
1C. All composite nacelle S-3 TRL 8 TRL 9 1% 1% 1% 1% 1% 1%
1D. All composite empennage S-4 TRL 9 TRL 9 1% 1% 1% 1% 1% 1%
2. Integrated structural health monitoring
S-5 TRL 8 TRL 9 1% 2% 1% 2% 3%
3. Advanced composite materials (higher strength, stiffness, toughness, damage tolerance, temperature)
S-6 TRL 5 TRL 9 2% 3% 2% 3% 4%
4. Advanced airframe metal alloy (2000, 7000 series A1 alloy, 3rd gen A1-Li, higher temp, Ti, etc.)
S-7 TRL 8 TRL 9 1% 1% 1% 1% 1% 1%
5. Advanced Manufacturing Technology
5A. Unitized construction (one piece fuselage barrel, wing box, skins, etc.)
S-8 TRL 8 TRL 9 3% 3% 4% 3% 4% 5%
5B. Out of autoclave curing composites
S-9 TRL 5 TRL 8 1% 1% 1% 1% 1%
5C. Automated tape laying, automated fiber placement
S-10 TRL 9 TRL 9 1% 1% 1% 1% 1% 1%
5D. Composite sandwich construction
S-11 TRL 8 TRL 9 2% 2% 2% 2% 2%
5E. Net shape components (forgings, castings, extrusions, RTM, RFI elimination of machining and fastening)
S-12 TRL 8 TRL 9 1% 1% 1% 1% 1% 1%

AVIATION FUEL EFFICIENCY TECHNOLOGY ASSESSMENT —APPENDICES TECOLOTE RESEARCH
PG C-2
Single Aisle 2024 2034
Technology Group Technology Code Starting
TRL
Est. TRL yr 2017
(Evol. Scenario) Evol. Mod. Aggr. Evol. Mod. Aggr.
5F. Additive manufacturing (for mass customization of cabin interior structures, depot repairs, etc.)
S-13 TRL 5 TRL 7 1% 1% 1% 1% 1%
5G. 3-D Preforms (aero elastically tailored, braided, woven, stitched)
S-14 3%
6. Bonded joints, innovations in structural joining
S-15 TRL 7 TRL 8 1% 1% 1% 1% 3%
7. Damage tolerance concepts (3-D woven composites, PRSEUS, crack arrestment features, stitching, z pinning, etc.)
S-16 TRL 7 TRL 8 2% 2% 2% 2% 3%
8. Adaptive and morphing structures (wings, control surfaces, etc.)
S-17 TRL 5 TRL 7 3%
9. Advanced metallic joining (Friction Stir Welding, Advanced Welding)
S-18 TRL 8 TRL 9 1% 1% 1% 1% 1% 1%
10. High temperature materials for Insulation, thermal protection
S-19 TRL 7 TRL 8 1% 1% 1% 1% 1%
11. High temperature ceramics and coatings for engine components
S-20 TRL 6 TRL 8 1% 1% 1%
12. Innovative load suppression, and vibration and aeromechanical stability control
S-21 TRL 6 TRL 7 1%
13. Multifunctional materials and structures (noise cancellation, embedded sensors, signal processing, actuators, antenna, lightning strike, etc.)
S-22 TRL 5 TRL 7 1%
Aircraft Systems More electric aircraft Sys-1 TRL 9 TRL 9 1% 1% 1% 1% 1% 1%
Electric landing-gear drive Sys-2 TRL 4 TRL 5 1% 1% 1% 1% 1%
TAB LE C-1B – STA CAND I D ATE TECH NOLOG Y LI S T
Small Twin Aisle 2024 2034
Technology Group Technology Code Current
TRL
Est. TRL
yr 2017 (Evol.
Scenario) Evol. Mod. Aggr. Evol. Mod. Aggr.
Aerodynamic Efficiency (Viscous) % Improvement values are in drag component, 100% deployment
Natural laminar flow on nacelles AV-1 TRL 9 TRL 9 0.25% 0.5% 1% 0.5% 1% 1%
Hybrid laminar flow on empennage AV-2 TRL 4 TRL 6 2% 2% 2% 2% 2%
Natural laminar flow on wings AV-3 TRL 5 TRL 7
Hybrid laminar flow on wing AV-4 TRL 5 TRL 7 10% 10% 10%
Laminar flow coating/riblets AV-5 TRL 5 TRL 7 2% 2% 2%
Low friction paint coating AV-6 TRL 5 TRL 7 2% 2% 2%
Aerodynamic Efficiency (Non-viscous)
Improved aero/transonic design ANV-1 TRL 6 TRL 7 2% 2% 3% 2% 3% 4%
Wingtip technologies (for fixed span) ANV-2 TRL 9 TRL 9 1% 2% 2% 2% 2% 3%
Variable camber with existing control
ANV-3 TRL 6 TRL 7 1% 1% 1% 1% 1% 1%
Adaptive compliant trailing edge ANV-4 TRL 5 TRL 6 1.5% 2% 1.5% 2% 2%
Active stability control (reduced static)
ANV-5 TRL 4 TRL 6 1% 1% 1% 1% 1%
Reduction of loads (active smart wing)
ANV-6 TRL 3 TRL 5 1.5% 2% 1.5% 2% 3%
Increased wing span ANV-7 TRL 7 TRL 7 8% 8% 8%

AVIATION FUEL EFFICIENCY TECHNOLOGY ASSESSMENT —APPENDICES TECOLOTE RESEARCH
PG C-3
Small Twin Aisle 2024 2034
Technology Group Technology Code Current
TRL
Est. TRL yr 2017
(Evol. Scenario) Evol. Mod. Aggr. Evol. Mod. Aggr.
Structures, Materials and Manufacturing
1. All composite aircraft S-0 TRL 8 TRL 9 10% 10% 10% 10% 10%
1A. All composite fuselage S-1 TRL 9 TRL 9 5% 5% 5% 5% 5% 5%
1B. All composite wing S-2 TRL 9 TRL 9 3% 3% 3% 3% 3% 3%
1C. All composite nacelle S-3 TRL 8 TRL 9 1% 1% 1% 1% 1% 1%
1D. All composite empennage S-4 TRL 9 TRL 9 1% 1% 1% 1% 1% 1%
2. Integrated Structural Health Monitoring
S-5 TRL 8 TRL 9 1% 2% 1% 2% 3%
3. Advanced composite materials (higher strength, stiffness, toughness, damage tolerance, temperature)
S-6 TRL 5 TRL 9 2% 3% 2% 3% 4%
4. Advanced airframe metal alloy (2000, 7000 series A1 alloy, 3rd gen A1-Li, higher temp, Ti, etc.)
S-7 TRL 8 TRL 9 1% 1% 1% 1% 1% 1%
5. Advanced Manufacturing Technology
5A. Unitized construction (one piece fuselage barrel, wing box, skins, etc.)
S-8 TRL 8 TRL 9 3% 3% 4% 3% 4% 5%
5B. Out of autoclave curing composites
S-9 TRL 5 TRL 8 1% 1% 1% 1% 3%
5C. Automated tape laying, automated fiber placement
S-10 TRL 9 TRL 9 1% 1% 1% 1% 1% 1%
5D. Composite sandwich construction
S-11 TRL 8 TRL 9 2% 2% 2% 2% 2%
5E. Net shape components (forgings, castings, extrusions, RTM, RFI elimination of machining and fastening)
S-12 TRL 8 TRL 9 1% 1% 1% 1% 1% 1%
5F. Additive manufacturing (for mass customization of cabin interior structures, depot repairs, etc.)
S-13 TRL 5 TRL 7 1% 1% 1% 1% 2%
5G. 3-D Preforms (aero elastically tailored, braided, woven, stitched)
S-14 3%
6. Bonded joints, innovations in structural joining
S-15 TRL 7 TRL 8 1% 1% 1% 1% 3%
7. Damage tolerance concepts (3-D woven composites, PRSEUS, crack arrestment features, stitching, z pinning, etc.)
S-16 TRL 7 TRL 8 2% 2% 2% 2% 3%
8. Adaptive and morphing structures (wings, control surfaces, etc.)
S-17 TRL 5 TRL 7 3%
9. Advanced metallic joining (Friction Stir Welding, Advanced Welding)
S-18 TRL 8 TRL 9 1% 1% 1% 1% 1% 1%
10. High temperature materials for Insulation, thermal protection
S-19 TRL 7 TRL 8 1% 1% 1% 1% 1%
11. High temperature ceramics and coatings for engine components
S-20 TRL 6 TRL 8 1% 1% 1%
12. Innovative load suppression, and vibration and aeromechanical stability control
S-21 TRL 6 TRL 7 1%
13. Multifunctional materials and structures (noise cancellation, embedded sensors, signal processing, actuators, antenna, lightning strike, etc.)
S-22 TRL 5 TRL 7 1%

AVIATION FUEL EFFICIENCY TECHNOLOGY ASSESSMENT —APPENDICES TECOLOTE RESEARCH
PG C-4
Small Twin Aisle 2024 2034
Technology Group Technology Code Current
TRL
Est. TRL yr 2017
(Evol. Scenario) Evol. Mod. Aggr. Evol. Mod. Aggr.
Aircraft Systems More electric aircraft Sys-1 TRL 9 TRL 9 1% 1% 1% 1% 1% 1%
Electric landing-gear drive Sys-2 TRL 3 TRL 5 1% 1% 1% 1% 1%
TAB LE C-1C – RJ CAND I D ATE TECH NOLOG Y LI S T
Regional Jet 2024 2034
Technology Group Technology Code Current
TRL
Est. TRL yr 2017
(Evol. Scenario) Evol. Mod. Aggr. Evol. Mod. Aggr.
Aerodynamic Efficiency (Viscous) % Improvement values are in drag component, 100% deployment
Natural laminar flow on nacelles AV-1 TRL 9 TRL 9 1% 1.3% 1.5% 1.3% 1.5% 1.5%
Hybrid laminar flow on empennage AV-2 TRL 4 TRL 6
Natural laminar flow on wings AV-3 TRL 5 TRL 7 5% 5% 8%
Hybrid laminar flow on wing AV-4 TRL 5 TRL 7
Laminar flow coating/riblets AV-5 TRL 5 TRL 7 2% 2% 2%
Low friction paint coating AV-6 TRL 5 TRL 7 2% 2% 2%
Aerodynamic Efficiency (Non-viscous)
Improved aero/transonic design ANV-1 TRL 6 TRL 7 2% 2% 3% 2% 3% 4%
Wingtip technologies (for fixed span) ANV-2 TRL 9 TRL 9 1% 2% 2% 2% 2% 3%
Variable camber with existing control
ANV-3 TRL 6 TRL 7
Adaptive compliant trailing edge ANV-4 TRL 5 TRL 6 1.5% 2% 1.5% 2% 2%
Active stability control (reduced static)
ANV-5 TRL 4 TRL 6
Reduction of loads (active smart wing)
ANV-6 TRL 3 TRL 5
Increased wing span ANV-7 TRL 7 TRL 7 1.5% 1.5% 1.5% 1.5 1.5% 1.5%
Structures, Materials and Manufacturing
1. All composite aircraft S-0 TRL 8 TRL 9 9.5% 9.5% 9.5% 9.5% 9.5%
1A. All composite fuselage S-1 TRL 9 TRL 9 4.8% 4.8% 4.8% 4.8% 4.8% 4.8%
1B. All composite wing S-2 TRL 9 TRL 9 2.9% 2.9% 2.9% 2.9% 2.9% 2.9%
1C. All composite nacelle S-3 TRL 8 TRL 9 1% 1% 1% 1% 1% 1%
1D. All composite empennage S-4 TRL 9 TRL 9 1% 1% 1% 1% 1% 1%
2. Integrated Structural Health Monitoring
S-5 TRL 8 TRL 9
3. Advanced composite materials (higher strength, stiffness,
toughness, damage tolerance, temperature)
S-6 TRL 5 TRL 9 1.9% 2.9% 1.9% 2.9% 3.8%
4. Advanced airframe metal alloy (2000, 7000 series A1 alloy, 3rd gen A1-Li, higher temp, Ti, etc.)
S-7 TRL 8 TRL 9 1% 1% 1% 1% 1% 1%
5. Advanced Manufacturing Technology
5A. Unitized construction (one piece fuselage barrel, wing box, skins, etc.)
S-8 TRL 8 TRL 9 2.9% 2.9% 3.8% 2.9% 3.8% 4.8%
5B. Out of autoclave curing composites
S-9 TRL 5 TRL 8 1% 1% 1% 1% 2.9%
5C. Automated tape laying, automated fiber placement
S-10 TRL 9 TRL 9 1% 1% 1% 1% 1% 1%
5D. Composite sandwich construction
S-11 TRL 8 TRL 9 1.9% 1.9% 1.9% 1.9% 1.9%
5E. Net shape components (forgings, castings, extrusions, RTM, RFI elimination of machining and fastening)
S-12 TRL 8 TRL 9 1% 1% 1% 1% 1% 1%

AVIATION FUEL EFFICIENCY TECHNOLOGY ASSESSMENT —APPENDICES TECOLOTE RESEARCH
PG C-5
Regional Jet 2024 2034
Technology Group Technology Code Current
TRL
Est. TRL yr 2017
(Evol. Scenario) Evol. Mod. Aggr. Evol. Mod. Aggr.
5F. Additive manufacturing (for mass customization of cabin interior structures, depot repairs, etc.)
S-13 TRL 5 TRL 7 1% 1% 1% 1% 1.9%
5G. 3-D Preforms (aero elastically tailored, braided, woven, stitched)
S-14 2.9%
6. Bonded joints, innovations in structural joining
S-15 TRL 7 TRL 8 1% 1% 1% 1% 2.9%
7. Damage tolerance concepts (3-D woven composites, PRSEUS, crack arrestment features, stitching, z pinning, etc.)
S-16 TRL 7 TRL 8 1.9% 1.9% 1.9% 1.9% 2.9%
8. Adaptive and morphing structures (wings, control surfaces, etc.)
S-17 TRL 5 TRL 7
9. Advanced metallic joining (Friction Stir Welding, Advanced Welding)
S-18 TRL 8 TRL 9 1% 1% 1% 1% 1% 1%
10. High temperature materials for Insulation, thermal protection
S-19 TRL 7 TRL 8 1% 1% 1% 1% 1%
11. High temperature ceramics and coatings for engine components
S-20 TRL 6 TRL 8 1% 1% 1%
12. Innovative load suppression, and vibration and aeromechanical stability control
S-21 TRL 6 TRL 7
13. Multifunctional materials and structures (noise cancellation, embedded sensors, signal processing, actuators, antenna, lightning strike, etc.)
S-22 TRL 5 TRL 7 1%
Aircraft Systems More electric aircraft Sys-1 TRL 9 TRL 9 1% 1% 1% 1% 1% 1%
Electric landing-gear drive Sys-2 TRL 3 TRL 5 0.5% 0.5% 0.5% 0.5% 0.5%
AVIATION FUEL EFFICIENCY TECHNOLOGY ASSESSMENT —APPENDICES TECOLOTE RESEARCH
PG D-1
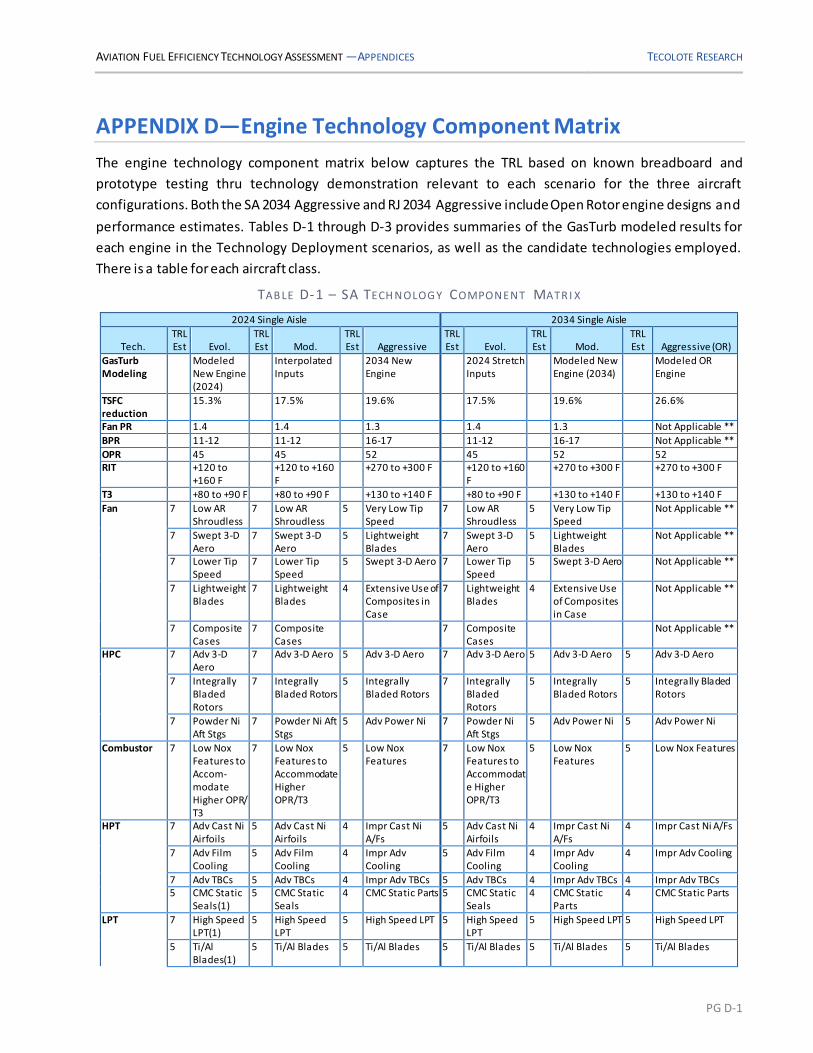
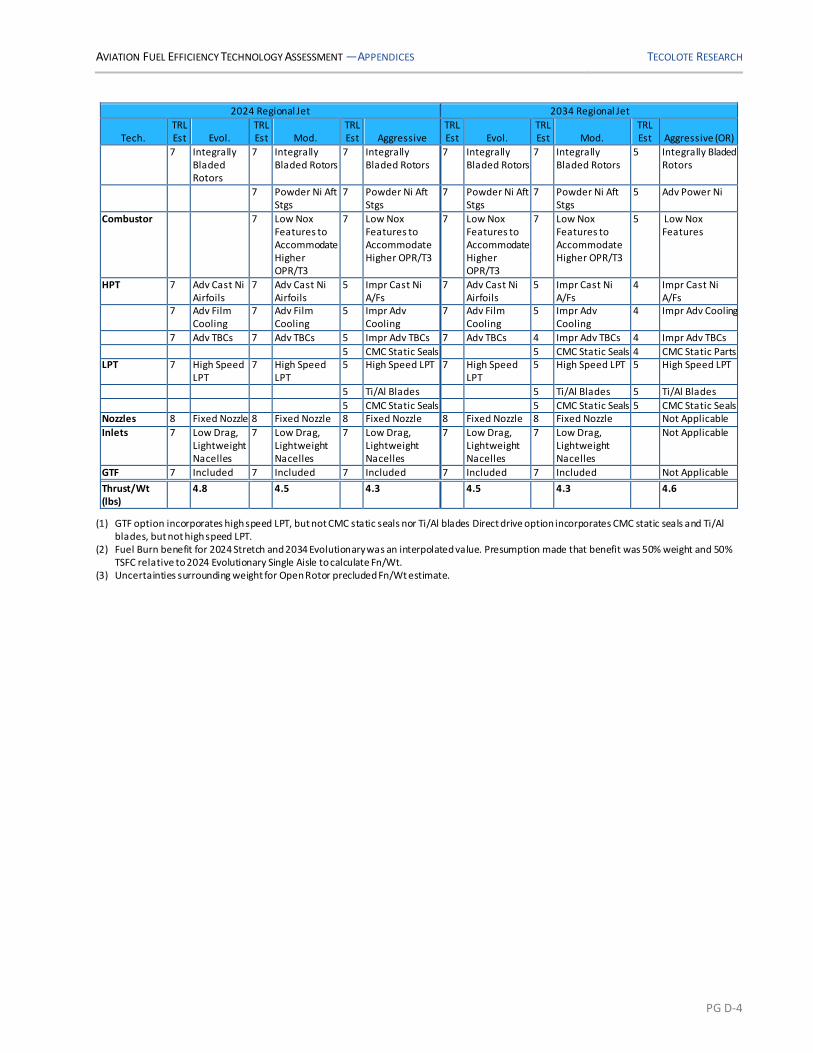
APPENDIX D—Engine Technology Component Matrix
The engine technology component matrix below captures the TRL based on known breadboard and
prototype testing thru technology demonstration relevant to each scenario for the three aircraft
configurations. Both the SA 2034 Aggressive and RJ 2034 Aggressive include Open Rotor engine designs and
performance estimates. Tables D-1 through D-3 provides summaries of the GasTurb modeled results for
each engine in the Technology Deployment scenarios, as well as the candidate technologies employed.
There is a table for each aircraft class.
TAB LE D-1 – SA TECH NOLOG Y COMPONENT MATR I X
2024 Single Aisle 2034 Single Aisle
Tech. TRL Est Evol.
TRL Est Mod.
TRL Est Aggressive
TRL Est Evol.
TRL Est Mod.
TRL Est Aggressive (OR)
GasTurb Modeling
Modeled New Engine (2024)
Interpolated Inputs
2034 New Engine
2024 Stretch Inputs
Modeled New Engine (2034)
Modeled OR Engine
TSFC reduction
15.3% 17.5% 19.6% 17.5% 19.6% 26.6%
Fan PR 1.4 1.4 1.3 1.4 1.3 Not Applicable **
BPR 11-12 11-12 16-17 11-12 16-17 Not Applicable **
OPR 45 45 52 45 52 52 RIT +120 to
+160 F +120 to +160
F +270 to +300 F +120 to +160
F +270 to +300 F +270 to +300 F
T3 +80 to +90 F +80 to +90 F +130 to +140 F +80 to +90 F +130 to +140 F +130 to +140 F
Fan 7 Low AR Shroudless
7 Low AR Shroudless
5 Very Low Tip Speed
7 Low AR Shroudless
5 Very Low Tip Speed
Not Applicable **
7 Swept 3-D Aero
7 Swept 3-D Aero
5 Lightweight Blades
7 Swept 3-D Aero
5 Lightweight Blades
Not Applicable **
7 Lower Tip Speed
7 Lower Tip Speed
5 Swept 3-D Aero 7 Lower Tip Speed
5 Swept 3-D Aero Not Applicable **
7 Lightweight Blades
7 Lightweight Blades
4 Extensive Use of Composites in Case
7 Lightweight Blades
4 Extensive Use of Composites in Case
Not Applicable **
7 Composite Cases
7 Composite Cases
7 Composite Cases
Not Applicable **
HPC 7 Adv 3-D Aero
7 Adv 3-D Aero 5 Adv 3-D Aero 7 Adv 3-D Aero 5 Adv 3-D Aero 5 Adv 3-D Aero
7 Integrally Bladed Rotors
7 Integrally Bladed Rotors
5 Integrally Bladed Rotors
7 Integrally Bladed Rotors
5 Integrally Bladed Rotors
5 Integrally Bladed Rotors
7 Powder Ni Aft Stgs
7 Powder Ni Aft Stgs
5 Adv Power Ni 7 Powder Ni Aft Stgs
5 Adv Power Ni 5 Adv Power Ni
Combustor 7 Low Nox Features to Accom-modate Higher OPR/ T3
7 Low Nox Features to Accommodate Higher OPR/T3
5 Low Nox Features
7 Low Nox Features to Accommodate Higher OPR/T3
5 Low Nox Features
5 Low Nox Features
HPT 7 Adv Cast Ni Airfoils
5 Adv Cast Ni Airfoils
4 Impr Cast Ni A/Fs
5 Adv Cast Ni Airfoils
4 Impr Cast Ni A/Fs
4 Impr Cast Ni A/Fs
7 Adv Film Cooling
5 Adv Film Cooling
4 Impr Adv Cooling
5 Adv Film Cooling
4 Impr Adv Cooling
4 Impr Adv Cooling
7 Adv TBCs 5 Adv TBCs 4 Impr Adv TBCs 5 Adv TBCs 4 Impr Adv TBCs 4 Impr Adv TBCs 5 CMC Static
Seals(1) 5 CMC Static
Seals 4 CMC Static Parts 5 CMC Static
Seals 4 CMC Static
Parts 4 CMC Static Parts
LPT 7 High Speed LPT(1)
5 High Speed LPT
5 High Speed LPT 5 High Speed LPT
5 High Speed LPT 5 High Speed LPT
5 Ti/Al Blades(1)
5 Ti/Al Blades 5 Ti/Al Blades 5 Ti/Al Blades 5 Ti/Al Blades 5 Ti/Al Blades

AVIATION FUEL EFFICIENCY TECHNOLOGY ASSESSMENT —APPENDICES TECOLOTE RESEARCH
PG D-2
2024 Single Aisle 2034 Single Aisle
Tech. TRL Est Evol.
TRL Est Mod.
TRL Est Aggressive
TRL Est Evol.
TRL Est Mod.
TRL Est Aggressive (OR)
5 CMC Static Seals(1)
5 CMC Static Seals
5 CMC Static Seals 5 CMC Static Seals
5 CMC Static Seals
5 CMC Static Seals
Nozzles 7 Variable Area Nozzle (Optional)
7 Variable Area Nozzle (Optional)
5 Variable Area Nozzle
7 Variable Area Nozzle (Optional)
5 Variable Area Nozzle
Not Applicable
Inlets 7 Low Drag, Lightweight Nacelles
7 Low Drag, Lightweight Nacelles
5 Adv Low Drag, Lightweight Nacelles
7 Low Drag, Lightweight Nacelles
5 Adv Low Drag, Lightweight Nacelles
Not Applicable
GTF 7 Optional (1) 7 Included 5 Higher Gear Ratio
7 Included 5 Higher Gear Ratio
Not Applicable
Thrust/Wt (lbs)
4.6 4.7(2) 4.5 4.7(2) 4.5 (2)
(1) GTF option incorporates high speed LPT, but not CMC static seals nor Ti/Al blades Direct drive option incorporates CMC static seals and Ti/Al blades, but not high speed LPT.
(2) Fuel Burn benefit for 2024 Stretch and 2034 Evolutionary was an interpolated value. Presumption made that benefit was 50% weight and 50% TSFC relative to 2024 Evolutionary Single Aisle to calculate Fn/Wt.
(3) Uncertainties surrounding weight for Open Rotor precluded Fn/Wt estimate. ** Note: Open Rotor (OR) performance was bounded by using gas generator efficiencies consistent with those of the 2034 Stretch GTF and
evaluating engine performance with propeller efficiencies of 80-85% at Mach Numbers of 0.75 and 0.80.
TAB LE D-2 – STA TECH NOLOG Y COMPONENT MATR I X
2024 Small Twin Aisle 2034 Small Twin Aisle
Tech. TRL Est Evol.
TRL Est Mod.
TRL Est Aggressive
TRL Est Evol.
TRL Est Mod.
TRL Est Aggressive (OR)
GasTurb Modeling
Modeled New Engine (2024)
Interpolated Inputs
Modeled New Engine (2034)
2024 Stretch Input
Modeled New Engine (2034)
Interpolated TSFC – 2% improvement
TSFC reduction
6.0% 10.0% 13.9% 10.0% 13.9% 15.9%
Fan PR 1.5 1.4 1.3 1.4 1.3 1.3
BPR 9-10 12-13 18-19 12-13 18-19 18-19 OPR 48 48 55 48 55 55
RIT +120 to +160 F
+120 to +160 F
+270 to +300 F +120 to +160 F
+270 to +300 F +270 to +300 F
T3 +80 to +90 F +80 to +90 F +130 to +140 F +80 to +90 F +130 to +140 F +130 to +140 F Fan 8 Low AR
Shroudless 6 Low AR
Shroudless 5 Very Low Tip
Speed 6 Low AR
Shroudless 5 Very Low Tip
Speed 5 Very Low Tip
Speed
8 Swept 3-D Aero
6 Swept 3-D Aero
5 Lightweight Blades
6 Swept 3-D Aero
5 Lightweight Blades
5 Lightweight Blades
6 Lower Tip Speed
5 Swept 3-D Aero 6 Lower Tip Speed
5 Swept 3-D Aero 5 Swept 3-D Aero
8 Lightweight Blades
6 Lightweight Blades
4 Extensive Use of Composites in Case
6 Lightweight Blades
4 Extensive Use of Composites in Case
4 Extensive Use of Composites in Case
8 Composite Cases
6 Composite Cases
6 Composite Cases
HPC 8 Adv 3-D Aero
6 Adv 3-D Aero 5 Adv 3-D Aero 6 Adv 3-D Aero 5 Adv 3-D Aero 5 Adv 3-D Aero
8 Integrally Bladed Rotors
6 Integrally Bladed Rotors
5 Integrally Bladed Rotors
6 Integrally Bladed Rotors
5 Integrally Bladed Rotors
5 Integrally Bladed Rotors
8 Powder Ni Aft Stgs
6 Powder Ni Aft Stgs
5 Adv Power Ni 6 Powder Ni Aft Stgs
5 Adv Power Ni 5 Adv Power Ni
Combustor 8 Low Nox Features to Accommodate Higher OPR/T3
6 Low Nox Features to Accommodate Higher OPR/T3
5 Low Nox Features
6 Low Nox Features to Accommodate Higher OPR/T3
5 Adv Low Nox Features
5 Adv Low Nox Features
HPT 8 Adv Cast Ni Airfoils
5 Adv Cast Ni Airfoils
4 Impr Cast Ni A/Fs
5 Adv Cast Ni Airfoils
4 Impr Cast Ni A/Fs
4 Impr Cast Ni A/Fs

AVIATION FUEL EFFICIENCY TECHNOLOGY ASSESSMENT —APPENDICES TECOLOTE RESEARCH
PG D-3
2024 Small Twin Aisle 2034 Small Twin Aisle
Tech. TRL Est Evol.
TRL Est Mod.
TRL Est Aggressive
TRL Est Evol.
TRL Est Mod.
TRL Est Aggressive (OR)
8 Adv Film Cooling
5 Adv Film Cooling
4 Impr Adv Cooling
5 Adv Film Cooling
4 Impr Adv Cooling
4 Impr Adv Cooling
8 Adv TBCs 5 Adv TBCs 4 Impr Adv TBCs 5 Adv TBCs 4 Impr Adv TBCs 4 Impr Adv TBCs
5 CMC Static Seals(1)
4 CMC Static Parts 5 CMC Static Seals(1)
4 CMC Static Parts 4 CMC Static Parts
LPT 5 High Speed LPT(1)
5 High Speed LPT 5 High Speed LPT(1)
5 High Speed LPT 5 High Speed LPT
5 Ti/Al Blades(1) 5 Ti/Al Blades 5 Ti/Al Blades(1) 5 Ti/Al Blades 5 Ti/Al Blades
5 CMC Static Seals(1)
5 CMC Static Seals 5 CMC Static Seals(1)
5 CMC Static Seals 5 CMC Static Seals
Nozzles 6 Variable Area Nozzle
5 Variable Area Nozzle
6 Variable Area Nozzle (Optional)
5 Variable Area Nozzle
5 Variable Area Nozzle
Inlets 6 Low Drag, Lightweight Nacelles
5 Adv Low Drag, Lightweight Nacelles
6 Low Drag, Lightweight Nacelles
5 Adv Low Drag, Lightweight Nacelles
5 Adv Low Drag, Lightweight Nacelles
GTF 5 Optional(1) 5 Higher Gear Ratio
6 Optional(1) 5 Higher Gear Ratio
5 Higher Gear Ratio
Thrust/Wt (lbs)
4.8 4.5 4.3 4.5 4.3 4.6
(1) GTF option incorporates high speed LPT, but not CMC static seals nor Ti/Al blades Direct drive option incorporates CMC static seals and Ti/Al
blades, but not high speed LPT. (2) Fuel Burn benefit for 2024 Stretch and 2034 Evolutionary was an interpolated value. Presumption made that benefit was 50% weight and 50%
TSFC relative to 2024 Evolutionary Single Aisle to calculate Fn/Wt. (3) The Aggressive Scenario for 2034 Twin Aisle was judged to be ‘beyond the headlights’. A 2% improvement in fuel burn was presumed to be
achieved in that time frame relative to the Stretch 2034 Twin Aisle. Technologies shown in this column are a copy of those shown for the Stretch. Fn/Wt value shown presumes that this fuel burn improvement was 50% TSFC and 50% weight.
TAB LE D-3 – RJ TECH NOLOG Y COMPONENT MATR I X
2024 Regional Jet 2034 Regional Jet
Tech. TRL Est Evol.
TRL Est Mod.
TRL Est Aggressive
TRL Est Evol.
TRL Est Mod.
TRL Est Aggressive (OR)
GasTurb Modeling
Modeled New Engine (2024)
Interpolated Inputs
2034 New Engine
2024 Stretch Inputs
Modeled New Engine (2034)
Modeled OR Engine
TSFC reduction
17.0% 19.0% 21.0% 19.0% 21.0% 26.8%
Fan PR 1.44 1.4 1.4 1.4 1.4 Not Applicable **
BPR 9-10 11-12 11-12 12-13 11-12 Not Applicable **
OPR 31 45 45 45 45 52
RIT +120 to +160 F
+120 to +160 F
+120 to +160 F +120 to +160 F
+120 to +160 F +270 to +300 F
T3 +80 to +90 F +80 to +90 F +80 to +90 F +80 to +90 F +130 to +140 F
Fan 7 Low AR Shroudless
7 Low AR Shroudless
7 Very Low Tip Speed
7 Low AR Shroudless
7 Low AR Shroudless
N/A **
7 Swept 3-D Aero
7 Swept 3-D Aero
7 Swept 3-D Aero 7 Swept 3-D Aero
7 Swept 3-D Aero Not Applicable **
7 Lower Tip Speed
7 Lower Tip Speed
7 Lower Tip Speed 7 Lower Tip Speed
7 Lower Tip Speed Not Applicable **
7 Lightweight Blades
7 Lightweight Blades
7 Lightweight Blades
7 Lightweight Blades
7 Lightweight Blades
Not Applicable **
7 Composite Cases
7 Composite Cases
7 Composite Cases
7 Composite Cases
7 Composite Cases
Not Applicable **
HPC 7 Adv 3-D Aero
7 Adv 3-D Aero 7 Adv 3-D Aero 7 Adv 3-D Aero 7 Adv 3-D Aero 5 Adv 3-D Aero
AVIATION FUEL EFFICIENCY TECHNOLOGY ASSESSMENT —APPENDICES TECOLOTE RESEARCH
PG D-4
2024 Regional Jet 2034 Regional Jet
Tech. TRL Est Evol.
TRL Est Mod.
TRL Est Aggressive
TRL Est Evol.
TRL Est Mod.
TRL Est Aggressive (OR)
7 Integrally Bladed Rotors
7 Integrally Bladed Rotors
7 Integrally Bladed Rotors
7 Integrally Bladed Rotors
7 Integrally Bladed Rotors
5 Integrally Bladed Rotors
7 Powder Ni Aft Stgs
7 Powder Ni Aft Stgs
7 Powder Ni Aft Stgs
7 Powder Ni Aft Stgs
5 Adv Power Ni
Combustor 7 Low Nox Features to Accommodate Higher OPR/T3
7 Low Nox Features to Accommodate Higher OPR/T3
7 Low Nox Features to Accommodate Higher OPR/T3
7 Low Nox Features to Accommodate Higher OPR/T3
5 Low Nox Features
HPT 7 Adv Cast Ni Airfoils
7 Adv Cast Ni Airfoils
5 Impr Cast Ni A/Fs
7 Adv Cast Ni Airfoils
5 Impr Cast Ni A/Fs
4 Impr Cast Ni A/Fs
7 Adv Film Cooling
7 Adv Film Cooling
5 Impr Adv Cooling
7 Adv Film Cooling
5 Impr Adv Cooling
4 Impr Adv Cooling
7 Adv TBCs 7 Adv TBCs 5 Impr Adv TBCs 7 Adv TBCs 4 Impr Adv TBCs 4 Impr Adv TBCs
5 CMC Static Seals 5 CMC Static Seals 4 CMC Static Parts LPT 7 High Speed
LPT 7 High Speed
LPT 5 High Speed LPT 7 High Speed
LPT 5 High Speed LPT 5 High Speed LPT
5 Ti/Al Blades 5 Ti/Al Blades 5 Ti/Al Blades
5 CMC Static Seals 5 CMC Static Seals 5 CMC Static Seals Nozzles 8 Fixed Nozzle 8 Fixed Nozzle 8 Fixed Nozzle 8 Fixed Nozzle 8 Fixed Nozzle Not Applicable
Inlets 7 Low Drag, Lightweight Nacelles
7 Low Drag, Lightweight Nacelles
7 Low Drag, Lightweight Nacelles
7 Low Drag, Lightweight Nacelles
7 Low Drag, Lightweight Nacelles
Not Applicable
GTF 7 Included 7 Included 7 Included 7 Included 7 Included Not Applicable
Thrust/Wt (lbs)
4.8 4.5 4.3 4.5 4.3 4.6
(1) GTF option incorporates high speed LPT, but not CMC static seals nor Ti/Al blades Direct drive option incorporates CMC static seals and Ti/Al blades, but not high speed LPT.
(2) Fuel Burn benefit for 2024 Stretch and 2034 Evolutionary was an interpolated value. Presumption made that benefit was 50% weight and 50% TSFC relative to 2024 Evolutionary Single Aisle to calculate Fn/Wt.
(3) Uncertainties surrounding weight for Open Rotor precluded Fn/Wt estimate.

AVIATION FUEL EFFICIENCY TECHNOLOGY ASSESSMENT —APPENDICES TECOLOTE RESEARCH
PG E-1
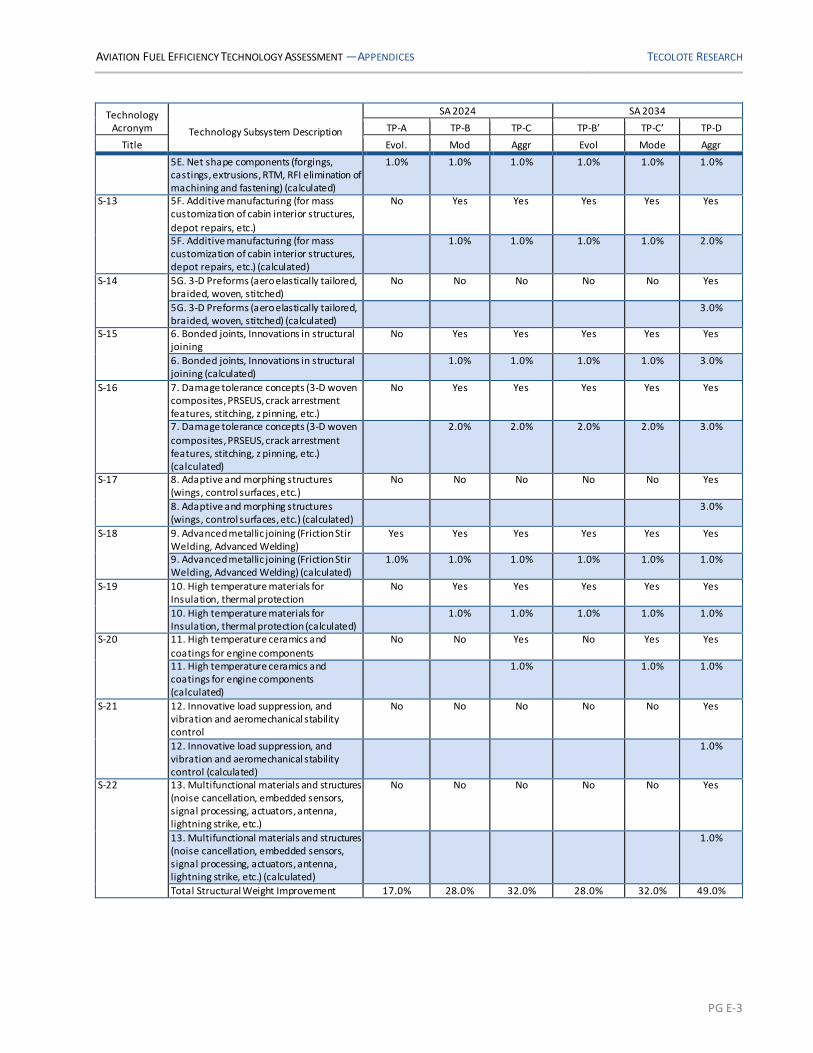
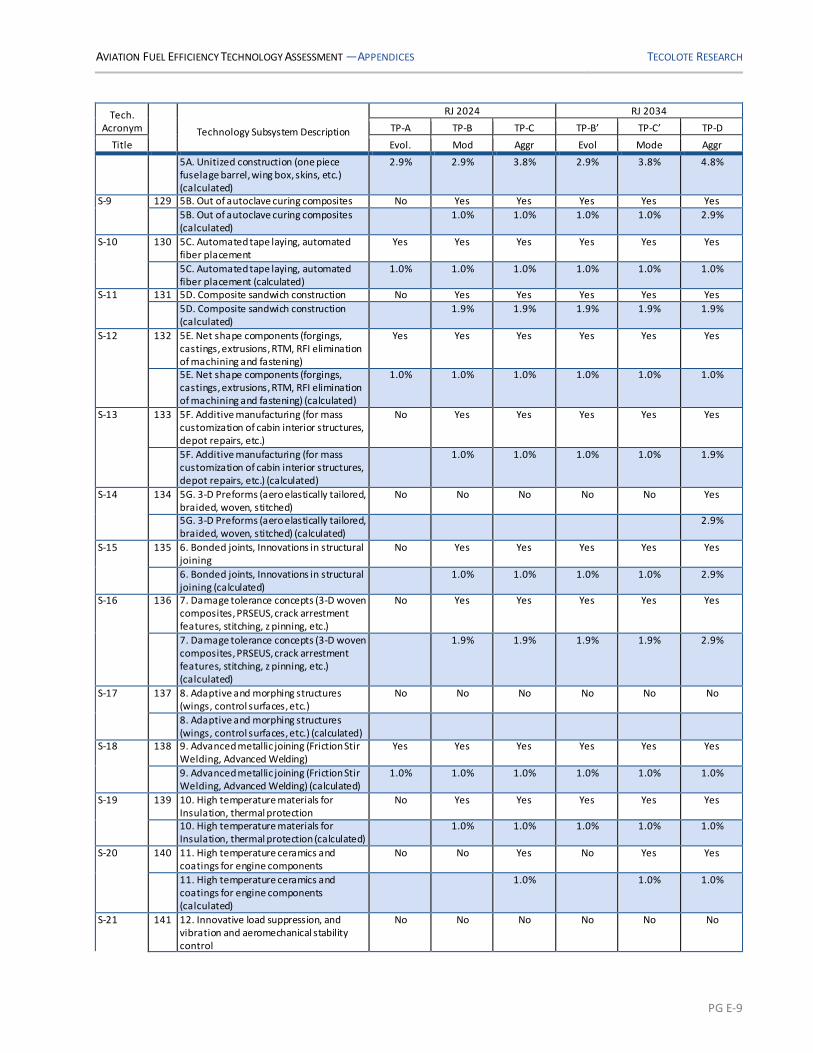
APPENDIX E—Subsystem Improvements
The data contained in this appendix detailed the summary results of the Technical SME’s evaluation of the
varying technologies assessed in the study. For each technology candidate a forecasted improvement was
identified for each of the Technology Deployment scenarios for each aircraft class. The improvements were
dependent on the area assessed. Improvements for Aerodynamic (Viscous and Non-Viscous) Efficiency are in
terms of reduction in drag. Improvements for Structural items are in terms of weight reduction.
Improvements for Systems are in terms of fuel efficiency improvement. In this appendix is a table for each
technology grouping (e.g., Aerodynamic Viscous, Structures and Materials, etc.) for each aircraft type
(Single-Aisle, Small Twin Aisle, and Regional Jet).
Single-Aisle Evaluations
TAB LE E-1 – SA AER OD YNAMI C V I S COUS TECH NOLOG I ES
Technology Acronym Technology Subsystem Description
SA 2024 SA 2034
TP-A TP-B TP-C TP-B’ TP-C’ TP-D
Title Evol. Mod Aggr Evol Mode Aggr
Aerodynamic Efficiency (Viscous)
AV-1 Natural laminar flow on nacelles Yes Yes Yes Yes Yes Yes Natural laminar flow on nacelles
(calculated) 1.0% 1.3% 1.5% 1.3% 1.5% 1.5%
AV-2 Hybrid laminar flow on empennage No Yes Yes Yes Yes Yes Hybrid laminar flow on empennage
(calculated)
2.0% 2.0% 2.0% 2.0% 2.0%
AV-3 Natural laminar flow on wings No No Yes No Yes No
Natural laminar flow on wings (calculated) 5.0% 5.0%
AV-4 Hybrid laminar flow on wing No No No No No Yes
Hybrid laminar flow on wing (calculated) 8.0%
AV-5 Laminar flow coating/riblets No No Yes No Yes Yes
Laminar flow coating/riblets (calculated) 2.0% 2.0% 2.0% AV-6 Low friction paint coating Yes Yes No Yes No No
Low friction paint coating (calculated) 2.0% 2.0% 2.0%
Total Aerodynamic Efficiency (Viscous) Improvement
3.0% 5.3% 10.5% 5.3% 10.5% 13.5%
TAB LE E-2 – SA AER OD YNAMI C NON-V I S COUS TECH NOLOG I ES
Technology Acronym Technology Subsystem Description
SA 2024 SA 2034
TP-A TP-B TP-C TP-B’ TP-C’ TP-D
Title Evol. Mod Aggr Evol Mode Aggr
Aerodynamic Efficiency (Non-Viscous)
ANV-1 Improved aero/transonic design Yes Yes Yes Yes Yes Yes Improved aero/transonic design
(calculated) 2.0% 2.0% 3.0% 2.0% 3.0% 4.0%
ANV-2 Wingtip technologies (for fixed span) Yes Yes Yes Yes Yes Yes
Wingtip technologies (for fixed span) (calculated)
1.0% 2.0% 2.0% 2.0% 2.0% 3.0%
ANV-3 Variable camber with existing control surfaces
Yes Yes Yes Yes Yes Yes
Variable camber with existing control surfaces (calculated)
1.0% 1.0% 1.0% 1.0% 1.0% 1.0%
ANV-4 Adaptive compliant trailing edge No Yes Yes Yes Yes Yes
Adaptive compliant trailing edge (calculated)
1.5% 2.0% 1.5% 2.0% 2.0%

AVIATION FUEL EFFICIENCY TECHNOLOGY ASSESSMENT —APPENDICES TECOLOTE RESEARCH
PG E-2
Technology Acronym Technology Subsystem Description
SA 2024 SA 2034
TP-A TP-B TP-C TP-B’ TP-C’ TP-D
Title Evol. Mod Aggr Evol Mode Aggr
ANV-5 Active stability control (reduced static margin)
No Yes Yes Yes Yes Yes
Active stability control (reduced static margin) (calculated)
1.0% 1.0% 1.0% 1.0% 1.0%
ANV-6 Reduction of loads (active smart wings) No Yes Yes Yes Yes Yes
Reduction of loads (active smart wings) (calculated)
1.5% 2.0% 1.5% 2.0% 3.0%
ANV-7 Increased wing span Yes Yes Yes Yes Yes Yes Increased wing span (calculated) 3.0% 3.0% 3.0% 3.0% 3.0% 3.0%
Total Aerodynamic Efficiency (Non-Viscous) Improvement
7.0% 12.0% 14.0% 12.0% 14.0% 17.0%
TAB LE E-3 – SA STR UCTUR AL TECH NOLOG I ES
Technology Acronym Technology Subsystem Description
SA 2024 SA 2034
TP-A TP-B TP-C TP-B’ TP-C’ TP-D
Title Evol. Mod Aggr Evol Mode Aggr
Structural Weight
S-1 1A. All composite fuselage Yes Yes Yes Yes Yes Yes
1A. All composite fuselage (calculated) 5.0% 5.0% 5.0% 5.0% 5.0% 5.0%
S-2 1B. All composite wing Yes Yes Yes Yes Yes Yes
1B. All composite wing (calculated) 3.0% 3.0% 3.0% 3.0% 3.0% 3.0% S-3 1C. All composite nacelle Yes Yes Yes Yes Yes Yes
1C. All composite nacelle (calculated) 1.0% 1.0% 1.0% 1.0% 1.0% 1.0%
S-4 1D. All composite empennage Yes Yes Yes Yes Yes Yes 1D. All composite empennage (calculated) 1.0% 1.0% 1.0% 1.0% 1.0% 1.0%
S-5 2. Integrated structural health monitoring
No Yes Yes Yes Yes Yes
2. Integrated structural health monitoring (calculated)
1.0% 2.0% 1.0% 2.0% 3.0%
S-6 3. Advanced composite materials (higher strength, stiffness, toughness, damage tolerance, temperature)
No Yes Yes Yes Yes Yes
3. Advanced composite materials (higher strength, stiffness, toughness, damage tolerance, temperature) (calculated)
2.0% 3.0% 2.0% 3.0% 4.0%
S-7 4. Advanced airframe metal alloy (2000, 7000 series Al alloy, 3rd gen Al-Li, higher temp Ti, etc.)
Yes Yes Yes Yes Yes Yes
4. Advanced airframe metal alloy (2000, 7000 series Al alloy, 3rd gen Al-Li, higher temp Ti, etc.) (calculated)
1.0% 1.0% 1.0% 1.0% 1.0% 1.0%
S-8 5A. Unitized construction (one piece fuselage barrel, wing box, skins, etc.)
Yes Yes Yes Yes Yes Yes
5A. Unitized construction (one piece fuselage barrel, wing box, skins, etc.) (calculated)
3.0% 3.0% 4.0% 3.0% 4.0% 5.0%
S-9 5B. Out of autoclave curing composites No Yes Yes Yes Yes Yes
5B. Out of autoclave curing composites (calculated)
1.0% 1.0% 1.0% 1.0% 3.0%
S-10 5C. Automated tape laying, automated fiber placement
Yes Yes Yes Yes Yes Yes
5C. Automated tape laying, automated fiber placement (calculated)
1.0% 1.0% 1.0% 1.0% 1.0% 1.0%
S-11 5D. Composite sandwich construction No Yes Yes Yes Yes Yes 5D. Composite sandwich construction
(calculated) 2.0% 2.0% 2.0% 2.0% 2.0%
S-12 5E. Net shape components (forgings, castings, extrusions, RTM, RFI elimination of machining and fastening)
Yes Yes Yes Yes Yes Yes
AVIATION FUEL EFFICIENCY TECHNOLOGY ASSESSMENT —APPENDICES TECOLOTE RESEARCH
PG E-3
Technology Acronym Technology Subsystem Description
SA 2024 SA 2034
TP-A TP-B TP-C TP-B’ TP-C’ TP-D
Title Evol. Mod Aggr Evol Mode Aggr
5E. Net shape components (forgings, castings, extrusions, RTM, RFI elimination of machining and fastening) (calculated)
1.0% 1.0% 1.0% 1.0% 1.0% 1.0%
S-13 5F. Additive manufacturing (for mass customization of cabin interior structures,
depot repairs, etc.)
No Yes Yes Yes Yes Yes
5F. Additive manufacturing (for mass customization of cabin interior structures, depot repairs, etc.) (calculated)
1.0% 1.0% 1.0% 1.0% 2.0%
S-14 5G. 3-D Preforms (aero elastically tailored, braided, woven, stitched)
No No No No No Yes
5G. 3-D Preforms (aero elastically tailored, braided, woven, stitched) (calculated)
3.0%
S-15 6. Bonded joints, Innovations in structural joining
No Yes Yes Yes Yes Yes
6. Bonded joints, Innovations in structural joining (calculated)
1.0% 1.0% 1.0% 1.0% 3.0%
S-16 7. Damage tolerance concepts (3-D woven composites, PRSEUS, crack arrestment features, stitching, z pinning, etc.)
No Yes Yes Yes Yes Yes
7. Damage tolerance concepts (3-D woven
composites, PRSEUS, crack arrestment features, stitching, z pinning, etc.) (calculated)
2.0% 2.0% 2.0% 2.0% 3.0%
S-17 8. Adaptive and morphing structures (wings, control surfaces, etc.)
No No No No No Yes
8. Adaptive and morphing structures (wings, control surfaces, etc.) (calculated)
3.0%
S-18 9. Advanced metallic joining (Friction Stir Welding, Advanced Welding)
Yes Yes Yes Yes Yes Yes
9. Advanced metallic joining (Friction Stir Welding, Advanced Welding) (calculated)
1.0% 1.0% 1.0% 1.0% 1.0% 1.0%
S-19 10. High temperature materials for Insulation, thermal protection
No Yes Yes Yes Yes Yes
10. High temperature materials for Insulation, thermal protection (calculated)
1.0% 1.0% 1.0% 1.0% 1.0%
S-20 11. High temperature ceramics and
coatings for engine components
No No Yes No Yes Yes
11. High temperature ceramics and coatings for engine components (calculated)
1.0% 1.0% 1.0%
S-21 12. Innovative load suppression, and vibration and aeromechanical stability control
No No No No No Yes
12. Innovative load suppression, and vibration and aeromechanical stability control (calculated)
1.0%
S-22 13. Multifunctional materials and structures (noise cancellation, embedded sensors, signal processing, actuators, antenna, lightning strike, etc.)
No No No No No Yes
13. Multifunctional materials and structures (noise cancellation, embedded sensors, signal processing, actuators, antenna, lightning strike, etc.) (calculated)
1.0%
Total Structural Weight Improvement 17.0% 28.0% 32.0% 28.0% 32.0% 49.0%

AVIATION FUEL EFFICIENCY TECHNOLOGY ASSESSMENT —APPENDICES TECOLOTE RESEARCH
PG E-4
TAB LE E-4 – SA SYS TEM AND CONF I G UR ATI ON TECH NOLOG I ES
Technology Acronym Technology Subsystem Description
SA 2024 SA 2034
TP-A TP-B TP-C TP-B’ TP-C’ TP-D
Title Evol. Mod Aggr Evol Mode Aggr
Aircraft Systems
Sys-1 More electric aircraft Yes Yes Yes Yes Yes Yes
More electric aircraft (calculated) 1.0% 1.0% 1.0% 1.0% 1.0% 1.0%
Sys-2 Electric landing-gear drive No Yes Yes Yes Yes Yes
Electric landing-gear drive (calculated) 0.5% 0.5% 0.5% 0.5% 0.5% Total Aircraft Systems Improvement 1.0% 1.5% 1.5% 1.5% 1.5% 1.5%
TAB LE E-5 – SA ENG I NE CONF I G UR ATI ONS
Technology Acronym Technology Subsystem Description
SA 2024 SA 2034
TP-A TP-B TP-C TP-B’ TP-C’ TP-D
Title Evol. Mod Aggr Evol Mode Aggr
Engine Configuration SA2024NE SA2024 Stretch
SA2034NE SA2024 Stretch SA2034NE SA2034NE
TSFC Performance Calculation
TSFC Improvement 15.3% 17.5% 19.5% 17.5% 19.6% 21.6%
Small Twin Aisle Evaluations
TAB LE E-6 – STA AER OD YNAMI C V I S COUS TECH NOLOG I ES
Technology Acronym Technology Subsystem Description
STA 2024 STA 2034
TP-A TP-B TP-C TP-B’ TP-C’ TP-D
Title Evol. Mod Aggr Evol Mode Aggr
Aerodynamic Efficiency (Viscous)
AV-1 Natural laminar flow on nacelles Yes Yes Yes Yes Yes Yes
Natural laminar flow on nacelles (calculated)
0.3% 0.5% 1.0% 0.5% 1.0% 1.0%
AV-2 Hybrid laminar flow on empennage No Yes Yes Yes Yes Yes Hybrid laminar flow on empennage
(calculated) 2.0% 2.0% 2.0% 2.0% 2.0%
AV-3 Natural laminar flow on wings No No No No No No
Natural laminar flow on wings (calculated) AV-4 Hybrid laminar flow on wing No No Yes No Yes Yes
Hybrid laminar flow on wing (calculated) 10.0% 10.0% 10.0%
AV-5 Laminar flow coating/riblets No No Yes No Yes Yes Laminar flow coating/riblets (calculated) 2.0% 2.0% 2.0%
AV-6 Low friction paint coating Yes Yes No Yes No No
Low friction paint coating (calculated) 2.0% 2.0% 2.0%
Total Aerodynamic Efficiency (Viscous) Improvement
2.3% 4.5% 15.0% 4.5% 15.0% 15.0%
TAB LE E-7 – STA AER OD YNAMI C NON-V I S COUS TECH NOLOG I ES
Technology Acronym Technology Subsystem Description
STA 2024 STA 2034
TP-A TP-B TP-C TP-B’ TP-C’ TP-D
Title Evol. Mod Aggr Evol Mode Aggr
Aerodynamic Efficiency (Non-Viscous)
ANV-1 Improved aero/transonic design Yes Yes Yes Yes Yes Yes Improved aero/transonic design
(calculated) 2.0% 2.0% 3.0% 2.0% 3.0% 4.0%
ANV-2 Wingtip technologies (for fixed span) Yes Yes Yes Yes Yes Yes
Wingtip technologies (for fixed span) (calculated)
1.0% 2.0% 2.0% 2.0% 2.0% 3.0%

AVIATION FUEL EFFICIENCY TECHNOLOGY ASSESSMENT —APPENDICES TECOLOTE RESEARCH
PG E-5
Technology Acronym Technology Subsystem Description
STA 2024 STA 2034
TP-A TP-B TP-C TP-B’ TP-C’ TP-D
Title Evol. Mod Aggr Evol Mode Aggr
ANV-3 Variable camber with existing control surfaces
Yes Yes Yes Yes Yes Yes
Variable camber with existing control surfaces (calculated)
1.0% 1.0% 1.0% 1.0% 1.0% 1.0%
ANV-4 Adaptive compliant trailing edge No Yes Yes Yes Yes Yes
Adaptive compliant trailing edge (calculated)
1.5% 2.0% 1.5% 2.0% 2.0%
ANV-5 Active stability control (reduced static margin)
No Yes Yes Yes Yes Yes
Active stability control (reduced static margin) (calculated)
1.0% 1.0% 1.0% 1.0% 1.0%
ANV-6 Reduction of loads (active smart wings) No Yes Yes Yes Yes Yes
Reduction of loads (active smart wings) (calculated)
1.5% 2.0% 1.5% 2.0% 3.0%
ANV-7 Increased wing span No No Yes No Yes Yes
Increased wing span (calculated) 8.0% 8.0% 8.0%
Total Aerodynamic Efficiency (Non-Viscous) Improvement
4.0% 9.0% 19.0% 9.0% 19.0% 22.0%
TAB LE E-8 – STA STR UCTUR AL TECH NOLOG I ES
Technology Acronym Technology Subsystem Description
STA 2024 STA 2034
TP-A TP-B TP-C TP-B’ TP-C’ TP-D
Title Evol. Mod Aggr Evol Mode Aggr
Structural Weight
S-1 1A. All composite fuselage Yes Yes Yes Yes Yes Yes 1A. All composite fuselage (calculated) 5.0% 5.0% 5.0% 5.0% 5.0% 5.0%
S-2 1B. All composite wing Yes Yes Yes Yes Yes Yes
1B. All composite wing (calculated) 3.0% 3.0% 3.0% 3.0% 3.0% 3.0%
S-3 1C. All composite nacelle Yes Yes Yes Yes Yes Yes 1C. All composite nacelle (calculated) 1.0% 1.0% 1.0% 1.0% 1.0% 1.0%
S-4 1D. All composite empennage Yes Yes Yes Yes Yes Yes
1D. All composite empennage (calculated) 1.0% 1.0% 1.0% 1.0% 1.0% 1.0% S-5 2. Integrated structural
health monitoring No Yes Yes Yes Yes Yes
2. Integrated structural health monitoring (calculated)
1.0% 2.0% 1.0% 2.0% 3.0%
S-6 3. Advanced composite materials (higher strength, stiffness, toughness, damage tolerance, temperature)
No Yes Yes Yes Yes Yes
3. Advanced composite materials (higher strength, stiffness, toughness, damage tolerance, temperature) (calculated)
2.0% 3.0% 2.0% 3.0% 4.0%
S-7 4. Advanced airframe metal alloy (2000, 7000 series Al alloy, 3rd gen Al-Li, higher temp Ti, etc.)
Yes Yes Yes Yes Yes Yes
4. Advanced airframe metal alloy (2000, 7000 series Al alloy, 3rd gen Al- temp Ti, etc.) (calculated)
1.0% 1.0% 1.0% 1.0% 1.0% 1.0%
S-8 5A. Unitized construction (one piece fuselage barrel, wing box, skins, etc.)
Yes Yes Yes Yes Yes Yes
5A. Unitized construction (one piece fuselage barrel, wing box, skins, etc.) (calculated)
3.0% 3.0% 4.0% 3.0% 4.0% 5.0%
S-9 5B. Out of autoclave curing composites No Yes Yes Yes Yes Yes
5B. Out of autoclave curing composites (calculated)
1.0% 1.0% 1.0% 1.0% 3.0%
S-10 5C. Automated tape laying, automated fiber placement
Yes Yes Yes Yes Yes Yes

AVIATION FUEL EFFICIENCY TECHNOLOGY ASSESSMENT —APPENDICES TECOLOTE RESEARCH
PG E-6
Technology Acronym Technology Subsystem Description
STA 2024 STA 2034
TP-A TP-B TP-C TP-B’ TP-C’ TP-D
Title Evol. Mod Aggr Evol Mode Aggr
5C. Automated tape laying, automated fiber placement (calculated)
1.0% 1.0% 1.0% 1.0% 1.0% 1.0%
S-11 5D. Composite sandwich construction No Yes Yes Yes Yes Yes
5D. Composite sandwich construction (calculated)
2.0% 2.0% 2.0% 2.0% 2.0%
S-12 5E. Net shape components (forgings, castings, extrusions, RTM, RFI elimination of machining and fastening)
Yes Yes Yes Yes Yes Yes
5E. Net shape components (forgings, castings, extrusions, RTM, RFI elimination of machining and fastening) (calculated)
1.0% 1.0% 1.0% 1.0% 1.0% 1.0%
S-13 5F. Additive manufacturing (for mass customization of cabin interior structures, depot repairs, etc.)
No Yes Yes Yes Yes Yes
5F. Additive manufacturing (for mass customization of cabin interior structures, depot repairs, etc.) (calculated)
1.0% 1.0% 1.0% 1.0% 2.0%
S-14 5G. 3-D Preforms (aero elastically tailored, braided, woven, stitched)
No No No No No Yes
5G. 3-D Preforms (aero elastically tailored, braided, woven, stitched) (calculated)
3.0%
S-15 6. Bonded joints, Innovations in structural joining
No Yes Yes Yes Yes Yes
6. Bonded joints, Innovations in structural joining (calculated)
1.0% 1.0% 1.0% 1.0% 3.0%
S-16 7. Damage tolerance concepts (3-D woven composites, PRSEUS, crack arrestment features, stitching, z pinning, etc.)
No Yes Yes Yes Yes Yes
7. Damage tolerance concepts (3-D woven composites, PRSEUS, crack arrestment features, stitching, z pinning, etc.) (calculated)
2.0% 2.0% 2.0% 2.0% 3.0%
S-17 8. Adaptive and morphing structures (wings, control surfaces, etc.)
No No No No No Yes
8. Adaptive and morphing structures (wings, control surfaces, etc.) (calculated)
3.0%
S-18 9. Advanced metallic joining (Friction Stir
Welding, Advanced Welding)
Yes Yes Yes Yes Yes Yes
9. Advanced metallic joining (Friction Stir Welding, Advanced Welding) (calculated)
1.0% 1.0% 1.0% 1.0% 1.0% 1.0%
S-19 10. High temperature materials for Insulation, thermal protection
No Yes Yes Yes Yes Yes
10. High temperature materials for Insulation, thermal protection (calculated)
1.0% 1.0% 1.0% 1.0% 1.0%
S-20 11. High temperature ceramics and coatings for engine components
No No Yes No Yes Yes
11. High temperature ceramics and coatings for engine components (calculated)
1.0% 1.0% 1.0%
S-21 12. Innovative load suppression, and vibration and aeromechanical stability control
No No No No No Yes
12. Innovative load suppression, and
vibration and aeromechanical stability control (calculated)
1.0%
S-22 13. Multifunctional materials and structures (noise cancellation, embedded sensors, signal processing, actuators, antenna, lightning strike, etc.)
No No No No No Yes

AVIATION FUEL EFFICIENCY TECHNOLOGY ASSESSMENT —APPENDICES TECOLOTE RESEARCH
PG E-7
Technology Acronym Technology Subsystem Description
STA 2024 STA 2034
TP-A TP-B TP-C TP-B’ TP-C’ TP-D
Title Evol. Mod Aggr Evol Mode Aggr
13. Multifunctional materials and structures (noise cancellation, embedded sensors, signal processing, actuators, antenna, lightning strike, etc.) (calculated)
1.0%
Total Structural Weight Improvement 17.0% 28.0% 32.0% 28.0% 32.0% 49.0%
TAB LE E-9 – STA SYS TEM AND CONF I G UR ATI ON TECH NOLOG I ES
Technology Acronym Technology Subsystem Description
STA 2024 STA 2034
TP-A TP-B TP-C TP-B’ TP-C’ TP-D
Title Evol. Mod Aggr Evol Mode Aggr
Aircraft Systems
Sys-1 More electric aircraft Yes Yes Yes Yes Yes Yes
More electric aircraft (calculated) 1.0% 1.0% 1.0% 1.0% 1.0% 1.0%
Sys-2 Electric landing-gear drive No Yes Yes Yes Yes Yes
Electric landing-gear drive (calculated) 0.5% 0.5% 0.5% 0.5% 0.5% Total Aircraft Systems Improvement 1.0% 1.5% 1.5% 1.5% 1.5% 1.5%
TAB LE E-10 – STA ENG I NE CONF I G UR ATI ONS
Technology
Acronym Technology Subsystem Description
STA 2024 STA 2034
TP-A TP-B TP-C TP-B’ TP-C’ TP-D
Title Evol. Mod Aggr Evol Mode Aggr
Engine Configuration STA2024NE STA 2024 Stretch
STA2034NE STA 2024 Stretch STA2034NE STA2034NE
TSFC Performance Calculation
TSFC Improvement 6.0% 10.0% 13.9% 10.0% 13.9% 15.9%
Regional Jet Evaluations
TAB LE E-11 – RJ AER OD YNAMI C V I S COUS TECH NOLOG I ES
Tech. Acronym Technology Subsystem Description
RJ 2024 RJ 2034
TP-A TP-B TP-C TP-B’ TP-C’ TP-D
Title Evol. Mod Aggr Evol Mode Aggr
Aerodynamic Efficiency (Viscous)
AV-1 74 Natural laminar flow on nacelles Yes Yes Yes Yes Yes Yes Natural laminar flow on nacelles
(calculated) 1.0% 1.3% 1.5% 1.3% 1.5% 1.5%
AV-2 75 Hybrid laminar flow on empennage No No No No No No
Hybrid laminar flow on empennage (calculated)
AV-3 76 Natural laminar flow on wings No No Yes No Yes Yes
Natural laminar flow on wings (calculated) 5.0% 5.0% 8.0%
AV-4 79 Hybrid laminar flow on wing No No No No No No Hybrid laminar flow on wing (calculated)
AV-5 80 Laminar flow coating/riblets No No Yes No Yes Yes
Laminar flow coating/riblets (calculated) 2.0% 2.0% 2.0% AV-6 81 Low friction paint coating Yes Yes No Yes No No
Low friction paint coating (calculated) 2.0% 2.0% 2.0%
Total Aerodynamic Efficiency (Viscous) Improvement
3.0% 3.3% 8.5% 3.3% 8.5% 11.5%

AVIATION FUEL EFFICIENCY TECHNOLOGY ASSESSMENT —APPENDICES TECOLOTE RESEARCH
PG E-8
TAB LE E-12 – RJ AER OD YNAMI C NON-V I S COUS TECH NOLOG I ES
Tech. Acronym Technology Subsystem Description
RJ 2024 RJ 2034
TP-A TP-B TP-C TP-B’ TP-C’ TP-D
Title Evol. Mod Aggr Evol Mode Aggr
Aerodynamic Efficiency (Non-Viscous)
ANV-1 85 Improved aero/transonic design Yes Yes Yes Yes Yes Yes
Improved aero/transonic design (calculated)
2.0% 2.0% 3.0% 2.0% 3.0% 4.0%
ANV-2 86 Wingtip technologies (for fixed span) Yes Yes Yes Yes Yes Yes
Wingtip technologies (for fixed span) (calculated)
1.0% 2.0% 2.0% 2.0% 2.0% 3.0%
ANV-3 87 Variable camber with existing control surfaces
No No No No No No
Variable camber with existing control
surfaces (calculated)
ANV-4 88 Adaptive compliant trailing edge No Yes Yes Yes Yes Yes
Adaptive compliant trailing edge (calculated)
1.5% 2.0% 1.5% 2.0% 2.0%
ANV-5 90 Active stability control (reduced static margin)
No No No No No No
Active stability control (reduced static margin) (calculated)
ANV-6 91 Reduction of loads (active smart wings) No No No No No No
Reduction of loads (active smart wings) (calculated)
ANV-7 93 Increased wing span: Yes Yes Yes Yes Yes Yes
Increased wing span: (calculated) 1.5% 1.5% 1.5% 1.5% 1.5% 1.5%
Total Aerodynamic Efficiency (Non-Viscous) Improvement
4.5% 7.0% 8.5% 7.0% 8.5% 10.5%
TAB LE E-13 – RJ STR UCTUR AL TECH NOLOG I ES
Tech. Acronym
Technology Subsystem Description
RJ 2024 RJ 2034
TP-A TP-B TP-C TP-B’ TP-C’ TP-D
Title Evol. Mod Aggr Evol Mode Aggr
S-2 120 1A. All composite fuselage Yes Yes Yes Yes Yes Yes
1A. All composite fuselage (calculated) 4.8% 4.8% 4.8% 4.8% 4.8% 4.8%
S-2 121 1B. All composite wing Yes Yes Yes Yes Yes Yes
1B. All composite wing (calculated) 2.9% 2.9% 2.9% 2.9% 2.9% 2.9% S-3 122 1C. All composite nacelle Yes Yes Yes Yes Yes Yes
1C. All composite nacelle (calculated) 1.0% 1.0% 1.0% 1.0% 1.0% 1.0%
S-4 123 1D. All composite empennage Yes Yes Yes Yes Yes Yes 1D. All composite empennage (calculated) 1.0% 1.0% 1.0% 1.0% 1.0% 1.0%
S-5 124 2. Integrated structural health monitoring
No No No No No No
2. Integrated structural health monitoring (calculated)
S-6 125 3. Advanced composite materials (higher strength, stiffness, toughness, damage tolerance, temperature)
No Yes Yes Yes Yes Yes
3. Advanced composite materials (higher strength, stiffness, toughness, damage tolerance, temperature) (calculated)
1.9% 2.9% 1.9% 2.9% 3.8%
S-7 126 4. Advanced airframe metal alloy (2000, 7000 series Al alloy, 3rd gen Al- temp Ti, etc.)
Yes Yes Yes Yes Yes Yes
4. Advanced airframe metal alloy (2000, 7000 series Al alloy, 3rd gen Al- temp Ti, etc.) (calculated)
1.0% 1.0% 1.0% 1.0% 1.0% 1.0%
S-8 128 5A. Unitized construction (one piece fuselage barrel, wing box, skins, etc.)
Yes Yes Yes Yes Yes Yes
AVIATION FUEL EFFICIENCY TECHNOLOGY ASSESSMENT —APPENDICES TECOLOTE RESEARCH
PG E-9
Tech. Acronym
Technology Subsystem Description
RJ 2024 RJ 2034
TP-A TP-B TP-C TP-B’ TP-C’ TP-D
Title Evol. Mod Aggr Evol Mode Aggr
5A. Unitized construction (one piece fuselage barrel, wing box, skins, etc.) (calculated)
2.9% 2.9% 3.8% 2.9% 3.8% 4.8%
S-9 129 5B. Out of autoclave curing composites No Yes Yes Yes Yes Yes
5B. Out of autoclave curing composites (calculated)
1.0% 1.0% 1.0% 1.0% 2.9%
S-10 130 5C. Automated tape laying, automated fiber placement
Yes Yes Yes Yes Yes Yes
5C. Automated tape laying, automated fiber placement (calculated)
1.0% 1.0% 1.0% 1.0% 1.0% 1.0%
S-11 131 5D. Composite sandwich construction No Yes Yes Yes Yes Yes
5D. Composite sandwich construction (calculated)
1.9% 1.9% 1.9% 1.9% 1.9%
S-12 132 5E. Net shape components (forgings, castings, extrusions, RTM, RFI elimination of machining and fastening)
Yes Yes Yes Yes Yes Yes
5E. Net shape components (forgings, castings, extrusions, RTM, RFI elimination of machining and fastening) (calculated)
1.0% 1.0% 1.0% 1.0% 1.0% 1.0%
S-13 133 5F. Additive manufacturing (for mass customization of cabin interior structures, depot repairs, etc.)
No Yes Yes Yes Yes Yes
5F. Additive manufacturing (for mass customization of cabin interior structures, depot repairs, etc.) (calculated)
1.0% 1.0% 1.0% 1.0% 1.9%
S-14 134 5G. 3-D Preforms (aero elastically tailored, braided, woven, stitched)
No No No No No Yes
5G. 3-D Preforms (aero elastically tailored, braided, woven, stitched) (calculated)
2.9%
S-15 135 6. Bonded joints, Innovations in structural joining
No Yes Yes Yes Yes Yes
6. Bonded joints, Innovations in structural joining (calculated)
1.0% 1.0% 1.0% 1.0% 2.9%
S-16 136 7. Damage tolerance concepts (3-D woven composites, PRSEUS, crack arrestment features, stitching, z pinning, etc.)
No Yes Yes Yes Yes Yes
7. Damage tolerance concepts (3-D woven composites, PRSEUS, crack arrestment features, stitching, z pinning, etc.) (calculated)
1.9% 1.9% 1.9% 1.9% 2.9%
S-17 137 8. Adaptive and morphing structures (wings, control surfaces, etc.)
No No No No No No
8. Adaptive and morphing structures (wings, control surfaces, etc.) (calculated)
S-18 138 9. Advanced metallic joining (Friction Stir Welding, Advanced Welding)
Yes Yes Yes Yes Yes Yes
9. Advanced metallic joining (Friction Stir Welding, Advanced Welding) (calculated)
1.0% 1.0% 1.0% 1.0% 1.0% 1.0%
S-19 139 10. High temperature materials for Insulation, thermal protection
No Yes Yes Yes Yes Yes
10. High temperature materials for Insulation, thermal protection (calculated)
1.0% 1.0% 1.0% 1.0% 1.0%
S-20 140 11. High temperature ceramics and coatings for engine components
No No Yes No Yes Yes
11. High temperature ceramics and coatings for engine components (calculated)
1.0% 1.0% 1.0%
S-21 141 12. Innovative load suppression, and vibration and aeromechanical stability control
No No No No No No

AVIATION FUEL EFFICIENCY TECHNOLOGY ASSESSMENT —APPENDICES TECOLOTE RESEARCH
PG E-10
Tech. Acronym
Technology Subsystem Description
RJ 2024 RJ 2034
TP-A TP-B TP-C TP-B’ TP-C’ TP-D
Title Evol. Mod Aggr Evol Mode Aggr
12. Innovative load suppression, and vibration and aeromechanical stability control (calculated)
S-22 142 13. Multifunctional materials and structures (noise cancellation, embedded
sensors, signal processing, actuators, antenna, lightning strike, etc.)
No No No No No Yes
13. Multifunctional materials and structures (noise cancellation, embedded sensors, signal processing, actuators, antenna, lightning strike, etc.) (calculated)
1.0%
Total Structural Weight Improvement 16.2% 25.7% 28.5% 25.7% 28.5% 39.9%
TAB LE E-14 – RJ SYS TEM AND CONF I G UR ATI ON TECH NOLOG I ES
Tech. Acronym
Technology Subsystem Description
RJ 2024 RJ 2034
TP-A TP-B TP-C TP-B’ TP-C’ TP-D
Title Evol. Mod Aggr Evol Mode Aggr
Aircraft Systems Sys-1 144 More electric aircraft Yes Yes Yes Yes Yes Yes
More electric aircraft (calculated) 1.0% 1.0% 1.0% 1.0% 1.0% 1.0%
Sys-2 145 Electric landing-gear drive No Yes Yes Yes Yes Yes Electric landing-gear drive (calculated) 0.5% 0.5% 0.5% 0.5% 0.5%
Total Aircraft Systems Improvement 1.0% 1.5% 1.5% 1.5% 1.5% 1.5%
TAB LE E-15 – RJ ENG I NE CONF I G UR ATI ONS
Technology Acronym Technology Subsystem Description
RJ 2024 RJ 2034
TP-A TP-B TP-C TP-B’ TP-C’ TP-D
Title Evol. Mod Aggr Evol Mode Aggr
Engine Configuration RJ2024NE RJ2024 Stretch
RJ2034NE RJ2024 Stretch
RJ2034NE RJ2034NE
TSFC Performance Calculation
TSFC Improvement 17.0% 19.0% 21.0% 19.0% 21.0% 26.8%

AVIATION FUEL EFFICIENCY TECHNOLOGY ASSESSMENT —APPENDICES TECOLOTE RESEARCH
PG F-1
APPENDIX F—Maintenance Assessment of Technology Candidates
The following are identified impacts to maintenance aspects from each individual technology by the SMEs.
The tables indicate by technology the level of impact it will have on the maintenance operations and a
description of the assessment
TAB LE F-1 – O&M IMPACTS F OR V I S COUS AND NON-V I S COUS TECH NOLOG I ES
Code Technology
Potential
Impact Description
AV-1 Natura l laminar flow on
nacelles
Significant Leading edge and surfaces must be kept smooth and free of
defect to maintain laminar flow and scheduled inspection and repaint/resurface may be needed
Fuel savings may not be fully realized, as a ircraft may be required
to carry additional fuel to account for in-flight loss of laminar flow
AV-2 Hybrid laminar flow on
empennage
Significant Leading edge and surfaces must be kept smooth and free of
defect to maintain laminar flow and scheduled inspection and repaint/resurface may be needed
Significant Suction holes need to be maintained to ensure they remain open Moderate Vacuum device must be inspected and maintained
Minor Suction holes will require new approach when painting
Fuel savings may not be fully realized, as a ircraft may be required to carry additional fuel to account for in-flight loss of laminar flow
AV-3 Natura l laminar flow on wings Significant Leading edge and surfaces must be kept smooth and free of defect to maintain laminar flow and scheduled inspection and
repaint/resurface may be needed Fuel savings may not be fully realized, as a ircraft may be required
to carry additional fuel to account for in-flight loss of laminar flow
AV-4 Hybrid laminar flow on wing Significant Leading edge and surfaces must be kept smooth and free of defect to maintain laminar flow and scheduled inspection and repaint/resurface may be needed
Significant Suction holes need to be maintained to ensure they remain open
Moderate Vacuum device must be inspected and maintained Minor Suction holes will require new approach when painting
Fuel savings may not be fully realized, as a ircraft may be required to carry additional fuel to account for in-flight loss of laminar flow
AV-5 Laminar flow coating/riblets Minor/
Moderate
Coatings/riblets must remain free of defect to maintain laminar
flow Minor/
Moderate
Riblets may erode and may require periodic removal and
replacement
ANV-1 Improved aero/transonic des ign
None
ANV-2 Wingtip technologies (for fixed span)
Minor/ Moderate
New component must be accounted for in maintenance cycles
ANV-3 Variable camber with existing control surfaces
Significant Extra actuator and movable parts require inspection and maintenance
ANV-4 Adaptive compliant tra iling
edge
Moderate Adds s tructural complexity and additional actuators to the tra iling
edge of the wing
ANV-5 Active s tability control (reduced static margin)
Moderate The extra sensor and feedback loop add system complexity, and maintenance also involves software upgrades and testing

AVIATION FUEL EFFICIENCY TECHNOLOGY ASSESSMENT —APPENDICES TECOLOTE RESEARCH
PG F-2
Code Technology Potential Impact Description
ANV-6 Reduction of loads (active
smart wings)
Significant New sensors to monitor wing loading must be included
Moderate New advanced actuators must be included
ANV-7 Increased wing span Minor May increase the complexity/parts count for the wing
TAB LE F-2 – MAI NTENANCE IMPACTS F OR SYS TEMS TECH NOLOG I ES
Code Technology Potential Impact Description
S-0 Al l composite aircraft Significant May s ignificantly alter the conduct of inspections Significant May s ignificantly alter the frequency with and how maintenance
and repair is performed
S-1 Al l composite fuselage Significant May s ignificantly alter the conduct of inspections
Significant May s ignificantly alter the frequency with and how maintenance and repair is performed
S-2 Al l composite wing Significant May s ignificantly alter the conduct of inspections
Significant May s ignificantly alter the frequency with and how maintenance and repair is performed
S-3 Al l composite nacelle Significant May s ignificantly alter the conduct of inspections May s ignificantly alter the frequency with and how maintenance
and repair is performed
S-4 Al l composite empennage Significant May s ignificantly alter the conduct of inspections
May s ignificantly alter the frequency with and how maintenance and repair is performed
S-5 Integrated s tructural
health monitoring
Moderate Adds multiple sensors to s tructural elements that must be
maintained May reduce some maintenance costs, particularly in the area of
inspections Software upgrades and testing may increase maintenance
S-6 Advanced composite materials (higher strength, s ti ffness, toughness, damage
tolerance, temperature)
None
S-7 Advanced airframe metal
a l loy (2000, 7000 series A1 a l loy, 3rd gen A1-Li , higher temp Ti , etc.
None
S-8 Unitized construction (one piece fuselage barrel, wing box, skins, etc.)
Moderate Larger one-piece components when damaged will require new repair processes or will require replacement of larger, more expensive components
Though larger one-piece external components may limit access to internal components and hamper inspection of structural elements, i t significantly reduces the number of parts and joints, which are to be inspected otherwise
S-9 Out of autoclave curing composites
None
S-10 Automated tape laying, automated fiber placement
Moderate Larger one-piece components when damaged will require new repair processes or will require replacement of larger, more
expensive components
Though larger one-piece external components may limit access to
internal components and hamper inspection of structural elements, i t significantly reduces the number of parts and joints, which are to be inspected otherwise
S-11 Composite sandwich construction
None
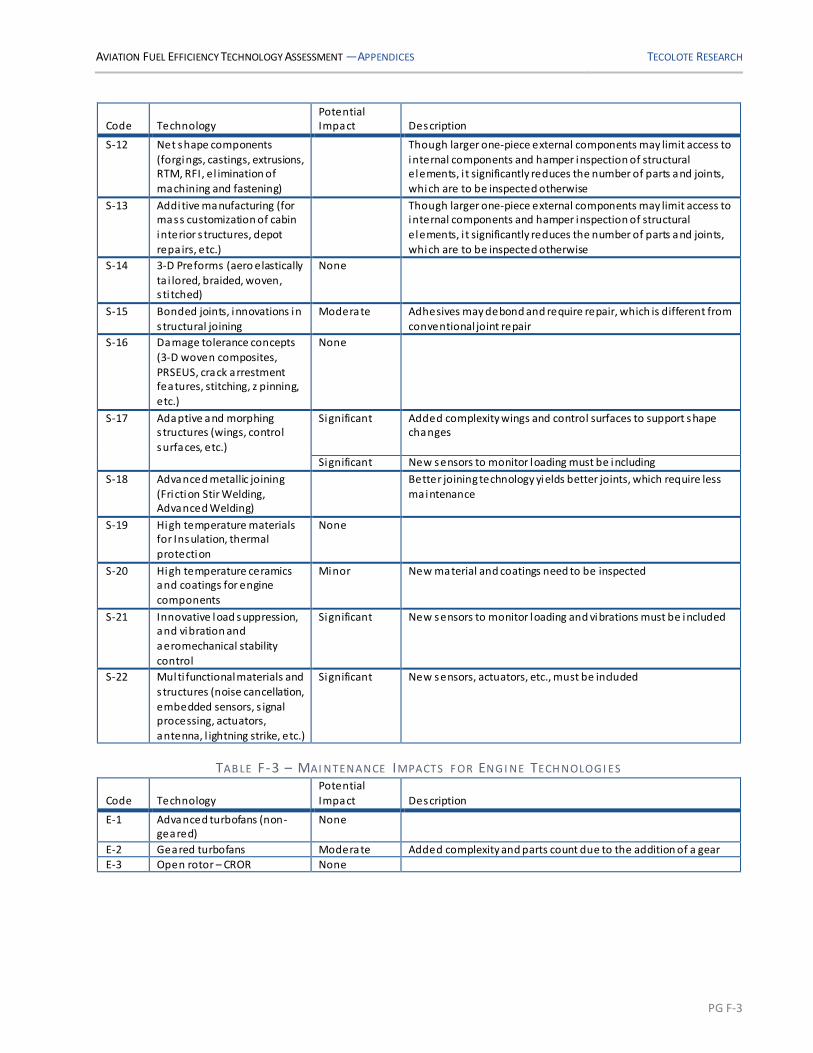
AVIATION FUEL EFFICIENCY TECHNOLOGY ASSESSMENT —APPENDICES TECOLOTE RESEARCH
PG F-3
Code Technology Potential Impact Description
S-12 Net shape components
(forgings, castings, extrusions, RTM, RFI, el imination of machining and fastening)
Though larger one-piece external components may limit access to
internal components and hamper inspection of structural elements, i t significantly reduces the number of parts and joints, which are to be inspected otherwise
S-13 Additive manufacturing (for mass customization of cabin
interior s tructures, depot repairs, etc.)
Though larger one-piece external components may limit access to internal components and hamper inspection of structural
elements, i t significantly reduces the number of parts and joints, which are to be inspected otherwise
S-14 3-D Preforms (aero elastically ta i lored, braided, woven, s ti tched)
None
S-15 Bonded joints, innovations in s tructural joining
Moderate Adhesives may debond and require repair, which is different from conventional joint repair
S-16 Damage tolerance concepts (3-D woven composites,
PRSEUS, crack arrestment features, stitching, z pinning, etc.)
None
S-17 Adaptive and morphing s tructures (wings, control
surfaces, etc.)
Significant Added complexity wings and control surfaces to support shape changes
Significant New sensors to monitor loading must be including
S-18 Advanced metallic joining (Friction Stir Welding, Advanced Welding)
Better joining technology yields better joints, which require less maintenance
S-19 High temperature materials for Insulation, thermal
protection
None
S-20 High temperature ceramics and coatings for engine
components
Minor New material and coatings need to be inspected
S-21 Innovative load suppression, and vibration and aeromechanical stability
control
Significant New sensors to monitor loading and vibrations must be included
S-22 Multi functional materials and
s tructures (noise cancellation, embedded sensors, s ignal processing, actuators,
antenna, l ightning strike, etc.)
Significant New sensors, actuators, etc., must be included
TAB LE F-3 – MAI NTENANCE IMPACTS F OR ENG I NE TECH NOLOG I ES
Code Technology
Potential
Impact Description
E-1 Advanced turbofans (non-geared)
None
E-2 Geared turbofans Moderate Added complexity and parts count due to the addition of a gear
E-3 Open rotor – CROR None

AVIATION FUEL EFFICIENCY TECHNOLOGY ASSESSMENT —APPENDICES TECOLOTE RESEARCH
PG G-1
APPENDIX G—Piano 5 User Factor Parameters
Piano includes user factors that an analyst can input that will enable the Piano model to resize an ai rcraft.
Subsequently, the revised aircraft weight and engine parameters can be used to estimate fuel burn
reductions and as an input into cost estimating models. The following figure shows the available user
factors, their name, their definition, and min/max/default values. The User Factors marked in ORANGE TEXT
are the factors used for modeling technology improvements in the study and were the core of evaluation by
the Technical SMEs and review by the TAG.
TAB LE G-1 – US ER FACTOR
USER FACTOR NAME DEFINITION MIN
Value MAX
Value DEFAULT
Value
USER-ADJUST-CL- CD-CURVE
User-adjustment of CL-dependent drag. It is a l ist of numbers representing alternately a CL and a corresponding Cd increment or decrement.
(referenced to trapezoidal wing-area)
-1.0 1.0 0
USER-ADJUST-MACH-
CD-CURVE
User-adjustment of Mach-dependent drag. It is a l ist of numbers representing alternately a Mach
number and a corresponding Cd increment (+ or -) (referenced to trapezoidal wing-area).
-1.0 1.0 0
USER-CDS-INCREMENT Drag area increment {Cd * S} for any unaccounted items. Units are sq. meters or sq. feet
-10 sq.m 10 sq.m 0 sq.m
USER-FACTOR-ON-APPROACH-FUEL
Factor applied to approach fuel 0 5.0 1
USER-FACTOR-ON-
ASYMMETRIC-DRAG
Factor applied to asymmetric drag due to yaw
with one engine out. See also user-factor-on-windmill-drag.
0.0 2.0 1
USER-FACTOR-ON- BOX-MASS
This factor is applied to the wing structural mass only. A separate factor exists for the flaps.
0.1 2 1
USER-FACTOR-ON- CLIMB-RATING
Applied to engine thrust characteristics 0.5 1.5 1
USER-FACTOR-ON-CONTINUOUS-RATING
Applied to engine thrust characteristics 0.5 1.5 1
USER-FACTOR-ON- CRUISE-RATING
Applied to engine thrust characteristics 0.5 1.5 1
USER-FACTOR-ON-DIVERGENCE-MACH
Divergence Mach is calculated internally as a function of
t/c, sweepback, CL, and the parameter roof-top-end. This factor is then applied to the result. The divergence Mach at a given CL can be examined through the drag report.
0.9 1.1 1
USER-FACTOR-ON-DIVERSION-FUEL
Factor applied to diversion fuel calculation. 0.1 2 1
USER-FACTOR-ON- FIN-DRAG
Factor applied to the fin zero-lift drag 0 5 1
USER-FACTOR-ON- FIN-MASS
Factor on estimated vertical tail mass. 0 10 1
USER-FACTOR-ON-
FLAP-MASS Factor on estimated wing flap mass 0.1 5 1
USER-FACTOR-ON- FUSE-DRAG
Factor applied to fuselage zero-lift drag 0 5 1

AVIATION FUEL EFFICIENCY TECHNOLOGY ASSESSMENT —APPENDICES TECOLOTE RESEARCH
PG G-2
USER FACTOR NAME DEFINITION MIN
Value MAX
Value DEFAULT
Value
USER-FACTOR-ON- FUSE-MASS
Factor on estimated fuselage mass. 0.1 2 1
USER-FACTOR-ON-
HOLD-FUEL Factor applied to holding fuel calculation 0.1 2.0 1
USER-FACTOR-ON-INDUCED-DRAG
Factor applied to the wing induced drag 0.5 1.5 1
USER-FACTOR-ON-
LANDING-CLMAX
This factor is applied to the total CLmax of the aircraft
at landing flap deflections. 0.5 2 1
USER-FACTOR-ON-LANDING-L/D
This factor is applied to the calculated overall Lift/Drag ratio in the landing configuration (shown in field reports). Used to change the final approach and landing
drags.
0.5 1.5 1
USER-FACTOR-ON- NAC-DRAG
Factor applied to nacelle zero-lift drag 0 5 1
USER-FACTOR-ON-SFC This factor is applied to all fuel consumption characteristics (sfc loops and idle flow).
0.1 2 1
USER-FACTOR-ON- STAB-DRAG
Factor applied to stabilizer zero-lift drag 0 5 1
USER-FACTOR-ON- STAB-MASS
Factor on estimated horizontal tail mass 0 10 1
USER-FACTOR-ON-
TAKEOFF-CLMAX
This factor is applied to the total CLmax of the aircraft
at takeoff flap deflections. 0.5 2 1
USER-FACTOR-ON-TAKEOFF-FUEL
Factor applied to takeoff fuel 0 5.0 1
USER-FACTOR-ON-
TAKEOFF-L/D
This factor is applied to the calculated overall Lift/Drag
ratio in the takeoff configuration (shown in field reports). Used to change the takeoff drag.
0.5 1.5 1
USER-FACTOR-ON-TAKEOFF-RATING
This factor should only be used to simulate an engine de-rating or throttle-push when calculating takeoff
performance. The given value of reference-thrust-per-engine will sti ll be used to find the engine mass, and all other ratings will still be defined relative to the
reference thrust.
0.5 1.5 1
USER-FACTOR-ON- TAXI-IN-FUEL
Factor applied to taxi -in fuel 0 5.0 1
USER-FACTOR-ON-
TAXI-OUT-FUEL Factor applied to taxi -out fuel 0 5.0 1
USER-FACTOR-ON- TOTAL-DRAG
A factor applied to the total drag. This should only be used for management-style studies and has l imited physical significance.
0.5 1.5 1
USER-FACTOR-ON- U/C-MASS
Factor on undercarriage mass 0 2 1
USER-FACTOR-ON-
WINDMILL-DRAG
Factor applied to windmill ing drag due to a failed
engine. 0.0 2.0 1
USER-FACTOR-ON- WING-DRAG
Factor applied to wing zero-lift drag 0 5 1
Source: www.piano.aero

AVIATION FUEL EFFICIENCY TECHNOLOGY ASSESSMENT —APPENDICES TECOLOTE RESEARCH
PG H-1
APPENDIX H— Piano 5 User Factors By Configuration
The following are the resulting composite Piano User Factors used in the study to derive optimized resized
aircraft. The graphs show a comparison across EIS years for each aircraft class. The data shown in the graphs
are only the variables provided by the SME for use in optimized aircraft resizing in Piano.
F I G UR E H-1 –SA 2024 P I ANO 5 US ER FACTOR S
wing-drag
fuse-drag
nac-drag
stab-drag
fin-draginduced
dragbox-mass
flap-mass
fuse-mass
stab-mass
fin-massu/c-mass
takeoff-clmax
landing-clmax
SA Evolutionary - 2024 0.95 0.95 0.91 0.96 0.96 0.97 0.93 0.91 0.89 0.93 0.93 0.99 1.04 1.04
SA Moderate - 2024 0.95 0.95 0.90 0.81 0.90 0.96 0.83 0.85 0.83 0.78 0.87 0.98 1.08 1.08
SA Aggressive - 2024 0.87 0.86 0.89 0.79 0.89 0.95 0.81 0.83 0.82 0.76 0.85 0.98 1.08 1.08
0.60
0.65
0.70
0.75
0.80
0.85
0.90
0.95
1.00
1.05
1.10
PIA
NO
Use
r Fa
cto
rs -
Re
lati
ve t
o B
asle
ine
Co
nfi
gura
tio
n
Single Aisle 2024 PIANO User Factors

AVIATION FUEL EFFICIENCY TECHNOLOGY ASSESSMENT —APPENDICES TECOLOTE RESEARCH
PG H-2
F I G UR E H-2 –SA 2034 P I ANO 5 US ER FACTOR S
wing-drag
fuse-drag
nac-dragstab-drag
fin-draginduced
dragbox-mass
flap-mass
fuse-mass
stab-mass
fin-massu/c-mass
takeoff-clmax
landing-clmax
SA Evolutionary - 2034 0.95 0.95 0.90 0.81 0.90 0.95 0.83 0.85 0.83 0.78 0.87 0.98 1.08 1.08
SA Moderate - 2034 0.87 0.86 0.89 0.79 0.89 0.94 0.80 0.83 0.82 0.76 0.85 0.98 1.08 1.08
SA Aggressive - 2034 0.86 0.86 0.89 0.79 0.89 0.93 0.68 0.72 0.71 0.65 0.73 0.97 1.08 1.08
0.60
0.65
0.70
0.75
0.80
0.85
0.90
0.95
1.00
1.05
1.10
PIA
NO
Use
r Fa
cto
rs -
Re
lati
ve t
o B
asle
ine
Co
nfi
gura
tio
nSingle Aisle 2034 PIANO User Factors
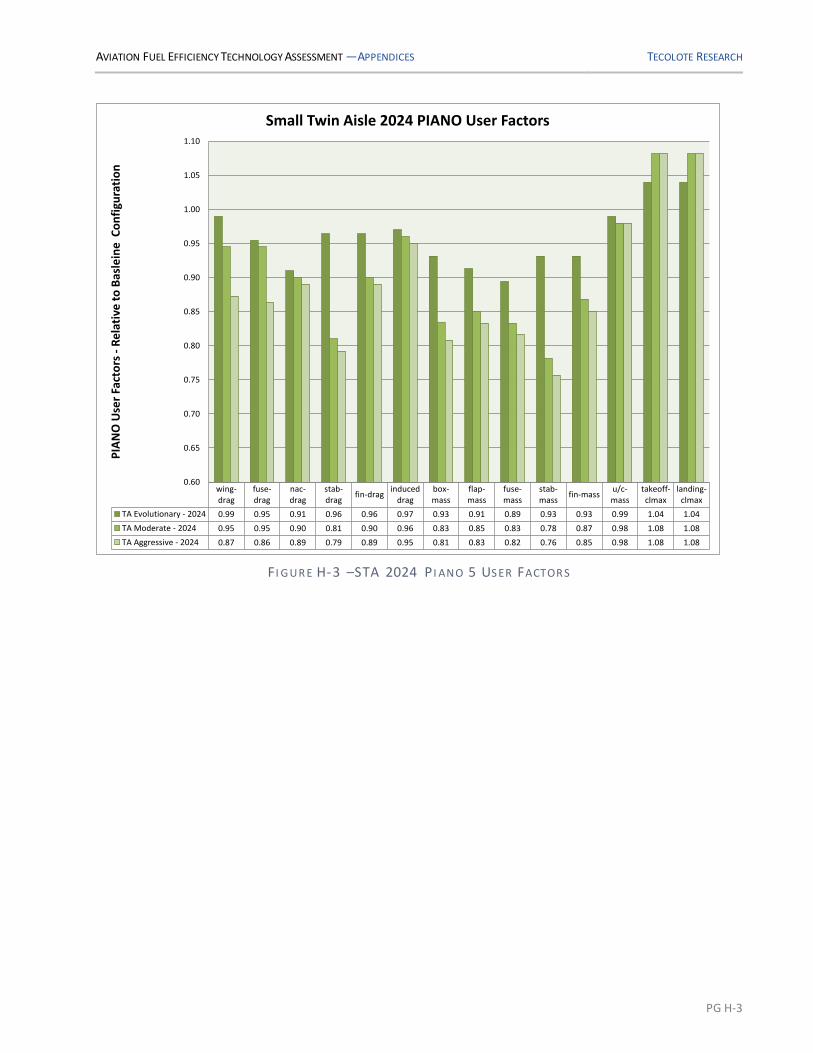
AVIATION FUEL EFFICIENCY TECHNOLOGY ASSESSMENT —APPENDICES TECOLOTE RESEARCH
PG H-3
F I G UR E H-3 –STA 2024 P I ANO 5 US ER FACTOR S
wing-drag
fuse-drag
nac-drag
stab-drag
fin-draginduced
dragbox-mass
flap-mass
fuse-mass
stab-mass
fin-massu/c-mass
takeoff-clmax
landing-clmax
TA Evolutionary - 2024 0.99 0.95 0.91 0.96 0.96 0.97 0.93 0.91 0.89 0.93 0.93 0.99 1.04 1.04
TA Moderate - 2024 0.95 0.95 0.90 0.81 0.90 0.96 0.83 0.85 0.83 0.78 0.87 0.98 1.08 1.08
TA Aggressive - 2024 0.87 0.86 0.89 0.79 0.89 0.95 0.81 0.83 0.82 0.76 0.85 0.98 1.08 1.08
0.60
0.65
0.70
0.75
0.80
0.85
0.90
0.95
1.00
1.05
1.10
PIA
NO
Use
r Fa
cto
rs -
Re
lati
ve t
o B
asle
ine
Co
nfi
gura
tio
nSmall Twin Aisle 2024 PIANO User Factors

AVIATION FUEL EFFICIENCY TECHNOLOGY ASSESSMENT —APPENDICES TECOLOTE RESEARCH
PG H-4
F I G UR E H-4 –STA 2034 P I ANO 5 US ER FACTOR S
wing-drag
fuse-drag
nac-drag
stab-drag
fin-draginduced
dragbox-mass
flap-mass
fuse-mass
stab-mass
fin-massu/c-mass
takeoff-clmax
landing-clmax
TA Evolutionary - 2034 0.95 0.95 0.90 0.81 0.90 0.95 0.83 0.85 0.83 0.78 0.87 0.98 1.08 1.08
TA Moderate - 2034 0.87 0.86 0.89 0.79 0.89 0.94 0.80 0.83 0.82 0.76 0.86 0.98 1.08 1.08
TA Aggressive - 2034 0.87 0.87 0.90 0.79 0.89 0.93 0.72 0.78 0.76 0.70 0.78 0.97 1.08 1.08
0.60
0.65
0.70
0.75
0.80
0.85
0.90
0.95
1.00
1.05
1.10
PIA
NO
Use
r Fa
cto
rs -
Re
lati
ve t
o B
asle
ine
Co
nfi
gura
tio
nSmall Twin Aisle 2034 PIANO User Factors
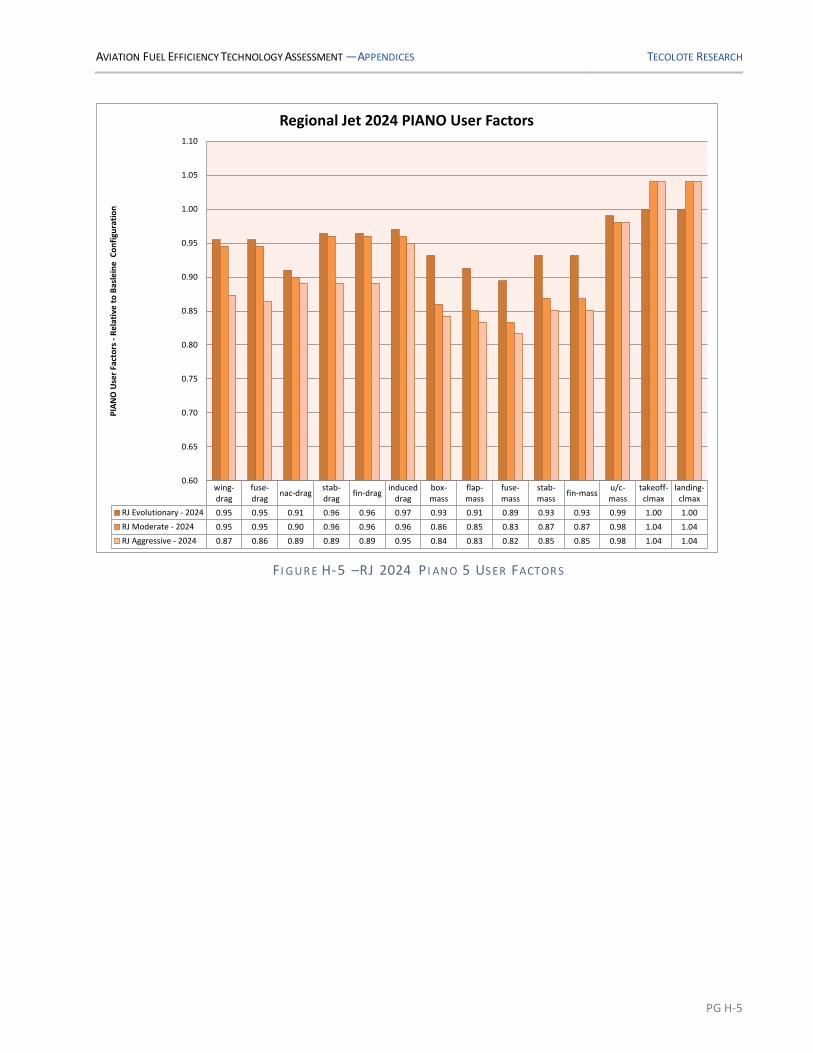
AVIATION FUEL EFFICIENCY TECHNOLOGY ASSESSMENT —APPENDICES TECOLOTE RESEARCH
PG H-5
F I G UR E H-5 –RJ 2024 P I ANO 5 US ER FACTOR S
wing-drag
fuse-drag
nac-dragstab-drag
fin-draginduced
dragbox-mass
flap-mass
fuse-mass
stab-mass
fin-massu/c-mass
takeoff-clmax
landing-clmax
RJ Evolutionary - 2024 0.95 0.95 0.91 0.96 0.96 0.97 0.93 0.91 0.89 0.93 0.93 0.99 1.00 1.00
RJ Moderate - 2024 0.95 0.95 0.90 0.96 0.96 0.96 0.86 0.85 0.83 0.87 0.87 0.98 1.04 1.04
RJ Aggressive - 2024 0.87 0.86 0.89 0.89 0.89 0.95 0.84 0.83 0.82 0.85 0.85 0.98 1.04 1.04
0.60
0.65
0.70
0.75
0.80
0.85
0.90
0.95
1.00
1.05
1.10
PIA
NO
Use
r Fa
cto
rs -
Re
lati
ve t
o B
asle
ine
Co
nfi
gura
tio
nRegional Jet 2024 PIANO User Factors

AVIATION FUEL EFFICIENCY TECHNOLOGY ASSESSMENT —APPENDICES TECOLOTE RESEARCH
PG H-6
F I G UR E H-6 –RJ 2034 P I ANO 5 US ER FACTOR S
wing-drag
fuse-drag
nac-dragstab-drag
fin-draginduced
dragbox-mass
flap-mass
fuse-mass
stab-mass
fin-massu/c-mass
takeoff-clmax
landing-clmax
RJ Evolutionary - 2034 0.95 0.95 0.90 0.96 0.96 0.95 0.86 0.85 0.83 0.87 0.87 0.98 1.04 1.04
RJ Moderate - 2034 0.87 0.86 0.89 0.89 0.89 0.94 0.84 0.83 0.82 0.85 0.85 0.98 1.04 1.04
RJ Aggressive - 2034 0.85 0.86 0.89 0.89 0.89 0.93 0.75 0.74 0.73 0.76 0.76 0.97 1.04 1.04
0.60
0.65
0.70
0.75
0.80
0.85
0.90
0.95
1.00
1.05
1.10
PIA
NO
Use
r Fa
cto
rs -
Re
lati
ve t
o B
asle
ine
Co
nfi
gura
tio
nRegional Jet 2034 PIANO User Factors

AVIATION FUEL EFFICIENCY TECHNOLOGY ASSESSMENT —APPENDICES TECOLOTE RESEARCH
PG I-1
APPENDIX I—Design Heritage Factors
In this study Design Heritage Factors was used to adjust the calculated development cost results to account
for the amount of new development required. Design Heritage Factors are a value between “0” and “1”,
where: 0 means 0% new design and 1 means 100% new design. The tables in this appendix show the overal l
composite effect on each subsystem based on the underlying technologies employed for each of the
deployment scenario (E = evolutionary, M = moderate, A = aggressive). These factors were determined by
the SMEs. As the model is probabilistic based, these parameters represent the triangular distribution ( low,
most likely, high values).
TAB LE I-1 – SA DES I G N HER I TAG E FACTOR S Low Most Likely High
2024 2034 2024 2034 2024 2034
E M A E M A E M A E M A E M A E M A
Air Vehicle
Ai rframe Integ. Ai rframe Fuselage 0.49 0.64 0.63 0.70 0.70 0.70 0.55 0.72 0.73 0.76 0.78 1.00 0.65 0.92 1.00 0.86 0.98 1.00
Wing Structure Box 0.61 0.71 0.75 0.77 0.78 0.86 0.67 0.79 0.85 0.83 0.86 1.00 0.77 0.99 1.00 0.93 1.00 1.00
Flaps 0.62 0.74 0.74 0.82 0.81 0.84 0.68 0.82 0.84 0.88 0.89 1.00 0.78 1.00 1.00 0.98 1.00 1.00
Slats 0.40 0.57 0.56 0.65 0.64 0.65 0.46 0.65 0.66 0.71 0.72 1.00 0.56 0.85 0.96 0.81 0.92 1.00
Spoi lers 0.40 0.54 0.56 0.65 0.64 0.65 0.46 0.62 0.66 0.71 0.72 1.00 0.56 0.82 0.96 0.81 0.92 1.00 Ai lerons 0.62 0.69 0.69 0.78 0.77 0.81 0.68 0.77 0.79 0.84 0.85 1.00 0.78 0.97 1.00 0.94 1.00 1.00
Winglets 0.04 0.57 0.56 0.62 0.62 0.63 0.10 0.65 0.66 0.68 0.70 1.00 0.20 0.85 0.96 0.78 0.90 1.00
Empennage Stabilizer 0.49 0.71 0.72 0.78 0.77 0.77 0.55 0.79 0.82 0.84 0.85 1.00 0.65 0.99 1.00 0.94 1.00 1.00
Fin 0.49 0.71 0.72 0.78 0.77 0.77 0.55 0.79 0.82 0.84 0.85 1.00 0.65 0.99 1.00 0.94 1.00 1.00 Landing Gear 0.04 0.33 0.31 0.42 0.40 0.42 0.10 0.41 0.41 0.48 0.48 1.00 0.20 0.61 0.71 0.58 0.68 1.00
Propulsion
Engine
Core 1.00 1.00 1.00 1.00 1.00 1.00 1.00 1.00 1.00 1.00 1.00 1.00 1.00 1.00 1.00 1.00 1.00 1.00 Pylon 0.14 0.22 0.20 0.31 0.29 0.27 0.20 0.30 0.30 0.37 0.37 1.00 0.30 0.50 0.60 0.47 0.57 1.00 Nacelle 0.56 0.62 0.65 0.72 0.71 0.71 0.62 0.70 0.75 0.78 0.79 1.00 0.72 0.90 1.00 0.88 0.99 1.00
Fuel System 0.18 0.18 0.18 0.32 0.32 0.90 0.20 0.20 0.20 0.36 0.36 1.00 0.24 0.24 0.24 0.43 0.43 1.00 Systems
Aux Power Unit 0.18 0.18 0.18 0.32 0.32 0.90 0.20 0.20 0.20 0.36 0.36 1.00 0.24 0.24 0.24 0.43 0.43 1.00
Surface Controls 0.63 0.73 0.72 0.81 0.80 0.80 0.69 0.81 0.82 0.87 0.88 1.00 0.79 1.00 1.00 0.97 1.00 1.00
Hydraulics 0.18 0.18 0.18 0.32 0.32 0.90 0.20 0.20 0.20 0.36 0.36 1.00 0.24 0.24 0.24 0.43 0.43 1.00 Electrical 0.34 0.32 0.30 0.42 0.40 0.38 0.40 0.40 0.40 0.48 0.48 1.00 0.50 0.60 0.70 0.58 0.68 1.00
Furnishings 0.04 0.20 0.18 0.24 0.22 0.22 0.10 0.28 0.28 0.30 0.30 1.00 0.20 0.48 0.58 0.40 0.50 1.00
Ai r Conditioning 0.18 0.18 0.18 0.32 0.32 0.90 0.20 0.20 0.20 0.36 0.36 1.00 0.24 0.24 0.24 0.43 0.43 1.00 Avionics 0.34 0.32 0.30 0.42 0.40 0.38 0.40 0.40 0.40 0.48 0.48 1.00 0.50 0.60 0.70 0.58 0.68 1.00
Misc Systems 0.18 0.18 0.18 0.32 0.32 0.90 0.20 0.20 0.20 0.36 0.36 1.00 0.24 0.24 0.24 0.43 0.43 1.00

AVIATION FUEL EFFICIENCY TECHNOLOGY ASSESSMENT —APPENDICES TECOLOTE RESEARCH
PG I-2
TAB LE I-2 – STA DES I G N HER I TAG E FACTOR S Low Most Likely High 2024 2034 2024 2034 2024 2034
E M A E M A E M A E M A E M A E M A
Air Vehicle
Ai rframe Integ. Ai rframe
Fuselage 0.49 0.62 0.63 0.70 0.70 0.70 0.55 0.70 0.73 0.76 0.78 1.00 0.65 0.90 1.00 0.86 0.98 1.00
Wing Structure Box 0.51 0.67 0.76 0.75 0.79 0.86 0.57 0.75 0.86 0.81 0.87 1.00 0.67 0.95 1.00 0.91 1.00 1.00
Flaps 0.62 0.72 0.75 0.82 0.82 0.84 0.68 0.80 0.85 0.88 0.90 1.00 0.78 1.00 1.00 0.98 1.00 1.00 Slats 0.40 0.54 0.57 0.65 0.66 0.67 0.46 0.62 0.67 0.71 0.74 1.00 0.56 0.82 0.97 0.81 0.94 1.00
Spoi lers 0.40 0.51 0.57 0.65 0.66 0.67 0.46 0.59 0.67 0.71 0.74 1.00 0.56 0.79 0.97 0.81 0.94 1.00
Ai lerons 0.62 0.67 0.70 0.78 0.78 0.82 0.68 0.75 0.80 0.84 0.86 1.00 0.78 0.95 1.00 0.94 1.00 1.00 Winglets 0.11 0.57 0.56 0.62 0.62 0.63 0.17 0.65 0.66 0.68 0.70 1.00 0.27 0.85 0.96 0.78 0.90 1.00
Empennage
Stabilizer 0.49 0.70 0.73 0.78 0.78 0.77 0.55 0.78 0.83 0.84 0.86 1.00 0.65 0.98 1.00 0.94 1.00 1.00
Fin 0.49 0.70 0.73 0.78 0.78 0.77 0.55 0.78 0.83 0.84 0.86 1.00 0.65 0.98 1.00 0.94 1.00 1.00 Landing Gear 0.04 0.33 0.34 0.42 0.42 0.44 0.10 0.41 0.44 0.48 0.50 1.00 0.20 0.61 0.74 0.58 0.70 1.00
Propulsion Engine Core 1.00 1.00 1.00 1.00 1.00 1.00 1.00 1.00 1.00 1.00 1.00 1.00 1.00 1.00 1.00 1.00 1.00 1.00
Pylon 0.14 0.22 0.20 0.31 0.29 0.27 0.20 0.30 0.30 0.37 0.37 1.00 0.30 0.50 0.60 0.47 0.57 1.00 Nacelle 0.56 0.62 0.65 0.72 0.71 0.71 0.62 0.70 0.75 0.78 0.79 1.00 0.72 0.90 1.00 0.88 0.99 1.00
Fuel System 0.18 0.18 0.18 0.32 0.32 0.90 0.20 0.20 0.20 0.36 0.36 1.00 0.24 0.24 0.24 0.43 0.43 1.00 Systems
Aux Power Unit 0.18 0.18 0.18 0.32 0.32 0.90 0.20 0.20 0.20 0.36 0.36 1.00 0.24 0.24 0.24 0.43 0.43 1.00 Surface Controls 0.58 0.73 0.72 0.81 0.80 0.80 0.64 0.81 0.82 0.87 0.88 1.00 0.74 1.00 1.00 0.97 1.00 1.00
Hydraulics 0.18 0.18 0.18 0.32 0.32 0.90 0.20 0.20 0.20 0.36 0.36 1.00 0.24 0.24 0.24 0.43 0.43 1.00
Electrical 0.34 0.32 0.30 0.42 0.40 0.38 0.40 0.40 0.40 0.48 0.48 1.00 0.50 0.60 0.70 0.58 0.68 1.00 Furnishings 0.00 0.20 0.18 0.24 0.22 0.22 0.00 0.28 0.28 0.30 0.30 1.00 0.00 0.48 0.58 0.40 0.50 1.00
Ai r Conditioning 0.18 0.18 0.18 0.32 0.32 0.90 0.20 0.20 0.20 0.36 0.36 1.00 0.24 0.24 0.24 0.43 0.43 1.00
Avionics 0.34 0.32 0.30 0.42 0.40 0.38 0.40 0.40 0.40 0.48 0.48 1.00 0.50 0.60 0.70 0.58 0.68 1.00
Misc Systems 0.18 0.18 0.18 0.32 0.32 0.90 0.20 0.20 0.20 0.36 0.36 1.00 0.24 0.24 0.24 0.43 0.43 1.00
TAB LE I-3 – RJ DES I G N HER I TAG E FACTOR S Low Most Likely High
2024 2034 2024 2034 2024 2034 E M A E M A E M A E M A E M A E M A
Air Vehicle Ai rframe Integ.
Ai rframe Fuselage 0.49 0.62 0.62 0.68 0.68 0.65 0.55 0.70 0.72 0.74 0.76 1.00 0.65 0.90 1.00 0.84 0.96 1.00
Wing
Structure Box 0.56 0.67 0.72 0.72 0.78 0.79 0.62 0.75 0.82 0.78 0.86 1.00 0.72 0.95 1.00 0.88 1.00 1.00 Flaps 0.40 0.62 0.63 0.70 0.70 0.68 0.46 0.70 0.73 0.76 0.78 1.00 0.56 0.90 1.00 0.86 0.98 1.00
Slats 0.40 0.57 0.56 0.62 0.62 0.59 0.46 0.65 0.66 0.68 0.70 1.00 0.56 0.85 0.96 0.78 0.90 1.00
Spoi lers 0.40 0.54 0.56 0.62 0.62 0.59 0.46 0.62 0.66 0.68 0.70 1.00 0.56 0.82 0.96 0.78 0.90 1.00
Ai lerons 0.40 0.54 0.56 0.62 0.62 0.59 0.46 0.62 0.66 0.68 0.70 1.00 0.56 0.82 0.96 0.78 0.90 1.00
Winglets 0.04 0.57 0.56 0.62 0.62 0.59 0.10 0.65 0.66 0.68 0.70 1.00 0.20 0.85 0.96 0.78 0.90 1.00
Empennage
Stabilizer 0.49 0.62 0.62 0.68 0.68 0.65 0.55 0.70 0.72 0.74 0.76 1.00 0.65 0.90 1.00 0.84 0.96 1.00
Fin 0.49 0.62 0.62 0.68 0.68 0.65 0.55 0.70 0.72 0.74 0.76 1.00 0.65 0.90 1.00 0.84 0.96 1.00 Landing Gear 0.04 0.30 0.28 0.37 0.40 0.38 0.10 0.38 0.38 0.43 0.48 1.00 0.20 0.58 0.68 0.53 0.68 1.00

AVIATION FUEL EFFICIENCY TECHNOLOGY ASSESSMENT —APPENDICES TECOLOTE RESEARCH
PG I-3
Low Most Likely High
2024 2034 2024 2034 2024 2034 E M A E M A E M A E M A E M A E M A
Propulsion Engine
Core 1.00 1.00 1.00 1.00 1.00 1.00 1.00 1.00 1.00 1.00 1.00 1.00 1.00 1.00 1.00 1.00 1.00 1.00 Pylon 0.14 0.18 0.16 0.25 0.23 0.21 0.20 0.26 0.26 0.31 0.31 1.00 0.30 0.46 0.56 0.41 0.51 1.00 Nacelle 0.56 0.62 0.65 0.72 0.71 0.68 0.62 0.70 0.75 0.78 0.79 1.00 0.72 0.90 1.00 0.88 0.99 1.00
Fuel System 0.18 0.18 0.18 0.32 0.32 0.90 0.20 0.20 0.20 0.36 0.36 1.00 0.24 0.24 0.24 0.43 0.43 1.00
Systems
Aux Power Unit 0.18 0.18 0.18 0.32 0.32 0.90 0.20 0.20 0.20 0.36 0.36 1.00 0.24 0.24 0.24 0.43 0.43 1.00 Surface Controls 0.34 0.44 0.43 0.55 0.54 0.52 0.40 0.52 0.53 0.61 0.62 1.00 0.50 0.72 0.83 0.71 0.82 1.00
Hydraulics 0.18 0.18 0.18 0.32 0.32 0.90 0.20 0.20 0.20 0.36 0.36 1.00 0.24 0.24 0.24 0.43 0.43 1.00
Electrical 0.34 0.32 0.30 0.42 0.40 0.38 0.40 0.40 0.40 0.48 0.48 1.00 0.50 0.60 0.70 0.58 0.68 1.00 Furnishings 0.04 0.20 0.18 0.24 0.22 0.20 0.10 0.28 0.28 0.30 0.30 1.00 0.20 0.48 0.58 0.40 0.50 1.00
Ai r Conditioning 0.18 0.18 0.18 0.32 0.32 0.90 0.20 0.20 0.20 0.36 0.36 1.00 0.24 0.24 0.24 0.43 0.43 1.00
Avionics 0.34 0.32 0.30 0.42 0.40 0.38 0.40 0.40 0.40 0.48 0.48 1.00 0.50 0.60 0.70 0.58 0.68 1.00
Misc Systems 0.18 0.18 0.18 0.32 0.32 0.90 0.20 0.20 0.20 0.36 0.36 1.00 0.24 0.24 0.24 0.43 0.43 1.00

AVIATION FUEL EFFICIENCY TECHNOLOGY ASSESSMENT —APPENDICES TECOLOTE RESEARCH
PG J-1
APPENDIX J—Development Complexity Factors
For this study, Development Complexity Factors were used to scale the relative effort required as compared
to the level required for the reference aircraft. These tables show the overall composite effect on each
subsystem based on the underlying technologies employed for the deployment scenario. These factors were
determined by the SMEs. As the model is probabilistic based, these parameters represent the triangular
distribution (low, most likely, high values).
TAB LE J-1 – SA DEVELOPMENT COMPLEXI TY FACTOR S Low Most Likely High 2024 2034 2024 2034 2024 2034 E M A E M A E M A E M A E M A E M A
Air Vehicle Ai rframe Integ. 0.90 1.29 1.40 1.34 1.43 1.57 1.00 1.43 1.55 1.49 1.59 1.74 1.10 1.72 2.02 1.64 1.91 2.26
Airframe
Fuselage 1.70 2.89 3.10 2.89 3.10 3.27 2.00 3.40 3.65 3.40 3.65 3.85 2.50 4.42 4.93 4.25 4.75 5.20
Wing Structure Box 2.47 3.66 4.38 3.66 4.51 5.79 2.90 4.30 5.15 4.30 5.30 6.81 3.63 5.59 6.95 5.38 6.89 9.19
Flaps 2.04 3.06 3.44 3.44 3.66 4.29 2.40 3.60 4.05 4.05 4.30 5.05 3.00 4.68 5.47 5.06 5.59 6.82 Slats 1.66 2.68 2.76 2.85 2.93 3.10 1.95 3.15 3.25 3.35 3.45 3.65 2.44 4.10 4.39 4.19 4.49 4.93 Spoi lers 1.66 2.47 2.76 2.85 2.93 3.10 1.95 2.90 3.25 3.35 3.45 3.65 2.44 3.77 4.39 4.19 4.49 4.93
Ai lerons 2.04 2.85 3.15 3.23 3.32 3.91 2.40 3.35 3.70 3.80 3.90 4.60 3.00 4.36 5.00 4.75 5.07 6.21 Winglets 1.06 2.68 2.76 2.68 2.76 2.93 1.25 3.15 3.25 3.15 3.25 3.45 1.56 4.10 4.39 3.94 4.23 4.66
Empennage
Stabilizer 1.66 3.19 3.61 3.36 3.66 3.70 1.95 3.75 4.25 3.95 4.30 4.35 2.44 4.88 5.74 4.94 5.59 5.87
Fin 1.66 3.19 3.61 3.36 3.66 3.70 1.95 3.75 4.25 3.95 4.30 4.35 2.44 4.88 5.74 4.94 5.59 5.87 Landing Gear 1.06 1.70 1.70 1.49 1.70 1.70 1.25 2.00 2.00 1.75 2.00 2.00 1.56 2.60 2.70 2.19 2.60 2.70
Propulsion
Engine Core 1.02 1.19 1.53 1.15 1.53 2.21 1.20 1.40 1.80 1.35 1.80 2.60 1.50 1.82 2.43 1.69 2.34 3.51
Pylon 1.49 1.96 1.96 1.96 1.96 1.96 1.75 2.30 2.30 2.30 2.30 2.30 2.19 2.99 3.11 2.88 2.99 3.11
Nacelle 1.93 2.66 3.08 3.04 3.15 3.36 2.28 3.13 3.63 3.58 3.70 3.95 2.84 4.06 4.89 4.47 4.81 5.33
Fuel System 1.00 1.00 1.00 1.00 1.00 1.00 1.00 1.00 1.00 1.00 1.00 1.00 1.00 1.00 1.00 1.00 1.00 1.00 Systems
Aux Power Unit 1.00 1.00 1.00 1.00 1.00 1.00 1.00 1.00 1.00 1.00 1.00 1.00 1.00 1.00 1.00 1.00 1.00 1.00
Surface Controls 2.10 2.75 2.85 2.75 2.95 3.40 2.25 2.90 3.00 2.90 3.10 3.55 2.50 3.15 3.25 3.15 3.35 3.80 Hydraulics 1.00 1.00 1.00 1.00 1.00 1.00 1.00 1.00 1.00 1.00 1.00 1.00 1.00 1.00 1.00 1.00 1.00 1.00
Electrical 1.30 1.30 1.30 1.30 1.30 1.30 1.45 1.45 1.45 1.45 1.45 1.45 1.70 1.70 1.70 1.70 1.70 1.70 Furnishings 1.00 0.95 0.95 0.95 1.05 1.10 1.00 1.10 1.10 1.10 1.20 1.25 1.00 1.35 1.35 1.35 1.45 1.50
Ai r Conditioning 1.00 1.00 1.00 1.00 1.00 1.00 1.00 1.00 1.00 1.00 1.00 1.00 1.00 1.00 1.00 1.00 1.00 1.00
Avionics 1.30 1.30 1.30 1.30 1.30 1.30 1.45 1.45 1.45 1.45 1.45 1.45 1.70 1.70 1.70 1.70 1.70 1.70 Misc Systems 1.00 1.00 1.00 1.00 1.00 1.00 1.00 1.00 1.00 1.00 1.00 1.00 1.00 1.00 1.00 1.00 1.00 1.00

AVIATION FUEL EFFICIENCY TECHNOLOGY ASSESSMENT —APPENDICES TECOLOTE RESEARCH
PG J-2
TAB LE J-2 – STA DEVELOPMENT COMPLEXI TY FACTOR S Low Most Likely High 2024 2034 2024 2034 2024 2034
E M A E M A E M A E M A E M A E M A
Air Vehicle
Ai rframe Integ. 0.90 1.27 1.46 1.35 1.49 1.62 1.00 1.41 1.62 1.50 1.66 1.80 1.10 1.69 2.11 1.64 1.99 2.34 Airframe
Fuselage 1.70 2.72 3.10 2.89 3.10 3.27 2.00 3.20 3.65 3.40 3.65 3.85 2.50 4.16 4.93 4.25 4.93 5.20
Wing Structure Box 2.08 3.36 4.42 3.53 4.55 5.79 2.45 3.95 5.20 4.15 5.35 6.81 3.06 5.14 7.02 5.19 7.22 9.19
Flaps 2.04 2.89 3.57 3.23 3.78 4.42 2.40 3.40 4.20 3.80 4.45 5.20 3.00 4.42 5.67 4.75 6.01 7.02 Slats 1.66 2.51 2.89 2.85 3.06 3.23 1.95 2.95 3.40 3.35 3.60 3.80 2.44 3.84 4.59 4.19 4.86 5.13
Spoi lers 1.66 2.30 2.89 2.64 3.06 3.23 1.95 2.70 3.40 3.10 3.60 3.80 2.44 3.51 4.59 3.88 4.86 5.13
Ai lerons 2.04 2.68 3.27 3.02 3.44 4.04 2.40 3.15 3.85 3.55 4.05 4.75 3.00 4.10 5.20 4.44 5.47 6.41 Winglets 1.19 2.64 2.76 2.68 2.76 2.93 1.40 3.10 3.25 3.15 3.25 3.45 1.75 4.03 4.39 3.94 4.39 4.66
Empennage
Stabilizer 1.66 3.02 3.74 3.36 3.78 3.83 1.95 3.55 4.40 3.95 4.45 4.50 2.44 4.62 5.94 4.94 6.01 6.08
Fin 1.66 3.02 3.74 3.36 3.78 3.83 1.95 3.55 4.40 3.95 4.45 4.50 2.44 4.62 5.94 4.94 6.01 6.08 Landing Gear 1.06 1.70 1.83 1.49 1.83 1.83 1.25 2.00 2.15 1.75 2.15 2.15 1.56 2.60 2.90 2.19 2.90 2.90
Propulsion Engine Core 1.02 1.15 1.62 1.15 1.62 1.96 1.20 1.35 1.90 1.35 1.90 2.30 1.50 1.76 2.57 1.69 2.57 3.11
Pylon 1.49 1.96 1.96 1.96 1.96 1.96 1.75 2.30 2.30 2.30 2.30 2.30 2.19 2.99 3.11 2.88 3.11 3.11 Nacelle 1.93 2.66 3.08 3.04 3.15 3.36 2.28 3.13 3.63 3.58 3.70 3.95 2.84 4.06 4.89 4.47 5.00 5.33
Fuel System 1.00 1.00 1.00 1.00 1.00 1.00 1.00 1.00 1.00 1.00 1.00 1.00 1.00 1.00 1.00 1.00 1.00 1.00 Systems
Aux Power Unit 1.00 1.00 1.00 1.00 1.00 1.00 1.00 1.00 1.00 1.00 1.00 1.00 1.00 1.00 1.00 1.00 1.00 1.00 Surface Controls 1.65 2.75 2.55 2.47 2.64 3.02 1.80 2.90 3.00 2.90 3.10 3.55 2.05 3.15 4.05 3.63 4.19 4.79
Hydraulics 1.00 1.00 1.00 1.00 1.00 1.00 1.00 1.00 1.00 1.00 1.00 1.00 1.00 1.00 1.00 1.00 1.00 1.00
Electrical 1.30 1.30 1.23 1.23 1.23 1.23 1.45 1.45 1.45 1.45 1.45 1.45 1.70 1.70 1.96 1.81 1.96 1.96 Furnishings 1.00 0.95 0.94 0.94 1.02 1.06 1.00 1.10 1.10 1.10 1.20 1.25 1.00 1.35 1.49 1.38 1.62 1.69
Ai r Conditioning 1.00 1.00 1.00 1.00 1.00 1.00 1.00 1.00 1.00 1.00 1.00 1.00 1.00 1.00 1.00 1.00 1.00 1.00
Avionics 1.30 1.30 1.30 1.23 1.23 1.23 1.45 1.45 1.45 1.45 1.45 1.45 1.70 1.70 1.70 1.81 1.96 1.96
Misc Systems 1.00 1.00 1.00 1.00 1.00 1.00 1.00 1.00 1.00 1.00 1.00 1.00 1.00 1.00 1.00 1.00 1.00 1.00
TAB LE J-3 – RJ DEVELOPMENT COMPLEXI TY FACTOR S Low Most Likely High
2024 2034 2024 2034 2024 2034 E M A E M A E M A E M A E M A E M A
Air Vehicle
Ai rframe Integ. 0.90 1.25 1.35 1.27 1.36 1.45 1.00 1.39 1.50 1.41 1.51 1.61 1.10 1.66 1.95 1.55 1.81 2.09 Airframe
Fuselage 1.70 2.72 2.93 2.72 2.93 3.10 2.00 3.20 3.45 3.20 3.45 3.65 2.50 4.16 4.66 4.00 4.66 5.11
Wing
Structure Box 2.25 3.27 3.95 3.27 3.95 4.94 2.65 3.85 4.65 3.85 4.65 5.81 3.31 5.01 6.28 4.81 6.28 8.13 Flaps 1.66 2.68 3.06 2.89 3.10 3.32 1.95 3.15 3.60 3.40 3.65 3.90 2.44 4.10 4.86 4.25 4.93 5.46
Slats 1.66 2.68 2.76 2.68 2.76 2.93 1.95 3.15 3.25 3.15 3.25 3.45 2.44 4.10 4.39 3.94 4.39 4.83 Spoi lers 1.66 2.47 2.76 2.68 2.76 2.93 1.95 2.90 3.25 3.15 3.25 3.45 2.44 3.77 4.39 3.94 4.39 4.83 Ai lerons 1.66 2.47 2.76 2.68 2.76 2.93 1.95 2.90 3.25 3.15 3.25 3.45 2.44 3.77 4.39 3.94 4.39 4.83
Winglets 1.06 2.68 2.76 2.68 2.76 2.93 1.25 3.15 3.25 3.15 3.25 3.45 1.56 4.10 4.39 3.94 4.39 4.83
Empennage
Stabilizer 1.66 2.68 2.89 2.68 2.89 2.89 1.95 3.15 3.40 3.15 3.40 3.40 2.44 4.10 4.59 3.94 4.59 4.76
Fin 1.66 2.68 2.89 2.68 2.89 2.89 1.95 3.15 3.40 3.15 3.40 3.40 2.44 4.10 4.59 3.94 4.59 4.76
Landing Gear 1.06 1.53 1.53 1.32 1.53 1.53 1.25 1.80 1.80 1.55 1.80 1.80 1.56 2.34 2.43 1.94 2.43 2.52

AVIATION FUEL EFFICIENCY TECHNOLOGY ASSESSMENT —APPENDICES TECOLOTE RESEARCH
PG J-3
Low Most Likely High
2024 2034 2024 2034 2024 2034 E M A E M A E M A E M A E M A E M A
Propulsion Engine 1.00 1.00 1.00 1.00 1.00 1.00 1.00 1.00 1.00 1.00 1.00 1.00 1.00 1.00 1.00 1.00 1.00 1.00
Core 1.02 1.19 1.53 1.15 1.53 2.21 1.20 1.40 1.80 1.35 1.80 2.60 1.50 1.82 2.43 1.69 2.43 3.64 Pylon 1.49 1.79 1.79 1.79 1.79 1.79 1.75 2.10 2.10 2.10 2.10 2.10 2.19 2.73 2.84 2.63 2.84 2.94 Nacelle 1.93 2.66 3.08 3.04 3.15 3.36 2.28 3.13 3.63 3.58 3.70 3.95 2.84 4.06 4.89 4.47 5.00 5.53
Fuel System 1.00 1.00 1.00 1.00 1.00 1.00 1.00 1.00 1.00 1.00 1.00 1.00 1.00 1.00 1.00 1.00 1.00 1.00 Systems
Aux Power Unit 1.00 1.00 1.00 1.00 1.00 1.00 1.00 1.00 1.00 1.00 1.00 1.00 1.00 1.00 1.00 1.00 1.00 1.00 Surface Controls 1.30 1.55 1.65 1.55 1.70 1.75 1.45 1.70 1.80 1.70 1.85 1.90 1.70 1.95 2.05 1.95 2.10 2.15
Hydraulics 1.00 1.00 1.00 1.00 1.00 1.00 1.00 1.00 1.00 1.00 1.00 1.00 1.00 1.00 1.00 1.00 1.00 1.00 Electrical 1.30 1.30 1.30 1.30 1.30 1.30 1.45 1.45 1.45 1.45 1.45 1.45 1.70 1.70 1.70 1.70 1.70 1.70 Furnishings 1.00 0.95 0.95 0.95 1.05 1.10 1.00 1.10 1.10 1.10 1.20 1.25 1.00 1.35 1.35 1.35 1.45 1.50
Ai r Conditioning 1.00 1.00 1.00 1.00 1.00 1.00 1.00 1.00 1.00 1.00 1.00 1.00 1.00 1.00 1.00 1.00 1.00 1.00 Avionics 1.30 1.30 1.30 1.30 1.30 1.30 1.45 1.45 1.45 1.45 1.45 1.45 1.70 1.70 1.70 1.70 1.70 1.70
Misc Systems 1.00 1.00 1.00 1.00 1.00 1.00 1.00 1.00 1.00 1.00 1.00 1.00 1.00 1.00 1.00 1.00 1.00 1.00
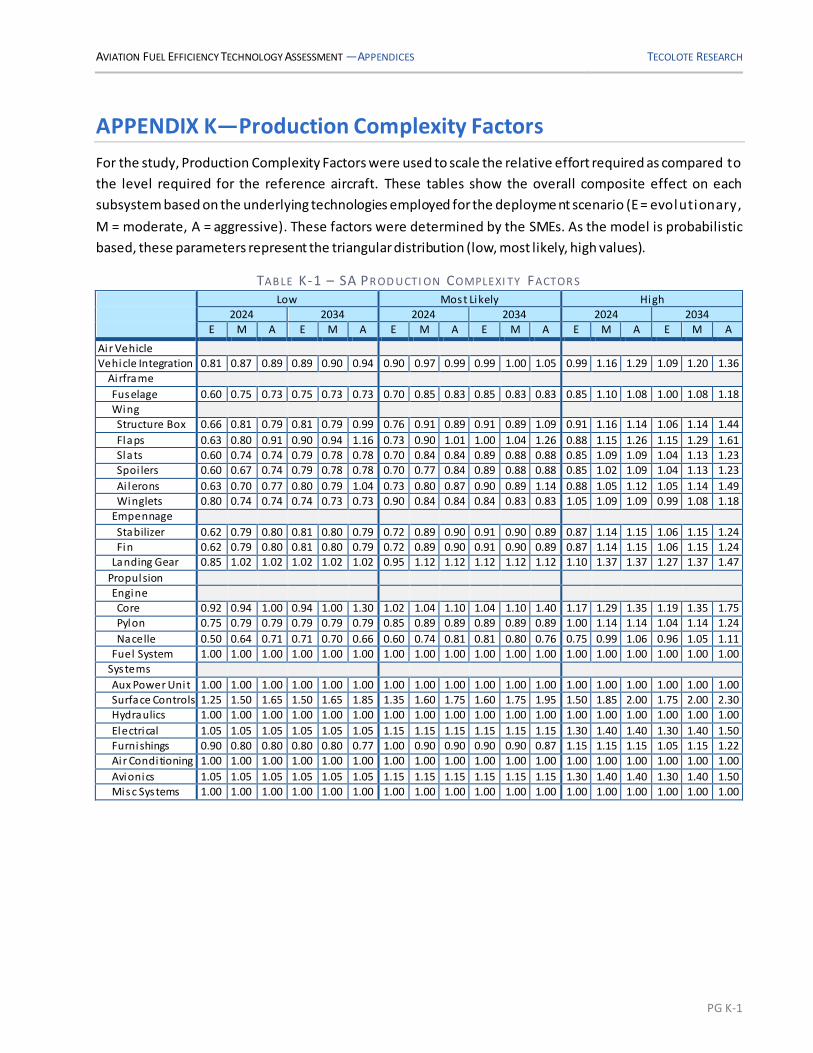
AVIATION FUEL EFFICIENCY TECHNOLOGY ASSESSMENT —APPENDICES TECOLOTE RESEARCH
PG K-1
APPENDIX K—Production Complexity Factors
For the study, Production Complexity Factors were used to scale the relative effort required as compared to
the level required for the reference aircraft. These tables show the overall composite effect on each
subsystem based on the underlying technologies employed for the deployme nt scenario (E = evolutionary,
M = moderate, A = aggressive). These factors were determined by the SMEs. As the model is probabilistic
based, these parameters represent the triangular distribution (low, most likely, high values).
TAB LE K-1 – SA PR OD UCTI ON COMPLEXI TY FACTOR S Low Most Likely High 2024 2034 2024 2034 2024 2034 E M A E M A E M A E M A E M A E M A
Air Vehicle Vehicle Integration 0.81 0.87 0.89 0.89 0.90 0.94 0.90 0.97 0.99 0.99 1.00 1.05 0.99 1.16 1.29 1.09 1.20 1.36
Airframe
Fuselage 0.60 0.75 0.73 0.75 0.73 0.73 0.70 0.85 0.83 0.85 0.83 0.83 0.85 1.10 1.08 1.00 1.08 1.18
Wing Structure Box 0.66 0.81 0.79 0.81 0.79 0.99 0.76 0.91 0.89 0.91 0.89 1.09 0.91 1.16 1.14 1.06 1.14 1.44
Flaps 0.63 0.80 0.91 0.90 0.94 1.16 0.73 0.90 1.01 1.00 1.04 1.26 0.88 1.15 1.26 1.15 1.29 1.61 Slats 0.60 0.74 0.74 0.79 0.78 0.78 0.70 0.84 0.84 0.89 0.88 0.88 0.85 1.09 1.09 1.04 1.13 1.23 Spoi lers 0.60 0.67 0.74 0.79 0.78 0.78 0.70 0.77 0.84 0.89 0.88 0.88 0.85 1.02 1.09 1.04 1.13 1.23
Ai lerons 0.63 0.70 0.77 0.80 0.79 1.04 0.73 0.80 0.87 0.90 0.89 1.14 0.88 1.05 1.12 1.05 1.14 1.49 Winglets 0.80 0.74 0.74 0.74 0.73 0.73 0.90 0.84 0.84 0.84 0.83 0.83 1.05 1.09 1.09 0.99 1.08 1.18
Empennage
Stabilizer 0.62 0.79 0.80 0.81 0.80 0.79 0.72 0.89 0.90 0.91 0.90 0.89 0.87 1.14 1.15 1.06 1.15 1.24
Fin 0.62 0.79 0.80 0.81 0.80 0.79 0.72 0.89 0.90 0.91 0.90 0.89 0.87 1.14 1.15 1.06 1.15 1.24 Landing Gear 0.85 1.02 1.02 1.02 1.02 1.02 0.95 1.12 1.12 1.12 1.12 1.12 1.10 1.37 1.37 1.27 1.37 1.47
Propulsion
Engine Core 0.92 0.94 1.00 0.94 1.00 1.30 1.02 1.04 1.10 1.04 1.10 1.40 1.17 1.29 1.35 1.19 1.35 1.75
Pylon 0.75 0.79 0.79 0.79 0.79 0.79 0.85 0.89 0.89 0.89 0.89 0.89 1.00 1.14 1.14 1.04 1.14 1.24
Nacelle 0.50 0.64 0.71 0.71 0.70 0.66 0.60 0.74 0.81 0.81 0.80 0.76 0.75 0.99 1.06 0.96 1.05 1.11
Fuel System 1.00 1.00 1.00 1.00 1.00 1.00 1.00 1.00 1.00 1.00 1.00 1.00 1.00 1.00 1.00 1.00 1.00 1.00 Systems
Aux Power Unit 1.00 1.00 1.00 1.00 1.00 1.00 1.00 1.00 1.00 1.00 1.00 1.00 1.00 1.00 1.00 1.00 1.00 1.00
Surface Controls 1.25 1.50 1.65 1.50 1.65 1.85 1.35 1.60 1.75 1.60 1.75 1.95 1.50 1.85 2.00 1.75 2.00 2.30 Hydraulics 1.00 1.00 1.00 1.00 1.00 1.00 1.00 1.00 1.00 1.00 1.00 1.00 1.00 1.00 1.00 1.00 1.00 1.00
Electrical 1.05 1.05 1.05 1.05 1.05 1.05 1.15 1.15 1.15 1.15 1.15 1.15 1.30 1.40 1.40 1.30 1.40 1.50 Furnishings 0.90 0.80 0.80 0.80 0.80 0.77 1.00 0.90 0.90 0.90 0.90 0.87 1.15 1.15 1.15 1.05 1.15 1.22
Ai r Conditioning 1.00 1.00 1.00 1.00 1.00 1.00 1.00 1.00 1.00 1.00 1.00 1.00 1.00 1.00 1.00 1.00 1.00 1.00
Avionics 1.05 1.05 1.05 1.05 1.05 1.05 1.15 1.15 1.15 1.15 1.15 1.15 1.30 1.40 1.40 1.30 1.40 1.50 Misc Systems 1.00 1.00 1.00 1.00 1.00 1.00 1.00 1.00 1.00 1.00 1.00 1.00 1.00 1.00 1.00 1.00 1.00 1.00

AVIATION FUEL EFFICIENCY TECHNOLOGY ASSESSMENT —APPENDICES TECOLOTE RESEARCH
PG K-2
TAB LE K-2 – STA PR OD UCTI ON COMPLEXI TY FACTOR S Low Most Likely High 2024 2034 2024 2034 2024 2034
E M A E M A E M A E M A E M A E M A
Air Vehicle
Vehicle Integration 0.80 0.87 0.91 0.88 0.92 0.98 0.89 0.97 1.01 0.98 1.03 1.09 0.98 1.16 1.31 1.08 1.23 1.42
Airframe
Fuselage 0.60 0.75 0.74 0.75 0.76 0.79 0.70 0.85 0.84 0.85 0.86 0.89 0.85 1.10 1.19 1.00 1.11 1.24 Wing
Structure Box 0.63 0.79 0.94 0.79 1.00 1.24 0.73 0.89 1.04 0.89 1.10 1.34 0.88 1.14 1.39 1.04 1.35 1.69
Flaps 0.63 0.80 0.95 0.83 0.99 1.31 0.73 0.90 1.05 0.93 1.09 1.41 0.88 1.15 1.40 1.08 1.34 1.76 Slats 0.60 0.74 0.77 0.79 0.83 0.85 0.70 0.84 0.87 0.89 0.93 0.95 0.85 1.09 1.22 1.04 1.18 1.30
Spoi lers 0.60 0.67 0.77 0.72 0.83 0.85 0.70 0.77 0.87 0.82 0.93 0.95 0.85 1.02 1.22 0.97 1.18 1.30
Ai lerons 0.63 0.70 0.80 0.73 0.84 1.11 0.73 0.80 0.90 0.83 0.94 1.21 0.88 1.05 1.25 0.98 1.19 1.56
Winglets 0.81 0.75 0.75 0.74 0.76 0.78 0.91 0.85 0.85 0.84 0.86 0.88 1.06 1.10 1.20 0.99 1.11 1.23 Empennage
Stabilizer 0.62 0.79 0.83 0.81 0.85 0.87 0.72 0.89 0.93 0.91 0.95 0.97 0.87 1.14 1.28 1.06 1.20 1.32
Fin 0.62 0.79 0.83 0.81 0.85 0.87 0.72 0.89 0.93 0.91 0.95 0.97 0.87 1.14 1.28 1.06 1.20 1.32 Landing Gear 0.85 1.02 1.04 1.02 1.06 1.05 0.95 1.12 1.14 1.12 1.16 1.15 1.10 1.37 1.49 1.27 1.41 1.50
Propulsion Engine
Core 0.92 0.94 1.00 0.95 1.00 1.30 1.02 1.00 1.10 1.05 1.10 1.40 1.17 1.29 1.45 1.20 1.35 1.75
Pylon 0.75 0.79 0.79 0.79 0.80 0.80 0.85 0.89 0.89 0.89 0.90 0.90 1.00 1.14 1.24 1.04 1.15 1.25 Nacelle 0.50 0.64 0.72 0.71 0.71 0.74 0.60 0.74 0.82 0.81 0.81 0.84 0.75 0.99 1.17 0.96 1.06 1.19
Fuel System 1.00 1.00 1.00 1.00 1.00 1.00 1.00 1.00 1.00 1.00 1.00 1.00 1.00 1.00 1.00 1.00 1.00 1.00
Systems
Aux Power Unit 1.00 1.00 1.00 1.00 1.00 1.00 1.00 1.00 1.00 1.00 1.00 1.00 1.00 1.00 1.00 1.00 1.00 1.00 Surface Controls 1.15 1.50 1.65 1.50 1.65 1.85 1.25 1.60 1.75 1.60 1.75 1.95 1.40 1.85 2.10 1.75 2.00 2.30
Hydraulics 1.00 1.00 1.00 1.00 1.00 1.00 1.00 1.00 1.00 1.00 1.00 1.00 1.00 1.00 1.00 1.00 1.00 1.00
Electrical 1.05 1.05 1.05 1.05 1.05 1.05 1.15 1.15 1.15 1.15 1.15 1.15 1.30 1.40 1.50 1.30 1.40 1.50 Furnishings 0.90 0.80 0.80 0.80 0.80 0.80 1.00 0.90 0.90 0.90 0.90 0.90 1.15 1.15 1.25 1.05 1.15 1.25
Ai r Conditioning 1.00 1.00 1.00 1.00 1.00 1.00 1.00 1.00 1.00 1.00 1.00 1.00 1.00 1.00 1.00 1.00 1.00 1.00
Avionics 1.05 1.05 1.05 1.05 1.05 1.05 1.15 1.15 1.15 1.15 1.15 1.15 1.30 1.40 1.50 1.30 1.40 1.50
Misc Systems 1.00 1.00 1.00 1.00 1.00 1.00 1.00 1.00 1.00 1.00 1.00 1.00 1.00 1.00 1.00 1.00 1.00 1.00
TAB LE K-3 – RJ PR OD UCTI ON COMPLEXI TY FACTOR S Low Most Likely High
2024 2034 2024 2034 2024 2034 E M A E M A E M A E M A E M A E M A
Air Vehicle Vehicle Integration 0.81 0.86 0.88 0.88 0.89 0.90 0.90 0.96 0.98 0.97 0.99 1.00 0.99 1.15 1.27 1.07 1.19 1.30 Airframe
Fuselage 0.60 0.74 0.72 0.74 0.75 0.75 0.70 0.84 0.82 0.84 0.85 0.85 0.85 1.09 1.17 0.99 1.15 1.25 Wing
Structure Box 0.66 0.80 0.78 0.80 0.81 0.76 0.76 0.90 0.88 0.90 0.91 0.86 0.91 1.15 1.23 1.05 1.21 1.26 Flaps 0.60 0.77 0.88 0.84 0.91 0.88 0.70 0.87 0.98 0.94 1.01 0.98 0.85 1.12 1.33 1.09 1.31 1.38
Slats 0.60 0.74 0.74 0.74 0.76 0.76 0.70 0.84 0.84 0.84 0.86 0.86 0.85 1.09 1.19 0.99 1.16 1.26 Spoi lers 0.60 0.67 0.74 0.74 0.76 0.76 0.70 0.77 0.84 0.84 0.86 0.86 0.85 1.02 1.19 0.99 1.16 1.26 Ai lerons 0.60 0.67 0.74 0.74 0.76 0.76 0.70 0.77 0.84 0.84 0.86 0.86 0.85 1.02 1.19 0.99 1.16 1.26
Winglets 0.80 0.74 0.74 0.74 0.76 0.76 0.90 0.84 0.84 0.84 0.86 0.86 1.05 1.09 1.19 0.99 1.16 1.26
Empennage
Stabilizer 0.62 0.74 0.73 0.74 0.76 0.75 0.72 0.84 0.83 0.84 0.86 0.85 0.87 1.09 1.18 0.99 1.16 1.25
Fin 0.62 0.74 0.73 0.74 0.76 0.75 0.72 0.84 0.83 0.84 0.86 0.85 0.87 1.09 1.18 0.99 1.16 1.25
Landing Gear 0.85 1.00 1.00 1.00 1.01 1.01 0.95 1.10 1.10 1.10 1.11 1.11 1.10 1.35 1.45 1.25 1.41 1.51

AVIATION FUEL EFFICIENCY TECHNOLOGY ASSESSMENT —APPENDICES TECOLOTE RESEARCH
PG K-3
Low Most Likely High
2024 2034 2024 2034 2024 2034 E M A E M A E M A E M A E M A E M A
Propulsion Engine
Core 0.92 0.94 1.00 0.94 1.00 1.30 1.02 1.04 1.10 1.04 1.10 1.40 1.17 1.29 1.45 1.19 1.40 1.80 Pylon 0.75 0.77 0.77 0.77 0.78 0.78 0.85 0.87 0.87 0.87 0.88 0.88 1.00 1.12 1.22 1.02 1.18 1.28 Nacelle 0.50 0.64 0.71 0.71 0.73 0.69 0.60 0.74 0.81 0.81 0.83 0.79 0.75 0.99 1.16 0.96 1.13 1.19
Fuel System 1.00 1.00 1.00 1.00 1.00 1.00 1.00 1.00 1.00 1.00 1.00 1.00 1.00 1.00 1.00 1.00 1.00 1.00 Systems
Aux Power Unit 1.00 1.00 1.00 1.00 1.00 1.00 1.00 1.00 1.00 1.00 1.00 1.00 1.00 1.00 1.00 1.00 1.00 1.00 Surface Controls 1.05 1.20 1.25 1.20 1.25 1.30 1.15 1.30 1.35 1.30 1.35 1.40 1.30 1.55 1.70 1.45 1.65 1.80
Hydraulics 1.00 1.00 1.00 1.00 1.00 1.00 1.00 1.00 1.00 1.00 1.00 1.00 1.00 1.00 1.00 1.00 1.00 1.00 Electrical 1.05 1.05 1.05 1.05 1.05 1.05 1.15 1.15 1.15 1.15 1.15 1.15 1.30 1.40 1.50 1.30 1.45 1.55 Furnishings 0.90 0.80 0.80 0.80 0.80 0.77 1.00 0.90 0.90 0.90 0.90 0.87 1.15 1.15 1.25 1.05 1.20 1.27
Ai r Conditioning 1.00 1.00 1.00 1.00 1.00 1.00 1.00 1.00 1.00 1.00 1.00 1.00 1.00 1.00 1.00 1.00 1.00 1.00 Avionics 1.05 1.05 1.05 1.05 1.05 1.05 1.15 1.15 1.15 1.15 1.15 1.15 1.30 1.40 1.50 1.30 1.45 1.55
Misc Systems 1.00 1.00 1.00 1.00 1.00 1.00 1.00 1.00 1.00 1.00 1.00 1.00 1.00 1.00 1.00 1.00 1.00 1.00

AVIATION FUEL EFFICIENCY TECHNOLOGY ASSESSMENT —APPENDICES TECOLOTE RESEARCH
PG L-1
APPENDIX L—Derivation of Composite Material Fraction for Reference Aircraft
Tables L-1 displays the application of the CMFs at the WBS level for A320-200, 777-200ER, and the Embraer
190AR. Global Express Business Jet. The resulting total structure composite fraction for the A320 is 14.1% ,
the results for the 777-200ER are at 12.1%, the results for E190 are 11.6%. Given that composites are used in
almost all of the same areas on both the A320 and 777-200ER aircraft, the composite percentages are
expected to be close.
input values
TAB LE L-1 – ES TI MATED COMPOS I TE MATER I AL WEI G H T FR ACTI ON WBS A320-200
(SA) comp wt fraction
777-200ER
(STA) comp wt fraction
E190
(RJ) comp wt fraction
Level
1 2 3 4
STRUCTURES 0.141 0.121 0.105 wing group 0.179 0.125 0.142
s truct box 0.1027 0.09029 0.0582
fa i rings 0.80 0.80 0.80
TE panels 0.85 0.85 0.00 MLG doors 0.80 0.80 0.80
J-nose (inboard LE) 0.80 0.00 0.00
center box 0.75 0.00 0.00 ribs 0.75 0.00 0.00
Outer box 0.75 0.00 0.00 other
flaps 0.50 0.50 0.50
s lats 0.50 0.00 0.00 spoilers 0.50 0.50 0.50
a i lerons 0.50 0.50 0.50 winglets 0.60 0.00 0.60
fuselage group 0.0625 0.0594 0.0619 radome 0.90 0.90 0.90
NLG doors 0.80 0.80 0.80
floor beams 0.85 0.85 0.85
keel beam 0.75 0.00 0.00 cross beams 0.75 0.00 0.00
rear pressure bulkhead 0.85 0.00 0.00
rear un-press. fus. 0.75 0.00 0.00 upper skin 0.75 0.00 0.00
ful l skin & frames 0.75 0.00 0.00 ta i l cone 0.85 0.00 0.00
other
ta i l group 0.715 0.715 0.197 Stabilizer 0.7150 0.715 2.35
elevators 0.50 0.50 0.50
LE & TE panels 0.85 0.85 0.85
s truct box (dry) 0.80 0.80 0.00 s truct box (wet) 0.80 0.80 0.00
other
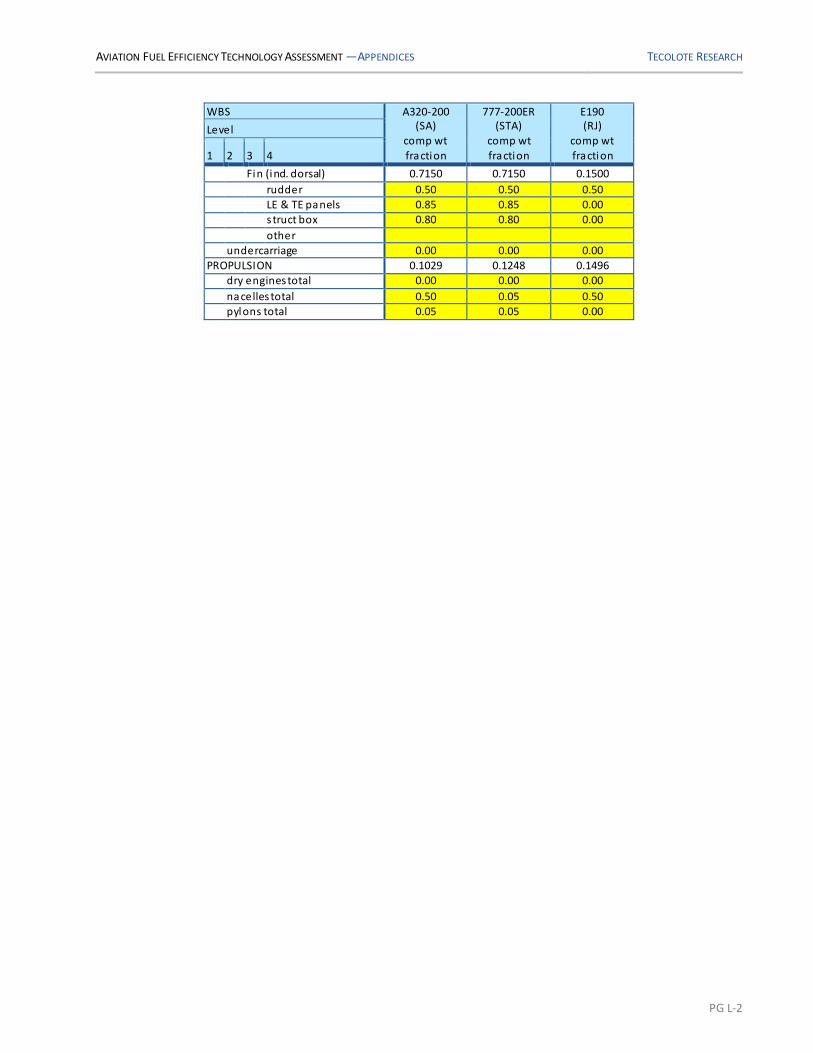
AVIATION FUEL EFFICIENCY TECHNOLOGY ASSESSMENT —APPENDICES TECOLOTE RESEARCH
PG L-2
WBS A320-200 (SA)
comp wt
fraction
777-200ER (STA)
comp wt
fraction
E190 (RJ)
comp wt
fraction
Level
1 2 3 4
Fin (ind. dorsal) 0.7150 0.7150 0.1500
rudder 0.50 0.50 0.50
LE & TE panels 0.85 0.85 0.00 s truct box 0.80 0.80 0.00
other undercarriage 0.00 0.00 0.00
PROPULSION 0.1029 0.1248 0.1496 dry engines total 0.00 0.00 0.00
nacelles total 0.50 0.05 0.50
pylons total 0.05 0.05 0.00

AVIATION FUEL EFFICIENCY TECHNOLOGY ASSESSMENT —APPENDICES TECOLOTE RESEARCH
PG M-1
APPENDIX M—Deployment Scenario Composite Material Fraction
The Aerodynamic & Structures Subject Matter Experts (SME) identified the composite percentage for each
Deployment Scenarios (DS) for the Single Aisle, Small Twin Aisle, and Regional Jet aircraft. The results are
detailed in the tables below. As the model is probabilistic based, these parameters represent the triangular
distribution (low, most likely, high values).
TAB LE M-1 – SA 2024 COMPOS I TE PER CENTAG E 2024 Evolutionary 2024 Stretch 2024 Aggressive
Low
Most Likely High Conf. Low
Most Likely High Conf. Low
Most Likely High Conf.
Air Vehicle
Airframe
Fuselage 83% 85% 87% Med 87% 89% 91% Med 91% 93% 95% Low Wing
Structure Box 92% 94% 96% Med 95% 97% 99% Med 98% 100% 100% High
Flaps 95% 97% 99% Med 98% 100% 100% Med 98% 100% 100% High Slats 95% 97% 99% Med 98% 100% 100% Med 98% 100% 100% High
Spoilers 95% 97% 99% Med 98% 100% 100% Med 98% 100% 100% High
Ailerons 95% 97% 99% Med 98% 100% 100% Med 98% 100% 100% High Winglets 96% 98% 100% Med 98% 100% 100% Med 98% 100% 100% High
Empennage
Stabilizer 95% 97% 99% Med 98% 100% 100% Med 98% 100% 100% High Fin 95% 97% 99% Med 98% 100% 100% Med 98% 100% 100% High
Landing Gear 2% Med 3% 5% 7% Low 6% 8% 10% Low
Propulsion
Engine Nacelle 93% 95% 97% Med 98% 100% 100% Med 98% 100% 100% High
Pylon 10% 12% 14% Med 14% 16% 18% Low 18% 20% 22% Low
Core 20% 25% 30% Med 25% 30% 35% Med 30% 35% 40% Med
TAB LE M-2 – SA 2034 COMPOS I TE PER CENTAG E 2034 Evolutionary 2034 Stretch 2034 Aggressive
Low
Most Likely High Conf. Low
Most Likely High Conf. Low
Most Likely High Conf.
Ai r Vehicle
Ai rframe
Fuselage 97% 99% 100% High 98% 100% 100% High 98% 100% 100% High
Wing Structure Box 97% 99% 100% High 98% 100% 100% High 98% 100% 100% High
Flaps 98% 99% 100% High 98% 100% 100% High 98% 100% 100% High Slats 98% 99% 100% High 98% 100% 100% High 98% 100% 100% High Spoi lers 98% 99% 100% High 98% 100% 100% High 98% 100% 100% High
Ai lerons 98% 99% 100% High 98% 100% 100% High 98% 100% 100% High Winglets 98% 99% 100% High 98% 100% 100% High 98% 100% 100% High
Empennage
Stabilizer 98% 99% 100% High 98% 100% 100% High 98% 100% 100% High
Fin 98% 99% 100% High 98% 100% 100% High 98% 100% 100% High Landing Gear 13% 15% 17% Low 17% 19% 21% Low 21% 23% 25% Low

AVIATION FUEL EFFICIENCY TECHNOLOGY ASSESSMENT —APPENDICES TECOLOTE RESEARCH
PG M-2
2034 Evolutionary 2034 Stretch 2034 Aggressive
Low
Most Likely High Conf. Low
Most Likely High Conf. Low
Most Likely High Conf.
Propulsion
Engine
Nacelle 98% 99% 100% High 98% 100% 100% High 98% 100% 100% High Pylon 23% 25% 27% Low 27% 29% 31% Low 31% 33% 35% Low
Core 20% 25% 30% Med 35% 40% 45% Med 45% 50% 55% Med
TAB LE M-3 – STA 2024 COMPOS I TE PER CENTAG E 2024 Evolutionary 2024 Stretch 2024 Aggressive
Low
Most
Likely High Conf. Low
Most
Likely High Conf. Low
Most
Likely High Conf.
Ai r Vehicle
Ai rframe Fuselage 83% 85% 87% Med 87% 89% 91% Med 91% 93% 95% Low Wing
Structure Box 92% 94% 96% Med 95% 97% 99% Med 98% 100% 100% High Flaps 95% 97% 99% Med 98% 100% 100% Med 98% 100% 100% High
Slats 95% 97% 99% Med 98% 100% 100% Med 98% 100% 100% High
Spoi lers 95% 97% 99% Med 98% 100% 100% Med 98% 100% 100% High
Ai lerons 95% 97% 99% Med 98% 100% 100% Med 98% 100% 100% High Winglets 96% 98% 100% Med 98% 100% 100% High 98% 100% 100% High
Empennage Stabilizer 97% 99% 100% Med 98% 100% 100% High 98% 100% 100% High Fin 97% 99% 100% Med 98% 100% 100% High 98% 100% 100% High
Landing Gear 1% 2% 3% Med 3% 5% 7% Low 6% 8% 10% Low
Propulsion
Engine Nacelle 93% 95% 97% Med 98% 100% 100% Med 98% 100% 100% High
Pylon 10% 12% 14% Med 14% 16% 18% Low 18% 20% 22% Low Core 20% 25% 30% Med 25% 30% 35% Med 30% 25% 40% Med
TAB LE M-4 – STA 2034 COMPOS I TE PER CENTAG E 2034 Evolutionary 2034 Stretch 2034 Aggressive
Low Most Likely High Conf. Low
Most Likely High Conf. Low
Most Likely High Conf.
Ai r Vehicle Ai rframe
Fuselage 97% 100% 100% High 98% 100% 100% High 98% 100% 100% High Wing Structure Box 97% 100% 100% High 98% 100% 100% High 98% 100% 100% High
Flaps 98% 100% 100% High 98% 100% 100% High 98% 100% 100% High
Slats 98% 100% 100% High 98% 100% 100% High 98% 100% 100% High
Spoi lers 98% 100% 100% High 98% 100% 100% High 98% 100% 100% High Ai lerons 98% 100% 100% High 98% 100% 100% High 98% 100% 100% High
Winglets 98% 100% 100% High 98% 100% 100% High 98% 100% 100% High Empennage
Stabilizer 98% 100% 100% High 98% 100% 100% High 98% 100% 100% High
Fin 98% 100% 100% High 98% 100% 100% High 98% 100% 100% High Landing Gear 13% 15% 17% Low 17% 19% 21% Low 21% 23% 25% Low
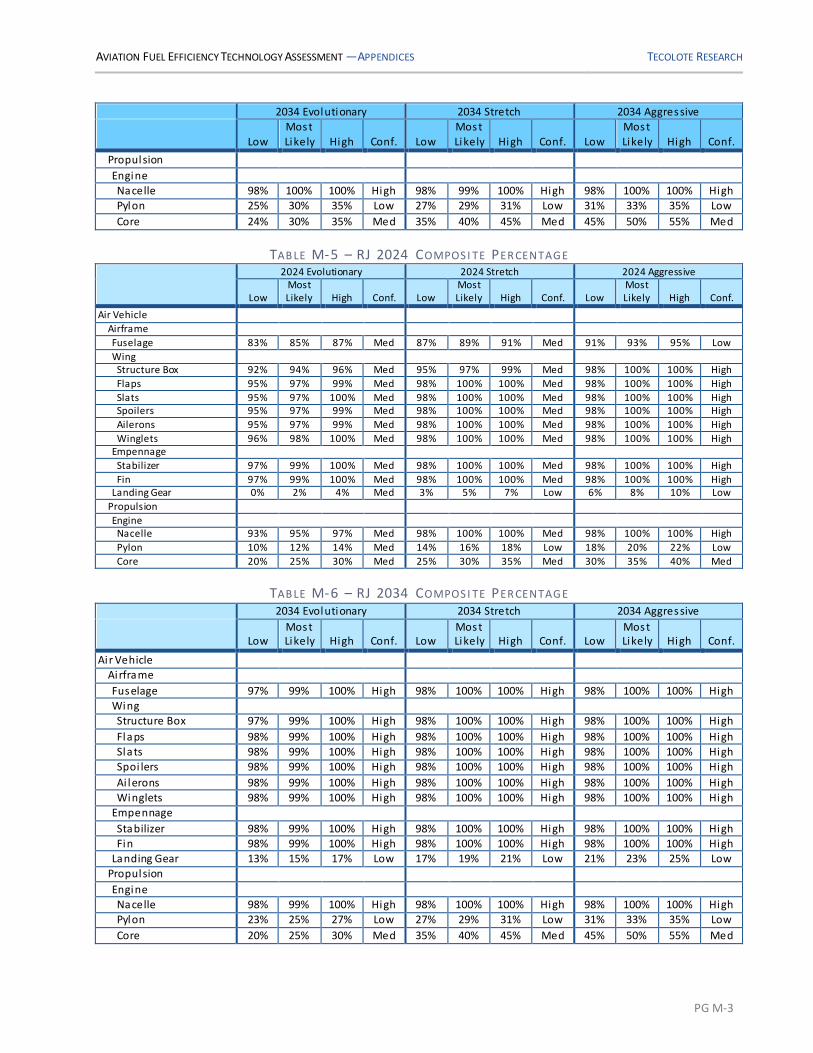
AVIATION FUEL EFFICIENCY TECHNOLOGY ASSESSMENT —APPENDICES TECOLOTE RESEARCH
PG M-3
2034 Evolutionary 2034 Stretch 2034 Aggressive
Low
Most Likely High Conf. Low
Most Likely High Conf. Low
Most Likely High Conf.
Propulsion
Engine
Nacelle 98% 100% 100% High 98% 99% 100% High 98% 100% 100% High Pylon 25% 30% 35% Low 27% 29% 31% Low 31% 33% 35% Low
Core 24% 30% 35% Med 35% 40% 45% Med 45% 50% 55% Med
TAB LE M-5 – RJ 2024 COMPOS I TE PER CENTAG E 2024 Evolutionary 2024 Stretch 2024 Aggressive
Low
Most Likely High Conf. Low
Most Likely High Conf. Low
Most Likely High Conf.
Air Vehicle
Airframe
Fuselage 83% 85% 87% Med 87% 89% 91% Med 91% 93% 95% Low
Wing Structure Box 92% 94% 96% Med 95% 97% 99% Med 98% 100% 100% High
Flaps 95% 97% 99% Med 98% 100% 100% Med 98% 100% 100% High
Slats 95% 97% 100% Med 98% 100% 100% Med 98% 100% 100% High Spoilers 95% 97% 99% Med 98% 100% 100% Med 98% 100% 100% High
Ailerons 95% 97% 99% Med 98% 100% 100% Med 98% 100% 100% High
Winglets 96% 98% 100% Med 98% 100% 100% Med 98% 100% 100% High Empennage
Stabilizer 97% 99% 100% Med 98% 100% 100% Med 98% 100% 100% High
Fin 97% 99% 100% Med 98% 100% 100% Med 98% 100% 100% High Landing Gear 0% 2% 4% Med 3% 5% 7% Low 6% 8% 10% Low
Propulsion
Engine Nacelle 93% 95% 97% Med 98% 100% 100% Med 98% 100% 100% High
Pylon 10% 12% 14% Med 14% 16% 18% Low 18% 20% 22% Low
Core 20% 25% 30% Med 25% 30% 35% Med 30% 35% 40% Med
TAB LE M-6 – RJ 2034 COMPOS I TE PER CENTAG E 2034 Evolutionary 2034 Stretch 2034 Aggressive
Low Most Likely High Conf. Low
Most Likely High Conf. Low
Most Likely High Conf.
Ai r Vehicle Ai rframe
Fuselage 97% 99% 100% High 98% 100% 100% High 98% 100% 100% High Wing Structure Box 97% 99% 100% High 98% 100% 100% High 98% 100% 100% High
Flaps 98% 99% 100% High 98% 100% 100% High 98% 100% 100% High Slats 98% 99% 100% High 98% 100% 100% High 98% 100% 100% High
Spoi lers 98% 99% 100% High 98% 100% 100% High 98% 100% 100% High
Ai lerons 98% 99% 100% High 98% 100% 100% High 98% 100% 100% High
Winglets 98% 99% 100% High 98% 100% 100% High 98% 100% 100% High Empennage
Stabilizer 98% 99% 100% High 98% 100% 100% High 98% 100% 100% High Fin 98% 99% 100% High 98% 100% 100% High 98% 100% 100% High Landing Gear 13% 15% 17% Low 17% 19% 21% Low 21% 23% 25% Low
Propulsion
Engine
Nacelle 98% 99% 100% High 98% 100% 100% High 98% 100% 100% High Pylon 23% 25% 27% Low 27% 29% 31% Low 31% 33% 35% Low
Core 20% 25% 30% Med 35% 40% 45% Med 45% 50% 55% Med

AVIATION FUEL EFFICIENCY TECHNOLOGY ASSESSMENT —APPENDICES TECOLOTE RESEARCH
PG N-1
APPENDIX N—Technology Maturation Cost Estimation Model Inputs
The model was originally established to estimate the costs of maturing technologies beginning with TRL 1.
The technologies estimated for this study typically began at TRL Level 4 or later. The following provides
information on the work effort required to progress through each TRL level. The analysis was done to
identify from a labor and material build-up perspective the overall cost to progress through each TRL. The
term Time Dependent (TD) refers to costs that are increase as the duration increases, meaning the total cost
is dependent on a burn-rate and the time required to do the effort. The term Time Independent (TI) refers
to costs that are not dependent on the duration, like material purchases.
TRL Level 4
DEVELOP DOCUMENTATION AND VERIFICATION PLANS—a 10% TI/90% TD split was used because there is always
the aspect of upper levels of engineering, including safety and quality, having to review and approve the
documentation and verification plans. This review cycle is typically presented as a percentage of the
overall effort.
DEVELOP UNIQUE MANUFACTURING/FABRICATION NEEDS—a 30% TI/70% TD split was used because, as the
manufacturer works to develop unique manufacturing tooling, some materials will be needed, including
tooling, to ensure that their needs can be met once the program moves into full -rate production.
EVOLVE BASELINE INTO PRODUCT SPECS—a 10% TI/90% TD split was used because there is always the aspect of
upper levels of engineering, including safety and quality, having to review and approve the documentation
and verification plans. This review cycle is typically presented as a percentage of the overall eff ort.
DEVELOP DESIGN/INITIAL DRAWINGS—a 20% TI/80% TD split was used because the review cycle of the
design/drawings includes significant oversight and review to ensure that the technology is ready to move to
the development of the initial prototype.
TRL Level 5
DEVELOP INITIAL PROTOTYPES—a 50% TI/50% TD split was used because of the need to procure materials to
develop the initial prototype, as well as ensuring that quality engineering is supporting the efforts
throughout. Typically, quality engineering is a percentage of the overall effort, not a direct bill like other
engineering specialties.
DETAILED ANALYSIS (MODELING AND SIMULATION)—a 50% TI/50% TD split was used because of the need to utilize
lab and simulator time in order to analyze the initial prototype, as well as ensuring that quality engineering
is supporting the efforts throughout. Typically, quality engineering is a percentage of the overall effort, not a
direct bill like other engineering specialties.
ORDER MATERIAL—100% TI cost was used to account for any material that would be necessary to build
models and/or test articles. The material costs were derived using the Cost Estimating Relationships (CERs)

AVIATION FUEL EFFICIENCY TECHNOLOGY ASSESSMENT —APPENDICES TECOLOTE RESEARCH
PG N-2
for specific aircraft components and then prorated, if necessary, according to the design ( for example, the
wing CER was divided by two, as testing would only require one wing, not both).
CRITICAL DESIGN REVIEW (CDR)—a 10% TI/90% TD split was used because, as the manufacturer goes into CDR,
there are a series of reviews that must be accomplished in order to proceed. These reviews are typically
presented as a percentage of the overall effort.
TRL Level 6
FABRICATE/ASSEMBLE/CODE TO PRODUCT SPECS—a 50% TI/50% TD split was used because of the need to procure
materials to develop the initial prototype, as well as ensuring that quality engineering is supporting the
efforts throughout. Typically, quality engineering is a percentage of the overall effort, not a di rect bi l l l ike
other engineering specialties.
DEVELOP SIMULATORS—a 50% TI/50% TD split was used because of the need to procure materials to develop
the initial prototype, as well as ensuring that quality engineering is supporting the efforts throughout.
Typically, quality engineering is a percentage of the overall effort, not a direct bill like ot her
engineering specialties.
DEVELOP TEST PLANS AND VERIFICATION OPTIONS—a 10% TI/90% TD split was used because there is always the
aspect of upper levels of engineering, including safety and quality, having to review and approve the
documentation and verification plans. This review cycle is typically presented as a percentage of the
overall effort.
TRL Level 7
INDIVIDUAL TEST AND EVALUATION—a 25% TI/75% TD split was used because of the need for the test
instrumentation and equipment to be installed and uninstalled, as well as often rigid structure of
component level testing. A higher ratio of TD costs were identified for this item due to the variable nature of
testing, where the overall time for tests can increase or decrease based on the results of the testing.
INTEGRATED TEST AND EVALUATION—a 25% TI/75% TD split was used because of the need for the test
instrumentation and equipment to be installed and uninstalled, as well as often rigid structure of integrated
testing. A higher ratio of TD costs were identified for this item due to the variable nature of testing, where
the overall time for tests can increase or decrease based on the results of the testing.
TEST READINESS REVIEW (TRR)—a 10% TI/90% TD split was used because, as the manufacturer goes into TRR,
there are a series of reviews that must be accomplished in order to proceed. These reviews are typically
presented as a percentage of the overall effort.
PRODUCTION READINESS REVIEW (PRR)—a 10% TI/90% TD split was used because, as the manufacturer goes
into PRR, there are a series of reviews that must be accomplished in order to proceed. These reviews are
typically presented as a percentage of the overall effort.
For technology maturation costs, the Subject Matter Experts (SME) provided the duration of the effort to
mature the respective technology, the staffing or manpower required to achieve the target maturity, and
the uncertainty associated with effort. These inputs created the notional project profile (using Microsoft
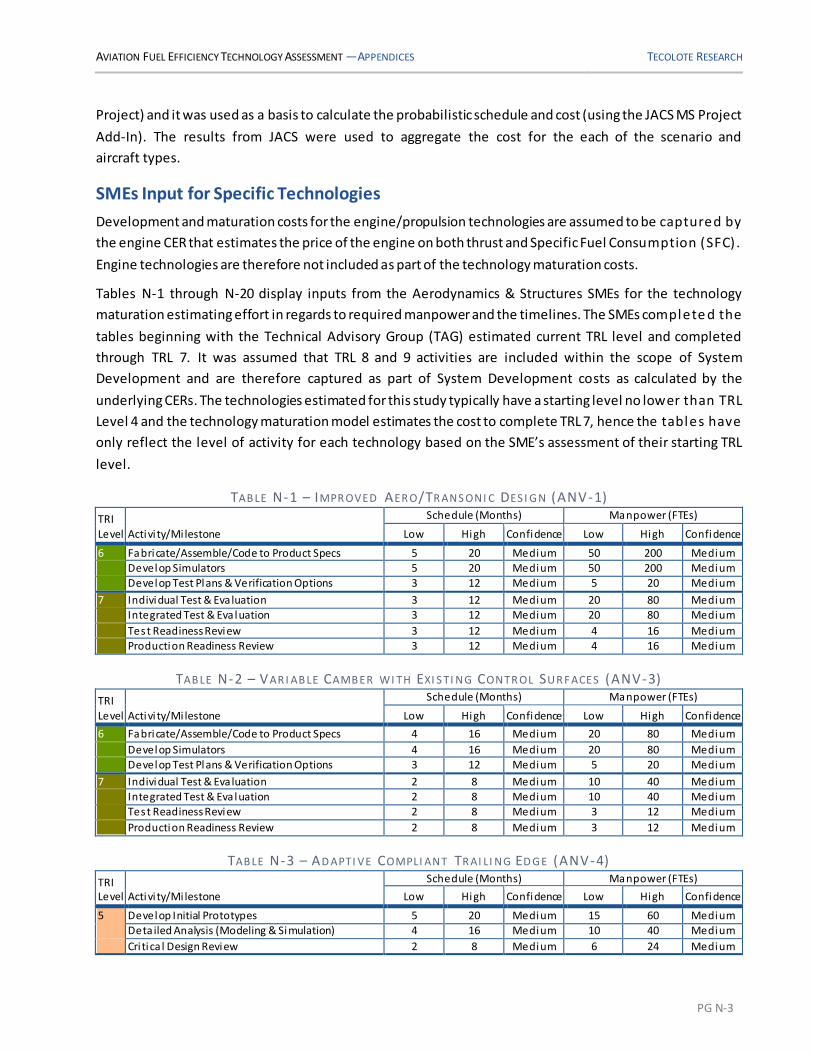
AVIATION FUEL EFFICIENCY TECHNOLOGY ASSESSMENT —APPENDICES TECOLOTE RESEARCH
PG N-3
Project) and it was used as a basis to calculate the probabilistic schedule and cost (using the JACS MS Project
Add-In). The results from JACS were used to aggregate the cost for the each of the scenario and
aircraft types.
SMEs Input for Specific Technologies
Development and maturation costs for the engine/propulsion technologies are assumed to be captured by
the engine CER that estimates the price of the engine on both thrust and Specific Fuel Consumption (SFC).
Engine technologies are therefore not included as part of the technology maturation costs.
Tables N-1 through N-20 display inputs from the Aerodynamics & Structures SMEs for the technology
maturation estimating effort in regards to required manpower and the timelines. The SMEs complete d the
tables beginning with the Technical Advisory Group (TAG) estimated current TRL level and completed
through TRL 7. It was assumed that TRL 8 and 9 activities are included within the scope of System
Development and are therefore captured as part of System Development costs as calculated by the
underlying CERs. The technologies estimated for this study typically have a starting level no lower than TRL
Level 4 and the technology maturation model estimates the cost to complete TRL 7, hence the tables have
only reflect the level of activity for each technology based on the SME’s assessment of their starting TRL
level.
TAB LE N-1 – IMPR OVED AER O/TR ANS ONI C DES I G N (ANV-1)
TRI Level Activi ty/Mi lestone
Schedule (Months) Manpower (FTEs)
Low High Confidence Low High Confidence
6 Fabricate/Assemble/Code to Product Specs 5 20 Medium 50 200 Medium Develop Simulators 5 20 Medium 50 200 Medium
Develop Test Plans & Verification Options 3 12 Medium 5 20 Medium
7 Individual Test & Evaluation 3 12 Medium 20 80 Medium Integrated Test & Evaluation 3 12 Medium 20 80 Medium
Test Readiness Review 3 12 Medium 4 16 Medium Production Readiness Review 3 12 Medium 4 16 Medium
TAB LE N-2 – VAR I AB LE CAMB ER WI TH EXI S TI NG CONTR OL SUR F ACES (ANV-3)
TRI Level Activi ty/Mi lestone
Schedule (Months) Manpower (FTEs)
Low High Confidence Low High Confidence
6 Fabricate/Assemble/Code to Product Specs 4 16 Medium 20 80 Medium
Develop Simulators 4 16 Medium 20 80 Medium
Develop Test Plans & Verification Options 3 12 Medium 5 20 Medium
7 Individual Test & Evaluation 2 8 Medium 10 40 Medium
Integrated Test & Evaluation 2 8 Medium 10 40 Medium Test Readiness Review 2 8 Medium 3 12 Medium
Production Readiness Review 2 8 Medium 3 12 Medium
TAB LE N-3 – AD APTI VE COMPLI ANT TR AI LI NG ED G E (ANV-4)
TRI Level Activi ty/Mi lestone
Schedule (Months) Manpower (FTEs)
Low High Confidence Low High Confidence
5 Develop Initial Prototypes 5 20 Medium 15 60 Medium Deta iled Analysis (Modeling & Simulation) 4 16 Medium 10 40 Medium
Cri tica l Design Review 2 8 Medium 6 24 Medium

AVIATION FUEL EFFICIENCY TECHNOLOGY ASSESSMENT —APPENDICES TECOLOTE RESEARCH
PG N-4
TRI Level Activi ty/Mi lestone
Schedule (Months) Manpower (FTEs)
Low High Confidence Low High Confidence
6 Fabricate/Assemble/Code to Product Specs 5 20 Medium 30 120 Medium
Develop Simulators 5 20 Medium 30 120 Medium
Develop Test Plans & Verification Options 4 16 Medium 10 40 Medium
7 Individual Test & Evaluation 3 12 Medium 20 80 Medium
Integrated Test & Evaluation 3 12 Medium 20 80 Medium
Test Readiness Review 3 12 Medium 6 24 Medium Production Readiness Review 3 12 Medium 6 24 Medium
TAB LE N-4 – ACTI VE STAB I LI TY CONTR OL (ANV-5)
TRI
Level Activi ty/Mi lestone
Schedule (Months) Manpower (FTEs)
Low High Confidence Low High Confidence
4 Develop Documentation & Verification Plans 2 8 Medium 3 12 Medium
Develop Unique Manufacturing/Fabrication Needs 2 8 Medium 3 12 Medium Evolve Baseline into Product Specs 3 12 Medium 3 12 Medium
Develop Design/Initial Drawings 3 12 Medium 3 12 Medium
5 Develop Initial Prototypes 5 20 Medium 5 20 Medium
Deta iled Analysis (Modeling & Simulation) 10 40 Medium 10 40 Medium Cri tica l Design Review 2 20 Medium 4 16 Medium
6 Fabricate/Assemble/Code to Product Specs 5 20 Medium 5 20 Medium Develop Simulators 10 40 Medium 10 40 Medium Develop Test Plans & Verification Options 5 20 Medium 10 40 Medium
7 Individual Test & Evaluation 5 20 Medium 10 40 Medium Integrated Test & Evaluation 10 40 Medium 10 40 Medium
Test Readiness Review 5 20 Medium 5 20 Medium
Production Readiness Review 5 20 Medium 5 20 Medium
TAB LE N-5 – RED UCTI ON OF LOAD S (ANV-6)
TRI Level Activi ty/Mi lestone
Schedule (Months) Manpower (FTEs)
Low High Confidence Low High Confidence
4 Develop Documentation & Verification Plans 5 20 Medium 5 20 Medium
Develop Unique Manufacturing/Fabrication Needs 5 20 Medium 5 20 Medium
Evolve Baseline into Product Specs 6 24 Medium 5 20 Medium Develop Design/Initial Drawings 6 24 Medium 5 20 Medium
5 Develop Initial Prototypes 10 40 Medium 7.5 30 Medium
Deta iled Analysis (Modeling & Simulation) 10 40 Medium 10 40 Medium
Cri tica l Design Review 3 12 Medium 4 16 Medium
6 Fabricate/Assemble/Code to Product Specs 10 40 Medium 10 40 Medium
Develop Simulators 20 80 Medium 10 40 Medium
Develop Test Plans & Verification Options 5 20 Medium 5 20 Medium
7 Individual Test & Evaluation 10 40 Medium 5 20 Medium
Integrated Test & Evaluation 10 40 Medium 5 20 Medium Test Readiness Review 10 40 Medium 5 20 Medium Production Readiness Review 10 40 Medium 5 20 Medium
TAB LE N-6 – INCR EAS ED WI NG SPAN (ANV-7)
TRI Level Activi ty/Mi lestone
Schedule (Months) Manpower (FTEs)
Low High Confidence Low High Confidence
7 Individual Test & Evaluation 10 40 Medium 5 20 Medium Integrated Test & Evaluation 10 40 Medium 5 20 Medium
Test Readiness Review 10 40 Medium 5 20 Medium Production Readiness Review 10 40 Medium 5 20 Medium

AVIATION FUEL EFFICIENCY TECHNOLOGY ASSESSMENT —APPENDICES TECOLOTE RESEARCH
PG N-5
TAB LE N-7 – ELECTR I C LAND I NG GEAR DR I VE SYS TEM (SYS-2)
TRI Level Activi ty/Mi lestone
Schedule (Months) Manpower (FTEs)
Low High Confidence Low High Confidence
5 Develop Initial Prototypes 2 8 Medium 3 12 Medium Deta iled Analysis (Modeling & Simulation) 1 4 Medium 3 12 Medium
Cri tica l Design Review 1 4 Medium 1 4 Medium
6 Fabricate/Assemble/Code to Product Specs 3 12 Medium 5 20 Medium
Develop Simulators 1 4 Medium 1 4 Medium
Develop Test Plans & Verification Options 1 4 Medium 1 4 Medium
7 Individual Test & Evaluation 1 4 Medium 2 8 Medium
Integrated Test & Evaluation 1 4 Medium 2 8 Medium Test Readiness Review 1 4 Medium 2 8 Medium
Production Readiness Review 1 4 Medium 2 8 Medium
TAB LE N-8 – HYB R I D LAMI NAR FLOW ON EMPENNAG E (AV-2)
TRI Level Activi ty/Mi lestone
Schedule (Months) Manpower (FTEs)
Low High Confidence Low High Confidence
4 Develop Documentation & Verification Plans 1.5 6 Medium 1.5 6 Medium
Develop Unique Manufacturing/Fabrication Needs 2 8 Medium 1.5 6 Medium
Evolve Baseline into Product Specs 1 4 Medium 2 8 Medium
Develop Design/Initial Drawings 1.5 6 Medium 2.5 10 Medium
5 Develop Initial Prototypes 2 8 Medium 20 80 Medium
Deta iled Analysis (Modeling & Simulation) 2 8 Medium 10 40 Medium
Cri tica l Design Review 0.5 2 Medium 1 4 Medium
6 Fabricate/Assemble/Code to Product Specs 2 8 Medium 20 80 Medium
Develop Simulators 2 8 Medium 20 80 Medium Develop Test Plans & Verification Options 1 4 Medium 2 8 Medium
7 Individual Test & Evaluation 1 4 Medium 10 40 Medium Integrated Test & Evaluation 1 4 Medium 10 40 Medium
Test Readiness Review 1 4 Medium 2 8 Medium Production Readiness Review 1 4 Medium 2 8 Medium
TAB LE N-9 – NATUR AL LAMI NAR FLOW ON WI NG S (AV-3)
TRI Level Activi ty/Mi lestone
Schedule (Months) Manpower (FTEs)
Low High Confidence Low High Confidence
5 Develop Initial Prototypes 4 16 Medium 40 160 Medium
Deta iled Analysis (Modeling & Simulation) 4 16 Medium 20 80 Medium Cri tica l Design Review 1 4 Medium 2 8 Medium
6 Fabricate/Assemble/Code to Product Specs 4 16 Medium 40 160 Medium Develop Simulators 4 16 Medium 40 160 Medium
Develop Test Plans & Verification Options 2 8 Medium 4 16 Medium
7 Individual Test & Evaluation 2 8 Medium 20 80 Medium
Integrated Test & Evaluation 2 8 Medium 20 80 Medium
Test Readiness Review 2 8 Medium 4 16 Medium Production Readiness Review 2 8 Medium 4 16 Medium
TAB LE N-10 – HYB R I D LAMI NAR FLOW ON WI NG S (AV-4)
TRI Level Activi ty/Mi lestone
Schedule (Months) Manpower (FTEs)
Low High Confidence Low High Confidence
5 Develop Initial Prototypes 6 24 Medium 60 240 Medium Deta iled Analysis (Modeling & Simulation) 6 24 Medium 30 120 Medium
Cri tica l Design Review 1.5 6 Medium 3 12 Medium

AVIATION FUEL EFFICIENCY TECHNOLOGY ASSESSMENT —APPENDICES TECOLOTE RESEARCH
PG N-6
TRI Level Activi ty/Mi lestone
Schedule (Months) Manpower (FTEs)
Low High Confidence Low High Confidence
6 Fabricate/Assemble/Code to Product Specs 6 24 Medium 60 240 Medium
Develop Simulators 6 24 Medium 60 240 Medium
Develop Test Plans & Verification Options 4 16 Medium 6 24 Medium
7 Individual Test & Evaluation 3 12 Medium 30 120 Medium
Integrated Test & Evaluation 3 12 Medium 30 120 Medium
Test Readiness Review 3 12 Medium 6 24 Medium Production Readiness Review 3 12 Medium 6 24 Medium
TAB LE N-11 – LAMI NAR FLOW COATI NG /RI B LETS (AV-5)
TRI
Level Activi ty/Mi lestone
Schedule (Months) Manpower (FTEs)
Low High Confidence Low High Confidence
5 Develop Initial Prototypes 2 8 Medium 20 80 Medium
Deta iled Analysis (Modeling & Simulation) 2 8 Medium 10 40 Medium Cri tica l Design Review 0.5 2 Medium 1 4 Medium
6 Fabricate/Assemble/Code to Product Specs 2 8 Medium 20 80 Medium Develop Simulators 2 8 Medium 20 80 Medium
Develop Test Plans & Verification Options 1 4 Medium 2 8 Medium
7 Individual Test & Evaluation 1 4 Medium 10 40 Medium
Integrated Test & Evaluation 1 4 Medium 10 40 Medium Test Readiness Review 1 4 Medium 2 8 Medium Production Readiness Review 1 4 Medium 2 8 Medium
TAB LE N-12 – AD VANCED COMPOS I TE MATER I ALS (S-6)
TRI Level Activi ty/Mi lestone
Schedule (Months) Manpower (FTEs)
Low High Confidence Low High Confidence
5 Develop Initial Prototypes 4 16 Medium 10 40 Medium Deta iled Analysis (Modeling & Simulation) 3 12 Medium 5 20 Medium
Cri tica l Design Review 1 4 Medium 3 112 Medium
6 Fabricate/Assemble/Code to Product Specs 4 16 Medium 20 80 Medium
Develop Simulators 4 16 Medium 20 80 Medium
Develop Test Plans & Verification Options 3 1 Medium 5 20 Medium
7 Individual Test & Evaluation 6 24 Medium 10 40 Medium
Integrated Test & Evaluation 6 24 Medium 10 40 Medium Test Readiness Review 6 24 Medium 3 12 Medium
Production Readiness Review 6 24 Medium 3 12 Medium
TAB LE N-13 – OUT-OF -AUTOCLAVE CUR I NG (S-9)
TRI
Level Activi ty/Mi lestone
Schedule (Months) Manpower (FTEs)
Low High Confidence Low High Confidence
5 Develop Initial Prototypes 4 16 Medium 10 40 Medium
Deta iled Analysis (Modeling & Simulation) 3 12 Medium 5 20 Medium Cri tica l Design Review 1 4 Medium 3 12 Medium
6 Fabricate/Assemble/Code to Product Specs 4 16 Medium 20 80 Medium Develop Simulators 4 16 Medium 20 80 Medium
Develop Test Plans & Verification Options 3 12 Medium 5 20 Medium
7 Individual Test & Evaluation 3 12 Medium 5 20 Medium
Integrated Test & Evaluation 3 12 Medium 5 20 Medium
Test Readiness Review 3 12 Medium 2 8 Medium Production Readiness Review 3 12 Medium 2 8 Medium

AVIATION FUEL EFFICIENCY TECHNOLOGY ASSESSMENT —APPENDICES TECOLOTE RESEARCH
PG N-7
TAB LE N-14 – AD D I TI VE MANUF ACTUR I NG (S-13)
TRI Level Activi ty/Mi lestone
Schedule (Months) Manpower (FTEs)
Low High Confidence Low High Confidence
5 Develop Initial Prototypes 4 16 Medium 10 40 Medium Deta iled Analysis (Modeling & Simulation) 3 12 Medium 5 20 Medium
Cri tica l Design Review 1 4 Medium 3 12 Medium
6 Fabricate/Assemble/Code to Product Specs 4 16 Medium 20 80 Medium
Develop Simulators 4 16 Medium 20 80 Medium
Develop Test Plans & Verification Options 3 12 Medium 5 20 Medium
7 Individual Test & Evaluation 6 24 Medium 10 40 Medium
Integrated Test & Evaluation 6 24 Medium 10 40 Medium Test Readiness Review 6 24 Medium 3 12 Medium
Production Readiness Review 6 24 Medium 3 12 Medium
TAB LE N-15 – 3D PR EF OR MS (S-14)
TRI Level Activi ty/Mi lestone
Schedule (Months) Manpower (FTEs)
Low High Confidence Low High Confidence
5 Develop Initial Prototypes 4 16 Medium 10 40 Medium
Deta iled Analysis (Modeling & Simulation) 3 12 Medium 5 20 Medium
Cri tica l Design Review 1 4 Medium 3 12 Medium
6 Fabricate/Assemble/Code to Product Specs 4 16 Medium 20 80 Medium Develop Simulators 4 16 Medium 20 80 Medium
Develop Test Plans & Verification Options 3 12 Medium 5 20 Medium
7 Individual Test & Evaluation 3 12 Medium 5 20 Medium
Integrated Test & Evaluation 3 12 Medium 5 20 Medium
Test Readiness Review 3 12 Medium 2 8 Medium Production Readiness Review 3 12 Medium 2 8 Medium
TAB LE N-16 – AD APTI VE AND MOR PH I NG MATER I ALS (S-17)
TRI Level Activi ty/Mi lestone
Schedule (Months) Manpower (FTEs)
Low High Confidence Low High Confidence
5 Develop Initial Prototypes 4 16 Medium 10 40 Medium Deta iled Analysis (Modeling & Simulation) 3 12 Medium 5 20 Medium
Cri tica l Design Review 1 4 Medium 3 12 Medium
6 Fabricate/Assemble/Code to Product Specs 4 16 Medium 30 120 Medium Develop Simulators 4 16 Medium 30 120 Medium
Develop Test Plans & Verification Options 3 12 Medium 10 40 Medium
7 Individual Test & Evaluation 6 24 Medium 20 80 Medium
Integrated Test & Evaluation 6 24 Medium 20 80 Medium Test Readiness Review 6 24 Medium 6 24 Medium
Production Readiness Review 6 24 Medium 6 24 Medium
TAB LE N-17 – HI G H TEMPER ATUR E CER AMI CS (S-20)
TRI Level Activi ty/Mi lestone
Schedule (Months) Manpower (FTEs)
Low High Confidence Low High Confidence
6 Fabricate/Assemble/Code to Product Specs 10 40 Medium 20 80 Medium
Develop Simulators 4 16 Medium 20 80 Medium
Develop Test Plans & Verification Options 5 20 Medium 10 40 Medium
7 Individual Test & Evaluation 10 40 Medium 10 40 Medium
Integrated Test & Evaluation 10 40 Medium 10 40 Medium Test Readiness Review 10 40 Medium 5 20 Medium
Production Readiness Review 10 40 Medium 5 20 Medium

AVIATION FUEL EFFICIENCY TECHNOLOGY ASSESSMENT —APPENDICES TECOLOTE RESEARCH
PG N-8
TAB LE N-18 – INNOVATI VE LOAD SUPPR ES S I ON (S-21)
TRI Level Activi ty/Mi lestone
Schedule (Months) Manpower (FTEs)
Low High Confidence Low High Confidence
6 Fabricate/Assemble/Code to Product Specs 10 40 Medium 10 40 Medium Develop Simulators 20 80 Medium 10 40 Medium
Develop Test Plans & Verification Options 5 20 Medium 5 20 Medium
7 Individual Test & Evaluation 10 40 Medium 5 20 Medium
Integrated Test & Evaluation 10 40 Medium 5 20 Medium
Test Readiness Review 10 40 Medium 5 20 Medium Production Readiness Review 10 40 Medium 5 20 Medium
TAB LE N-19 – MULTI -FUNCTI ONAL MATER I ALS (S-22)
TRI Level Activi ty/Mi lestone
Schedule (Months) Manpower (FTEs)
Low High Confidence Low High Confidence
5 Develop Initial Prototypes 4 16 Medium 10 40 Medium Deta iled Analysis (Modeling & Simulation) 3 12 Medium 5 20 Medium
Cri tica l Design Review 1 4 Medium 3 12 Medium
6 Fabricate/Assemble/Code to Product Specs 4 16 Medium 30 120 Medium
Develop Simulators 4 16 Medium 30 120 Medium
Develop Test Plans & Verification Options 3 12 Medium 10 40 Medium
7 Individual Test & Evaluation 6 24 Medium 20 80 Medium Integrated Test & Evaluation 6 24 Medium 20 80 Medium
Test Readiness Review 6 24 Medium 6 24 Medium
Production Readiness Review 6 24 Medium 6 24 Medium

AVIATION FUEL EFFICIENCY TECHNOLOGY ASSESSMENT —APPENDICES TECOLOTE RESEARCH
PG O-1
APPENDIX O—Cost Assessment Results
Total Ownership Cost (TOC)
The following tables show the TOC results for each aircraft configuration and deployment scenario (E =
Evolutionary, M = Moderate, A = Aggressive). All results are displayed at a level no lower than a mill ion
dollars. Based on uncertainty analysis conducted for this study the 2024 EIS scenario results are determined
to be accurate within +/- 15% and 2034 EIS scenario results at +/1 20%. All results have been normal ized to
be shown in a consistent economic base year (2013) regardless of when the costs will be incurred. This
allows analysts to see the true cost delta between the scenarios and not have the data altered by
inflationary impacts.
TAB LE O-1 – SA TOC—DI S COUNTED AND UND I S COUNTED MEAN RES ULTS SA – 2024 SA – 2034
Ref E M A Ref E M A
UNDISCOUNTED—Mean Costs in BY2013 Millions of USD
Total ownership cost 320,955 291,910 285,786 283,137 470,897 399,598 392,632 402,002 Operator capital investment 120,026 166,258 185,776 199,672 145,624 223,531 242,810 283,465
Operator expense for 7 years 242,852 183,722 164,898 153,206 376,136 254,142 234,631 217,546 Fuel cost total for 7 years 203,838 151,512 134,138 122,229 323,035 212,416 192,474 174,189 Maintenance cost total for 7 years 39,014 32,210 30,760 30,978 53,101 41,725 42,157 43,357
Operator income after 17 years (residual va lue) 41,923 58,071 64,888 69,742 50,863 78,075 84,809 99,008 Average TOC per A/C for all A/C purchased 80 73 71 70 86 73 72 74
Average operator capital investment per A/C 30 41 46 59 27 41 44 52
Average operator expense per A/C 60 46 41 38 68 47 43 40
Average fuel cost per A/C 51 38 33 30 59 39 35 32 Average maintenance cost per A/C 10 8 8 8 10 8 8 8
Operator income (residual value) 10 14 16 17 9 14 16 18
Average TOC per A/C for A/C purchased in 1st yr 77 70 69 68 82 70 69 71 Average operator capital investment per A/C 30 41 46 50 27 41 44 52
Average operator expense per A/C 57 43 39 36 64 44 40 37
Average fuel cost per A/C 47 35 31 28 55 36 33 30
Average maintenance cost per A/C 10 8 8 8 10 8 8 8 Operator income (residual value) 10 14 16 17 9 14 16 18
DISCOUNTED (9%) —Mean Costs in BY2013 Millions of USD
Total ownership cost 82,213 81,384 82,336 83,369 49,415 46,825 47,136 49,962 Operator capital investment 33,242 46,047 51,452 55,301 17,035 26,149 28,404 33,160
Operator expense for 7 years 51,653 39,053 35,036 32,531 33,755 22,787 21,025 19,479 Fuel cost total for 7 years 43,641 32,438 28,718 26,169 29,149 19,167 17,368 15,718
Maintenance cost total for 7 years 8,013 6,615 6,317 6,362 4,606 3,620 3,657 3,761
Operator income after 17 years (residual va lue) 2,683 3,716 4,153 4,463 1,375 2,110 2,292 2,676
Average TOC per A/C for all A/C purchased $20 $20 $20 $21 $9 $9 $9 $9 Average operator capital investment per A/C $8 $11 $13 $14 $3 $5 $5 $6
Average operator expense per A/C $13 $10 $9 $8 $6 $4 $4 $4
Average fuel cost per A/C $11 $8 $7 $7 $5 $4 $3 $3 Average maintenance cost per A/C $2 $2 $2 $2 $1 $1 $1 $1
Operator income (residual value) $1 $1 $1 $1 $0 $0 $0 $0
Average TOC per A/C for A/C purchased in 1st yr $29 $29 $29 $30 $13 $12 $12 $13
Average operator capital investment per A/C $12 $17 $19 $20 $5 $7 $8 $9 Average operator expense per A/C $18 $14 $12 $11 $9 $6 $5 $5
Average fuel cost per A/C $15 $11 $10 $9 $7 $5 $4 $4
Average maintenance cost per A/C $3 $2 $2 $2 $1 $1 $1 $1 Operator income (residual value) $1 $1 $2 $2 $0 $1 $1 $1

AVIATION FUEL EFFICIENCY TECHNOLOGY ASSESSMENT —APPENDICES TECOLOTE RESEARCH
PG O-2
TAB LE O-2 – STA TOC—DI S COUNTED AND UND I S COUNTED MEAN RES ULTS STA – 2024 STA – 2034 Ref E M A Ref E M A
UNDISCOUNTED—Mean Costs in BY2013 Millions of USD Total ownership cost 503,021 443,929 462,456 457,263 813,187 696,303 662,929 685,297
Operator capital investment $185,233 249,240 311,618 351,648 243,321 392,299 435,174 494,806 Operator expense for 7 years $382,486 281,743 259,680 228,439 654,853 441,026 379,752 363,317
Fuel cost total for 7 years $339,589 246,741 226,628 195,116 590,761 391,600 330,006 313,319
Maintenance cost total for 7 years $42,897 35,002 33,052 33,322 64,092 49,426 49,747 49,998 Operator income after 17 years (residual va lue) $64,698 87,055 108,842 122,824 84,987 137,022 151,997 172,826
Average TOC per A/C for all A/C purchased $353 312 325 321 382 327 312 322 Average operator capital investment per A/C $130 175 219 247 114 184 204 232
Average operator expense per A/C $269 198 182 160 308 207 179 171
Average fuel cost per A/C $239 173 159 137 278 184 155 147 Average maintenance cost per A/C $30 25 23 23 30 23 23 24
Operator income (residual value) $45 61 76 86 40 64 71 81
Average TOC per A/C for A/C purchased in 1st yr $337 300 314 312 361 313 300 311
Average operator capital investment per A/C $130 175 219 247 114 184 204 232 Average operator expense per A/C $253 186 172 151 287 194 167 160
Average fuel cost per A/C $223 162 149 128 257 170 144 136 Average maintenance cost per A/C $30 25 23 23 30 23 23 24
Operator income (residual value) $45 61 76 86 40 64 71 81
DISCOUNTED (9%) —Mean Costs in BY2013 Millions of USD Total ownership cost $126,765 122,613 133,717 137,200 84,433 81,246 80,338 85,235
Operator capital investment $50,963 68,574 85,736 96,750 28,278 45,592 50,574 57,504 Operator expense for 7 years $80,916 59,575 54,903 48,262 58,437 39,335 33,845 32,372
Fuel cost total for 7 years $72,164 52,434 48,159 41,463 52,914 35,075 29,558 28,064 Maintenance cost total for 7 years $8,752 7,141 6,743 6,798 5,523 4,259 4,287 4,309
Operator income after 17 years (residual va lue) $4,114 5,536 6,922 7,811 2,282 3,680 4,082 4,641
Average TOC per A/C for all A/C purchased $90 $86 $94 $96 $40 $38 $38 $40 Average operator capital investment per A/C $36 $48 $60 $68 $13 $21 $24 $27
Average operator expense per A/C $57 $42 $39 $34 $27 $18 $16 $15
Average fuel cost per A/C $51 $37 $34 $29 $25 $16 $14 $13
Average maintenance cost per A/C $6 $5 $5 $5 $3 $2 $2 $2 Operator income (residual value) $3 $4 $5 $5 $1 $2 $2 $2
Average TOC per A/C for A/C purchased in 1st yr $128 $123 $135 $139 $56 $55 $54 $58 Average operator capital investment per A/C $53 $71 $88 $100 $20 $31 $35 $40 Average operator expense per A/C $79 $58 $54 $47 $38 $26 $22 $21
Average fuel cost per A/C $70 $51 $47 $40 $34 $23 $19 $18 Average maintenance cost per A/C $9 $7 $7 $7 $4 $3 $3 $3
Operator income (residual value) $4 $6 $7 $8 $2 $3 $3 $3
TAB LE O-3 – RJ TOC—DI S COUNTED AND UND I S COUNTED MEAN RES ULTS RJ – 2024 RJ – 2034
Ref E M A Ref E M A
UNDISCOUNTED—Mean Costs in BY2013 Millions of USD
Total ownership cost 58,582 53,527 54,677 54,536 104,840 90,902 88,269 90,198 Operator capital investment 22,992 31,987 36,724 40,267 33,073 49,835 53,733 62,510 Operator expense for 7 years 43,620 32,712 30,780 28,333 83,318 58,473 53,304 49,521
Fuel cost total for 7 years 36,448 26,342 24,439 21,958 71,272 47,814 42,604 38,677
Maintenance cost total for 7 years 7,173 6,370 6,342 6,375 12,046 10,659 10,700 10,844
Operator income after 17 years (residual va lue) 8,031 11,172 12,827 14,064 11,552 17,406 18,768 21,834

AVIATION FUEL EFFICIENCY TECHNOLOGY ASSESSMENT —APPENDICES TECOLOTE RESEARCH
PG O-3
RJ – 2024 RJ – 2034
Ref E M A Ref E M A
Average TOC per A/C for all A/C purchased 61 56 57 57 65 56 55 56
Average operator capital investment per A/C 24 33 38 42 22 31 33 39 Average operator expense per A/C 46 34 32 30 53 36 33 31
Average fuel cost per A/C 38 28 26 23 44 30 27 24 Average maintenance cost per A/C 8 7 7 7 8 7 7 7
Operator income (residual value) 8 12 13 15 7 11 12 14
Average TOC per A/C for A/C purchased in 1st yr 59 54 55 55 62 54 53 54 Average operator capital investment per A/C 24 33 38 42 21 31 33 39
Average operator expense per A/C 43 32 30 28 48 34 31 29 Average fuel cost per A/C 36 26 24 21 41 27 24 22
Average maintenance cost per A/C 8 7 7 7 8 7 7 7 Operator income (residual value) 8 12 13 15 7 11 12 14 DISCOUNTED (9%) —Mean Costs in BY2013 Millions of USD
Total ownership cost 14,900 14,862 15,643 16,015 10,868 10,440 10,393 10,986 Operator capital investment 6,271 8,724 10,016 10,983 3,811 5,743 6,192 7,203
Operator expense for 7 years 9,135 6,842 6,435 5,919 7,364 5,161 4,701 4,364
Fuel cost total for 7 years 7,685 5,554 5,153 4,630 6,335 4,250 3,787 3,438
Maintenance cost total for 7 years 1,451 1,288 1,283 1,289 1,029 911 914 927 Operator income after 17 years (residual va lue) 506 704 808 886 308 463 500 581
Average TOC per A/C for all A/C purchased $16 $15 $16 $17 $7 $6 $6 $7
Average operator capital investment per A/C $7 $9 $10 $11 $2 $4 $4 $4 Average operator expense per A/C $10 $7 $7 $6 $5 $3 $3 $3
Average fuel cost per A/C $8 $6 $5 $5 $4 $3 $2 $2 Average maintenance cost per A/C $2 $1 $1 $1 $1 $1 $1 $1
Operator income (residual value) $1 $1 $1 $1 $0 $0 $0 $0
Average TOC per A/C for A/C purchased in 1st yr $22 $22 $24 $24 $10 $9 $9 $10 Average operator capital investment per A/C $10 $13 $15 $17 $4 $5 $6 $7
Average operator expense per A/C $13 $10 $9 $9 $6 $4 $4 $4 Average fuel cost per A/C $11 $8 $8 $7 $5 $4 $3 $3
Average maintenance cost per A/C $2 $2 $2 $2 $1 $1 $1 $1 Operator income (residual value) $1 $1 $1 $1 $0 $0 $0 $1
AUP Summary
The following tables show the Average Unit Price results for each aircraft configuration and
deployment scenario.
TAB LE O-4 – SA AUP MEAN RES ULTS SA – 2024 SA – 2034
Ref E M A Ref E M A
UNDISCOUNTED—Mean Costs in BY2013 Millions of USD
Total Manufacturer Investment (NONRECURRING) $0 $6,639 $11,766 $15,209 $0 $10,939 $12,873 $21,360 Tota l Production Quantity 4,024 4,024 4,024 4,024 5,477 5,477 5,477 5,477
Amortized Development Cost – per Vehicle $0 $2 $3 $4 $0 $2 $2 $4
Total Manufacturer Production (RECURRING) $100,022 $131,910 $143,048 $151,184 $121,353 $175,337 $189,469 $214,860 Tota l Production Quantity 4,024 4,024 4,024 4,024 5,477 5,477 5,477 5,477
Average Unit Production Cost $25 $33 $36 $38 $22 $32 $35 $39
Amortized Development Cost – per Vehicle $0 $2 $3 $4 $0 $2 $2 $4
Average Unit Production Cost $25 $33 $36 $38 $22 $32 $35 $39
Profi t (20%) $5.0 $7 $8 $8 $4 $7 $7 $9 Operator Capital Investment per A/C $30 $41 $46 $50 $28 $41 $44 $52

AVIATION FUEL EFFICIENCY TECHNOLOGY ASSESSMENT —APPENDICES TECOLOTE RESEARCH
PG O-4
SA – 2024 SA – 2034
Ref E M A Ref E M A
DISCOUNTED (9%) —Mean Costs in BY2013 Millions of USD
Average Operator Capital Cost for ALL A/C purchased
$8 $11 $13 $14 $3 $5 $5 $6
Average Operator Capital Cost for FIRST A/C purchased
$12 $17 $19 $20 $5 $7 $8 $9
TAB LE O-5 – STA AUP MEAN RES ULTS STA – 2024 STA – 2034
Ref E M A Ref E M A
UNDISCOUNTED—Mean Costs in BY2013 Millions of USD
Total Manufacturer Investment (NONRECURRING) $0 $15,714 $33,819 $44,791 $0 $32,335 $39,723 $47,274 Tota l Production Quantity 1,426 1,426 1,426 1,426 2,131 2,131 2,131 2,131
Amortized Development Cost – per Vehicle $0.0 $11 $24 $31 $0 $15 $19 $22
Total Manufacturer Production (RECURRING) $150,229 $182,488 $211,128 $230,644 $196,070 $277,379 $303,275 $342,448 Tota l Production Quantity 1,426 1,426 1,426 1,426 2,131 2,131 2,131 2,131
Average Unit Production Cost $105 $128 $148 $162 $92 $130 $142 $161
Amortized Development Cost – per Vehicle $0 $11 $24 $31 $0 $15 $19 $22
Average Unit Production Cost $105 $128 $148 $162 $92 $130 $142 $161 Profi t (20%) $21 $28 $34 $39 $18 $29 $32 $37
Operator Capital Investment per A/C $126 $167 $206 $232 $110 $174 $193 $220
DISCOUNTED (9%) —Mean Costs in BY2013 Millions of USD
Average Operator Capital Cost for ALL A/C purchased
$36 $48 $60 $68 $13 $21 $24 $27
Average Operator Capital Cost for FIRST A/C
purchased
$53 $71 $88 $100 $20 $32 $35 $40
TAB LE O-6 – RJ AUP MEAN RES ULTS RJ – 2024 RJ – 2034
Ref E M A Ref E M A
UNDISCOUNTED—Mean Costs in BY2013 Millions of USD
Total Manufacturer Investment (NONRECURRING) $0 $2,872 $4,701 $6,540 $0 $4,230 $5,576 $8,338
Tota l Production Quantity 961 961 961 961 1,614 1,614 1,614 1,614
Amortized Development Cost – per Vehicle $0 $3 $5 $7 $0 $3 $4 $5
Total Manufacturer Production (RECURRING) 19,160 $23,783 $25,902 $27,015 $27,561 $37,299 $39,201 $43,754 Tota l Production Quantity 961 961 961 961 1,614 1,614 1,614 1,614
Average Unit Production Cost $20 $25 $27 $28 $17 $23 $24 $27
Amortized Development Cost – per Vehicle $0 $3 $5 $7 $0 $3 $5 $5
Average Unit Production Cost $20 $25 $27 $28 $17 $23 $24 $27 Profi t (20%) $4 $6 $6 $7 $3 $5 $6 $7
AUP – Operator Capital Cost per A/C $24 $33 $38 $42 $21 $31 $33 $39
DISCOUNTED (9%) —Mean Costs in BY2013 Millions of USD Average Operator Capital Cost for ALL A/C
purchased
$7 $9 $10 $11 $2 $4 $4 $5
Average Operator Capital Cost for FIRST A/C
purchased
$10 $14 $16 $17 $4 $5 $6 $7

AVIATION FUEL EFFICIENCY TECHNOLOGY ASSESSMENT —APPENDICES TECOLOTE RESEARCH
PG O-5
Total Nonrecurring Cost
The following tables show the Total Nonrecurring Cost (manufacturer investment) results for each ai rcraft
configuration and deployment scenario. The detail show the cost for technology maturation for each
candidate, the overall system development cost, and the amortized development cost that is added to the
average unit production cost to support AUP calculations.
TAB LE O-7 – TOTAL NR MEAN COS T—STA ( I N BI LLI ONS ) SA – 2024 SA – 2034
Ref E M A Ref E M A
UNDISCOUNTED—Mean Costs in BY2013 Billions of USD
Total Manufacturer Investment $0 $6.639 $11.766 $15.209 $0 $10.939 $12.873 $21.360 Technology Maturation $0 $0.926 $2.034 $2.884 $- $1.756 $2.553 $3.923 Aerodynamic Efficiency (Viscous) $0 $0.077 $0.377 $- $0.068 $0.334 $0.643
Aerodynamic Efficiency (Non-Viscous) $0 $0.926 $1.421 $1.567 $- $1.283 $1.418 $1.523 Structures $0 $0 $0.517 $0.922 $- $0.390 $0.785 $1.742
Aircraft Systems $0 $0 $0.019 $0.019 $- $0.015 $0.015 $0.015
System Development $0 $5.713 $9.732 $12.325 $0 $9.183 $10.320 $17.438
Structure $0 $1.095 $2.438 $3.264 $0 $2.370 $2.804 $3.957 Fuselage Group $0 $0.383 $0.925 $1.178 $0 $0.881 $1.040 $1.253
Wing Group $0 $0.587 $1.131 $1.589 $0 $1.110 $1.345 $2.168
Structure Box $0 $0.522 $0.987 $1.403 $0 $0.959 $1.172 $1.931 Flaps $0 $0.041 $0.078 $0.101 $0 $0.083 $0.093 $0.125
Slats $0 $0.012 $0.032 $0.040 $0 $0.032 $0.038 $0.053
Spoi lers $0 $0.006 $0.014 $0.019 $0 $0.015 $0.018 $0.024
Ai lerons $0 $0.005 $0.009 $0.012 $0 $0.010 $0.011 $0.017 Winglets $0 $0.001 $0.012 $0.015 $0 $0.011 $0.013 $0.017
Empennage $0 $0.109 $0.298 $0.387 $0 $0.304 $0.330 $0.398
Stabilizer $0 $0.067 $0.185 $0.240 $0 $0.188 $0.204 $0.231 Fin $0 $0.042 $0.113 $0.147 $0 $0.116 $0.127 $0.167
Landing Gear $0 $0.015 $0.083 $0.110 $0 $0.075 $0.089 $0.138 Propulsion $0 $0.734 $0.874 $1.282 $0 $0.836 $1.108 $1.665
Engine $0 $0.728 $0.869 $1.276 $0 $0.828 $1.099 $1.644
Core $0 $0.579 $0.628 $0.952 $0 $0.564 $0.817 $1.320
Pylon $0 $0.020 $0.038 $0.052 $0 $0.040 $0.046 $0.067 Nacelle $0 $0.129 $0.202 $0.272 $0 $0.224 $0.236 $0.257
Fuel System $0 $0.005 $0.006 $0.006 $0 $0.009 $0.009 $0.021
Systems $0 $0.574 $0.841 $1.035 $0 $0.869 $0.979 $1.512 Auxi l iary Power Unit $0 $0.008 $0.009 $0.010 $0 $0.014 $0.014 $0.036
Surface Controls $0 $0.199 $0.317 $0.369 $0 $0.312 $0.340 $0.415 Hydraulics $0 $0.039 $0.041 $0.045 $0 $0.060 $0.061 $0.141
Electrical $0 $0.103 $0.121 $0.154 $0 $0.120 $0.137 $0.176 Furnishings $0 $0.067 $0.178 $0.241 $0 $0.156 $0.202 $0.358
Air Conditioning $0 $0.009 $0.010 $0.011 $0 $0.015 $0.016 $0.041
Avionics $0 $0.107 $0.123 $0.156 $0 $0.123 $0.139 $0.177 Misc Systems $0 $0.042 $0.044 $0.049 $0 $0.069 $0.070 $0.167
Air Vehicle Integration $0 $0.297 $0.370 $0.450 $0 $0.348 $0.370 $0.409 Software Development $- $1.109 $2.479 $2.736 $- $2.339 $2.339 $6.206
SE/PM $0 $0.418 $0.874 $1.281 $0 $0.819 $0.957 $1.469
Test $0 $1.433 $1.781 $2.188 $0 $1.529 $1.684 $2.112 Support Investment $0 $0.054 $0.075 $0.088 $0 $0.072 $0.079 $0.106
DISCOUNTED (9%) —Mean Costs in BY2013 Billions of USD Total Manufacturer Investment $0 $3.717 $6.819 $8.893 $0 $3.431 $4.329 $6.943
Technology Maturation $- $0.718 $1.642 $2.326 $- $1.365 $2.005 $2.982 System Development $0 $2.998 $5.177 $6.567 $0 $2.066 $2.324 $3.961
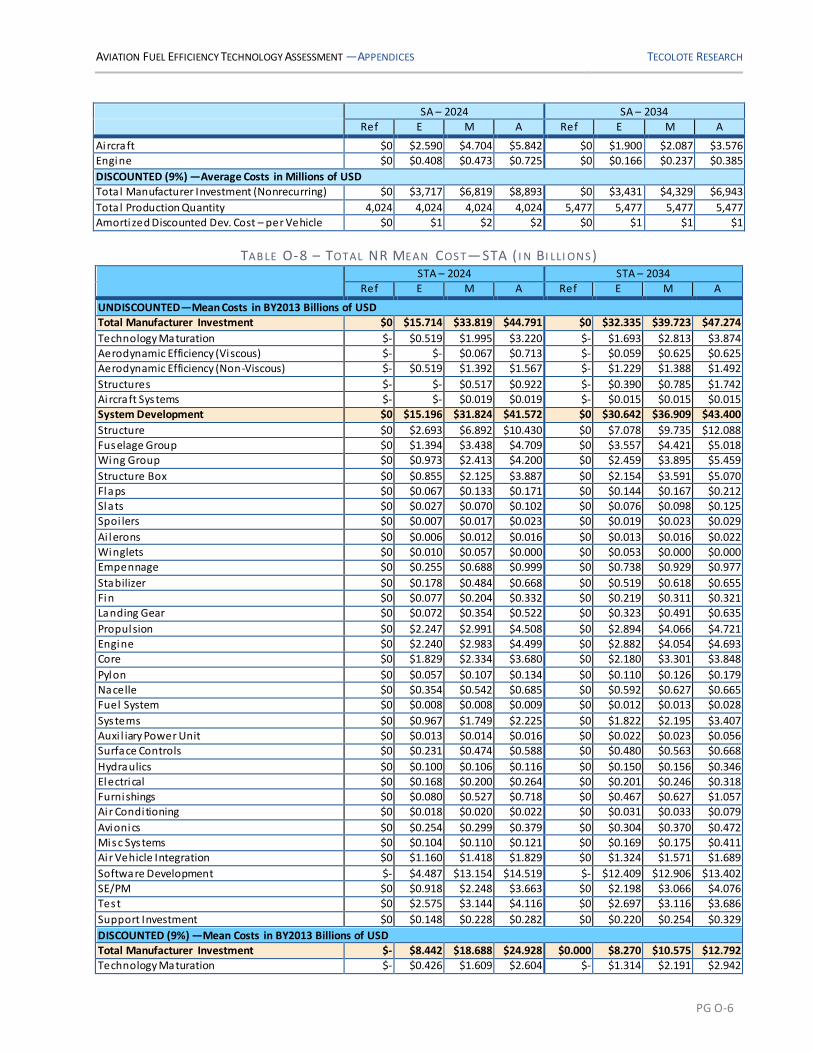
AVIATION FUEL EFFICIENCY TECHNOLOGY ASSESSMENT —APPENDICES TECOLOTE RESEARCH
PG O-6
SA – 2024 SA – 2034
Ref E M A Ref E M A
Aircraft $0 $2.590 $4.704 $5.842 $0 $1.900 $2.087 $3.576
Engine $0 $0.408 $0.473 $0.725 $0 $0.166 $0.237 $0.385
DISCOUNTED (9%) —Average Costs in Millions of USD
Total Manufacturer Investment (Nonrecurring) $0 $3,717 $6,819 $8,893 $0 $3,431 $4,329 $6,943
Tota l Production Quantity 4,024 4,024 4,024 4,024 5,477 5,477 5,477 5,477 Amortized Discounted Dev. Cost – per Vehicle $0 $1 $2 $2 $0 $1 $1 $1
TAB LE O-8 – TOTAL NR MEAN COS T—STA ( I N BI LLI ONS ) STA – 2024 STA – 2034 Ref E M A Ref E M A
UNDISCOUNTED—Mean Costs in BY2013 Billions of USD Total Manufacturer Investment $0 $15.714 $33.819 $44.791 $0 $32.335 $39.723 $47.274
Technology Maturation $- $0.519 $1.995 $3.220 $- $1.693 $2.813 $3.874 Aerodynamic Efficiency (Viscous) $- $- $0.067 $0.713 $- $0.059 $0.625 $0.625
Aerodynamic Efficiency (Non-Viscous) $- $0.519 $1.392 $1.567 $- $1.229 $1.388 $1.492
Structures $- $- $0.517 $0.922 $- $0.390 $0.785 $1.742 Aircraft Systems $- $- $0.019 $0.019 $- $0.015 $0.015 $0.015
System Development $0 $15.196 $31.824 $41.572 $0 $30.642 $36.909 $43.400
Structure $0 $2.693 $6.892 $10.430 $0 $7.078 $9.735 $12.088
Fuselage Group $0 $1.394 $3.438 $4.709 $0 $3.557 $4.421 $5.018 Wing Group $0 $0.973 $2.413 $4.200 $0 $2.459 $3.895 $5.459
Structure Box $0 $0.855 $2.125 $3.887 $0 $2.154 $3.591 $5.070 Flaps $0 $0.067 $0.133 $0.171 $0 $0.144 $0.167 $0.212 Slats $0 $0.027 $0.070 $0.102 $0 $0.076 $0.098 $0.125
Spoi lers $0 $0.007 $0.017 $0.023 $0 $0.019 $0.023 $0.029
Ai lerons $0 $0.006 $0.012 $0.016 $0 $0.013 $0.016 $0.022
Winglets $0 $0.010 $0.057 $0.000 $0 $0.053 $0.000 $0.000 Empennage $0 $0.255 $0.688 $0.999 $0 $0.738 $0.929 $0.977
Stabilizer $0 $0.178 $0.484 $0.668 $0 $0.519 $0.618 $0.655 Fin $0 $0.077 $0.204 $0.332 $0 $0.219 $0.311 $0.321 Landing Gear $0 $0.072 $0.354 $0.522 $0 $0.323 $0.491 $0.635
Propulsion $0 $2.247 $2.991 $4.508 $0 $2.894 $4.066 $4.721 Engine $0 $2.240 $2.983 $4.499 $0 $2.882 $4.054 $4.693
Core $0 $1.829 $2.334 $3.680 $0 $2.180 $3.301 $3.848
Pylon $0 $0.057 $0.107 $0.134 $0 $0.110 $0.126 $0.179
Nacelle $0 $0.354 $0.542 $0.685 $0 $0.592 $0.627 $0.665 Fuel System $0 $0.008 $0.008 $0.009 $0 $0.012 $0.013 $0.028
Systems $0 $0.967 $1.749 $2.225 $0 $1.822 $2.195 $3.407
Auxi l iary Power Unit $0 $0.013 $0.014 $0.016 $0 $0.022 $0.023 $0.056 Surface Controls $0 $0.231 $0.474 $0.588 $0 $0.480 $0.563 $0.668
Hydraulics $0 $0.100 $0.106 $0.116 $0 $0.150 $0.156 $0.346 Electrical $0 $0.168 $0.200 $0.264 $0 $0.201 $0.246 $0.318
Furnishings $0 $0.080 $0.527 $0.718 $0 $0.467 $0.627 $1.057 Air Conditioning $0 $0.018 $0.020 $0.022 $0 $0.031 $0.033 $0.079
Avionics $0 $0.254 $0.299 $0.379 $0 $0.304 $0.370 $0.472
Misc Systems $0 $0.104 $0.110 $0.121 $0 $0.169 $0.175 $0.411 Air Vehicle Integration $0 $1.160 $1.418 $1.829 $0 $1.324 $1.571 $1.689
Software Development $- $4.487 $13.154 $14.519 $- $12.409 $12.906 $13.402
SE/PM $0 $0.918 $2.248 $3.663 $0 $2.198 $3.066 $4.076
Test $0 $2.575 $3.144 $4.116 $0 $2.697 $3.116 $3.686
Support Investment $0 $0.148 $0.228 $0.282 $0 $0.220 $0.254 $0.329
DISCOUNTED (9%) —Mean Costs in BY2013 Billions of USD Total Manufacturer Investment $- $8.442 $18.688 $24.928 $0.000 $8.270 $10.575 $12.792 Technology Maturation $- $0.426 $1.609 $2.604 $- $1.314 $2.191 $2.942

AVIATION FUEL EFFICIENCY TECHNOLOGY ASSESSMENT —APPENDICES TECOLOTE RESEARCH
PG O-7
STA – 2024 STA – 2034
Ref E M A Ref E M A
System Development $- $8.016 $17.078 $22.324 $0.000 $6.956 $8.385 $9.850
Aircraft $- $6.736 $15.408 $19.710 $0.000 $6.343 $7.473 $8.719 Engine $- $1.280 $1.670 $2.615 $0.000 $0.613 $0.912 $1.132
DISCOUNTED (9%) —Average Costs in Millions of USD
Total Manufacturer Investment (Nonrecurring) — $8,442 $18,688 $24,928 $0 $8,270 $10,575 $12,792 Tota l Production Quantity 1,426 1,426 1,426 1,426 2,131 2,131 2,131 2,131
Amortized Discounted Dev. Cost – per Vehicle — $6 $13 $17 $0 $4 $5 $6
TAB LE O-9 – TOTAL NR MEAN COS T—RJ ( I N BI LLI ONS ) RJ – 2024 RJ – 2034
Ref E M A Ref E M A
UNDISCOUNTED—Mean Costs in BY2013 Billions of USD
Total Manufacturer Investment $0 $2.872 $4.701 $6.540 $0 $4.230 $5.576 $8.338 Technology Maturation $- $0.391 $1.159 $1.943 $- $0.952 $1.683 $2.388
Aerodynamic Efficiency (Viscous) $- $- $- $0.290 $- $- $0.257 $0.288
Aerodynamic Efficiency (Non-Viscous) $- $0.391 $0.623 $0.713 $- $0.546 $0.625 $0.673 Structures $- $- $0.517 $0.922 $- $0.390 $0.785 $1.412
Aircraft Systems $- $- $0.019 $0.019 $- $0.015 $0.015 $0.015
System Development $0 $2.481 $3.542 $4.597 $0 $3.278 $3.893 $5.949
Structure $0 $0.392 $0.779 $1.039 $0 $0.732 $0.925 $1.165 Fuselage Group $0 $0.139 $0.296 $0.376 $0 $0.281 $0.337 $0.414
Wing Group $0 $0.204 $0.374 $0.524 $0 $0.350 $0.463 $0.599 Structure Box $0 $0.183 $0.322 $0.456 $0 $0.299 $0.403 $0.518 Flaps $0 $0.011 $0.025 $0.033 $0 $0.025 $0.030 $0.038
Slats $0 $0.005 $0.012 $0.015 $0 $0.011 $0.013 $0.019
Spoi lers $0 $0.002 $0.003 $0.005 $0 $0.003 $0.004 $0.006
Ai lerons $0 $0.001 $0.003 $0.004 $0 $0.003 $0.003 $0.005 Winglets $0 $0.001 $0.009 $0.012 $0 $0.009 $0.010 $0.012
Empennage $0 $0.043 $0.085 $0.106 $0 $0.079 $0.094 $0.111 Stabilizer $0 $0.026 $0.051 $0.064 $0 $0.048 $0.057 $0.064 Fin $0 $0.017 $0.034 $0.042 $0 $0.031 $0.037 $0.047
Landing Gear $0 $0.006 $0.025 $0.032 $0 $0.022 $0.030 $0.041 Propulsion $0 $0.454 $0.562 $0.785 $0 $0.530 $0.668 $1.063
Engine $0 $0.451 $0.560 $0.782 $0 $0.526 $0.664 $1.054
Core $0 $0.391 $0.467 $0.659 $0 $0.425 $0.556 $0.934
Pylon $0 $0.010 $0.016 $0.022 $0 $0.016 $0.019 $0.025 Nacelle $0 $0.050 $0.076 $0.101 $0 $0.085 $0.090 $0.095
Fuel System $0 $0.003 $0.003 $0.003 $0 $0.004 $0.004 $0.009
Systems $0 $0.179 $0.249 $0.313 $0 $0.260 $0.293 $0.460 Auxi l iary Power Unit $0 $0.003 $0.004 $0.004 $0 $0.005 $0.005 $0.013
Surface Controls $0 $0.036 $0.059 $0.077 $0 $0.060 $0.071 $0.086 Hydraulics $0 $0.020 $0.021 $0.024 $0 $0.028 $0.028 $0.061
Electrical $0 $0.039 $0.045 $0.056 $0 $0.044 $0.049 $0.063 Furnishings $0 $0.025 $0.058 $0.077 $0 $0.051 $0.063 $0.109
Air Conditioning $0 $0.003 $0.004 $0.004 $0 $0.005 $0.005 $0.013
Avionics $0 $0.036 $0.041 $0.052 $0 $0.041 $0.046 $0.057 Misc Systems $0 $0.016 $0.017 $0.019 $0 $0.025 $0.025 $0.057
Air Vehicle Integration $0 $0.091 $0.112 $0.133 $0 $0.102 $0.109 $0.114
Software Development $- $0.255 $0.435 $0.480 $- $0.410 $0.500 $1.409
SE/PM $0 $0.120 $0.243 $0.362 $0 $0.224 $0.278 $0.399
Test $0 $0.960 $1.121 $1.437 $0 $0.982 $1.078 $1.288
Support Investment $0 $0.031 $0.041 $0.047 $0 $0.038 $0.041 $0.052

AVIATION FUEL EFFICIENCY TECHNOLOGY ASSESSMENT —APPENDICES TECOLOTE RESEARCH
PG O-8
RJ – 2024 RJ – 2034
Ref E M A Ref E M A
DISCOUNTED (9%)—Mean Costs in BY2013 Billions of USD
Total Manufacturer Investment $0 $1.602 $2.807 $3.998 $0 $1.480 $2.212 $3.192 Technology Maturation $- $0.323 $0.961 $1.596 $- $0.757 $1.350 $1.860
System Development $0 $1.279 $1.846 $2.403 $0 $0.723 $0.862 $1.331 Aircraft $0 $1.003 $1.492 $1.893 $0 $0.597 $0.700 $1.058 Engine $0 $0.277 $0.354 $0.510 $0 $0.125 $0.162 $0.273
DISCOUNTED (9%)—Average Costs in Millions of USD
Total Manufacturer Investment (Nonrecurring) $0 $1,602 $2,807 $3,998 $0 $1,480 $2,212 $3,192
Tota l Production Quantity 961 961 961 961 1,614 1,614 1,614 1,614 Amortized Discounted Dev. Cost – per Vehicle $0 $2 $3 $4 $0 $1 $1 $2
Total Recurring Production Cost
The following tables show the Total Recurring Cost (manufacturer investment) results for each aircraft
configuration and deployment scenario. The detail shows the cost by WBS for producing all the aircraft over
a ten-year purchase period. This cost is the basis for the average unit production cost that supports
AUP calculations.
TAB LE O-10 – TOTAL RECUR R I NG PR OD MEAN COS T SA SA – 2024 SA – 2034
Ref E M A Ref E M A
UNDISCOUNTED—Mean Costs in BY2013 Billions of USD
Total Recurring Production Cost $100.022 $131.910 $143.048 $151.184 $121.353 $175.337 $189.469 $214.860 Total Aircraft $82.390 $106.314 $116.301 $122.615 $100.324 $142.613 $154.877 $178.823
Structure $16.360 $27.395 $35.120 $36.431 $19.187 $43.212 $45.645 $51.365
Fuselage Group $5.072 $8.292 $10.669 $11.005 $5.949 $13.008 $13.749 $14.198 Wing Group $7.331 $14.423 $18.128 $18.927 $8.598 $22.416 $23.676 $28.306
Structure Box $5.783 $12.332 $15.325 $15.956 $6.782 $18.917 $19.923 $23.851
Flaps $0.803 $1.092 $1.384 $1.479 $0.942 $1.755 $1.828 $2.170
Slats $0.355 $0.478 $0.693 $0.717 $0.416 $0.840 $0.934 $1.107 Spoi lers $0.181 $0.223 $0.309 $0.336 $0.212 $0.392 $0.433 $0.505
Ai lerons $0.079 $0.126 $0.164 $0.175 $0.093 $0.207 $0.226 $0.309 Winglets $0.130 $0.171 $0.254 $0.263 $0.152 $0.304 $0.333 $0.364 Empennage $2.329 $2.976 $3.823 $3.862 $2.731 $4.739 $4.850 $5.053
Stabilizer $1.511 $1.836 $2.379 $2.403 $1.772 $2.931 $2.999 $2.941 Fin $0.817 $1.139 $1.444 $1.460 $0.959 $1.808 $1.851 $2.112
Landing Gear $1.628 $1.705 $2.500 $2.637 $1.909 $3.049 $3.371 $3.808
Propulsion $37.326 $44.483 $43.799 $47.706 $46.835 $54.349 $60.812 $71.898
Engine $37.085 $44.204 $43.509 $47.417 $46.552 $53.976 $60.423 $71.386 Core $31.834 $38.879 $37.601 $41.230 $40.394 $46.494 $52.917 $64.170
Pylon $1.626 $1.455 $1.613 $1.684 $1.907 $1.960 $2.069 $2.237 Nacelle $3.625 $3.870 $4.295 $4.503 $4.251 $5.523 $5.436 $4.979 Fuel System $0.241 $0.278 $0.290 $0.289 $0.283 $0.373 $0.389 $0.512
Systems $28.704 $34.435 $37.383 $38.477 $34.302 $45.052 $48.420 $55.560
Auxi l iary Power Unit $0.441 $0.516 $0.543 $0.545 $0.517 $0.698 $0.728 $0.978
Surface Controls $1.854 $3.469 $4.251 $4.559 $2.174 $5.201 $5.714 $6.225
Hydraulics $4.946 $5.522 $5.621 $5.562 $5.801 $7.236 $7.422 $9.537
Electrical $2.950 $4.090 $4.302 $4.438 $3.459 $5.060 $5.469 $5.775 Furnishings $8.843 $9.755 $11.413 $12.075 $10.371 $12.669 $14.323 $16.947 Air Conditioning $0.481 $0.562 $0.591 $0.593 $0.564 $0.758 $0.791 $1.062
Avionics $6.647 $7.756 $7.898 $7.992 $8.434 $9.863 $10.351 $10.493 Misc Systems $2.542 $2.766 $2.763 $2.713 $2.981 $3.566 $3.622 $4.542

AVIATION FUEL EFFICIENCY TECHNOLOGY ASSESSMENT —APPENDICES TECOLOTE RESEARCH
PG O-9
SA – 2024 SA – 2034
Ref E M A Ref E M A
Air Vehicle Integration $10.402 $16.430 $16.808 $17.942 $12.199 $20.608 $21.298 $20.718
SE/PM $7.230 $9.167 $9.939 $10.627 $8.830 $12.115 $13.294 $15.320 DISCOUNTED (9%) —Mean Costs in BY2013 Billions of USD
Total Production no Profit with 9% Discounting $27.950 $38.311 $41.799 $44.228 $14.303 $21.680 $23.442 $26.686 Buy Quantity 4,024 4,024 4,024 4,024 5,477 5,477 5,477 5,477 Buy Quantity—Year 1 349 349 349 349 475 475 475 475
Buy Quantity—Year 2 360 360 360 360 490 490 490 490 Buy Quantity—Year 3 371 371 371 371 505 505 505 505
Buy Quantity—Year 4 383 383 383 383 521 521 521 521 Buy Quantity—Year 5 395 395 395 395 537 537 537 537
Buy Quantity—Year 6 407 407 407 407 554 554 554 554 Buy Quantity—Year 7 420 420 420 420 571 571 571 571 Buy Quantity—Year 8 433 433 433 433 589 589 589 589
Buy Quantity—Year 9 446 446 446 446 608 608 608 608 Buy Quantity—Year 10 460 460 460 460 627 627 627 627
TAB LE O-11 – TOTAL RECUR R I NG PR OD MEAN COS T STA STA – 2024 STA – 2034 Ref E M A Ref E M A
UNDISCOUNTED—Mean Costs in BY2013 Billions of USD Total Recurring Production Cost $150.229 $182.488 $211.128 $230.644 $196.070 $277.379 $303.275 $342.448
Total Aircraft $115.156 $135.550 $161.045 $174.696 $151.193 $212.719 $231.522 $266.677
Structure $30.948 $40.423 $58.577 $66.407 $39.119 $76.772 $88.218 $98.672 Fuselage Group $14.401 $18.767 $27.736 $29.677 $18.207 $36.571 $39.510 $42.162
Wing Group $8.789 $13.688 $19.547 $24.248 $11.107 $25.460 $32.115 $38.642 Structure Box $7.475 $11.687 $16.754 $21.957 $9.447 $21.800 $29.061 $34.954
Flaps $0.708 $0.842 $1.162 $1.172 $0.895 $1.541 $1.560 $1.907 Slats $0.432 $0.497 $0.756 $0.809 $0.545 $0.998 $1.080 $1.271
Spoi lers $0.117 $0.134 $0.193 $0.195 $0.148 $0.258 $0.262 $0.310
Ai lerons $0.057 $0.077 $0.105 $0.113 $0.072 $0.139 $0.151 $0.200 Winglets $0.000 $0.451 $0.578 $0.000 $0.000 $0.724 $0.000 $0.000
Empennage $3.521 $3.720 $5.106 $5.508 $4.450 $6.697 $7.227 $7.443
Stabilizer $2.514 $2.604 $3.590 $3.681 $3.178 $4.709 $4.812 $4.998
Fin $1.007 $1.116 $1.516 $1.827 $1.273 $1.988 $2.416 $2.444 Landing Gear $4.236 $4.248 $6.187 $6.975 $5.354 $8.044 $9.366 $10.425
Propulsion $50.426 $57.556 $59.936 $63.633 $68.632 $81.354 $84.659 $98.885 Engine $50.254 $57.367 $59.740 $63.440 $68.415 $81.086 $84.385 $98.529 Core $42.050 $49.233 $50.812 $54.493 $58.047 $69.205 $73.020 $86.949
Pylon $2.538 $2.255 $2.466 $2.454 $3.209 $3.163 $3.185 $3.560 Nacelle $5.666 $5.879 $6.462 $6.492 $7.160 $8.718 $8.180 $8.020
Fuel System $0.172 $0.189 $0.196 $0.193 $0.217 $0.268 $0.275 $0.356 Systems $33.782 $37.571 $42.531 $44.657 $43.442 $54.594 $58.644 $69.120
Auxi l iary Power Unit $0.351 $0.406 $0.427 $0.428 $0.444 $0.585 $0.608 $0.801 Surface Controls $1.424 $2.342 $3.066 $3.337 $1.800 $4.013 $4.368 $4.800 Hydraulics $5.893 $6.260 $6.339 $6.225 $7.451 $8.697 $8.803 $11.350
Electrical $2.440 $3.429 $3.701 $3.949 $3.085 $4.654 $5.076 $5.645 Furnishings $13.492 $13.595 $17.076 $18.501 $17.054 $20.459 $22.933 $27.331
Air Conditioning $0.512 $0.592 $0.622 $0.624 $0.647 $0.853 $0.887 $1.170
Avionics $6.340 $7.460 $7.784 $8.146 $8.751 $10.512 $11.103 $11.773
Misc Systems $3.331 $3.488 $3.517 $3.447 $4.211 $4.820 $4.866 $6.250 Air Vehicle Integration $24.241 $34.255 $35.461 $39.709 $30.644 $45.536 $50.520 $51.360
SE/PM $10.832 $12.684 $14.623 $16.239 $14.233 $19.124 $21.233 $24.410

AVIATION FUEL EFFICIENCY TECHNOLOGY ASSESSMENT —APPENDICES TECOLOTE RESEARCH
PG O-10
STA – 2024 STA – 2034
Ref E M A Ref E M A
DISCOUNTED (9%) —Mean Costs in BY2013 Billions of USD
Total Production no Profit with 9% Discounting $41.763 $61.080 $80.011 $92.035 $22.992 $34.105 $37.346 $42.314 Buy Quantity 1,426 1,426 1,426 1,426 2,131 2,131 2,131 2,131
Buy Quantity—Year 1 118 118 118 118 177 177 177 177 Buy Quantity—Year 2 123 123 123 123 184 184 184 184 Buy Quantity—Year 3 128 128 128 128 191 191 191 191
Buy Quantity—Year 4 133 133 133 133 199 199 199 199 Buy Quantity—Year 5 139 139 139 139 207 207 207 207
Buy Quantity—Year 6 145 145 145 145 216 216 216 216 Buy Quantity—Year 7 150 150 150 150 225 225 225 225
Buy Quantity—Year 8 156 156 156 156 234 234 234 234 Buy Quantity—Year 9 163 163 163 163 243 243 243 243 Buy Quantity—Year 10 170 170 170 170 254 254 254 254
TAB LE O-12 – TOTAL RECUR R I NG PR OD MEAN COS T RJ RJ – 2024 RJ – 2034 Ref E M A Ref E M A
UNDISCOUNTED—Mean Costs in BY2013 Billions of USD Total Recurring Production Cost $19.160 $23.783 $25.902 $27.015 $27.561 $37.299 $39.201 $43.754
Total Aircraft $16.642 $20.495 $22.448 $23.396 $24.003 $32.406 $34.093 $38.472 Structure $3.311 $5.780 $6.767 $7.076 $4.517 $9.473 $10.280 $10.572
Fuselage Group $0.991 $1.658 $1.963 $2.042 $1.351 $2.799 $2.994 $3.169
Wing Group $1.499 $3.179 $3.699 $3.886 $2.044 $5.137 $5.610 $5.601 Structure Box $1.114 $2.702 $3.091 $3.234 $1.520 $4.277 $4.673 $4.522
Flaps $0.215 $0.224 $0.281 $0.303 $0.293 $0.408 $0.438 $0.489 Slats $0.073 $0.110 $0.139 $0.148 $0.099 $0.192 $0.212 $0.266
Spoi lers $0.031 $0.033 $0.042 $0.046 $0.042 $0.060 $0.066 $0.082 Ai lerons $0.023 $0.028 $0.035 $0.039 $0.031 $0.050 $0.056 $0.072
Winglets $0.043 $0.083 $0.111 $0.116 $0.059 $0.151 $0.166 $0.170
Empennage $0.532 $0.634 $0.704 $0.724 $0.726 $0.973 $1.041 $1.118 Stabilizer $0.350 $0.380 $0.426 $0.437 $0.477 $0.590 $0.629 $0.647
Fin $0.183 $0.254 $0.279 $0.287 $0.249 $0.383 $0.412 $0.470
Landing Gear $0.290 $0.309 $0.400 $0.425 $0.395 $0.564 $0.634 $0.685
Propulsion $8.362 $9.140 $9.736 $10.206 $12.562 $14.575 $14.957 $18.034 Engine $8.300 $9.074 $9.669 $10.139 $12.478 $14.477 $14.855 $17.906
Core $7.257 $7.930 $8.431 $8.854 $11.055 $12.656 $13.012 $16.276 Pylon $0.368 $0.359 $0.388 $0.400 $0.502 $0.545 $0.576 $0.503 Nacelle $0.674 $0.785 $0.850 $0.884 $0.920 $1.276 $1.267 $1.127
Fuel System $0.062 $0.066 $0.067 $0.067 $0.084 $0.098 $0.102 $0.128 Systems $4.969 $5.576 $5.945 $6.114 $6.925 $8.358 $8.856 $9.865
Auxi l iary Power Unit $0.091 $0.102 $0.107 $0.107 $0.124 $0.157 $0.163 $0.207 Surface Controls $0.452 $0.589 $0.692 $0.735 $0.617 $0.965 $1.052 $1.114
Hydraulics $1.023 $1.101 $1.120 $1.103 $1.395 $1.637 $1.669 $2.026 Electrical $0.574 $0.718 $0.742 $0.766 $0.783 $1.016 $1.078 $1.098 Furnishings $1.358 $1.464 $1.667 $1.777 $1.853 $2.186 $2.421 $2.786
Air Conditioning $0.085 $0.096 $0.100 $0.101 $0.116 $0.147 $0.152 $0.194 Avionics $0.920 $1.016 $1.025 $1.046 $1.400 $1.536 $1.599 $1.587
Misc Systems $0.466 $0.490 $0.490 $0.478 $0.636 $0.715 $0.722 $0.854
Air Vehicle Integration $1.306 $1.903 $1.927 $2.003 $1.781 $2.683 $2.765 $2.564
SE/PM $1.212 $1.385 $1.527 $1.617 $1.777 $2.211 $2.344 $2.719
DISCOUNTED (9%) —Mean Costs in BY2013 Billions of USD Total Production no Profit with 9% Discounting $5.289 $6.778 $7.420 $7.747 $3.209 $4.523 $4.761 $5.327
Buy Quantity 961 961 961 961 1,614 1,614 1,614 1,614 Buy Quantity—Year 1 75 75 75 75 126 126 126 126

AVIATION FUEL EFFICIENCY TECHNOLOGY ASSESSMENT —APPENDICES TECOLOTE RESEARCH
PG O-11
RJ – 2024 RJ – 2034
Ref E M A Ref E M A
Buy Quantity—Year 2 79 79 79 79 133 133 133 133
Buy Quantity—Year 3 83 83 83 83 140 140 140 140 Buy Quantity—Year 4 88 88 88 88 148 148 148 148
Buy Quantity—Year 5 93 93 93 93 156 156 156 156 Buy Quantity—Year 6 98 98 98 98 164 164 164 164 Buy Quantity—Year 7 103 103 103 103 172 172 172 172
Buy Quantity—Year 8 108 108 108 108 182 182 182 182 Buy Quantity—Year 9 114 114 114 114 191 191 191 191
Buy Quantity—Year 10 120 120 120 120 202 202 202 202
Average Unit Production Cost
TAB LE O-13 – SA AVER AG E UNI T PR OD UCTI ON MEAN COS T SA – 2024 SA – 2034
Ref E M A Ref E M A
DISCOUNTED (9%) —Average Costs in Millions of USD
AUP Cost $7 $10 $10 $11 $3 $4 $4 $5 Aircraft Discounted $5 $8 $8 $8 $2 $3 $3 $3
Engine Discounted $2 $3 $3 $3 $1 $1 $1 $1
AUP Cost with 20% Profit $8 $11 $12 $13 $3 $5 $5 $6
AUP Price – Ai rcraft Discounted with 20% Profi t
$6 $8 $9 $10 $2 $4 $4 $4
AUP Price – Engine Discounted
with 20% Profi t
$3 $3 $3 $4 $1 $1 $1 $2
TAB LE O-14 – STA AVER AG E UNI T PR OD UCTI ON MEAN COS T STA – 2024 S%A – 2034
Ref E M A Ref E M A
DISCOUNTED (9%)—Average Costs in Millions of USD
AUP Cost $30 $38 $45 $49 $11 $17 $18 $21
Aircraft Discounted $22 $28 $34 $38 $8 $13 $14 $16
Engine Discounted $8 $1 $10 $11 $3 $4 $4 $5 AUP Cost with 20% Profit $36 $46 $54 $59 $13 $20 $22 $25
AUP Price – Ai rcraft Discounted
with 20% Profi t
$26 $34 $41 $45 $10 $15 $17 $19
AUP Price – Engine Discounted
with 20% Profi t
$10 $12 $12 $13 $4 $5 $5 $6
TAB LE O-15 – RJ AVER AG E UNI T PR OD UCTI ON MEAN COS T RJ – 2024 RJ – 2034
Ref E M A Ref E M A
DISCOUNTED (9%) —Average Costs in Millions of USD
AUP Cost $6 $7 $8 $8 $2 $3 $3 $3 Aircraft Discounted $3 $5 $5 $5 $1 $2 $2 $2 Engine Discounted $2 $2 $2 $3 $1 $1 $1 $1
AUP Cost with 20% Profit $7 $8 $9 $10 $2 $3 $4 $4
AUP Price – Ai rcraft Discounted with 20% Profi t
$4 $6 $6 $7 $1 $2 $2 $3
AUP Price – Engine Discounted with 20% Profi t
$2 $3 $3 $3 $1 $1 $1 $1

AVIATION FUEL EFFICIENCY TECHNOLOGY ASSESSMENT —APPENDICES TECOLOTE RESEARCH
PG O-12
Total Operational Cost (Fuel & Maintenance)
The following tables show the Total Nonrecurring Cost (manufacturer investment) results for each ai rcraft
configuration and deployment scenario. The detail show the cost for technology maturation for each
candidate, the overall system development cost, and the amortized development cost that is added to the
average unit production cost to support AUP calculations.
TAB LE O-16 – SA TOTAL OPER ATI ONAL MEAN COS T (FUEL & MAI NT) SA – 2024 SA – 2034
Ref E M A Ref E M A
UNDISCOUNTED—Mean Costs in BY2013 Billions of USD
Total Operational Expense $242.852 $183.722 $164.898 $153.206 $376.136 $254.142 $234.631 $217.546 Fuel Cost $203.838 $151.512 $134.138 $122.229 $323.035 $212.416 $192.474 $174.189
Tota l Fuel Costs for Purchase – Year 1 $16.880 $12.547 $11.108 $10.122 $26.749 $17.589 $15.938 $14.424
Tota l Fuel Costs for Purchase – Year 2 $17.581 $13.068 $11.569 $10.542 $27.861 $18.321 $16.601 $15.023
Tota l Fuel Costs for Purchase – Year 3 $18.293 $13.597 $12.038 $10.969 $28.993 $19.064 $17.275 $15.634 Tota l Fuel Costs for Purchase – Year 4 $19.068 $14.173 $12.548 $11.434 $30.201 $19.859 $17.995 $16.285
Tota l Fuel Costs for Purchase – Year 5 $19.857 $14.759 $13.067 $11.907 $31.431 $20.668 $18.727 $16.948
Tota l Fuel Costs for Purchase – Year 6 $20.658 $15.355 $13.594 $12.387 $32.740 $21.529 $19.508 $17.654 Tota l Fuel Costs for Purchase – Year 7 $21.525 $15.999 $14.165 $12.907 $34.072 $22.405 $20.301 $18.373
Tota l Fuel Costs for Purchase – Year 8 $22.406 $16.655 $14.745 $13.436 $35.487 $23.335 $21.144 $19.136 Tota l Fuel Costs for Purchase – Year 9 $23.303 $17.321 $15.335 $13.973 $36.987 $24.322 $22.038 $19.945
Tota l Fuel Costs for Purchase – Year 10 $24.268 $18.038 $15.969 $14.552 $38.513 $25.325 $22.947 $20.767 Maintenance Cost – Rampup $39.014 $32.210 $30.760 $30.978 $53.101 $41.725 $42.157 $43.357
Tota l Maint Costs for Purchase – Year 1 $3.384 $2.794 $2.668 $2.687 $4.605 $3.619 $3.656 $3.760
Tota l Maint Costs for Purchase – Year 2 $3.490 $2.882 $2.752 $2.771 $4.751 $3.733 $3.772 $3.879 Tota l Maint Costs for Purchase – Year 3 $3.597 $2.970 $2.836 $2.856 $4.896 $3.847 $3.887 $3.998
Tota l Maint Costs for Purchase – Year 4 $3.713 $3.066 $2.928 $2.948 $5.051 $3.969 $4.010 $4.124 Tota l Maint Costs for Purchase – Year 5 $3.830 $3.162 $3.019 $3.041 $5.206 $4.091 $4.133 $4.251
Tota l Maint Costs for Purchase – Year 6 $3.946 $3.258 $3.111 $3.133 $5.371 $4.221 $4.264 $4.386
Tota l Maint Costs for Purchase – Year 7 $4.072 $3.362 $3.211 $3.233 $5.536 $4.350 $4.395 $4.520 Tota l Maint Costs for Purchase – Year 8 $4.198 $3.466 $3.310 $3.333 $5.711 $4.487 $4.534 $4.663
Tota l Maint Costs for Purchase – Year 9 $4.324 $3.570 $3.409 $3.433 $5.895 $4.632 $4.680 $4.813
Tota l Maint Costs for Purchase – Year 10 $4.460 $3.682 $3.516 $3.541 $6.079 $4.777 $4.826 $4.963
DISCOUNTED (9%) —Mean Costs in BY2013 Billions of USD Total Operational Expense $51.653 $39.053 $35.036 $32.531 $33.755 $22.787 $21.025 $19.479
Fuel Cost $43.641 $32.438 $28.718 $26.169 $29.149 $19.167 $17.368 $15.718 Tota l Fuel Costs for Purchase – Year 1 $5.316 $3.951 $3.498 $3.187 $3.550 $2.335 $2.115 $1.915 Tota l Fuel Costs for Purchase – Year 2 $5.079 $3.775 $3.342 $3.046 $3.393 $2.231 $2.022 $1.829
Tota l Fuel Costs for Purchase – Year 3 $4.849 $3.604 $3.191 $2.907 $3.239 $2.130 $1.930 $1.747 Tota l Fuel Costs for Purchase – Year 4 $4.637 $3.447 $3.051 $2.780 $3.095 $2.035 $1.844 $1.669
Tota l Fuel Costs for Purchase – Year 5 $4.430 $3.293 $2.915 $2.656 $2.956 $1.943 $1.761 $1.594 Tota l Fuel Costs for Purchase – Year 6 $4.228 $3.143 $2.782 $2.535 $2.824 $1.857 $1.683 $1.523
Tota l Fuel Costs for Purchase – Year 7 $4.042 $3.004 $2.660 $2.424 $2.697 $1.773 $1.607 $1.454 Tota l Fuel Costs for Purchase – Year 8 $3.860 $2.869 $2.540 $2.314 $2.577 $1.694 $1.535 $1.389 Tota l Fuel Costs for Purchase – Year 9 $3.683 $2.737 $2.424 $2.208 $2.464 $1.620 $1.468 $1.329
Tota l Fuel Costs for Purchase – Year 10 $3.519 $2.615 $2.315 $2.110 $2.354 $1.548 $1.402 $1.269 Maintenance Cost – Rampup $8.013 $6.615 $6.317 $6.362 $4.606 $3.620 $3.657 $3.761
Tota l Maint Costs for Purchase – Year 1 $1.015 $0.838 $0.800 $0.806 $0.584 $0.459 $0.463 $0.477
Tota l Maint Costs for Purchase – Year 2 $0.961 $0.793 $0.757 $0.763 $0.552 $0.434 $0.439 $0.451
Tota l Maint Costs for Purchase – Year 3 $0.908 $0.750 $0.716 $0.721 $0.522 $0.410 $0.415 $0.426 Tota l Maint Costs for Purchase – Year 4 $0.860 $0.710 $0.678 $0.683 $0.494 $0.388 $0.392 $0.404
Tota l Maint Costs for Purchase – Year 5 $0.814 $0.672 $0.642 $0.646 $0.467 $0.367 $0.371 $0.382 Tota l Maint Costs for Purchase – Year 6 $0.769 $0.635 $0.607 $0.611 $0.442 $0.348 $0.351 $0.361 Tota l Maint Costs for Purchase – Year 7 $0.728 $0.601 $0.574 $0.578 $0.418 $0.329 $0.332 $0.342

AVIATION FUEL EFFICIENCY TECHNOLOGY ASSESSMENT —APPENDICES TECOLOTE RESEARCH
PG O-13
SA – 2024 SA – 2034
Ref E M A Ref E M A
Tota l Maint Costs for Purchase – Year 8 $0.689 $0.569 $0.543 $0.547 $0.396 $0.311 $0.314 $0.323
Tota l Maint Costs for Purchase – Year 9 $0.651 $0.538 $0.513 $0.517 $0.375 $0.295 $0.298 $0.306 Tota l Maint Costs for Purchase – Year 10 $0.616 $0.509 $0.486 $0.489 $0.355 $0.279 $0.282 $0.290
TAB LE O-17 – STA TOTAL OPER ATI ONAL MEAN COS T (FUEL & MAI NT) STA – 2024 STA – 2034
Ref E M A Ref E M A
UNDISCOUNTED—Mean Costs in BY2013 Billions of USD
Total Operational Expense $382.486 $281.743 $259.680 $228.439 $654.853 $441.026 $379.752 $363.317 Fuel Cost $339.589 $246.741 $226.628 $195.116 $590.761 $391.600 $330.006 $313.319
Tota l Fuel Costs for Purchase – Year 1 $26.865 $19.520 $17.929 $15.436 $46.753 $30.991 $26.117 $24.796
Tota l Fuel Costs for Purchase – Year 2 $28.275 $20.544 $18.869 $16.246 $49.205 $32.617 $27.487 $26.097
Tota l Fuel Costs for Purchase – Year 3 $29.703 $21.582 $19.823 $17.067 $51.606 $34.208 $28.828 $27.370 Tota l Fuel Costs for Purchase – Year 4 $31.151 $22.634 $20.789 $17.898 $54.236 $35.952 $30.297 $28.765
Tota l Fuel Costs for Purchase – Year 5 $32.812 $23.841 $21.898 $18.853 $57.028 $37.802 $31.857 $30.246 Tota l Fuel Costs for Purchase – Year 6 $34.481 $25.054 $23.011 $19.812 $59.949 $39.739 $33.488 $31.795 Tota l Fuel Costs for Purchase – Year 7 $36.199 $26.302 $24.158 $20.799 $63.041 $41.788 $35.215 $33.435
Tota l Fuel Costs for Purchase – Year 8 $38.024 $27.628 $25.375 $21.847 $66.160 $43.856 $36.958 $35.089 Tota l Fuel Costs for Purchase – Year 9 $40.053 $29.102 $26.730 $23.013 $69.554 $46.105 $38.853 $36.889
Tota l Fuel Costs for Purchase – Year 10 $42.025 $30.535 $28.046 $24.146 $73.229 $48.542 $40.907 $38.838
Maintenance Cost – Rampup $42.897 $35.002 $33.052 $33.322 $64.092 $49.426 $49.747 $49.998
Tota l Maintenance Costs for Purchase – Year 1 $3.557 $2.902 $2.741 $2.763 $5.316 $4.100 $4.126 $4.147 Tota l Maintenance Costs for Purchase – Year 2 $3.708 $3.025 $2.857 $2.880 $5.541 $4.273 $4.301 $4.323 Tota l Maintenance Costs for Purchase – Year 3 $3.858 $3.148 $2.972 $2.997 $5.756 $4.439 $4.468 $4.490
Tota l Maintenance Costs for Purchase – Year 4 $4.007 $3.269 $3.087 $3.112 $5.991 $4.620 $4.650 $4.674 Tota l Maintenance Costs for Purchase – Year 5 $4.180 $3.411 $3.220 $3.247 $6.239 $4.811 $4.843 $4.867
Tota l Maintenance Costs for Purchase – Year 6 $4.350 $3.550 $3.352 $3.379 $6.496 $5.009 $5.042 $5.067
Tota l Maintenance Costs for Purchase – Year 7 $4.523 $3.691 $3.485 $3.514 $6.765 $5.217 $5.251 $5.277
Tota l Maintenance Costs for Purchase – Year 8 $4.705 $3.839 $3.625 $3.655 $7.032 $5.423 $5.458 $5.485 Tota l Maintenance Costs for Purchase – Year 9 $4.909 $4.005 $3.782 $3.813 $7.321 $5.646 $5.683 $5.711
Tota l Maintenance Costs for Purchase – Year 10 $5.101 $4.162 $3.930 $3.963 $7.634 $5.887 $5.925 $5.955
DISCOUNTED (9%) —Mean Costs in BY2013 Billions of USD Total Operational Expense $80.916 $59.575 $54.903 $48.262 $58.437 $39.335 $33.845 $32.372
Fuel Cost $72.164 $52.434 $48.159 $41.463 $52.914 $35.075 $29.558 $28.064
Tota l Fuel Costs for Purchase – Year 1 $8.453 $6.142 $5.641 $4.857 $6.200 $4.110 $3.464 $3.289
Tota l Fuel Costs for Purchase – Year 2 $8.162 $5.930 $5.447 $4.690 $5.987 $3.969 $3.344 $3.175 Tota l Fuel Costs for Purchase – Year 3 $7.866 $5.716 $5.250 $4.520 $5.761 $3.819 $3.218 $3.055
Tota l Fuel Costs for Purchase – Year 4 $7.569 $5.499 $5.051 $4.349 $5.554 $3.682 $3.103 $2.946
Tota l Fuel Costs for Purchase – Year 5 $7.314 $5.314 $4.881 $4.202 $5.358 $3.552 $2.993 $2.842 Tota l Fuel Costs for Purchase – Year 6 $7.051 $5.123 $4.706 $4.051 $5.167 $3.425 $2.887 $2.741
Tota l Fuel Costs for Purchase – Year 7 $6.791 $4.935 $4.532 $3.902 $4.985 $3.305 $2.785 $2.644 Tota l Fuel Costs for Purchase – Year 8 $6.545 $4.755 $4.368 $3.760 $4.800 $3.182 $2.681 $2.546
Tota l Fuel Costs for Purchase – Year 9 $6.325 $4.595 $4.221 $3.634 $4.629 $3.069 $2.586 $2.455 Tota l Fuel Costs for Purchase – Year 10 $6.088 $4.424 $4.063 $3.498 $4.472 $2.964 $2.498 $2.372
Maintenance Cost – Rampup $8.752 $7.141 $6.743 $6.798 $5.523 $4.259 $4.287 $4.309
Tota l Maintenance Costs for Purchase – Year 1 $1.067 $0.871 $0.822 $0.829 $0.674 $0.520 $0.523 $0.526 Tota l Maintenance Costs for Purchase – Year 2 $1.021 $0.833 $0.786 $0.793 $0.644 $0.497 $0.500 $0.503
Tota l Maintenance Costs for Purchase – Year 3 $0.974 $0.795 $0.751 $0.757 $0.614 $0.473 $0.477 $0.479
Tota l Maintenance Costs for Purchase – Year 4 $0.928 $0.757 $0.715 $0.721 $0.586 $0.452 $0.455 $0.457
Tota l Maintenance Costs for Purchase – Year 5 $0.888 $0.725 $0.684 $0.690 $0.560 $0.432 $0.435 $0.437
Tota l Maintenance Costs for Purchase – Year 6 $0.848 $0.692 $0.654 $0.659 $0.535 $0.413 $0.415 $0.417
Tota l Maintenance Costs for Purchase – Year 7 $0.809 $0.660 $0.623 $0.629 $0.511 $0.394 $0.397 $0.399

AVIATION FUEL EFFICIENCY TECHNOLOGY ASSESSMENT —APPENDICES TECOLOTE RESEARCH
PG O-14
STA – 2024 STA – 2034
Ref E M A Ref E M A
Tota l Maintenance Costs for Purchase – Year 8 $0.772 $0.630 $0.595 $0.600 $0.487 $0.376 $0.378 $0.380
Tota l Maintenance Costs for Purchase – Year 9 $0.739 $0.603 $0.569 $0.574 $0.466 $0.359 $0.361 $0.363 Tota l Maintenance Costs for Purchase – Year 10 $0.705 $0.575 $0.543 $0.547 $0.445 $0.344 $0.346 $0.348
TAB LE O-18 – RJ TOTAL OPER ATI ONAL MEAN COS T (FUEL & MAI NT) RJ – 2024 RJ – 2034
Ref E M A Ref E M A
UNDISCOUNTED—Mean Costs in BY2013 Billions of USD
Total Operational Expense $41.625 $31.237 $29.397 $27.068 $75.814 $53.363 $48.710 $45.308 Fuel Cost $34.697 $25.076 $23.264 $20.903 $64.178 $43.055 $38.363 $34.828
Tota l Fuel Costs for Purchase – Year 1 $2.581 $1.865 $1.731 $1.555 $4.776 $3.204 $2.855 $2.592
Tota l Fuel Costs for Purchase – Year 2 $2.745 $1.984 $1.841 $1.654 $5.090 $3.415 $3.043 $2.762
Tota l Fuel Costs for Purchase – Year 3 $2.912 $2.105 $1.953 $1.754 $5.410 $3.629 $3.234 $2.936 Tota l Fuel Costs for Purchase – Year 4 $3.117 $2.253 $2.090 $1.878 $5.774 $3.874 $3.452 $3.134
Tota l Fuel Costs for Purchase – Year 5 $3.327 $2.404 $2.230 $2.004 $6.145 $4.123 $3.674 $3.335 Tota l Fuel Costs for Purchase – Year 6 $3.539 $2.558 $2.373 $2.132 $6.523 $4.376 $3.899 $3.540 Tota l Fuel Costs for Purchase – Year 7 $3.756 $2.715 $2.518 $2.263 $6.908 $4.634 $4.129 $3.749
Tota l Fuel Costs for Purchase – Year 8 $3.977 $2.874 $2.666 $2.396 $7.380 $4.951 $4.412 $4.005 Tota l Fuel Costs for Purchase – Year 9 $4.238 $3.063 $2.842 $2.553 $7.820 $5.246 $4.675 $4.244
Tota l Fuel Costs for Purchase – Year 10 $4.505 $3.256 $3.020 $2.714 $8.351 $5.602 $4.992 $4.532
Maintenance Cost – Rampup $6.929 $6.160 $6.133 $6.165 $11.636 $10.308 $10.347 $10.481
Tota l Maintenance Costs for Purchase – Year 1 $0.541 $0.481 $0.479 $0.481 $0.908 $0.805 $0.808 $0.818 Tota l Maintenance Costs for Purchase – Year 2 $0.570 $0.506 $0.504 $0.507 $0.959 $0.849 $0.853 $0.864 Tota l Maintenance Costs for Purchase – Year 3 $0.598 $0.532 $0.530 $0.532 $1.009 $0.894 $0.897 $0.909
Tota l Maintenance Costs for Purchase – Year 4 $0.634 $0.564 $0.562 $0.565 $1.067 $0.945 $0.949 $0.961 Tota l Maintenance Costs for Purchase – Year 5 $0.671 $0.596 $0.593 $0.597 $1.125 $0.996 $1.000 $1.013
Tota l Maintenance Costs for Purchase – Year 6 $0.707 $0.628 $0.625 $0.629 $1.182 $1.047 $1.051 $1.065
Tota l Maintenance Costs for Purchase – Year 7 $0.743 $0.660 $0.657 $0.661 $1.240 $1.098 $1.103 $1.117
Tota l Maintenance Costs for Purchase – Year 8 $0.779 $0.692 $0.689 $0.693 $1.312 $1.162 $1.167 $1.182 Tota l Maintenance Costs for Purchase – Year 9 $0.822 $0.731 $0.727 $0.731 $1.377 $1.220 $1.224 $1.240
Tota l Maintenance Costs for Purchase – Year 10 $0.865 $0.769 $0.766 $0.770 $1.456 $1.290 $1.295 $1.312
DISCOUNTED (9%) —Mean Costs in BY2013 Billions of USD Total Operational Expense $8.751 $6.558 $6.168 $5.675 $6.738 $4.734 $4.317 $4.012
Fuel Cost $7.350 $5.312 $4.928 $4.428 $5.743 $3.853 $3.433 $3.117
Tota l Fuel Costs for Purchase – Year 1 $0.817 $0.590 $0.548 $0.492 $0.638 $0.428 $0.382 $0.346
Tota l Fuel Costs for Purchase – Year 2 $0.797 $0.576 $0.534 $0.480 $0.624 $0.419 $0.373 $0.339 Tota l Fuel Costs for Purchase – Year 3 $0.775 $0.560 $0.520 $0.467 $0.609 $0.408 $0.364 $0.330
Tota l Fuel Costs for Purchase – Year 4 $0.762 $0.550 $0.511 $0.459 $0.596 $0.400 $0.356 $0.323
Tota l Fuel Costs for Purchase – Year 5 $0.746 $0.539 $0.500 $0.449 $0.582 $0.390 $0.348 $0.316 Tota l Fuel Costs for Purchase – Year 6 $0.728 $0.526 $0.488 $0.438 $0.567 $0.380 $0.339 $0.307
Tota l Fuel Costs for Purchase – Year 7 $0.709 $0.512 $0.475 $0.427 $0.550 $0.369 $0.329 $0.299 Tota l Fuel Costs for Purchase – Year 8 $0.688 $0.497 $0.461 $0.415 $0.540 $0.362 $0.323 $0.293
Tota l Fuel Costs for Purchase – Year 9 $0.673 $0.486 $0.451 $0.405 $0.525 $0.352 $0.314 $0.285 Tota l Fuel Costs for Purchase – Year 10 $0.656 $0.474 $0.440 $0.395 $0.514 $0.345 $0.307 $0.279
Maintenance Cost – Rampup $1.401 $1.246 $1.240 $1.247 $0.994 $0.881 $0.884 $0.896
Tota l Maintenance Costs for Purchase – Year 1 $0.162 $0.144 $0.144 $0.144 $0.115 $0.102 $0.102 $0.104 Tota l Maintenance Costs for Purchase – Year 2 $0.157 $0.139 $0.139 $0.139 $0.111 $0.099 $0.099 $0.100
Tota l Maintenance Costs for Purchase – Year 3 $0.151 $0.134 $0.134 $0.134 $0.108 $0.095 $0.096 $0.097
Tota l Maintenance Costs for Purchase – Year 4 $0.147 $0.131 $0.130 $0.131 $0.104 $0.093 $0.093 $0.094
Tota l Maintenance Costs for Purchase – Year 5 $0.143 $0.127 $0.126 $0.127 $0.101 $0.089 $0.090 $0.091
Tota l Maintenance Costs for Purchase – Year 6 $0.138 $0.122 $0.122 $0.123 $0.097 $0.086 $0.087 $0.088
Tota l Maintenance Costs for Purchase – Year 7 $0.133 $0.118 $0.118 $0.118 $0.094 $0.083 $0.083 $0.084
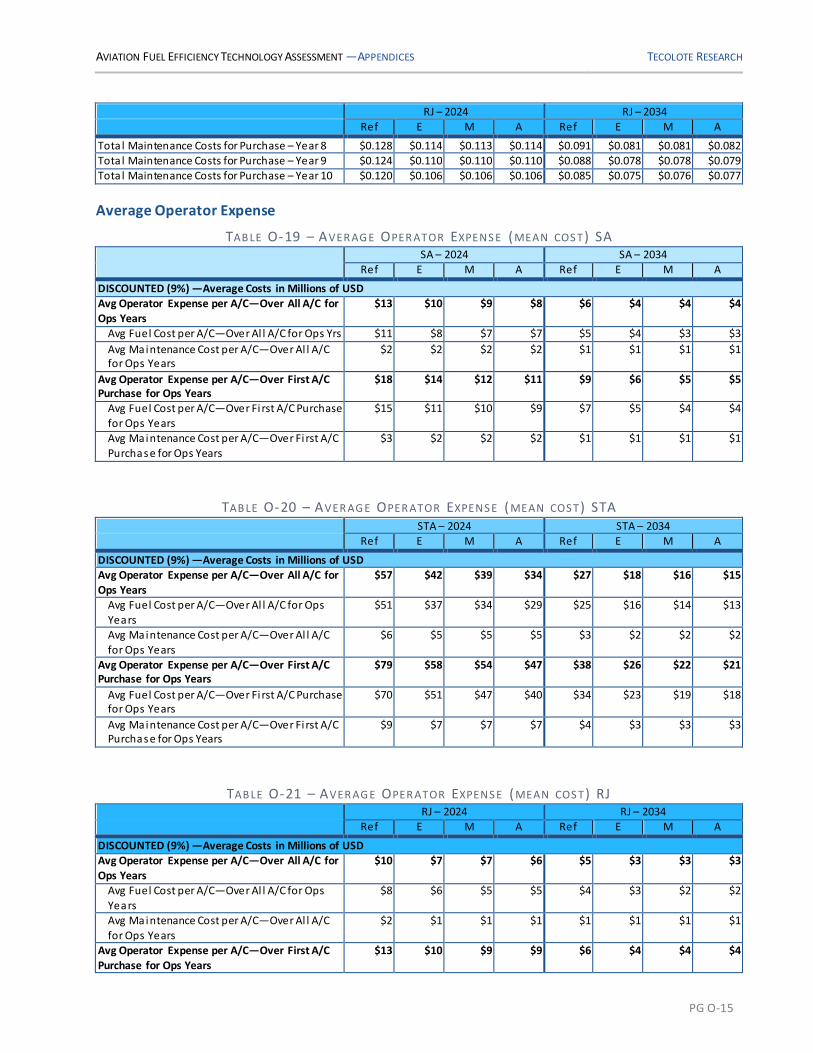
AVIATION FUEL EFFICIENCY TECHNOLOGY ASSESSMENT —APPENDICES TECOLOTE RESEARCH
PG O-15
RJ – 2024 RJ – 2034
Ref E M A Ref E M A
Tota l Maintenance Costs for Purchase – Year 8 $0.128 $0.114 $0.113 $0.114 $0.091 $0.081 $0.081 $0.082
Tota l Maintenance Costs for Purchase – Year 9 $0.124 $0.110 $0.110 $0.110 $0.088 $0.078 $0.078 $0.079 Tota l Maintenance Costs for Purchase – Year 10 $0.120 $0.106 $0.106 $0.106 $0.085 $0.075 $0.076 $0.077
Average Operator Expense
TAB LE O-19 – AVER AG E OPER ATOR EXPENS E (MEAN COS T) SA SA – 2024 SA – 2034
Ref E M A Ref E M A
DISCOUNTED (9%) —Average Costs in Millions of USD
Avg Operator Expense per A/C—Over All A/C for Ops Years
$13 $10 $9 $8 $6 $4 $4 $4
Avg Fuel Cost per A/C—Over Al l A/C for Ops Yrs $11 $8 $7 $7 $5 $4 $3 $3
Avg Maintenance Cost per A/C—Over Al l A/C for Ops Years
$2 $2 $2 $2 $1 $1 $1 $1
Avg Operator Expense per A/C—Over First A/C Purchase for Ops Years
$18 $14 $12 $11 $9 $6 $5 $5
Avg Fuel Cost per A/C—Over Fi rst A/C Purchase for Ops Years
$15 $11 $10 $9 $7 $5 $4 $4
Avg Maintenance Cost per A/C—Over Fi rst A/C
Purchase for Ops Years
$3 $2 $2 $2 $1 $1 $1 $1
TAB LE O-20 – AVER AG E OPER ATOR EXPENS E (MEAN COS T) STA STA – 2024 STA – 2034 Ref E M A Ref E M A
DISCOUNTED (9%) —Average Costs in Millions of USD Avg Operator Expense per A/C—Over All A/C for
Ops Years
$57 $42 $39 $34 $27 $18 $16 $15
Avg Fuel Cost per A/C—Over Al l A/C for Ops
Years
$51 $37 $34 $29 $25 $16 $14 $13
Avg Maintenance Cost per A/C—Over Al l A/C for Ops Years
$6 $5 $5 $5 $3 $2 $2 $2
Avg Operator Expense per A/C—Over First A/C Purchase for Ops Years
$79 $58 $54 $47 $38 $26 $22 $21
Avg Fuel Cost per A/C—Over Fi rst A/C Purchase for Ops Years
$70 $51 $47 $40 $34 $23 $19 $18
Avg Maintenance Cost per A/C—Over Fi rst A/C Purchase for Ops Years
$9 $7 $7 $7 $4 $3 $3 $3
TAB LE O-21 – AVER AG E OPER ATOR EXPENS E (MEAN COS T) RJ RJ – 2024 RJ – 2034 Ref E M A Ref E M A
DISCOUNTED (9%) —Average Costs in Millions of USD Avg Operator Expense per A/C—Over All A/C for
Ops Years
$10 $7 $7 $6 $5 $3 $3 $3
Avg Fuel Cost per A/C—Over Al l A/C for Ops
Years
$8 $6 $5 $5 $4 $3 $2 $2
Avg Maintenance Cost per A/C—Over Al l A/C
for Ops Years
$2 $1 $1 $1 $1 $1 $1 $1
Avg Operator Expense per A/C—Over First A/C Purchase for Ops Years
$13 $10 $9 $9 $6 $4 $4 $4

AVIATION FUEL EFFICIENCY TECHNOLOGY ASSESSMENT —APPENDICES TECOLOTE RESEARCH
PG O-16
RJ – 2024 RJ – 2034
Ref E M A Ref E M A
Avg Fuel Cost per A/C—Over Fi rst A/C Purchase for Ops Years
$11 $8 $8 $7 $5 $4 $3 $3
Avg Maintenance Cost per A/C—Over Fi rst A/C Purchase for Ops Years
$2 $2 $2 $2 $1 $1 $1 $1
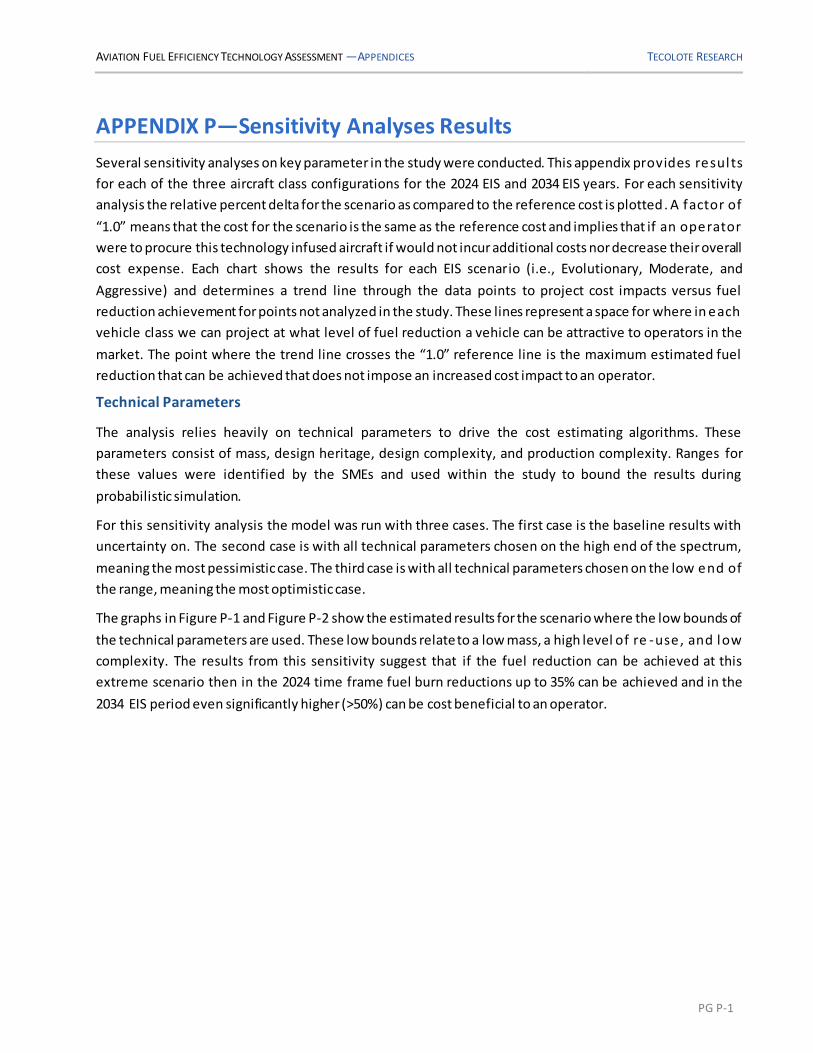
AVIATION FUEL EFFICIENCY TECHNOLOGY ASSESSMENT —APPENDICES TECOLOTE RESEARCH
PG P-1
APPENDIX P—Sensitivity Analyses Results
Several sensitivity analyses on key parameter in the study were conducted. This appendix provides results
for each of the three aircraft class configurations for the 2024 EIS and 2034 EIS years. For each sensitivity
analysis the relative percent delta for the scenario as compared to the reference cost is plotted. A factor of
“1.0” means that the cost for the scenario is the same as the reference cost and implies that if an operator
were to procure this technology infused aircraft if would not incur additional costs nor decrease their overall
cost expense. Each chart shows the results for each EIS scenario (i.e., Evolutionary, Moderate, and
Aggressive) and determines a trend line through the data points to project cost impacts versus fuel
reduction achievement for points not analyzed in the study. These lines represent a space for where in each
vehicle class we can project at what level of fuel reduction a vehicle can be attractive to operators in the
market. The point where the trend line crosses the “1.0” reference line is the maximum estimated fuel
reduction that can be achieved that does not impose an increased cost impact to an operator.
Technical Parameters
The analysis relies heavily on technical parameters to drive the cost estimating algorithms. These
parameters consist of mass, design heritage, design complexity, and production complexity. Ranges for
these values were identified by the SMEs and used within the study to bound the results during
probabilistic simulation.
For this sensitivity analysis the model was run with three cases. The first case is the baseline results with
uncertainty on. The second case is with all technical parameters chosen on the high end of the spectrum,
meaning the most pessimistic case. The third case is with all technical parameters chosen on the low end of
the range, meaning the most optimistic case.
The graphs in Figure P-1 and Figure P-2 show the estimated results for the scenario where the low bounds of
the technical parameters are used. These low bounds relate to a low mass, a high level of re -use, and low
complexity. The results from this sensitivity suggest that if the fuel reduction can be achieved at this
extreme scenario then in the 2024 time frame fuel burn reductions up to 35% can be achieved and in the
2034 EIS period even significantly higher (>50%) can be cost beneficial to an operator.
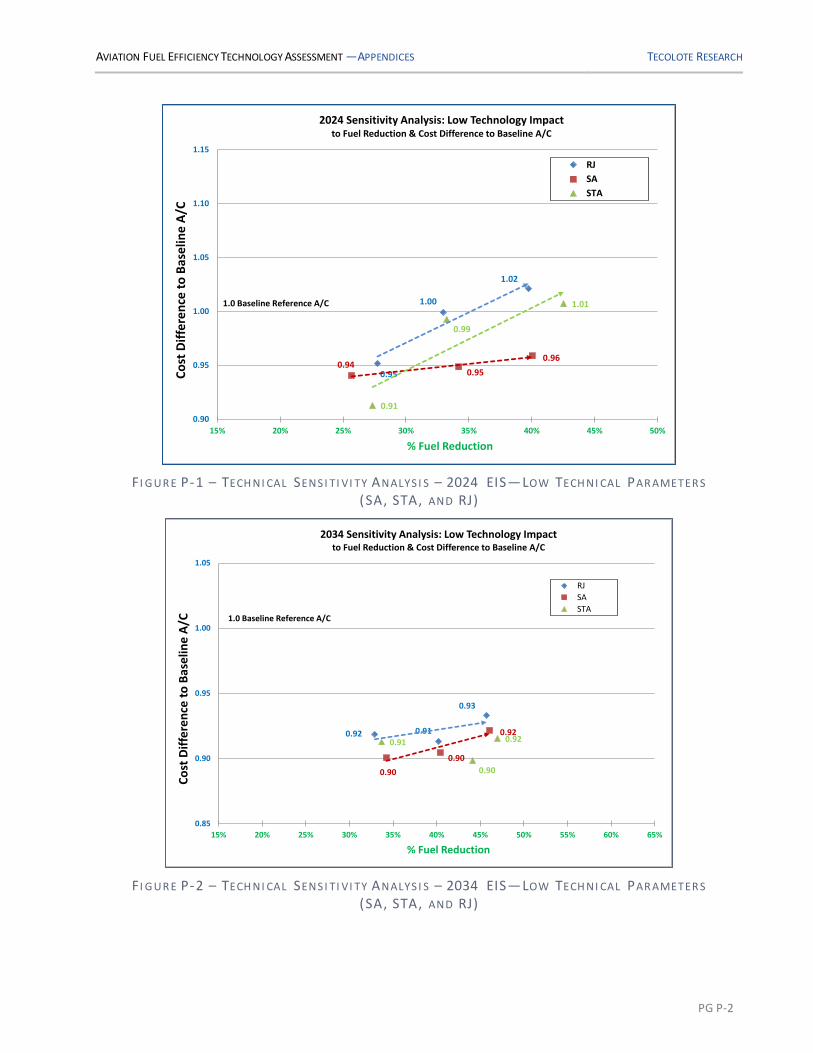
AVIATION FUEL EFFICIENCY TECHNOLOGY ASSESSMENT —APPENDICES TECOLOTE RESEARCH
PG P-2
F I G UR E P-1 – TECH NI CAL SENS I TI VI TY ANALYS I S – 2024 EIS—LOW TECH NI CAL PAR AMETER S
(SA, STA, AND RJ)
F I G UR E P-2 – TECH NI CAL SENS I TI VI TY ANALYS I S – 2034 EIS—LOW TECH NI CAL PAR AMETER S
(SA, STA, AND RJ)
0.95
1.00
1.02
0.940.95
0.96
0.91
0.99
1.01
0.90
0.95
1.00
1.05
1.10
1.15
15% 20% 25% 30% 35% 40% 45% 50%
Co
st D
iffe
ren
ce t
o B
ase
line
A/C
% Fuel Reduction
2024 Sensitivity Analysis: Low Technology Impact to Fuel Reduction & Cost Difference to Baseline A/C
RJ
SA
STA
1.0 Baseline Reference A/C
0.92 0.91
0.93
0.90
0.90
0.920.91
0.90
0.92
0.85
0.90
0.95
1.00
1.05
15% 20% 25% 30% 35% 40% 45% 50% 55% 60% 65%
Co
st D
iffe
ren
ce t
o B
ase
line
A/C
% Fuel Reduction
2034 Sensitivity Analysis: Low Technology Impact to Fuel Reduction & Cost Difference to Baseline A/C
RJ
SA
STA1.0 Baseline Reference A/C

AVIATION FUEL EFFICIENCY TECHNOLOGY ASSESSMENT —APPENDICES TECOLOTE RESEARCH
PG P-3
F I G UR E P-3 – TECH NI CAL SENS I TI VI TY ANALYS I S – 2024 EIS—HI G H TECH NI CAL PAR AMETER S
(SA, STA, AND RJ)
F I G UR E P-4 – TECH NI CAL SENS I TI VI TY ANALYS I S – 2034 EIS—HI G H TECH NI CAL PAR AMETER S
(SA, STA, AND RJ)
1.07
1.17
1.24
1.06
1.13
1.16
1.03
1.20
1.28
0.90
1.00
1.10
1.20
1.30
1.40
15% 20% 25% 30% 35% 40% 45% 50%
Co
st D
iffe
ren
ce t
o B
ase
line
A/C
% Fuel Reduction
2024 Sensitivity Analysis: High Technology Impact to Fuel Reduction & Cost Difference to Baseline A/C
RJSASTA
1.0 Baseline Reference A/C
1.02
1.07
1.13
1.02
1.07
1.14
1.04
1.08
1.15
0.90
0.95
1.00
1.05
1.10
1.15
1.20
15% 20% 25% 30% 35% 40% 45% 50% 55% 60% 65%
Co
st D
iffe
ren
ce t
o B
ase
line
A/C
% Fuel Reduction
2034 Sensitivity Analysis: High Technology Impact to Fuel Reduction & Cost Difference to Baseline A/C
RJ
SA
STA
1.0 Baseline Reference A/C

AVIATION FUEL EFFICIENCY TECHNOLOGY ASSESSMENT —APPENDICES TECOLOTE RESEARCH
PG P-4
Maintenance Parameters
For maintenance costs, four parameters are drivers. These parameters are maintenance complexity,
airframe maintenance interval, engine complexity, and engine maintenance interval One case is with all
maintenance parameters chosen to on the bound that drives a higher overall cost, meaning the most
pessimistic case. For this case, the maintenance complexity would be the high bound value and maintenance
interval would the low range value. The other case is with all technical parameters chosen on the low wind
of the range, meaning the most optimistic case.
In reviewing the results shown in Figure P-5, Figure P-6, Figure P-7, and Figure P-8 illustrate that for the RJ
and STA aircraft types, maintenance has little impact between the extreme scenarios on changing the costs
to an operator for the 2024 EIS timeframe. The SA vehicle is shown to be a little more sensitive to changes in
maintenance assumptions for the 2024 EIS timeframe. In all aircraft types for the 2034 EIS timeframe,
changes in maintenance assumption have little impact.
F I G UR E P-5 – MAI NTENANCE SENS I TI VI TY ANALYS I S – 2024 EIS —LOW TECH NI CAL PAR AMETER S
(SA, STA, AND RJ)
0.99
1.05
1.07
0.99 1.00
1.01
0.96
1.04
1.07
0.90
0.95
1.00
1.05
1.10
1.15
15% 20% 25% 30% 35% 40% 45% 50%
Co
st D
iffe
ren
ce t
o B
ase
line
A/C
% Fuel Reduction
2024 Sensitivity Analysis: Low Tech Maintenance Impact to Fuel Reduction & Cost Difference to Baseline A/C
RJ
SA
STA
1.0 Baseline Reference A/C

AVIATION FUEL EFFICIENCY TECHNOLOGY ASSESSMENT —APPENDICES TECOLOTE RESEARCH
PG P-5
F I G UR E P-6 – MAI NTENANCE SENS I TI VI TY ANALYS I S – 2034 EIS—LOW TECH NI CAL PAR AMETER S
(SA, STA, AND RJ)
F I G UR E P-7 – MAI NTENANCE SENS I TI VI TY ANALYS I S -2024 EIS—HI G H TECH NI CAL PAR AMETER S
(SA, STA, AND RJ)
0.960.95
1.01
0.94 0.95
1.01
0.96
0.95
1.01
0.90
0.95
1.00
1.05
1.10
1.15
15% 20% 25% 30% 35% 40% 45% 50% 55% 60% 65% 70%
Co
st D
iffe
ren
ce t
o B
ase
line
A/C
% Fuel Reduction
2034 Sensitivity Analysis: Low Tech Maintenance Impact to Fuel Reduction & Cost Difference to Baseline A/C
RJ
SA
STA
1.0 Baseline Reference A/C
1.00
1.05
1.08
0.99 1.01
1.02
0.96
1.05
1.08
0.90
0.95
1.00
1.05
1.10
1.15
15% 20% 25% 30% 35% 40% 45% 50%
Co
st D
iffe
ren
ce t
o B
ase
line
A/C
% Fuel Reduction
2024 Sensitivity Analysis: High Tech Maintenance Impact to Fuel Reduction & Cost Difference to Baseline A/C
RJ
SA
STA
1.0 Baseline Reference A/C

AVIATION FUEL EFFICIENCY TECHNOLOGY ASSESSMENT —APPENDICES TECOLOTE RESEARCH
PG P-6
F I G UR E P-8 – MAI NTENANCE SENS I TI VI TY ANALYS I S -2034 EIS—HI G H TECH NI CAL PAR AMETER S
(SA, STA, AND RJ)
Market Capture
A key parameter of the analysis is the overall size of the operational fleet. In the analysis the size of the fleet
is driven by the quantity of aircraft assumed to be procured and operated. Driving this analysis are two
parameters; 1) the overall market demand; and 2) the overall market capture. Sensitivity on market capture
was conducted to assess how increased or decreased demand could affect the ROI for an operator, three
scenarios were conducted for each aircraft and EIS year. The scenarios were to look at two reductions in
quantity—one at a 50% reduction and the other at 20% reduction. The last scenario was to look at a 20%
increase in market capture.
Figure P-9 and Figure P-10 shows the extreme case where an operator only captures 50% less of the market
than estimated in the baseline study results. This would reflect a 19% capture from an operator for the SA
market, instead of the 38% identified for this study. The STA and RJ market captures are also adjusted
accordingly. In this scenario, an operator may be willing to accept up an aircraft that can achieve up to a
15% fuel reduction. This is interesting in that several recently identified aircraft coming in the 2024
timeframe (i.e., A32-NEO) are indicating fuel burn reduction of 12-15%.
0.960.96
1.02
0.95 0.96
1.02
0.97
0.95
1.01
0.90
0.95
1.00
1.05
1.10
1.15
15% 20% 25% 30% 35% 40% 45% 50% 55% 60% 65% 70%
Co
st D
iffe
ren
ce t
o B
ase
line
A/C
% Fuel Reduction
2034 Sensitivity Analysis: High Tech Maintenance Impact to Fuel Reduction & Cost Difference to Baseline A/C
RJ
SA
STA
1.0 Baseline Reference A/C

AVIATION FUEL EFFICIENCY TECHNOLOGY ASSESSMENT —APPENDICES TECOLOTE RESEARCH
PG P-7
F I G UR E P-9 – MAR KET CAPTUR E SENS I TI VI TY ANALYS I S – 2024 EIS —V ER Y PES S I MI S TI C
(50% R ED UCTI ON ) MAR KET CAPTUR E (SA, STA, AND RJ)
F I G UR E P-10 – MAR KET CAPTUR E SENS I TI VI TY ANALYS I S – 2034 EIS —V ER Y PES S I MI S TI C
(50% R ED UCTI ON ) MAR KET CAPTUR E (SA, STA, AND RJ)
The resulting Figure P-11, Figure P-12, Figure P-13, and Figure P-4 show the study results given various levels
of change to the market capture. As expected, as the market capture increases the overall operator costs for
a vehicle with a specific fuel burn reduction decrease. This sensitivity went to a maximum increase of 20%,
1.08
1.18
1.24
1.06
1.101.13
0.98
1.09
1.12
0.80
0.90
1.00
1.10
1.20
1.30
1.40
1.50
0% 5% 10% 15% 20% 25% 30% 35% 40% 45% 50%
Co
st D
iffe
ren
ce t
o B
ase
line
A/C
% Fuel Reduction
2024 Sensitivity Analysis: Very Low (-50%) Market Capture Impact to Fuel Reduction & Cost Difference to Baseline A/C
RJ
SA
STA
1.0 Baseline Reference A/C
1.04
1.05
1.14
1.02
1.04
1.13
0.99 0.98
1.05
0.80
0.90
1.00
1.10
1.20
1.30
1.40
1.50
10% 15% 20% 25% 30% 35% 40% 45% 50% 55% 60%
Co
st D
iffe
ren
ce t
o B
ase
line
A/C
% Fuel Reduction
2034 Sensitivity Analysis: Very Low (-50%) Market Capture Impact to Fuel Reduction & Cost Difference to Baseline A/C
RJSASTA
1.0 Baseline Reference A/C

AVIATION FUEL EFFICIENCY TECHNOLOGY ASSESSMENT —APPENDICES TECOLOTE RESEARCH
PG P-8
which equated to a market capture of approximately 46% for SA, and indicates that a maximum fuel
reduction of up to 31% may be attractive in the market.
F I G UR E P-11 – MAR KET CAPTUR E SENS I TI VI TY ANALYS I S – 2024 EIS —PES S I MI S TI C (20% R ED UCTI ON )
MAR KET CAPTUR E (SA, STA, AND RJ)
F I G UR E P-12 – MAR KET CAPTUR E SENS I TI VI TY ANALYS I S —2034 EIS – PES S I MI S TI C (20% R ED UCTI ON ) MAR KET CAPTUR E (SA, STA, AND RJ)
1.02
1.08
1.12
1.011.03 1.05
0.97
1.06
1.09
0.80
0.90
1.00
1.10
1.20
1.30
1.40
1.50
0% 5% 10% 15% 20% 25% 30% 35% 40% 45% 50%
Co
st D
iffe
ren
ce t
o B
ase
line
A/C
% Fuel Reduction
2024 Sensitivity Analysis: Low (-20%) Market Capture Impact to Fuel Reduction & Cost Difference to Baseline A/C
RJSASTA
1.0 Baseline Reference A/C
0.980.98
1.05
0.97
0.98
1.04
0.97 0.96
1.02
0.80
0.90
1.00
1.10
1.20
1.30
1.40
1.50
10% 15% 20% 25% 30% 35% 40% 45% 50% 55% 60%
Co
st D
iffe
ren
ce t
o B
ase
line
A/C
% Fuel Reduction
2034 Sensitivity Analysis: Low (-20%) Market Capture Impact to Fuel Reduction & Cost Difference to Baseline A/C
RJSASTA
1.0 Baseline Reference A/C

AVIATION FUEL EFFICIENCY TECHNOLOGY ASSESSMENT —APPENDICES TECOLOTE RESEARCH
PG P-9
F I G UR E P-13 – MAR KET CAPTUR E SENS I TI VI TY ANALYS I S – 2024 EIS—OPTI MI S TI C (20% I NCR EAS E) MAR KET CAPTUR E (SA, STA, AND RJ)
F I G UR E P-14 – MAR KET CAPTUR E SENS I TI VI TY ANALYS I S – 2034 EIS—OPTI MI S TI C (20% I NCR EAS E) MAR KET CAPTUR E (SA, STA, AND RJ)
0.98
1.031.04
0.98
0.98 0.99
0.95
1.041.06
0.80
0.85
0.90
0.95
1.00
1.05
1.10
1.15
1.20
0% 5% 10% 15% 20% 25% 30% 35% 40% 45% 50%
Co
st D
iffe
ren
ce t
o B
ase
line
A/C
% Fuel Reduction
2024 Sensitivity Analysis: High (+20%) Market Capture Impact to Fuel Reduction & Cost Difference to Baseline A/C
RJ
SA
STA
1.0 Baseline Reference A/C
0.94
0.94
0.98
0.930.94
0.99
0.95
0.94
1.00
0.80
0.90
1.00
1.10
1.20
1.30
1.40
1.50
10% 15% 20% 25% 30% 35% 40% 45% 50% 55% 60%
Co
st D
iffe
ren
ce t
o B
ase
line
A/C
% Fuel Reduction
2034 Sensitivity Analysis: High (+20) Market Capture Impact to Fuel Reduction & Cost Difference to Baseline A/C
RJ
SA
STA
1.0 Baseline Reference A/C
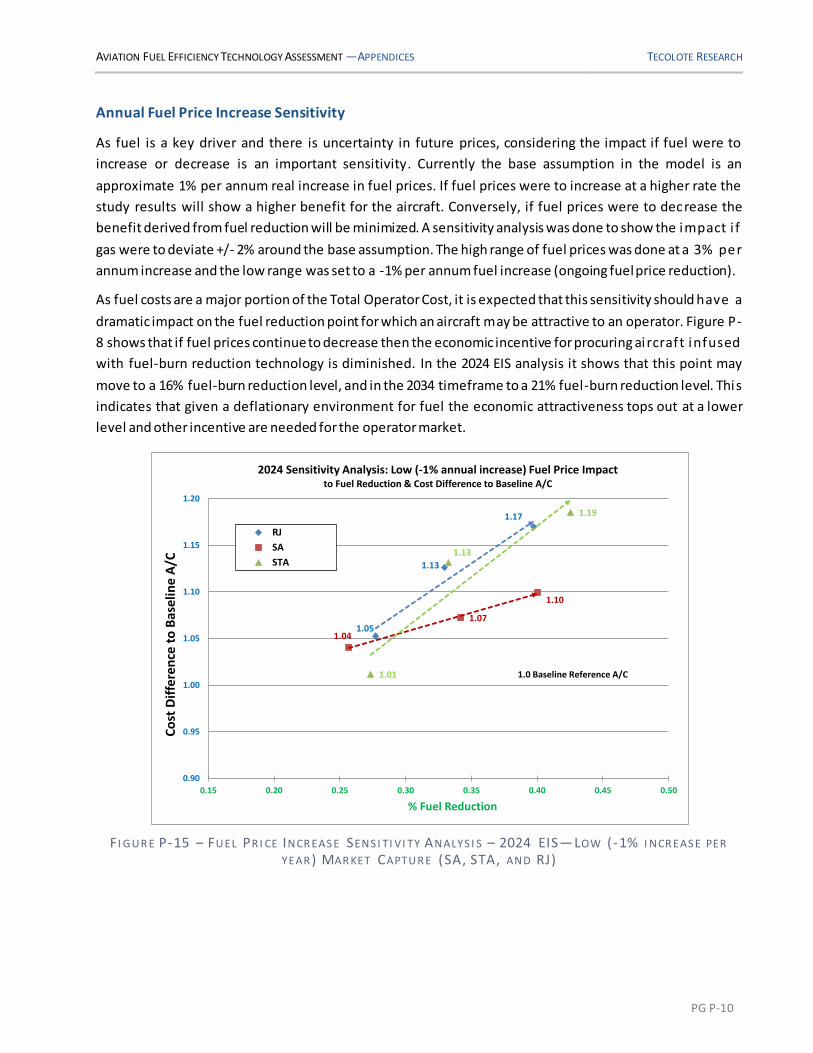
AVIATION FUEL EFFICIENCY TECHNOLOGY ASSESSMENT —APPENDICES TECOLOTE RESEARCH
PG P-10
Annual Fuel Price Increase Sensitivity
As fuel is a key driver and there is uncertainty in future prices, considering the impact if fuel were to
increase or decrease is an important sensitivity. Currently the base assumption in the model is an
approximate 1% per annum real increase in fuel prices. If fuel prices were to increase at a higher rate the
study results will show a higher benefit for the aircraft. Conversely, if fuel prices were to decrease the
benefit derived from fuel reduction will be minimized. A sensitivity analysis was done to show the impact i f
gas were to deviate +/- 2% around the base assumption. The high range of fuel prices was done at a 3% per
annum increase and the low range was set to a -1% per annum fuel increase (ongoing fuel price reduction).
As fuel costs are a major portion of the Total Operator Cost, it is expected that this sensitivity should have a
dramatic impact on the fuel reduction point for which an aircraft may be attractive to an operator. Figure P-
8 shows that if fuel prices continue to decrease then the economic incentive for procuring ai rcraft infused
with fuel-burn reduction technology is diminished. In the 2024 EIS analysis it shows that this point may
move to a 16% fuel-burn reduction level, and in the 2034 timeframe to a 21% fuel-burn reduction level. This
indicates that given a deflationary environment for fuel the economic attractiveness tops out at a lower
level and other incentive are needed for the operator market.
F I G UR E P-15 – FUEL PR I CE INCR EAS E SENS I TI VI TY ANALYS I S – 2024 EIS—LOW ( -1% I NCR EAS E PER
YEAR ) MAR KET CAPTUR E (SA, STA, AND RJ)
1.05
1.13
1.17
1.04
1.07
1.10
1.01
1.13
1.19
0.90
0.95
1.00
1.05
1.10
1.15
1.20
0.15 0.20 0.25 0.30 0.35 0.40 0.45 0.50
Co
st D
iffe
ren
ce t
o B
ase
line
A/C
% Fuel Reduction
2024 Sensitivity Analysis: Low (-1% annual increase) Fuel Price Impact to Fuel Reduction & Cost Difference to Baseline A/C
RJ
SA
STA
1.0 Baseline Reference A/C

AVIATION FUEL EFFICIENCY TECHNOLOGY ASSESSMENT —APPENDICES TECOLOTE RESEARCH
PG P-11
F I G UR E P-16 – FUEL PR I CE INCR EAS E SENS I TI VI TY ANALYS I S – 2034 EIS—LOW ( -1% I NCR EAS E PER
YEAR ) MAR KET CAPTUR E (SA, STA, AND RJ)
F I G UR E P-17 – FUEL PR I CE INCR EAS E SENS I TI VI TY ANALYS I S – 2024 EIS—HI G H (+3% I NCR EAS E PER
YEAR ) MAR KET CAPTUR E (SA, STA, AND RJ)
1.07 1.09
1.19
1.06
1.09
1.19
1.09
1.12
1.21
0.90
0.95
1.00
1.05
1.10
1.15
1.20
1.25
0.10 0.15 0.20 0.25 0.30 0.35 0.40 0.45 0.50 0.55 0.60
Co
st D
iffe
ren
ce t
o B
ase
line
A/C
% Fuel Reduction
2034 Sensitivity Analysis: Low (-1% annual increase) Fuel Price Impact to Fuel Reduction & Cost Difference to Baseline A/C
RJ
SA
STA
Linear (RJ)
Linear (SA)
Linear (STA)
1.0 Baseline Reference A/C
0.96
0.99
1.00
0.95 0.95
0.95
0.92
0.98
0.99
0.90
0.95
1.00
1.05
1.10
1.15
0.15 0.20 0.25 0.30 0.35 0.40 0.45 0.50
Co
st D
iffe
ren
ce t
o B
ase
line
A/C
% Fuel Reduction
2024 Sensitivity Analysis: High (+3% annual increase) Fuel Price Impact to Fuel Reduction & Cost Difference to Baseline A/C
RJ
SA
STA
Linear (RJ)
Linear (SA)
Linear (STA)
1.0 Baseline Reference A/C

AVIATION FUEL EFFICIENCY TECHNOLOGY ASSESSMENT —APPENDICES TECOLOTE RESEARCH
PG P-12
F I G UR E P-18 – FUEL PR I CE INCR EAS E SENS I TI VI TY ANALYS I S – 2034 EIS—HI G H (+3% I NCR EAS E PER
YEAR ) MAR KET CAPTUR E (SA, STA, AND RJ)
Discount Rate Sensitivity
This analysis looks at the range of the impact by changing the discount rates and calculating the overall
results to determine where a potential fuel-burn reduction aircraft will cost less over a seven-year
operational life than a vehicle with current performance characteristics. The discount rate is important as i t
varies by company and is in line with the internal rate of return they are looking at for investment of their
funds. Companies with risk adverse postures or who have high returns on their investments will lean toward
a higher discount rate for their analysis as they place tremendous value on their cash and feel that there are
more lucrative investment options.
Given the potential variation between operators for discount rate a wide range of sensitivities were run to
capture from a regulatory Government perspective of 3% up to a rate of 15%. This provides a wide span and
allows the ability to develop a curve over this range to assess the ove rall study sensitivity to discount rate.
The following figures indicate that as discount rate is decreased there is an underlying cost benefit in
pursuing more aggressive fuel-burn reducing aircraft. The sensitivity indicates that an aircraft with up to 19%
fuel burn reduction can be attractive even considering a 15% discount rate. The 3% discount level shows the
maximum operator cost threshold calculated by the study on fuel -burn reduction to be approximately 33% .
Figure P-19, Figure P-20, Figure P-21, Figure P-22, Figure P-23, Figure P-24, Figure P-25, and Figure P-25
illustrate the impact of the various discount rates for the 2024 and 2034 EIS periods.
0.89
0.87
0.90
0.88 0.87
0.90
0.88
0.85
0.89
0.70
0.75
0.80
0.85
0.90
0.95
1.00
1.05
1.10
0.25 0.30 0.35 0.40 0.45 0.50 0.55 0.60 0.65 0.70 0.75 0.80
Co
st D
iffe
ren
ce t
o B
ase
line
A/C
% Fuel Reduction
2034 Sensitivity Analysis: High (+3% annual increase) Fuel Price Impact to Fuel Reduction & Cost Difference to Baseline A/C
RJ
SA
STA1.0 Baseline Reference A/C

AVIATION FUEL EFFICIENCY TECHNOLOGY ASSESSMENT —APPENDICES TECOLOTE RESEARCH
PG P-13
F I G UR E P-19 – DI S COUNT RATE SENS I TI VI TY ANALYS I S – 2024 EIS —3% DI S COUNT RATE
(SA, STA, AND RJ)
F I G UR E P-20 – DI S COUNT RATE SENS I TI VI TY ANALYS I S – 2034 EIS —3% DI S COUNT RATE
(SA, STA, AND RJ)
0.95
0.98 0.99
0.940.94 0.94
0.92
0.980.98
0.90
0.95
1.00
1.05
1.10
1.15
0.100 0.200 0.300 0.400 0.500
Cost
Diff
eren
ce t
o Ba
selin
e A
/C
% Fuel Reduction
2024 Sensitivity Analysis: 3% Discount Rate Impact to Fuel Reduction & Cost Difference to Baseline A/C
RJ
SA
STA
1.0 Baseline Reference A/C
0.91
0.89
0.92
0.890.89
0.92
0.90
0.87
0.91
0.85
0.90
0.95
1.00
1.05
0.30 0.40 0.50 0.60 0.70 0.80
Cost
Dif
fere
nce
to B
asel
ine
A/C
% Fuel Reduction
2034 Sensitivity Analysis: 3% Discount Rate Impact to Fuel Reduction & Cost Difference to Baseline A/C
RJ
SA
STA
1.0 Baseline Reference A/C

AVIATION FUEL EFFICIENCY TECHNOLOGY ASSESSMENT —APPENDICES TECOLOTE RESEARCH
PG P-14
F I G UR E P-21 – DI S COUNT RATE SENS I TI VI TY ANALYS I S – 2024 EIS—5% DI S COUNT RATE
(SA, STA, AND RJ)
F I G UR E P-22 – DI S COUNT RATE SENS I TI VI TY ANALYS I S – 2034 EIS—5% DI S COUNT RATE
(SA, STA, AND RJ)
0.97
1.01
1.03
0.96 0.960.97
0.93
1.00
1.02
0.90
0.95
1.00
1.05
1.10
1.15
0.10 0.20 0.30 0.40 0.50
Co
st D
iffe
ren
ce t
o B
ase
line
A/C
% Fuel Reduction
2024 Sensitivity Analysis: 5% Discount Rate Impact to Fuel Reduction & Cost Difference to Baseline A/C
RJ
SA
STA
1.0 Baseline Reference A/C
0.93
0.92
0.96
0.91
0.91
0.96
0.93
0.90
0.95
0.85
0.90
0.95
1.00
1.05
0.30 0.40 0.50 0.60 0.70 0.80
Co
st D
iffe
ren
ce t
o B
ase
line
A/C
% Fuel Reduction
2034 Sensitivity Analysis: 5% Discount Rate Impact to Fuel Reduction & Cost Difference to Baseline A/C
RJ
SA
STA
1.0 Baseline Reference A/C

AVIATION FUEL EFFICIENCY TECHNOLOGY ASSESSMENT —APPENDICES TECOLOTE RESEARCH
PG P-15
F I G UR E P-23 – DI S COUNT RATE SENS I TI VI TY ANALYS I S – 2024 EIS—9% DI S COUNT RATE
(SA, STA, AND RJ)
F I G UR E P-24 – DI S COUNT RATE SENS I TI VI TY ANALYS I S – 2034 EIS—9% DI S COUNT RATE
(SA, STA, AND RJ)
1.00
1.05
1.07
0.99
1.00
1.01
0.96
1.05
1.07
0.90
0.95
1.00
1.05
1.10
1.15
0.10 0.20 0.30 0.40 0.50
Co
st D
iffe
ren
ce t
o B
ase
line
A/C
% Fuel Reduction
2024 Sensitivity Analysis: 9% Discount Rate Impact to Fuel Reduction & Cost Difference to Baseline A/C
RJ
SA
STA
1.0 Baseline Reference A/C
0.96 0.96
1.01
0.95 0.95
1.01
0.96
0.95
1.01
0.90
0.95
1.00
1.05
0.10 0.20 0.30 0.40 0.50 0.60 0.70 0.80
Co
st D
iffe
ren
ce t
o B
ase
line
A/C
% Fuel Reduction
2034 Sensitivity Analysis: 9% Discount Rate Impact to Fuel Reduction & Cost Difference to Baseline A/C
RJSASTA
1.0 Baseline Reference A/C
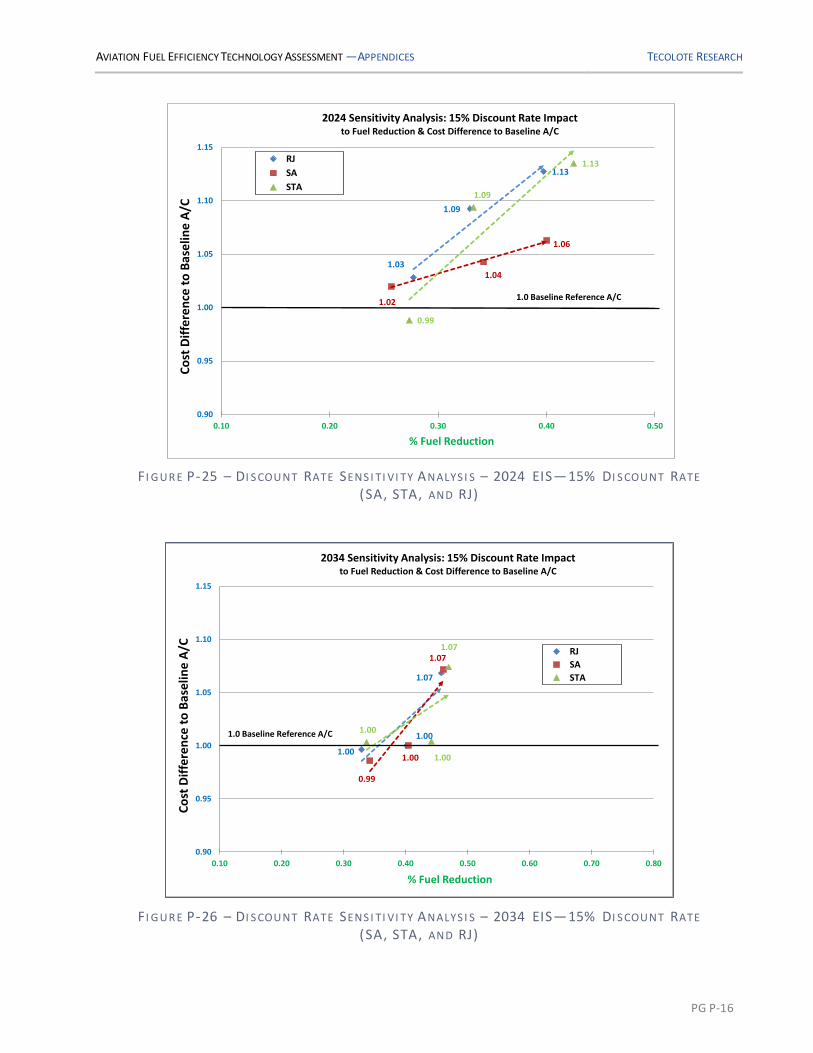
AVIATION FUEL EFFICIENCY TECHNOLOGY ASSESSMENT —APPENDICES TECOLOTE RESEARCH
PG P-16
F I G UR E P-25 – DI S COUNT RATE SENS I TI VI TY ANALYS I S – 2024 EIS—15% DI S COUNT RATE
(SA, STA, AND RJ)
F I G UR E P-26 – DI S COUNT RATE SENS I TI VI TY ANALYS I S – 2034 EIS—15% DI S COUNT RATE
(SA, STA, AND RJ)
1.03
1.09
1.13
1.02
1.04
1.06
0.99
1.09
1.13
0.90
0.95
1.00
1.05
1.10
1.15
0.10 0.20 0.30 0.40 0.50
Co
st D
iffe
ren
ce t
o B
ase
line
A/C
% Fuel Reduction
2024 Sensitivity Analysis: 15% Discount Rate Impact to Fuel Reduction & Cost Difference to Baseline A/C
RJ
SA
STA
1.0 Baseline Reference A/C
1.00
1.00
1.07
0.99
1.00
1.07
1.00
1.00
1.07
0.90
0.95
1.00
1.05
1.10
1.15
0.10 0.20 0.30 0.40 0.50 0.60 0.70 0.80
Co
st D
iffe
ren
ce t
o B
ase
line
A/C
% Fuel Reduction
2034 Sensitivity Analysis: 15% Discount Rate Impact to Fuel Reduction & Cost Difference to Baseline A/C
RJ
SA
STA
1.0 Baseline Reference A/C

AVIATION FUEL EFFICIENCY TECHNOLOGY ASSESSMENT —APPENDICES TECOLOTE RESEARCH
PG P-17
Figure P-27 and Figure P-28 displays a summary of the various discount rate scenarios. The charts show a
weighted composite for each aircraft technology deployment scenario (i.e., Evolutionary, Moderate, and
Aggressive) of the cost difference to the baseline aircraft for each discount rate analyzed in the sensi tivi ty
analysis. This represents a composite cost to fuel-burn reduction point across all aircraft configurations in
the study. From these data points, trend lines were developed to identify the point where there i s no net
change in operators TOC. By viewing the trend lines one can see how the various discount rates can have an
effect on the level of fuel-burn reduction.
F I G UR E P-27 – DI S COUNT RATE SENS I TI VI TY ANALYS I S -2024 EIS—WEI G H TED AVER AG E
0.92
0.97 0.98
0.94
1.00 1.01
0.96
1.04
1.07
0.99
1.09
1.13
0.80
0.85
0.90
0.95
1.00
1.05
1.10
1.15
1.20
20% 25% 30% 35% 40% 45% 50% 55%
Co
st D
iffe
ren
ce t
o B
ase
line
A/C
% Fuel Burn Reduction - Average
2024 Sensitivity Analysis: Discount Rate Weighted Average Impact Across SA, STA, and RJto Fuel Burn Reduction & Cost Difference to Baseline A/C
1.0 Baseline Reference A/C

AVIATION FUEL EFFICIENCY TECHNOLOGY ASSESSMENT —APPENDICES TECOLOTE RESEARCH
PG P-18
F I G UR E P-28 – DI S COUNT RATE SENS I TI VI TY ANALYS I S -2034 EIS—WEI G H TED AVER AG E
0.90
0.87
0.91 0.92
0.90
0.95 0.96
0.95
1.01 1.00 1.00
1.07
0.80
0.85
0.90
0.95
1.00
1.05
1.10
1.15
1.20
20% 25% 30% 35% 40% 45% 50% 55%
Co
st D
iffe
ren
ce t
o B
ase
line
A/C
% Fuel Burn Reduction - Average
2034 Sensitivity Analysis: Discount Rate Weighted Average Impact Across SA, STA, and RJ to Fuel Burn Reduction & Cost Difference to Baseline A/C
1.0 Baseline Reference A/C