appendices - epa.wa.gov.au · appendices appendix 1: epa guidelines for the consultative...
TRANSCRIPT

00 WEST AUSTRALIAN PETROLEUM PTV LIMITED
PERMIT AREA TP/3 PART 1
FIVE YEAR DRILLING PROGRAMME
CONSULTATIVE ENVIRONMENTAL REVIEW
APPENDICES
622.323 (26) I
LEP
Vol. 2
CopyA

c
jI
F 1
ro
r
n:1
L -j*f3'1kI t i_' 1I jL ?c
Tir
¶Z T -L ®r _1y
ki f
1111 11114
jc
' 1.?%1!f11J'j 1,4I L • -I — I & I i- -i i1. rAL_ •. -w -'u. — '- r I• H- --i f - IT U L •# rf t_•I
Air .1
; 1I:i 1__..:1.I ' _•
5 J3 :
ti Ar-
•_. 'rj-i I_' III.4
— .- .- • , '-p. ••,
_.1 1 4 'II1 • UI :

PERMIT AREA TP/3 PART 1
FIVE YEAR DRILLING PROGRAMME
CONSULTATIVE ENVIRONMENTAL REVIEW
VOLUME 2 OF 2
APPENDICES
Appendix 1: EPA Guidelines for the Consultative Environmental Review.
Appendix 2: Habitats Maps.
Appendix 3: Oil Spill Trajectoiy Predictions.
Appendix 4: Real Time Tracking Results.
Appendix 5: Literature Review of Toxicity of Medium Weight Crude to Tropical Marine Environments.
Appendix 6: Example Handout for all Rig Personnel and Visitors Environmental Protection.
Appendix 7: Summary of the Oil Spill Contingency Plan for the Permit Area TP/3 Part 1.
Appendix 8: List of Commitments.

© West Australian Petroleum Pty. Limited 1991.
This document is copyright. Other than for the put-poses of and subject to the conditions prescribed under the Copyright Act, no part of it may be reproduced, stored in a retrieval system or transmitted without the prior written consent of West Australian Petroleum Pty. Limited.

West Australian Petroleum Pty Limited
Permit Area TP/3 Part 1
Five Year Drilling Programme
Consultative Environmental Review
APPENDIX I
EPA GUIDELINES FOR THE
CONSULTATIVE ENVIRONMENTAL REVIEW
LEC Ref: J217/R345

PETROLEUM OFFSHORE EXPLORATION WELL
PROGRAMME IN PERMIT TP/3
GUIDELINES FOR THE CONSULTATIVE ENVIRONMENTAL
REVIEW (CER) BY WEST AUSTRALIAN PETROLEUM PTY LTD
PREFACE
These guidelines are issued as a checklist of matters which the Environmental Protection Authority considers should be addressed in the CER. They are not exhaustive and other relevant issues may arise during the preparation of the document: these should also be included in the CER.
It should also be noted that the guidelines are not intended to convey the Authority's wishes with respect to the format of the document. The format is a matter for the proponent.
A package assessment is a new concept created to improve the efficiency of the assessment process. As there is only one formal assessment in the place of several there is a critical requirement to address the proposal as comprehensively as possible. It is recognised, however, that there will be a need to review site-specific data when the exact location of wells is known. This data would need to include water depth and bottom conditions; distance from environmentally sensitive locations such as reefs, mangroves etc.; tide and current dynamics; and the appropriate management procedure for spills. As well, the proposed timing of drilling and possible conflicts arising should be canvassed and minimised.
SUMMARY
This section should contain a brief summary of the salient points made in the report.
1 INTRODUCTION
background and objectives of the proposal. A brief discussion of existing facilities and how the exploration programme might relate to them would be useful;
timing of this proposal, i.e. what are the time constraints on the programme with respect to tenure?;
relevant legislative requirements and approval processes.
1

2
2 NEED FOR THE PROPOSAL
This section is to enable the proponent to provide the justification for the project.
3 EVALUATION OF ALTERNATIVES
A discussion of the possible operational alternatives, especially with regard to wells likely to be located in highly sensitive reef or nearshore environments, and their potential impacts.
4 DESCRIPTION OF PROPOSAL
It is important to set the context by briefly describing the exploration programme as tendered to the Department of Mines. The following aspects should be discussed:
broad project timetable. The specific timing of individual wells would not be required at this stage as this information would be expected to comprise part of the site-specific proposals;
components of the drilling operations, including exclusion zones around the rig, details of the drilling muds to be used and other operational discharges;
details of waste disposal methods including disposal of cuttings and domestic discharges;
location of onshore operations base and its requirements. The function and frequency of use of the Beadon Creek base should be mentioned;
size of crews, brief description of roster system and transfer operations;
details of support vessels and rig refuelling procedures.
5 EXISTING ENVIRONMENT
This section should provide a brief description of the broader physical, biological and social environment and coastal processes. It should be possible to divide the permit area into zones of different environmental sensitivity (which could attract differing levels of management, for discussion in the appropriate section). You should then list the systems which are potentially at risk from, or likely to be impacted by routine or accidental activities associated with this proposal.

This section should include an overview of:
current terrestrial and marine uses (e.g. island recreation, commercial fishing etc.);
commercial fishing values;
conservation and recreational values;
effects of drilling operations on social environment.
6 ENVIRONMENTAL IMPACTS
This section of the CER should show the overall physical, biological and social impacts of the proposal on the environment.
It also presents an opportunity to educate the public, some of whom may be poorly informed about petroleum operations, impacts and the environmental management and characteristics of north west 'crude', as a balance to those details which are frequently presented in the media about oil spills and operations in other parts of the world.
The objective is to briefly synthesise all information and predict potential impacts upon the environment. This will require a discussion of likely small, medium and large spills, and their probabilities.
As specific well sites are not expected to be known at this stage it will be very important to address credible events, such as an uncontrolled blowout from a rig located in an environmentally sensitive area, for the benefit of the assessment process so that the situations leading to these occurrences can be publicly fully appreciated and discussed.
You should include a discussion of the resilience of the biological systems to natural and human-induced pressures associated with this proposal. The probability and effects of oil spills of various sizes, together with their fate, should be discussed in this section.
Impacts on those conservational, commercial and recreational values identified in Section 5 should be discussed.
7 ENVIRONMENTAL MANAGEMENT
Environmental management should be described on the basis of (and cross-referenced to) the potential environmental impacts described in Section 6. The issue of management of the adverse impacts of the proposal, as well as ongoing

Ell
monitoring programmes should be specifically addressed in detail, including who will be responsible.
The purpose of management is to demonstrate the manner in which potential environmental impacts can be ameliorated either through design or specific ongoing management. There should be a discussion of spill scenarios and a description of appropriate responses to each. As well, there should be a summary of the key points and commitments made in more detail in the Oil Spill Contingency Plan. Equipment on hand, or readily available (such as booms, skimmers and dispersants) that could be used to contain what would be considered the most likely spill scenario should be considered. Management of the rig and personnel in the event of a cyclone needs to be discussed.
The Oil Spill Contingency Plan should be included as a stand-alone appendix to the CER.
8 SUMMARY OF COMMITMENTS BY PROPONENT
A summasy of commitments made should be included as an appendix to the CER. The commitments should be numbered and include: who makes the commitment; the nature of the commitment; when it will be carried out; and to whose satisfaction.
9 REFERENCES
All references should be listed.
10 CONSULTATIONS
A list of agencies or groups consulted (such as professional fishermen's associations) in the preparation of the CER and for the purposes of foreshadowing issues arising out of the proposal should be included.
The report should include appropriate maps, tables and photographs, as required, to illustrate points made in the text.

West Australian Petroleum Pty Limited
Permit Area TPI3 Part 1
Five Year Exploration Drilling Programme
Consultative Environmental Review
APPENDIX 2
HABITAT MAPS
LEC Ref: J217/R345

HABITAT MAPS
LIST OF FIGURES
1 Index to habitat distribution maps 1
2 Intertidal and shallow water habitats between Tubridgi 2 Point and Beadon Point
3 Habitat distribution at the Ashburton delta and Urala 3 Creek
4 Habitat distribution Thevenard Island 4
5 Habitat distribution Serrurier Island 5
6 Habitat distribution Ashburton and Tortoise Islands 6
7 Habitat distribution Direction Island 7
8 Habitat distribution Bessieres Island and Bowers Ledge 8
9 Habitat distribution Locker Island 9
I

115° 00E
I n d i a n Ocean
1
d
AirIIe Island
SEE FIGURE 8 SEE FIGURE 7 21° 30S
Besaleres I8and4 DIrection Island
SEE FIGURE—S Sorrurier Island
Cooigra Point
C
O
0 E C 0
C uJ
::::::::::::::::::::::::::::::::::::::::::::::::::::O r1sL ow : : : : : : SEE FIGU E 3 :::::::::::::::::::::
SEE FIGURE 9
Locker Islajnd -v
• .................................................... ...........................................................
URALA :::::::::.'::::::::::::::::::: ........................................................................
( r .................................................................
............................................................................ Tubridgi . : : : : :::::::::::: : :: : : : :::::::::::::: Pol .. : : : : ::: :: : : ..:::.::::::::: : ... : : : : .:::. : : ::::: : : : : • .....
:EEF2
KILOMETRES
PERMIT AREA TP/3 Part 1 I Figure
0j West Australian I Petroleum
Pty. Limited INDEX TO HABITAT DISTRIBUTION MAPS
J217 R345 A2 4/91

I n d I a n 0 c e a nflManlcom Bank
( Locker R
'Locker Island
(.)Baviis Patches
FSecret Ck
Rocky Point /1
NSLOW
Black Ledge
Serrurier Island L
210 45S
Ledge
REFERENCE
Shoal
Nearehore reef
Limeitone pavement/rocky shore
River and tidal creek chennil - Mangal flat.
Salt flat
Sandy beach
Coastel dune and hinterland sand plain
- - - - Boundary uncertain - Road or track
Paroo Sh Koolinda Patch
AustraIlnd Sh 0 Mhb0s Sh Q0Rrchardson Sh 3Hastings Sh
Qsaladin Sh
ortotse island c_b (9AahburtOn Island
Glennle ROLLER 0 ç )Ward R
Patches C 0a1 Banks
C ROLLER C
Beadon Poin ROLLER B
ROLLER A
Tongue Sh Couter Sh f~ f1v
Entrance
- _-
- '—
'Old )nalc ruins
Point
n, URALA
0-
0 2 4 6 8 10 I I
KILOMETRES
115° ODE
PERMIT AREA TP/3 Part 1
West Australian INTERTIDAL AND SHALLOW WATER Petroleum C7 Pty.Limited HABITATS BETWEEN TUBRIDGI POINT
AND BEADON POINT
Figure
2
114 451
J217 R345 A2 4/81

01
REFERENCE
Limestone pavement/rocky shore
River and tidal creak channel
Mangal fiats
Salt flat
Sand spIt and chenler
Sandy beach
Coastal dune and hinterland *and plain
Road or track
(
Entrance Point Ocean
KILOMETRES
HABITAT DISTRIBUTION AT MOUTH OF URALA CREEK
I n d i a n
> LD(O
' ONSLOW CO I RUlN8 7/
'I ' --
0
0 Tv C E C 0 > C w
PERMIT AREA TPI3 Part 1 I Figure West Australian I Petroleum I HABITAT DISTRIBUTION AT THE 3 PLy. Limited
ASHBURTON DELTA AND URALA CREEK c)
J1l loaqo #/ 4l1

A
I REFERENCE
1 -'- - i + j Island (supralldai)
Intertidal sandy beach
Intertidal sand spit.
Intertidal eand veneared limestone
Intertidal limestone pavement
Intertidal limestone rubble
Eubtidal sand
Subtidsi algal covered limestone pavement
Subtidal coral reef
Subtidal coral and algal covered limestone pavement
0 —J1km
J217 R345 A2 4/91

0 1km
1EFERENCE
F ± J Island (supratidal).
Intertidal sandy beach
El Intertidal limestone pavement
Subtidal sand
IISublidat algal covered limestone paveicent
Subtldnl coral reef
J217 Ff345 A2 4/91

17 R345 A2 4191
3h TORTOISE ISLAND
REFERENCE
1 +1
r + 1 Island (supratldal)
IntertIdal sandy beach
EM Intertidal limestone pavement
Intertidal limestone rubble
Subtidal sand
Subtidal coral reef
0 1km
BURTON ISLAND

::•::••:.:
REFERENCE
Island (supratidal)
t intertidal sandy beach 0 1km
II Intertidal limestone pavement I
I21 Subtidal sand
Subtidal algal covered limestone pavement
Subtidal coral reef
West Australian Petroleum Pty. Limited
PERMIT AREA TP/3 Part 1
HABITAT DISTRIBUTION
DIRECTION ISLAND
Figure
7
7
J217 R345 A2 4/91

. . . . . . . . . . . . . . . . . . . . . . . . . . . . . . . . . . . . . . . ......................... ...........................
+ + +
BESSIERES (ANCHOR) ISLAND + +
+ + +
+ .+•: .......... + + ,'
+
::::::" 0 1km I I
REFERENCE
L±i±] Island
111111 Intertidal sandy beach - - -
[] Intertidal limestone pavement
[ ] Subtidal sand
Subtldal algal covered limestone pavement
Subtidal coral reef BOWERS LEDGE
PERMIT AREA TPI3 Part 1
West Australian 1 Petroleum HABITAT DISTRIBUTION I Pty.Limited BESSIERES ISLAND AND BOWERS LEDGE
Figure
B
E:]
J217 R345 A2 4/91

-- 0.
c14.
:0CKER ISLAND
G Unnamed sand cay
REFERENCE
Island (supratidal)
Sandy beach
Intertidal sand spit - -
F I Intertidal limestone pavement
Low Intertidal limestone rubble
Subtidal coral and algal covered limestone pavement and rubble
Subtidal sand sheets
["•"1 Subtidal algal covered limestone o 1km i::••:.•i pavement with coral
Coral reef
Boundary uncertain
C C
C
C C
C a
West Australian Petroleum PLy. Limited
PERMIT AREA TP13 Part 1
HABITAT DISTRIBUTION LOCKER ISLAND
Figure
9
J217 R345 A2 4/91

West Australian Petroleum Pty Limited
Permit Area TP/3 Part 1
Five Year Exploration Drilling Programme
Consultative Environmental Review
APPENDIX 3
OIL SPILL TRAJECTORY PREDICTIONS
LEC Ref: J217/R345

1
OIL SPILL TRAJECTORy PREDICTIONS
Table of Contents -- -
INTRODUCTION - 1
2 METOCEAN CONDITIONS 2
2.1 Wind 2
2.1.1 Synoptic Winds 2 2.1.2 Sea and Land Breezes 2 2.1.3 Storm Winds 3 2.1.4 Wind Data Used for Modelling 3
2.2 Currents . 4
2.2.1 Available Data 4 2.2.2 Tidal Currents 5 2.2.3 Wind-Driven Circulation 5 2.2.4 Regional Oceanic Circulation 5 2.2.5 Thermohaline Circulation 5
3 CIRCULATION MODELLING 6
3.1 Method 6 3.2 Results 6
3.2.1 Saladin Location 6 3.2.2 Roller Field 7
4 OIL SPILL TRAJECTORY MODELLING AND PREDICTIONS 8
4.1 Rationale 8
4.1.1 Saladin Location 8 4.1.2 Roller Field 9
4.2 Results and Discussion 9
4.2.1 Saladin Location 9 4.2.2 Predictions for Australjnd 10

11
4.2.3 Roller Field 11 4.2.4 Predictions for Paroo and Curlew 13 4.2.5 Predictions for Thringa, Bessieres, Lightfoot 14
and Weld
5 CONCLUSION 16
6 REFERENCES 17
LIST OFTABLES
1 Occurrence of wind speed and direction at Barrow Island 18 between 1 January 1984 and 31 December 1984
2 OcculTence of wind speed and direction at Thevenard 19 Island between 1 February 1987 and 31 January 1988
3 OcculTence of wind speed and direction at Barrow Island 20 between 1 February 1987 and 31 January 1988
4 Percentage duration of winds at Thevenard Island 21 between 1 February 1987 and 31 January 1988
5 Percentage duration of winds at Barrow Island 21 between 1 February 1987 and 31 January 1988
6 Summary of oil spill simulation case studies and the 22 maximum excursion distances for the Saladin location
7 Risk frequency and time to impact of an oil spill 23 from the Roller well locations
LIST OF FIGURES
1 Location map 24
2 Vector plots of the depth-averaged wind-driven currents 25 predicted by the circulation model for the Saladin location, for spring tides
3 Vector plots of the depth-averaged wind-driven currents 26 - predicted by the circulation model for the Saladin location, for an easterly gale

111
LIST OF FIGURES (Cont'd)
4 Spring tidal depth-average currents at three hourly 27 intervals, predicted by the 2D circulation model for the Roller field
5 Neap tidal depth-averaged currents at three hourly 28 intervals, predicted by the 2D circulation model for the Roller field
6 Surface currents predicted by the 2.5D circulation 29 model for the Roller field, for steady 10 m/s winds from the north, north-east, east and south-east
7 Surface currents predicted by the 2.51) circulation 30 model for the Roller field, for steady 10 m/s winds from the south, south-west, west and north-west
8 Maximum radial extent of an oil release from each 31 Saladin location due to neap tides and strong easterly gales
9 Maximum radial extent of an oil release from each 32 Saladin location due to spring tides and strong easterly gales
10 Maximum radial extent of an oil release from each 33 Saladin location due to neap tides and south-westerly winds
11 Maximum radial extent of an oil release from each 34 Saladin location due to spring tides and south-westerly winds
12 Maximum radial extent of an oil release from each 35 Saladin location due to neap tides and north-easterly winds
13 Maximum radial extent of an oil release from each 36 Saladin location due to spring tides and north-easterly winds
14 Oil spill envelopes for release times of 6, 12, 24 and 37 48 hours for the case of northerly wind during spring tides for the Roller North location

iv
LIST OF FIGURES (Cont'd)
15 Oil spill envelopes for release times of 6, 12, 24 and 38 48 hours for the case of north-easterly wind during spring tides for the Roller North location
16 Oil spill envelopes for release times of 6, 12, 24 and 39 48 hours for the case of south-westerly wind during spring tides for the Roller North location
17 Oil spill envelopes for release times of 6, 12, 24 and 40 48 hours for the case of westerly wind during spring tides for the Roller North location

1
OIL SPILL TRAJECTORY PREDICTIONS
1 INTRODUCTION -
West Australian Petroleum Pty Limited (WAPET) have made a commitment to the Department of Mines Western Australia, as part of the permit conditions for TP/3 Part 1, to drill a minimum of one well between June 1991 and June 1992, and one well between June 1995 and June 1996. However, WAPET expect to drill a minimum of four wells and a maximum of 12 wells over the next five years. At this stage there are five prospects [Roller (for the Roller Oilfield Development), Paroo, Lightfoot, Weld and Australind] within the Permit Area that WAPET are considering for drilling, and three other prospects that are possibilities, i.e. Curlew, Thringa and Bessieres. The locations of these prospects are shown in Figure 1.
The Roller prospect is the subject of a separate report [Roller Oilfield Development Consultative Environmental Review (CER) (LEC, 1991)], for which, oil spill trajectory modelling was undertaken by Steedman Science and Engineering (1991a). The report on the modelling exercise was summarised as Appendix 4 for the Roller CER. Oil spill trajectory modelling has also been undertaken for the Saladin Oilfield Development, which is located within TP/3 Part 1. The modelling exercise was reported in Steedman Limited (1986) and constituted Technical Appendix 7 of the Saladin No. 1 Environmental Review and Management Programme. No other trajectory modelling has been undertaken for other locations within the Permit Area.
This document reviews the results of the modelling exercises undertaken for the Roller field and the Saladin location, and predicts the areas that would be at risk from an oil spill from the Paroo, Lightfoot, Weld, Australind, Curlew, Thringa and Bessieres prospects, based on the trajectories produced from the Roller and Saladin modelling exercises.

2.1 WIND
2.1.1 Synoptic Winds
Western Australia is subject to two main synoptic air flow systems that prevail during the winter and summer seasons, respectively. In between are the transition seasons when air flow conditions are variable.
During winter (June to August), northern Australia is dominated by an easterly airflow, the speed of which is influenced by the eastward progression of high pressure cells across central Australia. The Permit Area lies on the northern periphery of these highs where south, south-easterly and easterly winds predominate. The winds, known as the 'South-East Trades', comprise of cool, dry air originating over continental Australia.
During summer (October to March), the axis of the high pressure cell system (the subtropical high pressure ridge) is located south of Australia, and together with heating of the Earth's surface, causes a low pressure zone to develop over the north of Australia. These features control the surface winds over the north-west Australian continental shelf. The location of the Permit Area to the west of the semi-permanent low pressure trough usually results in a westerly and south-westerly flow of air. The air parcel has often travelled over warm tropical waters, therefore it may be moist and unstable.
April to May is a transitional period when the summer regime gradually breaks down and the high pressure ridge becomes the dominant synoptic feature. The other transitional season is -from September to October, -when --the high pressure ridge moves southward and the heat lows form. During the transitional seasons both summer (west and south-westerly) and winter (south, south-easterly and easterly) air flows may occur.
2.1.2 Sea and Land Breezes
In addition to synoptic winds, the Permit Area is also subject to locally-generated breezes. During the summer months in particular, and generally throughout the year, the differential heating and cooling of the sea and land during the daily cycle generates local sea breezes (onshore) in the afternoon and land breezes (offshore) overnight. This land-sea breeze system usually results in a daily swing in wind direction from southerly in the early morning, to westerly in late afternoon. -
Steedman have compared wind data from Thevenard Island with the wind data collected at the Onslow Post Office at 0900 hours and 1500 hours to compare the influence of the land-sea breeze system at the two locations. The data show that

3
south and south-westerly winds are predominant at 0900 hours at Thevenard, but westerly winds dominate at 1500 hours. These findings are consistent with the Onslow data. The strength of the sea breeze at the two locations is similar, but the land breeze (easterlies) tends to be slightly stronger at Onslow compared -with Thevenard Island (EPA, 1989). The influence of the land breeze within the Permit Area reduces with increasing distance offshore, and is not considered to be significant at distances greater than 20 km from the mainland.
2.1.3 Storm Winds
The study area is subject to three main types of storms: tropical cyclones, pressure gradient storms and squalls associated with thunderstorms.
Tropical cyclones have typical wind speeds of 15-30 rn/s and may generate peak wind speeds of 30-50 m/s. The duration of the cyclones typically range from 4-16 hours. They occur between November and April and may come from any direction, depending on the location of the eye. Their frequency has been estimated to be 1.5 storms per annum.
Pressure gradient storms may result from strong pressure gradients associated with intense high pressure cells. Depending on the time of the year, the storms may be strong easterly gales or westerly and south-westerly winds. Wind speeds may reach 20 m/s and the storms may endure for 3-4 days.
Squalls accompanying thunderstorms during the summer season result from strong downdrafts in the cumulonimbus cloud. The wind speeds may range from 15-35 m/s, with instantaneous gusts to 45-50 m/s. The squalls may come from any direction, but their duration rarely exceeds two hours, which is insufficient to generate waves, surface currents or storm surges of any significance to oil spill trajectory modelling -
2.1.4 Wind Data Used for Modelling
It was shown in Section 2.1.2 that the Onslow wind records are similar to the offshore wind data collected at Thevenard Island. The wind data collected offshore at BaITOW and Thevenard Islands are more extensive and therefore more suitable for use in the modelling exercise.
The Saladin oil spill trajectory modelling was based on wind data collected from Barrow Island for the period 1 January 1984 to 31 December 1984 (Table 1). The Roller oil spill trajectory modelling was based on wind data collected from Thevenard Island for the period 1 February 1987 and 31 January 1988 (Table 2)
To correlate data from the two sites for the purpose of this data review, wind data from Barrow Island for the period 1 February 1987 to 31 January 1988 (Table 3) were compared with the Thevenard Island data for the same period.

The most common wind directions from both sites for this period were:
ru
Barrow Island
south-west (22.7%) west (20.5%) east (14.9%) south (12.3%)
(0.9% calm; 8996 data points)
Thevenard Island
south-west (28.8%) south (18.1%) west (14.8%) south-east (9.1%)
(0.2% calm; 8755 data points)
The results indicate that both locations are subject to a predominant wind component from the south-west - south sector. Barrow Island is subject to onshore-offshore influences in the form of easterlies and westerlies, whereas the different orientation of the mainland shoreline near Thevenard Island causes the offshore compnent to come from the south-east.
The directional distribution of wind strengths at the two locations are very similar, but the percentage duration of a given wind speed is consistently higher at Barrow (Table 4) than at Thevenard Island (Table 5); Thevenard Island experiences more variable wind speeds over a given time period than Barrow Island. This phenomenon is probably due to the closer proximity of Thevenard Island to the mainland. At both locations the wind strengths are predominantly light to gentle (1-10 m/s), i.e. only 3.2% of wind speeds equal or exceed 10 m/s for more than six hours at Barrow Island (Table 4), and only 0.7% at Thevenard Island (Table 5).
2.2 CURRENTS
2.2.1 Available Data
No systematic study of the circulation in the Permit Area has been undertaken. Limited oceanographic measurements commenced at the Roller No. 1 site in April 1990, and several field measurement and numerical simulation studies have been undertaken for the Saladin Oilfield development adjacent to Thevenard Island. Real time current tracking of mats and drogues from selected sites in the Permit Area have been undertaken, and the results are presented in Appendix 4 of the CER. These real time results have not been included in the modelling exercises, but have generally shown that the model predictions represent actual current patterns.
Four main types of currents operate in the study area: tidal currents; wind-driven currents; Indian Ocean circulation; and thermohaline circulation.

5
2.2.2 Tidal Currents
Current monitoring recOrd indicate that the current regime is dominated by a semi-diurnal tide, with a pronounced spring-neap cycle and slight diurnal inequality. During spring tides, mid-depth current speeds at Roller reach 0.4 m/s, with a flood direction of 900 (flowing to the east) and an ebb direction of 250° (flowing to the south-west). Maximum tidal current speeds at mid-depth are reduced to 0.1 m/s during neap tides.
2.2.3 Wind-Driven Circulation
The available current data show that wind-forced currents are dominant during neap tides and appear to be perennially important in determining mean drift directions. Water flow is also influenced by the bathymetric contours (Steedman Science & Engineering, 1991).
The tidal current flows would be enhanced by wind-induced currents generated by the predominant south-westerly and southerly winds. However, as only 3.2% of winds at Barrow Island equal or exceed 10 m/s for six or more hours, and assuming that the 3% of wind speed rule applies for the deeper water of the outer permit area, then wind-induced currents are unlikely to enhance the tidal flow by more than 0.3 m/s.
Storm currents resulting from severe tropical cyclones may affect the area in summer. Typical storm currents of 0.25-0.50 m/s may be expected, with the flow generally being parallel to bathymetry. The relative position of the storm and the point of observation determine the direction, but the general direction of flow in that area is expected to be to the south-west (Steedman Limited, 1986).
2.2.4 Regional Oceanic Circulation
There is no obvious evidence of the influence of regional oceanic circulation on the measured currents at the Roller and Saladin locations. The Leeuwin Current is known to operate in the region, but its influence is relatively weak and the contribution of regional oceanic circulation to the study area is not expected to exceed 0.5 m/s (Steedman Science & Engineering, 1991).
2.2.5 Thermohaline Circulation
Occasional flooding of the Ashburton River can contribute markedly to the near-surface thermohaline circulation in the study area. In such instances it is expected that the Coriolis effect will divert the flood flow to the west of the study area, although density-gradient forces may cause north-westerly flows in the inner Permit Area. These flows are not expected to exceed 0.2 m/s, and due to their infrequency, they have not been taken into account in the modelling exercises.

6
3 CIRCULATION MODELLING
3.1 METHOD
Field data suggest that both wind-driven circulation and tidal motion will dominate water movement in the study area, and hence the oil spill trajectories. The role of the circulation models was to provide a time-varying surface current, for different metocean conditions as study examples to be input as forcing mechanisms for the oil spill trajectoiy model.
The numerical, hydrodynamic models used for the study comprised a depth-integrated [two-dimensional (21))] model for tidal-driven cases, and a '2.5-dimensional' (2.51)) model for wind-driven cases. The latter is able to model currents at any given depth, however due to constraints of computing time and data storage, the model was run with only uniform wind fields, constant in time, to produce steady-state current fields. Thus the wind cases to be modelled had to be represented as a constant wind strength from a given direction.
To model conditions driven by both wind and tide, the surface currents predicted by the wind-only 2.51) model were superimposed onto the tidal currents predicted by the 2D model. This approach is at worst conservative, since at times of strong tidal currents (e.g. spring tides) the effect of wind-driven forces is likely to be reduced.
Full details of the modelling criteria and results are given in Steedman Limited (1986) for the Saladin location and Steedman Science & Engineering (1991) for the Roller field.
RESULTS
3.2.1 Saladin Location
The modelling for the Saladin location was undertaken in 1986, using wind data from Barrow Island. The model used had a relatively coarse grid which does not necessarily reflect the effects of localised changes in bathymetry.
Figure 2 shows the depth-averaged current strength vectors at each nodal point on the model grid for the tide-driven model under spring tide conditions. The model results suggest that the tidal ellipse at Saladin will have a major axis oriented south-east to north-west (Steedman Limited, 1986). Variable tidal flow directions and strengths are caused by channelling of the flow between islands and reefs. Decreases in water depth over the shoal areas increases the speed of the currents, as shown by the longer vectors in Figure 2. Near the coastline the vertical structure of the current differed from that of the more open water areas. Generally the flow is parallel to the coastline, but there is a small cross-shore flow which may be

7
onshore or offshore at the surface, depending upon the wind direction relative to the coast.
The current vector plots generated by the wind-driven model for strong easterly wind conditions (based on wind conditions at Barrow Island from May 17 to 22, 1982) are shown in Figure 3. The water circulation responded quickly to the increased wind speed of 19-20 May and this circulation pattern was maintained (with slightly decreased current speeds) until 0000 hours on 22 May, when a decrease in the wind speed caused a corresponding decrease in current speed. Following an increase in the wind speed between 0000 hours and 1200 hours on 22 May, the water currents again increased in speed until the wind speed decreased at 2400 hours on 22 May. The modelling exercise shows that the water body in the study area will respond quickly to changes in the wind conditions, and that the current flow, particularly in the shallow water near the islands and the mainland, will be markedly enhanced by the influence of strong winds. The direction of the flow was determined by the wind direction and the local bathymetry.
3.2.2 Roller Field
The modelling for the Roller field was undertaken in 1991, using wind data from Thevenard Island. The model used a finer (more detailed) grid than the previous Saladin modelling exercise and therefore better represents nearshore current patterns in the shallow water.
Figure 4 shows the depth-averaged current vectors at each nodal point on the model grid for the tide-driven model under spring tide conditions. Figure 5 shows the vectors for neap tide conditions. Maximum current speeds are attained at approximately midway between high and low spring water. Speed variations are created by changes in water depth across the grid and the presence of obstructions (islands). The maximum depth-averaged tidal currents are predicted - to - be approximately 0.4 m/s in agreement with .the measured data (Section 2.2.2).
The current vector fields generated by the wind-driven model were determined for a depth of -1.0 m (1 m below sea level) at hour 65. The results for the eight cases (wind directions) are presented in Figures 6 and 7. The plots show that surface currents in the study area are strongly influenced by the local bathymetry, which constrains the direction of flow. The speed of the wind-generated surface currents ranged from 0.1-0.5 m/s and were typically at least 3% of the wind speed (0.3 m/s) or faster.

4 OIL SPILL TRAJECTORY MODELLING AND PREDICTIONS
4.1 RATIONALE
The model used for the oil spill trajectory modelling for the Saladin and Roller locations was a simple tide- and wind-driven, conservative advection model which considers the advection of oil by the superimposition of the time-dependent tidal currents for spring and neap tides with the steady-state wind-driven currents. The model is unable to incorporate the effects of weathering of the oil or its difference in density compared with seawater, so the following assumptions were made:
oil travels with the ocean currents;
the oil slick is conservative (i.e. no loss through evaporation or chemical transformation);
both the horizontal and vertical turbulent diffusive processes can be ignored; and
the wind-driven and tidal currents dominate the oil slick movement through the coastal waters.
- It was acknowledged that these assumptions lead to an over-estimate of the distance of travel of the slick, because the slick will tend to maintain the same direction as, but lower speed than, the underlying water.
The results derived from the circulation modelling exercises were input to the oil spill trajectory model to generate the oil spill envelopes for given wind and tide conditions.--------..
Estimates of the trajectories were calculated using the oil spill model for durations of 6, 12, 24 and 48 hours after release from the source. Oil travel times in excess of 48 hours were not considered, as contingency plans in the event of an oil spill are expected to allow spill containment action to be taken within 48 hours.
For each duration (6, 12, 24 and 48 hours) the region through which an oil spill may travel under the influence of surface currents was determined from the trajectories of a continuous series of discrete parcels of oil. A parcel of oil is released from the prospect site each 30 minutes.
4.1.1 Saladin Location
For the Saladin location the model was run for release from four locations (the proposed Saladin well, the Koolinda location, and two locations south-east of

Thevenard Island) and four types of wind conditions. A total of 10 case studies were conducted.
4.1.2 Roller Field
For the Roller field the oil spill trajectory model was run for release from three proposed well sites: Roller North (near Roller D), Roller Central (near Roller C) and Roller South (near Roller A and B). Modelling runs from each well site were made for spring and neap tides (tide-driven current only), and for combinations of each wind direction (eight intracardinal directions) with each tide option (spring and neap); a total of 54 scenarios.
The 'worst case' approach was adopted for the modelling of wind-driven currents. Table 5 shows that winds exceeding 10 m/s seldom persist for any length of time at Thevenard Island (i.e. only more than six, hours for 0.7% of the time). Therefore 10 m/s was chosen as the worst case example for non-storm conditions. Eight wind directions were chosen: north, north-east, east, south-east, south, south-west, west and north-west.
Storm conditions were not modelled because they rarely persist for sufficient lengths of time to generate important wind-driven currents, and the assumption is made that during several storm conditions, the oilfield operations will cease thus minimising the risk of an oil spill.
4.2 RESULTS AND DISCUSSION
4.2.1 Saladin Location
4.2.1.1 Overview
Table 6 summarises the maximum excursion of a parcel of oil from all of the Saladin locations under the combined effect of winds and tides for the 10 case studies. Maximum excursion occurred during the easterly gales, particularly on neap tides, when the wind is the predominant current-driving force.
The simulations indicate that combined wind and neap tidal currents will move the oil at 'a maximum distance of 8-30 km over a 48 hour period. The importance of wind-induced dispersion increase with time; after 48 hours the influence of the wind begins to exceed that of the tides.
For the Saladin and Koolinda locations oil spill scenarios, tidal flow advects the spill in a north-west, south-east direction. The excursion for spring tides exceeded that for neap tides.

4.2.1.2 Strong Easterly Gales
For the case of strong easterly gales, the wind-induced currents drive the oil spill around the north and south of Thevenard Island. After 48 hours, the envelope corresponding to a spill from either location totally encompasses the Island (Figs 8 &9).
4.2.1.3 South-Westerly Winds
South-westerly winds spread the spill in a north-easterly direction away from Thevenard Island (Figs 10 & 11).
4.2.1.4 North-Easterly Winds
For north-easterly winds, the wind-induced currents advect the spill south-westerly, south of Thevenard Island. The tidal excursion does result in some of the spill passing to the north of the Island. However, the northerly component of the wind is not of sufficient duration or strength to drive the oil spill onto the coast near Onslow (Figs 12 & 13).
4.2.2 Predictions for Australind
The Australind prospect is located approximately 4 km north of the Saladin field, in an average water depth of 17 m. Due to the close proximity of Australind to the Saladin A (Koolinda) well, the results of the oil spill trajectory modelling for this well have been chosen to represent the Australind project.
4.2.2.1 Easterly Gales
Figures 8 and 9 indicate that flow in the vicinity of the Australind prospect would be to the west during strong easterly winds. Therefore a spill from Australind during easterly gales would be expected to move to the west, bypassing Thevenard Island.
4.2.2.2 South-Westerly Wind
A spill from the Australind prospect during a south-westerly wind would move in a north-easterly direction between Airlie and Rosily Islands (Figs 10 & 11).
10

11
4.2.2.3 North-Easterly Wind
A spill from the Australian prospect during north-easterly wind conditions would be likely to move to the south-west and would probably impact on the north-western and western shores of Thevenard Island (Figs 12 & 13).
4.2.3 Roller Field
The results of the modelling runs for the Roller field for combined tide and wind-drive currents are summarised in Table 7, which presents the risk frequencies of the shorelines in the study area from an oil spill from each of the proposed Roller well sites. The percentage likelihood was determined according to the duration of oil spill release before landfall at a particular location and the percentage occurrence given in Table 2 for winds from the given direction. It should be noted that the tables represent discrete wind directions only.
Table 6 indicates that the greatest risk to nearshore marine resources is associated with spills that occur during northerly, north-easterly, south-westerly and westerly winds, i.e during summer and the transition seasons. The principal shorelines at risk are those in the immediate vicinity of the Roller Oilfield, i.e. Ashburton Island, Entrance Point (at the mouth of ,the Ashburton River) and the coast adjacent to Rocky Point. The low risk for most other shorelines in the region is due to the very low persistence of winds greater than 10 m/s in the area.
Although Table 2 shows that southerly and south-easterly winds constitute 27.2% of the winds that occur at Thevenard, the wind-driven circulation model (Fig. 6) and the trajectory model showed that under these conditions the oil slick would move to the north-west and west, respectively, and would not endanger any of the mainland shorelines. Table 7 shows that a spill associated with a south-easterly wind would only impact on one shoreline, i.e. Sunday Island, and -the risk frequency of this occurrence is less than 0.1%.
The following sections summarise the impact of the oil slick from Roller North under spring tide conditions and winds from the north, north-east, south-west and west, respectively.
Only the spring tide condition is discussed because spring tide conditions cause greatest spread of the slicks. Tide-driven forces exceed wind-driven forces during spring tides, so the slicks take on an elliptical shape, compared with the elongated shape which results during neap tides. Overall envelope lengths are comparable for neap and spring tides.
The oil spill envelopes that are presented in Figures 14-17 depict the region in which the oil slick is confined. The oil does not cover the entire envelope. The slick's position at any time is dependent upon the phase of the tide at the time of release. If the envelope impacts a location, it does not necessarily follow that oil

12
will impact that location, particularly if the envelope is very wide, i.e. some spills may be contained within the envelope but not actually within the entire envelope.
It is also important to note that all of the trajectories represent conditions with a sustained wind of 10 m/s over the given period, however- in reality wind records from Thevenard Island show that wind speeds of 10 m/s or more persist for longer than six hours only 0.7% of the time; wind speeds are generally less than 10 m/s. The trajectories also do not allow for any weathering of the slick, so the trajectories are very conservative.
4.2.3.1 Northerly Wind and Spring Tide
Figure 14 shows the oil spill envelopes for release times of 6, 12, 24 and 48 hours for the case of a northerly wind during spring tides. The plots show that the slick moves directly south, and by six hours after initial release the spill is starting to impact on the shoreline at Entrance Point. The slick is relatively confined by the shape of the coastline either side of Entrance Point.
4.2.3.2 North-Easterly Wind and Spring Tide
Figure 15 shows the oil spill envelopes for the case of north-easterly wind during spring tides. In this case the slick forms an ellipse with an axis that extends in a south-westerly direction. The slick may impact the shoreline north-east of Rocky Point 6-12 hours after the initial release, and may reach Locker Point by 48 hours after the initial release time.
4.2.3.3 South-Westerly Wind and Spring Tide
Figure 16 shows the oil spill envelopes for the case of a south-westerly wind during spring tides. The slick envelope fans outward to the north and north-east, and may impact and surround Ashburton Island. By 12 hours after the initial release time, the slick envelope has formed a bulging ellipse which extends to the north-east. Bathymetric features south-east of Thevenard Island channel the flow of the water and cause the oil envelope to narrow and then bulge around the eastern side of the Island and continue northward. The bulge in the envelope occurs where the wind is driven at an angle to the tidal currents.
4.2.3.4 Westerly Wind and Spring Tide
Figure 17 shows the oil spill envelopes for the case of a westerly wind during spring tides. Within the first six hours after initial release - the oil slick envelope fans out to the north-east, and oil may impact the eastern side of Ashburton Island. By 12 hours after initial release the slick envelope forms an ellipse whose axis

13
extends toward the north-east. Over the next 12 hours the slick envelope takes on a propeller shape and begins to veer toward the north in response to tidal oscillations.
4.2.4 Predictions for Paroo and Curlew
The Paroo prospect is located approximately 10 km east-north-east of the Roller prospect, and is approximately the same' average distance from the mainland shoreline as the Roller prospect, located in similar water depth (10 m). Due to the similarity in the aspect of these two prospects it is considered reasonable to apply the results of the oil spill trajectory modelling for Roller D (Roller North) to the Paroo prospect.
Figure 2 shows that the direction of, flow during spring tides is similar at both the Roller and Paroo/Curlew locations, but the tide-driven flow at the Paroo/Curlew location is stronger. Wind-driven flows (Figs 4 & 5) are similar for the two locations.
4.2.4.1 Northerly Wind and Spring Tide
Under these conditions, any oil released from the Paroo and Curlew locations is expected to flow toward the mainland shoreline and could impact at Onslow in less than six hours from the time of release. The lateral spread of the oil in the nearshore region will depend on the strength and direction of the nearshore currents and wave action.
4.2.4.2 North-Easterly Wind and Spring Tide
.Under these .,onthtions,, oil released from the Paroo and,CurlewJocations,js_, expected to flow to the south-west and impact the mainland coastline in the embayment between Onslow and Entrance Point in less than 12 hours. The oil would probably be prevented from moving further south-west along the coastline by the presence of the Entrance Point headland.
4.2.4.3 South-Westerly Wind and Spring Tide
Oil released from Paroo and Curlew would be expected to flow to the north and north-east and may not impact on any shorelines if strong currents at the eastern end of Thevenard Island deflect the flow from the Island. The spill would be expected to continue to move to the north-north-east toward Airlie Island, but would take 24-48 hours to reach that shoreline.

U 14
4.2.4.4 Westerly Wind and Spring Tide
Oil released from the Paroo and Curlew locations under these conditions would be expected to flow to the north-east toward Direction Island, and possibly impact on this shoreline within 6-12 hours. Other shorelines potentially at risk, if the spill flows in a shore-parallel direction, include South Island, Middle Island and North Island.
4.2.5 Predictions for Thringa, Bessieres, Lightfoot and Weld
The Lightfoot, Thringa and Bessieres prospects are located north-west and west-north-west of the Roller field, and the Weld prospect is located north. Average water depths are 15 m (Lightfoot), 13 m (Weld), 12 m (Thringa) and 12 m (Bessieres). In terms of bathymetry and location, the two prospects lie between Saladin and Roller. The modelling undertaken for the Roller North location is considered to be more representative of these prospect areas than the modelling conducted for the sites south-east of Thevenard Island because the latter are strongly influenced by the localised metocean conditions associated with the shallow water surrounding the Island.
Figure 4 indicates that spring tidal culTent vectors in the vicinity of the Thringa, Bessieres, Lightfoot and Weld prospects are stronger than those at the Roller field, and at times of peak flow, the direction of flow is onshore-offshore, whereas the vectors at the Roller field show the flow to be shore-parallel. This difference is not apparent during neap tide conditions (Fig. 5). The strength and direction of the wind-generated current flow vectors do not show any marked differences between the prospectiocations and the Roller field.
4.2.5.1 Northerly Wind and Spring-Tide -
During these conditions it is expected that a spill at any of the prospects would flow towards the mainland shoreline, as the spring tidal flow is onshore and would be enhanced by the northerly wind. Such a trajectory would put Ashburton Island at risk within six hours of the time of release. The time taken for the spill to reach the mainland would depend on the influence of the longshore currents in the nearshore water. The area affected is also difficult to predict, but could range between Entrance Point and Rocky Point.
4.2.5.2 North-Easterly Wind and Spring Tide
Under these conditions a spill from the prospects may or may not impact Ashburton Island, depending on the resultant vectors from the combined effect of the wind and tide. The spill would be expected to move toward Locker Island but would probably take in excess of 24 hours to reach that shoreline.

15
4.2.5.3 South-Westerly Wind and Spring Tide
Under these conditions, a spill from the prospects could potentiallyimpact on the western end of Thevenard Island, or could move directly north and bypass all shorelines on adjacent islands.
4.2.5.4 Westerly Wind and Spring Tide
Westerly winds combined with a spring tide would move the oil directly toward Thevenard Island, and the impact would probably occur within 12 hours of the time of release.

16
5 CONCLUSION
Offshore islands and the mainland shoreline are the resources most at risk from an oil spiii due to the predominance of winds from the southerly sectors. However, the potential exists for spills to affect mainland resources during periods of easterly and north-easterly winds. Marine resources outside TP/3 Part 1 could also be affected.

- 17
6 REFERENCES
Environmental Protection Authority, 1989. Roller No. 1 Oil Exploration Permit TP/3 Part 1. WAPET-- Pty. Limited. Report and Recommendations of the Environmental Protection Authority. Bulletin No. 415, Environmental Protection Authority, Perth, Western Australia, 18 PP.
LeProvost Environmental Consultants, 1991. West Australian Petroleum Pty. Limited. Roller OilJield Development Con.ultative Environmental Review. Unpublished report to West Australian Petroleum Pty. Limited. Report No. R342, LeProvost Environmental Consultants, Perth, Western Australia.
Steedman Limited, 1986. Prediction of Oil Spill Trajectories for Saladin Location. Unpublished report to LeProvost Semeniuk & Chalmer. Report No. R306, Steedman Limited, Perth, Western Australia.
Steedman Science & Engineering, 1991. Prediction of Oil Spill Envelopes for the Proposed Wells Associated with Roller Field. Unpublished report to West Australian Petroleum Pty. Limited. Report No. R491, Steedman Science & Engineering, Jolimont, Western Australia.

TABLE 1
OCCURRENCE OF WIND SPEED AND DIRECTION AT BARROW ISLAND BETWEEN 1 JANUARY 1984 AND 31 DECEMBER 1984
WIND SPEED
(km/h) <7 7-14 14-22 22-29 29-36 36-43 43-50 >50 DIRECTION TOTALS
(mIs) 0.1- 2.1- 4.1- 6.1- 8.1- 10.1- 12.1- >14.1 (%) 2.0 4.0 6.0 8.0 10.0 12.0 14.0
North 0.5 1.7 1.1 0.5 0.3 - - - 4.1
North-east 0.6 3.0 2.1 1.4 1.0 0.4 - 0.1 8.6
East 0.6 2.7 2.8 2.7 2.8 1.8 0.3 0.1 13.8
South-east 0.7 4.8 3.0 1.1 0.3 0.1 - 0.2 10.2
South 0.7 3.6 4.6 2.3 0.8 0.3 - 0.1 12.4
South-west 0.9 4.7 6.8 7.7 3.5 0.7 0.1 0.0 24.4
West 0.5 3.0 6.5 6.5 3.4 0.5 0.1 - 20.5 North-west 0.5 1.5 2.4 1.1 0.2 0.1 - - 5.8
Total (%) 5.0 1 25.0 29.3 23.3 12.3 1 3.9 1 0.5 0.5 *100.0
* Includes occurrence of calm periods (0.2%)
Source: Steedman Limited (1986)
In

TABLE2
OCCURRENCE OF WIND SPEED AND DIRECTION AT THEVENARD ISLAND BETWEEN 1 FEBRUARY 1987 AND 31 JANUARY 1988
WIND SPEED
(km/h) <7 7-14 14-22 22-29 29-36 36-43 43-50 >50 DIRECTION TOTALS
(mis) 0.1- 2.1- 4.1- 6.1- 8.1- 10.1- 12.1- >14.1 (%) 2.0 4.0 6.0 8.0 10.0 12.0 14.0
North 1.3 3.1 2.3 1.3 0.3 0.0 - - 8.4
North-east 0.8 1.8 1.9 1.8 1.1 0.4 0.1 0.0 8.0
East 0.7 2.0 2.1 1.1 0.4 0.1 0.0 - 6.4
South-east 0.7 3.2 2.8 1.8 0.6 0.0 - - 9.1
South 0.9 3.4 4.9 5.7 2.8 0.5 0.0 - 18.1
South-west 0.9 5.3 9.2 9.8 3.2 0.4 0.1 0.0 28.8
West 0.7 4.3 4.8 4.0 1.0 0.0 - - 14.8
North-west 0.7 3.1 2.1 0.2 0.0 - - - 6.1
Total (%) 1 6.7 26.3 30.1 25.7 9.3 1.5 0.1 0.0 *100.0
* Includes occurrence of calm periods (0.3%)
Source: Steedman Science & Engineering (1991)
19
I

TABLE 3
-OCCURRENCE OF WIND SPEED AND DIRECTION AT BARROW ISLAND BETWEEN 1 FEBRUARY 1987 AND 31 JANUARY 1988
WIND SPEED
(km/h) <7 7-14 14-22 22-29 29-36 36-43 43-50 >50 DIRECTION TOTALS
(m/s) 0.1- 2.1- 4.1- 6.1- 8.1- 10.1- 12.1- >14.1 (%) 2.0 4.0 6.0 8.0 10.0 12.0 14.0
North 0.3 2.1 0.8 0.1 - - - - 3.3
North-east 0.8 2.5 3.1 2.3 0.9 0.2 - - 9.7
East 0.5 2.8 3.3 4.0 2.6 1.3 0.5 - 149
South-east 0.4 3.9 3.6 1.6 0.2 0.1 - - 9.7
South 0.5 4.1 4.0 2.7 0.8 0.1 - - 12.3
South-west 1.1 6.0 9.4 5.2 0.9 0.2 - - 22.7
West 0.9 4.4 8.7 4.8 1.0 0.7 - - 20.5
North-west 0.7 2.7 2.1 0.4 0.1 - - - 6.0
Total (%) 5.2 28.6 35.0 20.8 6.5 2.5 0.5 0.0 *100.0
* Includes occurrence of calm periods (0.9%)
Source: Steedman Science & Engineering
20

TABLE 4
PERCENTAGE DURATION OF WINDS AT THEVENARD ISLAND BETWEEN 1 FEBRUARY 1987 AND 31 JANUARY 1988
WIND SPEED
DURATION (hours)
km/h m/s >6 >12 >18 >24 >30 >36 >48 >96
~t43 ~!12 0.0 - - - - - - -
~36 ~!10 0.7 0.0 - - - - - -
~!29 ~!8 6.9 3.9 1.6 0.5 0.5 0:5 0.0 -
~!22 ~!6 30.2 21.4 12.2 7.1 5.4 4.2 2.0 0.0 ~!14 ~4 61.5 52.4 44.6 36.1 35.0 33:1 26.4 13.7
~t7 ~t2 91.7 88.9 83.9 75.5 71.7 68.4 61.0 48.7
0-7 0-2 8.3 - - - - - - -
Source: Steedman Science & Engineering (1991)
TABLE S
PERCENTAGE DURATION OF WINDS AT BARROW ISLAND BETWEEN 1 FEBRUARY 1987 AND 31 JANUARY 1988
WIND SPEED
DURATJON(hou
krn/h m/s >6 >12 >18 >24 >30 >36J >48 >96
~!43 ~t12 0.7 0.3 - - - - - -
:~!36 ~t10 3.2 2.6 1.5 - - - - -
~t29 ~!8 8.8 7.2 5.7 3.6 2.9 2.1 0.9 -
~!22 ~6 30.5 26.4 22.2 15.9 13.2 9.3 7.0 1.6
~!14 ~!4 64.4 61.4 57.7 53.4 50.3 46.0 35.7 26.5 ~!7 ~!2 94.1 93.8 92.8 91.7 90.4 89.5 84.8 73.9
[__0-7 0-2 5.9 - - - - - - -
Source: Steedman Science & Engineering
21

TABLE 6
SUMMARY OF OIL SPILL SIMULATION CASE STUDIES AND MAXIMUM EXCURSION DISTANCE FOR THE SALADIN LOCATION
TIDE AND WIND MEAN WIND MEAN WIND MAXIMUM MAXIMUM PATTERN SPEED DIRECTION EXCURSION EXCURSION
(m/s) (deg) DISTANCE DIRECTION (km) (deg)
Spring tide - - 12.0 120-300
Neap tide - - 8.7 120-300
Spring tide and 9 90 26.1 240 easterly gales
Neap tide and 9 90 30.7 240 easterly gales
Spring tide and cold 5 200 6.7 302-330 front
Neap tide and cold 5 200 8.0 40 front
Spring tide and 8 230 13.4 45 south-westerly wind
Neap tide and south- 8 230 18.7 35 westerly wind
Spring tide and 7 0 20.0 240 northerly wind
Neap tide and 7 0 20.0 240 northerly wind - - -
Source: Steedman Limited (1986) -
Notes: (i) Maximum excursion distance is related to 48 hour travel time (all release points). Often the direction is bimodal as a result of tidal motion. Directions expressed are away from the observer (or downwind).
22

TABLE 7
RISK FREQUENCY AND TIME TO IMPACT OF AN OIL SPILL FROM THE ROLLER WELL LOCATIONS
RELEASE POINT
SHORELINES AT RISK
RISK FREQUENCY
(%)
WIND DIRECTION
TIME TO IMPACT
(HOURS)
Roller North Ashburton Island 44.3 Calm, SW, W 6 (near Roller D) Entrance Point 8.4 N 6
Thevenard Island 0.5 SW 12 Rocky Point 0.5 NE 12 Locker Island 0.1 E 12 Fly Island 0.1 E 24 Serrurier Island <0.1 SE 24 Coolgra Point <0.1 NW 24 Sunday Island <0.1 SE 48
Roller Central Ashburton Island 43.6 SW, W 6 (near Roller C) Entrance Point 8.4 N 6
Thevenard Island 8.0 NE 6 Rocky Point 0.5 SW 18 Locker Island 0.1 E 12 Fly Island 0.1 E 24 Onslow <0.1 NW 12 Coolgra Point <0.1 NW 24 Sunday Island <0.1 SE 48
Roller South Ashburton Island 28.8 SW 6 (near Roller Entrance Point 8.4 N 6
A and B) Thevenard Island 8.0 NE 6 Rocky Point 0.5 SW 18 Locker Island Onslow <0.1 NW 12 Coolgra Point <0.1 NW 24 Sunday Island <0.1 SE 48
23
Source: Steedman Science & Engineering (1991)

24
[114°
115°00'E
WA-24—P
7TP/3 Pt.I 21° 15'S
pt_I to Rosily Island
REFERENCE
Oil well
* Oil and gas well
Prospect AUS TRALIND
21° 30'S
JO Direction Islar
TINGS
?LEW
J Bessieres Island
THRINGA Tortoise .1
Ashburton Islan BESSIERES ---v- -:-.-:-:-- .--' PARO
ROLLER D(proposE ROLLERJ,OLLER C (proposed)
@West Australian Petroleum Pty. Limited
LOCATION MAP
J217 R345

25
In 01 01 '-4
In CM
0 '-4
'-4
0
0 0 1
CM
CO

4
9861 PO4IWfl UUUJPOOIS :3flos Z861 IZZArR .Xfl04 0000(q)
61 'ez .cw .tnoq oot (3). 8 o
861 • tZ Auw anog oot ()

CUMUlI YCC1005 AQUA 70 '•$ N
0.00 111$
o KM 6.00
.4.4.4.4 PP.P.7 tI 44444*A A A A A P. A A ALASkA P. A 4(4 • •
711144* A A A A A A A AS' S 5.46k 6 •+a4$ + ft f
4 4 4 A a a A 5 8 A A 6 It 8 A A A A 4 4 4 A 4 4 4 6 6
444 a a - 46 5.6 8 8 8 A A A A A A A4 PA 46 6
* 4 4 ) 'p p .4 a 44 44 A It A 55. A it A P. a. a. A tA S S S 46
/ .0 • a.V till 4 A A • 6,555* 55. APP. S. P.AP.Aa. A
SI-I.',114 4,4
44 QIl *4* 4S't SP.P°'AAPrVV
S I.AW'4>1114 AAAAAAAI.rVttt (C OflSIOW SI a.l.V44nna4**4*444AA*A A A AP.Pr ' VP.
ADa.L4.L.<r,A:A*_442A*A*.A Entrance Pt
Rocky Pt * A 4.44.4.4< tpP.P.APAP.P.P.AA
CUMUlI VICTORS hOUR 10 !
0 Xh 6.00
\ k.68t,y. • • a & a... a... a. a. a.a.a. a. I. 5. i..wr ' (*4 4 4 4444.44 L..a. * 4 <4444* tt
t 665, PAt (4 <ALL L.a. I. a. a. 1.1. AtVVV * • bL-.,J+ 5. L a a a tttt*hPrrc4,*&*La.a.a.a.a.a.a.a.5., 4 V4'1
If 4 A
If f 0 (a A A P. ç <(L&LL 7444444 A P.t C I. *1.554 ti. a.a.L.a. 1. 4.1.1. LI. • 4
144 PP V
(444
p 4 44 1' A P P. P P C 4 4 4. 44 a. a. a. a. L. I. a. 4.
'P. N CURIPEKI 1010003 AQUA 73 0.50 ois
0KH 6.00 I
t ft
ft ft 666868 hI ft ft kkk8Ss St
1' 4 0 4 4 44 6 6 8 4 4 f 4 4 4 6 66
ph ph 4 6 6 6 6 ,, 1\ \
4...4.i..p. tttI 4.
\ 65865 hISS
666 6
6\ :
6666668
'
CUM150 YCCOOP, tOut 00 0.00 PP'S
—# L
API 5.00
4444 *
4444444 . a a a a a a .4 '-.;"
, • , . 4 4 4 . a a 5 .4 * a 'a '5.4 .4 4 .., ... 'a SII4II*444 a 4*44 P4*1444444444 5*4 4S4'aO P. • 4 4 4 4 4 4 4 4 4 * 'a
a.' P. 1 • i 9 9 9 9 ' '.\ \ 'a
I I {
\a9
9o\'9 '95999*449*4A
'4
lb

J'# ))<.4l44*.4PP.PPPpp(&4
PP
4444(448.4.9.4.4 .44.44444.J.J,4.J 4< ¶ '.cpp P. P41
::'4 P.V0.4 Op
* W44'44444VVt " ".4.44.444.4.44.4.44 .4444 4444 4 4 -i i.st I
(<(<<C 44.4.9.4.44444444444444443.4443,4 44(4 .4 .4 ( 4 4 (4.l'94444444.4 04'4>'4 S
p.'.'. C 4 (69'44'444444443)3).1.%3 >3344'4 T P V r c 4 4 4.44 .4 .4 4 4 .4 4 4 4 3 3 .4 , .4 > 3 .4 4 > 3 4 .4 .4 p. p p p P (3 3 44 4 4 44 4 33 .4 ) .4 .4 3 .4 1 >1 .4 3 3 3 4 .4
'.1- <'. VP'. P PP PI'" 344334
33)4 .4 .4.43.4)444.4.4 94.44 1)))>>) 334344(94.
1 oo' ' o m
_!' 06 00041 0440133* 181341<03
-
414*'
<
t P V P P P P P P P A P. P 81' A A * ***AAAA, <V.4CC?? Pt? Pr'. i-P P4. pA p-pp p.0.9*4
t '.tl0'.P'.PP ppp.tfr.4k J'A rttrr '.IP Pt? r rt. r r P.44.90.. P'.AF.?. P94. A*.CI I .4
41.4crP rr'. PPP.PV,?? PPPPPP PAp'. r PPP P PP'P. 9*4111 (CT '.'. '. p.'.'.,'.'. v '.t vr rr Pr, - ppp '.pp. PP. P.A444 ACT PP P PP P Pt?'.?? TV? Pt'.P<Yt PP Vt'.'. P P P i-
pp. pp - Pt'. pp pp ppPA VT'.??'. Vt??'.'. P Pt.'.'. P P
TV?? cc c ¶1? t p. V VP TV'.? Pt PP P p. t PIP p. p P APP P ttt ??T'. ICC ((C C C VCV'.?PP Pt??'.?? p- PP P ?FPPPP A A P'.C<Y,Ttt (<((CC Vt????'. CC? (<TV?'.?'.
I 009 0 m
' _!0 06 0009 600133* 1*30003
\ ¶ .ttt4kt,k,.PP,
H (44*4
4. 0 2 2 2 2 2 2 2
4 44(44< CTTVPPPPPPPPP' 44(4 ((C((< (<CC'.???
(<<<((4449 C? (??'.'.< Pr'.? Pp..4 pp.94.4*44
: ; 4 4(<<<.C(<C(<( (C ('.4 Pr PTPPPPP I tee * •<<<C<<CCCCC <<<((CCC??? C (Cr'.'. p PP p9*44.4 <-1-4 44C<(C<<((( <C<(<(<<tt '.4<4.4? P1- V pp 9P.A4 4 4 ct * t CCC CC <(<<4< 4 (CC C C <DCC (.4< C'. C VT'.'.'. pAP.A* 4'.. ¶(??Cc(CCCC(CCCC<C4C C <4<(<<<ççp.p'.ppPPP* 4(4(V'.?'.(<<((C<<<( (4(4< 4(4< ((((<CC'.tPPPPPP9
<<<<<'.<C(C?P P P pp
C V P P t P p p p p < < < 44C(4LCC<<<<<< (4((((CCCCC
'C4L4LLL4LCL( <<<<< ((cc(<<<((.4
009Nm 0
s,u4_.s.0 00 0009 0001334 38130003
6p4444444 1 1).4l
IdJO)OO1 4 4.44.4.44.44443>1.4
- 34'434.430)44444),P/ ,,>3343ai3.44444>3v
11717} 343)4444444444<
Mol
Id .I
d 1111117777>>>) )34J44444
'.sr'. ., , , , ,O -, , , , • , 3 4 .. 4.
I-,
* n"fl.f'l 111111111 11111>77>) 3433344.4.44 su043< .444.4
<CPP*,,11 't11I11I111'7114
1Z
11)))> )4444yp 4 C PP A 4114410111111111111 a 01 7>30 $3
+ 4 4 C V P'A*4 1 1 1 11 1 I I I 111 I 17 17 14 117 .4 3' .4 1 '4 4 *.CIIIIIIIIIII'tIllll?<)Il 1V7,, >3'4<
>>1>8444.444 St I 444444
4 4 n -j 11 'p 'p 'p -p I I I I p 1 1 1 1 1 7 I 7 7 '4 4 '4 '4 '4 <4.4*444.44 4I.,en4 ,117.,'p-,l,,ip, >4.>84344434
* *444I.4411 4 A 44 44 4 .4 jj'p.4 .4777 7>>)13)34>4 '4'4
4 4 I 1 1 1 7 .4 øje<<b ç, -1 1 1 1 1 1 1 .4 7 > - '4 '4 '4
+ 44*11 I 111111717)> 4)34444*4.4 4 4 * 4 .4 1 7 .4 7 .4
I oo9M0o '4 . 6/4* 00'O
P1 ._ (6 00081 00013)) .48139003
-J 0W I- z 0 W -
cr.Z
IIW-J I-LL.
w Oi > cr -J
Oj
II
Ocr>- cr
<I-0LL
CL
ric
-
Co Co 0) C- V 0
C
C E
4- 0 0 o Cl)
ir
co

C') ( 11I\ g
C)
—. H CUMCIIt YHCTOIIS 00011 60
. —J
H CD CD CUJIT 00CTQIO P 00
0 50 I/S * _ I — D 0 6.00 0 6.00
a \\\\\\\ \\\\\\ \\\\ 444.444. 444J_44444444444444444 444444.t ii jjj $J H 4444444444444141114 411
11411111 3 64 \\\\
\\\ \\\ H 11H0000400044b4400',I 540 '4\\\ 1414444144 4 411i1111 111 0 11 64 11 64 44444 4* 4 0000 0000 11141111 1iiiiij// ////
a 44411113411/II/I///
mcC') ° \ l'\ Q-C 6
EfltrncPt J j 4j4 4 44. 4. 4.4I.0fl a t 44
Rocky Pt
a 0 Locker Pt (a)
Ons low
z
J T'fl
Woom 13 -a
m CA m
Cl) -O - 0X3
fl1 WH&I4t YCC?W43 110141 IS 0.061/s
D 0 6.00
mT
.4-'
e'eI ee dd.'di,I.'11'i/ mlw
m m .4.4.4.4
> z = / ///// ///J
-I r
(c)
mC
CLIWICHY VCCTOII5 11000 65 H
4., 0 041 6.00
_-4-
-4
II,.,, II. 4* ._'I'-.*..I.*.._-4+4-4--4 •l -.---._-._* .11..
T001 4_4O4
Cd)
N)

C5.ACJT YCC0605 10U0 05 0.50 HIS
o 6.00
oçk k\
4 4 4 It 8 8 11 8 \ ' 6*6*4*88* 4#*kk$t81 1kk8111\8\\
*0* 6 6*64 4 4 44$ +.+t 1 8 0068 4 8 4 118 I 1 'c I I 8
88I\ \ \ 0.886'\
$
t I t t t I 1 It ft I ¶ It I 1 Onslow
lf
it
?11111 ft
Lock
Pt
Lferpt
tttft
( a)
T
0(C1005 #o.m OSN I
0.50 M/S 6 I _ I I 0 RM 5.00 I I
ft ft )•ft ft ft,0 ft/Oft ft ft ft ft ft ft F ft ) ft ft 1 ft ft/•fIff ft ft/ftftftftftftftft ft ft ,%/ft/Oftft ,0 ftftft$f ftF,%?/pftt7/7/7///A1 ,/,,7/7//77 'ft-ft
ft/Oft's-ft ,0ftftftftftftft,0ftftftft77/ /,,,7,,,,,,,,_ft,,.,_ft//////
ftftft ,0 - ft ,0
/ 7 / //ft/ ft///7Yft,,, ft0ftft_ 0/oX L._
IiIvr __
ctos*cor vCcro*S wtm *5
tfftftDtt1t1 ft??f?TTTTTr1 4 /1
tttft?tt?? I??? If I It? Itt ft ttftftlf?1?f?? ff??tt?tttt It?????? I??? It ff111 it/It t 1111????? tf I1IIH ft /1,/Il ,.,?/III?I1??ttltftI ti/ti / /117111 1117 717,111 77/ /7/771/77
tilt ft7L
UN0C4r VCC100S MOtIM 65 0.50 HIS
LL 6.00
—-------- --— -
------_,-ft - p _._._.._..____t._..s__.....a......_......._._..._.___.t._.__._c_.t -
C/) 0 C
C) m (I)
CD cD CL
CD
r 3 CD CL
-t Co Co

31
(c) 24 hours
4€0P TI0 ESTELT CRL
0 o, 13.00
&1 Austrliulfld Prospect
1•
heveflard to Bessieres Is.3:::j
T
(d) 48 hours
SOURCE: Steedman Limited 1986.
IFigure
West Australian MAXIMUM RADIAL EXTENT OF AN OIL RELEASE I
Petroleum I FROM EACH SALADIN LOCATION DUE TO 8 ' Pty. Limited I NEAP TIDES AND STRONG EASTERLY GALES
J217 R345

(c) 24 hours
PRIMG HOE EASTERLf CR1.0
0 , ILOO
Australind prospect 47
N Thev:nardIS.
(d) 48 hours
SOURCE: Steedman Limited 1986. Figure
MAXIMUM RADIAL EXTENT OF AN OIL RELEASE
West Australian I FROM EACH SALADIN LOCATION DUE TO
Pty. Umited i SPRING TIDES AND STRONG EASTERLY GALES 9 Petroleum I
32
J217 R345

(C) 24 hours
,irep nor ouui 'C5ERLtS
I__ o ILOO
Australind Prospect
Thev:nardIs.
(d) 48 hours
SOURCE: Steedman Limited 1986.
Figure
West Australian
I MAXIMUM.RADIAL EXTENT OF AN OIL RELEASE
Petroleum I FROM EACH SALADIN LOCATION DUE TO ' Pty. Limited I NEAP TIDES AND SOUTH—WESTERLY WINDS I 10
33
J217 R345

I
34
24 hours
SPOUIO T10( - S0UTHl0STtRLI(S
0 13.00
Australind Prospect
\ \ I
\ Thevenard Is.
\ U Bessieres Is. t/
11
48 hours
SOURCE: Steedman Limited 1986.
Figure
MAXIMUM RADIAL EXTENT OF AN OIL RELEASE
Petroleum West Australian FROM EACH SALADIN LOCATION DUE TO Pty. Umited SPRING TIDES AND SOUTH—WESTERLY WINDS
.J217 R345

24 hours
48 hours
SOURCE: Steedman Limited 1986.
35
Figure
West Australian MAXIMUM RADIAL EXTENT OF AN OIL RELEASE
Petroleum FROM EACH SALADIN LOCATION DUE TO Pty. Limited NEAP TIDES AND NORTH—EASTERLY WINDS 12
J217 R345

36
J217 R345

TIDES SPRING
) WINOS NORTHERLIES RELEASE POINT : ROLLER NORTH
Rl OIL StILL ENYCLOPO 05 00005 SIt. SPILL CHYCLOPI 12 HOURS
C. 3 >
LtJ 0 pj 6.00
LLJ 0 p 1.00
-S Theveflard Is.
CD 0 0 BesSiereS IS. CL LIghtfooI' WeId
Has In gs Serrurier Is.
0 C ao sleres 0paroo 10W
Thringa
a
Pt
Z Prospect Locations
m00 Co moc o(I)I.J
OIL SPILL ENYCLOPS 20 HOURS - I c; 0
!j all. SPILL CHYCLOPE tO HOURS H
1 I(,):0rn 1hKm -.00 oL;J.00
S
fllQ)
0
ZDm.
a
0
a a

ul
rD I m
Prospect Locations
m_ 0co Cm PA
JCm imomm
z i-
o > >° rn
mm
mmO co m
Sit. SflLL ENYCLOPS SN NOUNS N
0 tN 6.00
0
0 oU 0
Co A.
Cn
Cl) TIDES SPRING 0 c WINOS NORTH ERSTEALIES
RELEASE POINT ROLLER NORTH
ED Cl,
CD
CL
3
F—
CD a zo OMF
ED 00 0)
—I -- cI)
oIr rn -1(i)
mm
o -go
Oil. srlLt. FNYCLOPC 05 NOUNS - N
0 6.00
H 0
LIghttoot 'Weid
Thringa t1 Hastings
0 0
Bessieres
OIL SPILL CNV(LOPF IS NOUNS N
0 65 6.00
Theveflard Is.
0 Bessieres Is.
Serrurier Is.
0
0 0
13
Onslow
()

OIL. SPILL (NYCLOPO 12 60060
KH
- -- LL
0.00
r- -. Prospect Loc8tOflS
!:poci, zC_n
00 Co Cm
/ I> OCOmCO >O m -iC) I-z -
mm
0 0 mmO COrn
I
- C
CD
®
C" TIDES : SPRING 0 c WINDS SOUTH WESIERLIES
RELEASE POINT ROLLER NORTH 0
C,)
a
Cx
CD a.
c2 00r
Co
P C -LC,)
m1 O'
.-1m m IC°>Z mZ<
mm I-
Oil. 5P111 ENYELO?E 06 HOUCIS H
CII 6.00
0 Weld Llghttoot
Thrunga aHastlngs
Paroo
- -
0
(.)

prospect Locations
CC -.
rU 0 m C)ZI
0— D > Z(J) --. mm m
0 CO 10
Ti
(0
CD
® CD TIDES SPRING 0 WINDS : WESTERLIES
RELERSE POINT : ROLLER NORTH
0)
CL —.c
Ca C
CD 0.
0 -I Co 00
9F Cn
-'-r>Z rn<z<
am
f_ - ._n '
OIL SPILL ENVELOPe 08 HOUOS N
0 KH 6.00
0
Llghtfoot eld
Thringa a Hastings
-
0PCurlew
OIL SPILL (IIYCLOPO 12 MOONS H
0 ON 1.00
Thevenard Is. EJ
OBessleres Is.
Serrurier IS.
Onslow

West Australian Petroleum Pty Limited
Permit Area TPI3 Part 1
Five Year Exploration Drilling Programme
Consultative Environmental Review
APPENDIX 4
REAL TIME TRACKING RESULTS
LEC Ref: J217/R345

1
REAL TIME TRACKING RESULTS
LIST OF FIGURES
1 Tanker mooring drogue and mat tracking 15. September 1989 1
2 Saladin A mat tracking 20 September 1989 2
3 Saladin A mat tracking 27 May 1990 3
4 Saladin B drogue and mat tracking 16 September 1989 4
5 Saladin B drogue and mat tracking 18 September 1989 5
6 Saladin B mat tracking 28 May 1989 6
7 Saladin B mat tracking 29 May 1989 7
8 Saladin-B mat tracking 31 May 1989 8
9 Saladin C mat tracking 19 September 1989 9
10 Saladin C mat tacking 26May 1990 10
11 Saladin C mat tracking 30 May 1990 11
12 Drogue tracking February 1989 12
13 Yammaderry drogue tracking 10 February 1991 13
14 Yammaderry drogue tracking 14 February 1991 14
15 Cowle drogue tracking 28 October 1990 15
16 Cowle drogue tracking 29 October 1990 16
17 Roller-i drogue and mat tracking 28 November 1989 17
18 Roller-i drogue and mat tracking 29 November 1989 18
19 Roller-i mat tracking 30 November 1989 19
20 Roller-i drogue and mat tracking 7 December 1989 20
21 Roller-i mat tracking 8 December 1989 21
22 Roller-i mat tracking 9 December 1989 22

4
I
336. .• im
247 .-_,
9-.s 437 . I Y1624
1521
135
,jrapef
c:TIiI. Ree
Direction lslsd
Australind (') Shoal
Ashburtofl Island
TIDE
I TIME I HEIGHT I RANGE I 104231 0.3
1.6 111091 1.9
1.8 11656 0.1
0 10 20 30 knots I I I I I I
WIND SPEED
0 5km Al PERMIT AREA TPI3 Part 1 Figure
j West Australian TANKER MOORING Petroleum I PLy. Limited DROGUE AND MAT TRACKING
15 September 1989
J217 R345 A4 4/91
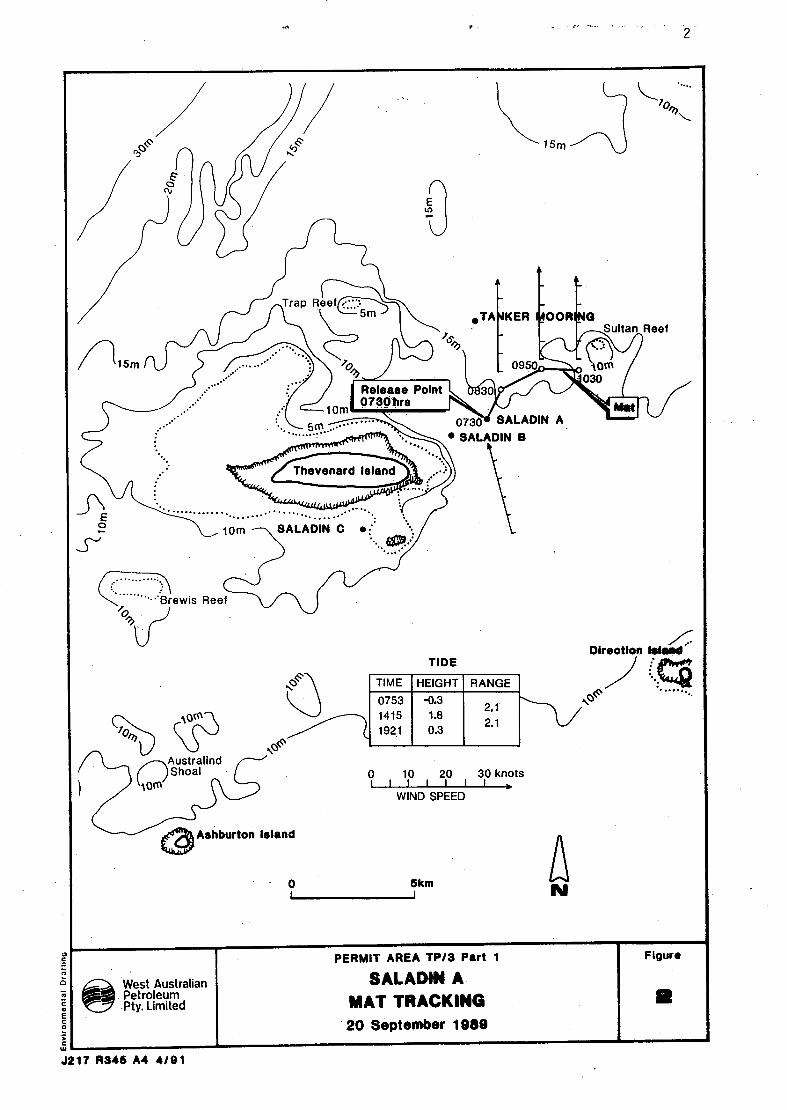
-- - - --,-- -- 2
/ K15m
NeeT(.: )
/ Releace Point 0730hre
..... .....
Thevenard I8iand
.. .................... 2 1 om _\SALADIN C • (J1
Brewis Reef '\fJ
TIDE
OTANIKER
09
073 SALADIN A SALADIN B
Reef
me
Direction $st.ed
cH ,.—Australind
(Shoal
Aehburton island
I TIME I HEIGHT I RANGE I I 07531 -0.3 I I
2.1 I I 1415 I 1.8 I I 2.1 19211 0.3
I
0 10 20 30 knots I I I II
WIND SPEED
0 5km Rk
West Australian Petroleum -Pty. Limited
PERMIT AREA TP/3 Part 1
SALADIN A MAT TRACKING
Figure
R 20 September 1980
J217 R345 A4 4/91

MAT TRACK
I TIME HEIGHT! RANGE I
00531 1.9 I 0539 I 0.5 11243 2.4 I
2.5 1 1918 I -0.1
0 10 20 30 knots
I LLL I WIND SPEED
I (),
\TrI)F1(of TANKER MOORING
Sultan Reef
) IRELEASE POINT
lOm -4
'-.-. 0730hrs SALAOIN—A
rs AL
3
/
J /
1]Um (
) 1730hrs
Brewis RO I::' /
rlo_ -i0m
7 )
(\\)
Zparoo Shoal Australind
(..Miles Shoal -
\_1530hrs 7
Ashb ur ton Island
s-- Ward Reef
Beadon Point
0 5km
Roller Shoal
Entrance Point
PERMIT AREA TP13 Part 1
West Australian SALADIN A 1 Petroleum Pty. Limited MAT TRACKING
27 May 1990
Figure
3
J217 R345 A4 4/91

I TIME I HEIGHT I RANGE I 05051 0.0 I
2.0 I I 11151 I 2.0 2.0
1723 0.0
0 10 20 30 knots 1111111
WIND SPEED
/
10
15m
:
CV
/ Mat / Trap ReefT
/5m 1615 \ TANKER MOORING
Drogue 645 515 Sultan Reef 615
1415 10 15
cii :enjfld
1015
0815tl5
015
2 1 om ALADIN C •
Brewis Reef
`2v
Direction Island TIDE
4
lo'-,7
A00--\
1~611)
A
L
S AOM
susland
0 5km
PERMIT AREA TP/3 Part 1
o West Australian SALADIN B Petroleum I Pty.Limited DROGUE AND MAT TRACKING
16 September 1989
Figure
J217 R345 A4 4/91

/ 5
Mat
Drogue
51625
I -
Trap Ree.fl
635
15m "0
lam
WE
SALA
Thevenard Island
.. .... ......
iom —SALADlN
Reef
I..';.Iii rewjs Reef
TIDE
I TIME I HEIGHT RANGE I 06281 -0.3 I I
2.3 I I 113051 2.0 1.9 1822 0.1
Direction Island
4311
A
L-04,4~~
S
Island
0 10 20 30 knots I I I I
WIND SPEED
0 5km
PERMIT AREA TP/3 Part 1 i Figure
0j West Australian I SALADIN B I Petroleum I Pty. Limited DROGUE AND MAT TRACKING I 5
18 September 1989 I J217 R345 A4 4/91

Brewis Ree'iITi
çlOm -.
TANKER MOORING \Trap Reef
Sultan Reef
-
MAT TRACK l700hr
163 hrs
1530hrs">"
RELEASE POINT 1430hrs O730hrs SALADIN— A
... .. ...0730 830hr 13?Ohrs\.
1230 hrs rs
SALAD$N—C 0 / .0730hrs
\ ,030hrs
QB3Ohrs 093 Ohrs
a r ~co S h o a.1
:: Miles Shoal
TIDE I TIME IHEIGHTI RANGE I 101341 1.9 I I
1.3 I 106341 0.6 I 1.7 I 113301 2.3 12001 0.0
0 10 20 30knots I II I I I
WIND SPEED
~j 1~.10 M
Australind (ShoaI
,01 Ashburton Island
0Ward Reef
Beadon Point
0 5km
Roller Shoal
Entrance Point
xZZ-11- .. - -. - - ~- - - -
PEPMIT AREA TPI3 Part 1 Figur.
West Australian. SALADIN B Petroleum Pty. Umited MAT TRACKING 6
28 May 1990
J217 R345 A4 4/91

10m - \.1715
Trap Reef
RELEASE POINT O8l5hrs
9 .... ....... SALADIN-C
croShoa.ft
: Miles Shoal
(ci1 TIB r e w i s Ree" 3
)Orh / I Australind
(Shoal
MAi TRACK
rs/
irs KER MOORING
Sultan Reef
/14156rS15 / l3l5hrs 1215hrs
11 l5hrs' O9l5hrs SOl5hbis A
1 08?5hrs B \8ALADIN- \
TIDE I TIME 'HEIGHT RANGE 102171 1.8 I 1.2 10743 I 0.6 I 1.5 11416 I 2.1 I 1.9 2044 0.2
0 10 20 30knots II I I I
WIND SPEED
7
J Ahburton Island
N
0 5km
Roller Shoal
Entrance Point
Ward Reef
Beadon Point
NSLOW
PERMIT AREA TP/3 Part 1 Figure
j
West Australian SALADIN B Petroleum Pty. Limited MAT TRACKING 7
S C 29 May iaeo
J211 R345 A4 4/91

Br
ENLARGEMENT
I TIME IHEIGHTI RANGE
1 0349 1.7 0.9 10950 0.8 0.9 115531 1.7 1.2 12208 05
TANKER MOORING
Sultan Reef
on'
SALADIN-A
LADIN-B
R,
0 5km O9l5hrs
1015hrs
r\-fl 131:h:: 1215hrs 1115hrs
SALADINB (J'1
LMIATTRACK IRELEASE POINT Ward Reef 0815hrs
Beadon Point 0 10 20 knots
WIND SPEED ONSLOW,'
Thevenard IsIand) 500 m
Entrance Point
PERMIT AREA TP/3 Part 1 Figwe
West Australian SALADIN B Petroleum MAT TRACKING B
31 May 1990
J217 R345 A4 4/91

/
5m
10m----.. 1630
K15m
Brewis Reef
V
evenardIsland °
11 030
7*' Release Point 1
I lO3Ohrs Mat 1
TANKER MOORING Sultan Reef
SALAD SALADIN B
Point 1 1430 hrs Mat 2
\1430 lOrn - SPILPtLUN C . / . 1230 -
Direction Island / 1
10
Australind Shoal
urtonIs land
TIDE
I TIME I HEIGHT RANGE I 0711 -0.4 113391
2.3 1.9 I
1.8 1853 0.1
0 10 20 30 knots III I
WIND SPEED
0 5km lik
0j West Australian Petroleum Ply. Limited
PERMIT AREA TP/3 Part 1
SALADIN C MAT TRACKING 19 September 1989
Figure
9
J217 R345 A4 4/91

\-" enAehburton Island
A N
o 5km
Roller Shoal
Entrance Point
A zee - - - ~--- I t Z~' --
PERMIT AREA TPI3 Part 1
SALADIN C MAT TRACKING
26 May 19$0
J217 R345 A4 4/91
C
West Australian Petroleum Pty. Limited
C 0
C
Ward Reef
Beadon Point
NSLOW, / ..............
FIgure
ID
I
10
OUM IN U
Sultan Reef
' 0"
i-A
Br
o y
OAustralind Shoal
-10
(
jorn
/aroShoaJk2
Miles Shoal
I TIME IHEIGHTI RANGE I I 0011 I 1.8 1.3 104531 0.5 I 1.9 111561 2.4
2.6 11833 -0.2
0 10 20 30knots I I I I I I I
WIND SPEED

9
/Ij
I
Br
TIDE
TIME IHEIGHT RANGE
I 0302 I 1.7 I 1.0 108491 0.7 I 1.2 I 1503 I 1.9 I 1.6 2126 0.3
ENLARGEMENT : 1
45hrs
345 his
0945hrsA 445h rs
1545hrs
l64r
SAtADIN-C WIND SPEED
5OOm
Entrance Point
PERMIT AREA TPI3 Part 1
j
West Australian
SALADIN C Petroleum Pty. Limited MAT TRACKING
30 May 1990
11
TANKER MOORING
Sultan Reef
SALADIN- A
ALADIN- B
0 5km I I
11: I
0 (I I
,,.. /
-" Ward Reef
Beadon PoInt z Figure
11
J217 R345 A4 4/91

I -
ENCE
b.- Drogue track
(\N:\
1\ PP
S
/952
ond
+ Pp14
12
A
0 500m
J217 R345 A4 4/91

Brewis Reef' iII
13
10M
ap Reef
lOm
TANKER MOORING
Sultan Reef
om
SALAD1N A
LADIN B
J)
745hrs
/ 15
1 YAMMADERR ll45hrs
11 5hrs
rs/1445hrs 1615hrs 1 \ I
164 hrs
+
1 4lShrs r ks Shoal
COW LE
SALADIN C•
RELEASE POINT iiinre
5hrs 171
()S-Iorn Gorgon Patch
O iom
Australind sho
Paroo Shoa
Miles Shoal
Aahburton Island
TIDE
Al 0 5km
a
West Australian Petroleum Pty. Limited
0
I TIME HEIGHT I RANGE I I 0222 I 1.2 l 0.3 I 11035 I 1.5 I 0.0 I 11221 I 1.5 I 0.5 11938 2.0
j
0 10 20 30 I Ill I I
WIND SPEED
PERMIT AREA TPI3 Part 1
YAMMADERRY DROGUE TRACKING
10 February 1991
Ward Reef
Beadon Point
/ Figure
13
Roller Shoal
Entrance Point
J217 R345 A4 4/91

14
'S.
rap Re
lom- e
"fl •TANKER MOORING Sultan Reef
lOm
SALADIN A
, SALADIN B
\J 1530hrs
lOm. SALADIN C 1500hss -i l200hrs
RELEASE POiNT J , — 1 430hrs
O800hrs 0900hrs 1 hrs '14OOhrs,. YAMMADERRY 1330hrs
Brewis Ree"i.I:.T"\ O800hrs 09Ohrs / \ •
1300hrs
o, Ohrs 7'1030hrs \ 1230hrs
llOOhrs\ ' Weeks Shoal
_/"'P <ro Australind
Ashburton Island
TIDE I2Ward Reef
0 10 20 30 I I I I I I I
Roller Shoal WIND SPEED
Entrance PoInt
PERMIT AREA TP/S Part 1
West Australian YAMMADERRY Petroleum • DROGUE TRACKING
14 February 1991 C
I TIME 'HEIGHT RANGE I
0 5km
I 0517 I 0.7 1.5 I I 143 I 2.2 I I 1700 I 1.1 1.1 2329 2.5 1.4
B.adon Point
Z Figure
14
J217 R345 A4 4/91

0 5km
15
10m
apRee' \ .TANKER MOORING Sultan Reef
jorn
lOm
1455hr/
Brewis Reef ...............\o955hrs 122
R125hrs 1425hrs
1255h
...........:
1355hrs YAMMA
£ 1O
-
1 0925hrs
55hrs //
Weeks
0825hrs
PLEAS
E
yO855hrs
Shod
COWLE rs
Ahburton Island
0 10 20 30 I I I
Roller Shoal WIND SPEED
Entrance Point
PERMIT AREA TPIS Part I
West Australian COWLE Petroleum DROGUE TRACKING
28 October 1990
TIME IHEIGHTI RANGE I 0319 I 1.7 I 0.7
11032 I 1.0 I 0.5 1 1716 I 1.5 I 2312 1.3 0.2
Gorgon Patch
5? IS!
TIDE Ward Reef
Beadon Point
/NS
Figure
15
J211 R346 A4 4/91

Entrance Point
- -. 16
I Orn
neef .TANKER MOORING ap Sultan Reef
N Aom
lOm
o!!dIId:
SALADIN C• 7
RV4rs LIrs 4
SALADIN A
LADIN B
545hrs -l5l5hrs
-1445hrs
1...... Brewis Reef
1 345 hrs
09 15 0945hrs
l3l5hrs Weeks Shoal
/COWLE 40845hrs
I
RELEASE 0845hrs
cT"o ,o'\ iom
O iom
\\5\) Gorgon Patch Paroo Shoal.
Australind (C: Miles Shoal
A8hburton Island
0 5km
Roller Shoal
West Australian Petroleum Pty. Umited
TIDE
TIME IHEIGHTI RANGE I
10506 I 1.5 I I 0.5 I
I I 1211 I 1.0
19131 16 0.6
I
0 10 20 30 I I I I I I,._ WIND SPEED
PERMIT AREA TP/3 Part 1
COWLE DROGUE TRACKING
29 October 1990
,Ward Reef
Budon Point
/7 Figure
16
J217 R346 A4 4/91

S2Ohrs
5 -
--J Beadon Poinf..\
ONSLOW
1
150 OOE
aland )?
'0,1) / torn ( Sm
U
Brewis
l
TIDE
I TIME I lIEIGIIT RANGE I 0506 I 0.0 I I 1132 I 1.6 I 1.6
1621 0.7 0 9 .
:. Besaleres Island
0 Bowers Ledge
\ r_ - Direction laland
oal
0
Australind ParooSli
Saladin Shoal Shoal
IOM Oe Tortoise
t27 13236rs,l4l6hrs
Ashburton Island
1546 hrs 11
bm 24 hrs
Gtertnie Patches 1430
) (7 JO2Ohr
intLf / l8hrs
hoals 511'
L) Roller Shoal
Entrance Point
N
a 0 5km
J217 R345 A4 4/91

-23O
1652 0.7
Bessleres Island
('
501
Bowers LedEe
Direction Island
Australind o5hoa1 0 C Shoal Shoal
or iseIeland
_,shburton Island
at ....
Glennie Palches<() 1324hrs, 1525hrs 1428hrs1 lGlOhrs .,
C lOm
TIME Ii IEIGI-IT RANGE I 0537 I -.i I I 1201 1.7 1.8
I 1.0
TIDE
1l5 '00E
nardIaIand
5/t (,
ACM
1Om
/ 223hrs
(•__/ / 0924h 1505hrs
hrs 003Ohrs 1347 hrS
/ 227hrs
1027hrs 127hrs
Drogue hoals
RollEr Shoal
Fa C 0 E C 0
C Si
0 5km ........... .......... ............ ................ F
J217 R345 A4 4/91

ho a Is
1Om
0 5km a B C C
C U J217 R345 A4 4/91
) (7 1226hrs L6f1009hrs
/ 15213hrs
25hrs
1 326hrS
Roller Shoal
straIian
..... s .... .7.7 ..............
T)
-? ci Om
115 OOE
Thevenardlsland
Sm
1Dm
Brewis Reel 1.0
(tTh ;,ctIon ad
)
Paroo Shoal Australind
AOM
1723 J
0.7
TIME I HEIGHT I RANGE I 0608 -0.1 I 1232 I 1.7 I 1.8 I
TIDE
2l0 30S
- Bessieres Island
rn
GBowers Ledge
(7

Ku1j __
Glennie Patches Mat
Sm -
(7 s
Drogue
Shoals RoItarShoat
- tlS 'OO'E
1 Oni -- ------ -----___ -- Sm
U 7 1 Urn __________________
Brewis Reel
ENCE
:::kiflg 7 Dec 1989
- - NeaR tides Direction Island High tide 17 10hrz
- \ LOW tide : 1018hrs m
WIND SPEED \O' 0 102030km
I I-
I ~v
Australind
Agra Tongue
torn
5ki
1710 1.6 1.1
1
TIDE
- 230
Beasle roe Island
Bowers Ledge
TIME I FIEIGI-IT RANGE I 0421 1.4 I 1018j 0.5 I 0.9 I
J217 R345 A4 4191

115OO'E
Thevenard
n 1o 1 1 Om 5m
2o:sJ Om
Bessleres Island
j
rn
(Bowers Led6e
10m
Dection Iand
/
U
IIIII7 Auslralind Paroo Shoal
Shoal
torn Shoal
ON 3
Mat
Glennie Patches
Beadon /
lam Entrance Point
5km / WestAuraIIan
U
TIME HEIGHT IIANGE
0532 1.2 0.6
1112 0.6 1806 1.7
1.1
TIDE
17 R345 A4 4/91

-
'Ol4lhrs Release Int ,
hoala Roller Shoal
rT.TT1
-21 30S
iBm
(Brewis Reef
/
Beasbares Island
5mS
sm Bowers Ledge
10w
Dlrec lion Island
5rn
ParoAustrafind
oShOal
SEod hoat
lom
ortoIaeIsIafld
rton Island Ashbu
Mat
Glenn
S
in patches 1237hrs
r ) ,Sm --" 1339
1 lO38hrs
I TIME HEIGIIT.l RANGE
I 0706 1.2 I I 1222 I 0.7
0.5
19061 1.8 1.1
TIDE
Ce o 5km
J217 R345 A4 4/91

West Australian Petroleum Pty Limited
Permit Area TP/3 Part 1
Five Year Exploration Drilling Programme
Consultative Environmental Review
APPENDIX 5
LITERATURE REVIEW ON TOXICITY
OF MEDIUM WEIGHT CRUDE TO
TROPICAL MARINE ENVIRONMENTS
LEC Ref: J217/R345

1
LITERATURE REVIEW ON TOXICITY
OF MEDIUM WEIGHT CRUDE TO
TROPICAL MARINE ENVIRONMENTS
Table of Contents
1 INTRODUCTION 1
2 PRAWN FISHERIES 2
2.1 Introduction 2 2.2 Toxicity Studies 2
2.2.1 Oil and Prawns 2 2.2.2 Dispersed Oil and Prawns 3 2.2.3 Fisheries Impact 4 2.2.4 Tainting of Prawns 4
2.3 Conclusion 5
3 MANGROVES 7
3.1 Oil and Mangroves 7 3.2 Dispersants 9 3.3 Restoration of Mangroves 10 3.4 Conclusions 11
4 CORALS 12
5 SEAGRASSES 13
6 IMPLICATIONS FOR MANAGEMENT OF SPILLS OF 14 MEDIUM WEIGHT OILS
7 REFERENCES 15

1
LITERATURE REVIEW ON TOXICITY
OF MEDIUM WEIGHT CRUDE TO
TROPICAL MARINE ENVIRONMENTS
1 INTRODUCTION
A comprehensive literature review of the impacts of oil on tropical marine environments was conducted for the Saladin Oilfield Environmental Review and Management Programme (ERMP) (1987). This review was subsequently used as a basis for the assessment of the potential impacts of oil spills on marine resources in the vicinity of the Roller prospect during the preparation of the Roller Notice of Intent (NOI) (LSC, 1989). The assessment was conducted assuming that a very light oil, which is characteristic of the North West Shelf, would be found. The discovery of oil at the Roller prospect showed that the crude was in fact a medium weight oil (API 29°). Based on its gravity the oil more closely resembles Prudhoe Bay, Nigerian and Tijuana crude oils than typical North West Shelf oils.
Initial characterisation of the Roller crude oil suggests that it is composed primarily of hydrocarbon compounds between C7 (heptanes) and C19 (nonadecanes). The remaining 30% (by volume) comprises the C (eicosanes plus) fraction that includes the higher molecular weight cyclic and aromatic compounds. The oil is highly biodegraded so its chromatographic trace is characterised by an unidentified complex mixture (UCM), a lack of normal alkanes and a suite of branched and cyclic hydrocarbons. The oil is therefore heavier than an equivalent oil that has not been biodegraded within the reservoir.
Since Roller oil is heavier than had previously been anticipated it was considered necessary to re-assess the potential impacts of the oil on local marine resources, and particularly those having high ecological and commercial value. This review is therefore concerned primarily with the impacts of whole and dispersed medium weight crude oil on mangroves and prawns. A brief review of recent (1987-1990) literature has also been conducted to bring the 1987 Saladin ERMP literature review up to date. This information is included at the end of this review and covers the potential impacts of light and medium weight crude oils on corals and seagrasses.

2
2 PRAWN FISHERIES
2.1 INTRODUCTION
The potential impacts of an oil spill on a commercial fishery may include:
lossof access to trawling areas;
hazard to navigation;
debris fouling trawl nets; and
pollution of prawns and gear.
in the event of an oil spill in the vicinity of a commercial trawling ground two major areas of concern have been identified: the toxic impact of the oil on the various life stages of the fishery; and the perception of the consumer with regards to tainting.
2.2 TOXICITY STUDIES
2.2.1 Oil and Prawns
Studies into the physiological response of marine and estuarine organisms to oil commenced in the early 1970s (Anderson et al., 1974a; Anderson et al., 1974b; Anderson, 1975; Neff & Anderson, 1981; Anderson et al., 1983; Anderson et al., 1987). The research has indicated that the tolerance of an life stages of both estuarine and oceanic shrimps and prawns to the water soluble fraction of a medium weight crude oil were variable (Neff & Anderson, 1981). For example, laboratory experiments on the effects of whole oil and water soluble fractions of oil on prawns have indicated that the potential impacts range from none observable to lethargy and death. Furthermore the individual classes of organic hydrocarbons within oil exhibit different degrees of toxicity based on their solubility. The low molecular weight polycyclic aromatic hydrocarbons (PAH) can be toxic at approximately 1 ppm, while PAH of four rings and greater have not been found to be toxic at all. In addition, alkylated PAH, while less soluble than parental PAH, are also more toxic than parental PAH.
More recently Anderson et al. (1987) have identified and isolated the specific compounds in crude oils that cause toxic responses in a species of penaeid shrimp. Their evidence suggests that toxicity decreases with decreasing total aromatics (benzene, alkylbenzene and naphthalenes). Naphthalenes caused significant mortality at the lowest concentration. Benzenes are also toxic, however their comparatively low solubility in water reduces the bio-availability of these compounds. Benzenes are also highly volatile and disappear from solution and

3
sediments rapidly. Similar tests performed on fish were substantially different to shrimps, with the former being more tolerant than prawns to dispersed oil, particularly the water-soluble fractions. The authors concluded that the effects of water-soluble fractions of the oil were not likely to be significant unless the oil becomes trapped. They noted, however, that latent mortality was evident in tests following cessation of oil exposure. Thus the implications of the findings of Anderson et al. (1987) should be treated cautiously.
Concern has also been expressed over the possibility of toxic hydrocarbons being bio-accumulated within the food chain. The results of early research suggests however that this does not occur since shrimps contain detoxifying enzymes that allow them to metabolise and flush aromatic hydrocarbons from their system (Neff et at., 1976). It is therefore apparent that the degree of toxicity of an oil will depend on its molecular composition and in general, medium weight crude oils have a lower percentage of low molecular weight PAH relative to lighter, more toxic oils.
As with light, medium and heavy weight oils which exhibit variability in the degree of toxicity, similar variability is seen between fresh verstis weathered oils. Evaporation removes the more volatile low molecular weight toxic components, so a weathered oil is aPvays less toxic than a fresh oil. This concept has been supported by the results of a study on the water soluble fraction of a medium weight oil, which showed that while fresh oil was toxic to test shrimp and caused an immediate and irreversible effect on feeding, the weathered fraction was less toxic and produced delayed and reversible effects on feeding (Lee, Winters & Nicol, 1978).
Recently Kasymov and Gasanov (1987) demonstrated that under static laboratory conditions, oil concentrations of 5 mg/L caused sublethal toxic responses in test shrimp while concentrations of 10-25 mgfL caused mortality of the organism. The study also concluded that larvae were more sensitive than adult life stages. Toxicity testing was also conducted following the Ixtoc blowout in the Gulf of Mexico during 1979 and 1980 (Lee, Morris & Boatwright, 1980; Bedinger & Nulton, 1982; Jernelov & Linden, 1981). Larvae and adults of commercial shrimps from spawning grounds in the vicinity of the Ixtoc blowout were found to have an acutely toxic response to 0.1-10 ppm of total oil, while weathered Ixtoc oil did not induce any acute toxicity in these crustaceans.
2.2.2 Dispersed Oil and Prawns
While dispersants will bring a greater proportion of the water column (and thus a greater number of marine organisms not normally affected) into contact with spilled oil, the dispersants also enhance the volatilisation of the lighter more toxic aromatics. Laboratory studies on the impacts of dispersed oil on prawn life stages are scarce. However a recent study involving a chemically dispersed light crude indicates that toxic responses occur rapidly within the first six hours of a spill, but that shrimps surviving the first 6-12 hours of exposure had a high chance of

4
recovery and survived the rest of the test period (Shuba & Heikamp, 1989).
2.2.3 Fisheries Impact
Compared with laboratory studies which do not always accurately reflect those observed in the field, it is widely recognised that the results of studies following real oil spills are generally a better indicator of the true impacts of oil spills. The majority of these studies suggest that no observable impacts on prawn fisheries have been caused by oil spills (Hester, 1977, and references therein; Blackman & Law, 1980; Boehm & Fiest, 1983; Molter et al., 1989). None of the reviewed literature could conclude that a definitive impact on a commercial prawn fishery had occurred as a direct result of oil spills. Most authors found that it was extremely difficult to separate the effects of an oil spill from seasonal variations in catch statistics. Molter et al. (1989), while investigating the impacts of oil spills on commercial fishery operations, suggested that free swimming shrimps are rarely affected by oil spills. Moreover they could find no evidence of cases involving proven damage to commercial stocks of free swimming species.
Finally, the Ixtoc blowout of 1979-1980 resulted in a massive intrusion of petroleum hydrocarbons into the waters of the Gulf of Mexico. Approximately half a million tonnes were released into the marine environment which included known prawn trawling grounds. A study by Boehm & Fiest (1983) concluded that:
"no definitive offshore damage could be associated with the Ixtoc, or other known spills (such as the Burmah Agate) on the epibenthic commercial shrimp population."
2.2.4 Tainting of Prawns
While there are no significant correlations between oil spills and fluctuations in commercial fishery catch statistics, shrimps caught in the vicinity of an oil slick immediately following a spill may contain measurable concentrations of petroleum hydrocarbons (Teal & Howarth, 1984). While it is difficult to identify and quantify the chronic and acute impacts of oil spills on crustaceans, it becomes almost impossible to characterise the tainting impacts of oil on commercial seafoods since tainting cannot be easily measured, and is based on subjective rather than objective assessments. Consumer fears of tainted seafood following a spill may cause a greater economic impact on a fishery than the actual oil spill. Care must also be exercised in assessing sources for contamination, since natural sources for petrogenic hydrocarbons do exist (Blumer, Guillard & Chase, 1971; Youngblood & Blumer, 1973; Giam et al., 1976).
The Commonwealth Scientific and Industrial Research Organisation (CSIRO) Food Research Laboratory has identified the five most commonly encountered types of off-flavours. Related studies indicate that the most likely origins of the offending taint-causing compounds may include microbial spoilage, diet and environmental

5
pollution (Whitfield & Freeman, 1983). In the event of petroleum hydrocarbon contamination the compounds that have been identified as being responsible for off-flavours include aromatic hydrocarbons, particularly alkylbenzenes and alkylthiophenes (Kagi et al., 1982; Whitfield, 1988).
Whitfield et al. (1987) has also found that off-flavours characteristic of Exmouth Gulf Endeavour prawns are caused by the algae and bryozoa diet of the prawns and thus in this case tainting of the prawns is a natural event.
Of the few studies investigating organoleptic characteristics of marine organisms, only one (McGill et al., 1987) reported a concentration range of petroleum hydrocarbons in tainted fish (0.14-4.6 ppm). This study found that the maximum concentration of petroleum hydrocarbons in taint free samples was 0.30 ppm, a finding implying that, while a sample may be contaminated by petroleum hydrocarbons, it must contain the specific compounds that cause off-flavours for the sample to become tainted.
A laboratory study by Knieper and Culley in 1975 is the only one from the available literature in which the taste threshold for oil in shrimp was assessed. The study found that 90 ppm oil in water was the minimum concentration required to cause taste tainting in shrimps. Due to the difficulties in identifying and quantifying tainting in seafoods this type of data is rarely reported following oil spills. One such study was however conducted following the Eleni V spill off the English coast in 1978. The results indicated that the commercial shrimp samples were free of off-flavours (Blackman & Law, 1980).
2.3 CONCLUSIONS
The following general conclusions can be drawn from this review of the potential impacts of oil on penaeid prawns:
Generally there has been little or no observable physical impact on commercial fisheries following oil spills.
Natural fluctuations in fisheries catch statistics may mask any effect caused by an oil spill.
Unweathered medium weight oils containing relatively low concentrations of low molecular weight PAH are less toxic to prawns than unweathered light crude oils which often contain a greater proportion of volatile PAH.
Weathered oils, having lost the more toxic volatile components, are expected to be less toxic to prawns than unweathered crude oils.
While penaeid prawns (shrimps) will take up petroleum hydrocarbons, these compounds are not bio-accumulated or bio-magnified since the animal is capable of metabolising these compounds and flushing them from their

bodies.
Young life stages are generally more sensitive to oil than adult stages.
The pelagic-stages have a lower potential for exposure to oil floating on the sea surface than to dispersed oil (which spreads throughout the water column).
There is a potential for a decline in the marketability of seafood following an oil spill because of the public's perception regarding tainting of the product.
Aromatic hydrocarbons are generally responsible for petroleum-like off-flavours in seafood.
Natural sources are occasionally responsible for tainting of prawns.

7
3 MANGRO YES
3.1 OIL AND MANGRO YES
Mangroves are considered to be an important component of tropical ecosystems as they are:
nursery areas for a wide range of marine species;
a source of organic matter and nutrients; and
shoreline stabilisers.
Until recently mangrove forests have been uniformly assigned the highest sensitivity ranking when compared to other coastal environments. This has been in response to the observed deleterious effects of crude oil on these ecosystems (Baker, 1981).
The deleterious effects may include blackening and curling of the leaves, chiorosis, defoliation, pneumatophore damage and death. There are numerous variations in the response of mangroves to spilled oil and this variability may be caused by factors such as:
zone of impact;
the species of mangrove impacted;
the initial and inherent toxicity of the oil;
the degree of weathering and emulsification that has taken place between spillage and impact;
prevailing weather and seasonal conditions which influence weathering, emulsification and the position, concentration and retention of oil deposited in mangrove areas; and
geomorphology of the mangrove area.
This review concentrates primarily on the impacts of medium weight crude oils, either alone or dispersed (usually with Corexit 9527), on the mangroves Rhizophora and Avicennia.
The following general information is pertinent to this review:
(i) unweathered lighter more aromatic crude oils have a higher biological toxicity than unweathered medium and heavy weight oils (Wardrop et al., 1987);

the high air and water temperatures of subtropical and tropical marine environments promote evaporative weathering of light - medium weight crude oils;
medium weight crude oils will weather moderately rapidly and may leave some residual contamination in water and sediments (Ballou & Lewis, 1989);
very fine sediments in low energy mangrove environments tend to retain hydrocarbons more than coarse sediments in high energy areas (Vandermeulen cited in Jackson et al., 1989);
mangrove biota in protected riverine and channel settings are more affected than those in open coast settings (Jackson et al., 1989).
A comprehensive review of the literature on the impacts of oil spills on mangroves was conducted by Thorhaug (1987). It was concluded that while defoliation of mangroves was a common occurrence, massive mortality was not always the ultimate outcome, suggesting toxicity and not necessarily lethality, of spilt oil. Specific case studies involving spilled oil and mangroves are outlined below.
A spill of approximately 397 kL (2,500 bbl) of oil occurred in the Florida Keys in 1975 (Chan, 1977). A one year survey following the spill indicated that no adverse impact to mature Rhizophora trees occurred where oil partially coated prop roots; while the oiling of less than 50% of Avicennia pneumatophores did not appear to affect the trees. This survey did identify extensive mortality of Rhizophora seedlings following the oiling of their stems and leaves, and in dwarf black Avicennia mangroves with more than 50% oiling of pneumatophores.
Snowden & Ekweozor (1987) studied a spill of medium weight Nigerian crude in a semi-enclosed estuary area which caused defoliation of 500 m2 of mangroves. Within this area no mortality of mature trees was observed, while seedlings were seen to die as a result of the oiling. Defoliated trees had begun to show new leaf growth within five months of the spill.
A 3,815 kL (24,000 bbl) spill of medium weight Tijuana crude oil washed ashore at Cabo Rojo in Puerto Rico resulted in oiling of the prop roots and submerged roots of Rhizophora and Avicennia mangroves (Nadeau & Bergquist, 1977). Mortality was restricted to a 1 ha area of mangroves in the months following the spill. A second survey carried out approximately four years after the spill by Page et 'al. (1979), found that the initial mortality was not ongoing and that re-emergence of young trees was occurring in spite of the fact that some of the sediments were still heavily contaminated by oil. The oiled sediments appeared to be no longer toxic to the mangroves, and chemical analyses showed that the one, two and three ring aromatics had been weathered from the oiled sediments. Furthermore, compared with temperate locations, the rate of biodegradation of the oil within the anoxic mangrove sediments was extremely rapid. The study concluded that the recovery potential from an oil spill for a coastal mangrove

ecosystem can be high.
In synthesising the results of a seven year programme to determine the effects of oil and dispersants on Rhizophora and Avicennia, Getter, Ballou and Koons (1985) found that Rhizophora appeared to be able to exclude oil uptake at the roots while Avicennia was only partially capable of this and thus potentially the more sensitive of the two species to oil.
Mangrove response also varied as a function of which part of the tree was oiled; for example root and leaf oilings were more toxic than oiling of the stems. Field studies were carried out by the same researchers who reported defoliation of mangroves without mortality after being exposed to 50 ppm of medium weight crude oil for 24 hours. The acute impacts, of the oiling were seen within two weeks of the experimental spill, and no further onset of new effects were observed after four months.
In 1986, 7,949 kL (50,000 bbl) of a medium weight crude oil was spilled directly into a sheltered coastal habitat in Panama (Cubit et al., 1987; Jackson et al., 1989). The area affected had been subject to a monitoring programme since a previous oil spill 18 years earlier, and thus detailed baseline information was available for impact assessment purposes. The spill caused extensive mortality in the Rhizophora mangroves immediately after the spill (Keller, 1989); it was thought that sublethal effects on the Rhizophora forests were extensive and that they may be more important in the long-term than the initial mortality (Jackson et al., 1989).
3.2 DISPERSANTS AND MANGROVES
Mangrove substrates are usually composed of fine sediments in low energy areas, so it is generally accepted that mechanical clean-up procedures in those habitats have the potential to render more harm than the oil itself (API, 1985). The alternative has therefore been to treat the oil with chemical dispersants.
Dispersants were first used on a large scale during the Torry Canyon incident in 1967. The extensive ecological damage that resulted from the use of the early dispersant formulations (first generation dispersants) was due to the fact that they were composed primarily of hydrocarbon solvents, containing high concentrations of organic compounds now known to be toxic to marine organisms. These dispersants were applied to the oil undiluted and in large volumes (Brochu et al., 1986/87). The second generation dispersants were water dilutable concentrates which, when diluted, contained lower levels of the toxic hydrocarbons than the first generation types (Franklin & Lloyd, 1986/87). The third generation of dispersants are concentrates that are applied undiluted and, because they are glycol-based, are of a much lower biological toxicity than the two previous types (Franklin & Lloyd, 1986/87).
The dispersant most widely tested and most frequently recommended is Corexit 9527, a third generation concentrate. It has a wide range of applications to various

10
oil types and alone it has a relatively low toxicity to most marine organisms.
Laboratory experiments do not always accurately reflect the behaviour of dispersed oils in the field, so Getter, Ballou and Koons (1985) conducted a 20 month long field experiment with a whole and dispersed medium weight crude oil in Panama. The results of this study clearly indicated that the field application of dispersants to the oil, prior to its exposure to the mangroves, greatly reduced the lethal and sublethal effects on seedlings and adult mangroves. Moreover the application of dispersants greatly reduced the retention of petroleum hydrocarbons in mangrove sediments, reducing uptake by the adult mangroves. Supporting evidence from Ballou et al. (1987) indicated that dispersants had a positive effect reducing or preventing adverse impacts to the mangroves, and that seedling sprouting success and survival rates were much higher at dispersed sites than at undispersed sites.
The results of studies involving the lighter, generally more toxic crudes support the results of studies with medium weight crude oils. Locally, a study of dispersed oil in South Australian Avicennia stands found that the toxicity of the dispersant oil mixture caused high initial toxicity, however this toxicity decreased with time (Wardrop et al., 1987).
A similar study by Teas, Duerr and Wilcock (1987) provided evidence suggesting that there was no significant difference in deaths of mangroves within dispersed oil and control plots.
As an oil spill management tool, dispersant use on oil prior to its entry to a mangrove forest is recommended by the majority of in'stigators involved in mangrove research (Getter, Ballou & Koons, 1985; Ballou et al., 1987; Teas, Duerr & Wilcock, 1987; Ballou et al., 1989; Thorhaug, 1989). Dispersas must not, however, be applied after oil enters the mangroves since it produces the same effect as oil alone in mangroves (Thorhaug et at., 1989).
3.3 RESTORATION OF MANGROVES
While mechanical treatment of oil spilled in mangroves is not recommended, restoration of impacted areas has been attempted with some success.
Experiments with the long-term restoration potential of impacted Florida mangroves have indicated that oiled Rhizophora seeds placed in clean water will germinate. However, the rate may be lower than control seeds (Chan, 1977).
Seedling sprouting success and survival rates are enhanced in sediments subject to dispersed oil in comparison with sediments exposed to oil only (Getter, Ballou & Koons, 1985).
The largest mangrove restoration project in the world has been initiated in Panama following the rupture of a tank containing a medium weight crude oil (Teas, Duerr & Wilcock, 1989). More than 42,000 nursery-grown seedlings and 44,000

11
propagules have been planted to restore oil-killed mangrove forests in the area. The restoration programme was initiated soon after the spill and the results of the initial experimental phase suggests that seedlings were successfully replanted six months following the spill, however growth was more rapid if replanting was delayed nine to 12 months after the spill.
3.4 CONCLUSIONS
The conclusions based on review of literature cited in this review are as follows:
The most common response of mangroves to oiling is defoliation, rather than mortality which occurs much less frequently.
Defoliated trees are capable of regrowth within 6-12 months of a spill occurring.
The low molecular weight aromatics are thought to be responsible for the toxicity of oil to mangroves and the observed defoliation and mortality.
Residues of weathered medium weight crude oil do not appear to be toxic to mangroves.
Oiling of stems does not appear to cause adverse impact on mangroves However oiling of leaves, prop roots and pneumatophores usually results in defoliation of mangroves.
Mangroves exposed to dispersed oil exhibit less lethal and sublethal effects than mangroves impacted by crude oil alone.
Seedling sprouting success and survival rates were much higher at dispersed sites than undispersed sites.
An oil spill that potentially threatens a mangrove forest should be dispersed prior to it impacting the area.
Restoration of mangroves impacted by medium weight crude oil is possible and should not be initiated until approximately one year post spill.
It should be noted, however, that these findings are indicative only of the likely effects under conditions experience on the Western Australian coast, until tests can be performed on mangroves in their natural setting using local crude oils.

12
4 CORALS
Recent information on the effects of crude oil on corals is provided by Ballou et al. (1989); Jackson et al. (1989); LeGore et al. (1989) and Thorhaug et al. (1989).
Intertidal and subtidal reefs were monitored following a spill of medium weight crude oil in Panama. The results indicated that extensive mortality occurred in intertidal and shallow subtidal reefs, however corals growing in waters deeper than 3 m were not affected (Jackson et al., 1989). These results contradict the fmdings of a large number of researchers who have found little or no adverse impact on corals following oil spills (LeGore et al., 1989 and references therein).
Thorhaug et al. (1989) identified a wide variability in response between coral species to various dispersant types and oil. Specifically Acropora sp. were far more sensitive to dispersed oil than the shallow water Diploria sp. Severe long-term impacts on corals were also noted by Ballou et al. (1989) during a field survey on the effects of a dispersed medium weight crude oil on the major tropical habitat types. The authors concluded however that under more realistic conditions, in which floating untreated oil had weathered for several hours and is then dispersed into the water column over a relatively short period of time, it is reasonable to assume that the magnitude of impacts to subtidal environments would not be as severe as that measured during the study. The experimental data for a site exposed to whole, untreated crude oil clearly indicated that the impacts on submerged corals were relatively minor. The report further concluded that the results of this and numerous other studies of oil spills consistently showed that intertidal habitats are exposed to much higher concentrations of oil than subtidal habitats, if no action is taken to prevent the stranding of oil.
Finally, a field study carried out using Arabian light crude (API Gravity between 30° and 48°) indicated that healthy reef corals can tolerate relatively short (one to five days) exposure to floating oil and to dispersed oil with no observable effects. Dispersant-related coral mortality may occur if the corals are exposed to other environmental stresses, such as exceptionally high or low water temperatures or cyclone activity (LeGore et al., 1989).
13
S SEAGRASSES
Experiments and field observations following spills- of medium weight crude oils suggest that seagrasses do not suffer lethal or long-term impacts as a result of crude oil floating on the sea surface (Ballou et al., 1989; Thorhaug et al., 1989; Jackson et al., 1989; Thorhaug & Marcus, 1987).
Jackson et al. (1989) saw a discolouration and heavy algal fouling of seagrasses for several months following heavy oiling of a subtidal seagrass area, however the seagrasses survived these perturbations.
Thorhaug and Marcus (1987) reporting on the use of dispersants on an actual oil spill, found that the results corroborated laboratory and field studies with regards to the low degree of impact caused by the dispersed oil. This study did however identify a variability in toxicities of different dispersants to various seagrasses. Thalassia sp. appears to be the most tolerant species tested.
Toxicity testing using light crudes are less common. Thorhaug et al. (1989) found that there was a variability in response of Thalassia, Halodule and Syringodium to oil and dispersed oil, and generally Thalassia was the most tolerant species. Dispersed oil appeared to have a slightly greater effect on the seagrasses than oil alone.

14
6 IMPLICATIONS FOR MANAGEMENT OF SPILLS OF MEDIUM WEIGHT OILS
The Roller crude is a medium weight oil that potentially has lower levels of the toxic PAH than a lighter oil, therefore it is anticipated that a spill of this type of oil will be less toxic to sensitive marine resources than lighter oils.
The following actions are recommended in the event of a spill of medium weight crude oil:
avoid using dispersants over coral or seagrass algae beds,
apply dispersants to oil prior to the oil impacting mangroves.
It is further recommended that the option of dispersing a medium weight crude should be carried out within approximately six hours of the spill occurring, as evaporative weathering will rapidly remove the light end components leaving a relatively heavy residue. This residue will probably be very viscous and the application of chemical dispersants at this point will have no effect on the oil.
Should the weathered residues of a medium weight crude impact a shoreline then action may be necessary to remove the oil. The residues of a weathered medium weight crude are heavier and more viscous than a light crude and/or its residues, so if the crude makes landfall the primary impacts are expected to be physical rather than chemical. The removal of oil and sediments may be necessary to protect biologically important (turtle and seabird breeding) beaches.
In any event, because of the idiosyncratic nature of major oil spills, the decision to disperse with chemicals must ultimately be made with all conditions and factors prevailing at the time of the spill taken into account.

15
7 REFERENCES
Anderson, J.W., (ed.), 1975. Laboratory Studies on the Effect of Oil on Marine Organisms: An Overview. Publication No. 4249, American Petroleum Institute, Washington, D.C.
Anderson, J.W., Neff, J.M., Cox, B.A., Tatem, H.E. & Hightower, G.M., 1974a. Characteristics of dispersions and water soluble extracts of crude oil refined oils and their toxicity to estuarine crustaceans and fish. Marine Biology 27: 75-88.
Anderson, J.W., Neff, J.M., Cox, B.A., Tatem, H.E. & Hightower, G.M., 1974b. The effects of oil on estuarine animals: toxicity, uptake depuration, respiration. In: J. & W. Vernberg, (eds), 1974. Pollution and Physiology of Marine Organisms.
Anderson, J.W., Riley, R., Kiesser, S. & Gurtisen, J., 1987. Toxicity of dispersed and undispersed Prudhoe Bay crude oil fractions to shrimp and fish. In: Proceedings 1987 Oil Spill Conference (Prevention, Behaviour, Control, Cleanup), Tenth Biennial, April 6-9, 1987, Baltimore, Maryland. Publication No. 4452, American Petroleum Institute, Washington, D.C., pp. 235-240.
Anderson, K.J., Matthews, J.E., Watson P.O., Halliday, M.C., Shiells, G.M. & Read, P.A., 1983. Effects of pollution on the benthos of the Firth of Forth. Marine Pollution Bulletin, 14(1): 12.
American Petroleum Institute, 1985. Oil Spill Response: Options for Minimizing Adverse Ecological Impacts. Publication No. 4398, American Petroleum Institute, Washington, D.C., 98 pp.
Baker, J.M., 1981. The investigation of oil industry influence on tropical marine ecosystems. Marine Pollution Bulletin 12: 6-10.
Ballou, T.G., Dodge, R.E., Hess, S.C., Knap., A.H. & Sleeter, T.D., 1987. Effects of a Dispersed and Undispersed Oil on Man groves, Sea grasses and Corals. Publication No. 4460, Health & Environmental Science Department, American Petroleum Institute, Washington, D.C., 198 pp.
Ballou, T.G., Hess, S.C., Dodge, R.E., Knap, A.H. & Sleeter, T.D., 1989. Effects of untreated and chemically dispersed oil on tropical marine communities: a long-term field experiment. In: Proceedings 1989 Oil Spill Conference (Prevention, Behaviour, Control, Cleanup), 20th Anniversary Conference. February 13-16, 1989, an Antonio, Texas. Publication No. 4479, American Petroleum Institute,
Washington, D.C., pp. 447-454.
Ballou, T.G. & Lewis, R.R. III, 1989. Environmental assessment and restoration recommendations for a mangrove forest affected by jet fuel. In: Proceedings 1989 Oil Spill Conference (Prevention, Behaviour, Control, Cleanup), 20th Anniversary Conference. February 13-16, 1989, San Antonio, Texas, Publication No. 4479,

16
American Petroleum Institute, Washington, D.C., pp. 407-412.
Bedinger, C.A. & Nulton, C.P., 1982. Analysis of environmental and tar samples from the nearshore south Texas area after oiling from the Ixtoc- 1 blowout. Bulletin of Environmental Contamination & Toxicology 28(2): 166-171.
Blackman, R.A.A. & Law, R.S., 1980. The Eleni V oil spill: Fate and effects of the oil over the first twelve months. Part II Biological effects. Marine Pollution Bulletin 11: 217-220.
Blumer, M., Guillard, R.R.L. & Chase, T., 1971. Hydrocarbons of marine phytoplankton. Marine Biology 8: 183-189.
Boehm, P.D., Fiest, D.L., Kaplan, J., Mankiewicz, P. & Lowbel, G.S., 1983. A natural resources damage assessment study: the Ixtoc blowout. In: Proceedings 1983 Oil Spill Conference. American Petroleum Institute, Washington, D.C.
Brochu, C., Pelletier, E., Caron, G. & Desnoyers, J.E., 1986/87. Dispersion of crude oil in seawater: The role of synthetic surfactants. Oil and Chemical Pollution 3: 257-279.
Chart, E.I., 1977. Oil pollution and tropical littoral communities: biological effects of the 1975 Florida Keys Oil Spill. In: Proceedings 1977 Oil Spill Conference, March 8-10, 1977, New Orleans, L.A. Publication No. 4284, American Petroleum Institute, Washington, D.C.
Cubit, J.D., Getter, C.D., Jackson, J.D., Garrity, S.D., Caffey, H.M., Thompson, R.C., Weil, E. & Marshall, M.J., 1987. An oil spill affecting coral reefs and mangroves on the Caribbean coast of Panama. In: Proceedings 1987 Oil Spill Conference (Prevention, Behaviour, Control, Cleanup), Tenth Biennial, April 6-9, 1987, Baltimore, Maryland. Publication No. 4452, American Petroleum Institute, Washington, D.C., pp. 401-406.
Department of Conservation & Environment, 1982. Petroleum Hydrocarbons in Cockburn Sound. Bulletin No. 125, Department of Conservation & Environment, Perth, Western Australia.
Franidin, F.L. & Lloyd, R., 1986/87. The relationship between oil droplet size and the toxicity of dispersant oil mixtures in standard MAFF 'sea' test. Oil and Chemical Pollution 3: 37-52.
Getter, L.D., Ballou, T.G. & Koons, C.B., 1985. Effects of dispersed oil on mangroves; synthesis of a seven year study. Marine Pollution Bulletin 16(8): 318-324.
Giam, C.S., Chan, H.S. & Neff, G.S., 1976. Bulletin of Environmental Contamination and Toxicology 16: 37-43.

17
Gould, H.R. & Koons, C.B., 1980. Cli Worldwide status of research on fate and effect of oil in the marine environment. In Geyer, R.A. (ed.). Marine Environment Pollution, Hydrocarbons. Elsevier Oceanography Series, New York, pp. 319-335.
Grant, J.P., 1978. The conflict between the fishing and the oil industries in the North Sea: A case study. Ocean Management 4: 137-149.
Hester, F.J., 1977. Laboratory biological studies: making them appropriate for predicting the effects of offshore oil and gas operations. In: Offshore Techno.'ogy Conference. OTC Paper No. 2524.
Jackson, J.B.C., Cubit, J.D., Keller, B.D., Batista, V., Burns, K., Caffey, H.M., Caidwell, R.L, Garrity, S.D., Getter, C.D., Gonzalez, C., Guzman, H.M., Kaufmann, K.W., Knap, A.H., Levings, S.C., Marshall, M.J., Steger, R., Thompson, R.C. & Weil, E. 1989. Ecological effects of a major oil spill on Panamanian coastal marine communities. Science 243: 37-44.
Jackson, W.B., (ed.) 1982. Environmental assessment of an active oil field in the Northwestern Gulf of Mexico, 1977-1978: A report of NMFSILGL Workshop 1, 1977-1978. National Marine Fisheries Service. Galveston, Texas. In: Middleditch, Basile & Chang, 1982.
Jernelov, A. & Linden, 0., 1981. Ixtoc 1: A case study of the world's largest oil spill. Ambio 10(6): 299-306.
Kasymov, A.G. & Gasanov, V.M., 1987. Effects of oil and oil-products on crustaceans. Water, Air, and Soil Pollution 36: 9-22.
Keller, B.D., 1989. On evaluating ecological effects of a major oil spill on the Caribbean coast of Panama. In: Proceedings 1989 Oil Spill Conference (Prevention, Behaviour, Control, Cleanup), 20th Anniversary Conference. February 13-16, 1989, San Antonio, Texas, Publication No. 4479, American Petroleum Institute, Washington, D.C., p. 578.
Knieper, L.H. & Culley, D.D., 1975. The effects of crude oil on the palatability of marine crustaceans. Progressive Fish Culturist 37(1): 9-14.
Lee, W.Y., Morris, A., Boatwright, D., 1980. Mexican Oil Spill: A toxicity study of oil accommodated in seawater on marine invertebrates. Marine Pollution Bulletin 11: 231-234.
Lee, W.Y., Winters, K. & Nicol, J.A.C., 1978. The biological effects of the water soluble fractions of a No. 2 fuel oil on the planktonic shrimp Lucifer faxoni. Environmental Pollution 15: 167-183.
LeGore, S., Marszalek, D.S., Danek, L.J., Tomlinson, M.S., Hofmann, J.E. & Cuddeback, J.E., 1989. Effects of chemically dispersed oil on Arabian Gulf corals: a field experiment. In: Proceedings 1989 Oil Spill Conference (Prevention,

Behaviour, Control, Cleanup), 20th Anniversary Conference. February 13-16, 1989, San Antonio, Texas, Publication No. 4479, American Petroleum Institute, Washington, D.C.
LeProvost, Semeniuk & Chalmer, 1987. Environmental Review and Management Programme Saladin Oilfield Development. Unpublished report to West Australian Petroleum Pty Ltd. Report No. Ri 14, LeProvost, Semeniuk & Chalmer, Perth, Western Australia.
LeProvost, Semeniuk & Chalmer, 1989. Exploration Permit TP/3 Port 1, Roller No. 1. Notice of Intent. Unpublished report to West Australian Petroleum Pty Ltd. Report No. 260, LeProvost, Semeniuk & Chalmer, Perth, Western Australia.
McGill, A.S., Mackie, P.R., Howgate, P. & McHenery, J.G., 1987. The flavour and chemical assessment of Dabs (Limanda limanda) caught in the vicinity of the Beatrice Oil Platform. Marine Pollution Bulletin 18(4): 186-189.
Middleditch, B.S., Basile, B. & Chang, E.S., 1982. Ailcanes in shrimp from the Buccaneer oil field. Bulletin of Environmental Contamination and Toxicology, 29: 18-23.
Moller, T.H., Dicks, B. & Goodman, C.N., 1989. Fisheries and mariculture affected by oil spills. In: Proceedings 1989 Oil Spill Conference (Prevention, Behaviour, Control, Cleanup), 20th Anniversary Conference. February 13-16, 1989, San Antonio, Texas, Publication No. 4479, American Petroleum Institute, Washington, D.C., pp. 389-394.
Nadeau, R.J. & Bergquist, E.T., 1977.: Effects of the March 18, 1973 oil spill near Cabo Rojo Puerto Rico on tropical marine communities. In: Proceedings 1977 Oil Spill Conference, March 8-10, 1977, New Orleans, L.A. Publication No. 4284, American Petroleum Institute, Washington, D.C., pp. 535-538.
Neff, J.M., Cox, B.A., Dixit, D. & Anderson, J.W., 1976. Accumulation and release of petroleum derived aromatic hydrocarbons by four species of marine animals. Marine Biology 38: 2 79-289.
Neff, J.F., & Anderson, J.W., 1981. Response of Marine Animals to Petroleum and Specific Petroleum Hydrocarbons. Applied Science Publishers Ltd, London.
Page, D.S., Mayo, D.W., Cooley, J.F., Sorenson, E., Gilfillan, E.S. & Hanson, S.A., 1979. Hydrocarbon distribution and weathering characteristics at a tropical oil spill site. In: Proceedings 1979 Oil Spill Conference. American Petroleum Institute, Washington, D.C., pp. 709-7 12.
Shuba, P.J. & Heikamp, A.J. Jnr, 1989. Toxicity tests on biological species indigenous to the Gulf of Mexico. In: Proceedings 1989 Oil Spill Conference (Prevention, Behaviour, Control, Cleanup), 20th Anniversary Conference. February 13-16, 1989, San Antonio, Texas, Publication No. 4479, American Petroleum

19
Institute, Washington, D.C., pp. 309-3 16.
Snowden, R.J. & Ekweozor, I.K.E., 1987. The impact of a minor oil spillage in the Estuarine Niger delta. Marine Pollution Bulletin 18(11): 595-599.
Teal, J.M. & Howarth, R.W., 1984. Oil spill studies: A review of. ecological effects. Environmental Management 8(1): 27-44.
Teas, H.E., Duerr, E. & Wilcock J.R., 1987. Effects of South Louisiana crude oil and dispersants on Rhizophora mangroves. In: Proceedings 1987 Oil Spill Conference (Prevention, Behaviour, Control, Cleanup), Tenth Biennial, April 6-9, 1987, Baltimore, Maryland. Publication No. 4452, American Petroleum Institute, Washington, D.C., p. 633.
Teas, H.J., Lasday, A.H., Luque, E., Morales, R.A., DeDiego, M.E. & Baker, J.M., 1989. Mangrove restoration after the 1986 refineria Panama oil spill. In: Proceedings 1989 Oil Spill Conference (Prevention, Behaviour, Control, Cleanup), 20th Anniversary Conference. February 13-16, 1989, San Antonio, Texas, Publication No. 4479, American Petroleum Institute, Washington, D.C., pp. 433-437.
Thorhaug, A., 1987. The effect of oil and dispersed oil on global tropical seagrass and mangroves. In: Spillcon 1987, Proceedings Australian National Oil Spill Conference, Melbourne 7-9 October, 1987. Australian Institute of Petroleum Ltd, pp. 4.0-4.14.
Thorhaug, A. & Marcus, J., 1987. Preliminary mortality effects of seven dispersants on subtropical/tropical seagrasses. In: Proceedings 1987 Oil Spill Conference (Prevention, Behaviour, Control, Cleanup), Tenth Biennial, April 6-9, 1987, Baltimore, Maryland. Publication No. 4452, American Petroleum Institute, Washington, D.C.
Thorhaug, A., McDonald, F., Miller, B., Gordon, V., McFarlane, J., Carby, B., Anderson, M. & Gayle, P., 1989. Dispersed oil effects on tropical habitats: Preliminary laboratory results of dispersed oil testing on Jamaica corals and seagrass. In: Proceedings 1989 Oil Spill Conference (Prevention, Behaviour, Control, Cleanup), 20th Anniversary Conference. February 13-16, 1989, San Antonio, Texas, Publication No. 4479, American Petroleum Institute, Washington, D.C., pp. 455-458.
Wardrop, J.A., Butler, A.J. & Johnson, J.E., 1987. A field study of the toxicity of two oils and a dispersant to the mangrove Avicennia marina. Marine Biology 96(1): 15 1-156.
Whitfield, F.B., Last, J.H., Shaw, K.J. & Tindale, C.D., 1988. 2,6 - Dibromophenol: the cause of an iodoform-like off-flavour in some Australian crustacea. Journal of Science, Food & Agriculture.

20
Whitfield, F.B., 1988. Chemistry of off-flavours in marine organisms. Water Science & Technology 20(8/9): 63-74.
Whitfield, F.B. & Freeman, D.J., 1983. Off-flavours in crustaceans caught in Australian coastal waters. Water Science & Technology 15: 85-95.
Youngblood, W.W. & Blumer, M., 1973. Alkanes and alkenes in marine benthic algae. Marine Biology 21: 163-173.

West Australian Petroleum Pty Limited
Permit Area TPI3 Part 1
Five Year Exploration Drilling Programme
Consultative Environmental Review
APPENDIX 6
EXAMPLE HANDOUT FOR ALL RIG PERSONNEL AND VISITORS
ENVIRONMENTAL PROTECTION.
LEC Ref: J217/R345

1
EXAMPLE HANDOUT FOR ALL RIG PERSONNEL AND VISITORS
ENVIRONMENTAL PROTECTION
1 GENERAL
It is West Australian Petroleum Pty. Limited's (WAPET'S) responsibility to minimise the short-term effects of our drilling operations on the environment and to avoid any long-term effects. All personnel on site must practise good housekeeping and enforce the following rules and practices.
2 OIL SPILL PROCEDURES
Refer to the Permit Area TP/3 Part 1 Oil Spill Contingency Plan.
3 ENVIRONMENTAL PROTECTION PROCEDURES
The whole of the permit is environmentally sensitive. Because prospects may be located close to offshore reefs, known fisheries (recreational at Thevenard, commercial off the Ashburton Delta), and a tourist area (Thevenard Island), WAPET requires adherence to the following procedures.
3.1 ALL PERSONNEL
3.1.1 Observe good housekeeping practices, do not allow any materials apart from drill cuttings to be washed or dumped into the sea. if any accidental dumping occurs, report it to the WAPET Drilling Representative, the Drilling Rig Toolpusher or Barge Engineer, or your Supervisor immediately.
3.1.2 Fishing will be totally banned during all well drilling operations. The reasons include the hazards to divers caused by lost lines and tackle, attraction of sharks to the rig resulting in the potential for divers or personnel abandoning the rig being attacked.
3.2 DRILLING FLUIDS ENGINEER, DERRICKMAN, SHAKER HAND
3.2.1 Do not use chemicals apart from those listed in the individual wells drilling fluids programme unless approved by the WAPET Drilling Superintendent.

2
The drilling fluids formulations in the drilling fluids programmes are not environmentally damaging under normal operating conditions. Do not use any materials (except inert ones) in excess of the recommended concentrations, or any materials not included in the programme, unless such use is approved by Perth Office.
3.2.2 Ensure that the shakers and desander/desilter/mud cleaner are operating efficiently so minimal drilling fluids go overboard with the cuttings/solids. Use the mud cleaner in preference to the desander/desilter. Do not discharge drilling fluids into the sea without the approval of the Drilling Superintendent. Any discharge shall be at a minimal rate (approximately 318L/min) during favourable combinations of tides and wind direction.
3.2.3 Drilling/completion fluids remaining on board the rig towards the end of the well must not be discharged before the rig reaches deep water unless they pose a safety problem. The eventual discharge location must be approved by the WAPET Drilling Superintendent.
In the event of production testing and/or suspension of the well, plan ahead to either:
minimise both drilling fluids and brine quantities and keep both on board if possible; or
discharge the drilling fluids at a slow, controlled rate, according to the tidal flow's capacity for diffusion as directed by the Drilling Superintendent.
3.2.4 If the generation of toxic, oily or generally non-biodegradable wastes cannot be avoided, these should be removed by the supply vessels for shore disposal. Disposal requirements are determined by Perth Office in conjunction with the Health Department of Western Australia.
3.3 'MAERSK' BARGE ENGINEER/TOOLPUSHER
3.3.1 Note comments under 3.2 above.
3.3.2 Do not dose the sea water cooling system with microbiocide.
3.3.3 Collect all waste oil, kitchen oil and other noxious and toxic materials in drums for shipment to Port Hedland.

3
3.3.4 Rubbish may be burnt over the side in open mesh tiger cages, provided that:
a hot work permit is obtained from the Drilling Representative and 'Maersk' Toolpusher;
it is contained within a basket so non-degradable material is recovered;
all material remaining after burning is shipped to Port Hedland for disposal.
3.3.5 Ship all solids/plastics and other non-burnable rubbish (batteries, etc.) to Port Hedland.
3.3.6 All sewage and liquid kitchen wastes are macerated prior to discharge into the sea. Use only biodegradable products in the kitchen, laundry and sewage system (e.g. detergents).
3.4 SUPPLY VESSEL CAPTAINS/HELICOPTER PILOTS
3.4.1 Maintain a constant watch for fishing activity to prevent fouling of gear and damage to the fishing industry. Helicopter reports should be passed to the vessels so that they may avoid such activity areas.
3.4.2 Helicopters shall avoid overlying islands, thus minimising disturbance to seabird colonies.
3.4.3 No island landings of vessel or helicopter crews shall be permitted without prior written approval from the Drilling Superintendent.
3.4.4 No wreck diving by vessel crews shall be permitted.
3.4.5 Keep a log of observed current directions and other observations that may help us understand tidal/current behaviour. (Note the limitations on drilling fluid discharges in Section 3.2 above.)

ri!
3.5 DIVERS, REMOTELY OPERATED VEHICLE
Following abandonment or suspension of any well, a diver or Remotely Operated Vehicle (ROV) inspection shall be made to:
ensure no obstructions remain on the seabed;
map the distribution and size of drill cuttings mound;
measure and photograph the suspended well, especially noting the height above seabed of a reference point on the well.
identify and remove any rubbish that has been left on the seafloor.

West Australian Petroleum Pty Limited
Permit Area TP/3 Part 1
Five Year Exploration Drilling Programme
Consultative Environmental Review
APPENDIX 7
SUMMARY OF THE OIL SPILL CONTINGENCY
PLAN FOR PERMIT AREA TP/3 PART!
LEC Ref: J217/R345

1
SUMMARY OF THE OIL SPILL CONTINGENCY PLAN
FOR THE PERMIT AREA TP/3 PART 1
Table of Contents
1 INTRODUCTION 1
2 OBJECTIVES 1
3 ON-SITE OIL SPILL ACTION PLAN - PERMIT AREA TP/3 2 PART 1
4 NOTIFICATION PROCEDURES AND INDIVIDUAL 4 RESPONSIBILITIES WITHIN WAPET
5 RESPONSE SCENARIOS 4
6 OFFSHORE DRILLING OPERATIONS 6
7 TELEPHONE LIST 7
8 REPORTING REQUIREMENTS 7
9 ENVIRONMENTAL CONSIDERATIONS 8
10 MARINE AND TERRESTRIAL CONTROL MEASURES 9 AND CLEAN-UP PROCEDURES
11 ENVIRONMENTAL MONITORING PROCEDURES 9
12 SEASONAL METOCEAN CHARACTERISTICS 10
13 EXTERNAL RESOURCES AVAILABLE FOR COMBATING 10 LARGE MARINE OIL SPILLS
14 LOCALLY AVAILABLE OIL SPILL EQUIPMENT 10 AND DISPERSANTS
LIST OF TABLES
1 A summary of the effects of oil on shorelines 14
2 The effects of oil on tropical marine habitats 15 and populations and management options

11
LIST OF FIGURES
1 Flowchart of notification procedures 18
2 Oil spill treatment 19

1
SUMMARY OF THE OIL SPILL CONTINGENCY PLAN
FOR PERMIT AREA TP/3 PART 1
1 INTRODUCTION
A detailed Oil Spill Contingency Plan (OSCP), covering all drilling and production operations in Permit Area TP/3 Part 1, was submitted as a 'stand-alone' document to, and approved by, relevant government departments, including the Environmental Protection Authority, the Department of Mines and the State Combat Committee in early 1990.
This plan has been updated as new information has been obtained and the revised pages distributed to all personnel and government departments that hold copies of the plan.
The purpose of the permit wide contingency plan was to provide a document that could be used for drilling and production operations within the area. The aim of the TP/3 Part 1 OSCP was to avoid the unnecessary repetition and time consuming delays involved in preparation of identical documents for every prospect drilled and for subsequent production operations within the Permit Area. This appendix on oil spill contingency planning summarises the most important aspects of the detailed TP/3 Part 1 OSCP.
2 OBJECTIVES
The objective of the plan is to provide procedures and guidelines for personnel involved in combating an oil spill such that damage to the environment is either prevented or minimised.
The plan defines priority actions to be taken in the event of a spill and identifies personnel responsibilities, equipment and facilities available for containment, recovery and disposal of spilled oil, and the role of the company and other organisations in responding to an oil spill.
The plan identifies environmental resources in the area requiring special protection and provides information on the influence of local meteorological and oceanographic conditions on marine oil spills. Guidelines are provided for monitoring the impact of oil spills on the environment and for subsequent clean-up procedures. The following sections are summaries of the individual areas covered by the detailed OSCP.

2
3 ON-SITE OIL SPILL ACTION PLAN - PERMIT AREA TP/3 PART 1
When a reported oil spill or slick is confirmed the following action plan would be used by the West Australian Pty Limited (WAPET) person-in-charge (PlC) to develop appropriate response measures. These response measures are applicable regardless of the size of the spill. This action plan is a summary of the more detailed plan contained in the Permit Area TP/3 Part 1 OSCP.
(1) Initiate alert procedures
I (a) Evaluate whether reciuired spill response is within the capability of
WAPET or whether assistance is needed.
(b) Communication channels (radio) are to be manned continuously (24 hours) during an oil spill response.
(2) Act to prevent continuing spillage if possible to do safely. Isolate equipment and materials which may create a fire hazard. Priority consideration must be given to safety of personnel before taking any action.
(3) Assess spill
Identify location and time of spill. Estimate quantity of oil. Identify type of oil. Estimate size of slick. Observe direction of movement of spill.
(1) Observe weather conditions: wind direction, wind speed.
(4) Despatch vessel carrying containment boom equipment
(5) Arrange to monitor the movement of the slick
(6) Assess the anticipated path of the slick
Determine current phase of tidal cycle (neap or springs). Refer to tide tables.
Determine wind direction and speed. Weather stations located at Thevenard Island and Barrow Island can provide this information.
Determine likely spill trajectory from oil spill trajectory charts compiled from computer model trajectory results.
(d) Using data from (a) and (b), determine the likely trajectory by vector calculations.

3
Monitor actual movement of slick by placing movement indicators (e.g. rubber-backed sponge mat) into the leading edge of the spill. Commence sample collection.
Determine marine resources at immediate risk in the path of the spill. The priorities for protection of vulnerable marine resources in the area are summarised below (see Section 8).
High priority
mangroves (all year); sandy beaches (September - May) (turtles and hatchlings); tourist beach, Thevenard Island (May - October) (tourist season); coral reefs (spawning March/April); vessel mooring area in Beadon Creek, Onslow (all year).
Lower priority
sandy beaches (June - August) except tourist beach on Thevenard Island; seagrass and algae beds.
(9) Determine appropriate response strategy to deal with the spill (Fig. 1).
(10) Initiate clean-up procedures
(a) Table 1 is a summary of the effects of oil on various shorelines and should be used as a guide to dealing with beached oil.
(b) The preferred course of action for light-medium weight crude oil is to allow any stranded or beached oil to weather and degrade naturally.
(c) If an affected beach is heavily utiised at the time by turtles or seabirds, either:
rake the affected beach areas to increase the rate of weathering and degradation; or
remove the contaminated sand and dispose of at an approved site on the mainland.
(d) Dispersants are not to be applied to stranded oil.
(11) Dispose of oil-contaminated wastes and recovered oil and water
(a) Oily waste and contaminated sand will be sent to one of the following sites:

I
nominated oily waste disposal site at Onslow contact Work Supervisor, Shire of Ashburton, Ph. (091) 84 6001, a/h Ph. (091) 84 6083;
Karratha "Seyen Mile" industrial disposal site, contact Shire of Roebourne, Ph. (091) 86 8555, a/h Ph. (091) 85 2272;
Karratha existing domestic tip.
(b) Recovered oil and water gathered by skimmers into a barge-mounted tank will be sent to Thevenard Island or Barrow Island and transferred to shore-based tank(s).
Vacuum truck(s) will transfer recovered oil and water to the production processing facilities existing at either site where the oil will be recovered or burned and the water treated prior to disposal.
(12) Initiate environmental monitoring of affected areas.
4 NOTIFICATION PROCEDURES AND INDIVIDUAL RESPONSIBILITIES WITHIN WAPET
These have been summarised in Figure 2 as a flow chart. The level of notification will depend on the size of an oil spill. Notification of government departments will be initiated through the Department of Mines in the event - of a spill in excess of 80 L. If a significant spill takes place the following departments will be notified immediately: Environmental Protection Authority (EPA), Department of Conservation and Land Management (CALM), Department of Fisheries, State Combat Committee. A flow chart of contacts is presented in the OSCP.
5 RESPONSE SCENARIOS
1 Refuelling operation, spill volume less than 1,500 L of diesel, or testing production flow, spill volume up to approximately 7,500 L of crude oil.
Ensure that source of spill has been cut off. Monitor the slick movement and have boom stored on rig (or standby vessel) on standby. If spill occurs in shallow water close to a sensitive area, deploy boom to contain oil and mobilize Komara oil skimmer from Varanus Island (Hadson) to the site. Collect diesel crude and transfer to Thevenard Island for treatment through separator plant.
If spill occurs at a location remote from sensitive areas, track spill until evaporation/weathering is complete. If a spill in a remote area appears to be moving towards a sensitive area, notify Operations Superintendent and Environment, Health and Safety Superintendent

5
who will notify the Environmental Protection Authority (EPA) and -. request permission to use dispersants, should weather conditions
preclude the use of the boom and skimmer.
2 Blowout, well brought under control within hours. Assume a loss of 79,485794,850 L of light to medium weight crude oil.
Notify Operations Superintendent, Perth, who will put the Marine Oil Spill Action Plan (MOSAP) on standby to mobilize supplementary equipment to site. Scenario 1 to be followed with regards to the deployment of the boom and skimmer and surveillance of the spill. Additional WAPET equipment held on Barrow Island and Thevenard Island to be mobilized to site in conjunction with vessels and manpower necessary for the deployment and operation of equipment. Operations Superintendent and Environment, Health and Safety Superintendent to notify EPA and State Combat Committee to discuss dispersant use options. Continue containment, collection, surveillance and/or dispersal actions. Oil/water mix to be transferred to Thevenard Island for treatment in the separator• plant.
If the spill is likely to beach, mobilize clean-up crews to the beaches ahead of the spill for deployment of beach barrier/absorbant booms. In conjunction with WAPET environmental staff, determine what resources are at nsk, the pnontles for protection of the resources and options for protecting/cleaning them up.
Arrange for WAPET environmental staff to inspect clean-up, and initiate post-spill monitoring of the impacted area.
The WAPET representative responsible for co-ordinating the spill clean-up operation in the field will be nominated by, and report to, the Operations Superintendent, Perth. The Operations Superintendent will be responsible for co-ordinating the overall clean-up effort and lialsing with the MOSAP Regional Industrial Controller (RIC), the State Combat Committee and nominated Government departments. WAPET personnel currently located at Onslow will be responsible for co-ordinating equipment and resources to be sent to the spill site.
- - (v) At the completion of the clean-up, the Operations Superintendent
will prepare a written report on the actions taken to contain and clean up the oil spill. The report will be forwarded to the Department of Mines and the EPA.

3 Uncontrolled blowout
Response scenario 2 to be followed with regards to the deployment of equipment and resources held by WAPET and available through MOSAP. MOSAP RIC to request that the State Combat Committee mobilize all available State resources and if necessary National resources.
Operations Superintendent, Perth to initiate measures required to achieve shut-down of well as soon as 'possible.
6 OFFSHORE DRILLING OPERATIONS
During the drilling of offshore prospects in Permit Area TPI3 Part 1, the following arrangements will be made with regards to oil spill equipment.
(i) WAPET will place on board the drilling rig 300 m of Jackson net boom, with further 200 m stored at Thevenard Island (part of the WAPET OSCP).
(ii) This boom is stowed in frames designed for rapid deployment. Each frame contains 100 in of boom. Deployment during training exercises took 5-6 minutes per 100 m.
(iii) The boom can be deployed from the following vessels:
supply vessel; mooring vessel; fishing vessel.
(iv) In the event of an oil spill, the boom would be transferred from the rig to the standby vessel and rapidly deployed.
(v) A Komara 12K Skimmer Mark 2 would be used for the recovering the spilled oil (12 tonnes per hour). This skimmer would be obtained from Hadson Energy Limited (Harriet Field, Lowendal Islands).
An agreement is currently in place between WAPET and Hadson Energy covering use of the skimmer.
(vi) The Komara Skimmer would be loaded aboard one of the three landing barges under charter to WAPET. Each barge has the capacity to hold 120 tonnes of recovered oil in their cargo fuel tanks.
(vii) Several 63.6 kL (400 bbl) frac tanks are available at Barrow Island. These tanks can be loaded onto a barge for additional storage. Hose connections and pump have all been allocated for this contingency.

-7
Dispersant availability
1,200 L of Corexit 9527 dispersant is held on Barrow Island, Thevenard Island and the currently contracted standby supply vessel at all times. A company-owned, helicopter-mounted dispersant spray bucket is held at Thevenard Island or Barrow Island at all times.
Response times (estimated maximum times under suitable weather conditions)
Loading of boom onto a supply vessel 15 minutes
Deployment of boom 20 minutes
Transport of additional 200 m of boom 0-6 hours at Barrow to Permit Area TP/3 Part 1
Transport of Komara Skimmer and power 1 hour pack to site by helicopter
Barge to site 0 to 6 hours
Deployment of dispersant spray bucket 1 hour
7 TELEPHONE LIST
A regularly updated telephone list is included in the plan. It lists contact details for the following personnel:
WAPET; Other local oilfield operators; State Combat Committee; State Departments (CALM, EPA, Department of Mines, Department of Marine & Harbours); Local Government - Shire of Ashburton;
(vi), Local Government - Shire of Roebourne; Bird Rehabilitation Volunteer Group; Regional Emergency Groups; Federal Authorities.
8 REPORTING REQUIREMENTS
All oil spills will be reported to the WAPET PlC.
Any oil spills less than 80 L (0.5 bbl) will be logged by the WAPET PlC. The log details:

time and place of spill; type of oil spilt; estimated amount of oil spilt; and actions taken.
The log will be forwarded to the Operations Superintendent in Perth immediately.
All spills in excess of 80 L will be reported by the Operations Superintendent to the Department of Mines immediately.
The Operations Superintendent will prepare a written report to the Department of Mines and the EPA detailing:
time and place of spill; type of oil spilt;
estimated amount of oil spilt; cause of spill;
action taken to control spill; and damage assessment.
9 ENVIRONMENTAL CONSIDERATIONS
Details concerning the distribution of marine habitats within the permit area are included in the plan and are updated as the results of ongoing biological surveys are obtained.
To date biological habitat surveys have been conducted for:
Serrurier Island; Bessieres Island;
Bowers Ledge; Tortoise Island;
Ashburton Island; Direction Island;
Thevenard Island; Ashburton River delta;
(ix)
Locker Island; and (x) Intertidal habitats - Turbridgi Point to Beadon Creek.
The islands (i) to (viii) have also been surveyed on a biannual basis as part of the ongoing Saladin Oilfield Development Marine Biological Monitoring Program. This program involves the monitoring of seagrass and algae, corals and sediment hydrocarbon levels. A similar program will be instigated for the mainland coast between Turbridgi Point and Beadon Creek, including the Ashburton River Delta and Locker Island for the Roller Development.
Habitat distribution studies have been conducted for the Roller development and details are contained in Section 4 of the Roller Consultative Environmental Review

(CER). The TP/3 Part 1 Contingency Plan also contains a brief review of the impact of crude oil and dispersed oil on local marine resources and an assessment of priority allocations for the protection of sensitive resources in the vicinity of WAPET's various exploration and development activities within the permit area. This information is summarised in Table 2.
Particular consideration has been given to the potential impacts of an oil spill on the mangroves of the mainland coastline adjacent to the Roller development, on the commercial recreational vessels that use Beadon Creek (Onslow) as a mooring area, and on the proposed Onslow Salt development. These resources have been assigned a high priority for protection and methods for achieving this have been considered.
10 MARINE AND TERRESTRIAL CONTROL MEASURES AND CLEAN-UP PROCEDURES
Details concerning the available clean-up options and where they should be used are given in the contingency plan. Options discussed include:
containment and recovery with boom and skimmer; dispersant application; diversion with booms; agitation on water surface; raking of beaches; physical removal of beached oil; and natural degradation.
The control measures and clean-up procedures used will depend on the time and size of the spill, the prevailing metocean conditions and the oil type. The preferred options recommended by the EPA are:
contain and recover at sea; divert with booms; allow to weather naturally; and use chemical dispersants (only with EPA authorisation).
11 ENVIRONMENTAL MONITORING PROCEDURES
An existing marine monitoring program has collected baseline and post-commissioning data for the Saladin Oilfield development.
Baseline habitat surveys have also been conducted at Locker Island, Ashburton River delta (east), Turbridgi Point and Urala Creek as part of the environmental monitoring program for the Roller Oilfield Development. The habitat maps derived from these surveys are included in the TP/3 Part 1 OSCP as a function of the regular updating of the plan.

10
In the unlikely event of an oil spill, these sites will be monitored to assess the extent and impact of oil and the time it takes for the system to recover. This information will be promptly reported to the Department of Mines and the EPA.
12 SEASONAL METOCEAN CHARACTERISTICS
This information is used by personnel combating the oil spill in conjunction with the computer simulated oil spill trajectories to assess the likely weathering behaviour and direction of travel taken by a spill. The contingency plan details seasonal meteorological and oceanographic characteristics of the development area.
Computer modelled oil spill trajectories have been conducted for Roller, Thevenard Island tanker mooring and Saladin A, B and C (Thevenard Island).
13 EXTERNAL RESOURCES AVAILABLE FOR COMBATING LARGE MARINE OIL SPILLS
In the event of a marine oil spill incident which requires a level of response beyond the immediate capability of WAPET to provide, assistance may be called upon from external sources. These include:
the Australian Institute of Petroleum (AlP) Marine Oil Spill Action Plan;
the West Australian State Counter Disaster Plan; and
National Plan to Combat Pollution of the Sea by Oil.
These Plans can provide equipment and manpower to the company in the event of an oil spill. Contact number and equipment available is detailed in the WAPET TP/3 Part 1 plan.
14 LOCALLY AVAILABLE OIL SPILL EQUIPMENT AND DISPERSANTS
A wide range of equipment and dispersants are available within Western Australia and can be accessed by WAPET either directly or through the MOSAP Regional Industrial Controller at Karratha.
The TP/3 Part 1 OSCP lists equipment available from the following sources:
WAPET; Western Mining Corporation; Woodside Offshore Petroleum - King Bay; Hadson Energy Limited; and AlP equipment at King Bay.

11
An inventory of this equipment is given below. The contact details necessary to mobilise this equipment in addition to miscellaneous equipment held by various private companies are listed in detail in the plan.
WAPET FACILITIES AND EQUIPMENT
BWI = Barrow Island TVI = Thevenard Island ONS = Onslow
Equipment
Location
1. Vessels
1 Tug "Mary Ann Tide", has fire monitors and dispersant booms.
"Osprey" 1 x 19 m launch capable of deploying Jackson net boom and carrying 2,200 L Corexit 9527 dispersant, spray facilities.
"Miss Barrow" 1 x 10 m launch with capacity for 800 L Corexit 9527 dispersant.
2 x landing barges, loaded draught 1.8 m, deck cargo space 160 m, capacity 150 tonnes.
TVI/BWI
TVI/BWI
BWIITVJJ ONS
"Saladin Scout" 1 x 9.9 m launch capable of deploying TVI Jackson net boom and carrying 30 L Corexit 9527 dispersant for immediate use, spray facilities (as from December 1989). A further 1000 L of dispersant (Corexit 9527) is stored on Thevenard and can be carried on board four drums at a time.
Booms
300 m Jackson net boom TVL'BWI 200 m Jackson net boom TVI/BWI
Dispersant
1,200 L Corexit 9527 BWI 1,000 L Corexit 9527 TVI 1,000 L Corexit 9527 Vessel 2 x 44 gallon dispersant (Corexit 9527) on each of the supply vessels (WAPET Drilling)

12
Helicopter spray unit TVI/BWI
Aviation services
1 x twin engine aircraft, nine person STOL capability. BWI
Miscellaneous equipment
5 x front-end loaders BWI 1 x front-end loaders TVI 1 x grader BWI 1 x bulldozer BWI 1 x tractor BWI 1 x tractor TVI 2 x vacuum trucks BWI 1 x vacuum tank trailer (10.9 kL) TVI Various mobile tanks (up to 79.5 kL) BWIITVI Various mobile pumps and bases BWI/TVI
Miscellaneous equipment
During offshore drilling operations the above equipment is supplemented by the following:
Vessels - 2 x supply/support vessels BWI Helicopters - 1 x PUMA TVI
1 x Bell 206B
WESTERN MINING CORPORATION LIMITED, PETROLEUM DIVISION EQUIPMENT
Equipment and dispersants available immediately are:
one vessel "Marella" (25 m) one 1,620 foot Petrel TXB - 50 air-filled oil boom 10 x 200 L Corexit 9527
WOODSIDE OFFSHORE PETROLEUM PTY LTD - KING BAY
Tugs
Four vessels - LOA: 33.0 m speed: 12 knots 50 ton bollard pull fire fighting: Class B waterborne fire fighting support vessels fitted with dispersant booms and fire/foam monitors
4.
S.

Oil spill equipment
600 m Jackson net 200 m Hoyle Shore guardian 100 m Gamlen boom 20 bags Drizit for absorbent boom 200 L BP 1100WD Komara Mini Skipper (BP) Vikoma Coastal Pack (BP)
HADSON ENERGY LIMITED
Launches 1
Length-25m Speed - 10 knots Radio fitted - yes Equipment - spray system Dispersant - 2,000 L Corexit 9527, 2,000 L Baroid Surflo OWl
Boom - 300 m Jackson boom Spray equipment - Simplex helicopter dispersant spray bucket unit Helicopters - 1 x S76
1 x 206 Skimmer- 1 Komara MKII 12K
AlP EQUIPMENT HELD AT KING BAY
Two spray units for vessels, including power pack and spray booms. 12 kL Shell dispersant.
13

TABLE 1
A SUMMARY OF THE EFFECTS OF OIL ON SHORELINES
METHODS OF, AND SHORELINE TYPE COMMENTS SUSCEPTIBILITY TO, CLEANUP
Exposed rocky Wave reflection will keep some oil No attempt should be made to clean headlands and offshore. Landed oil weathers rapidly. by artificial means. eroding wave-cut platforms
Fine-gramed sand Light grade oils penetrate deeply. Depending on priority rating, beached beaches Asphalt-like pavement may develop, oil may be left to weather naturally
and persist for many years on a low or, alternatively, hand or mechanical energy beach. On a high energy beach removal of oily sand may be oil may be weathered and removed necessary. rapidly, or buried and removed more slowly.
Coarse-grained sand Light grade oils can sink in rapidly and Depending on priority rating, beached beaches deeply. Under moderate to high wave oil may be left to weather naturally
energy, oil can be removed rapidly. or, hand or mechanical removal of Buried oil may persist in low energy oily sand may be necessary. beaches.
Mixed sand and Oil may undergo rapid penetration and Depending on priority rating, beached gravel burial. Under moderate to low energy oil may be left to weather naturally
conditions buried oil may persist for or, hand or mechanical removal of years. Under high energy conditions, oil oily sand may be necessary. can be removed rapidly.
Sheltered rocky Areas of low wave energy. Oil may Allow to weather naturally. May be coasts and sand persist. protected by dykes if mangroves beaches present. Booms should be used to
keep oil offshore.
Mangroves Extremely low energy environment. In Diversion of oil offshore with booms, muddy sediments little penetration of etc. a high priority. Extremely the substrate occurs. Oil is not rapidly sensitive area. May be necessary to removed and is very persistent. In disperse prior to landfall. Mechanical sediment with a large sand component, removal must not be attempted. oil may penetrate the sediments and persist for years.
Intertidal limestone Landed oil should weather rapidly. May Natural weathering will remove oil pavement with or collect in pools and be redistributed on with time. Dispersants not without sand veneer rising tide. recommended, will cause loss of
shoreline plants and animals.
Refs: Healey, B.O., 1987. The role of the scientific co-ordinator. In: Spillcon, 1987, Proceedings Australian National Oil Spill Conference, Melbourne, 1987.
IMCO/UNEP, 1982. The Status of Oil Pollution and Oil Pollution Control in the West and Central African Region. Regional Seas Report and Studies No. 4, UNEP.
The International Tanker Owners Pollution Federation Ltd, 1983. Technical Information Papers: 1-10
14

TABLE 2
THE EFFECTS OF OIL ON TROPICAL MARINE HABITATS AND POPULATIONS AND MANAGEMENT OPTIONS
HABITAT! DAMAGE AND SENSITIVITY TO OIL TREATMENT WHAT TO POPULATION TYPE OF EFFECT AND RECOVERY OPTIONS AVOID
TYPE RATES FOLLOWING DAMAGE
CORAL REEFS Impacts range from no Sensitive. Booms can be No dispersants in affect (particularly on Behavioural effects used to deflect oil shallow (less than corals in deep, well temporary. Recovery rates around shallow 10 m) deep water. flushed areas) to poorly known. Corals reef areas. mortality of entire have been observed self assemblages in shallow cleaning after an acute water (dispersed oil), exposure. Abortion effects have been reported, direct coating is lethal and corals are expected to be highly sensitive during mass spawning.
SEAGRASS Some species show Moderately sensitive. Booms can be No dispersants BEDS short-term local Recovery may be rapid used to deflect oil increases
denuding. Dispersed after short-term impact. around shallow residence time of oil causes severe Retention of oil in seabed area, oil in sediments. damage to intertidal sediments may cause organisms and long-term damage. produces higher sediment hydrocarbon concentrations than in undispersed areas.
MANGROVES Highly susceptible to Very sensitive. Dispersants Dispersants even light oiling Diversion of spill the should be applied should not be resulting in defoliation highest priority. Estimates to oil that is used on oil and death. Faunal from lOs-lOOs of years to approaching stranded in mortalities leading to attain a mature forest. mangroves. Best mangroves. decrease in population Retention of oil in treatment is to Mechanical clean- density. sediments may cause leave stranded oil up methods must
long-term problems. alone to weather not be attempted naturally. in mangroves.
INTERTIDAL These areas support a Sensitive. Booms can be Dispersants MUD AND great variety of marine Recoveries vary from used to deflect oil should be SAND FLATS flora and fauna and rapid (months to years) to away from area avoided.
often are spawning or slow (lOs of years) possibly onto a flursery grounds, and depending on the degree beach for later fish and bird feeding of oil retention and clean-up. areas. The above - availability of components are all recolonising species. highly susceptible to the impacts of oil. Turtles mating in shallow nearshore waters may be seriously affected.
15

TABLE 2 (Cont'd)
THE EFFECTS OF OIL ON TROPICAL MARINE HABITATS AND POPULATIONS AND MANAGEMENT OPTIONS
HABITAT/ DAMAGE AND SENSITIVITY TO TREATMENT WHAT TO POPULATION TYPE OF EFFECT OIL AND OPTIONS AVOID
TYPE RECOVERY RATES FOLLOWING
DAMAGE
ROCKY Little or no effect. Low sensitivity. None required. INTERTIDAL Organisms hardy. Fast recovery.
Damage caused by Rapid recolonisation by coating leading to more species. suffocation or loss of purchase on substrate.
OPEN WATERS Surface dwelling Some components If there is a organisms may suffer sensitive. Unknown, potential for (birds, mammals, Birds severely landfall, disperse plankton). Sublethal to impacted. Local oil in deep water. lethal effects on fish, breeding populations of If not, leave Tainting of fish or larval fish and shellfish alone. prawn flesh may may take a long time to occur, recover. Plankton is
expected to recover rapidly.
BENTHIC Mortalities lead to Some components None identified. COMMUNITIES decrease in population sensitive. Immigration
density and age from surrounding areas distributions. Change are expected to speed in species abundance up recovery. and distribution, imbalance between interacting populations.
BIRDS Very easily damaged, Very sensitive. Clean-up of birds Trampling nests oiling of plumage and Damage to breeding may be attempted, above high tide line ingestion of oil result population will cause it is rarely of sandy beaches. in large mortalities, slow recovery, successful.
SANDY Severe impact on egg Some components very Beaches should be Dispersants should BEACHES laying turtles and sensitive on a seasonal raked to promote never be applied to
hatchlings, feeding basis. Recovery of evaporation, a sandy beach. and breeding wading fauna will depend on Mechanical or Avoid trampling of birds and intertidal the time it takes for the manual removal the beach and dune fauna. sandy beach to be may be necessary areas.
cleansed of oil, on nesting Affected breeding beaches. populations will be slow to recover.
16

17
TABLE 2 (Cont'd)
THE EFFECTS OF OIL ON TROPICAL MARINE HABITATS AND POPULATIONS AND MANAGEMENT OPTIONS
HABITAT/ POPULATION
TYPE
DAMAGE AND TYPE OF EFFECT
SENSITIViTY TO OIL AND
RECOVERY RATES
FOLLOWING DAMAGE
TREATMENT OPTIONS
WHAT TO AVOID
FISH Possible for them to Moderate sensitivity. Dispersants will avoid spills. Fast to moderate make oil more Mortality and recovely rates. Fast available to the fish, tainting of flesh can immigration of however, its use may occur. Greatest larvae and adults, be necessaiy to danger to breeding protect higher populations in priority habitats. confined waterways or benthic fish in heavily polluted substrates.
MAMJvIALS Chances of impact Unknown sensitivity. reduced by low Slow if population is abundance of seriously affected. mammals and ability to escape the area impacted. Conclusive evidence of death due to oil is rare. Possible effects include ingestion of oil during grooming, loss of thermal insulation and/or water-proofing and eye irritation. Indirect effects include destruction of food sources.
Refs: Dicks, 13., 1984. Oil pollution in the Red Sea. Environmental monitoring of an oiffield in a coral area, Gulf of Suez. Deep Sea Research 31 (6-8A): 83.
Hyland, J.L & Schneider, E.D., 1977. Petroleum Hydrocarbons and Their Effects on Marine Organisms, Populations, Communities and &osystems. Sources, Effects and Sinks of Hydrocarbons in the Aquatic Environment. American Institute of Biological Science, Washington, D.C., pp. 463-506.
Knap, A., 1987. The effects of oil spills on reef systems. In: Proceedings Australian National Oil Spill Conference, Melbourne, 7-9 October 1987.
Thorhaug, A., 1987. The effect of oil and dispersed oil on global tropical seagrass and mangroves. In: Proceedings Australian National Oil Spill Conference, Melbourne, 7-9 October 1987.

- - - NATPLAN
SPILL OBSERVED
*
PE
West Australian I FLOWCHART OF I RMIT AREA TP/3 Part 1 I Figure
jPetroleum
I I Pty. Limited
I NOTIFICATION PROCEDURES I I
September 1989 I J217 R345 A7 4/91

Decision making process To be carried out in conjunction with scientific advisor
Oil spill surveillance forecasting
I Moving from shore
I Maintain surveillance I
Moving to shore
I Leave undisturbed for I natural biodegradation
No Examine risk
II
Yes
oil j
lo
Examineproperties, ather forecast.
cation etc
Yes I Is recovery feasible ?
19
Recover
Is
overyoperatnefficient?N00rEitI
Yes
( Maintain recovery t
e any environmentally nsitive resources risk ?
7 Yes No
I Discuss dispersant options I with EPA personnel
Allow to beach and treat on shore
PERMIT AREA TPI3 Part i Figure
West Australian I Petroleum I OIL SPILL TREATMENT 2 Pty. Limited
September 1989
J217 R345 A7 4/91

West Australian Petroleum Pty Limited
Permit Area TPI3 Part 1
Five Year Exploration Drilling Programme
Consultative Environmental Review
APPENDIX 8
LIST OF COMMITMENTS
LEC Ref: J217/R345

ii
LIST OF COMMITMENTS
West Australian Petroleum Pty Limited (WAPET) undertakes to abide by all of the commitments made in the Consultative Environmental Review (CER) for the Permit Area TP/3 Part 1 Five Year Exploration Drilling Programme, and in all cases will fulfil those commitments to the satisfaction of the appropriate statutory authority(s).
The major commitments given within the CER are listed in the following sections.
ENVIRONMENTAL EDUCATION
(1) Before commencement of their duties, each worker or contractor (including workboat and supply vessel crews) will be given an induction course including advice on the sensitive nature of the environment in which the drilling rig is located.
SAFETY AND OIL SPILL CONTINGENCY
To improve operational safety, commercial and recreational vessels will not be permitted closer than 500 m to the drilling rig during the construction phase.
The drilling rig to be contracted will be capable of withstanding cyclonic wind and wave conditions. Detailed procedures which set out the various levels of responses to cyclones will be contained in the operator's Emergency Procedures Manual.
WAPET will abide by all procedures detailed in the Permit Area TP/3 Part 1 Oil Spill Contingency Plan (OSCP).
An oil spill containment boom will be present at the site during drilling. A vessel will be in the vicinity of the drilling rig at all times to deploy the boom and skimmer in the event of an oil spill.
During any spill event, WAPET would make available oil spill equipment, vessels, aircraft and personnel to help with containment and clean-up measures.
Existing WAPET and rig operator procedures for cyclone response will be followed to safeguard the wells, rig, offshore structures, vessels and personnel.

2
(7) With regard to any oil spill or discharge resulting from the drilling of any wells in the Permit Area WAPET makes the following commitments:
to be fully responsible for the cost of operations conducted by it or any Governmental agency aimed at containing or dispersing or recovering any such petroleum or cleaning up any areas polluted by such petroleum;
to promptly pay to any person, company or Government (Federal, Sate or Local) any damages to which any of those entities is lawfully entitled from WAPET.
DRILLING RIG OPERATIONS
Prior to spudding in, the rig operator will conduct surveys and tests in accordance with Department of Mines regulations to ensure stability of the rig and to minimise the risk of abnormal penetration of the seabed during storm conditions.
The blowout preventer (BOP) stack will be tested in accordance with Department of Mines regulations after the surface casing has been installed.
All casing strings installed below the BOP stack will be pressure tested in accordance with Department of Mines regulations before drilling is resumed.
Drilling fluids used will be those approved for offshore use by the Department of Mines.
Chrome lignosuiphates will not be used in drilling any well.
At prospects within 500 m of sensitive marine resources drillers will only drill 17.5" and 36" holes during times when the tidal currents will transport the cuttings away from sensitive resources. Drill cuttings and excess fluids produced after the 36" hole will be disposed of between the down hole casings and into the lost circulation zone. If this zone is not available, drilling of the hole will only continue during favourable tidal conditions.
At prospects within 500 m and 2 km of sensitive marine resources, cuttings will be separated on board the rig and continuously discharged overboard through a conductor pipe to the seabed. Drilling fluid will be stored and discharged down the conductor pipe on tides that will carry the fluids away from sensitive marine resources.
At prospects more than 2 km from sensitive marine resources, cuttings will be separated and disposed overboard continuously. Drilling fluids will be

L stored and released at a controlled rate during tide and wind conditions that will move the plume away from the closest sensitive resources.
Deck drainage and other oily wastes will be collected and transported to Port Hedland for recycling.
Sanitary wastes from the kitchen, showers and laundry will be passed through a sewage treatment plant for comminution and disinfection before being discharged overboard. Solid food waste will be macerated before disposal overboard. Biodegradable detergents will be used for cleaning functions. Combustible materials will be burnt on the rig. All non-combustible material will be returned to the shore base for disposal at an approved land site.
OPERATION OF VESSELS AND AIRCRAFT
(1) Helicopter pilots will be instructed not to overfly islands.
Regular crew transfers between the drilling rig, Thevenard Island and Perth will use existing routes involving helicopter/light aircraft transfers to Barrow Island, and chartered commercial flight direct to Perth.
All refuelling operations for the supply vessels will be conducted in accordance with strict Port Authority requirements, including continuous visual monitoring and the use of reinforced hoses and fall-safe valves and fittings.
It will be a contractual requirement for the supply vessels and rig to comply with all State and Commonwealth legislation for the control of pollution and dumping at sea.
Masters of supply vessels will be instructed not to allow crew to disturb islands or wreck sites, nor to anchor close to coral reefs.
