appendices economic report on indonesia appendices 251 tables number title table 1 gross domestic...
TRANSCRIPT

APPENDICES

250 2016 ECONOMIC REPORT ON INDONESIAAppendices
2016 Bank Indonesia Regulations
No. Regulation Date Corcerning
1 Bank Indonesia Regulation (PBI) No. 18/1/PBI/2016 28/01/16 Total and Nominal Value of Rupiah Currency Destroyed in 2015
2 Bank Indonesia Regulation (PBI) No. 18/2/PBI/2016 26/02/16 Sharia Hedging
3 Bank Indonesia Regulation (PBI) No. 18/3/PBI/2016 10/03/16Third Amendment to Bank Indonesia Regulation (PBI) No. 15/15/PBI/2013 concerning Rupiah and Foreign Currency Statutory Reserve Requirements for Conventional Commercial Banks
4 Bank Indonesia Regulation (PBI) No. 18/4/PBI/2016 22/04/16 Implementation of Prudential Principles in Managing the External Debt of Nonbank Corporations
5 Bank Indonesia Regulation (PBI) No. 18/5/PBI/2016 2/05/16 The Management of Fund Transfers and Scheduled Clearing by Bank Indonesia
6 Bank Indonesia Regulation (PBI) No. 18/6/PBI/2016 2/05/16Amendment to Bank Indonesia Regulation (PBI) No. 17/18/PBI/2015 concerning the Management of Transactions, Administration of Securities and Real-Time Fund Settlement
7 Bank Indonesia Regulation (PBI) No. 18/7/PBI/2016 17/05/16 Bank Transactions to Bank Indonesia through Bilateral Currency Swap Arrangements
8 Bank Indonesia Regulation (PBI) No. 18/8/PBI/2016 17/05/16 Second Amendment to Bank Indonesia Regulation (PBI) No. 15/17/PBI/2013 concerning Hedge Swap Transactions to Bank Indonesia
9 Bank Indonesia Regulation (PBI) No. 18/9/PBI/2016 03/06/16 Payment System Regulation and Supervision and Rupiah Currency Management
10 Bank Indonesia Regulation (PBI) No. 18/10/PBI/2016 30/06/16 Monitoring Foreign Exchange Flows of Bank and Customer
11 Bank Indonesia Regulation (PBI) No. 18/11/PBI/2016 29/07/16 Money Market
12 Bank Indonesia Regulation (PBI) No. 18/12/PBI/2016 15/08/16 Monetary Operations
13 Bank Indonesia Regulation (PBI) No. 18/13/PBI/2016 15/08/16 Third Amendment to Bank Indonesia Regulation (PBI) No. 15/17/PBI/2013 concerning Hedge Swap Transactions to Bank Indonesia
14 Bank Indonesia Regulation (PBI) No. 18/14/PBI/2016 22/08/16Fourth Amendment to Bank Indonesia Regulation (PBI) No. 15/15/PBI/2013 concerning Rupiah and Foreign Currency Statutory Reserve Requirements for Conventional Commercial Banks
15 Bank Indonesia Regulation (PBI) No. 18/15/PBI/2016 29/08/16 Management of Rupiah Currency Processing Services
16 Bank Indonesia Regulation (PBI) No. 18/16/PBI/2016 29/08/16Loan-to-Value (LTV) Ratio for Property Loans, Financing-to-Value Ratio (FTV) for Property Financing and Downpayments on Motor Vehicle Loans and Financing
17 Bank Indonesia Regulation (PBI) No. 18/17/PBI/2016 29/08/16 Second Amendment to Bank Indonesia Regulation (PBI) No. 11/12/PBI/2009 concerning Electronic Money
18 Bank Indonesia Regulation (PBI) No. 18/18/PBI/2016 07/09/16 Foreign Currency Transactions against the Rupiah between Banks and Domestic Parties
19 Bank Indonesia Regulation (PBI) No. 18/19/PBI/2016 07/09/16 Foreign Currency Transactions against the Rupiah between Banks and Foreign Parties
20 Bank Indonesia Regulation (PBI) No. 18/20/PBI/2016 07/10/16 Nonbank Foreign Currency Exchange Businesses (Money Changers)
21 Bank Indonesia Regulation (PBI) No. 18/21/PBI/2016 07/10/16 Amendment to Bank Indonesia Regulation (PBI) No. 9/14/PBI/2007 concerning the Debtor Information System (DIS)
22 Bank Indonesia Regulation (PBI) No. 18/22/PBI/2016 27/10/16 Issuance of 2016 Emission Year 50,000 (Fifty Thousand) Rupiah Banknotes
23 Bank Indonesia Regulation (PBI) No. 18/23/PBI/2016 27/10/16 Issuance of 2016 Emission Year 10,000 (Ten Thousand) Rupiah Banknotes
24 Bank Indonesia Regulation (PBI) No. 18/24/PBI/2016 27/10/16 Issuance of 2016 Emission Year Uncut 50,000 (Fifty Thousand) Rupiah Banknotes
25 Bank Indonesia Regulation (PBI) No. 18/25/PBI/2016 27/10/16 Issuance of 2016 Emission Year Uncut 10,000 (Ten Thousand) Rupiah Banknotes
26 Bank Indonesia Regulation (PBI) No. 18/26/PBI/2016 27/10/16 Issuance of 2016 Emission Year 1,000 (One Thousand) Rupiah Coins
27 Bank Indonesia Regulation (PBI) No. 18/27/PBI/2016 27/10/16 Issuance of 2016 Emission Year 500 (Five Hundred) Rupiah Coins
28 Bank Indonesia Regulation (PBI) No. 18/28/PBI/2016 27/10/16 Issuance of 2016 Emission Year 200 (Two Hundred) Rupiah Coins
29 Bank Indonesia Regulation (PBI) No. 18/29/PBI/2016 28/10/16 Issuance of 2016 Emission Year 100,000 (One Hundred Thousand) Rupiah Banknotes
30 Bank Indonesia Regulation (PBI) No. 18/30/PBI/2016 28/10/16 Issuance of 2016 Emission Year 20,000 (Twenty Thousand) Rupiah Banknotes
31 Bank Indonesia Regulation (PBI) No. 18/31/PBI/2016 28/10/16 Issuance of 2016 Emission Year 5,000 (Five Thousand) Rupiah Banknotes
32 Bank Indonesia Regulation (PBI) No. 18/32/PBI/2016 28/10/16 Issuance of 2016 Emission Year 2,000 (Two Thousand) Rupiah Banknotes
33 Bank Indonesia Regulation (PBI) No. 18/33/PBI/2016 28/10/16 Issuance of 2016 Emission Year 1,000 (One Thousand) Rupiah Banknotes
34 Bank Indonesia Regulation (PBI) No. 18/34/PBI/2016 28/10/16 Issuance of 2016 Emission Year Uncut 100,000 (One Hundred Thousand) Rupiah Banknotes
35 Bank Indonesia Regulation (PBI) No. 18/35/PBI/2016 28/10/16 Issuance of 2016 Emission Year Uncut 20,000 (Twenty Thousand) Rupiah Banknotes

2512016 ECONOMIC REPORT ON INDONESIA Appendices
Tables
Number Title
Table 1 Gross Domestic Product by Expenditures
Table 2 Gross Domestic Product by Industrial Origin at Constant Prices
Table 3 Gross Domestic Product by Industrial Origin at Current Prices
Table 4 Monthly Minimum Wages/Earnings by Province
Table 5 Indonesia’s Consumer Price Index
Table 6 Consumer Price Index from 82 cities
Table 7 Indonesia’s Wholesale Price Indices
Table 8 Indonesia’s Balance of Payments
Table 9 Value of Non-Oil and Gas Export By Commodities
Table 10 Volume of Non Oil and Gas Export by Commodities
Table 11 Value of Non-Oil and Gas Export By Country of Destination (fob)
Table 12 Value of Import By Broad Economic Categories
Table 13 Value of Non-Oil and Gas Import By Commodities (cif)
Table 14 Volume of Non-Oil and Gas Import By Commodity
Table 15 Value of Non-Oil and Gas Import By Country of Origin (CIF)
Table 16 Value of Oil and Gas Export (fob)
Table 17 Money Supply
Table 18 Changes in Money Supply and Its Affecting Factors
Table 19 Interest Rate on Time Deposits in Rupiah and Foreign Currency by Group of Banks
Table 20 Interest Rates of Credit on Rupiah (IDR) by Group of Banks
Table 21 Flow of Bank Notes within Bank Indonesia Head Office and Regional Offices
2016 Bank Indonesia Regulations
No. Regulation Date Corcerning
36 Bank Indonesia Regulation (PBI) No. 18/36/PBI/2016 28/10/16 Issuance of 2016 Emission Year Uncut 5,000 (Five Thousand) Rupiah Banknotes
37 Bank Indonesia Regulation (PBI) No. 18/37/PBI/2016 28/10/16 Issuance of 2016 Emission Year Uncut 2,000 (Two Thousand) Rupiah Banknotes
38 Bank Indonesia Regulation (PBI) No. 18/38/PBI/2016 28/10/16 Issuance of 2016 Emission Year Uncut 1,000 (One Thousand) Rupiah Banknotes
39 Bank Indonesia Regulation (PBI) No. 18/39/PBI/2016 28/10/16 Issuance of 2016 Emission Year 100 (One Hundred) Rupiah Coins
40 Bank Indonesia Regulation (PBI) No. 18/40/PBI/2016 09/11/16 Implementation of Payment Transaction Processing
41 Bank Indonesia Regulation (PBI) No. 18/41/PBI/2016 22/11/16 Bilyet Giro (Payment Order)
42 Bank Indonesia Regulation (PBI) No. 18/42/PBI/2016 30/11/16 Formulation of Regulations at Bank Indonesia
43 Bank Indonesia Regulation (PBI) No. 18/43/PBI/2016 28/12/16Amendment to Bank Indonesia Regulation (PBI) No. 8/29/PBI/2006 concerning the National Blacklist of Bad Cheque and/or Bilyet Giro Withdrawals
252 2016 ECONOMIC REPORT ON INDONESIAAppendices
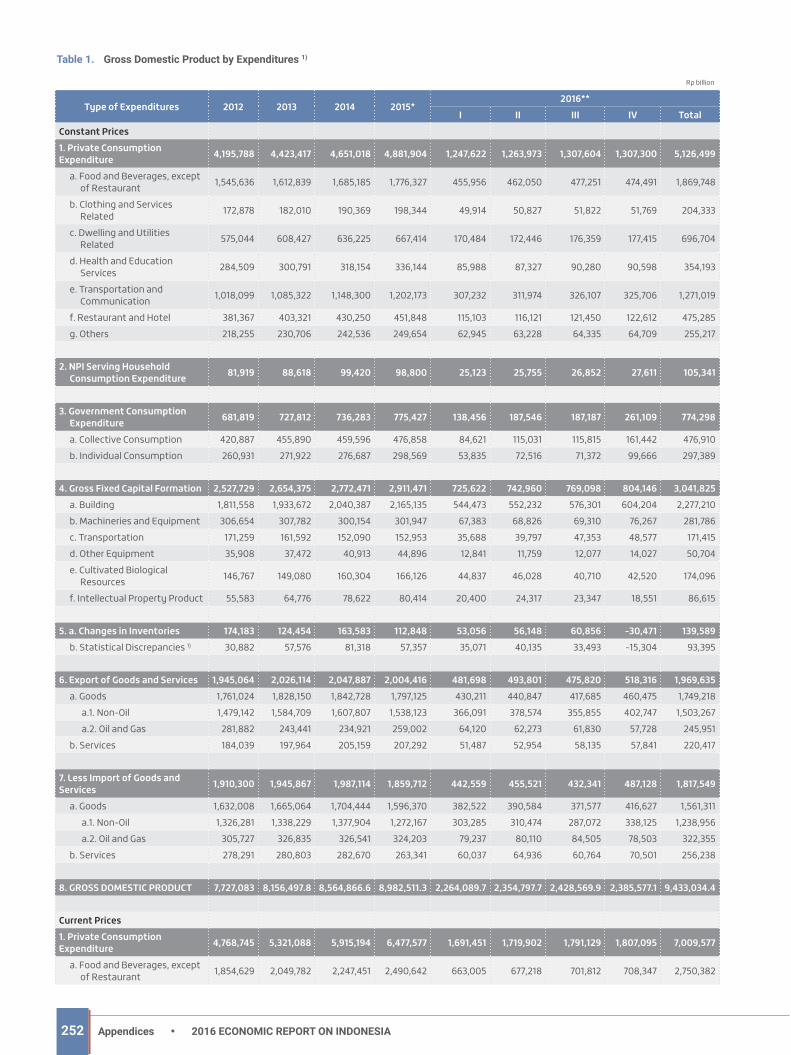
Gross Domestic Product by Expenditures 1)Table 1.
Rp billion
Type of Expenditures 2012 2013 2014 2015*2016**
I II III IV TotalConstant Prices1. Private Consumption Expenditure 4,195,788 4,423,417 4,651,018 4,881,904 1,247,622 1,263,973 1,307,604 1,307,300 5,126,499
a. Food and Beverages, except of Restaurant 1,545,636 1,612,839 1,685,185 1,776,327 455,956 462,050 477,251 474,491 1,869,748
b. Clothing and Services Related 172,878 182,010 190,369 198,344 49,914 50,827 51,822 51,769 204,333
c. Dwelling and Utilities Related 575,044 608,427 636,225 667,414 170,484 172,446 176,359 177,415 696,704
d. Health and Education Services 284,509 300,791 318,154 336,144 85,988 87,327 90,280 90,598 354,193
e. Transportation and Communication 1,018,099 1,085,322 1,148,300 1,202,173 307,232 311,974 326,107 325,706 1,271,019
f. Restaurant and Hotel 381,367 403,321 430,250 451,848 115,103 116,121 121,450 122,612 475,285g. Others 218,255 230,706 242,536 249,654 62,945 63,228 64,335 64,709 255,217
2. NPI Serving Household Consumption Expenditure 81,919 88,618 99,420 98,800 25,123 25,755 26,852 27,611 105,341
3. Government Consumption Expenditure 681,819 727,812 736,283 775,427 138,456 187,546 187,187 261,109 774,298
a. Collective Consumption 420,887 455,890 459,596 476,858 84,621 115,031 115,815 161,442 476,910b. Individual Consumption 260,931 271,922 276,687 298,569 53,835 72,516 71,372 99,666 297,389
4. Gross Fixed Capital Formation 2,527,729 2,654,375 2,772,471 2,911,471 725,622 742,960 769,098 804,146 3,041,825a. Building 1,811,558 1,933,672 2,040,387 2,165,135 544,473 552,232 576,301 604,204 2,277,210b. Machineries and Equipment 306,654 307,782 300,154 301,947 67,383 68,826 69,310 76,267 281,786c. Transportation 171,259 161,592 152,090 152,953 35,688 39,797 47,353 48,577 171,415d. Other Equipment 35,908 37,472 40,913 44,896 12,841 11,759 12,077 14,027 50,704e. Cultivated Biological
Resources 146,767 149,080 160,304 166,126 44,837 46,028 40,710 42,520 174,096
f. Intellectual Property Product 55,583 64,776 78,622 80,414 20,400 24,317 23,347 18,551 86,615
5. a. Changes in Inventories 174,183 124,454 163,583 112,848 53,056 56,148 60,856 -30,471 139,589b. Statistical Discrepancies 1) 30,882 57,576 81,318 57,357 35,071 40,135 33,493 -15,304 93,395
6. Export of Goods and Services 1,945,064 2,026,114 2,047,887 2,004,416 481,698 493,801 475,820 518,316 1,969,635a. Goods 1,761,024 1,828,150 1,842,728 1,797,125 430,211 440,847 417,685 460,475 1,749,218
a.1. Non-Oil 1,479,142 1,584,709 1,607,807 1,538,123 366,091 378,574 355,855 402,747 1,503,267a.2. Oil and Gas 281,882 243,441 234,921 259,002 64,120 62,273 61,830 57,728 245,951
b. Services 184,039 197,964 205,159 207,292 51,487 52,954 58,135 57,841 220,417
7. Less Import of Goods and Services 1,910,300 1,945,867 1,987,114 1,859,712 442,559 455,521 432,341 487,128 1,817,549
a. Goods 1,632,008 1,665,064 1,704,444 1,596,370 382,522 390,584 371,577 416,627 1,561,311a.1. Non-Oil 1,326,281 1,338,229 1,377,904 1,272,167 303,285 310,474 287,072 338,125 1,238,956a.2. Oil and Gas 305,727 326,835 326,541 324,203 79,237 80,110 84,505 78,503 322,355
b. Services 278,291 280,803 282,670 263,341 60,037 64,936 60,764 70,501 256,238
8. GROSS DOMESTIC PRODUCT 7,727,083 8,156,497.8 8,564,866.6 8,982,511.3 2,264,089.7 2,354,797.7 2,428,569.9 2,385,577.1 9,433,034.4
Current Prices1. Private Consumption Expenditure 4,768,745 5,321,088 5,915,194 6,477,577 1,691,451 1,719,902 1,791,129 1,807,095 7,009,577
a. Food and Beverages, except of Restaurant 1,854,629 2,049,782 2,247,451 2,490,642 663,005 677,218 701,812 708,347 2,750,382

2532016 ECONOMIC REPORT ON INDONESIA Appendices
Gross Domestic Product by Expenditures 1) - Continued
Type of Expenditures 2012 2013 2014 2015*2016**
I II III IV Totalb. Clothing and Services
Related 187,041 203,088 221,633 239,249 61,621 63,607 65,480 64,897 255,606
c. Dwelling and Utilities Related 637,060 705,522 774,867 850,102 218,867 221,601 228,323 231,291 900,082
d. Health and Education Services 327,738 359,752 394,268 433,991 113,281 115,371 121,874 122,541 473,066
e. Transportation and Communication 1,085,926 1,246,467 1,420,289 1,508,760 385,848 389,418 409,073 411,177 1,595,515
f. Restaurant and Hotel 443,100 499,346 570,465 636,739 166,114 168,770 178,080 180,785 693,749g. Others 233,251 257,131 286,222 318,094 82,715 83,917 86,486 88,058 341,177
2. NPI Serving Household Consumption Expenditure 89,586 103,929 124,242 130,951 34,088 35,098 36,923 38,360 144,470
3. Government Consumption Expenditure 796,848 908,574 996,197 1,124,812 201,147 290,750 289,888 390,635 1,172,420
a. Collective Consumption 492,963 568,131 622,774 692,657 123,153 178,293 179,214 242,831 723,492b. Individual Consumption 303,885 340,443 373,423 432,155 77,994 112,457 110,674 147,804 448,929
4. Gross Fixed Capital Formation 2,819,026 3,051,496 3,436,924 3,782,143 962,048 985,791 1,021,403 1,071,255 4,040,498a. Building 2,053,896 2,242,780 2,569,122 2,844,115 725,013 735,733 768,627 807,866 3,037,240b. Machineries and Equipment 329,147 343,132 357,548 377,519 86,722 89,272 89,820 99,060 364,874c. Transportation 179,039 172,446 163,609 173,924 43,156 48,136 57,585 59,418 208,295d. Other Equipment 38,480 41,709 49,215 59,047 17,406 15,882 16,440 19,213 68,941e. Cultivated Biological
Resources 159,227 177,280 201,676 225,516 63,282 65,000 57,753 60,659 246,694
f. Intellectual Property Product 59,236 74,149 95,753 102,023 26,470 31,768 31,178 25,039 114,454
5. a. Changes in Inventories 202,638 178,091 220,231 158,754 80,588 86,769 94,587 -47,839 214,105b. Statistical Discrepancies 1) -27,181 58,392 -44,000 -191,993 -53,621 -56,636 -61,042 -99,116 -270,415
6. Export of Goods and Services 2,118,979 2,283,777 2,501,425 2,439,107 557,905 585,087 571,669 652,671 2,367,332a. Goods 1,918,040 2,044,358 2,223,342 2,131,563 480,495 505,485 484,493 565,000 2,035,473
a.1. Non-Oil 1,572,451 1,703,499 1,869,262 1,884,921 433,942 465,221 442,688 520,273 1,862,123a.2. Oil and Gas 345,589 340,859 354,080 246,642 46,553 40,263 41,805 44,728 173,349
b. Services 200,939 239,419 278,083 307,543 77,410 79,602 87,176 87,671 331,859
7. Less Import of Goods and Services 2,152,937 2,359,212 2,580,508 2,389,633 542,161 571,626 539,106 618,285 2,271,178
a. Goods 1,850,040 2,012,940 2,177,253 1,963,460 443,898 466,071 441,427 503,429 1,854,825a.1. Non-Oil 1,439,293 1,523,386 1,652,229 1,625,136 389,632 400,063 372,773 435,677 1,598,146a.2. Oil and Gas 410,747 489,554 525,024 338,325 54,265 66,007 68,654 67,752 256,679
b. Services 302,897 346,272 403,255 426,172 98,263 105,555 97,678 114,856 416,353
8. GROSS DOMESTIC PRODUCT 8,615,705 9,546,134 10,569,705 11,531,717 2,931,446 3,075,135 3,205,452 3,194,776 12,406,810
Notes: 1) Since year 2010, GDP figures are using 2010=100 as a base year*) Preliminary figures**) Very Preliminary figures Source: BPS-Statistics Indonesia

254 2016 ECONOMIC REPORT ON INDONESIAAppendices
Gross Domestic Product by Industrial Origin at Constant Prices 1)Table 2.
Rp billion
Industrial Origin 2012 2013 2014 2015*2016**
I II III IV TOTALAgriculture, Forestry and Fishery 1,039,441 1,083,142 1,129,052.7 1,171,578.7 286,159.5 321,669.8 336,680.9 265,177.0 1,209,687.2Agriculture, Livestock, Hunting, and Agriculture Services 816,304 847,764 880,389.5 906,804.5 220,614.5 253,125.2 267,538.7 194,176.7 935,455.1
Food crops 263,076 268,268 268,426.9 280,018.8 77,897.6 82,960.1 80,606.5 45,636.5 287,100.7Horticultural crops 117,425 118,208 124,300.9 127,110.0 30,399.4 34,974.2 36,229.7 28,923.8 130,527.1Plantation crops 301,020 319,533 338,502.2 345,164.9 72,979.4 95,212.0 109,302.7 79,740.7 357,234.8Livestock 119,250 125,302 132,221.1 136,936.4 34,873.1 35,229.7 36,351.6 36,005.2 142,459.6Agricultural Services and Hunting 15,534 16,453 16,938.4 17,574.4 4,465.0 4,749.2 5,048.2 3,870.5 18,132.9
Forestry and Logging 58,872 59,229 59,573.5 60,757.4 13,468.1 16,010.9 15,011.6 15,218.3 59,708.9Fishery 164,264 176,149 189,089.7 204,016.8 52,076.9 52,533.7 54,130.6 55,782.0 214,523.2
Mining and Quarrying 771,562 791,054 794,489.5 767,327.2 195,814.8 191,093.0 192,193.1 196,384.7 775,485.6Crude Petroleum, Natural Gas, and Geothermal 323,632 313,328 307,161.7 307,325.8 80,220.9 78,452.3 78,623.9 78,206.4 315,503.5
Coal and Lignite Mining 230,589 247,595 251,073.6 232,725.3 57,630.2 54,441.1 53,582.6 57,444.7 223,098.6Iron Ore mining 91,615 98,609 98,257.9 87,702.9 21,128.7 21,358.1 23,142.1 23,674.3 89,303.2Other Mining and Quarrying 125,726 131,523 137,996.3 139,573.2 36,835.0 36,841.5 36,844.5 37,059.3 147,580.3
Manufacturing 1,697,787 1,771,962 1,854,256.7 1,934,533.2 490,175.7 507,499.7 511,699.1 508,180.6 2,017,555.1Manufacture of Coal and Refined Petroleum Products 227,456 221,450 216,750.8 214,312.0 55,378.0 55,427.5 55,799.5 54,657.6 221,262.6
Manufacture of Food Products and Beverages 441,342 459,283 502,856.2 540,756.4 136,633.8 149,825.5 152,327.3 147,732.4 586,519.0
Manufacture of Tobacco Products 73,011 72,814 78,878.7 83,798.7 20,433.6 21,213.9 21,523.8 22,003.2 85,174.5Manufacture of Textiles and Wearing Apparel 108,754 115,913 117,723.4 112,078.9 28,014.1 28,314.2 27,721.4 27,882.0 111,931.7
Manufacture of Leather and Related Products and Footwear 20,665 21,746 22,967.7 23,879.2 6,279.8 6,506.4 6,409.5 6,630.4 25,826.1
Manufacture of Wood and Products of Wood and Cork, Articles of Straw and Plaiting Materials
54,787 58,181 61,742.5 60,735.4 15,824.4 15,729.6 15,140.0 15,137.1 61,831.1
Manufacture of Paper and Paper products Printing and Reproduction of Recorded Media
68,590 68,229 70,670.1 70,556.8 17,239.1 18,536.9 18,460.6 17,843.0 72,079.6
Manufacture of Chemicals and Pharmaceuticals and Botanical Products
140,102 147,249 153,191.9 164,843.0 41,433.7 43,079.4 44,520.0 44,836.4 173,869.5
Manufacture of Rubber, Rubber Products, and Plastic Products 73,307 71,946 72,777.3 76,442.1 17,525.3 17,467.7 17,132.6 17,938.6 70,064.2
Manufacture of Other Nonmetallic Mineral Products 59,252 61,229 62,706.8 66,485.2 17,006.0 17,199.4 17,933.8 17,972.9 70,112.1
Manufacture of Basic Metals 60,889 67,972 72,059.1 76,532.1 20,028.9 19,320.1 18,560.2 19,206.2 77,115.4Manufacture of Fabricated Metal Products, Computer, Optical Products, and Electronic Devices
158,804 173,452 178,544.2 192,528.0 49,947.0 49,163.5 50,868.6 50,912.5 200,891.6
Manufacture of Machinery and Equipment 25,437 24,164 26,259.7 28,250.5 7,441.4 7,538.0 7,536.7 7,161.3 29,677.4
Manufacture of Transport Equipment 148,905 171,166 178,022.5 182,289.1 46,910.7 47,813.9 47,636.1 48,164.2 190,524.9
Manufacture of Furniture 21,589 22,375 23,179.9 24,377.4 6,020.2 6,271.5 6,098.4 6,102.4 24,492.5Other Manufacturing, Repair and Installation of Machinery and Equipment
14,897 14,794 15,925.9 16,668.4 4,059.7 4,092.2 4,030.6 4,000.4 16,182.9

2552016 ECONOMIC REPORT ON INDONESIA Appendices
Gross Domestic Product by Industrial Origin at Constant Prices 1) - Continued
Industrial Origin 2012 2013 2014 2015*2016**
I II III IV TOTALElectricity and Gas Supply 84,393 88,805 94,047.2 94,894.8 24,425.4 25,208.1 24,673.3 25,703.1 100,009.9Electricity 70,827 75,051 79,581.5 81,407.0 21,093.3 21,907.9 21,369.0 22,210.1 86,580.3Gas Supply and Production of Ice 13,567 13,754 14,465.7 13,487.8 3,332.1 3,300.2 3,304.3 3,493.0 13,429.6
Water Supply, Sewerage, Waste Management and Remediation Activities
6,330 6,540 6,882.5 7,369.0 1,870.9 1,907.7 1,916.3 1,939.7 7,634.6
Construction 728,226 772,720 826,615.6 879,163.9 220,736.9 224,166.1 234,722.7 245,436.8 925,062.5
Wholesale and Retail Trades, Repair of Motor Vehicles and Motorcycles
1,067,912 1,119,272 1,177,297.5 1,207,751.1 302,856.8 314,954.7 319,337.7 318,075.7 1,255,224.9
Wholesale and Retail Trade and Repair of Motor Vehicles and Motorcycles
203,431 218,291 229,228.4 229,967.5 58,891.0 59,744.0 59,622.6 60,341.9 238,599.5
Wholesale and Retail Trades, except of Motor Vehicles and Motorcycles
864,481 900,981 948,069.1 977,783.6 243,965.8 255,210.7 259,715.1 257,733.8 1,016,625.4
Transport and Storage 284,663 304,506 326,933.0 348,773.8 89,459.5 91,779.8 96,730.7 97,794.4 375,764.4Railways Transport 2,202 2,337 2,823.1 2,948.6 736.6 740.8 781.2 792.0 3,050.6Land Transport 155,852 167,560 180,367.4 193,257.0 50,254.3 50,920.3 53,103.4 53,645.0 207,923.0Sea Transport 25,601 27,372 29,473.7 30,173.7 7,263.2 7,590.1 7,859.3 7,838.3 30,550.9River, Lake and Ferry Transport 9,057 9,469 10,117.6 10,222.2 2,491.1 2,531.3 2,646.8 2,702.7 10,371.9Air Transport 47,030 49,263 52,255.1 57,188.9 14,863.7 15,567.7 17,010.8 17,341.6 64,783.8Warehousing and Support Services for Transportation, Postal and Courier
44,921 48,505 51,896.1 54,983.4 13,850.6 14,429.6 15,329.2 15,474.8 59,084.2
Accommodation and Food Service Activities 228,233 243,748 257,815.5 268,922.4 69,193.3 69,943.2 70,882.1 72,181.8 282,200.4
Accommodation 43,567 47,700 51,426.7 54,340.3 13,929.3 14,121.8 14,344.3 14,836.8 57,232.2Food and Beverages Service Activities 184,665 196,049 206,388.8 214,582.1 55,264.0 55,821.4 56,537.8 57,345.0 224,968.2
Information and Communication 316,279 349,150 384,475.6 421,741.4 109,401.8 113,754.9 116,990.0 119,022.9 459,169.6
Financial and Insurance Services 280,896 305,515 319,825.5 347,308.6 92,058.2 93,905.4 96,525.3 95,745.8 378,234.7Financial Intermediary Services 175,168 192,098 197,712.2 216,631.2 58,155.4 58,746.1 61,032.7 59,962.2 237,896.4Insurance and Pension Fund 60,045 64,661 69,794.6 74,398.1 19,059.5 20,042.5 20,060.6 20,067.6 79,230.2Other Financial Services 38,868 41,372 44,464.7 48,013.8 12,763.0 12,971.0 13,239.6 13,475.5 52,449.1Financial Supporting Services 6,815 7,384 7,854.0 8,265.5 2,080.3 2,145.8 2,192.4 2,240.5 8,659.0
Real Estate Activities 229,254 244,238 256,440.2 266,979.6 68,888.1 69,557.3 69,868.9 70,158.6 278,472.9
Business Services 116,293 125,491 137,795.3 148,395.5 38,997.4 39,480.4 40,097.8 40,746.1 159,321.7
Public Administration and Defence; Compulsory Social Security
282,235 289,449 296,329.7 310,054.2 77,810.0 78,086.4 79,379.7 84,676.9 319,953.0
Education 232,704 250,016 263,685.0 283,020.1 68,777.0 73,073.0 72,139.8 79,887.8 293,877.6

256 2016 ECONOMIC REPORT ON INDONESIAAppendices
Industrial Origin 2012 2013 2014 2015*2016**
I II III IV TOTALHuman Health and Social Work Activities 78,380 84,621 91,357.1 97,463.0 24,828.5 25,147.3 25,306.5 27,056.0 102,338.3
Other Services Activities 115,675 123,083 134,070.1 144,902.4 37,919.7 38,665.2 39,417.8 40,195.8 156,198.5Gross Value Added At Basic Price 7,560,263 7,953,312 8,351,368.7 8,700,178.9 2,199,373.5 2,279,892.0 2,328,561.7 2,288,363.7 9,096,190.9Taxes less Subsides on Products 166,821 203,186 213,497.9 282,332.4 64,716.2 74,905.7 100,008.2 97,213.4 336,843.5
Gross Domestic Product 7,727,083 8,156,498 8,564,866.6 8,982,511.3 2,264,089.7 2,354,797.7 2,428,569.9 2,385,577.1 9,433,034.4
Notes:1) Since year 2010, GDP figures are using 2010=100 as a base year*) Preliminary figures**) Very Preliminary figures Source: BPS-Statistics Indonesia
Gross Domestic Product by Industrial Origin at Constant Prices 1) - Continued

2572016 ECONOMIC REPORT ON INDONESIA Appendices
Gross Domestic Product by Industrial Origin at Current Prices 1)Table 3.
Rp billion
Industrial OriginConstant Prices
2012 2013 2014 2015* 2016**Agriculture, Forestry and Fishery 1,152,262 1,275,048 1,409,656 1,555,747 1,668,998Agriculture, Livestock, Hunting, and Agriculture Services 902,126 994,778 1,089,550 1,183,971 1,266,361
Food crops 305,671 332,112 343,252 397,409 424,898Horticultural crops 125,108 137,369 160,569 174,454 186,909Plantation crops 323,362 358,172 398,261 405,292 429,682Livestock 130,614 147,982 167,008 184,152 200,611Agricultural Services and Hunting 17,372 19,143 20,460 22,666 24,261
Forestry and Logging 65,882 69,599 74,618 82,860 85,545Fishery 184,254 210,671 245,488 288,917 317,092
Mining and Quarrying 1,000,308 1,050,746 1,039,423 881,694 893,947Crude Petroleum, Natural Gas, and Geothermal 492,894 520,088 509,783 384,516 369,354Coal and Lignite Mining 270,519 282,193 259,767 229,974 231,698Iron Ore mining 100,845 98,468 93,615 74,264 73,301Other Mining and Quarrying 136,050 149,996 176,258 192,940 219,595
Manufacturing 1,848,151 2,007,427 2,227,584 2,418,376 2,544,576Manufacture of Coal and Refined Petroleum Products 298,403 314,216 337,201 320,330 286,061Manufacture of Food Products and Beverages 457,773 491,142 562,017 647,072 741,734Manufacture of Tobacco Products 79,340 82,684 95,668 108,652 117,163Manufacture of Textiles and Wearing Apparel 116,558 129,912 139,032 139,394 143,481Manufacture of Leather and Related Products and Footwear 21,687 24,810 28,600 31,441 35,145
Manufacture of Wood and Products of Wood and Cork, Articles of Straw and Plaiting Materials 60,629 66,958 76,072 77,993 80,133
Manufacture of Paper and Paper products, Printing and Reproduction of Recorded Media 73,665 74,319 84,373 87,760 89,246
Manufacture of Chemicals and Pharmaceuticals; and Botanical Products 143,460 157,042 180,037 209,788 222,597
Manufacture of Rubber, Rubber Products and Plastic Products 76,425 76,466 80,263 85,951 79,243
Manufacture of Other Nonmetallic Mineral Products 63,028 69,401 76,852 83,371 89,048Manufacture of Basic Metals 64,557 74,495 82,119 90,159 89,352Manufacture of Fabricated Metal Products, Computer, Optical Products and Electronic Devices 162,970 186,195 198,081 226,678 241,794
Manufacture of Machinery and Equipment 24,832 25,504 33,079 37,288 40,171Manufacture of Transport Equipment 166,391 192,768 207,401 220,511 236,568Manufacture of Furniture 22,487 24,931 28,118 31,340 32,126Other Manufacturing, Repair and Installation of Machinery and Equipment 15,947 16,584 18,673 20,649 20,716
Electricity and Gas Supply 95,638 98,687 114,905 131,250 142,772Electricity 73,350 74,358 84,151 102,069 113,049Gas Supply and Production of Ice 22,288 24,329 30,754 29,182 29,723
Water Supply, Sewerage, Waste Management and Remediation Activities
6,604 7,209 7,841 8,546 8,948
Construction 805,208 905,991 1,041,950 1,177,084 1,287,659
Wholesale and Retail Trades, Repair of Motor Vehicles and Motorcycles
1,138,484 1,261,146 1,419,239 1,535,288 1,635,960
Wholesale and Retail Trade and Repair of Motor Vehicles and Motorcycles 228,667 258,942 292,839 311,606 334,100

258 2016 ECONOMIC REPORT ON INDONESIAAppendices
Gross Domestic Product by Industrial Origin at Current Prices 1) - Continued
Industrial OriginConstant Prices
2012 2013 2014 2015* 2016**Wholesale and Retail Trades, except of Motor Vehicles and Motorcycles 909,818 1,002,203 1,126,400 1,223,682 1,301,860
Transport and Storage 313,156 375,306 466,969 579,060 647,154Railways Transport 2,783 3,143 4,228 6,358 6,928Land Transport 159,226 190,201 225,882 283,222 305,024Sea Transport 26,615 30,062 36,075 39,307 39,907River, Lake and Ferry Transport 9,780 11,165 13,137 14,267 14,185Air Transport 62,201 77,722 108,792 142,536 176,549Warehousing and Support Services for Transportation, Postal and Courier 52,552 63,014 78,855 93,370 104,561
Accommodation and Food Service Activities 252,612 289,498 321,062 341,556 362,232Accommodation 51,052 63,489 74,255 80,791 86,108Food and Beverages Service Activities 201,560 226,009 246,807 260,765 276,125
Information and Communication 311,362 341,009 369,457 405,992 449,141
Financial and Insurance Services 320,534 370,132 408,439 465,020 520,926Financial Intermediary Services 204,479 237,170 256,029 291,510 328,161Insurance and Pension Fund 65,882 76,005 87,337 99,041 109,269Other Financial Services 42,688 48,279 55,245 63,465 71,825Financial Supporting Services 7,485 8,679 9,829 11,003 11,672
Real Estate Activities 237,914 264,275 294,573 327,601 348,298
Business Services 127,724 144,604 165,991 190,268 211,624
Public Administration and Defence; Compulsory Social Security 340,568 372,195 404,630 450,233 478,636
Education 270,372 307,862 341,818 388,042 418,258
Human Health and Social Work Activities 86,235 96,881 109,147 122,928 132,428
Other Services Activities 122,566 140,316 163,549 190,580 212,220
GROSS DOMESTIC PRODUCT 8,615,705 9,546,134 10,569,705 11,531,717 12,406,810
1) Since year 2010, GDP figures using 2010=100 as a base year*) Preliminary figures **) Very preliminary figures Source: BPS-Statistics Indonesia

2592016 ECONOMIC REPORT ON INDONESIA Appendices
Monthly Minimum Wages/Earnings by Province
Table 4.
Province 2011 2012 2013 2014 2015 2016
Nanggroe Aceh Darussalam 1,350,000 1,400,000 1,550,000 1,750,000 1,900,000 2,118,500North Sumatra 1,035,500 1,200,000 1,375,000 1,505,850 1,625,000 1,811,875West Sumatra 1,055,000 1,150,000 1,350,000 1,490,000 1,615,000 1,800,725Riau 1,120,000 1,238,000 1,400,000 1,700,000 1,878,000 2,095,000Riau Islands 975,000 1,015,000 1,365,087 1,665,000 1,954,000 2,178,710Jambi 1,028,000 1,142,000 1,300,000 1,502,230 1,710,000 1,906,650South Sumatra 1,048,440 1,195,220 1,630,000 1,825,600 1,974,346 2,206,000Bangka Belitung 1,024,000 1,110,000 1,265,000 1,640,000 2,100,000 2,341,500Bengkulu 815,000 930,000 1,200,000 1,350,000 1,500,000 1,605,000Lampung 855,000 975,000 1,150,000 1,399,037 1,581,000 1,763,000Banten 1,000,000 1,042,000 1,170,000 1,325,000 1,600,000 1,784,000DKI Jakarta 1,290,000 1,529,150 2,200,000 2,441,301 2,700,000 3,100,000West Java 732,000 780,000 850,000 1,000,000 1,131,862 2,250,000Central Java 675,000 720,000 830,000 910,000 1,100,000 1,265,000D.I. Yogyakarta 808,000 892,660 947,114 988,500 1,108,249 1,235,700East Java 705,000 745,000 866,250 1,000,000 1,150,000 1,283,000Bali 890,000 967,500 1,181,000 1,542,600 1,621,172 1,807,600West Nusa Tenggara 950,000 1,000,000 1,100,000 1,210,000 1,330,000 1,482,950East Nusa Tenggara 850,000 925,000 1,010,000 1,150,000 1,250,000 1,425,000West Kalimantan 802,500 900,000 1,060,000 1,380,000 1,560,000 1,739,400Central Kalimantan 1,134,580 1,327,459 1,550,000 1,723,970 1,896,367 2,057,550South Kalimantan 1,126,000 1,225,000 1,337,000 1,620,000 1,870,000 2,085,050East Kalimantan 1,084,000 1,177,000 1,752,073 1,886,315 2,026,126 2,161,253North Kalimantan - - - - 2,026,126 2,175,340North Sulawesi 1,050,000 1,250,000 1,550,000 1,900,000 2,150,000 2,400,000Central Sulawesi 827,500 885,000 995,000 1,250,000 1,500,000 1,670,000South Sulawesi 1,100,000 1,200,000 1,440,000 1,800,000 2,000,000 2,250,000South East Sulawesi 930,000 1,032,300 1,125,207 1,400,000 1,652,000 1,850,000West Sulawesi 1,006,000 1,127,000 1,165,000 1,400,000 1,655,500 1,864,000Maluku 900,000 975,000 1,275,000 1,415,000 1,650,000 1,775,000North Maluku 889,350 960,498 1,200,622 1,440,746 1,577,617 1,681,266Gorontalo 762,500 837,500 1,175,000 1,325,000 1,600,000 1,875,000Papua 1,403,000 1,585,000 1,710,000 1,900,000 2,193,000 2,435,000West Papua 1,410,000 1,450,000 1,720,000 1,870,000 2,015,000 2,237,000
Notes:By the decree of Manpower Minister of the Republic of Indonesia No.PER-01/MEN/1999 tahun 1999, at the beginning of each year, the regional minimum wages or Provincial minimum wages stipulated by the Governor of the said province, base on information from each Regional Wage Board of the province
Source: - Ministry of Manpower of the Republic of Indonesia, Direktorat Pengupahan & Jamsostek - Ditjen PHI (Directorate of Wage & Social Security - Directorate General of Industrial Relations and Social Security Workers)- Data of 2011 - 2014: BPS - Statistics Indonesia- Data of 2015-2016 based on decree of its Governor
260 2016 ECONOMIC REPORT ON INDONESIAAppendices
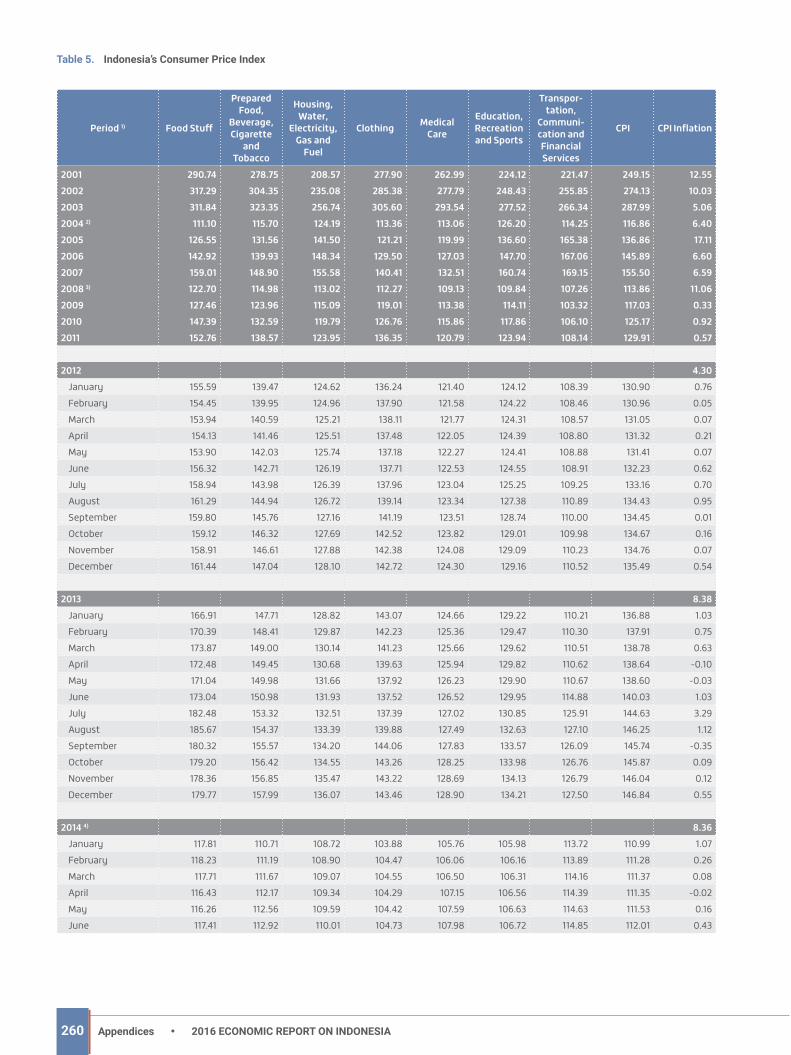
Indonesia’s Consumer Price IndexTable 5.
Period 1) Food Stuff
Prepared Food,
Beverage, Cigarette
and Tobacco
Housing, Water,
Electricity, Gas and
Fuel
Clothing Medical Care
Education, Recreation and Sports
Transpor-tation,
Communi-cation and Financial Services
CPI CPI Inflation
2001 290.74 278.75 208.57 277.90 262.99 224.12 221.47 249.15 12.552002 317.29 304.35 235.08 285.38 277.79 248.43 255.85 274.13 10.032003 311.84 323.35 256.74 305.60 293.54 277.52 266.34 287.99 5.062004 2) 111.10 115.70 124.19 113.36 113.06 126.20 114.25 116.86 6.402005 126.55 131.56 141.50 121.21 119.99 136.60 165.38 136.86 17.112006 142.92 139.93 148.34 129.50 127.03 147.70 167.06 145.89 6.602007 159.01 148.90 155.58 140.41 132.51 160.74 169.15 155.50 6.592008 3) 122.70 114.98 113.02 112.27 109.13 109.84 107.26 113.86 11.062009 127.46 123.96 115.09 119.01 113.38 114.11 103.32 117.03 0.332010 147.39 132.59 119.79 126.76 115.86 117.86 106.10 125.17 0.922011 152.76 138.57 123.95 136.35 120.79 123.94 108.14 129.91 0.57
2012 4.30January 155.59 139.47 124.62 136.24 121.40 124.12 108.39 130.90 0.76February 154.45 139.95 124.96 137.90 121.58 124.22 108.46 130.96 0.05March 153.94 140.59 125.21 138.11 121.77 124.31 108.57 131.05 0.07April 154.13 141.46 125.51 137.48 122.05 124.39 108.80 131.32 0.21May 153.90 142.03 125.74 137.18 122.27 124.41 108.88 131.41 0.07June 156.32 142.71 126.19 137.71 122.53 124.55 108.91 132.23 0.62July 158.94 143.98 126.39 137.96 123.04 125.25 109.25 133.16 0.70August 161.29 144.94 126.72 139.14 123.34 127.38 110.89 134.43 0.95September 159.80 145.76 127.16 141.19 123.51 128.74 110.00 134.45 0.01October 159.12 146.32 127.69 142.52 123.82 129.01 109.98 134.67 0.16November 158.91 146.61 127.88 142.38 124.08 129.09 110.23 134.76 0.07December 161.44 147.04 128.10 142.72 124.30 129.16 110.52 135.49 0.54
2013 8.38January 166.91 147.71 128.82 143.07 124.66 129.22 110.21 136.88 1.03February 170.39 148.41 129.87 142.23 125.36 129.47 110.30 137.91 0.75March 173.87 149.00 130.14 141.23 125.66 129.62 110.51 138.78 0.63April 172.48 149.45 130.68 139.63 125.94 129.82 110.62 138.64 -0.10May 171.04 149.98 131.66 137.92 126.23 129.90 110.67 138.60 -0.03June 173.04 150.98 131.93 137.52 126.52 129.95 114.88 140.03 1.03July 182.48 153.32 132.51 137.39 127.02 130.85 125.91 144.63 3.29August 185.67 154.37 133.39 139.88 127.49 132.63 127.10 146.25 1.12September 180.32 155.57 134.20 144.06 127.83 133.57 126.09 145.74 -0.35October 179.20 156.42 134.55 143.26 128.25 133.98 126.76 145.87 0.09November 178.36 156.85 135.47 143.22 128.69 134.13 126.79 146.04 0.12December 179.77 157.99 136.07 143.46 128.90 134.21 127.50 146.84 0.55
2014 4) 8.36January 117.81 110.71 108.72 103.88 105.76 105.98 113.72 110.99 1.07February 118.23 111.19 108.90 104.47 106.06 106.16 113.89 111.28 0.26March 117.71 111.67 109.07 104.55 106.50 106.31 114.16 111.37 0.08April 116.43 112.17 109.34 104.29 107.15 106.56 114.39 111.35 -0.02May 116.26 112.56 109.59 104.42 107.59 106.63 114.63 111.53 0.16June 117.41 112.92 110.01 104.73 107.98 106.72 114.85 112.01 0.43

2612016 ECONOMIC REPORT ON INDONESIA Appendices
Indonesia’s Consumer Price Index - Continued
Period 1) Food Stuff
Prepared Food,
Beverage, Cigarette
and Tobacco
Housing, Water,
Electricity, Gas and
Fuel
Clothing Medical Care
Education, Recreation and Sports
Transpor-tation,
Communi-cation and Financial Services
CPI CPI Inflation
July 119.69 114.05 110.50 105.62 108.40 107.20 115.86 113.05 0.93August 120.12 114.64 111.31 105.86 108.76 108.89 115.72 113.58 0.47September 119.92 115.23 112.17 105.68 109.07 109.63 115.44 113.89 0.27October 120.22 115.73 113.34 105.90 109.72 109.88 115.62 114.42 0.47November 122.80 116.55 113.90 105.81 110.19 109.97 120.58 116.14 1.50December 126.76 118.84 115.55 106.49 111.00 110.37 127.27 119.00 2.46
2015 3.35January 127.52 119.61 116.48 107.39 111.73 110.66 122.13 118.71 -0.24February 125.65 120.15 116.96 107.95 112.17 110.81 120.26 118.28 -0.36March 124.73 120.88 117.30 107.86 112.89 110.92 121.19 118.48 0.17April 123.75 121.48 117.56 108.12 113.32 110.98 123.37 118.91 0.36May 125.47 122.09 117.80 108.37 113.70 111.05 123.62 119.50 0.50June 127.48 122.76 118.07 108.67 114.06 111.13 123.75 120.14 0.54July 130.06 123.39 118.22 109.09 114.47 111.51 125.90 121.26 0.93August 131.24 124.26 118.41 109.10 115.27 113.43 125.17 121.73 0.39September 129.83 124.75 118.65 110.01 115.78 114.44 124.67 121.67 -0.05October 128.46 125.25 118.76 110.29 116.11 114.62 124.69 121.57 -0.08November 128.89 125.84 118.94 110.04 116.62 114.68 124.76 121.82 0.21December 133.01 126.47 119.41 110.14 116.90 114.75 125.32 122.99 0.96
2016 3.02January 135.93 127.11 120.04 110.43 117.32 114.92 123.93 123.62 0.51February 135.14 127.91 119.50 111.14 117.63 114.99 123.74 123.51 -0.09March 136.07 128.37 119.42 111.75 117.98 115.02 123.47 123.75 0.19April 134.79 128.82 119.26 112.00 118.35 115.05 121.50 123.19 -0.45May 135.19 129.57 119.28 112.49 118.67 115.08 121.76 123.48 0.24June 137.38 130.32 119.46 113.28 119.07 115.12 122.53 124.29 0.66July 138.92 131.03 119.75 113.78 119.51 115.71 124.03 125.15 0.69August 137.98 131.57 120.24 114.24 119.98 117.07 122.76 125.13 -0.02September 137.88 132.02 120.59 114.39 120.38 117.68 122.99 125.41 0.22October 137.59 132.34 121.26 114.04 120.73 117.80 122.95 125.59 0.14November 139.88 132.67 121.46 114.03 121.09 117.82 123.04 126.18 0.47December 140.58 133.27 121.68 113.50 121.48 117.88 124.42 126.71 0.42
2017January 141.51 133.89 123.01 113.87 122.09 118.02 127.35 127.94 0.97
1) Annual/Quarterly data is figures at the end of the reference period2) CPI has been calculated from 45 cities using 2002 = 100 as a base year, and classified into 7 groups3) CPI has been calculated from 66 cities using 2007 = 100 as a base year, and classified into 7 groups, as of June 20084) CPI has been calculated from 82 cities using 2012=100 as a base year, and classified into 7 groups, as of January 2014
Source: BPS-Statistics Indonesia

262 2016 ECONOMIC REPORT ON INDONESIAAppendices
Consumer Price Index from 82 citiesTable 6.
Percent, yoy
City 2010 1) 2011 1) 2012 1) 2013 1) 2014 2) 2015 2) 2016 2)
Meulaboh n.a. n.a. n.a. n.a. 8.20 0.58 3.77Banda Aceh 4.64 3.32 0.06 6.39 7.83 1.27 3.13Lhokseumawe 7.19 3.55 0.39 8.27 8.53 2.44 5.60Sibolga 11.83 3.71 3.30 10.08 8.36 3.34 7.39Pematang Siantar 9.68 4.25 4.73 12.02 7.94 3.36 4.76Medan 7.65 3.54 3.79 10.09 8.24 3.32 6.60Padang Sidempuan 7.42 4.66 3.54 7.82 7.38 1.66 4.28Padang 7.84 5.37 4.16 10.87 11.90 0.85 5.02Bukit Tinggi n.a. n.a. n.a. n.a. 9.24 2.79 3.93Tembilahan n.a. n.a. n.a. n.a. 10.06 2.06 2.58Pekanbaru 7.00 5.09 3.35 8.83 8.53 2.71 4.19Dumai 9.05 3.09 3.21 8.60 8.53 2.63 3.98Bungo n.a. n.a. n.a. n.a. 8.99 1.29 3.11Jambi 10.52 2.76 4.22 8.74 8.72 1.37 4.54Palembang 6.02 3.78 2.72 7.04 8.38 3.05 3.68Lubuk Linggau n.a. n.a. n.a. n.a. 9.34 3.47 2.74Bengkulu 9.08 3.96 4.61 9.94 10.85 3.25 5.00Bandar Lampung 9.95 4.24 4.30 7.56 8.36 4.65 2.75Metro n.a. n.a. n.a. n.a. 6.50 2.67 2.92Tanjung Pandan n.a. n.a. n.a. n.a. 13.15 0.88 4.92Pangkal Pinang 9.36 5.00 6.57 8.71 6.81 4.66 7.78Batam 7.40 3.76 2.02 7.81 7.61 4.73 3.61Tanjung Pinang 6.17 3.32 3.92 10.09 7.49 2.46 3.06Jakarta 6.21 3.97 4.52 8.00 8.95 3.30 2.37Bogor 6.57 2.85 4.06 8.55 6.83 2.70 3.60Sukabumi 5.43 4.26 3.98 8.03 8.38 2.20 2.57Bandung 4.53 2.75 4.02 7.97 7.75 3.93 2.93Cirebon 6.70 3.20 3.36 7.86 7.08 1.56 1.87Bekasi 7.88 3.45 3.46 9.46 7.68 2.22 2.47Depok 7.97 2.94 4.11 10.97 7.49 1.87 2.60Tasikmalaya 5.56 4.17 3.87 6.89 8.09 3.53 2.75Cilacap n.a. n.a. n.a. n.a. 8.18 2.63 2.77Purwokerto 6.04 3.40 4.73 8.50 7.09 2.52 2.42Kudus n.a. n.a. n.a. n.a. 8.59 3.28 2.32Surakarta 6.65 1.93 2.87 8.32 8.01 2.56 2.15Semarang 7.11 2.87 4.85 8.19 8.52 2.56 2.32Tegal 6.73 2.58 3.10 5.80 7.40 3.95 2.71Yogyakarta 7.38 3.88 4.31 7.32 6.59 3.09 2.29Jember 7.09 2.43 4.49 7.21 7.53 2.31 1.93Banyuwangi n.a. n.a. n.a. n.a. 6.59 2.15 1.91Sumenep 6.75 4.18 5.05 6.62 8.04 2.62 2.19Kediri 6.80 3.62 4.63 8.05 7.49 1.71 1.30Malang 6.70 4.05 4.60 7.92 8.14 3.32 2.62Probolinggo 6.68 3.78 5.88 7.98 6.79 2.11 1.53Madiun 6.54 3.49 3.51 7.52 7.39 2.75 2.25Surabaya 7.33 4.72 4.39 7.52 7.90 3.43 3.22Serang 6.18 2.78 4.41 9.16 10.07 4.67 3.26Tangerang 6.08 3.78 4.44 10.02 9.81 4.28 2.65Cilegon 6.12 2.35 3.91 7.98 11.37 3.94 4.22Singaraja n.a. n.a. n.a. n.a. 10.32 2.97 4.57Denpasar 8.10 3.75 4.71 7.35 8.03 2.70 2.94Mataram 11.07 6.38 4.10 9.27 7.18 3.25 2.47

2632016 ECONOMIC REPORT ON INDONESIA Appendices
Consumer Price Index from 82 cities - Continued
City 2010 1) 2011 1) 2012 1) 2013 1) 2014 2) 2015 2) 2016 2)
Bima 6.35 7.19 3.61 10.42 7.37 4.11 3.11Maumere 8.48 6.59 6.49 6.24 4.00 3.89 3.62Kupang 9.97 4.32 5.10 8.84 8.32 5.07 2.31Pontianak 8.52 4.91 6.62 9.48 9.38 6.17 3.88Singkawang 7.10 6.72 4.21 6.15 9.65 4.00 2.58Sampit 9.53 3.60 4.69 7.25 7.90 5.72 2.46Palangkaraya 9.49 5.28 6.73 6.45 6.63 4.20 1.91Tanjung n.a. n.a. n.a. n.a. 8.80 6.69 2.18Banjarmasin 9.06 3.98 5.96 6.98 7.16 5.03 3.68Balikpapan 7.38 6.45 6.41 8.56 7.43 6.26 4.13Samarinda 7.00 6.23 4.81 10.37 6.74 4.24 2.83Tarakan 7.92 6.43 5.99 10.35 11.91 3.42 4.31Manado 6.28 0.67 6.04 8.12 9.67 5.56 0.35Palu 6.40 4.47 5.87 7.57 8.85 4.17 1.49Bulukumba n.a. n.a. n.a. n.a. 9.45 2.17 1.48Watampone 6.74 3.94 3.65 6.86 8.22 0.97 1.50Makassar 6.82 2.87 4.57 6.24 8.51 5.18 3.18Pare-pare 5.78 1.60 3.49 6.31 9.38 1.58 2.11Palopo 3.99 3.35 4.11 5.25 8.95 3.38 2.74Kendari 3.87 5.09 5.25 5.92 7.40 1.64 3.07Bau-bau n.a. n.a. n.a. n.a. 11.37 3.95 1.71Gorontalo 7.43 4.08 5.31 5.84 6.14 4.30 1.30Mamuju 5.12 4.91 3.28 5.91 7.88 5.07 2.23Ambon 8.78 2.85 6.73 8.81 6.81 5.92 3.28Tual n.a. n.a. n.a. n.a. 11.48 8.58 2.97Ternate 5.32 4.52 3.29 9.78 9.34 4.52 1.91Manokwari 4.68 3.64 4.88 4.63 5.70 2.77 5.75Sorong 8.13 0.90 5.12 7.93 6.84 6.17 2.95Merauke n.a. n.a. n.a. n.a. 12.31 5.76 0.82Jayapura 4.48 3.40 4.52 8.27 7.98 2.79 4.13National CPI Inflation 6.96 3.79 4.30 8.38 8.36 3.35 3.02
Notes:1) Calculated using 2017=100 as a base year, taken from 66 cities2) Calculated using 2012=100 as a base year, taken from 82 cities Source: BPS-Statistics Indonesia

264 2016 ECONOMIC REPORT ON INDONESIAAppendices
Indonesia’s Wholesale Price IndicesTable 7.
Items 2010 1) 2011 2) 2012 2013 2014 2015
Annual Percentage Changes -
2015 to 2014 (%)
2016
Annual Percentage Changes -
2016 to 2015 (%)
Agriculture 231.43 248.78 263.25 287.44 175.05 240.68 37.49 358.41 48.92Mining and Quarrying 212.31 221.50 231.20 239.05 117.22 119.87 2.26 118.43 -1.20
Manufacturing 172.01 180.32 187.48 194.09 122.83 128.89 4.93 133.92 3.90Import 160.90 177.37 189.17 199.25 137.37 134.19 -2.32 128.10 -4.53Export 137.80 154.11 163.15 168.71 138.73 130.46 -5.96 133.31 2.18
Oil and Gas 124.52 173.11 194.38 202.32 168.10 110.65 -34.18 94.42 -14.67Non-Oil and Gas 142.05 148.03 153.16 157.95 129.07 136.98 6.13 146.11 6.66
General Index 170.59 183.31 192.69 201.95 132.44 138.26 4.39 149.16 7.89
1) As of January 2009, WPI calculated using 2005=100 as a base year2) As of year 2011, WPI calculated using 2010=100 as a base year Since November-December 2013, Statistics Indonesia no longer disseminated WPI figures for Oil and Gas Exports
Source: BPS-Statistics Indonesia
2652016 ECONOMIC REPORT ON INDONESIA Appendices
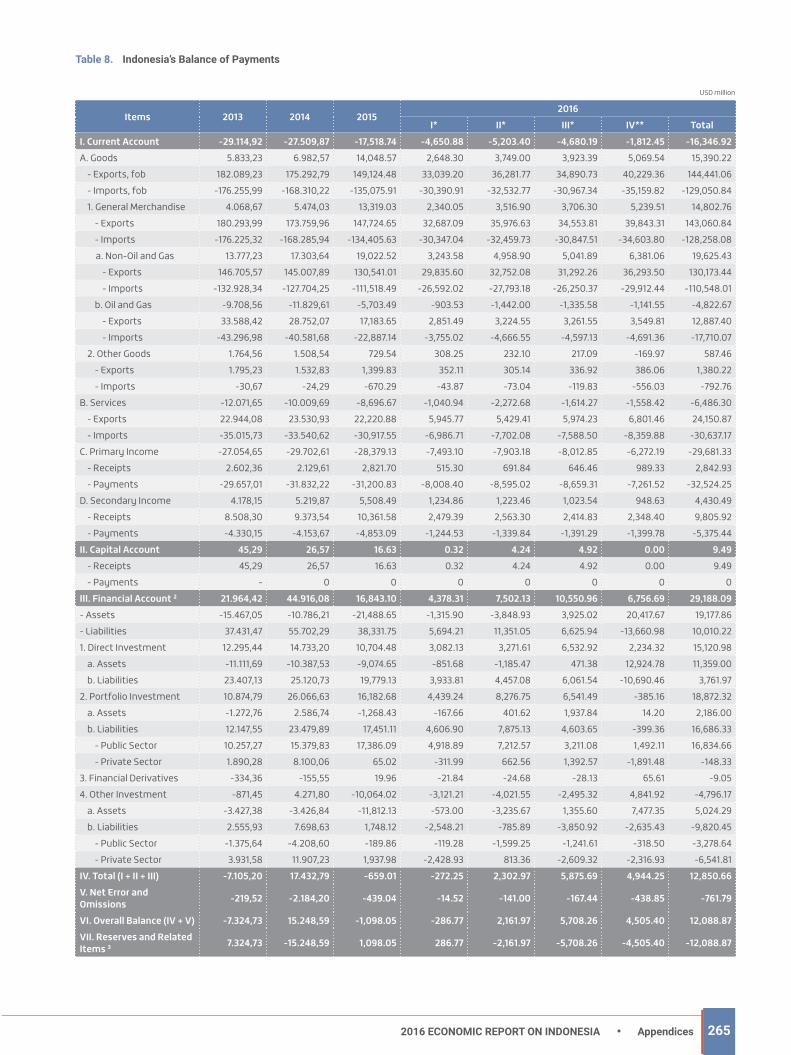
Indonesia’s Balance of PaymentsTable 8.
USD million
Items 2013 2014 20152016
I* II* III* IV** TotalI. Current Account -29.114,92 -27.509,87 -17,518.74 -4,650.88 -5,203.40 -4,680.19 -1,812.45 -16,346.92A. Goods 5.833,23 6.982,57 14,048.57 2,648.30 3,749.00 3,923.39 5,069.54 15,390.22
- Exports, fob 182.089,23 175.292,79 149,124.48 33,039.20 36,281.77 34,890.73 40,229.36 144,441.06- Imports, fob -176.255,99 -168.310,22 -135,075.91 -30,390.91 -32,532.77 -30,967.34 -35,159.82 -129,050.841. General Merchandise 4.068,67 5.474,03 13,319.03 2,340.05 3,516.90 3,706.30 5,239.51 14,802.76
- Exports 180.293,99 173.759,96 147,724.65 32,687.09 35,976.63 34,553.81 39,843.31 143,060.84- Imports -176.225,32 -168.285,94 -134,405.63 -30,347.04 -32,459.73 -30,847.51 -34,603.80 -128,258.08a. Non-Oil and Gas 13.777,23 17.303,64 19,022.52 3,243.58 4,958.90 5,041.89 6,381.06 19,625.43
- Exports 146.705,57 145.007,89 130,541.01 29,835.60 32,752.08 31,292.26 36,293.50 130,173.44- Imports -132.928,34 -127.704,25 -111,518.49 -26,592.02 -27,793.18 -26,250.37 -29,912.44 -110,548.01
b. Oil and Gas -9.708,56 -11.829,61 -5,703.49 -903.53 -1,442.00 -1,335.58 -1,141.55 -4,822.67- Exports 33.588,42 28.752,07 17,183.65 2,851.49 3,224.55 3,261.55 3,549.81 12,887.40- Imports -43.296,98 -40.581,68 -22,887.14 -3,755.02 -4,666.55 -4,597.13 -4,691.36 -17,710.07
2. Other Goods 1.764,56 1.508,54 729.54 308.25 232.10 217.09 -169.97 587.46- Exports 1.795,23 1.532,83 1,399.83 352.11 305.14 336.92 386.06 1,380.22- Imports -30,67 -24,29 -670.29 -43.87 -73.04 -119.83 -556.03 -792.76
B. Services -12.071,65 -10.009,69 -8,696.67 -1,040.94 -2,272.68 -1,614.27 -1,558.42 -6,486.30- Exports 22.944,08 23.530,93 22,220.88 5,945.77 5,429.41 5,974.23 6,801.46 24,150.87- Imports -35.015,73 -33.540,62 -30,917.55 -6,986.71 -7,702.08 -7,588.50 -8,359.88 -30,637.17
C. Primary Income -27.054,65 -29.702,61 -28,379.13 -7,493.10 -7,903.18 -8,012.85 -6,272.19 -29,681.33- Receipts 2.602,36 2.129,61 2,821.70 515.30 691.84 646.46 989.33 2,842.93- Payments -29.657,01 -31.832,22 -31,200.83 -8,008.40 -8,595.02 -8,659.31 -7,261.52 -32,524.25
D. Secondary Income 4.178,15 5.219,87 5,508.49 1,234.86 1,223.46 1,023.54 948.63 4,430.49- Receipts 8.508,30 9.373,54 10,361.58 2,479.39 2,563.30 2,414.83 2,348.40 9,805.92- Payments -4.330,15 -4.153,67 -4,853.09 -1,244.53 -1,339.84 -1,391.29 -1,399.78 -5,375.44
II. Capital Account 45,29 26,57 16.63 0.32 4.24 4.92 0.00 9.49- Receipts 45,29 26,57 16.63 0.32 4.24 4.92 0.00 9.49- Payments - 0 0 0 0 0 0 0
III. Financial Account ² 21.964,42 44.916,08 16,843.10 4,378.31 7,502.13 10,550.96 6,756.69 29,188.09- Assets -15.467,05 -10.786,21 -21,488.65 -1,315.90 -3,848.93 3,925.02 20,417.67 19,177.86- Liabilities 37.431,47 55.702,29 38,331.75 5,694.21 11,351.05 6,625.94 -13,660.98 10,010.221. Direct Investment 12.295,44 14.733,20 10,704.48 3,082.13 3,271.61 6,532.92 2,234.32 15,120.98
a. Assets -11.111,69 -10.387,53 -9,074.65 -851.68 -1,185.47 471.38 12,924.78 11,359.00b. Liabilities 23.407,13 25.120,73 19,779.13 3,933.81 4,457.08 6,061.54 -10,690.46 3,761.97
2. Portfolio Investment 10.874,79 26.066,63 16,182.68 4,439.24 8,276.75 6,541.49 -385.16 18,872.32a. Assets -1.272,76 2.586,74 -1,268.43 -167.66 401.62 1,937.84 14.20 2,186.00b. Liabilities 12.147,55 23.479,89 17,451.11 4,606.90 7,875.13 4,603.65 -399.36 16,686.33
- Public Sector 10.257,27 15.379,83 17,386.09 4,918.89 7,212.57 3,211.08 1,492.11 16,834.66- Private Sector 1.890,28 8.100,06 65.02 -311.99 662.56 1,392.57 -1,891.48 -148.33
3. Financial Derivatives -334,36 -155,55 19.96 -21.84 -24.68 -28.13 65.61 -9.054. Other Investment -871,45 4.271,80 -10,064.02 -3,121.21 -4,021.55 -2,495.32 4,841.92 -4,796.17
a. Assets -3.427,38 -3.426,84 -11,812.13 -573.00 -3,235.67 1,355.60 7,477.35 5,024.29b. Liabilities 2.555,93 7.698,63 1,748.12 -2,548.21 -785.89 -3,850.92 -2,635.43 -9,820.45
- Public Sector -1.375,64 -4.208,60 -189.86 -119.28 -1,599.25 -1,241.61 -318.50 -3,278.64- Private Sector 3.931,58 11.907,23 1,937.98 -2,428.93 813.36 -2,609.32 -2,316.93 -6,541.81
IV. Total (I + II + III) -7.105,20 17.432,79 -659.01 -272.25 2,302.97 5,875.69 4,944.25 12,850.66V. Net Error and Omissions -219,52 -2.184,20 -439.04 -14.52 -141.00 -167.44 -438.85 -761.79
VI. Overall Balance (IV + V) -7.324,73 15.248,59 -1,098.05 -286.77 2,161.97 5,708.26 4,505.40 12,088.87VII. Reserves and Related Items ³ 7.324,73 -15.248,59 1,098.05 286.77 -2,161.97 -5,708.26 -4,505.40 -12,088.87

266 2016 ECONOMIC REPORT ON INDONESIAAppendices
Indonesia’s Balance of Payments - Continued
Items 2013 2014 20152016
I* II* III* IV** TotalA. Reserve Asset Transactions 7.324,73 -15.248,59 1,098.05 286.77 -2,161.97 -5,708.26 -4,505.40 -12,088.87
B. Credit and Loans with IMF - 0 0 0 0 0 0 0
C. Exceptional Financing - 0 0 0 0 0 0 0Memorandum:- Reserve Assets Position 99.386,71 111.861,60 105,931.02 107,542.59 109,788.72 115,671.35 116,361.53 116,361.53
In Months of Imports & Official Debt Repayment 5,47 6,45 7.39 7.72 8.02 8.50 8.41 8.41
- Current Account (% GDP) -3,19 -3,09 -2.03 -2.14 -2.25 -1.92 -0.75 -1.75
Notes:1) Excludes reserves and related items2) Negative represents surplus and positive represents deficit*) Preliminary figures **) Very preliminary figures
Source: Bank Indonesia
2672016 ECONOMIC REPORT ON INDONESIA Appendices
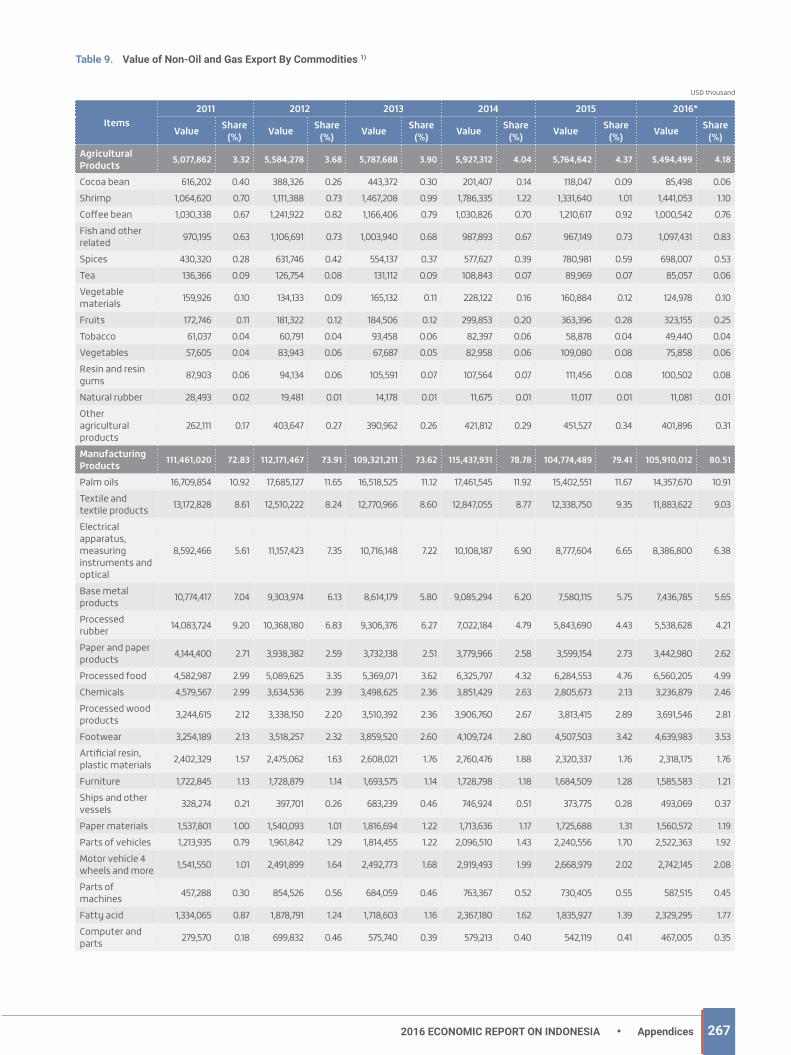
Value of Non-Oil and Gas Export By Commodities 1)Table 9.
USD thousand
Items2011 2012 2013 2014 2015 2016*
Value Share (%) Value Share
(%) Value Share (%) Value Share
(%) Value Share (%) Value Share
(%)Agricultural Products 5,077,862 3.32 5,584,278 3.68 5,787,688 3.90 5,927,312 4.04 5,764,642 4.37 5,494,499 4.18
Cocoa bean 616,202 0.40 388,326 0.26 443,372 0.30 201,407 0.14 118,047 0.09 85,498 0.06Shrimp 1,064,620 0.70 1,111,388 0.73 1,467,208 0.99 1,786,335 1.22 1,331,640 1.01 1,441,053 1.10Coffee bean 1,030,338 0.67 1,241,922 0.82 1,166,406 0.79 1,030,826 0.70 1,210,617 0.92 1,000,542 0.76Fish and other related 970,195 0.63 1,106,691 0.73 1,003,940 0.68 987,893 0.67 967,149 0.73 1,097,431 0.83
Spices 430,320 0.28 631,746 0.42 554,137 0.37 577,627 0.39 780,981 0.59 698,007 0.53Tea 136,366 0.09 126,754 0.08 131,112 0.09 108,843 0.07 89,969 0.07 85,057 0.06Vegetable materials 159,926 0.10 134,133 0.09 165,132 0.11 228,122 0.16 160,884 0.12 124,978 0.10
Fruits 172,746 0.11 181,322 0.12 184,506 0.12 299,853 0.20 363,396 0.28 323,155 0.25Tobacco 61,037 0.04 60,791 0.04 93,458 0.06 82,397 0.06 58,878 0.04 49,440 0.04Vegetables 57,605 0.04 83,943 0.06 67,687 0.05 82,958 0.06 109,080 0.08 75,858 0.06Resin and resin gums 87,903 0.06 94,134 0.06 105,591 0.07 107,564 0.07 111,456 0.08 100,502 0.08
Natural rubber 28,493 0.02 19,481 0.01 14,178 0.01 11,675 0.01 11,017 0.01 11,081 0.01Other agricultural products
262,111 0.17 403,647 0.27 390,962 0.26 421,812 0.29 451,527 0.34 401,896 0.31
Manufacturing Products 111,461,020 72.83 112,171,467 73.91 109,321,211 73.62 115,437,931 78.78 104,774,489 79.41 105,910,012 80.51
Palm oils 16,709,854 10.92 17,685,127 11.65 16,518,525 11.12 17,461,545 11.92 15,402,551 11.67 14,357,670 10.91Textile and textile products 13,172,828 8.61 12,510,222 8.24 12,770,966 8.60 12,847,055 8.77 12,338,750 9.35 11,883,622 9.03
Electrical apparatus, measuring instruments and optical
8,592,466 5.61 11,157,423 7.35 10,716,148 7.22 10,108,187 6.90 8,777,604 6.65 8,386,800 6.38
Base metal products 10,774,417 7.04 9,303,974 6.13 8,614,179 5.80 9,085,294 6.20 7,580,115 5.75 7,436,785 5.65
Processed rubber 14,083,724 9.20 10,368,180 6.83 9,306,376 6.27 7,022,184 4.79 5,843,690 4.43 5,538,628 4.21
Paper and paper products 4,144,400 2.71 3,938,382 2.59 3,732,138 2.51 3,779,966 2.58 3,599,154 2.73 3,442,980 2.62
Processed food 4,582,987 2.99 5,089,625 3.35 5,369,071 3.62 6,325,797 4.32 6,284,553 4.76 6,560,205 4.99Chemicals 4,579,567 2.99 3,634,536 2.39 3,498,625 2.36 3,851,429 2.63 2,805,673 2.13 3,236,879 2.46Processed wood products 3,244,615 2.12 3,338,150 2.20 3,510,392 2.36 3,906,760 2.67 3,813,415 2.89 3,691,546 2.81
Footwear 3,254,189 2.13 3,518,257 2.32 3,859,520 2.60 4,109,724 2.80 4,507,503 3.42 4,639,983 3.53Artificial resin, plastic materials 2,402,329 1.57 2,475,062 1.63 2,608,021 1.76 2,760,476 1.88 2,320,337 1.76 2,318,175 1.76
Furniture 1,722,845 1.13 1,728,879 1.14 1,693,575 1.14 1,728,798 1.18 1,684,509 1.28 1,585,583 1.21Ships and other vessels 328,274 0.21 397,701 0.26 683,239 0.46 746,924 0.51 373,775 0.28 493,069 0.37
Paper materials 1,537,801 1.00 1,540,093 1.01 1,816,694 1.22 1,713,636 1.17 1,725,688 1.31 1,560,572 1.19Parts of vehicles 1,213,935 0.79 1,961,842 1.29 1,814,455 1.22 2,096,510 1.43 2,240,556 1.70 2,522,363 1.92Motor vehicle 4 wheels and more 1,541,550 1.01 2,491,899 1.64 2,492,773 1.68 2,919,493 1.99 2,668,979 2.02 2,742,145 2.08
Parts of machines 457,288 0.30 854,526 0.56 684,059 0.46 763,367 0.52 730,405 0.55 587,515 0.45
Fatty acid 1,334,065 0.87 1,878,791 1.24 1,718,603 1.16 2,367,180 1.62 1,835,927 1.39 2,329,295 1.77Computer and parts 279,570 0.18 699,832 0.46 575,740 0.39 579,213 0.40 542,119 0.41 467,005 0.35
268 2016 ECONOMIC REPORT ON INDONESIAAppendices
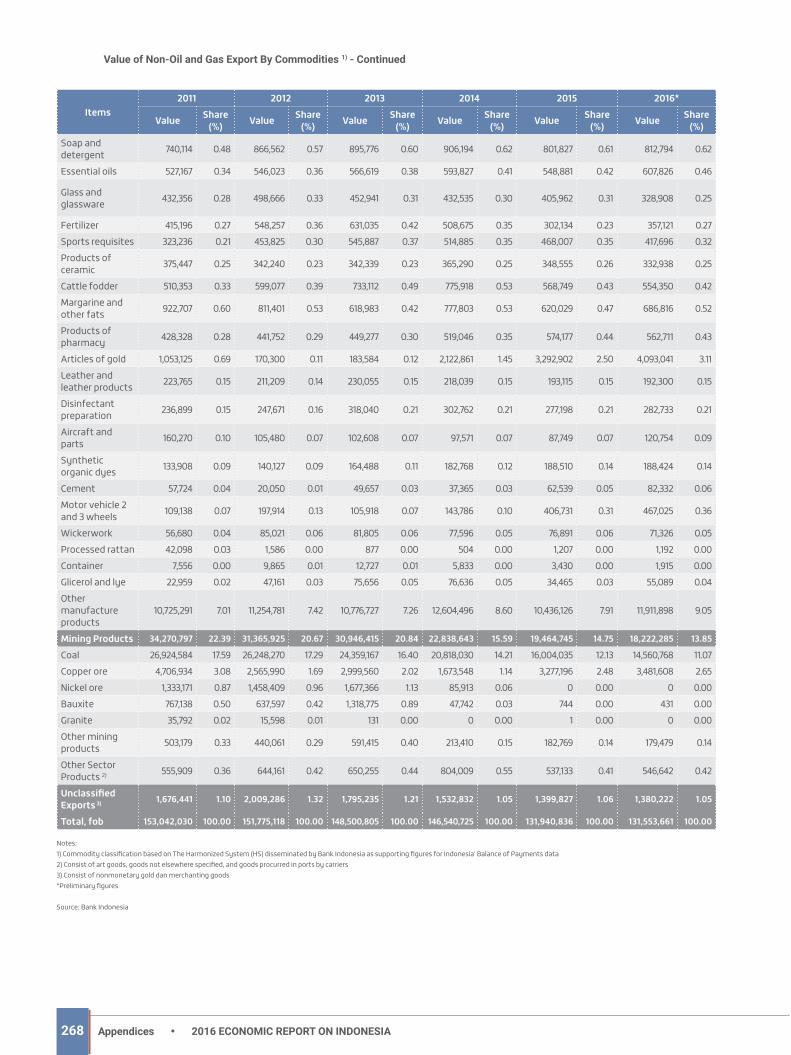
Value of Non-Oil and Gas Export By Commodities 1) - Continued
Items2011 2012 2013 2014 2015 2016*
Value Share (%) Value Share
(%) Value Share (%) Value Share
(%) Value Share (%) Value Share
(%)Soap and detergent 740,114 0.48 866,562 0.57 895,776 0.60 906,194 0.62 801,827 0.61 812,794 0.62
Essential oils 527,167 0.34 546,023 0.36 566,619 0.38 593,827 0.41 548,881 0.42 607,826 0.46
Glass and glassware 432,356 0.28 498,666 0.33 452,941 0.31 432,535 0.30 405,962 0.31 328,908 0.25
Fertilizer 415,196 0.27 548,257 0.36 631,035 0.42 508,675 0.35 302,134 0.23 357,121 0.27Sports requisites 323,236 0.21 453,825 0.30 545,887 0.37 514,885 0.35 468,007 0.35 417,696 0.32Products of ceramic 375,447 0.25 342,240 0.23 342,339 0.23 365,290 0.25 348,555 0.26 332,938 0.25
Cattle fodder 510,353 0.33 599,077 0.39 733,112 0.49 775,918 0.53 568,749 0.43 554,350 0.42Margarine and other fats 922,707 0.60 811,401 0.53 618,983 0.42 777,803 0.53 620,029 0.47 686,816 0.52
Products of pharmacy 428,328 0.28 441,752 0.29 449,277 0.30 519,046 0.35 574,177 0.44 562,711 0.43
Articles of gold 1,053,125 0.69 170,300 0.11 183,584 0.12 2,122,861 1.45 3,292,902 2.50 4,093,041 3.11Leather and leather products 223,765 0.15 211,209 0.14 230,055 0.15 218,039 0.15 193,115 0.15 192,300 0.15
Disinfectant preparation 236,899 0.15 247,671 0.16 318,040 0.21 302,762 0.21 277,198 0.21 282,733 0.21
Aircraft and parts 160,270 0.10 105,480 0.07 102,608 0.07 97,571 0.07 87,749 0.07 120,754 0.09
Synthetic organic dyes 133,908 0.09 140,127 0.09 164,488 0.11 182,768 0.12 188,510 0.14 188,424 0.14
Cement 57,724 0.04 20,050 0.01 49,657 0.03 37,365 0.03 62,539 0.05 82,332 0.06Motor vehicle 2 and 3 wheels 109,138 0.07 197,914 0.13 105,918 0.07 143,786 0.10 406,731 0.31 467,025 0.36
Wickerwork 56,680 0.04 85,021 0.06 81,805 0.06 77,596 0.05 76,891 0.06 71,326 0.05Processed rattan 42,098 0.03 1,586 0.00 877 0.00 504 0.00 1,207 0.00 1,192 0.00Container 7,556 0.00 9,865 0.01 12,727 0.01 5,833 0.00 3,430 0.00 1,915 0.00Glicerol and lye 22,959 0.02 47,161 0.03 75,656 0.05 76,636 0.05 34,465 0.03 55,089 0.04Other manufacture products
10,725,291 7.01 11,254,781 7.42 10,776,727 7.26 12,604,496 8.60 10,436,126 7.91 11,911,898 9.05
Mining Products 34,270,797 22.39 31,365,925 20.67 30,946,415 20.84 22,838,643 15.59 19,464,745 14.75 18,222,285 13.85
Coal 26,924,584 17.59 26,248,270 17.29 24,359,167 16.40 20,818,030 14.21 16,004,035 12.13 14,560,768 11.07Copper ore 4,706,934 3.08 2,565,990 1.69 2,999,560 2.02 1,673,548 1.14 3,277,196 2.48 3,481,608 2.65Nickel ore 1,333,171 0.87 1,458,409 0.96 1,677,366 1.13 85,913 0.06 0 0.00 0 0.00Bauxite 767,138 0.50 637,597 0.42 1,318,775 0.89 47,742 0.03 744 0.00 431 0.00Granite 35,792 0.02 15,598 0.01 131 0.00 0 0.00 1 0.00 0 0.00Other mining products 503,179 0.33 440,061 0.29 591,415 0.40 213,410 0.15 182,769 0.14 179,479 0.14
Other Sector Products 2) 555,909 0.36 644,161 0.42 650,255 0.44 804,009 0.55 537,133 0.41 546,642 0.42
Unclassified Exports 3) 1,676,441 1.10 2,009,286 1.32 1,795,235 1.21 1,532,832 1.05 1,399,827 1.06 1,380,222 1.05
Total, fob 153,042,030 100.00 151,775,118 100.00 148,500,805 100.00 146,540,725 100.00 131,940,836 100.00 131,553,661 100.00
Notes:1) Commodity classification based on The Harmonized System (HS) disseminated by Bank Indonesia as supporting figures for Indonesia’ Balance of Payments data2) Consist of art goods, goods not elsewhere specified, and goods procurred in ports by carriers3) Consist of nonmonetary gold dan merchanting goods*Preliminary figures
Source: Bank Indonesia

2692016 ECONOMIC REPORT ON INDONESIA Appendices
Volume of Non Oil and Gas Export by Commodities 1)Table 10.
Thousand ton
Items2011 2012 2013 2014 2015 2016*
Volume Share (%) Volume Share
(%) Volume Share (%) Volume Share
(%) Volume Share (%) Volume Share
(%)Agricultural Products 2695.96 0.52 3,005 0.54 3,103 0.48 3,215 0.63 3,773 0.81 3,442 0.74
Cocoa bean 211 0.04 172 0.03 198 0.03 77 0.02 54 0.01 38 0.01Shrimp 119 0.02 133 0.02 145 0.02 160 0.03 149 0.03 158 0.03Coffee bean 344 0.07 446 0.08 532 0.08 384 0.08 513 0.11 413 0.09Fish and other related 550 0.11 644 0.12 649 0.10 623 0.12 420 0.09 431 0.09
Spices 96 0.02 111 0.02 119 0.02 156 0.03 151 0.03 140 0.03Tea 68 0.01 62 0.01 65 0.01 61 0.01 51 0.01 46 0.01Vegetable materials 230 0.04 169 0.03 192 0.03 203 0.04 207 0.04 186 0.04
Fruits 209 0.04 243 0.04 245 0.04 300 0.06 352 0.08 285 0.06Tobacco 20 0.00 16 0.00 20 0.00 17 0.00 12 0.00 13 0.00Vegetables 88 0.02 147 0.03 104 0.02 111 0.02 196 0.04 127 0.03Resin and resin gums 38 0.01 71 0.01 73 0.01 50 0.01 69 0.01 76 0.02
Natural rubber 9 0.00 9 0.00 7 0.00 6 0.00 8 0.00 7 0.00Other agricultural products
713 0.14 780 0.14 755 0.12 1,068 0.21 1,591 0.34 1,524 0.33
Manufacturing Products 62,703 12.20 64,782 11.73 70,819 10.88 75,443 14.85 78,316 16.87 77,291 16.54
Palm oils 15,823 3.08 18,967 3.43 21,517 3.31 22,889 4.51 26,496 5.71 22,794 4.88Textile and textile products 1,934 0.38 1,951 0.35 2,109 0.32 2,213 0.44 2,264 0.49 2,204 0.47
Electrical apparatus, measuring instruments and optical
573 0.11 623 0.11 588 0.09 536 0.11 517 0.11 511 0.11
Base metal products 2,256 0.44 2,361 0.43 2,019 0.31 3,059 0.60 3,667 0.79 3,780 0.81
Processed rubber 3,080 0.60 3,030 0.55 3,324 0.51 3,248 0.64 3,258 0.70 3,216 0.69
Paper and paper products 4,216 0.82 4,227 0.77 4,263 0.66 4,343 0.86 4,552 0.98 4,118 0.88
Processed food 2,499 0.49 2,315 0.42 2,538 0.39 3,351 0.66 2,988 0.64 3,046 0.65Chemicals 4,843 0.94 4,088 0.74 3,863 0.59 4,185 0.82 3,943 0.85 5,290 1.13Processed wood products 3,986 0.78 4,202 0.76 4,900 0.75 5,972 1.18 5,420 1.17 5,480 1.17
Footwear 193 0.04 199 0.04 213 0.03 214 0.04 235 0.05 240 0.05Artificial resin, plastic materials 1,201 0.23 1,279 0.23 1,350 0.21 1,483 0.29 1,417 0.31 1,576 0.34
Furniture 588 0.11 599 0.11 551 0.08 552 0.11 505 0.11 467 0.10Ships and other vessels 128 0.02 165 0.03 107 0.02 134 0.03 159 0.03 275 0.06
Paper materials 2,902 0.56 3,185 0.58 3,671 0.56 3,494 0.69 3,400 0.73 3,532 0.76Parts of vehicles 156 0.03 231 0.04 230 0.04 259 0.05 286 0.06 321 0.07Motor vehicle 4 wheels and more
178 0.03 260 0.05 268 0.04 322 0.06 314 0.07 317 0.07
Fatty Acid 1,200 0.23 1,855 0.34 2,150 0.33 21 0.00 20 0.00 15 0.00Computer and parts 15 0.00 25 0.00 22 0.00 863 0.17 839 0.18 882 0.19
Soap and detergent 621 0.12 745 0.13 839 0.13 100 0.02 90 0.02 99 0.02

270 2016 ECONOMIC REPORT ON INDONESIAAppendices
Volume of Non Oil and Gas Export by Commodities 1) - Continued
Items2011 2012 2013 2014 2015 2016*
Volume Share (%) Volume Share
(%) Volume Share (%) Volume Share
(%) Volume Share (%) Volume Share
(%)Essential oils 106 0.02 100 0.02 101 0.02 656 0.13 686 0.15 621 0.13Cattle fodder 3,660 0.71 4,236 0.77 4,613 0.71 805 0.16 802 0.17 855 0.18Margarine and other fats 796 0.15 766 0.14 681 0.10 24 0.00 21 0.00 20 0.00
Products of pharmacy 19 0.00 21 0.00 26 0.00 0 0.00 0 0.00 0 0.00
Articles of gold 0 0.00 0 0.00 0 0.00 7 0.00 7 0.00 6 0.00Leather and leather products 12 0.00 10 0.00 11 0.00 95 0.02 82 0.02 76 0.02
Disinfectant preparation 79 0.02 72 0.01 82 0.01 1 0.00 1 0.00 1 0.00
Aircraft and parts 1 0.00 0 0.00 1 0.00 34 0.01 32 0.01 35 0.01
Syntetic organic dyes 25 0.00 30 0.01 34 0.01 571 0.11 1,216 0.26 2,082 0.45
Cement 1,318 0.26 275 0.05 946 0.15 15 0.00 37 0.01 42 0.01Motor vehicle 2 and 3 wheels 11 0.00 20 0.00 11 0.00 22 0.00 21 0.00 19 0.00
Wickerwork 22 0.00 23 0.00 22 0.00 0 0.00 0 0.00 1 0.00Processed rattan 40 0.01 1 0.00 0 0.00 3 0.00 1 0.00 1 0.00Container 3 0.00 3 0.00 4 0.00 318 0.06 168 0.04 361 0.08Glicerol and lye 96 0.02 164 0.03 248 0.04 6,238 1.23 5,549 1.20 5,529 1.18Other manufacture products
7,871 1.53 6,219 1.13 6,688 1.03 429,253 84.51 382,009 82.31 386,351 82.68
Mining Products 448,449 87.27 484,713 87.73 576,742 88.64 408,345 80.40 367,041 79.09 370,231 79.23Coal 348,056 67.74 385,421 69.76 422,637 64.95 715 0.14 1,712 0.37 1,913 0.41Copper ore 1,480 0.29 1,109 0.20 1,455 0.22 4,284 0.84 - 0.00 - 0.00Nickel ore 37,474 7.29 46,901 8.49 64,232 9.87 2,087 0.41 3 0.00 2 0.00Bauxite 39,634 7.71 29,799 5.39 55,557 8.54 - 0.00 0 0.00 - 0.00Granite 4,468 0.87 2,002 0.36 19 0.00 13,822 2.72 13,254 2.86 14,205 3.04Other mining products 17,337 3.37 19,480 3.53 32,842 5.05 3 0.00 2 0.00 219 0.05
Other Sector Products 2) 0 0.00 0 0.00 0 0.00 0 0.00 0 0.00 0 0.00
Total 513,849 100.00 552,502 100.00 650,666 100.00 507,914 100.00 464,100 100.00 467,302 100.00
Notes:1) Commodity classification based on The Harmonized System (HS) and not include goods procured in ports by carriers, repair on goods, and adjustment for coverage of Batam industrial exports. Data disseminated
by Bank Indonesia as supporting figures for Indonesia’ Balance of Payments data.2) Consist of arts goods and other goods not elsewhere specified*Preliminary figures
Source: Bank Indonesia

2712016 ECONOMIC REPORT ON INDONESIA Appendices
Value of Non-Oil and Gas Export By Country of Destination (fob) 1)Table 11.
Items2011 2012 2013 2014 2015 2016*
Value Share (%) Value Share
(%) Value Share (%) Value Share
(%) Value Share (%) Value Share
(%)America 19,749,881 12.90 18,824,693 12.40 19,401,683 13.07 20,327,656 13.87 19,273,316 14.61 19,578,169 14.88
North America 15,967,415 10.43 15,286,203 10.07 15,795,051 10.64 16,607,330 11.33 16,023,284 12.14 16,387,135 12.46
United States of America 15,019,944 9.81 14,497,394 9.55 15,017,442 10.11 15,851,790 10.82 15,297,600 11.59 15,652,462 11.90
Canada 946,635 0.62 787,624 0.52 775,984 0.52 754,366 0.51 724,445 0.55 733,140 0.56
Other North America 836 0.00 1,185 0.00 1,626 0.00 1,174 0.00 1,238 0.00 1,533 0.00
Central and South America 3,782,466 2.47 3,538,490 2.33 3,606,631 2.43 3,720,326 2.54 3,250,033 2.46 3,191,034 2.43
Argentina 352,449 0.23 310,359 0.20 336,956 0.23 237,166 0.16 238,132 0.18 219,225 0.17
Brazil 1,665,021 1.09 1,479,334 0.97 1,517,190 1.02 1,503,465 1.03 1,164,516 0.88 1,099,466 0.84
Mexico 597,834 0.39 594,865 0.39 625,022 0.42 814,494 0.56 802,893 0.61 795,730 0.60
Other Central and South America 1,167,162 0.76 1,153,932 0.76 1,127,463 0.76 1,165,201 0.80 1,044,491 0.79 1,076,613 0.82
Europe 22,381,070 14.62 20,827,697 13.72 19,998,354 13.47 20,044,107 13.68 18,474,670 14.00 19,393,969 14.74
European Union 19,204,575 12.55 17,780,102 11.71 16,613,817 11.19 16,846,951 11.50 14,769,696 11.19 14,404,140 10.95
Netherlands 4,728,965 3.09 4,473,179 2.95 4,009,880 2.70 3,909,794 2.67 3,407,638 2.58 3,217,926 2.45
Belgium 1,341,888 0.88 1,293,102 0.85 1,254,708 0.84 1,217,226 0.83 1,103,886 0.84 1,122,655 0.85
United Kingdom 1,627,847 1.06 1,679,815 1.11 1,618,871 1.09 1,659,576 1.13 1,521,994 1.15 1,582,567 1.20
Italy 2,995,989 1.96 2,279,791 1.50 2,121,981 1.43 2,287,691 1.56 1,871,943 1.42 1,570,686 1.19
Germany 3,201,299 2.09 3,064,411 2.02 2,860,998 1.93 2,819,491 1.92 2,652,510 2.01 2,629,585 2.00
France 1,049,478 0.69 1,116,351 0.74 1,053,698 0.71 1,018,400 0.69 971,332 0.74 886,124 0.67
Spain 2,231,984 1.46 2,059,230 1.36 1,806,692 1.22 1,938,255 1.32 1,476,585 1.12 1,578,057 1.20
Other European Union 2) 2,027,124 1.32 1,814,223 1.20 1,886,988 1.27 1,996,519 1.36 1,763,807 1.34 1,816,541 1.38
Russia 852,039 0.56 866,396 0.57 934,132 0.63 1,056,775 0.72 993,581 0.75 1,273,965 0.97
Turkey 1,423,668 0.93 1,361,964 0.90 1,537,295 1.04 1,447,167 0.99 1,159,227 0.88 1,022,876 0.78
Other Europe 900,788 0.59 819,235 0.54 913,110 0.61 693,214 0.47 1,552,167 1.18 2,692,988 2.05
Asia and Middle East 103,157,274 67.40 102,731,460 67.69 99,945,259 67.30 96,266,318 65.69 86,429,505 65.51 85,681,577 65.13
ASEAN 26,971,924 17.62 30,797,388 20.29 29,359,595 19.77 28,840,547 19.68 27,180,205 20.60 28,491,913 21.66
Brunei Darussalam 65,327 0.04 116,854 0.08 88,496 0.06 98,866 0.07 85,588 0.06 85,335 0.06
Philippines 3,642,588 2.38 3,651,969 2.41 3,757,698 2.53 3,886,987 2.65 3,917,396 2.97 5,244,085 3.99
Cambodia 266,448 0.17 290,188 0.19 316,755 0.21 416,539 0.28 429,189 0.33 424,465 0.32
Lao PDR 10,613 0.01 23,736 0.02 5,087 0.00 6,212 0.00 7,135 0.01 5,863 0.00
Malaysia 8,779,155 5.74 8,445,424 5.56 7,161,960 4.82 6,400,296 4.37 6,186,335 4.69 5,904,556 4.49
Myanmar 321,484 0.21 412,643 0.27 576,497 0.39 587,256 0.40 610,521 0.46 597,072 0.45
Singapore 7,142,675 4.67 10,136,569 6.68 9,687,013 6.52 10,012,470 6.83 8,639,824 6.55 8,617,760 6.55
Thailand 4,547,436 2.97 5,469,613 3.60 5,209,797 3.51 4,990,703 3.41 4,590,229 3.48 4,607,542 3.50
Vietnam 2,196,200 1.44 2,250,393 1.48 2,556,292 1.72 2,441,218 1.67 2,713,988 2.06 3,005,236 2.28
Hong Kong SAR 3,078,247 2.01 2,644,935 1.74 2,646,008 1.78 2,760,064 1.88 2,048,572 1.55 2,127,947 1.62
India 13,158,360 8.60 12,454,827 8.21 12,948,553 8.72 12,220,101 8.34 11,606,701 8.80 9,943,155 7.56
Iraq 148,874 0.10 44,886 0.03 171,973 0.12 70,480 0.05 94,987 0.07 91,069 0.07
Japan 18,135,364 11.85 17,165,696 11.31 16,025,840 10.79 14,636,828 9.99 12,990,521 9.85 13,149,692 10.00
South Korea 7,283,875 4.76 6,657,016 4.39 5,999,024 4.04 5,725,271 3.91 5,410,487 4.10 5,244,905 3.99
Pakistan 910,807 0.60 1,375,854 0.91 1,412,034 0.95 2,048,083 1.40 1,988,049 1.51 2,017,960 1.53
People Republic of China 21,414,082 13.99 20,783,070 13.69 21,156,450 14.25 16,465,326 11.24 13,250,531 10.04 15,160,683 11.52
Saudi Arabia 1,372,845 0.90 1,764,557 1.16 1,728,591 1.16 2,155,287 1.47 2,060,074 1.56 1,327,878 1.01
Taiwan, Province of China 4,154,619 2.71 4,084,297 2.69 3,714,616 2.50 3,891,682 2.66 3,642,075 2.76 2,561,948 1.95
Other Asia and Middle East 6,528,277 4.27 4,958,934 3.27 4,782,574 3.22 7,452,648 5.09 6,157,303 4.67 5,564,427 4.23
USD thousand

272 2016 ECONOMIC REPORT ON INDONESIAAppendices
Value of Non-Oil and Gas Export By Country of Destination (fob) 1) - Continued
Items2011 2012 2013 2014 2015 2016*
Value Share (%) Value Share
(%) Value Share (%) Value Share
(%) Value Share (%) Value Share
(%)Australia and Oceania 3,235,990 2.11 4,026,451 2.65 3,922,662 2.64 4,519,496 3.08 3,730,292 2.83 3,350,097 2.55
Australia 2,445,147 1.60 3,296,172 2.17 2,989,647 2.01 3,697,363 2.52 2,991,168 2.27 2,648,491 2.01
New Zealand 388,844 0.25 356,826 0.24 444,951 0.30 460,164 0.31 396,674 0.30 358,059 0.27
Other Australia and Oceania 401,999 0.26 373,454 0.25 488,064 0.33 361,970 0.25 342,451 0.26 343,547 0.26
Africa 3,961,906 2.59 4,552,974 3.00 4,400,184 2.96 4,857,604 3.31 3,503,548 2.66 3,021,562 2.30
South Africa 1,409,167 0.92 1,642,411 1.08 1,245,443 0.84 1,378,907 0.94 665,661 0.50 727,757 0.55
Other Africa 2,552,739 1.67 2,910,563 1.92 3,154,740 2.12 3,478,697 2.37 2,837,887 2.15 2,293,805 1.74
Unclassified exports 3) 555,909 0.36 811,843 0.53 832,663 0.56 525,544 0.36 529,503 0.40 528,287 0.40
Total, fob 153,042,030 100.00 151,775,118 100.00 148,500,805 100.00 146,540,725 100.00 131,940,836 100.00 131,553,661 100.00
Notes:1) Data disseminated by Bank Indonesia as supporting figures for Indonesia’ Balance of Payments data 2) Enlargements become 27 states since Bulgaria and Romania integrates in European Union on January 20073) Consist of goods procured in ports by carriers, repair on goods, and adjustment for coverage of Batam industrial exports*Preliminary figures
Source: Bank Indonesia

2732016 ECONOMIC REPORT ON INDONESIA Appendices
Value of Import By Broad Economic Categories 1)Table 12.
Items2011 2012 2013 2014 2015 2016*
Value Share (%) Value Share
(%) Value Share (%) Value Share
(%) Value Share (%) Value Share
(%)
Consumption Goods 22,611,945 14.38 25,532,632 14.29 26,879,699 15.25 25,907,577 15.39 18,461,404 13.67 17,031,317 13.20
Food and beverages, primary, mainly for household
1,832,692 1.17 1,537,179 0.86 1,394,325 0.79 1,541,254 0.92 1,320,173 0.98 1,729,433 1.34
Food and beverages, processed, mainly for household
3,533,437 2.25 2,759,331 1.54 2,812,575 1.60 2,750,512 1.63 2,332,869 1.73 3,008,403 2.33
Passenger motor cars 872,628 0.55 1,498,307 0.84 1,171,510 0.66 784,431 0.47 583,152 0.43 594,982 0.46
Transport equipment, non-industrial
555,433 0.35 367,729 0.21 383,485 0.22 268,909 0.16 243,873 0.18 142,456 0.11
Durable consumer goods 1,192,777 0.76 1,592,871 0.89 1,624,973 0.92 1,415,739 0.84 1,073,667 0.79 1,208,969 0.94
Semi durable consumer goods 1,501,594 0.95 1,921,446 1.08 2,150,785 1.22 1,952,560 1.16 1,965,991 1.46 2,221,105 1.72
Non durable consumer goods 1,490,297 0.95 1,910,634 1.07 2,154,691 1.22 2,158,041 1.28 2,023,181 1.50 2,154,847 1.67
Fuels and lubricants, processed, oil products 2)
11,465,941 7.29 13,720,367 7.68 14,736,636 8.36 14,504,300 8.62 8,181,422 6.06 5,146,414 3.99
Goods not elsewhere specified
167,147 0.11 224,769 0.13 450,718 0.26 531,831 0.32 737,074 0.55 824,708 0.64
Raw Materials and Auxilliary Goods
113,151,281 71.94 126,732,417 70.93 127,649,765 72.42 121,677,775 72.29 97,936,858 72.51 95,107,896 73.70
Food and beverages, primary, mainly for industry
4,112,931 2.61 4,005,713 2.24 4,348,635 2.47 4,934,923 2.93 4,100,987 3.04 4,423,637 3.43
Food and beverages, processed, mainly for industry
3,261,887 2.07 3,317,376 1.86 3,294,925 1.87 3,247,084 1.93 2,726,501 2.02 3,463,722 2.68
Industrial supplies, primary 6,679,561 4.25 5,480,589 3.07 6,180,739 3.51 5,967,884 3.55 4,616,310 3.42 3,987,153 3.09
Industrial supplies, processed
49,204,480 31.28 58,236,091 32.59 56,624,346 32.13 56,247,051 33.42 49,421,677 36.59 47,305,728 36.66
Parts and accessories for capital goods
13,831,250 8.79 18,011,245 10.08 17,191,495 9.75 15,552,758 9.24 14,628,024 10.83 15,537,453 12.04
Parts and accessories for transport equipments
6,617,550 4.21 8,267,873 4.63 8,980,793 5.10 7,128,761 4.24 6,139,368 4.55 6,384,705 4.95
Fuels and lubricants, primary
10,923,734 6.95 11,008,146 6.16 13,322,222 7.56 12,896,531 7.66 8,011,548 5.93 7,197,942 5.58
o/w crude oil 2) 10,905,440 6.93 10,987,073 6.15 13,236,094 7.51 12,600,220 7.49 7,725,385 5.72 6,874,010 5.33
Fuels and lubricants, processed
18,519,887 11.77 18,405,384 10.30 17,706,610 10.05 15,702,783 9.33 8,292,444 6.14 6,807,557 5.28
USD thousand

274 2016 ECONOMIC REPORT ON INDONESIAAppendices
Value of Import By Broad Economic Categories 1) - Continued
Items2011 2012 2013 2014 2015 2016*
Value Share (%) Value Share
(%) Value Share (%) Value Share
(%) Value Share (%) Value Share
(%)
o/w oil products 2) 16,590,030 10.55 15,540,944 8.70 14,408,358 8.17 12,442,784 7.39 6,057,936 4.48 4,744,722 3.68
o/w Liquified Petroleum Gas 3)
1,708,094 1.09 2,626,816 1.47 3,094,502 1.76 3,039,246 1.81 2,061,615 1.53 1,841,452 1.43
Capital Goods 30,490,023 19.39 36,086,323 20.20 30,909,621 17.54 29,448,344 17.50 24,854,992 18.40 22,315,959 17.29
Capital goods (except transport equipment)
22,301,038 14.18 26,642,473 14.91 25,541,302 14.49 25,570,739 15.19 22,424,297 16.60 19,860,202 15.39
Passenger motor cars 872,628 0.55 1,498,307 0.84 1,171,510 0.66 784,431 0.47 583,152 0.43 594,982 0.46
Other transport equipment, industrial
7,316,357 4.65 7,945,543 4.45 4,196,809 2.38 3,093,174 1.84 1,847,542 1.37 1,860,775 1.44
Other merchandise 4) 724,016 0.46 743,455 0.42 714,679 0.41 753,791 0.45 419,459 0.31 473,567 0.37
Unclassified imports 5) 71,097 0.05 43,071 0.02 32,398 0.02 25,620 0.02 706,213 0.52 832,126 0.64
Total, cif 167,048,361 106.21 189,137,898 105.86 186,186,162 105.63 177,813,107 105.65 142,378,926 105.41 135,760,866 105.20
Insurance and Freight 9,764,655 6.21 10,470,943 5.86 9,930,168 5.63 9,502,882 5.65 7,303,013 5.41 6,710,029 5.20
Total, fob 157,283,706 100.00 178,666,955 100.00 176,255,994 100.00 168,310,225 100.00 135,075,913 100.00 129,050,837 100.00
Notes:1) Commodity classified by Broad Economic Category (BEC). Data disseminated by Bank Indonesia as supporting figures for Indonesia’ Balance of Payments data2) A component of oil imports3) A component of gas imports4) Consist of goods procured in ports by carriers, and repair on goods5) Consist of nonmonetary gold
*Preliminary figuresSource: Bank Indonesia

2752016 ECONOMIC REPORT ON INDONESIA Appendices
Value of Non-Oil and Gas Import By Commodities (cif) 1)Table 13.
Items2011 2012 2013 2014 2015 2016*
Value Share (%) Value Share
(%) Value Share (%) Value Share
(%) Value Share (%) Value Share
(%)
Agricultural Products 9,277,539 7.82 8,129,294 5.90 8,650,023 6.51 9,340,745 7.31 7,683,036 6.85 7,954,150 7.14
Cocoa bean 62,895 0.05 62,719 0.05 77,422 0.06 342,015 0.27 169,735 0.15 182,452 0.16
Shrimp and prawn 49,459 0.04 51,709 0.04 63,173 0.05 60,399 0.05 49,054 0.04 67,845 0.06
Coffee bean 39,092 0.03 109,399 0.08 29,424 0.02 39,856 0.03 27,492 0.02 43,460 0.04
Fish and other related 172,917 0.15 129,259 0.09 139,702 0.11 139,614 0.11 142,605 0.13 155,335 0.14
Spices 396,509 0.33 153,669 0.11 30,082 0.02 71,275 0.06 35,429 0.03 101,894 0.09
Tea 24,749 0.02 28,732 0.02 24,199 0.02 19,568 0.02 19,914 0.02 23,450 0.02
Vegetable materials 1,896 0.00 1,748 0.00 1,834 0.00 1,422 0.00 4,129 0.00 1,434 0.00
Fruits 792,567 0.67 834,467 0.61 653,001 0.49 781,392 0.61 656,088 0.58 832,295 0.75
Tobacco 134,434 0.11 258,929 0.19 224,698 0.17 205,018 0.16 82,833 0.07 78,779 0.07
Vegetables 557,773 0.47 470,697 0.34 612,965 0.46 612,117 0.48 530,410 0.47 669,144 0.60
Resin and resin gums 4,131 0.00 2,174 0.00 2,163 0.00 7,671 0.01 4,723 0.00 2,624 0.00
Natural rubber 27,408 0.02 39,576 0.03 36,709 0.03 31,477 0.02 30,798 0.03 26,106 0.02
Other agricultural products
7,013,708 5.92 5,986,217 4.34 6,754,652 5.08 7,028,921 5.50 5,929,827 5.29 5,769,334 5.18
Manufacture Products 115,099,993 97.08 136,202,320 98.80 129,985,389 97.76 123,554,860 96.73 108,052,242 96.31 106,513,465 95.66
Palm oils 24,992 0.02 509 0.00 46,251 0.03 489 0.00 4,624 0.00 4,117 0.00
Textile and textile products 6,529,501 5.51 6,788,245 4.92 7,061,634 5.31 7,178,665 5.62 6,869,687 6.12 7,055,350 6.34
Electrical apparatus, measuring instruments and optical
15,462,441 13.04 19,690,154 14.28 19,581,953 14.73 17,966,458 14.07 16,305,177 14.53 16,444,105 14.77
Base metal products 14,687,575 12.39 20,917,890 15.17 19,191,815 14.43 17,403,341 13.63 14,234,548 12.69 13,283,611 11.93
Processed rubber 1,260,895 1.06 1,624,157 1.18 1,423,535 1.07 1,303,276 1.02 1,094,270 0.98 1,102,522 0.99
Paper and paper products 1,941,297 1.64 1,931,670 1.40 1,914,713 1.44 2,026,246 1.59 1,730,720 1.54 1,782,397 1.60
Processed food 5,203,802 4.39 4,572,444 3.32 4,471,081 3.36 4,392,198 3.44 3,939,240 3.51 5,519,774 4.96
Chemicals 8,642,410 7.29 9,284,444 6.73 9,219,775 6.93 9,169,681 7.18 7,547,230 6.73 6,536,464 5.87
Processed wood products 366,068 0.31 378,610 0.27 367,416 0.28 349,575 0.27 316,108 0.28 297,683 0.27
Footwear 314,536 0.27 367,657 0.27 412,326 0.31 389,560 0.30 411,766 0.37 485,067 0.44
Artificial resin, plastic materials 6,270,210 5.29 7,139,882 5.18 7,827,678 5.89 7,913,122 6.20 6,973,838 6.22 7,075,996 6.36
Furniture 261,448 0.22 365,781 0.27 371,420 0.28 340,918 0.27 325,487 0.29 321,963 0.29
Ships and other vessels 2,134,241 1.80 2,006,036 1.46 1,411,337 1.06 1,452,848 1.14 1,110,857 0.99 1,003,856 0.90
Paper materials 1,180,856 1.00 1,043,749 0.76 1,259,124 0.95 1,274,317 1.00 961,080 0.86 981,246 0.88
Parts of vehicles 3,013,552 2.54 3,890,143 2.82 3,995,442 3.01 3,527,161 2.76 2,987,819 2.66 3,124,393 2.81
Motor vehicle 4 wheels and more 5,842,187 4.93 7,580,873 5.50 4,627,083 3.48 3,266,401 2.56 2,202,997 1.96 2,070,963 1.86
Parts of machines 1,630,158 1.37 2,615,726 1.90 2,066,901 1.55 2,167,452 1.70 1,901,345 1.69 1,950,582 1.75
Fatty Acid 66,289 0.06 65,820 0.05 68,853 0.05 62,857 0.05 53,913 0.05 73,222 0.07
Computer and parts 2,707,714 2.28 2,641,069 1.92 2,758,276 2.07 2,465,939 1.93 2,312,212 2.06 2,043,105 1.84
Soap and detergent 263,520 0.22 325,142 0.24 329,083 0.25 348,722 0.27 305,795 0.27 291,224 0.26
USD thousand

276 2016 ECONOMIC REPORT ON INDONESIAAppendices
Value of Non-Oil and Gas Import By Commodities (cif) 1) - Continued
Items2011 2012 2013 2014 2015 2016*
Value Share (%) Value Share
(%) Value Share (%) Value Share
(%) Value Share (%) Value Share
(%)
Essential oils 683,025 0.58 849,363 0.62 1,098,519 0.83 1,014,065 0.79 952,198 0.85 1,024,407 0.92
Glass and glassware 320,015 0.27 398,987 0.29 395,404 0.30 374,295 0.29 307,417 0.27 344,843 0.31
Fertilizer 2,587,220 2.18 2,617,943 1.90 1,744,110 1.31 1,822,385 1.43 2,014,518 1.80 1,555,282 1.40
Sports requisites 185,708 0.16 248,572 0.18 233,121 0.18 160,270 0.13 157,148 0.14 209,966 0.19
Products of ceramic 259,801 0.22 425,998 0.31 320,347 0.24 369,382 0.29 326,269 0.29 371,983 0.33
Cattle fodder 2,208,054 1.86 2,783,272 2.02 3,044,755 2.29 3,274,681 2.56 2,736,151 2.44 2,481,302 2.23
Margarine and other fats 27,930 0.02 41,562 0.03 39,595 0.03 33,930 0.03 33,816 0.03 34,397 0.03
Products of pharmacy 513,397 0.43 560,115 0.41 612,677 0.46 685,807 0.54 717,287 0.64 775,540 0.70
Articles of gold 11,364 0.01 29,145 0.02 22,971 0.02 20,092 0.02 16,342 0.01 21,430 0.02
Leather and leather products 473,948 0.40 445,709 0.32 460,467 0.35 549,072 0.43 511,559 0.46 505,928 0.45
Disinfectant preparation 277,063 0.23 289,489 0.21 407,411 0.31 392,330 0.31 380,986 0.34 413,196 0.37
Aircraft and parts 2,014,855 1.70 2,320,848 1.68 1,495,957 1.13 675,982 0.53 797,216 0.71 769,763 0.69
Synthetic organic dyes 349,173 0.29 378,996 0.27 441,577 0.33 486,373 0.38 432,465 0.39 449,901 0.40
Cement 65,850 0.06 206,954 0.15 240,513 0.18 249,431 0.20 191,719 0.17 39,592 0.04
Motor vehicle 2 and 3 wheels 139,190 0.12 165,928 0.12 207,286 0.16 145,336 0.11 127,339 0.11 61,395 0.06
Wickerwork 3,740 0.00 1,751 0.00 1,354 0.00 2,387 0.00 2,804 0.00 2,068 0.00
Processed rattan 81 0.00 5 0.00 73 0.00 44 0.00 46 0.00 382 0.00
Container 16,253 0.01 14,359 0.01 21,626 0.02 21,487 0.02 13,207 0.01 9,331 0.01
Glicerol and lye 2,622 0.00 959 0.00 272 0.00 206 0.00 81 0.00 343 0.00
Other manufacture products
27,157,012 22.90 31,192,368 22.63 30,791,657 23.16 30,278,076 23.71 26,744,964 23.84 25,994,778 23.35
Mining Products and Other Sector Products
1,197,691 1.01 1,130,859 0.82 1,302,202 0.98 1,521,494 1.19 1,469,514 1.31 1,352,588 1.21
Coal 12,860 0.01 18,699 0.01 82,752 0.06 296,310 0.23 286,080 0.25 323,792 0.29
Copper ore 103,809 0.09 102,762 0.07 148,665 0.11 42,830 0.03 107,472 0.10 7 0.00
Nickel ore 0 0.00 11 0.00 6 0.00 0 0.00 0 0.00 27 0.00
Bauxite 421 0.00 716 0.00 811 0.00 280 0.00 734 0.00 476 0.00
Granite 8,853 0.01 9,883 0.01 6,971 0.01 8,205 0.01 6,799 0.01 6,174 0.01
Other mining products 1,071,747 0.90 998,788 0.72 1,062,997 0.80 1,173,870 0.92 1,068,428 0.95 1,022,112 0.92
Other Sector Products 2) 458,608 0.39 474,557 0.34 429,382 0.32 457,091 0.36 265,343 0.24 379,758 0.34
Unclassified Import 3) 71,097 0.06 43,071 0.03 32,398 0.02 25,620 0.02 706,213 0.63 832,126 0.75
Total, cif 126,104,929 106.36 145,980,103 105.89 140,399,394 105.60 134,899,810 105.61 118,176,348 105.34 117,032,088 105.11
Insurance and Freight 7,538,026 6.36 8,123,524 5.89 7,440,379 5.60 7,171,269 5.61 5,987,570 5.34 5,691,318 5.11
Total, fob 118,566,903 100.00 137,856,579 100.00 132,959,014 100.00 127,728,541 100.00 112,188,777 100.00 111,340,770 100.00
Notes:1) Commodity classification based on The Harmonized System (HS), not include goods procured in ports by carriers and repair on goods. Data disseminated by Bank Indonesia as supporting table for Indonesia’ Balance of Payments data2) Consist of arts goods and other goods not elsewhere specified, and goods procured in ports by carriers3) Consists of nonmonetary gold*Preliminary figures
Source: Bank Indonesia

2772016 ECONOMIC REPORT ON INDONESIA Appendices
Volume of Non-Oil and Gas Import By Commodity 1)Table 14.
Items2011 2012 2013 2014 2015 2016*
Value Share (%) Value Share
(%) Value Share (%) Value Share
(%) Value Share (%) Value Share
(%)Agricultural products 13,900 16.43 12,787 13.98 14,902 15.54 15,982 16.23 16,053 16.23 17,023 16.24
Cocoa bean 19 0.02 24 0.03 31 0.03 109 0.11 53 0.05 60 0.06Shrimp and prawn 6 0.01 7 0.01 8 0.01 7 0.01 6 0.01 6 0.01
Coffee bean 14 0.02 51 0.06 13 0.01 18 0.02 12 0.01 24 0.02Fish and other related 213 0.25 141 0.15 138 0.14 127 0.13 122 0.12 106 0.10
Spices 72 0.08 57 0.06 31 0.03 32 0.03 29 0.03 42 0.04Tea 19 0.02 23 0.03 20 0.02 14 0.01 14 0.01 19 0.02Vegetable materials 1 0.00 0 0.00 0 0.00 0 0.00 1 0.00 1 0.00
Fruits 781 0.92 781 0.85 505 0.53 548 0.56 434 0.44 478 0.46Tobacco 36 0.04 63 0.07 56 0.06 39 0.04 22 0.02 17 0.02Vegetables 896 1.06 791 0.86 784 0.82 853 0.87 711 0.72 742 0.71Resin and resin gums 1 0.00 1 0.00 1 0.00 2 0.00 2 0.00 1 0.00
Natural rubber 9 0.01 18 0.02 19 0.02 21 0.02 27 0.03 26 0.02Other agricultural products
11,830 13.98 10,831 11.84 13,296 13.86 14,213 14.43 14,621 14.78 15,501 14.79
Manufacture products 63,747 75.35 71,648 78.31 72,661 75.76 69,652 70.73 67,651 68.38 70,963 67.69
Palm oils 23 0.03 0 0.00 65 0.07 0 0.00 8 0.01 3 0.00Textile and textile products
1,075 1.27 1,252 1.37 1,317 1.37 1,358 1.38 1,315 1.33 1,487 1.42
Electrical apparatus, measuring instruments and optical
2,380 2.81 1,207 1.32 1,080 1.13 1,022 1.04 1,014 1.02 1,134 1.08
Base metal products 11,551 13.65 17,652 19.29 20,758 21.64 15,476 15.72 14,703 14.86 16,808 16.03
Processed rubber 329 0.39 304 0.33 426 0.44 290 0.29 274 0.28 294 0.28
Paper and paper products 3,143 3.72 3,066 3.35 3,053 3.18 3,016 3.06 2,417 2.44 2,874 2.74
Processed food 5,993 7.08 5,443 5.95 4,894 5.10 4,952 5.03 5,330 5.39 7,526 7.18
Chemicals 7,560 8.94 8,770 9.58 8,603 8.97 8,720 8.86 8,468 8.56 8,182 7.80Processed wood products 703 0.83 735 0.80 776 0.81 657 0.67 547 0.55 529 0.50
Footwear 52 0.06 58 0.06 57 0.06 50 0.05 49 0.05 66 0.06Artificial resin, plastic materials
3,455 4.08 3,401 3.72 3,709 3.87 3,718 3.78 3,817 3.86 4,238 4.04
Furniture 142 0.17 140 0.15 142 0.15 131 0.13 140 0.14 139 0.13Ships and other vessels 1,380 1.63 1,225 1.34 550 0.57 679 0.69 482 0.49 968 0.92
Paper materials 1,310 1.55 1,349 1.47 1,629 1.70 1,605 1.63 1,310 1.32 1,425 1.36
Parts of vehicles 463 0.55 537 0.59 550 0.57 533 0.54 451 0.46 501 0.48
Motor vehicle 4 wheels and more
532 0.63 663 0.72 458 0.48 337 0.34 247 0.25 227 0.22
Gold bar 0.00 0.00 0.00 177 0.18 168 0.17 174 0.17
Thousand ton
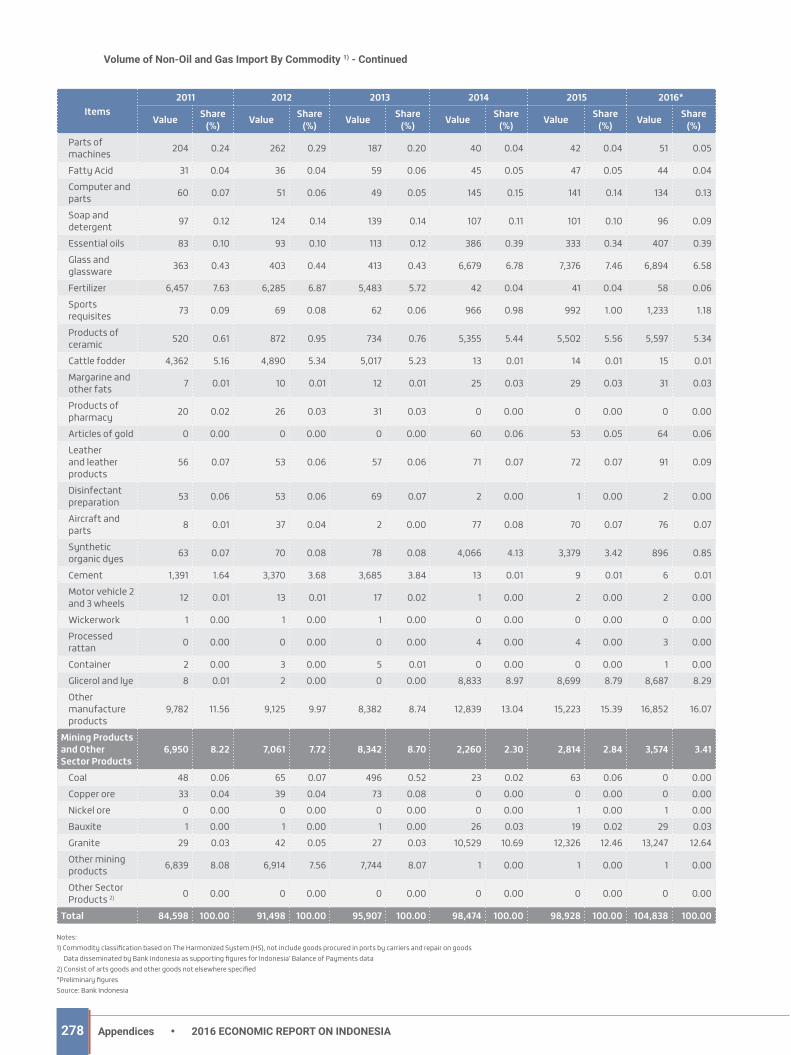
278 2016 ECONOMIC REPORT ON INDONESIAAppendices
Volume of Non-Oil and Gas Import By Commodity 1) - Continued
Items2011 2012 2013 2014 2015 2016*
Value Share (%) Value Share
(%) Value Share (%) Value Share
(%) Value Share (%) Value Share
(%)Parts of machines 204 0.24 262 0.29 187 0.20 40 0.04 42 0.04 51 0.05
Fatty Acid 31 0.04 36 0.04 59 0.06 45 0.05 47 0.05 44 0.04Computer and parts 60 0.07 51 0.06 49 0.05 145 0.15 141 0.14 134 0.13
Soap and detergent 97 0.12 124 0.14 139 0.14 107 0.11 101 0.10 96 0.09
Essential oils 83 0.10 93 0.10 113 0.12 386 0.39 333 0.34 407 0.39Glass and glassware 363 0.43 403 0.44 413 0.43 6,679 6.78 7,376 7.46 6,894 6.58
Fertilizer 6,457 7.63 6,285 6.87 5,483 5.72 42 0.04 41 0.04 58 0.06Sports requisites 73 0.09 69 0.08 62 0.06 966 0.98 992 1.00 1,233 1.18
Products of ceramic 520 0.61 872 0.95 734 0.76 5,355 5.44 5,502 5.56 5,597 5.34
Cattle fodder 4,362 5.16 4,890 5.34 5,017 5.23 13 0.01 14 0.01 15 0.01Margarine and other fats 7 0.01 10 0.01 12 0.01 25 0.03 29 0.03 31 0.03
Products of pharmacy 20 0.02 26 0.03 31 0.03 0 0.00 0 0.00 0 0.00
Articles of gold 0 0.00 0 0.00 0 0.00 60 0.06 53 0.05 64 0.06Leather and leather products
56 0.07 53 0.06 57 0.06 71 0.07 72 0.07 91 0.09
Disinfectant preparation 53 0.06 53 0.06 69 0.07 2 0.00 1 0.00 2 0.00
Aircraft and parts 8 0.01 37 0.04 2 0.00 77 0.08 70 0.07 76 0.07
Synthetic organic dyes 63 0.07 70 0.08 78 0.08 4,066 4.13 3,379 3.42 896 0.85
Cement 1,391 1.64 3,370 3.68 3,685 3.84 13 0.01 9 0.01 6 0.01Motor vehicle 2 and 3 wheels 12 0.01 13 0.01 17 0.02 1 0.00 2 0.00 2 0.00
Wickerwork 1 0.00 1 0.00 1 0.00 0 0.00 0 0.00 0 0.00Processed rattan 0 0.00 0 0.00 0 0.00 4 0.00 4 0.00 3 0.00
Container 2 0.00 3 0.00 5 0.01 0 0.00 0 0.00 1 0.00Glicerol and lye 8 0.01 2 0.00 0 0.00 8,833 8.97 8,699 8.79 8,687 8.29Other manufacture products
9,782 11.56 9,125 9.97 8,382 8.74 12,839 13.04 15,223 15.39 16,852 16.07
Mining Products and Other Sector Products
6,950 8.22 7,061 7.72 8,342 8.70 2,260 2.30 2,814 2.84 3,574 3.41
Coal 48 0.06 65 0.07 496 0.52 23 0.02 63 0.06 0 0.00Copper ore 33 0.04 39 0.04 73 0.08 0 0.00 0 0.00 0 0.00Nickel ore 0 0.00 0 0.00 0 0.00 0 0.00 1 0.00 1 0.00Bauxite 1 0.00 1 0.00 1 0.00 26 0.03 19 0.02 29 0.03Granite 29 0.03 42 0.05 27 0.03 10,529 10.69 12,326 12.46 13,247 12.64Other mining products 6,839 8.08 6,914 7.56 7,744 8.07 1 0.00 1 0.00 1 0.00
Other Sector Products 2) 0 0.00 0 0.00 0 0.00 0 0.00 0 0.00 0 0.00
Total 84,598 100.00 91,498 100.00 95,907 100.00 98,474 100.00 98,928 100.00 104,838 100.00
Notes:1) Commodity classification based on The Harmonized System (HS), not include goods procured in ports by carriers and repair on goods Data disseminated by Bank Indonesia as supporting figures for Indonesia’ Balance of Payments data2) Consist of arts goods and other goods not elsewhere specified*Preliminary figuresSource: Bank Indonesia
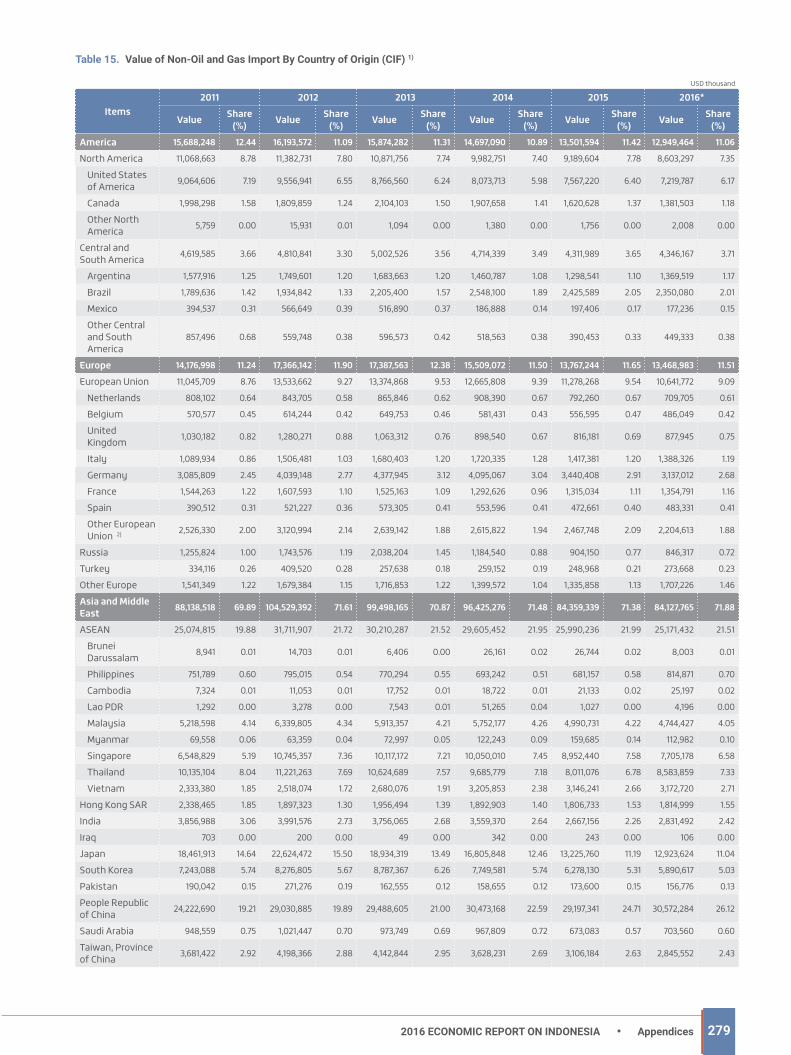
2792016 ECONOMIC REPORT ON INDONESIA Appendices
Value of Non-Oil and Gas Import By Country of Origin (CIF) 1)Table 15.
Items2011 2012 2013 2014 2015 2016*
Value Share (%) Value Share
(%) Value Share (%) Value Share
(%) Value Share (%) Value Share
(%)America 15,688,248 12.44 16,193,572 11.09 15,874,282 11.31 14,697,090 10.89 13,501,594 11.42 12,949,464 11.06
North America 11,068,663 8.78 11,382,731 7.80 10,871,756 7.74 9,982,751 7.40 9,189,604 7.78 8,603,297 7.35
United States of America 9,064,606 7.19 9,556,941 6.55 8,766,560 6.24 8,073,713 5.98 7,567,220 6.40 7,219,787 6.17
Canada 1,998,298 1.58 1,809,859 1.24 2,104,103 1.50 1,907,658 1.41 1,620,628 1.37 1,381,503 1.18
Other North America 5,759 0.00 15,931 0.01 1,094 0.00 1,380 0.00 1,756 0.00 2,008 0.00
Central and South America 4,619,585 3.66 4,810,841 3.30 5,002,526 3.56 4,714,339 3.49 4,311,989 3.65 4,346,167 3.71
Argentina 1,577,916 1.25 1,749,601 1.20 1,683,663 1.20 1,460,787 1.08 1,298,541 1.10 1,369,519 1.17
Brazil 1,789,636 1.42 1,934,842 1.33 2,205,400 1.57 2,548,100 1.89 2,425,589 2.05 2,350,080 2.01
Mexico 394,537 0.31 566,649 0.39 516,890 0.37 186,888 0.14 197,406 0.17 177,236 0.15
Other Central and South America
857,496 0.68 559,748 0.38 596,573 0.42 518,563 0.38 390,453 0.33 449,333 0.38
Europe 14,176,998 11.24 17,366,142 11.90 17,387,563 12.38 15,509,072 11.50 13,767,244 11.65 13,468,983 11.51
European Union 11,045,709 8.76 13,533,662 9.27 13,374,868 9.53 12,665,808 9.39 11,278,268 9.54 10,641,772 9.09
Netherlands 808,102 0.64 843,705 0.58 865,846 0.62 908,390 0.67 792,260 0.67 709,705 0.61
Belgium 570,577 0.45 614,244 0.42 649,753 0.46 581,431 0.43 556,595 0.47 486,049 0.42
United Kingdom 1,030,182 0.82 1,280,271 0.88 1,063,312 0.76 898,540 0.67 816,181 0.69 877,945 0.75
Italy 1,089,934 0.86 1,506,481 1.03 1,680,403 1.20 1,720,335 1.28 1,417,381 1.20 1,388,326 1.19
Germany 3,085,809 2.45 4,039,148 2.77 4,377,945 3.12 4,095,067 3.04 3,440,408 2.91 3,137,012 2.68
France 1,544,263 1.22 1,607,593 1.10 1,525,163 1.09 1,292,626 0.96 1,315,034 1.11 1,354,791 1.16
Spain 390,512 0.31 521,227 0.36 573,305 0.41 553,596 0.41 472,661 0.40 483,331 0.41
Other European Union 2) 2,526,330 2.00 3,120,994 2.14 2,639,142 1.88 2,615,822 1.94 2,467,748 2.09 2,204,613 1.88
Russia 1,255,824 1.00 1,743,576 1.19 2,038,204 1.45 1,184,540 0.88 904,150 0.77 846,317 0.72
Turkey 334,116 0.26 409,520 0.28 257,638 0.18 259,152 0.19 248,968 0.21 273,668 0.23
Other Europe 1,541,349 1.22 1,679,384 1.15 1,716,853 1.22 1,399,572 1.04 1,335,858 1.13 1,707,226 1.46
Asia and Middle East 88,138,518 69.89 104,529,392 71.61 99,498,165 70.87 96,425,276 71.48 84,359,339 71.38 84,127,765 71.88
ASEAN 25,074,815 19.88 31,711,907 21.72 30,210,287 21.52 29,605,452 21.95 25,990,236 21.99 25,171,432 21.51
Brunei Darussalam 8,941 0.01 14,703 0.01 6,406 0.00 26,161 0.02 26,744 0.02 8,003 0.01
Philippines 751,789 0.60 795,015 0.54 770,294 0.55 693,242 0.51 681,157 0.58 814,871 0.70
Cambodia 7,324 0.01 11,053 0.01 17,752 0.01 18,722 0.01 21,133 0.02 25,197 0.02
Lao PDR 1,292 0.00 3,278 0.00 7,543 0.01 51,265 0.04 1,027 0.00 4,196 0.00
Malaysia 5,218,598 4.14 6,339,805 4.34 5,913,357 4.21 5,752,177 4.26 4,990,731 4.22 4,744,427 4.05
Myanmar 69,558 0.06 63,359 0.04 72,997 0.05 122,243 0.09 159,685 0.14 112,982 0.10
Singapore 6,548,829 5.19 10,745,357 7.36 10,117,172 7.21 10,050,010 7.45 8,952,440 7.58 7,705,178 6.58
Thailand 10,135,104 8.04 11,221,263 7.69 10,624,689 7.57 9,685,779 7.18 8,011,076 6.78 8,583,859 7.33
Vietnam 2,333,380 1.85 2,518,074 1.72 2,680,076 1.91 3,205,853 2.38 3,146,241 2.66 3,172,720 2.71
Hong Kong SAR 2,338,465 1.85 1,897,323 1.30 1,956,494 1.39 1,892,903 1.40 1,806,733 1.53 1,814,999 1.55
India 3,856,988 3.06 3,991,576 2.73 3,756,065 2.68 3,559,370 2.64 2,667,156 2.26 2,831,492 2.42
Iraq 703 0.00 200 0.00 49 0.00 342 0.00 243 0.00 106 0.00
Japan 18,461,913 14.64 22,624,472 15.50 18,934,319 13.49 16,805,848 12.46 13,225,760 11.19 12,923,624 11.04
South Korea 7,243,088 5.74 8,276,805 5.67 8,787,367 6.26 7,749,581 5.74 6,278,130 5.31 5,890,617 5.03
Pakistan 190,042 0.15 271,276 0.19 162,555 0.12 158,655 0.12 173,600 0.15 156,776 0.13
People Republic of China 24,222,690 19.21 29,030,885 19.89 29,488,605 21.00 30,473,168 22.59 29,197,341 24.71 30,572,284 26.12
Saudi Arabia 948,559 0.75 1,021,447 0.70 973,749 0.69 967,809 0.72 673,083 0.57 703,560 0.60
Taiwan, Province of China 3,681,422 2.92 4,198,366 2.88 4,142,844 2.95 3,628,231 2.69 3,106,184 2.63 2,845,552 2.43
USD thousand
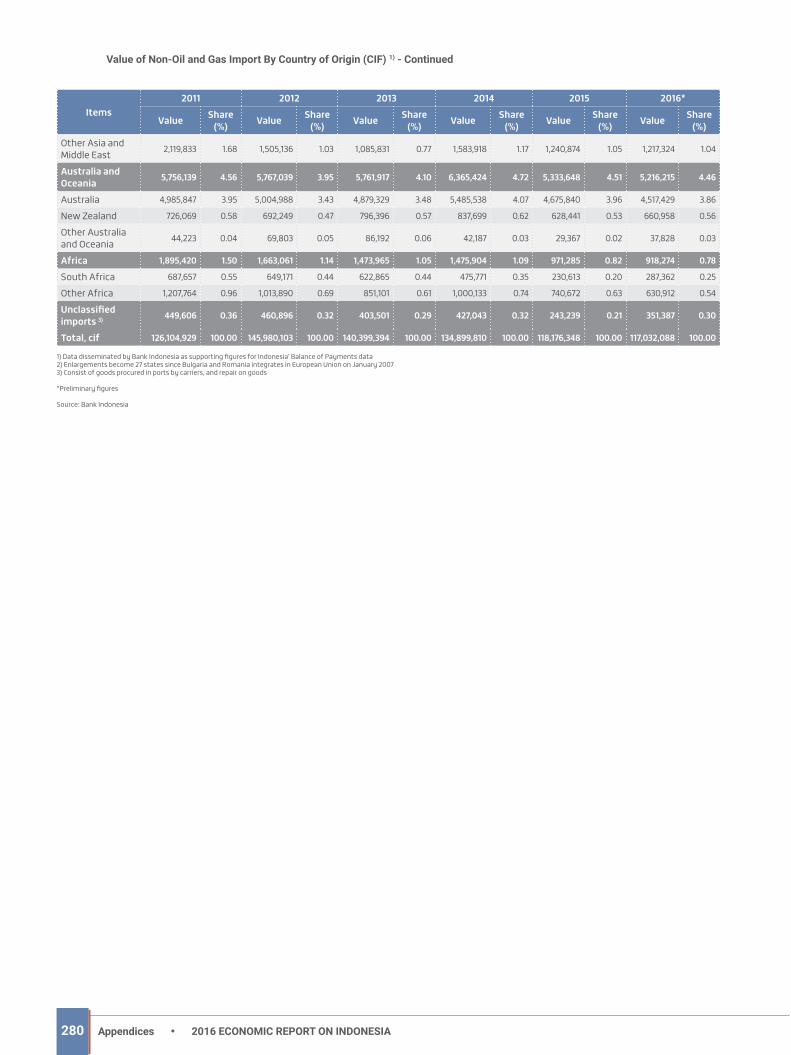
280 2016 ECONOMIC REPORT ON INDONESIAAppendices
Value of Non-Oil and Gas Import By Country of Origin (CIF) 1) - Continued
Items2011 2012 2013 2014 2015 2016*
Value Share (%) Value Share
(%) Value Share (%) Value Share
(%) Value Share (%) Value Share
(%)Other Asia and Middle East 2,119,833 1.68 1,505,136 1.03 1,085,831 0.77 1,583,918 1.17 1,240,874 1.05 1,217,324 1.04
Australia and Oceania 5,756,139 4.56 5,767,039 3.95 5,761,917 4.10 6,365,424 4.72 5,333,648 4.51 5,216,215 4.46
Australia 4,985,847 3.95 5,004,988 3.43 4,879,329 3.48 5,485,538 4.07 4,675,840 3.96 4,517,429 3.86
New Zealand 726,069 0.58 692,249 0.47 796,396 0.57 837,699 0.62 628,441 0.53 660,958 0.56
Other Australia and Oceania 44,223 0.04 69,803 0.05 86,192 0.06 42,187 0.03 29,367 0.02 37,828 0.03
Africa 1,895,420 1.50 1,663,061 1.14 1,473,965 1.05 1,475,904 1.09 971,285 0.82 918,274 0.78
South Africa 687,657 0.55 649,171 0.44 622,865 0.44 475,771 0.35 230,613 0.20 287,362 0.25
Other Africa 1,207,764 0.96 1,013,890 0.69 851,101 0.61 1,000,133 0.74 740,672 0.63 630,912 0.54
Unclassified imports 3) 449,606 0.36 460,896 0.32 403,501 0.29 427,043 0.32 243,239 0.21 351,387 0.30
Total, cif 126,104,929 100.00 145,980,103 100.00 140,399,394 100.00 134,899,810 100.00 118,176,348 100.00 117,032,088 100.00
1) Data disseminated by Bank Indonesia as supporting figures for Indonesia’ Balance of Payments data2) Enlargements become 27 states since Bulgaria and Romania integrates in European Union on January 20073) Consist of goods procured in ports by carriers, and repair on goods
*Preliminary figures
Source: Bank Indonesia

2812016 ECONOMIC REPORT ON INDONESIA Appendices
Value of Oil and Gas Export (fob)Table 16.
USD thousand
Rincian 2009 2010 2011 2012 2013 2014 2015* 2016**Export Value (in Millions of USD)
Oil and its product 8,290 11,635 14,821 14,648 17,889 13,806 7,833 6,267 Gas 9,002 12,840 17,663 17,860 15,700 14,946 9,351 6,620 - LNG 7,879 11,708 15,204 12,448 10,568 10,294 6,894 4,813 - LPG 24 8 74 9 11 4 7 1 - Natural Gas 980 900 2,164 5,402 5,121 4,648 2,444 1,763 - Other Gas 119 224 220 0 0 0 6 44 Total 17,292 24,475 32,484 32,507 33,588 28,752 17,184 12,887
Export VolumeOil and its product (in millions of Barrel) 152 156 149 132 170 143 156 156
Gas 1,452 1,896 1,711 1,411 1,253 1,182 1,159 1,165- LNG (in millions of MMBTU) 1,115 1,506 1,264 931 888 834 841 866
- LPG (in thousands of MT) 46 11 81 8 10 4 10 1
- Natural Gas (in millions of MMBTU) 137 123 207 472 355 347 317 295
- Other Gas 155 256 158 0 0 0 0 4Total 1,604 2,051 1,860 1,543 1,422 1,325 1,315 1,321
MMBTU: Million British Thermal UnitMT: Metric Ton* Preliminary figures** Very preliminary figures
Source: Bank Indonesia, calculated

282 2016 ECONOMIC REPORT ON INDONESIAAppendices
Money SupplyTable 17.
End of PeriodM1 1) Quasi Money 2) M2 3)
Outstanding Share (%) Outstanding Share
(%) OutstandingChanges (%)
Annual Quarterly2010 605,411 24.52 1,856,720 75.12 2,471,206 15.32 8.552011 722,991 25.13 2,139,840 74.37 2,877,220 16.43 8.852012 841,652 25.45 2,455,435 74.24 3,307,508 14.95 5.732013 887,084 23.78 2,820,521 75.61 3,730,409 12.79 4.08 2014
January 842,678 23.07 2,787,449 76.32 3,652,349 11.73February 834,532 22.96 2,787,035 76.67 3,635,060 10.81March 853,502 23.37 2,785,176 76.25 3,652,531 9.93 -2.09April 880,470 23.66 2,828,686 76.00 3,721,882 10.74May 906,727 23.98 2,860,135 75.65 3,780,955 10.35June 945,718 24.51 2,903,415 75.26 3,857,962 13.02 5.62 July 918,566 23.63 2,959,732 76.14 3,887,407 10.86August 895,827 23.05 2,982,674 76.74 3,886,520 10.97September 949,168 23.67 3,044,842 75.93 4,010,147 11.89 3.94 October 940,349 23.37 3,066,421 76.19 4,024,489 12.51November 955,535 23.44 3,099,350 76.03 4,076,670 12.74December 942,221 22.58 3,209,475 76.90 4,173,327 11.87 4.07
2015January 918,079 21.99 3,233,881 77.46 4,174,826 14.31February 927,848 22.00 3,278,945 77.73 4,218,123 16.04March 957,580 22.55 3,275,499 77.14 4,246,361 16.26 1.75 April 959,376 22.44 3,302,204 77.23 4,275,711 14.88May 980,915 22.87 3,293,147 76.79 4,288,369 13.42June 1,039,518 23.85 3,305,641 75.84 4,358,802 12.98 2.65 July 1,031,906 23.60 3,325,908 76.05 4,373,208 12.50August 1,026,323 23.30 3,362,148 76.34 4,404,085 13.32September 1,063,039 23.58 3,426,343 76.00 4,508,603 12.43 3.44 October 1,036,311 23.32 3,391,260 76.33 4,443,078 10.40November 1,051,191 23.61 3,386,209 76.05 4,452,325 9.21December 1,055,440 23.20 3,479,961 76.50 4,548,800 9.00 0.89
2016January 1,046,257 23.26 3,436,492 76.39 4,498,361 7.75February 1,035,551 22.90 3,473,033 76.80 4,521,951 7.20March 1,064,738 23.34 3,483,694 76.37 4,561,873 7.43 0.29 April 1,089,212 23.77 3,479,713 75.95 4,581,878 7.16May 1,118,768 24.25 3,483,442 75.50 4,614,062 7.59June 1,184,329 25.00 3,539,326 74.71 4,737,451 8.69 3.85 July 1,144,501 24.19 3,573,997 75.55 4,730,380 8.17August 1,135,548 23.93 3,596,408 75.78 4,746,027 7.76September 1,126,046 23.77 3,599,248 75.97 4,737,631 5.08 0.00 October 1,142,786 23.92 3,622,679 75.81 4,778,479 7.55November 1,182,730 24.29 3,671,427 75.41 4,868,651 9.35December 1,237,643 24.73 3,753,809 75.00 5,004,977 10.03 5.64
1) Consists of currency and demand deposits2) Consists of time deposits and savings, both in rupiah and foreign currency, and demand deposits in foreign currency held by residents3) Consists of narrow money (M1), quasi money, and securities other than stock with up-to-1 year maturity
Source: Bank Indonesia
Rp billion

2832016 ECONOMIC REPORT ON INDONESIA Appendices
Changes in Money Supply and Its Affecting FactorsTable 18.
Rp billion
Items 2011 2012 2013 2014 20152016
I II III IV
Money Supply
M2 2,877,220 3,307,508 3,730,409 4,173,327 4,548,800 4,561,873 4,737,451 4,737,631 5,004,977M1 722,991 841,652 887,084 942,221 1,055,440 1,064,738 1,184,329 1,126,046 1,237,643
Currency 307,760 361,897 399,609 419,262 469,534 420,214 511,295 469,542 508,124Demand Deposits 415,231 479,755 487,475 522,960 585,906 644,524 673,034 656,504 729,519
Quasi Money 2,139,840 2,455,435 2,820,521 3,209,475 3,479,961 3,483,694 3,539,326 3,599,248 3,753,809
Affecting Factors 2,877,220 3,307,508 3,730,409 4,173,327 4,548,800 4,561,873 4,737,451 4,737,631 5,004,977Net Foreign Assets 912,174 965,442 1,011,361 1,105,783 1,176,638 1,186,803 1,221,949 1,270,287 1,298,938Net Claims on Central Government
351,177 389,827 406,611 416,608 491,127 517,322 511,217 410,538 519,065
Claims on Other Sectors 2,383,823 2,917,452 3,526,612 3,961,583 4,318,126 4,309,736 4,451,853 4,535,305 4,711,239
Claims on Regional Government
1,410 2,790 4,727 6,635 6,516 6,779 6,969 1,245 589
Claims on Private Sectors 2,118,376 2,581,327 3,098,305 3,488,677 3,822,128 3,799,229 3,901,644 3,978,129 4,115,821
Net Other Assets -29,895 17,778 34,146 49,733 57,313 43,782 116,936 83,143 79,272
Source: Bank Indonesia

284 2016 ECONOMIC REPORT ON INDONESIAAppendices
Interest Rate on Time Deposits in Rupiah and Foreign Currency by Group of Banks 1)Table 19.
Percent
MaturityDecember 2011 December 2012 December 2013 December 2014 December 2015 December 2016
Rupiah Foreign Currency Rupiah Foreign
Currency Rupiah Foreign Currency Rupiah Foreign
Currency Rupiah Foreign Currency Rupiah Foreign
Currency
State Banks
1 month 6.04 1.32 5.22 0.95 7.15 1.11 8.12 1.81 7.14 0.73 6.24 1.03 3 months 6.62 2.11 5.54 1.11 7.60 1.38 8.73 1.61 7.25 0.73 6.35 1.01 6 months 6.54 2.05 5.58 1.98 6.84 1.37 8.83 1.99 7.56 1.21 6.61 1.17 12 months 6.94 1.47 5.91 1.66 6.88 1.69 8.80 1.75 7.87 1.43 6.83 0.79 24 months 6.40 1.25 5.87 1.23 8.19 0.94 9.34 0.65 9.09 1.85 7.32 1.80 Private National Banks1 month 6.62 1.81 5.96 2.06 8.53 2.48 9.04 2.34 7.89 1.23 6.58 0.94 3 months 6.91 2.03 5.81 2.14 7.53 2.51 9.11 2.53 8.35 1.36 7.04 1.22 6 months 7.28 2.41 6.18 2.40 7.61 2.64 9.54 2.59 8.84 1.68 7.31 1.25 12 months 7.05 1.93 5.82 2.47 6.79 2.39 8.58 2.52 8.36 1.64 7.16 1.03 24 months 5.83 0.41 4.23 2.63 7.43 3.28 7.33 2.67 9.09 2.52 7.12 2.62 Regional Government Banks1 month 7.39 2.09 5.92 2.03 7.55 2.60 8.05 2.76 7.81 1.42 7.32 2.53 3 months 8.04 6.29 6.69 2.48 8.41 2.82 9.03 2.64 8.26 1.11 7.49 2.13 6 months 8.24 1.00 6.60 1.55 7.81 1.45 9.35 1.09 8.42 1.10 7.83 0.81 12 months 8.41 1.28 7.08 1.04 7.32 1.80 9.10 1.52 9.21 0.62 8.39 1.56 24 months 7.63 - 6.65 1.20 7.44 1.15 7.70 1.04 7.68 0.53 7.23 0.50 Foreign and Joint Banks1 month 5.00 1.19 4.61 1.51 7.51 1.67 7.51 1.37 7.36 0.60 6.18 0.64 3 months 5.74 1.62 5.54 1.90 7.98 1.52 8.57 1.41 8.11 0.78 6.72 0.77 6 months 6.47 1.74 6.04 2.04 8.17 2.02 9.23 1.52 8.71 0.96 6.91 0.94 12 months 6.64 1.51 6.19 1.86 6.90 2.42 9.50 2.40 8.86 1.37 7.40 1.10 24 months 6.64 1.17 6.20 0.92 9.18 1.46 10.01 1.40 9.62 1.74 6.85 0.44 Commercial Banks1 month 6.35 1.53 5.58 1.48 7.92 1.80 8.58 2.00 7.60 1.00 6.50 0.97 3 months 6.81 1.90 5.76 1.86 7.61 2.07 8.94 2.18 7.99 1.13 6.78 1.11 6 months 7.19 2.11 6.05 2.20 7.49 2.10 9.30 2.23 8.54 1.38 7.15 1.18 12 months 7.06 1.69 6.09 2.09 6.89 2.14 8.79 2.25 8.47 1.54 7.33 0.94 24 months 6.33 0.80 5.47 1.63 8.17 2.01 9.26 1.96 9.07 2.22 7.23 2.16
1) Weighted average at end of periodSource: Bank Indonesia

2852016 ECONOMIC REPORT ON INDONESIA Appendices
Interest Rates of Credit on Rupiah (IDR) by Group of Banks 1)Table 20.
Percent
End of Period
State Banks Regional Government Banks Private National Bank Foreign and Joint Banks Commercial Bank
Working Capital Investment Working
Capital Investment Working Capital Investment Working
Capital Investment Working Capital Investment
2009 13.63 12.56 13.91 12.54 14.09 13.51 11.73 12.22 13.69 12.962010 13.06 10.81 13.57 12.44 13.02 13.20 10.23 11.82 12.83 12.282011 12.37 10.39 13.52 12.40 12.34 12.64 8.71 14.89 12.16 12.042012 11.70 10.08 13.66 12.25 11.68 11.88 7.90 9.47 11.49 11.27 2013March 11.72 10.07 13.44 12.20 11.58 11.82 8.04 9.44 11.44 11.24June 11.79 10.35 13.60 12.24 11.46 11.67 8.11 9.49 11.41 11.14September 11.71 10.53 13.61 12.27 12.15 12.16 9.23 10.24 11.80 11.50December 11.94 10.84 13.37 12.23 12.55 12.51 9.84 10.71 12.12 11.822014January 12.05 10.91 13.34 12.21 12.68 12.63 9.96 10.87 12.23 11.92February 12.06 10.96 13.34 12.27 12.86 12.69 10.09 11.04 12.33 11.98March 12.09 10.98 13.36 12.23 12.87 12.72 10.20 10.97 12.37 12.00April 12.23 11.04 13.30 12.34 12.79 12.77 10.19 10.99 12.38 12.06May 12.38 11.13 13.19 12.18 13.19 12.96 10.25 11.04 12.63 12.18June 12.26 11.20 13.24 12.21 13.29 13.02 10.27 11.00 12.63 12.24July 12.34 11.40 13.27 12.22 13.36 13.06 10.41 10.78 12.70 12.32August 12.42 11.43 13.21 12.22 13.43 13.07 10.44 10.91 12.76 12.34September 12.44 11.44 13.24 12.23 13.43 13.08 10.44 10.94 12.78 12.34October 12.52 11.48 13.72 12.51 13.39 13.13 10.49 10.94 12.82 12.39November 12.53 11.48 13.84 12.40 13.41 13.13 10.41 10.90 12.84 12.38December 12.50 11.47 13.63 12.38 13.36 13.11 10.49 10.93 12.79 12.362015January 12.52 11.47 13.56 12.25 13.31 13.02 10.39 10.59 12.76 12.29February 12.55 11.45 13.38 12.13 13.29 13.03 10.26 10.51 12.74 12.27March 12.65 11.49 13.71 12.37 13.36 13.06 10.26 10.47 12.82 12.32April 12.64 11.45 13.71 12.36 13.25 13.06 10.23 10.77 12.75 12.32May 12.61 11.45 13.72 12.38 13.20 13.02 10.21 10.75 12.72 12.30June 12.60 11.46 13.74 12.39 13.17 13.02 10.18 10.60 12.70 12.29July 12.54 11.46 13.56 12.18 13.14 12.98 10.28 10.68 12.65 12.26August 12.59 11.45 13.47 12.45 13.03 12.87 10.30 10.67 12.63 12.21September 12.48 11.44 13.47 12.52 13.00 12.83 10.51 10.78 12.58 12.19October 12.43 11.42 13.45 12.25 12.98 12.85 10.72 10.95 12.58 12.19November 12.36 11.40 13.66 12.44 12.92 12.77 10.79 11.13 12.55 12.14December 12.30 11.35 13.50 12.19 12.82 12.77 10.79 11.25 12.46 12.122016January 12.26 11.34 13.46 12.18 12.88 12.48 10.71 11.25 12.46 11.96February 12.16 11.27 13.22 12.17 12.88 12.49 10.51 11.12 12.40 11.93March 12.05 11.18 13.14 12.16 12.81 12.40 10.06 10.83 12.28 11.83April 11.83 11.04 13.12 12.09 12.73 12.32 9.90 10.52 12.14 11.71May 11.68 10.99 12.62 11.81 12.58 12.18 9.75 10.34 11.97 11.60June 11.52 10.89 12.80 11.77 12.43 12.08 9.64 10.28 11.82 11.49July 11.44 10.84 12.78 11.63 12.40 12.04 9.61 10.35 11.78 11.45August 11.36 10.81 12.75 11.61 12.38 12.02 9.44 10.37 11.73 11.42September 11.19 10.72 12.76 11.76 12.31 11.97 9.35 10.29 11.61 11.36October 11.15 10.71 12.69 11.60 12.31 11.98 9.27 10.16 11.59 11.34November 11.09 10.63 12.65 11.42 12.22 12.05 9.21 10.12 11.52 11.33December 10.83 10.42 12.59 11.49 12.10 11.94 9.22 10.32 11.35 11.20
1) Weighted averageSource: Bank Indonesia

286 2016 ECONOMIC REPORT ON INDONESIAAppendices
Flow of Bank Notes within Bank Indonesia Head Office and Regional OfficesTable 21.
Office2011 2012 2013 2014 2015 2016
In Out In Out In Out In Out In Out In OutSumatera Region 57,900.3 80,092.2 65,910.6 85,234.6 74,281.8 97,846.7 86,023.1 102,338.2 86,497.0 109,185.1 97,763.5 121,991.7
Nanggroe Aceh Darussalam
2,308.0 6,338.1 2,619.6 6,378.0 4,035.8 8,242.4 4,567.0 8,632.4 4,709.8 9,636.6 5,774.9 11,310.6
North Sumatra 23,237.8 22,176.5 25,980.6 22,494.6 26,674.6 22,284.0 30,499.9 26,389.3 30,253.6 27,877.1 34,426.9 31,958.8
South Sumatra 9,384.5 5,299.7 11,192.1 6,434.3 13,151.6 7,204.7 14,102.9 7,060.0 13,308.8 7,470.7 14,078.2 9,197.8
Riau 3,012.5 12,434.1 4,447.3 13,013.8 6,286.8 15,974.0 6,356.3 15,157.5 7,156.5 15,788.6 8,210.9 17,645.0 Riau Islands 1,426.3 5,818.6 2,236.0 6,965.6 2,295.2 9,257.9 2,563.0 10,231.5 3,217.7 9,802.5 4,316.5 10,067.6 Jambi 1,867.6 5,216.7 2,138.5 5,013.2 3,864.9 8,018.7 5,169.1 8,379.3 4,978.1 8,324.5 4,398.2 7,774.0 South Sumatra 7,820.3 14,523.6 9,126.0 15,600.1 8,056.5 14,350.6 10,039.8 13,262.9 10,797.2 13,483.7 12,751.7 15,755.9
Bengkulu 1,153.1 2,560.5 1,201.3 2,959.3 2,642.0 4,262.8 3,261.5 4,561.9 2,791.3 4,851.5 2,888.9 5,162.7 Lampung 7,690.1 5,724.4 6,969.2 6,375.6 7,274.3 8,251.6 9,450.1 8,341.1 8,107.5 9,945.2 9,373.1 10,435.5 Bangka Belitung 13.7 322.1 1,176.6 2,004.8 1,544.2 2,683.8
Special Capital Region - Jakarta
62,958.0 101,604.4 76,664.9 136,466.6 84,525.8 149,240.8 92,103.0 152,275.9 100,424.8 163,749.4 115,684.4 170,613.7
Java's Region (excluding Jakarta)
123,916.7 83,511.4 160,482.3 111,362.6 200,722.0 137,567.4 217,301.9 147,069.0 230,140.4 171,567.5 261,606.6 190,567.8
West Java 43,774.9 20,781.8 60,629.0 28,894.9 72,420.8 35,821.4 78,660.2 40,856.6 81,302.7 47,062.7 88,036.1 49,404.8 Central Java 35,136.8 19,975.1 43,298.1 28,492.9 57,317.7 37,673.4 60,475.4 39,110.2 65,198.1 46,840.5 72,781.7 53,659.3 Special Region - Yogyakarta
6,489.8 7,537.8 9,172.7 9,486.0 13,984.1 12,072.6 13,890.7 13,171.1 14,831.2 14,079.7 17,350.1 13,012.8
East Java 38,515.2 35,216.7 47,382.5 44,488.8 56,999.4 52,000.1 64,275.6 53,931.2 68,808.4 63,584.7 83,438.7 74,490.8 Eastern Indonesia Region
48,650.1 82,407.4 63,198.8 96,487.6 77,347.9 105,352.5 88,792.6 110,393.6 92,694.7 121,178.9 109,548.7 127,264.8
Bali 6,394.3 8,911.8 8,202.5 10,781.8 10,433.2 13,145.0 11,599.9 13,103.6 13,071.7 14,470.6 17,913.7 18,139.6 West Nusa Tenggara 1,802.6 3,818.7 3,675.7 4,379.1 4,516.4 5,179.4 5,694.4 5,619.5 6,285.0 6,727.9 8,841.7 8,149.2
East Nusa Tenggara 2,125.2 3,693.1 2,735.0 4,259.6 3,168.8 4,708.7 3,512.4 4,663.1 3,651.2 5,529.6 4,210.0 5,652.3
West Kalimantan 2,830.8 5,221.4 3,385.7 5,698.1 4,029.1 6,011.1 5,942.5 6,735.8 6,675.5 8,485.6 7,439.8 9,402.2
Central Kalimantan 778.8 6,849.9 1,134.8 7,740.6 1,896.7 8,031.5 1,887.4 8,309.8 3,546.9 10,190.2 3,694.3 10,131.2
South Kalimantan 5,369.1 5,125.7 7,311.0 5,579.8 8,471.1 6,419.1 9,613.8 6,264.8 9,558.4 6,754.6 10,809.5 7,424.3
East Kalimantan 4,293.3 12,337.5 5,743.2 14,425.7 7,542.2 17,550.8 8,935.6 17,425.6 9,646.0 16,514.4 10,903.2 15,221.2
North Sulawesi 5,671.0 6,606.3 6,634.6 6,375.0 7,436.4 4,738.8 7,374.5 7,207.1 6,286.3 7,202.2 7,265.6 7,707.4
Central Sulawesi 1,562.9 4,017.5 1,884.8 4,457.9 2,585.6 5,045.5 3,000.1 5,731.1 2,593.3 5,309.8 2,665.3 4,962.4
South Sulawesi 10,593.5 8,967.2 13,701.5 11,872.6 16,805.3 14,149.9 19,384.3 15,645.6 19,583.1 16,235.7 21,043.3 15,493.6
South-East Sulawesi 659.4 2,888.8 963.6 2,950.2 1,392.7 3,511.4 2,255.7 3,537.5 2,384.8 4,715.8 3,490.9 4,488.0
West Sulawesi 536.1 1,514.0
North Maluku 586.2 1,631.0 632.6 1,677.2 895.9 2,016.6 1,005.8 1,815.6 1,006.5 2,397.0 1,259.1 2,246.5
Rp billion

2872016 ECONOMIC REPORT ON INDONESIA Appendices
Flow of Bank Notes within Bank Indonesia Head Office and Regional Offices - Continued
Office2011 2012 2013 2014 2015 2016
In Out In Out In Out In Out In Out In OutMaluku 1,272.8 2,352.4 1,147.1 2,689.7 1,388.7 2,716.3 1,781.0 2,865.8 1,789.5 3,123.3 2,367.2 3,309.1 Papua 4,710.1 9,986.1 6,046.8 13,600.2 6,785.9 12,128.3 6,793.7 11,298.5 6,099.0 11,623.5 6,291.4 11,500.0 West Papua 11.7 170.1 517.5 1,898.6 817.7 1,923.8
Notes: Bangka Belitung and West Papua Offices begin its activity on year 2014.
Source: Bank Indonesia

288 2016 ECONOMIC REPORT ON INDONESIAAppendices
Glossary
Term Description
Administered Prices Inflation predominantly influenced by shocks from government policy and prices, for example prices of subsidized fuels, electricity billing rates, and transport fares
Advanced Economy (AE) Group of developed countries, among others, reflected by the GDP and the high level of industrializationAging Population Increasing median age in the population of a region due to declining fertility rates and/or rising life expectancyBack-to-back loan Bank loan backed by liquid collateral Bank Indonesia Policy Mix Bank Indonesia policy by combining monetary, macroprudential, and payment system policiesSystemic bank Banks that have significant impact on the domestic financial systemBarrel Unit of volume, normally used in international oil trading
Base effect The consequences of the abnormally (either high or low) from previous period, thus affecting the growth rate in the current period
BI Rate The policy rate reflecting the monetary policy stance adopted by Bank Indonesia
Brexit Stand for British Exit; a commonly used term for the United Kingdom's withdrawal from the European Union (EU)
BUKU Grouping of banks in Indonesia based on bank's core capital
Call option An agreement that gives an investor the right, but not the obligation, to buy financial instrument at specified price and time
Capital control Regulation to limit capital flows from capital market
Capital flows The movement of money for the purpose of investment, trade or business production can be either inflow or outflow
Capital reversal Sudden reversal on the direction of capital inflowsChinese Rebalancing Chinese policies aimed at ensuring consumption-led growth and limiting credit expansion for investment
Circuit breaker The mechanism by which price fluctuations have reached the threshold, the securities trading activity will be suspended for a certain period of time
Clean money policy Policy for replacement of damaged or soiled currency with currency fit for circulation in order to improve the quality standard of currency in circulation
Cluster Group of business that are close each other, normally used in term of Micro, Small and Medium Scale Enterprise
Consensus Forecast Future predictions made by combining several separate forecasts made with the use of different methodologies
Consolidated fiscal policy Fiscal policy aimed at reducing government's balance deficit Consumption smoothing Tendency of consumer to have stable path of consumption over time
Core Inflation Persistent component in inflation movements, influenced by fundamentals such as demand-supply interaction, exchange rate, international commodity prices, trading partner inflation and inflation expectations
Cost-push inflation
Inflation arising from pressure from the supply side. The factors driving cost push inflation may arise from depreciation in the exchange rate, impact of imported inflation, particularly in trading partner nations, increases in administered prices and the occurrence of negative shocks due to natural disasters and disruption to distribution
Counter cyclical Moving in the opposite direction of the overall economic cycle
Countercyclical capital buffer (CCB) A policy aimed at preventing the occurrence of systemic risk due to periods of excessive channeling of loans through the establishment of additional capital for bank
Crisis Management Protocol Procedure for crisis management that establishes the protocol for deploying a management team and defines the roles and responsibilities of the members of the team
Currency Appreciation The rise in currency (the rupiah for Indonesia) against foreign currenciesCurrency Depreciation The down in currency (the rupiah for Indonesia) against foreign currenciesCurrent Account Balance Part of balance of payments that records a nation’s flow of goods and servicesDeflation General decline in prices of goods and services
Demand Deposit Deposits at banks in which withdrawal may be made on demand using a cheque or other payment order or by book-keeping transfer
Deposit Facility Placement of rupiah funds by banks at Bank IndonesiaDeposit Rate Rate of interest on a bank depositDerivatives Derivative products are contracts, agreements, or transactions whose value is derived from a productDivestment the opposite of an investment; reduction of assetDovish Thought/Advisor that is pro to low interest rate o to improve labor market and economic performance Down Payment Pre-payment, payment before delivery of goods/services
Dutch Disease The phenomenon of concentration of the economy to the extractive activities in line with abundance of natural resources, so that other sectors are slowing down
e-commerce Online trading
El Nino and La Nina El Nino is a warm phase and La Nina is a cool phase of a recurring seasonal pattern in the Pasific tropics. El Nino and La Nina caused changes in global temperature and precipitation.
2892016 ECONOMIC REPORT ON INDONESIA Appendices
Term Description
Electronic money
Electronic money, i.e. a payment instrument with the following features: (1) issued on the basis of the value of money paid in advance to the issuer; (2) monetary value is stored electronically on a medium such as server or chip; (3) used as an instrument for payments to merchants who are not issues of the electronic money; and (4) the value of the electronic money paid in by the holder and managed by the issuer does not constitute a deposit as referred to in the laws governing banking.
Emerging Market (EM) Group of nations with rapidly growing economies, reflected among others in their financial markets development and industrialization
Energy Security The state described as energy is available and affordableEuro Currency of the countries in the EurozoneExecutive orders Orders (binding like Act) issued by the President of the US directly to US Federal government officials or agents Export Sale of goods or commodities from one country to another.
Financial inclusion The right of every individual to have full access to quality financial services on a timely, convenient and clearly defined basis at affordable cost
Financial Literacy The ability to understand how money works in the world: how someone manages to earn or make it, how that person manages it, how he/she invests it (turn it into more) and how that person donates it to help others
Financial technology (Fintech) Innovation that combines the functions of Finance (Financial) with TechnologyFirst line of defense First line of defense in form of prudent and consistent monetary and banking policy
Fiscal stimulus The government's fiscal policy aimed at encouraging aggregate demand is further expected to impact on short-term economic activity
Food Security The state described as food is available (not fluctuating due to season), affordable, and has food quality / safety
Foreign Direct investment Foreign Investment that is directly to firm Foreign-exchange reserves Money or other assets held by a central bank or other monetary authority to pay foreign liabilitiesForward Contract to buy or sell the asset at a certain price in the future dateFull employment The state in which the labor that is willing to work in an economy can be used as efficiently as possible
Gen-Y or Millenial Generation Generations born in the early 1980s s.d. 1990s, normally this generation use digital technology and internet intensively
Geo-politics Political conditions influenced by geographical factors.Gini Ratio Coefficient that measures the degree of inequality income distribution in societyGreen economy Economy that aims to achieve sustainable growth without degrading the quality of the environmentHawkish Thought/Advisor that is pro to high interest rate to achieve inflation target Hedging Techniques of mitigating risks arising from price fluctuations on the financial marketImport Activity of purchasing goods from overseasImported inflation Inflation caused by price increases for imported goodsInflation expectation The public's expectations for inflation Interoperability Capability of a system to interact and function with other systems without limitation of access
Investment Accumulation of a form of assets with the expectation of earning profit in the future. At times, investment is also referred to as capital investment
Investment grade Rating that indicates that a municipal or corporate bond has a relatively low risk of defaultLending Facility Provision of rupiah funds by Bank Indonesia to banks
Lifting Volume of oil taken from stock, transported by tanker or pipeline and sold to buyers. In other words, lifting is oil production that is ready for sale
Liquidity Ratio A company's ability to pay short term debt/liabilitiesM1 Narrow measure of money (currency outside banks and demand deposits)
M2 Broad measure of money (currency outside banks, demand deposits, quasi-money and securities other than stocks)
Macroprudential Approach to financial regulation with the aim of mitigating risks in the overall financial system
Microprudential Prudential approach related to the management of an individual financial institution so that its survival in ensured
Middle income trap A situation where a country’s economic growth slows after reaching middle income levels. The growth is not enough to bring the country into high-income levels
Minas National oil consist of crude oil, oil and petrol oil.Mismatch The difference in maturities between assets and liabilities side of a financial institution
Monetary Authority An entity that has the authority to control the money supply in a country and have the right to set interest rates and other parameters that determine the cost and supply of money
Monetary easing Monetary policy for boosting economic performance judged to be moving too slowly. Example: lowering interest rates
Glossary
290 2016 ECONOMIC REPORT ON INDONESIAAppendices
Glossary
Term Description
Monetary Tightening Monetary policy for restraining economic performance judged to be moving too fast. Example: raising interest rates
Money of circulation Original rupiah money that meets the requirements to be circulated based on quality standards stipulated by Bank Indonesia
Multiplier A factor of proportionality that measures how much an endogenous variable changes in response to a change in some exogenous variable
New Economy The economy that relies on services and technology (intangible assets)Non tradable See tradable definitionsNostro A foreign currency account of a bank that is in a foreign correspondent bankOffshore Foreign exchange transactions conducted outside the territory of the country that issues the currencyOld Economy The economy that relies on the manufacture and commodities (tangible assets)Onshore Foreign exchange transactions conducted within the territory of the country that issues the currencyOutput gap The difference between actual GDP and potential GDPPayment system System related to transfer of an amount of money from one party to another partyPeer countries Group of countries with similar characteristics
Phising The fraudulent practice of sending emails purporting to be from reputable companies in order to induce individuals to reveal personal information, such as passwords and credit card numbers
Policy Mix The combination of several policies taken at the same time
Poverty Gap Index Average measure of gap between individual spending by the poor and the poverty line. The greater the index, the lower the average spending per person compared to the poverty line, or the deeper the level of poverty
Poverty line A minimum income level used as an official standard for determining the proportion of a population living in poverty
Poverty Severity Index Measurement of the distribution of spending among the poor. The higher the index, the greater the disparity among the poor themselves
Prefunding Initial financingPrice bubble Price surge on the fundamentalsPrimary balance The state's total revenue minus total expenditures excluding interest payment componentsProcyclical The policy is in line with the economic cycle
Protectionism Trade restriction policy through import tariff policy, quota restrictions, etc. This policy usually aims to protect the domestic industry
Quantitative Easing Policy for monetary loosening or augmenting the monetary stimulus by the central bank by purchasing financial assets in a certain volume from commercial banks or other private institutions
Real effective exchange rate An index that describes the strength of a currency against another country's basket of currencies (basket of other currencies)
Refinancing Replace a loan with another loan
Repatriation The process of returning an asset, an item of symbolic value or a person - voluntarily or forcibly - to its owner or their place of origin or citizenship
Repurchase Agreement Transaction for the sale of a securities instrument between two parties followed by an agreement in which repurchase of the same securities will be executed at an agreed price at a future date
Return Yield or profit, i.e. one factor motivating investors to invest and also rewarding an investor’s courage in assuming the risks of his investment
Reverse Repo Transaction for purchase of securities with a commitment to resell at an agreed term and priceRisk Adjusted Return The result of an investment by taking into account the risks associated with an investment productRisk aversion Investor tendency to avoid risk
Safe Haven Currency Currency that has a low risk and is believed to be a currency that is stable in value compared to other currencies. Currencies that include categories include US dollars
Samurai Bond Yen-denominated bond issued in Japan by non-Japanese company
Second line of defense Strengthening of second layer resilience is in the form of cooperation of regional financial system resilience (regional financial arrangement) and bilateral cooperation with partner country
Second round effect Impact of propagation
Shale oil It is an oil extracted from sedimentary rocks containing a shale hydrocarbon content. Shale oil substitutes from crude oil (crude oil) as well as other types of carbon energy such as coal
Shortfall Failure / deficit of what was originally projectedSkimming An electronic method of capturing a victim's personal information used by identity thieves
Smelter Facility for processing mined ore with the function of increasing metal content to a level that meets a standard as raw material for end products
Solvency The ability of the company to pay all its obligationsSpot Forex transactions with settlement on the same day or maximum within two days

2912016 ECONOMIC REPORT ON INDONESIA Appendices
Term Description
Start-up company An entrepreneurial venture which is typically a newly emerged, fast-growing business that aims to meet a marketplace need by developing or offering an innovative product, process or service
Stress test Simulation to test the resistance of a system to the shockStructural reform Changes from a system
Subsidy Form of financial assistance paid by the government to producers, distributors, consumers and the public in defined areas
Sukuk Long-term created securities based on sharia principles
Sunset Policy The policy of granting tax facilities, which was effective only in 2008, in the form of the elimination of administrative sanctions in the form of interest taxes
Surveillance Observation or monitoring of activities, behaviour or other changes in information of a target
SwapA transaction / contract to buy or sell foreign currency against another (foreign) currency on a particular currency date at the same time an agreement to sell or repurchase at a different currency date in the future, at a price specified on the contract date. Both transactions are executed at once and with the same counterparty.
Taper tantrum Volatility in financial markets is related to the probability of a tapering off policy conducted by the Fed
Tax amnesty Tax abolition for taxpayers who do not meet the obligation to pay taxes in exchange for paying taxes at a lower rate
Tax evader Individuals and companies that illegally reduce or avoid tax obligations
Term Deposit An amount of funds placed at a bank or other financial institution for a minimum term before it may be withdrawn without incurring a penalty. Also referred to as time deposit
Term of trade Ratio of export prices to import pricesThe Fed The central bank of the United States, comprising an independent entity within government administration
Time deposit An amount of funds placed at a bank or other financial institution for a minimum term before it may be withdrawn without incurring a penalty
Tradable Economic sectors whose output can be traded internationally, for example the manufacturing sectorTraded Core Inflation Core inflation reflecting external pressures
Troughput The ratio of total transactions completed for a given period on day x to the total transactions completed on day x
Trump Effect The effects are related to the election of US president Donald Trump
Unconventional monetary policyMonetary policy adopted by monetary institutions when interest rates have reached zero (zero lower bound), so to provide stimulus to the economy can not use interest rates but using other policies such as quantitative easing
Volatile food Inflation predominantly influenced by shocks in the food category, such as harvests, adverse natural elements or factors in the movement of domestic food commodity prices or movement in international food commodity prices
Yield Income or profit or return that will be obtained from investment
Glossary

292 2016 ECONOMIC REPORT ON INDONESIAAppendices
No. Abbreviation Description1 ACI Association Cambiste Internationale2 ADB Asian Development Bank3 AE Advanced Economies4 AFI Alliance for Financial Inclusion 5 LA/D Liquid Assets to Deposits6 LA/NCD Liquid Assets to Non Core Deposit7 AMRO ASEAN+3 Macroeconomic Research Office8 AP Administered Prices 9 APBD Regional Government Budget10 APBN State Budget11 APBN-P Revised State Budget12 APEC Asia Pasific Economic Cooperation13 APIK Financial Information Recording Application14 APMK Card Payment Instrument15 APP Asset Purchase Programme
16 APRACA Asia-Pacific Regional Conference on Rural Finance and Community Development
17 APU dan PPT Anti Money Laundering and Combating Financing of Terrorism
18 ARRA American Recovery and Reinvestment Act 19 ASDP River, Lake and Crossing Transport20 ASEAN Association of South-East Asian Nations21 ASN State Civil Apparatus22 ATM Automated Teller Machine 23 ATMR Risk Weighted Assets24 BAZNAS National Amil Zakat Body 25 BBM Oil Based Fuel26 BBRT Household Fuel27 BI-CAC Bank Indonesia Counterfeit Analysis Center 28 BI-RTGS Bank Indonesia – Real Time Gross Settlement 29 BIS Bank for International Settlements30 BI-SCN BI-SSSS Central Node 31 BI-SPP BI-SSSS Participant Platform
32 BI-SSSS Bank Indonesia Scripless Securities Settlement System
33 BKPM Investment Coordinating Board34 BLU Public Service Agency35 BOPO Operating Expenses to Operating Revenues
36 Botasupal Coordinating Agency for Eradication of Counterfeit Money
37 BPD Regional Development Bank38 BPJT Toll Road Regulatory Board39 BPS Statistics Indonesia40 Brexit British Exit41 BRIC Brazil, Russia, India, dan Tiongkok42 BSA Bilateral Swap Arrangement 43 BUJP Security Services Enterprise44 BUKU Commercial Banks by Group of Operations45 Bulog National logistics Agency46 BUMD Municipal Enterprises47 BUMN State Owned Enterprises48 BUS Sharia Based Commercial Bank49 BWI Indonesian Waqf Board50 CAR Capital Adequacy Ratio 51 CBP Government Rice Buffer Stock
No. Abbreviation Description52 CCB Countercyclical Capital Buffer 53 CCP Central Counterparty 54 CDD Customer Due Diligence 55 CDM Cash Deposit Machine56 CDS Credit Default Swap57 CeBM Central Bank Money 58 CF Consensus Forecast 59 CFETS China Foreign Exchange Trade System60 CiV Cash in Vault61 CKPN Privision for Impairment Loss62 CMIM Chiang Mai Initiative Multilateralization 63 COP-21 the 21st Conference on Parties Agreement64 CP Commercial Paper 65 CPI Consumer Price Index66 CPO Crude Palm Oil 67 CRM Cash Recycling Machine
68 CSD/SSS Central Securities Depository/Securities Settlement System
69 DAU General Allocation Funds70 DBH Revenue Sharing Funds71 DER Debt to Equity Ratio 72 DF Deposit Facility73 DIRE Real Estate Investment Funds74 DJP The Directorate General of Taxation75 DOC Day Old Chick 76 DP Down Payment 77 DPK Deposits78 DRC Disaster Recovery Center 79 DVP Delivery Versus Payment 80 DXY Dollar Index Spot81 EBA Asset- Backed Securities
82 EBITDA Earning Before Interest Taxes Depreciation and Amortization
83 EDC Electronic Data Capture84 EM Emerging Markets85 EMEAP Executives Meeting of East Asia Pacific 86 EODB Ease of Doing Business 87 ETF Exchange-Traded Fund88 ETP Electronic Trading Platform 89 EU European Union90 FDI Foreign Direct Investment91 FFR Federal Funds Rate92 FGD Focus Group Discussion 93 FinTech Financial Technology 94 FKMM Macro-Micro prudential Coordination Forum
95 FK-PPPK Coordination Forum for Development Financing through Financial Markets
96 FKSSK Financial System Stability Coordination Forum97 FLI Intraday Liquidity Facility98 FOMC Federal Open Market Committee99 FSAP Financial Sector Assessment Program100 FSB Financial Stability Board101 FTV Financing to Value 102 GFI Global Financial Integrity
Abbreviations

2932016 ECONOMIC REPORT ON INDONESIA Appendices
No. Abbreviation Description103 GMRA Global Master Repo Agreement 104 GNNT National Non-Cash Movement
105 G-SIFIs Global Systemically Important Financial Institutions
106 GWM Reserve Requirement
107 GWM LFR Reserve Requirement based on Loan to Funding Ratio
108 HBKN National Religious Day109 HCS Perfectly Printed Currency110 HIMBARA Community of State Owned Banks111 HJE Retail Price112 ICOC Islamic Financial Market Code of Conduct 113 ICR Interest Coverage Ratio 114 IFEMC Indonesia Foreign Exchange Market Committee 115 IHK Consumer Price Index116 IHPB Wholesale Price Index117 IHPR Residential Property Price Index118 IKNB Non-Bank Financial Institutions119 IMBT Ijarah Muntahiya Bittamlik120 IMF International Monetary Fund
121 IOSCO International Organization of Securities Commission
122 IPO Initial Public Offering123 IRSM Indonesia Single Risk Management
124 IRTI-IDB Islamic Research and Training Institute-Islamic Development Bank
125 ISN National Iron Stock126 ISSK Financial System Stability Index127 ITF Inflation Targeting Framework 128 JCI Indonesia Composite Index129 JIBOR Jakarta Interbank Offered Rate 130 JISDOR Jakarta Interbank Spot Dollar Rate 131 KAI State Owned Indonesian Railway Company132 KCJ Operator of PT KAI for Jabodetabek Region133 KEKP Tourism Special Economic Zone134 KFLN Overseas Financial Obligation135 KKB Motor Vehicle Loan136 KMK Working Capital Loan137 KNKS National Committee for Sharia Finance138 KPA Apartment Ownership Loan139 KPBI Bank Indonesia Head Office140 KPPK Implementation of Prudential Principles141 KPR Housing Loan142 KPw BI Bank Indonesia Representative Office143 KPwDN-BI Bank Indonesia Regional Representative Office144 KSEI Indonesian Central Securities Depository145 KSPN National Tourism Strategic Zone146 KSSK Financial System Stability Committee147 KTI Eastern Region of Indonesia148 KUBE PKH Joint Venture Group of Hope Family Program149 KUPVA Foreign Exchange Business Activity150 KUPVA BB Non-Bank Foreign Exchange Business Activity151 KUR Small Business Loan152 KURBE Export-Oritented Small Business Loan153 LA/D Liquid Assets to Deposits
No. Abbreviation Description154 LA/NCD Liquid Assets to Non Core Deposit155 LAZ Amil Zakat Body156 LBU Commercial Bank Report157 LCGC Low Cost Green Car158 LCS Local Currency Settlement159 LDR Loan to Deposit Ratio 160 LED Local Economic Development 161 LF Lending Facility162 LFR Loan to Funding Ratio 163 LGFV Local Government Financial Vehicles 164 LKD Digital Financial Services165 LMAN State Asset Management Institution166 LNG Liquid Natural Gas 167 LNPRT Non-Profit Household Institution168 LPP Supervisory and Regulatory Institution169 LPPI Infrastructure Development Financing Institution170 LPS Indonesia Deposit Insurance Corporation171 LTV Loan-to-value 172 LU Business Sector173 Mbpd Million Barrel per Day174 MEA ASEAN Economic Society175 Migas Oil and Gas176 MRA Master Repo Agreement 177 mtm month to month178 MTN Medium term notes179 Musrenbang Development Planning Deliberation Forum180 NAFTA North American Free Trade Agreement
181 NAIRU Non-Accelerating Inflation Rate Of Unemployment
182 NCD Negotiable Certificate of Deposit183 NG Natural Gas184 NIM Net Interest Margin185 NK Memorandum of Understanding186 NKRI Republic of Indonesia187 NPG National Payment Getaway188 NPI Balance of Payment Indonesia189 NPL Non-Performing Loan
190 NSICCS National Standard of Indonesian Chip Card Specification
191 NTT East Nusa Tenggara192 O/N Overnight193 OCA Overseas Current Account
194 OECD The Organization for Economic Co-operation and Development
195 OHC Overhead Costs196 OIC Organization of Islamic Cooperation 197 OJK Financial Services Authority198 OM Monetary Operation199 OP Individual200 OPEC Organization Petroleum of Exporting Countries201 OPT Open Market Operation202 OVI Optically Variable Ink 203 PAD Regionally Generated Revenues204 PBB Land and Property Tax
Abbreviations

294 2016 ECONOMIC REPORT ON INDONESIAAppendices
No. Abbreviation Description205 PBoC People’s Bank of China206 PCE Private Consumption Expenditure207 PDB Produk Domestik Bruto208 Pelni National Shipping Company of Indonesia209 Pergub Governor Decree210 PFMIs Principles for Financial Market Infrastructures 211 PIHPS Center of Strategic Food Price Information212 PII International Investment Position213 Pilkada Regional Head Elections214 Pilpres Presidential Election215 PIRAC Public Interest Research and Advocacy Center 216 PJPUR Rupiah Processing Services Operator217 PK Working Guidelines218 PKE Economic Policy Package219 PKH Family Hope Program220 PLTU Steam-driven Power Station221 PMA Foreign Investment222 PMI Purchasing Managers' Index223 PMK Crisis Management Protocol224 PMN State Capital Participation225 PNBP Non Tax Revenue226 PNS Civil Servants227 PP Finance Companies228 PPh Income Tax229 PPI Producer Price Index
230 PPKSK Prevention and Resolution of Financial System Crisis
231 PPN Value Added Tax232 PPP Public Private Partnership 233 PTK Financial Transactions Accounting234 PTKP Nontaxable Income235 PTSP One Stop Integrated Service236 PUAB Interbank Money Market237 PUPR Ministry of Public Works and Housing238 PYD Disbursed Loan239 QE Quantitative Easing240 Rakor Pusda National - Regional Coordination Meeting241 Rakornas National Coordination Meeting242 Rastra Rice for Prosperous Family Food Aid Program243 RBI Reserve Bank of India 244 RCEP Regional Comprehensive Economic Partnership245 RCN RTGS Central Node 246 RFCC Residual Fluid Catalytic Cracking 247 RIRU Regional Investor Relations Unit248 RKPD Regional Government Work Plan249 ROA Return on Assets250 ROE Return on Equity251 RWA Risk Weighted Assets252 RPJMD Provincial Medium-term Development Plan253 RPJMN National Medium Term Development Plan
254 RPK National Logistics Agency Program for Food Affordability and Sustainability
255 RPP RTGS Participant Platform256 RTRW Regional Spatial Plan
No. Abbreviation Description257 RUEN National Energy General Plan258 RUPS Shareholders General Meeting259 Satgas Task Force260 SBI Bank Indonesia Certificates261 SBN Government Securities262 SBR Savings Bond Retail 263 SBSN Sharia Based Government Securities264 SDA Natural Resources265 SDBI Bank Indonesia Certificates of Deposit266 SDM Human Resources267 SDR Special Drawing Rights268 SILPA Budget Financing Surplus269 S-INVEST Integrated Investment System270 SIPS Systemically Important Payment System 271 SKDU Business Survey272 SKNBI Bank Indonesia National Clearing System273 SLA Service Level Agreement 274 SLC Senior Level Committee 275 SNKI National Financial Inclusion Strategy276 SPAM Drinking Water Supply System277 SSB Securities278 SSK Financial System Stability279 SUN Indonesia Government Bond280 TA Tax Amnesty281 TB Current Account282 TD BB Non-Bank Fund Transfer283 TE Emission Year284 TFA Trade Facilitation Agreement 285 TKA Foreign Workers286 TKI Indonesian Migrant Workers287 TLAC Total Loss Absorbing Capacity 288 TMF Capital and Financial Account289 TPAK Labor Force Participation Rate290 TPI Inflation Monitoring and Controlling Team
291 TPID Regional Inflation Monitoring and Controlling Team
292 TPMSE Trade Transactions Through Electronic System293 TPP Trans Pacific Partnership294 TPT Textile and Textile Products295 TTL Electricity Tariffs296 TUKAB Interbank Cash Transactions297 UKA Foreign Bank Notes298 ULN Foreign Debt299 UMKM Micro, Small Medium Enterprises300 UMP Provincial Minimum Wage301 US United States302 USD United States Dollars 303 UTLE Currency Unfit for Circulation 304 UU Legislation
305 UU PPKSK Act on Financial System Crisis Prevention and Resolution
306 UUS Sharia Business Unit307 UV Ultra violet 308 UYD Money in Circulation
Abbreviations

2952016 ECONOMIC REPORT ON INDONESIA Appendices
No. Abbreviation Description309 Valas Foreign Currency310 VF Volatile food 311 VIX Volatility Index312 WC-FINC Working Committee on Financial Inclusion313 WCP Waqf Core Principles
314 WCPSS Working Committee on Payment and Settlement System
315 WIOD World Input Output Database316 WJI West Java Incorporated 317 WP Taxpayer318 WTO World Trade Organization319 yoy year on year
320 ZCP Zakat Core Principles
Abbreviations

Editorial Team
Steering Committee
Chief Editors
Chief Authors
Authors
Production and Dissemination Team
Contributors
Dody Budi Waluyo, Juda Agung
Yoga Affandi, Firman Mochtar, Bambang Pramono
Nugroho Joko Prastowo, Donni Fajar Anugrah, Dian Prima Susiandri
Agus Taufik; Angsoka Yorintha P.; Archi Hilmardhany; Asrianti Mira A.; Bambang Satya Permana; Bayu Panji Permono; Beny Okta Tutuarima; Darius Tirtosuharto; Deasy Ariyanti; Fenty Tirtasari E.; Ferry Kurniawan; Handri Adiwilaga; Hayatullah Khumaeni; Herriman Budi S.; I Nyoman Agus Wirya; Indra Astrayuda; Irene Hennywati; Irfan Sukarna; Karina Arti; Linda Nurliana P.; Meliana Rizka; Merlin Dwi Yuniar; Minda Putri Dwinanda; Neva Andina; Nurkholisoh Ibnu Aman; Olga Desiani; Pakasa Bary; Prayudhi Azwar; Ragil Misas Fu’adi; Rikie Fasha; Rizki Fitrama; Sinta Atharinanda; Syachman Perdymer; Tumpak Silalahi; Vidi Adyatama Nugraha; Yanfitri; Yenny Fridayanti; Zulfia Fatma
Illinia Ayudhia Riyadi; Rio Khasananda; Saraswati
Department of Economic and Monetary PolicyDepartment of Monetary ManagementDepartment of Macroprudential PolicyDepartment of Payment System Policy and OversightDepartment of StatisticDepartment of InternationalDepartment of Currency ManagementDepartment of Financial Access and MSMEs DevelopmentCenter of Bank Indonesia’s Transformation ProgramDepartment of Regional IDepartment of Regional IIDepartment of Regional III