appendices c t : e b c o - council of canadian … and... · science advice in the public interest...
TRANSCRIPT

Science Advice in the Public Interest
Report of the Expert Panel on Biodiversity Science
Canadian Taxonomy: Exploring BiodivErsiTy, CrEaTing opporTuniTy
appEndiCEs

Appendices Canadian Taxonomy: Exploring Biodiversity, Creating Opportunity
Contents
Appendix 1: Survey of Taxonomic Expertise in Canada . . . . . . . . . . . . 1
Appendix 2: Survey of Canadian Collections . . . . . . . . . . . . . . . . . . . . 22
Appendix 3: University-run Canadian Field Stations for Biodiversity Discovery . . . . . . . . . . . . . . . . . 44
Appendix 4: Employment, Funding, and Publication Trends in Canadian Biodiversity Science . . . . . . . . . . . . 45

1Appendix 1 Survey of Taxonomic Expertise in Canada
Appendix 1 Survey of Taxonomic Expertise in Canada
1. BACKGROUND
This appendix is a summary of the key results of the survey of taxonomic expertise. It does not contain conclusions or findings, as these are found in the panel’s assessment report, of which this is an appendix. The complete data set on which this appendix is based (with identifying information of respondents removed) is freely available on request from the Council of Canadian Academies by contacting [email protected].
In November 2009, the Council of Canadian Academies convened an expert panel to conduct an assessment of:
“The state and trends of biodiversity science in Canada: Are we equipped to understand the challenges of our biodiversity resources?”
This assessment was requested by the Minister of Canadian Heritage on behalf of the Canadian Museum of Nature, and supported by other members of the Federal Biodiversity Information Partnership. The charge to the panel focuses specifically on the state of taxonomy in Canada — research that discovers, distinguishes, classifies, and documents living things. The Panel’s report can be found at: http://www.scienceadvice.ca/biodiversity.
As part of their response to the charge, the Panel launched evidence-gathering activities, which included an online survey of taxonomic expertise in Canada, an online survey of Canadian natural history collections, and a public call for evidence.

2 Appendices Canadian Taxonomy: Exploring Biodiversity, Creating Opportunity
1 .1 Survey Distribution On 8 December 2009, the Council of Canadian Academies’ Expert Panel on Biodiversity Science launched a survey of taxonomic expertise in Canada. Information in both English and French inviting participation in the survey was distributed widely through:
a) Email distribution by Council staff: Council of Canadian Academies’ staff contacted 520 university, government, and private and non-profit researchers and technicians by email. Council staff also used email listservs to distribute the survey to the membership of the following (listed in alphabetical order): the Alberta Mycological Society, Biological Society of Canada, Canadian Arthropod Survey, Canadian Paleontology Coalition, Canadian Society for Ecology and Evolution, Canadian Society of Microbiologists (CSM), Canadian Society for Systems Biology (CSB), Canadian Society of Zoologists (CSZ), COSEWIC (Committee on the Status of Endangered Wildlife in Canada), Entomological Collections Network, Entomological Society of Canada (ESC), Entomo-l listserve, International Society for Evolutionary Protistology (ISEP), International Society of Protistologists (ISOP), Mycological Society of Toronto, Paleontological Society, South Vancouver Island Mycological Society, Taxacom, and Vancouver Mycological Society.
b) The website: The Council of Canadian Academies placed a notice on its website, inviting participation in the survey of taxonomic expertise.
All emails and the website notice encouraged recipients to further distribute information about the survey, and to post it to websites and listservs as appropriate. As a result, total reach of this distribution is unknown. The survey, hosted by Survey Monkey (www.surveymonkey.com), closed on 8 February 2010.
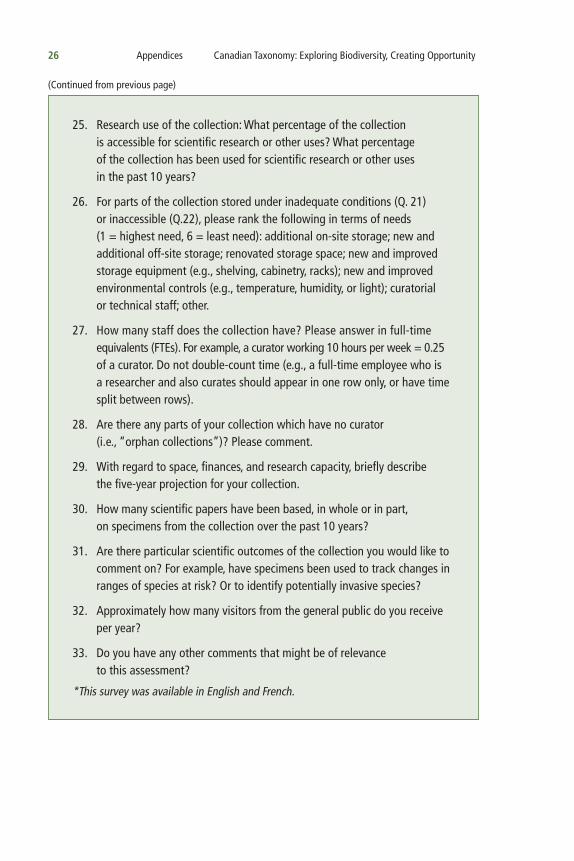
1 .2 Survey QuestionsThe survey questions and background information are provided in Box A1.1. To save space, answer options are not listed. Please contact the Council of Canadian Academies to see the full survey as it was distributed.

3Appendix 1 Survey of Taxonomic Expertise in Canada
Box A1 .1Survey Questions The Council of Canadian Academies’ Expert Panel on Biodiversity Science (http://www.scienceadvice.ca/biodiversity) is conducting an assessment of biosytematics and taxonomy in Canada. As part of this assessment, the Panel is seeking information about taxonomic research and expertise in Canada. This information will be used to inform the Panel’s report to the Government of Canada.
If you have taxonomic expertise (broadly defined, irrespective of taxon), please fill out the following survey and forward the link to colleagues. All responses will be treated in confidence.
We are aware that certain areas of biodiversity research, such as microbial metagenomics, involve the mass characterization and enumeration of many species by molecular sequencing of environmental samples. Unless such work is undertaken primarily for the purposes of defining taxonomic relationships or results in the collection of isolated strains or their DNAs, it is not the kind of activity we mean to encompass in this survey.
Questions about the survey should be addressed to Wendy Shen ([email protected]).
The Panel is also conducting a survey of collections in Canada and a public call for evidence. Please see http://www.scienceadvice.ca/biodiversity.html for more details.*
1. Which of the following best describes your position?
2. Which of the following best describes your place of work?
3. Where is your institution?
4. Approximately how many hours per week do you spend on the following activities?
5. Are you male or female?
6. Your age range.
7. Please indicate what best describes your formal education and training (select all that apply).
8. How long have you been working in taxonomy?
9. What is your broad taxa of expertise?
10. Please indicate the taxon or taxa for which you have recognized expertise. Organize in order of expertise; the first three will provide the basis for subsequent questions.
(Continued on next page)

4 Appendices Canadian Taxonomy: Exploring Biodiversity, Creating Opportunity
11. Taxonomic expertise is a broad subject, please specify the areas in which you consider yourself an expert. As a taxonomic expert (indicate as many as apply):
12. Rough number of species within your area of expertise (see Q. 9 and 10).
13. What best describes the main habitat(s) of your taxa of expertise? Pick up to three.
14. What best describes the main location(s) of your taxa of expertise? Pick up to three.
15. Describe your published work: numbers and types of publications.
16. What is the approximate annual research funding for your taxonomic work (excluding your own salary)?
17. Have you received infrastructure funding to support your research?
18. Has taxonomic work you and/or your trainees have performed had applied outcomes (e.g., medical, agricultural, control of invasive species, protection of endangered species)? If so, please describe briefly.
19. Please describe any other evidence of impact of your taxonomic work (e.g., important collaborations, facilitating research in specific areas, etc.)
20. Cite examples, either in your work, or of others, of leadership by Canada in worldwide taxonomy and systematics. This leadership could have been or could be achieved by accomplishments in methods, results, or training. If relevant, differentiate between the past (e.g., 1980 to 2000), the present (2001 to 2009), or potential for leadership in the near future.
21. Training: numbers of students supervised.
22. Do you teach a class covering the principles of taxonomy and systematics?
23. Any other comments for the panel?
*This survey was available in English and French.
(Continued from previous page)

5Appendix 1 Survey of Taxonomic Expertise in Canada
2. PROFILE OF RESPONDENTS
The questionnaire was completed by 432 respondents; 87% (378) answered in English and 13% (54) in French. Of the 432 respondents, 30% (129) were women and 70% (303) were men.
2 .1 EducationOut of the 432 respondents, 72% (311) held a PhD, 16% (71) held a masters degree and 9% (37) held a bachelors degree. Only 3% (13) did not report holding any diploma. More specifically, 269 respondents with PhDs reported having a focus on taxonomy or elements of training in taxonomy, while 228 respondents with masters degrees and 272 respondents with bachelors degrees reported having similar training.1
2 .2 AgeAs shown in Figure A1.1, age of respondents ranged from under 30 to over 70 years old. The largest groups of respondents were between 51 and 60 years old (112 respondents) and between 31 and 40 years old (106 respondents).
1 If a respondent reported a location OR a subject OR funding for a bachelors, masters, or PhD degree, he or she was considered to have held that degree.
0
20
40
60
80
100
120
Over 7061–7051–6041–5031–40 20–30
Num
ber
of r
espo
nden
ts
Age range (years)
47
106
86
57
112
24
(Council of Canadian Academies)
Figure A1.1
Age distribution of survey respondents

6 Appendices Canadian Taxonomy: Exploring Biodiversity, Creating Opportunity
2 .3 LocationOut of the 432 respondents, 429 responded to the question, “Where is your institution?” Of these, 414 reported a location within Canada, 6 were in the U.S., 6 were in countries other than the U.S., and 3 reported their location as not applicable. The profiles of respondents reporting to be outside Canada were examined and a decision was made to keep them in the analysis because they had strong associations with Canada (e.g., a Canadian working as a post-doctoral fellow in the United States).
Respondents’ work locations covered every Canadian province and territory, except Nunavut. As shown in Figure A1.2, the province with the largest number of taxonomic experts responding to the survey was Ontario, followed by Quebec, Alberta, and British Columbia.
0
Number of experts
126
70
126
17
1618
11
3
2
1 0
62
67 21
(Council of Canadian Academies)
Figure A1.2
Location of survey respondents across Canada

7Appendix 1 Survey of Taxonomic Expertise in Canada
3. EMPLOYMENT
3 .1 Position HeldThe most common position held by survey respondents were university professor (31%) and government research scientist (16%). However, as Table A1.1 shows, respondents held a variety of other positions (e.g., museum curator, research scientist, or bioinformatician).
Table A1.1
Position held by survey respondents
Position Number Percentage
University professor 132 31
Research scientist (gov’t) 70 16
Graduate student 48 11
Museum curator 28 6
Research technician 28 6
Retired 25 6
Post-doctoral fellow 24 6
Research scientist (private sector) 15 3
Research scientist (other than gov’t or private) 11 3
Amateur/volunteer 11 3
Databaser/bioinformatician 6 1
Other 34 8
Total 432 100
(Council of Canadian Academies)
If a respondent reported more than one position (e.g., university professor and museum curator), each position was counted 1/total number of positions. As a result, the total number of respondents to the survey remained at 432, even if multiple answers were provided for that question.
The age distribution of survey respondents varied according to their position. See Figure A1.3 for more details (only the three largest categories are displayed: university professor, government research scientist, and graduate student).

8 Appendices Canadian Taxonomy: Exploring Biodiversity, Creating Opportunity
4. TAXONOMIC RESEARCH
4 .1 Taxa Being StudiedThe most common taxonomic groups of specialization among respondents were insects (26% of respondents) and dicots (12% of respondents). No other groups represented more than 10% of total responses, though vertebrates combined for 18% (see Figure A1.4).
In the concurrent survey of Canadian collections carried out by the Panel (see Appendix 2), insects represented 57% of all specimens in Canadian collections. Fish and dicots each represented 7%. This data suggests that taxa with the highest numbers of experts in Canada are also those with the highest numbers of specimens in collections.
The expertise available in Canada varies greatly by taxa. Relative to other taxa, fish, tetrapods, and plants are well represented by Canadian taxonomists, whereas algae, fungi, lichens, and invertebrates are less well represented, given the number of species in Canada. For example, with an estimated 1,500 fish species in Canada, the survey reports 32 taxonomic experts in this area. In contrast, although Canada has an estimated 16,500 species of fungi and lichen, the survey found only 25 experts (see Figure A1.5).
Over 7061–7051–6041–5031–40 20–30
� University professor
� Graduate student
� Research scientist (gov’t)
Num
ber
of r
espo
nses
Age range (years)
0 0
32 33
13 14 13
0
31
2
11
0 0
39 40
17
3 2
0
5
10
15
20
25
30
35
40
(Council of Canadian Academies)
Figure A1.3
Age distribution of respondents broken down by the three most common types of positions

9Appendix 1 Survey of Taxonomic Expertise in Canada
Number of experts
Algae
Archae
Amphibians and reptiles
Angiosperms: Dicots
Angiosperms: Monocots
Annelids
Bacteria
Birds
Bryophytes
Cnidaria and ctenophores
Crustaceans
Echinoderms
Fish
Fossils
Fungi
Gymnosperms
Insects
Lichens
Mammals
Other minorinvertebrate phyla
Molluscs
Nematodes
Other arthropods (excl.insects and crustaceans)
Platyhelminthes
Porifera
Protists
Pteridophytes
Viruses
19
12
52
14
4
20
10
9
3
15
3
32
113
11
18
3
7
22
6
22
8
2
2
10
6
2
7
0
(Council of Canadian Academies)
Figure A1.4
Broad taxa of expertise reported by survey respondents

10 Appendices Canadian Taxonomy: Exploring Biodiversity, Creating Opportunity
Respondents were asked more precisely about their area of expertise through the question, “Please indicate the taxon or taxa for which you have recognized expertise.” Canadian taxonomists reported a huge diversity of taxonomic groups. The wide range of responses and the different levels described (orders, families, genera) prevented general analysis, but did provide a valuable reference archive of taxa being studied by Canadian taxonomists in 2009–2010. This list is available from the Council of Canadian Academies at [email protected] (see also Figure A1.6).
Num
ber o
f tax
onom
ic e
xper
ts
10,000 20,000 30,000 40,000 50,000 60,000
Vertebrate
Invertebrates (excl. insects)
Insects
FishFungi & Lichens
Algae
Plants
Number of estimated species in Canada
0
50
100
150
200
(Data Source: Gagnon & Fitzgerald, 2004; Mosquin et al., 1995 & Council of Canadian Academies)2, 3
Figure A1.5
Number of experts versus estimated number of speciesData on the broad taxa of expertise from Figure A1.4 are shown relative to the number of estimated species in Canada (Table 5.1 in the Panel’s report). The line represents the line of proportionality; expertise is underrepresented for points below this line. Taxa used in this figure correspond to those in Table 5.1. Not all taxa are covered.
2 Gagnon, J. and G. Fitzgerald (2004). Towards a national collection strategy: reviewing existing holdings. Museums and the Future of Collecting S. J. Knell. Burlington, Vermont, Ashgate Publishing Limited: 215–221.
3 Mosquin, T., Whiting, P. G., & McAllister, D. E. (1995). Canada’s Biodiversity: the Variety of Life, its Status, Economic Benefits, Conservation Costs and Unmet Needs: The Canada Country Study of Biodiversity. Ottawa: Canadian Museum of Nature.

11Appendix 1 Survey of Taxonomic Expertise in Canada
ExpertiseRespondents were asked about their taxonomic expertise within their main taxon of specialization. Out of the 432 respondents, 92% declared that they are able to identify species, and 50% stated that they are recognized internationally as an expert. Also, 42% of respondents reported using genetic techniques (see Table A1.2).
Table A1.2
Types of taxonomic expertise
Expertise Number Percentage
I can identify species 397 92
I can recognize, with keys or reference materials, species within this group
355 82
I am recognized internationally as an expert 218 50
I have written species descriptions 223 52
I have written a taxonomic revision or monograph 173 40
I have been trained in taxonomy 254 59
I use genetic resources 181 42
(Council of Canadian Academies)
Self-reported expertise by survey respondents do not add to 100% as multiple answers were allowed.
coleoptera
angiosperms
hymenoptera
acaribirds
carabidaediptera fish
lepidoptera mammalia
vascularplants
araneae
insecta
algae amphipoda
bacteria bryophyta
cestoda
ephemeroptera family fungi
hyphomycetes
lichens odonata
orthoptera pleuronectiformes proteobacteria salix
trichoptera zooplankton
amphipods annelida
aquatic artiodactyla asteraceae bees braconidae
carex chiroptera cichlidae
collembola culicidae cyperaceae
ichneumonidae
marine muscidae opiliones
phytoplankton platyhelminthes rhodophyta
(Council of Canadian Academies)
Figure A1.6
Taxa of expertiseCloud map of the most common responses to the freeform question, “Please indicate the taxon or taxa for which you have recognized expertise.” TagCrowd functionality was used to make this figure (Daniel Steinbock, http://www.tagcrowd.com/).

12 Appendices Canadian Taxonomy: Exploring Biodiversity, Creating Opportunity
Habitat and Location of Main Taxa of ExpertiseA total of 368 respondents reported the main habitat for their primary taxa of expertise. Freshwater habitats were most commonly reported (23%, 86 responses), however all habitats proposed in the survey were represented (see Figure A1.7).
As shown in Figure A1.8, 343 respondents indicated a main location for their taxa of expertise. All provinces and territories were covered although there were few experts for taxa specific to large territories with low human population density such as Nunavut and the Northwest Territories (respectively one and two researchers).
0
10
20
30
40
50
60
70
80
90
Tund
raSoil
Non-
hum
an co
mm
ensa
ls/pa
rasit
es
Mar
ine
Hum
an co
mm
ensa
ls/pa
rasit
es
Gras
sland
Fresh
water
Dese
rt
Bore
al
Arcti
c
Agric
ultur
al ha
bitat
s
Num
ber
of r
espo
nses
Habitat of main taxa of expertise
25
9
78
10
37
62
118
86
7
35
(Council of Canadian Academies)
Figure A1.7
Habitat of main taxa of expertise

13Appendix 1 Survey of Taxonomic Expertise in Canada
4 .2 ActivitiesRespondents were asked the average amount of time each week they dedicated to different types of taxonomic activities. As shown in Figure A1.9, 25% of respondents spent more than 10 hours per week on taxonomic research, 5% spent more than 10 hours per week on curatorial activities, and 13% spent more than 10 hours per week on identification. Teaching and administration were also part of many respondents’ daily activities: 15% and 14% spent more than 10 hours per week respectively on teaching and administration.
0
10
20
30
40
50
Unite
d St
ates
Sout
h Am
erica
Midd
le Ea
st
Euro
pe
Circu
mpo
lar A
rctic
Cent
ral A
mer
ica
Austr
alasiaAsia
Anta
rctic
Afric
a
Yuko
n
Sask
atch
ewan
Queb
ec
Princ
e Edw
ard
Islan
d
Onta
rio
Nuna
vut
Nova
Scot
ia
North
west T
errit
ories
Newfo
undla
nd
New B
runs
wick
Man
itoba
Briti
sh C
olum
bia
Albe
rta
Num
ber
of r
espo
nses
Location of main taxa of expertise
42 41
12
62 1 2
117
13
50
45
47
36
9 10
17
11
3
13
28
(Council of Canadian Academies)
Figure A1.8
Location of main taxa of expertise

14 Appendices Canadian Taxonomy: Exploring Biodiversity, Creating Opportunity
Based on the data reported in Figure A1.9, respondents can be divided into two categories: i) those that spent at least 20 hours weekly on taxonomy-related work; and ii) those that spent less than 20 hours per week on taxonomy-related tasks. Figures A1.10 and A1.11 show the proportion of respondents working on taxonomic-related work depending on their position and institution. Research technicians, bioinformaticians, and government research scientists were the most likely to be devoting working time to taxonomy. In contrast, university professors spent only about 20% of their time on taxonomy (see Figure A 1.10).
388
50
53
55
110
118
� Less than 1 hour/week� 11–20 hours/week� Not reported
� 1–5 hours/week� 21–40 hours/week
� 6–10 hours/week� Over 40 hours/week
0%
10%
20%
30%
40%
50%
60%
70%
80%
90%
100%
OtherDatabasingAdministrationTeachingIdentificationCurationTaxonomic research
Perc
enta
ge o
f res
pond
ents
Activity
392
20
50
34
164
123
117
213
60
51
64
125
108
213
58
45
109
97
84
721
40
123
157
245
947
46
362029
7612
4117
130
165
(Council of Canadian Academies)
Figure A1.9
Time spent by survey respondents on different taxonomic activitiesProportion of survey respondents working specific amounts of time on different types of taxonomic activities. For example, about 25% of researchers reported working on taxonomic research from one to five hours a week.

15Appendix 1 Survey of Taxonomic Expertise in Canada
Time spent on taxonomic-related work also varied from one type of institution to another. For example, 58% of respondents working in government museums spent more than 20 hours per week on taxonomic activities, while only 28% of people working in universities spent this kind of time on taxonomy (see Figure A1.11).
0%
10%
20%
30%
40%
50%
60%
70%
80%
90%
100%
Rese
arch
tech
nician
Data
base
r/bioi
nfor
mat
ician
Rese
arch
scien
tist (
gov’t
)
Grad
uate
stud
ent
Mus
eum
cura
tor
Amat
eur/v
olunt
eer
Retir
ed
Othe
r
Post-
docto
ral f
ellow
Rese
arch
scien
tist
(oth
er th
an g
ov’t
or p
rivat
e)
Rese
arch
scien
tist
(priv
ate s
ecto
r)
Unive
rsity
prof
esso
r
� Taxonomic work � 20h � Taxonomic work < 20h
Perc
enta
ge o
f res
pond
ents
Position held
24 5 4 10 14 11 5 12 24
10108 7 15 15 16
36 17
21 7 24 34 3 11
3
(Council of Canadian Academies)
Figure A1.10
Taxonomic work by types of activityProportion of respondents working more than 20 hours per week on taxonomic-related work versus respondents that do not, by position held. These numbers are an approximation, calculated from time ranges reported by survey respondents.

16 Appendices Canadian Taxonomy: Exploring Biodiversity, Creating Opportunity
4 .3 PublicationsThe majority of the 432 respondents were involved in publishing taxonomic material and species discoveries, as shown in Figure A1.12. Among those generating publications, 65% produced taxonomic descriptions or redescriptions, 44% produced monographs and taxonomic reviews, 39% produced taxonomic keys, 55% produced species discoveries, and 53% produced clarifications of species delimination.
0%
10%
20%
30%
40%
50%
60%
70%
80%
90%
100%
Othe
r
Taxo
nom
ic wor
k is n
ot
par
t of m
y paid
emplo
ymen
t
Unive
rsity
Priva
te in
dustr
y
Priva
te/n
on-p
rofit
mus
eum
Non-
prof
it se
ctor
Gove
rnm
ent l
abor
ator
y
Gove
rnm
ent m
useu
m
Perc
enta
ge o
f res
pond
ents
32
23
34
36
3
4
3
5
4
6
74
156
6
16
9
22
� Taxonomic work � 20h � Taxonomic work < 20h
Institutions
(Council of Canadian Academies)
Figure A1.11
Taxonomic work by type of institutionProportion of respondents working more than 20 hours per week on taxonomic-related work versus respondents that do not, by type of institution. These numbers are an approximation, calculated from the time range reported by survey respondents.

17Appendix 1 Survey of Taxonomic Expertise in Canada
Type of published work was analyzed by age range (20 to 40 years old, 41 to 60 years old, and over 60 years old). As the breakdown in Figure A1.13 shows, the type of publications varied greatly depending on the age of the respondents.
0
10
20
30
40
50
60
70
80
90
100
Number of speciesdeliminations clarified
Number of speciesdiscovered
Number of taxonomickeys published
Monographs andtaxonomic reviews
Taxonomic descriptionsor redescriptions
� 1–2 publication(s)� 11–20 publications
Range of publication numbers
� 3–5 publications� Over 20 publications
� 6–10 publications
Num
ber
of r
espo
nses
Type of publications
88
55
3225
80
95
40
16 18 20
67
37
17 19
29
63
3337
31
74
51
42
3329
74
(Council of Canadian Academies)
Figure A1.12
Published workDistribution of number of publications by type of taxonomic publication. Each bar corresponds to a range of publication numbers.

18 Appendices Canadian Taxonomy: Exploring Biodiversity, Creating Opportunity
0
4
8
12
16
20
24
28
32
36
40
Over 2011–206–103–51–2
Num
ber
of r
espo
nses
20–40 years old
Range of publications
33
37
18 1921
8
15
11 12 11
3
9 9
1 1
7
12
9
1
12
17
35
0
12
0
5
10
15
20
25
30
35
40
45
Over 2011–206–103–51–2
Num
ber
of r
espo
nses
41–60 years old
Range of publications
3941
28
38
28
20
30
16 15 14
6
14 14 1512 13 13
1114 14
7
40
3532
10
0
5
10
15
20
25
30
35
Over 2011–206–103–51–2
� Monographs and taxonomic reviews� Number of species deliminations clarified� Number of taxonomic keys published
� Taxonomic descriptions or redescriptions� Number of species discovered
Num
ber
of r
espo
nses
Range of publications
Over 60 years old
23
10
56
18
1210
15
6
12
79
7
13
4 57 6
10
4
12
31
2725
16
(Council of Canadian Academies)
Figure A1.13
Type of published work broken down by age

19Appendix 1 Survey of Taxonomic Expertise in Canada
5. FUNDING
5 .1 Sources of Research FundingThere were 359 responses to a question asking about annual research funding (excluding salary). Among these respondents, 50% reported less than $3,000 in research funding (all types of funding combined).4 The mean annual funding reported by the survey’s respondents is $27,184. See Figure A1.14 for distribution of types of funding.
0
20
40
60
80
100
120
140
Over
$1,
000,
000
$250
,000
–$1,
000,
000
$100
,000
–$25
0,00
0
$75,
000–
$100
,000
$50,
000–
$75,
000
$25,
000–
$50,
000
$10,
000–
$25,
000
$5,0
00–$
10,0
00
$1,0
00–$
5,00
0
Less
than
$1,
000
� From federal or provincial granting agencies� From other sources
Num
ber
of r
espo
nses
Amount of funding reported (C$)
137
113
4942
20 17 14
33
63
33
83 6 4
114 20 1 0
(Council of Canadian Academies)
Figure A1.14
Amount of research funding from government agencies and other sources
4 For each response, the mean value from the range proposed in the question was used. For example, the range $1,000 to $5,000 was counted as $3,000.

20 Appendices Canadian Taxonomy: Exploring Biodiversity, Creating Opportunity
5 .2 Infrastructure FundingA total of 45% of all respondents declared that they received infrastructure funding from their own institution. The Canada Foundation for Innovation (CFI) and provincial programs ranked as the second-most frequent funding sources (20%), while 15% of respondents declared other sources of funding. This funding was mainly targeted towards lab equipment and, to a lesser extent, towards field equipment (see Figure A1.15).
6. TRAINING
Teaching is also part of some taxonomic experts’ activities, particularly that of university professors. Of all respondents, 29% reported teaching courses in taxonomy at the undergraduate level and 9% at the postgraduate level. Looking only at university professors, 57% taught a course in taxonomy at the undergraduate level and 25% at the postgraduate level.
0
20
40
60
80
100
120
140
160
180
From a foundation/other donorFrom your institutionFrom CFI/provincial program
� For lab equipment� For field equipment� For new collections space� Other
Num
ber
of r
espo
nses
Type of infrastructure funding
73
36
22
6
121
3037
21
170
64
35
4
(Council of Canadian Academies)
Figure A1.15
Amount of infrastructure funding from government agencies, institutions, and other sources

21Appendix 1 Survey of Taxonomic Expertise in Canada
When asked how many research students they had trained over their careers, respondents to the survey reported training a total of approximately 1,150 students at the masters level, 660 students at the PhD level, and 335 at the post-doctoral level.5 But not all students go into a career in taxonomy or systematics after being trained. To the respondents’ best knowledge, about 22% of these masters students, 36% of the PhD students, and 42% of the post-doctoral fellows continued to pursue a career in taxonomy. See Figure A1.16 for more details.
5 The mean value of ranges proposed in the questions was counted.
0
200
400
600
800
1,000
1,200
1,400
Post-docPhDMasters
� Number of students trained� Number of students that went on to a career in taxonomy
Num
ber
of s
tude
nts
Type of training
1,152
259 240335
662
142
(Council of Canadian Academies)
Figure A1.16
Training and careers in taxonomyThis figure shows the total number of students that survey respondents have trained at the masters, PhD and post-doctoral level in taxonomy and systematics, and the number that went on to a career in taxonomy. These numbers are an approximation from the ranges given by survey respondents.

22 Appendices Canadian Taxonomy: Exploring Biodiversity, Creating Opportunity
Appendix 2 Survey of Canadian Collections
1. BACKGROUND
This appendix is a summary of the key results of the survey of Canadian collections. It does not contain conclusions or findings, as these are found in the Panel’s assessment report, of which this is an appendix. The complete data set on which this appendix is based (with identifying information of respondents removed) is freely available on request from the Council of Canadian Academies by contacting [email protected].
In November 2009, the Council of Canadian Academies convened an expert panel to conduct an assessment of:
“The state and trends of biodiversity science in Canada: Are we equipped to understand the challenges of our biodiversity resources?”
This assessment was requested by the Minister of Canadian Heritage on behalf of the Canadian Museum of Nature, and supported by other members of the Federal Biodiversity Information Partnership. The charge to the Panel focuses specifically on the state of taxonomy in Canada — research that discovers, distinguishes, classifies and documents living things. The Panel’s report can be found at: http://www.scienceadvice.ca/biodiversity.
As part of their response to the charge, the Panel launched evidence-gathering activities, which included an online survey of taxonomic expertise in Canada, an online survey of Canadian natural history collections, and a public call for evidence.

23Appendix 2 Survey of Canadian Collections
1 .1 Survey Distribution On 8 December 2009, the Council of Canadian Academies’ Expert Panel on Biodiversity Science (http://www.scienceadvice.ca/biodiversity) launched a survey of Canadian biodiversity collections. Information in both English and French about the survey was available through:• personal emails sent by the Council of Canadian Academies’ staff;• references to the Collections survey in the Survey of Taxonomic Expertise,
or in the public Call for Evidence; and• the Council of Canadian Academies’ website.
In an attempt to avoid duplication of responses from a single collection, the link to the survey was not publicly available, but was sent directly by email to museum directors and curators asking them to co-ordinate a response for their collection. The survey was sent to a total of 360 individuals at collections, including all in the Alliance of Natural History Museums of Canada, a group of primarily federal and provincial museums, federal government collections, university and college biodiversity collections, and other collections. Additionally, heads of biology, zoology, botany, and other relevant departments in Canadian universities and colleges were contacted. The survey was also sent to all who self-identified as having a biodiversity collection. The survey, hosted by Survey Monkey (www.surveymonkey.com), closed on 15 February 2010.
Questions in the survey were based on the Panel’s information needs and on surveys performed in Australia (Australian Department of the Environment, Water, Heritage and the Arts, 2003),6 and the United States (National Science and Technology Council, 2009).7
1 .2 Survey QuestionsThe survey questions and background information are detailed in Box A2.1. To save space, answer options are not listed. Please contact the Council of Canadian Academies to see the full survey as it was distributed.
6 Australian Department of the Environment, Water, Heritage and the Arts. (2003). Survey of Australian Taxonomic Capacity. Canberra: Government of Australia.
7 National Science and Technology Council. (2009). Scientific Collections: Mission-Critical Infrastructure for Federal Science Agencies. Washington, D.C.: Interagency Working Group on Scientific Collections (IWGSC), Office of Science and Technology Policy.

24 Appendices Canadian Taxonomy: Exploring Biodiversity, Creating Opportunity
Box A2 .1Survey Questions The Council of Canadian Academies’ Expert Panel on Biodiversity Science (http://www.scienceadvice.ca/biodiversity) is seeking information on taxonomic collections in Canada. This information will be used to inform the Panel’s report to the Government of Canada. If you are responsible for a museum, university, government, hospital, private, or other collection, regardless of taxon, please complete this survey.
For large collections, it would be most informative if the curator for each subsection of the collection (e.g., entomological collection, vascular plants, microbiological collection, etc.) filled out the survey. In your answers, please include any specimens out on loan to others, and exclude any loaned specimens currently in your collection.
Questions about the survey should be addressed to Wendy Shen ([email protected]). Supplemental information (e.g., annual reports, strategic plans, etc.) will be useful for the Panel and can also be sent to [email protected].
The Panel is also conducting a survey of taxonomists in Canada and a Public Call for Evidence. Please see http://www.scienceadvice.ca/biodiversity.html for more details.*
1. Identification of the collection.
2. Type of institution.
3. In one sentence, please describe the main purpose of the collection. For example, to display live specimens (e.g., a zoo), reference collection, etc.
4. Please indicate the approximate percentage of funding for your collection from each of the following sources. Exclude research grants.
5. Approximately how many animal specimens are in your collection? (Leave blank any categories which are not applicable)
6. Approximately how many “botanical” specimens are in your collection? (Leave blank any categories which are not applicable).
7. Approximately how many “other” specimens (or quantities of lots/vials/slides by which they are measured) are in your collection? (Leave blank any categories which are not applicable).
8. Indicate the kinds of information about the collection that are accessible via the internet (indicate all that apply).
9. What percentage of specimens in your collections: are catalogued; have databased label data; have databased images; are available on the internet; have DNA samples associated with them?

25Appendix 2 Survey of Canadian Collections
10. How many full-time equivalent (FTE) staff do you have contributing to digitization? Please provide approximate annual figures (e.g., one person working 10 hours per week = 0.25 FTE/year; one person working full-time for three months also = 0.25 FTE/year).
11. What operating system and database system do you use for digitization?
12. How many type specimens are in your collection?
13. Approximately how many specimens do you loan on an annual basis?
14. How do you acquire your specimens? (indicate percentage)
15. Do you have comments on the way your collection acquires specimens? For example, has the way you acquire specimens changed over time? Does it vary by taxa?
16. Do you have a publicly available collections policy?
17. What is the geographical scope of the collection?
18. Considering your Canadian specimens, approximately what percentage of named Canadian/provincial species (for each broad taxa) are represented in your collection?
19. Assessing the value of a collection is extremely difficult. Have you attempted to do this? If so, what was the monetary value of your collection? Additional documentation on methods used to assess value would be useful to the Panel.
20. Please comment on the approximate costs associated with your collection.
21. Who are the primary users of the collection? (Please rank: 1 uses most, 7 uses least. Indicate N/A if the group does not use the collection in any meaningful way.)
22. In the past 10 years, has the size or condition of your collection changed?
23. Please indicate the effect of the following pressures on increasing or decreasing the size of your collection: routine collection activities; government mandates; reorganization or restructuring; financial or budgetary changes; staff changes.
24. What percentage of the collection is stored in conditions considered to be adequate for its care and preservation?
(Continued on next page)
26 Appendices Canadian Taxonomy: Exploring Biodiversity, Creating Opportunity
25. Research use of the collection: What percentage of the collection is accessible for scientific research or other uses? What percentage of the collection has been used for scientific research or other uses in the past 10 years?
26. For parts of the collection stored under inadequate conditions (Q. 21) or inaccessible (Q.22), please rank the following in terms of needs (1 = highest need, 6 = least need): additional on-site storage; new and additional off-site storage; renovated storage space; new and improved storage equipment (e.g., shelving, cabinetry, racks); new and improved environmental controls (e.g., temperature, humidity, or light); curatorial or technical staff; other.
27. How many staff does the collection have? Please answer in full-time equivalents (FTEs). For example, a curator working 10 hours per week = 0.25 of a curator. Do not double-count time (e.g., a full-time employee who is a researcher and also curates should appear in one row only, or have time split between rows).
28. Are there any parts of your collection which have no curator (i.e., “orphan collections”)? Please comment.
29. With regard to space, finances, and research capacity, briefly describe the five-year projection for your collection.
30. How many scientific papers have been based, in whole or in part, on specimens from the collection over the past 10 years?
31. Are there particular scientific outcomes of the collection you would like to comment on? For example, have specimens been used to track changes in ranges of species at risk? Or to identify potentially invasive species?
32. Approximately how many visitors from the general public do you receive per year?
33. Do you have any other comments that might be of relevance to this assessment?
*This survey was available in English and French.
(Continued from previous page)

27Appendix 2 Survey of Canadian Collections
2. PROFILE OF RESPONDING INSTITUTIONS
2 .1 Institutions The survey was completed by 120 collections including university, government, private, and other collections. As shown in Table A2.1, university collections (43%) and government collections (39%) made up the bulk of respondents.
Table A2.1
Type of responding institutions
Type of institution Number Percentage
University 52 43
Federal government 26 22
Other government 20 17
Other collections 22 18
Total 120 100
(Council of Canadian Academies)
If a respondent reported belonging to more than one institution, answers were weighted by the total number of categories reported. For example, if a respondent reported that their collection belonged to three different categories, each category was attributed one-third.
2 .2 Location of CollectionsCollections from all Canadian provinces and one territory completed the survey. As shown in Figure A2.1, Alberta had the most collections responding (32), followed by Ontario (23), and Quebec (22). No collections from Nunavut and the Yukon were reported in this survey.
2 .3 Monetary Value of CollectionsTwenty-two collections provided an estimate of the value of their collection. The estimates ranged from $5,000 to $20 million. The median of the estimated monetary value of these 22 collections is $1.6 million with a mean of $3.7 million.
2 .4 Funding About one-third of the collections received most of their funding (more than 90%) from governments (federal and provincial) and about one-fifth received most of their funding from a university. No collection received more than 25% of funding from foundations; only 11 collections reported any funding at all from foundations.

28 Appendices Canadian Taxonomy: Exploring Biodiversity, Creating Opportunity
The data suggest that type of funding is related to the recipient’s type of institution. For example, 77% of federal government collections reported that most of their funding (more than 90%) comes from federal government agencies. Similarly, 70% of collections classified as “other government” reported that most of their funding (more than 90%) came from provincial governments. University collections were slightly more diversely funded, as shown in Figure A2.2.
0
Number of collections
32
22
23
8
44
2
2
1
16
32 6
0
0
(Council of Canadian Academies)
Figure A2.1
Distribution of collections across Canada

29Appendix 2 Survey of Canadian Collections
3. SPECIMENS
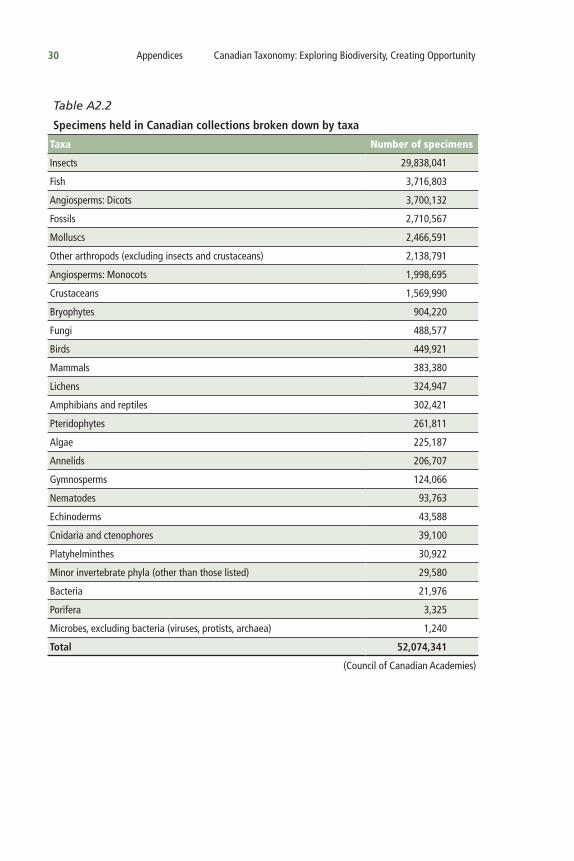
3 .1 Breakdown of Specimens by Taxa The survey reported a total of 52,074,341 specimens in Canadian collections. Of the taxa identified in the survey, insects accounted for the most specimens, with 29,838,041 specimens. Plants were the next most abundant, with 6,988,924 specimens (see Table A2.2 for more details on the breakdown by taxonomic groups).
91–100%11–90%0–10%None
Num
ber
of r
espo
nses 17
20
5
15
13
10
23
6 65
2
17
3
0 0 01
0 0
3 32
23
� Federal government� Provincial government� University
Percentage of funding provided by a given source
� Foundation� Public donations� Other
0
5
10
15
20
25
(Council of Canadian Academies)
Figure A2.2
Source of funding for university collections This figure shows the different sources of funding that support university collections. For example, 23 university collections reported receiving 91% to 100% of their funding from their institution. There were 43 responses from university collections.
30 Appendices Canadian Taxonomy: Exploring Biodiversity, Creating Opportunity
Table A2.2
Specimens held in Canadian collections broken down by taxa
Taxa Number of specimens
Insects 29,838,041
Fish 3,716,803
Angiosperms: Dicots 3,700,132
Fossils 2,710,567
Molluscs 2,466,591
Other arthropods (excluding insects and crustaceans) 2,138,791
Angiosperms: Monocots 1,998,695
Crustaceans 1,569,990
Bryophytes 904,220
Fungi 488,577
Birds 449,921
Mammals 383,380
Lichens 324,947
Amphibians and reptiles 302,421
Pteridophytes 261,811
Algae 225,187
Annelids 206,707
Gymnosperms 124,066
Nematodes 93,763
Echinoderms 43,588
Cnidaria and ctenophores 39,100
Platyhelminthes 30,922
Minor invertebrate phyla (other than those listed) 29,580
Bacteria 21,976
Porifera 3,325
Microbes, excluding bacteria (viruses, protists, archaea) 1,240
Total 52,074,341
(Council of Canadian Academies)

31Appendix 2 Survey of Canadian Collections
About 60% of specimens were held by government collections (51% by federal collections and 9% by other government institutions). Universities held approximately 36% of the total specimens across Canada (see Table A2.3 for more details).
Table A2.3
Percentage of specimens held by each type of institution
Type of institution Number of specimens Percentage
Federal government 26,470,354 51
University 18,498,105 36
Other government 4,578,755 9
Other collections 2,527,127 4
Total 52,074,341 100
(Council of Canadian Academies)
The same weighting method described for Table A2.1 was used to calculate the number of specimens held by each type of institution.
Specimens are unevenly distributed across Canada. Most specimens reported in the survey were held in Ontario, Quebec, and Alberta (see Figure A2.3). Ontario itself accounted for 64% of all specimens held in collections in Canada — this is mainly because the Canadian National Collection of Insects, with 16.7 million specimens (nearly one-third of the number reported in the survey), is located in Ottawa.

32 Appendices Canadian Taxonomy: Exploring Biodiversity, Creating Opportunity
0
Number of specimens
33,074,317
7,365,049
33,074,317
2,265,022
1,102
0
0
3,005,048
5,139,216378,930
553,430212,945
50,542
28,740
(Council of Canadian Academies)
Figure A2.3
Specimen holdings reported in the survey, by province and territory
3 .2 Type Specimens A type specimen is the designated representative of a taxon. In this survey, collections reported a total of 80,197 type specimens. See Table A2.4 for a breakdown of type specimens by taxa.

33Appendix 2 Survey of Canadian Collections
Table A2.4
Breakdown of type specimens by taxa in Canadian collections
Taxa Type specimen count
Insects 24,043
Bacteria 17,575
Fossils 7,883
Angiosperms: Dicots 7,138
Fungi 6,591
Angiosperms: Monocots 3,362
Fish 2,267
Crustaceans 2,144
Other arthropods (excluding insects and crustaceans) 1,711
Bryophytes 1,641
Mammals 953
Lichens 939
Annelids 794
Molluscs 677
Algae 556
Minor invertebrate phyla (other than those listed) 408
Nematodes 313
Cnidaria and ctenophores 261
Amphibians and reptiles 257
Pteridophytes 216
Platyhelminthes 200
Echinoderms 128
Gymnosperms 56
Birds 53
Porifera 22
Archaea 5
Viruses 4
Total 80,197
(Council of Canadian Academies)

34 Appendices Canadian Taxonomy: Exploring Biodiversity, Creating Opportunity
3 .3 Scope of Canadian CollectionsWhen asked about geographical scope, most respondents indicated that their collection mainly focuses on local/regional species (62%). Additionally, 33% of collections reported having an international focus (see Table A2.5). A collection can have mainly a local scope, but also have an international component.
Table A2.5
Geographical scope of Canadian collections
Geographical scope Number Percentage
Mainly local/regional 74 62
Mainly national 22 18
International 39 33
(Council of Canadian Academies)
Percentages do not total 100% since multiple answers were permitted.
3 .4 Coverage of Canadian Species Canadian species are well represented in Canadian collections. As shown in Table A2.6, the four most common Canadian taxa reported in collections — insects, fish, dicots, and molluscs — have over 90% of their species represented in several collections. When looking at a regional level, representation of Canadian species in collections is even higher.

35Appendix 2 Survey of Canadian Collections
3 .5 Specimen AcquisitionRespondents were asked about how their collection acquires specimens. As shown in Figure A2.4, 63% (75) of collections reported that most of their specimens were acquired from field collections. Purchases and donations were a less common way to acquire specimens.
Table A2.6
Coverage of selected taxa of Canadian and provincial species
Insects (%)
Fish (%)
Dicots(%)
Molluscs(%)
Approximately what percentage of named Canadian species are represented in your collection?
None 5 5 2 0
1–5% 20 10 12 24
6–10% 7 0 8 0
11–25% 9 5 16 14
26–50% 9 30 18 5
51–75% 9 10 8 5
76–90% 7 5 6 5
91–100% 7 5 10 5
Approximately what percentage of named species from the province or territory the collection is located in are represented?
None 5 5 2 0
1–5% 5 0 6 10
6–10% 11 0 6 10
11–25% 9 10 8 0
26–50% 9 10 10 0
51–75% 9 5 12 14
76–90% 9 15 12 14
91–100% 11 20 16 10
Number of collections that reported specimens in this taxa 44 20 51 21
(Council of Canadian Academies)
Taxa represented in this table are those with the highest number of specimens in the survey (because of the difficulties in showing all taxa in a table). The percentages presented are based on the number of collections that reported specimens for the given taxa in Questions 5, 6 or 7. Percentages do not total 100% because not all collections responded to the questions.

36 Appendices Canadian Taxonomy: Exploring Biodiversity, Creating Opportunity
4. COLLECTION FACILITIES
4 .1 Research Use of the Collection Among the collections surveyed, 87% reported that over three-quarters of their collection is accessible for scientific research and other uses, and 90% reported that their collection had been used in the last 10 years for scientific research or other uses (see Figure A2.5 for more details).
71–100%31–70%1–30%
Num
ber
of r
espo
nses
Percentage of collection acquired
16
65
21
28
14
1
14
43
17
3
75� Purchase� Donation� Field collection� Other
0
10
20
30
40
50
60
70
80
(Council of Canadian Academies)
Figure A2.4
Methods of specimen acquisition used by collections

37Appendix 2 Survey of Canadian Collections
4 .2 Primary Users of CollectionsA wide range of groups use collections for research purposes or other activities. The survey found students are the most common users of Canadian collections (reported by 38 collections), followed by Canadian researchers (reported by 36 collections).
4 .3 Changes in Canadian Collections When questioned about changes over the past 10 years in the size and condition of their collections, the majority of respondents (81%) reported an increase in collection size (3% reported a decrease). Some 40% of respondents reported an improvement in the condition of their collections in the last 10 years, and 17% reported a deterioration in the condition (see Table A2.7 for more details).
0
10
20
30
40
50
60
70
80
No response
Not sure
100%76–99%51–75%26–50%11–25%1–10%None
� What percentage of the collection is accessible for scientific research or other uses?
� What percentage of the collection has been used for scientific research or other uses in the past 10 years?
Num
ber
of r
espo
nses
Percentage of collection
2 1 3
3733
1410
20
94
7
73
7
0 16
31
(Council of Canadian Academies)
Figure A2.5
Research use of the collections

38 Appendices Canadian Taxonomy: Exploring Biodiversity, Creating Opportunity
Table A2.7
Changes in the size and condition of Canadian collections over the past 10 years
Size of the collection Condition of the collection
Increased 97 (81%) 48 (40%)
No significant change 19 (16%) 44 (37%)
Decreased 4 (3%) 20 (17%)
Not reported 0 (0%) 8 (6%)
(Council of Canadian Academies)
4 .4 Pressures that Impact Collections When asked to indicate the effect of different pressures on collection size, routine collection activities were found to have had the biggest impact. Government mandates, reorganization or restructuring, and financial/budgetary changes were most commonly reported to have had no impact on the size of the collection (see Table A2.8 for more details).
Table A2.8
Pressures that impact collection size (number of respondents)
Caused an increase
Caused a decrease
Had no impact
Not reported
Routine collection activities 80 (67%) 9 (8%) 27 (23%) 4 (3%)
Government mandates 15 (13%) 12 (10%) 79 (66%) 14 (12%)
Reorganization or restructuring 20 (17%) 24 (20%) 60 (50%) 16 (13%)
Financial/budgetary changes 16 (13%) 38 (32%) 53 (44%) 13 (11%)
Staff changes 24 (20%) 27 (23%) 54 (45%) 15 (13%)
Other 9 (8%) 5 (4%) 19 (16%) 87 (73%)
(Council of Canadian Academies)

39Appendix 2 Survey of Canadian Collections
5. COLLECTION NEEDS
5 .1 Storage FacilitiesAdequate storage facilities are essential to maintaining the quality of collections for research. Most collections (80 out of 120) reported that over three-quarters of their collection is stored in adequate conditions (see Figure A2.6). In contrast, nine collections reported that only 1% to 25% is stored in adequate conditions.
(Council of Canadian Academies)
Figure A2.6
Percentage of collection stored in adequate conditionsEach respondent was asked the percentage of their collection that is stored in adequate conditions. The pie chart represents the proportion (and number) of collections reporting different level of storage conditions. For example, 37 collections reported that 100% of their collection is stored in adequate conditions.
� None� 1–25%� 26–50%� 51–75%� 76–99%� 100%� Not sure
43
10
4
9
10
37
7

40 Appendices Canadian Taxonomy: Exploring Biodiversity, Creating Opportunity
Collections stored in inadequate or inaccessible conditions were asked to identify their greatest needs to improve the state of their collection. Of those that responded, curatorial and technical staff emerged as the greatest need (ranked highest by 40% (34) of the collections), followed by the need for additional on-site storage (ranked highest by 21% (18) of the collections) (see Figure A2.7).
� Additional on-site storage� New and additional off-site storage� Renovated storage space� New and improved
storage equipment� New and improved
environmental controls� Curatorial or technical staff� Other
9
13
3
5
18
34
2
(Council of Canadian Academies)
Figure A2.7
Greatest needs identified to improve the state of collectionsIf respondents reported that some of their collection was stored in inadequate conditions, they were asked to identify their greatest needs to improve the state of their collection. The pie chart shows the proportion (and number) of collections that ranked that need as their top priority. For example, 34 collections considered more curatorial or technical staff as their biggest need.
6. DATA MANAGEMENT PROCESS
6 .1 Data Capture Respondents for each collection were asked a series of questions about data capture and sharing. These aimed to determine what proportion of specimens had databased label data, were available on the internet, had databased images and/or DNA samples, and were catalogued.

41Appendix 2 Survey of Canadian Collections
Table A2.9 shows the answers for the four taxa with the largest number of specimens. Data capture methods such as catalogues or databased label data were the most common. In contrast, images and DNA samples were used infrequently. Availability of data on the internet varied among the four taxa presented here. For example, fish were well represented on the internet, while insect collections had less visibility online.
Table A2.9
Types of data captures for selected taxa
Percentage of collection
Insects (%)
Fish (%)
Dicots (%)
Molluscs (%)
Have databased label data
None 9 15 8 14
1–10% 25 0 16 10
11–90% 34 35 47 29
91–100% 16 30 16 24
Are available on the internet
None 43 45 35 48
1–10% 20 0 12 5
11–90% 11 20 20 19
91–100% 2 20 2 5
Have databased images None 50 60 43 57
1–10% 20 20 18 10
11–90% 2 5 8 10
91–100% 2 0 0 0
Have DNA samples associated with them
None 48 50 43 57
1–10% 20 25 24 5
11–90% 0 5 0 0
91–100% 0 0 0 0
Are catalogued (paper or electronic)
None 5 10 8 10
1–10% 27 0 4 19
11–90% 36 35 35 29
91–100% 23 55 37 38
Number of collections that reported specimens in this taxa 44 20 51 21
(Council of Canadian Academies)
Taxa represented in this table are those with the highest number of specimens in the survey (because of the difficulties in showing all taxa in a table). The percentages presented are based on the number of collections that reported specimens for the given taxa in Questions 5, 6, or 7. Percentages do not total 100% because not all collections responded to the questions.

42 Appendices Canadian Taxonomy: Exploring Biodiversity, Creating Opportunity
6 .2 Accessibility of the Collection via the Internet Respondents were asked to indicate the kinds of information that is available about the specimens in their collections on the internet. As shown in Table A2.10, 53% of respondents indicated that none of their collection is available online. When available, the most common type of information shared is a collection-level description (27% of the collections).
Table A2.10
Accessibility of collections via the internet
Type of information Number Percentage
None 63 53
Collection-level descriptions 32 27
Minimum catalogue information for collections
23 19
Specimen or lot labels 22 18
Images of collection 25 21
Enhanced catalogue information for specimens
13 11
No answer 3 3
(Council of Canadian Academies)
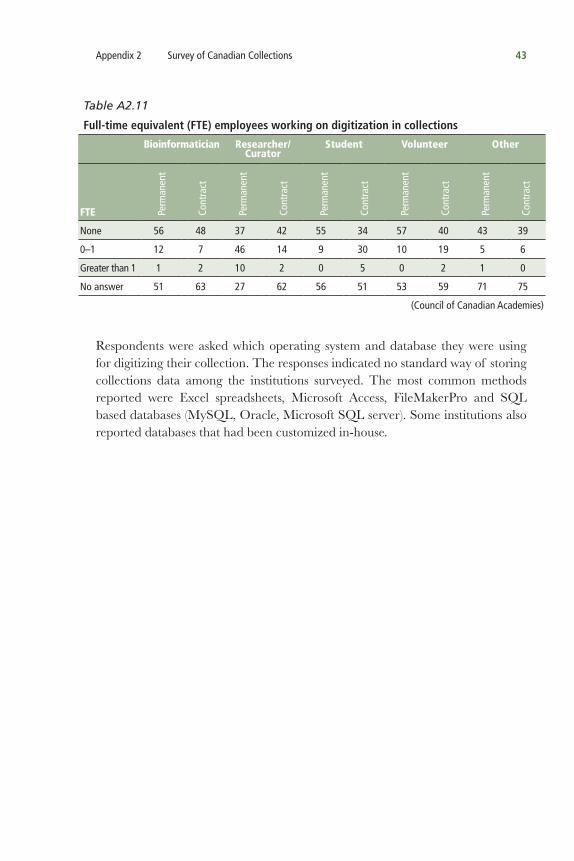
6 .3 Staff Working on Digitization Respondents were asked to indicate how many full-time equivalent (FTE) permanent and temporary staff they had contributing to digitization. As shown in Table A2.11, most respondents reported that one FTE or less was working on the digitization of their collection. Only 11% (13) of collections reported having specialized permanent employees (bioinformaticians) working on digitization. Researchers and curators with permanent positions were performing the bulk of digitization (47%), with contracted students and volunteers also contributing (29% and 18% respectively).
Percentages do not total 100% since multiple answers were permitted.
43Appendix 2 Survey of Canadian Collections
Respondents were asked which operating system and database they were using for digitizing their collection. The responses indicated no standard way of storing collections data among the institutions surveyed. The most common methods reported were Excel spreadsheets, Microsoft Access, FileMakerPro and SQL based databases (MySQL, Oracle, Microsoft SQL server). Some institutions also reported databases that had been customized in-house.
Table A2.11
Full-time equivalent (FTE) employees working on digitization in collections
Bioinformatician Researcher/ Curator
Student Volunteer Other
FTE Perm
anen
t
Cont
ract
Perm
anen
t
Cont
ract
Perm
anen
t
Cont
ract
Perm
anen
t
Cont
ract
Perm
anen
t
Cont
ract
None 56 48 37 42 55 34 57 40 43 39
0–1 12 7 46 14 9 30 10 19 5 6
Greater than 1 1 2 10 2 0 5 0 2 1 0
No answer 51 63 27 62 56 51 53 59 71 75
(Council of Canadian Academies)

44 Appendices Canadian Taxonomy: Exploring Biodiversity, Creating Opportunity
Appendix 3 University-run Canadian Field Stations for Biodiversity Discovery
Table A3.1
List of Field Stations
Field Station Province/Territory
Website
* Bamfield Marine Sciences Centre BC http://www.bms.bc.ca/
Bon Portage Island Field Station NS http://www.acadiau.ca/~dshutler/PIsland.html
* Canadian Rockies & Foothills Biogeoscience Institute (Kananaskis Field Stations)
AB http://bgs.ucalgary.ca/
* Centre d’études nordiques (CEN) NU, QC http://www.cen.ulaval.ca/
* Churchill Northern Studies Centre MB http://www.churchillscience.ca/
Deep Bay Field Station BC http://www.viu.ca/deepbay/index.asp
* Delta Marsh Field Station MB http://umanitoba.ca/delta_marsh/
EMEND AB http://www.emend.rr.ualberta.ca/
Gault Nature Reserve QC http://www.mcgill.ca/gault/
* Huntsman Marine Science Centre NB http://www.huntsmanmarine.ca/
* Kluane Lake Research Station YT http://www.arctic.ucalgary.ca/index.php?page=kluane_station
Koffler Scientific Reserve at Jokers Hill ON http://www.ksr.utoronto.ca/
McGill Arctic Research Station (MARS) NU http://www.mcgill.ca/mars/
McGill Subarctic Research Station QC http://www.mcgill.ca/msars/
* Meanook Biological Research Station AB http://www.biology.ualberta.ca/facilities/meanook/
* Queens University Biological Station ON http://www.queensu.ca/biology/qubs.html
Quesnel River Research Centre BC http://www.unbc.ca/qrrc/
Station de biologie des Laurentides (SBL) QC http://www.bio.umontreal.ca/SBL/
Taiga Biological Station MB http://www.wilds.mb.ca/taiga/
* Wildlife Research Station ON http://www.uoguelph.ca/~wrs/
* Federal funding for these field stations has been terminated by recent changes to the rules of the NSERC Major Resources Support (MRS) Program, which prohibits applications from groups such as field stations that are primarily utilized within a single province. MRS funds previously supplied 8% to 50% of the annual budget of these field stations. Whether they will remain financially viable without additional financial support is unclear.
(Council of Canadian Academies)
There are also many government-run field stations not captured in this table. Websites retrieved September 2010.

45Appendix 4 Employment, Funding, and Publication Trends in Canadian Biodiversity Science
Appendix 4 Employment, Funding, and Publication Trends in Canadian Biodiversity Science
This appendix provides details on methods and results to support the analyses and findings related to employment, funding, and publication trends presented in Chapter 4 of the Panel’s report.
1. EMPLOYMENT
The “back matter” from Science magazine was downloaded from JSTOR (http://www.jstor.org) for all issues of the years 1974 to 2004, in five-year intervals. Back matter was then searched electronically for the word, “Canada.” Advertisements (ads) for permanent positions (post-PhD) in academia, museums, companies, and/or government agencies were examined for content. These ads were counted in Table A4.1 if they included the phrases “environment*”, “ecolog*”, “evolution”, “phylogen*”, “systemati*”, “taxonom*” in the research and/or teaching area desired for the job candidate. If these phrases were only used to describe the strength of the rest of the unit, the ad was not included. Ads that met these criteria were then individually evaluated to ensure that the jobs were related to biodiversity researchers (e.g., ads relating to the “physical environment” or “environmental engineers” were excluded). The number of job advertisements in taxonomy is compared with other biodiversity sciences in Figure A4.1.
Ads that did not include the above key phrases, but were likely related, were not included in order to avoid subjective decisions (e.g., ads for “microbiologist” might include biodiversity scientists, but were often medically oriented). Ads for administrative positions (department heads, deans, directors) were not included. In a few cases, ads suggested that multiple jobs might be available, but the exact number of jobs was not always specified. For this reason, Table A4.1 lists the number of job ads found and not the total number of job positions. Fixed-term jobs, including post-docs, research associates, and sabbatical replacement positions were not included, except for positions funded by the Natural Sciences and Engineering Research Council (NSERC) (University Research Fellowship, University Faculty Award), which typically transition to full-time faculty positions. If the same ad appeared more than once within the year, it was included only once.
Issues from 2009 were searched manually using the above criteria and were included in Table A4.1. Few relevant ads were published in 2009, likely because of a switch to advertising online at Science Careers (http://sciencecareers.sciencemag.org/);8 thus only data prior to 2009 are discussed in the Panel’s report. The significance of the results were unaffected by including 2009 data.
8 Only current advertisements can be accessed online, restricting the ability to document more recent trends.

46 Appendices Canadian Taxonomy: Exploring Biodiversity, Creating Opportunity
Table A4.1
Number of job advertisements in Science within biodiversity science
Environment Ecolog* Evolution Phylogen* Systemati* Taxonom* Total
1969 0 5 0 0 0 2 6
1974 1 11 1 0 1 2 14
1979 0 2 0 0 0 3 5
1984 1 6 1 0 3 0 9
1989 3 3 3 0 0 0 8
1994 2 9 2 0 1 0 11
1999 3 5 4 1 2 1 13
2004 2 6 5 0 2 0 10
2009 2 3 0 0 0 0 4
(Council of Canadian Academies)
The same job ad can contribute to entries in multiple columns. The last column is the total number of jobs that used one or more of these key phrases.
0
2
4
6
8
10
12
14
20041999199419891984197919741969
� Biodiversity science � Taxonomy
Num
ber
of jo
b ad
vert
isem
ents
Year
6
2
14
23
0 0 0
11
0
10
5
98
13
1
(Council of Canadian Academies)
Figure A4.1
Job openings within biodiversity science including ecology, evolution, environmental studies, phylogenetics, systematics, and taxonomyTo compare the number of job ads in taxonomy to the number in biodiversity sciences as a whole, eight jobs were randomly sampled (the total number of taxonomy jobs over the dataset) from the full set of jobs. The slope in the number of job openings over time was then calculated. This was repeated 10,000 times. The declining slope observed in taxonomy was extremely unusual, falling in the lowest 0.5 per cent.
47Appendix 4 Employment, Funding, and Publication Trends in Canadian Biodiversity Science
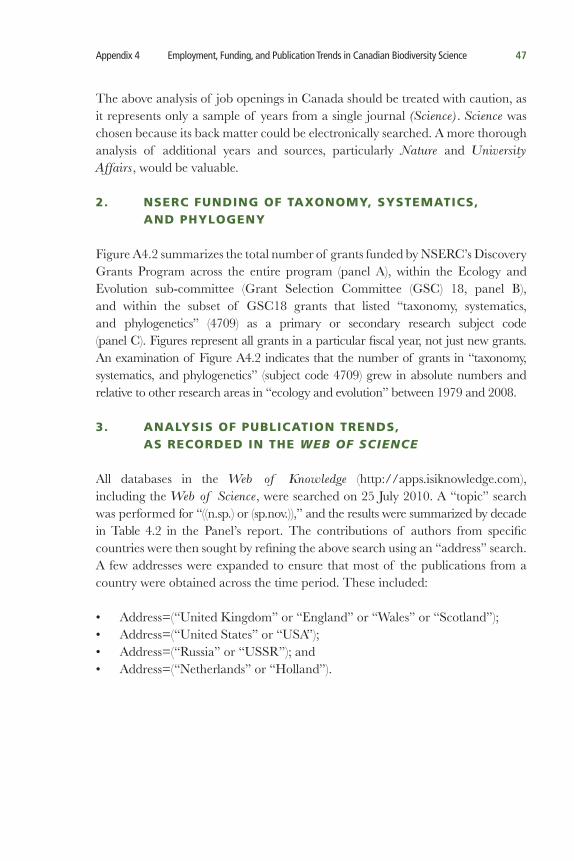
The above analysis of job openings in Canada should be treated with caution, as it represents only a sample of years from a single journal (Science). Science was chosen because its back matter could be electronically searched. A more thorough analysis of additional years and sources, particularly Nature and University Affairs, would be valuable.
2. NSERC FUNDING OF TAXONOMY, SYSTEMATICS, AND PHYLOGENY
Figure A4.2 summarizes the total number of grants funded by NSERC’s Discovery Grants Program across the entire program (panel A), within the Ecology and Evolution sub-committee (Grant Selection Committee (GSC) 18, panel B), and within the subset of GSC18 grants that listed “taxonomy, systematics, and phylogenetics” (4709) as a primary or secondary research subject code (panel C). Figures represent all grants in a particular fiscal year, not just new grants. An examination of Figure A4.2 indicates that the number of grants in “taxonomy, systematics, and phylogenetics” (subject code 4709) grew in absolute numbers and relative to other research areas in “ecology and evolution” between 1979 and 2008.
3. ANALYSIS OF PUBLICATION TRENDS, AS RECORDED IN THE WEB OF SCIENCE
All databases in the Web of Knowledge (http://apps.isiknowledge.com), including the Web of Science, were searched on 25 July 2010. A “topic” search was performed for “((n.sp.) or (sp.nov.)),” and the results were summarized by decade in Table 4.2 in the Panel’s report. The contributions of authors from specific countries were then sought by refining the above search using an “address” search. A few addresses were expanded to ensure that most of the publications from a country were obtained across the time period. These included:
• Address=(“United Kingdom” or “England” or “Wales” or “Scotland”);• Address=(“United States” or “USA”);• Address=(“Russia” or “USSR”); and• Address=(“Netherlands” or “Holland”).

48 Appendices Canadian Taxonomy: Exploring Biodiversity, Creating Opportunity
Year
Num
ber
of D
isco
very
Gra
nts
awar
ded
� AII NSERC
A
0
2,000
4,000
6,000
8,000
10,000
19801975 1985 1990 1995 2000 2005 2010
Num
ber
of D
isco
very
Gra
nts
awar
ded
Year
� GSC 18 (Ecology & Evolution)
B
0
100
200
300
400
500
600
700
19801975 1985 1990 1995 2000 2005 2010
Year
Num
ber
of D
isco
very
Gra
nts
awar
ded
C
0
10
20
30
40
50
60
70
80
19801975 1985 1990 1995 2000 2005 2010
� 4709 (Taxonomy, systematics,and phylogenetics)
(Data Source: NSERC, 2007)9
Figure A4.2
Trends in NSERC grant awardsThe number of grants awarded across the entire NSERC Discovery Program (red, from NSERC, 2007), the Ecology and Evolution sub-committee (GSC18, yellow, from NSERC, personal communication), and the subset of GSC18 using subject code “Taxonomy, systematics, and phylogenetics” (blue, from NSERC, personal communication).
9 NSERC (Natural Sciences and Engineering Research Council of Canada). (2007). NSERC’s Discovery Program. Ottawa: NSERC. Retrieved from: http://www.nserc-crsng.gc.ca/_doc/Reports-Rapports/Consultations/GSCStructure/NSERCDiscoveryGrantsProgram_e.pdf

49Appendix 4 Employment, Funding, and Publication Trends in Canadian Biodiversity Science
Countries were chosen for inclusion in the analysis if they were a member of the G20. As the European Union counts as a single member, all European Union countries whose gross domestic product was in the top 25 in the world10 were also included, leading to the addition of Spain, Netherlands, Switzerland, Belgium, Sweden, Norway, and Austria.
The Web of Knowledge is not an exhaustive database. In particular, data from the 1980s are likely to be more poorly represented than data from the 2000s (data from the 1970s were particularly spotty and are not reported). Nevertheless the overall trends reported in Table 4.2 in the Panel’s report are likely to be robust. As supporting evidence, Packer et al. (2009)11 also reported a decline in the number of new species descriptions and taxonomic revisions written by Canadian senior authors, relative to senior authors from other countries, in a study that examined all articles in the Canadian Journal of Zoology, Canadian Journal of Botany, and The Canadian Entomologist from a sample of years spanning 1978 to 2000.
To determine whether similar trends are apparent in other areas of biodiversity science, an analysis among related fields within Canada was also undertaken. The Web of Knowledge was searched for articles from 1980 to 2009 that either did or did not list Canada in the address. Searches were conducted in three different areas of biodiversity science to compare trends: (panel A) topic search for “ecolog* and evolution;” (panel B) topic search for “systemat* and phylogeny;” and (panel C) topic search for “n.sp. or sp.nov.” The specific combinations of search words were arbitrarily chosen to allow full searches within the Web of Knowledge, which was limited to 100,000 hits per search. Figure A4.3 illustrates the percentage of all articles worldwide that listed a Canadian author in each subject area. Regression analysis revealed that the slopes were significantly positive for (panel A) ecology and evolution; not significantly different from zero for (panel B) systematics and phylogenetics; and significantly negative for (panel C) new species descriptions (generalized least squares fit, accounting for temporal autocorrelation).
10 The Gross Domestic Product (GDP) used was the International Monetary Fund’s World Economic Outlook Database 2009, available at http://www.imf.org/external/pubs/ft/weo/2010/01/weodata/index.aspx
11 Packer, L., Grixti, J. C., Roughley, R. E., & Hanner, R. (2009). The status of taxonomy in Canada and the impact of DNA Barcoding. Canadian Journal of Zoology, 87(12), 1097-1110.

50 Appendices Canadian Taxonomy: Exploring Biodiversity, Creating Opportunity
� % Ecolog* and evolution from Canada
Year1980 1985 1990 1995 2000 2005
� % Systemat* and phylogeny from Canada
0%
1%
2%
3%
4%
5%
6%
7%
Year
1980 1985 1990 1995 2000 2005
� % New species descriptions from Canada
0%
1%
2%
3%
4%
5%
6%
7%
Perc
enta
ge C
anad
ian
cont
ribu
tion
Perc
enta
ge C
anad
ian
cont
ribu
tion
Perc
enta
ge C
anad
ian
cont
ribu
tion
Year
1980 1985 1990 1995 2000 2005
0%
1%
2%
3%
4%
5%
6%
7%
8%
A
B
C
(Data Source: Thomson Reuters, 2010)12
Figure A4.3
Trends in Canada’s contribution to the global literature in biodiversity science
12 Thomson Reuters. (2010). Web of Knowledge. Retrieved May 2010, from http://thomsonreuters.com/