appendices appendix a: l, s, and ism bands survey
TRANSCRIPT

Appendices Appendix A: L, S, and ISM Bands Survey Measurement Data Appendix A.1: San Jose Downtown
Site Description
The City of San Jose is the 11th largest city in the United States and the center of Silicon Valley with an area of 454 km2 and a population of 925,000. Table A.1 and Figures A.1 through A.4 depict the measurement site location and conditions. The LSSM was located downtown. As shown in Figure A.1, nearby buildings included the Civic Auditorium (10 m away, north), the Crown Plaza Hotel (50 m away, southeast) and a parking garage (30 m away, south). Pedestrian traffic was high throughout daylight hours. Weather was mostly sunny. WiFi (IEEE 802.11b) activity (channel number = 11, SNR = 38) was detected during the site survey.
Time Location Weather Distance to Building
Distance to
Pathway
WiFi Channel Address
Oct 21 0900 ~ Oct 22 0900
N37.33 W121.89
Sunny Clear 10 m 4 m Channel 11
SNR = 38
120 Park Ave. San Jose CA 95113
Table A.1. Measurement Site Conditions (San Jose Downtown)
LSSM
ParkingGarage
Crown PlazaHotel
Road
Civic Auditorium
ConventionCenter
Figure A.1. Location of LSSM at San Jose Downtown
61

Figure A.2. Photo of Spectrum Survey at San Jose Downtown
Figure A.3. Aerial Map and Street Map to San Jose Downtown (via www.globexplorer.com & www.mapquest.com)
62

9 12 15 18 21 24 27 30 330
5
10
15
20
25
30
35
40 San Jose Downtown
Time [hour]
Tem
pera
ture
[o C]
Ambient TemperatureLNA Temperature
Figure A.4. Temperature Variation During Measurements at San Jose Downtown
Data Observation
Band Comments
Temporal analysis
The average received power was almost always between -112.2 and -111.4 dBm/MHz, below the thermal noise floor. At 24:00, it increased to -104.7 dBm/MHz. We suspect that this exceptional signal originated from a source in the Crown Plaza Hotel.
Spectral analysis
The average received power was almost always between -112.6 and -110.6 dBm/MHz, below the thermal noise floor for all measurement frequencies. There were a few exceptional signals with bandwidths less than 1 MHz at 1575, 1576, 1577, 1582, 1583, and 1584 MHz. Amongst these, the highest power, -100.9 dBm/MHz, was measured at 1583.6MHz.
GPS signals at 1575MHz also appeared slightly above the thermal noise floor. The GPS power received by the GPS antenna was approximately 1.5 dB higher than the signal received by the horn antennas, because it was directed skyward and the GPS antenna was able to aggregate the power from many GPS satellites while the horn antennas were directed at the horizon and were only able to receive the signals from the satellites near to the horizon. Similar observations were made at the rest of the measurement sites.
Angular analysis
The average received power was almost always between -112.0 and -111.6 dBm/MHz, below the thermal noise floor for all measurement angles. The average received power increased to -106.4 dBm/MHz at an angle of 105 ~ 120 degrees, which is the direction to the Crown Plaza Hotel.
GPS L1
(Fig A.5)
Statistical analysis
Man-made signals were present in less than 0.01 % of the measurement data with a maximum power of -100.7 dBm/MHz.
63

Temporal analysis
The average received power was between -111.7 and -103.6 dBm/MHz, and was above the thermal noise floor for the most of the measurement period. The highest power, - 103.6 dBm/MHz, was measured at 29:30. After 17:00, man-made signals were more or less continuous. Before 17:00, the band was mostly quiet. These man-made signals probably originated from multiple sources in the surrounding buildings.
Spectral analysis
The average received power was variable and high, between -112.3 and -96.0 dBm/MHz, for all measurement frequencies. The highest power, -96.0 dBm/MHz, was received at 2050.5 MHz. Man-made signals were observed at 2050, 2068, and 2084 MHz, and the rest of the frequencies were quiet.
Angular analysis
The average received power was between -110.8 and -105.0 dBm/MHz. It was above the thermal noise floor for all measurement angles. The highest power, -105.0 dBm/MHz, was measured at 225 degrees when the directional antennas pointed at the parking garage. Man-made signals were observed at all angles and no quiet angles were observed. The highest powers came from angles between 60 and 90 degrees corresponding to the Convention Center and angle between 180 and 255 degrees corresponding to the parking garage.
UNI-S
(Fig A.6)
Statistical analysis
Man-made signals were clearly indicated. They were present 1.67 % of the measurement data with a maximum power of -82.5 dBm/MHz.
Temporal analysis
The average received power varied between -99.6 and -75.7 dBm/MHz, well above the thermal noise floor for all measurement time periods. The highest power, -75.7 dBm/MHz, was measured at 10:49. Man-made signals were continuous and no quiet moments were observed. These signals probably had multiple sources in the surrounding buildings.
Spectral analysis
The average received power varied between -104.6 and -74.8 dBm/MHz, well above the thermal noise floor for all measurement frequencies. The highest power, -74.8 dBm/MHz, was monitored at 2472.9 MHz. Man-made signals were continuous in frequency, and no quiet frequencies were observed.
Angular analysis
The average received power varied between -90.6 and -78.7 dBm/MHz, well above the thermal noise floor for all measurement angles. The highest power, -78.7 dBm/MHz, was monitored at 120 degrees, when the antenna pointed at the Crown Plaza Hotel.
ISM 2.4
(Fig A.7)
Statistical analysis
Man-made signals were prevalent. They appeared in 6.08 % of the measurement data with a maximum power of -49.4 dBm/MHz.
64

9 12 15 18 21 24 27 30 33−120
−110
−100
−90
−80
−70
−60
−50
Temporal Analysis
Time [hour]
Ave
rage
Pow
er [d
Bm
/MH
z]
Horizontal HornVertical HornGPS Antenna50 ohm TerminatorThermal Noise Floor
1565 1570 1575 1580 1585−120
−110
−100
−90
−80
−70
−60
−50
Spectral Analysis
Frequency [MHz]P
ower
Spe
ctru
m [d
Bm
/MH
z]
Horizontal HornVertical HornGPS Antenna50 ohm TerminatorThermal Noise Floor
0 60 120 180 240 300 360−120
−110
−100
−90
−80
−70
−60
−50
Angular Analysis
Angle [degree]
Ave
rage
Pow
er [d
Bm
/MH
z]
Horizontal HornVertical HornThermal Noise Floor
0.01 0.1 1 5 10 25 37 50−10
0
10
20
30
40
50
60
Statistical Analysis
Percentile exceeding ordinate
dB a
bove
(kT
0B+
NF
)
Horizontal HornVertical HornGPS Antenna50 ohm TerminatorThermal Noise Floor
Figure A.5. Spectrum Measurements at San Jose Downtown (GPS L1)
65

9 12 15 18 21 24 27 30 33−120
−110
−100
−90
−80
−70
−60
−50
Temporal Analysis
Time [hour]
Ave
rage
Pow
er [d
Bm
/MH
z]
Horizontal HornVertical Horn50 ohm TerminatorThermal Noise Floor
2040 2060 2080 2100−120
−110
−100
−90
−80
−70
−60
−50
Spectral Analysis
Frequency [MHz]P
ower
Spe
ctru
m [d
Bm
/MH
z]
Horizontal HornVertical Horn50 ohm TerminatorThermal Noise Floor
0 60 120 180 240 300 360−120
−110
−100
−90
−80
−70
−60
−50
Angular Analysis
Angle [degree]
Ave
rage
Pow
er [d
Bm
/MH
z]
Horizontal HornVertical HornThermal Noise Floor
0.01 0.1 1 5 10 25 37 50−10
0
10
20
30
40
50
60
Statistical Analysis
Percentile exceeding ordinate
dB a
bove
(kT
0B+
NF
)
Horizontal HornVertical Horn50 ohm TerminatorThermal Noise Floor
Figure A.6. Spectrum Measurements at San Jose Downtown (UNI-S)
66

9 12 15 18 21 24 27 30 33−120
−110
−100
−90
−80
−70
−60
−50
Temporal Analysis
Time [hour]
Ave
rage
Pow
er [d
Bm
/MH
z]
Horizontal HornVertical Horn50 ohm TerminatorThermal Noise Floor
2400 2420 2440 2460 2480−120
−110
−100
−90
−80
−70
−60
−50
Spectral Analysis
Frequency [MHz]P
ower
Spe
ctru
m [d
Bm
/MH
z]
Horizontal HornVertical Horn50 ohm TerminatorThermal Noise Floor
0 60 120 180 240 300 360−120
−110
−100
−90
−80
−70
−60
−50
Angular Analysis
Angle [degree]
Ave
rage
Pow
er [d
Bm
/MH
z]
Horizontal HornVertical HornThermal Noise Floor
0.01 0.1 1 5 10 25 37 50−10
0
10
20
30
40
50
60
Statistical Analysis
Percentile exceeding ordinate
dB a
bove
(kT
0B+
NF
)
Horizontal HornVertical Horn50 ohm TerminatorThermal Noise Floor
Figure A.7. Spectrum Measurements at San Jose Downtown (ISM 2.4)
67

(This page was left intentionally blank)
68
Appendix A.2: Palo Alto Downtown
Site Description
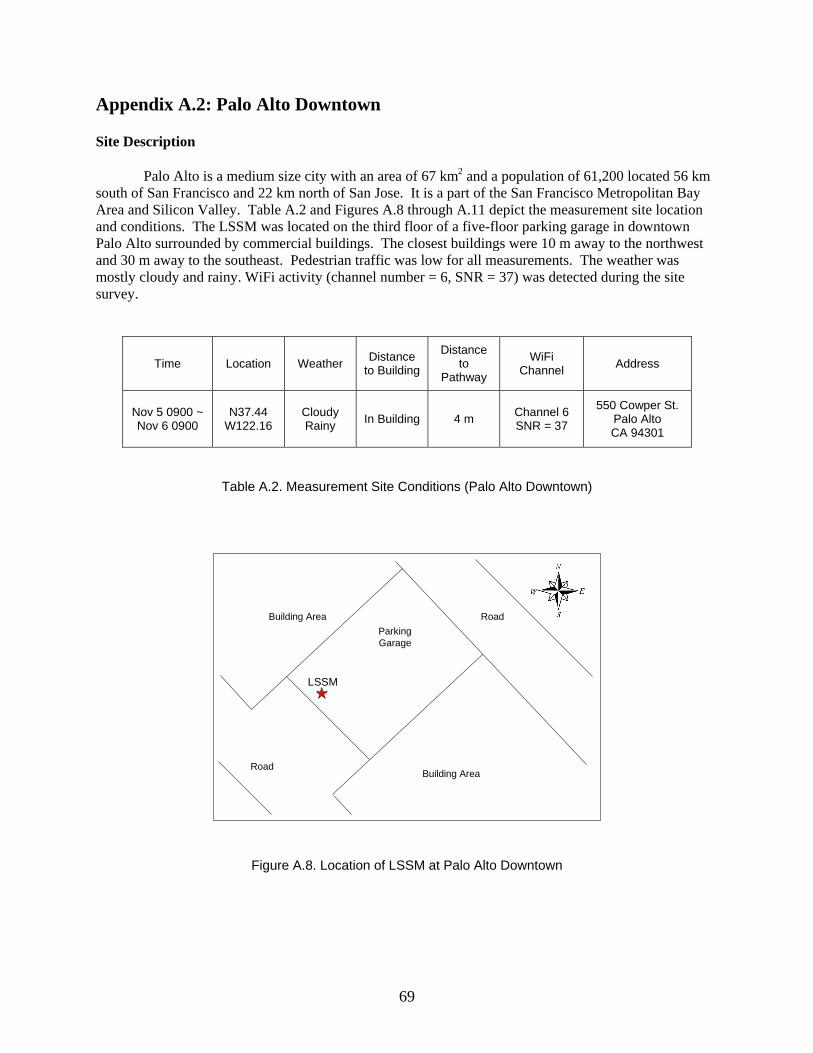
Palo Alto is a medium size city with an area of 67 km2 and a population of 61,200 located 56 km south of San Francisco and 22 km north of San Jose. It is a part of the San Francisco Metropolitan Bay Area and Silicon Valley. Table A.2 and Figures A.8 through A.11 depict the measurement site location and conditions. The LSSM was located on the third floor of a five-floor parking garage in downtown Palo Alto surrounded by commercial buildings. The closest buildings were 10 m away to the northwest and 30 m away to the southeast. Pedestrian traffic was low for all measurements. The weather was mostly cloudy and rainy. WiFi activity (channel number = 6, SNR = 37) was detected during the site survey.
Time Location Weather Distance to Building
Distance to
Pathway
WiFi Channel Address
Nov 5 0900 ~ Nov 6 0900
N37.44 W122.16
Cloudy Rainy In Building 4 m Channel 6
SNR = 37
550 Cowper St. Palo Alto CA 94301
Table A.2. Measurement Site Conditions (Palo Alto Downtown)
LSSM
ParkingGarage
Building Area
Road
Road
Building Area
Figure A.8. Location of LSSM at Palo Alto Downtown
69
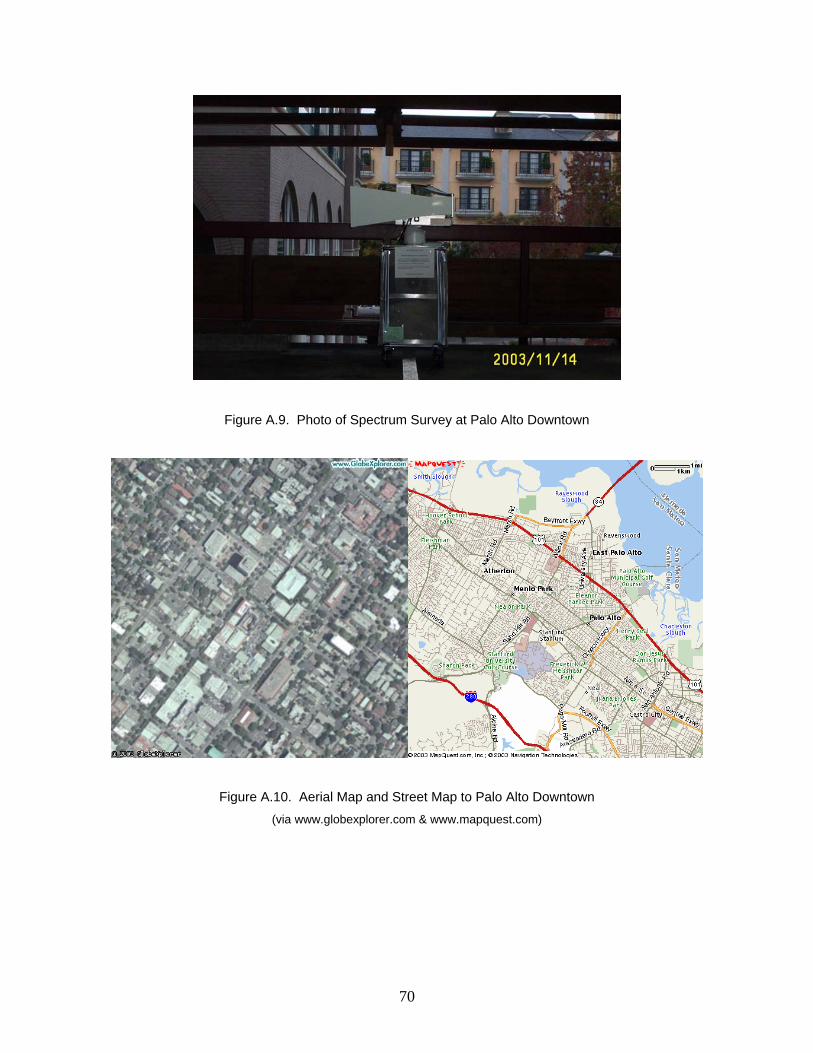
Figure A.9. Photo of Spectrum Survey at Palo Alto Downtown
Figure A.10. Aerial Map and Street Map to Palo Alto Downtown (via www.globexplorer.com & www.mapquest.com)
70

9 12 15 18 21 24 27 30 330
5
10
15
20
25
30
35
40 Palo Alto Downtown
Time [hour]
Tem
pera
ture
[o C]
Ambient TemperatureLNA Temperature
Figure A.11. Temperature Variation During Measurements at Palo Alto Downtown
Data Observation
Band Comments
Temporal analysis
The average received power was almost always constant between -111.7 and -110.8 dBm/MHz, at the thermal noise floor for all measurement time periods. At 21:12, the vertical horn antenna detected a power increase to -103.3 dBm/MHz. This exceptional signal probably originated from a single source in a surrounding building.
Spectral analysis
The average received power was almost always between -111.8 and -110.2 dBm/MHz, at the thermal noise floor for all measurement frequencies. An exception was detected at 1570.5 MHz, where a signal with a bandwidth of less than 1 MHz appeared with a power of -101.2 dBm/MHz.
Angular analysis
The average received power was almost always between -112.0 and -111.2 dBm/MHz, at the thermal noise floor for all measurement angles. The sole exception was detected at 15 degrees, where the power increased to -103.6 dBm/MHz.
GPS L1
(Fig A.12)
Statistical analysis
Man-made signals were measured only with the vertical horn, and these signals occurred in less than 0.02 % of the measurement data with a maximum power of -97.8 dBm/MHz.
UNI-S
(Fig A.13)
Temporal analysis
The average received power was almost always constant between -111.7 and -111.2 dBm/MHz, at the thermal noise floor for all measurement time periods. At 18:30, an exception increased the power to -103.4 dBm/MHz through the vertical horn antenna. This exception probably originated from a single source in a surrounding building.
71

Spectral analysis
The average received power was almost always constant between -112.2 and -110.8 dBm/MHz and near the thermal noise floor for all measurement frequencies. A sole exception occurred at 2085.1 MHz where the signal had a bandwidth less than 5 MHz bandwidth and a power of -100.9 dBm/MHz.
Angular analysis
The average received power was almost always constant between -111.9 and -110.5 dBm/MHz and near the thermal noise floor for all measurement angles. Exceptions occurred at measurement angles between 75 and 90 degrees and between 285 and 290 degrees. In these angular bins, the power level increased to -105.6 dBm/MHz.
Statistical analysis
The only man-made signal that was indicated appeared in the vertical horn antenna measurement. This signal appeared in less than 0.06 % of the data with maximum density of -87.5 dBm/MHz.
Temporal analysis
The power varied between -103.2 and -81.6 dBm/MHz, well above the thermal noise floor for all measurement time periods. The highest power was -81.6 dBm/MHz, and was measured at 21:53. Man-made signals were continuous in time and no quiet times were observed. These signals probably originated from multiple sources in the surrounding buildings.
Spectral analysis
The power varied between -109.4 and -82.3 dBm/MHz, well above the thermal noise floor for all measurement frequencies. The highest power was -82.3 dBm/MHz and occurred at 2464.1 MHz. Man-made signals were continuous in frequency and no quiet frequencies were found.
Angular analysis
The power varied between -105.5 and -83.5 dBm/MHz, well above the thermal noise floor for all measurement angles. The highest power was -83.5 dBm/MHz and occurred at 240 degrees. Man-made signals were observed at all angles, and no quiet angles were observed.
ISM 2.4
(Fig A.14)
Statistical analysis
Man-made signals were apparent in 4.35 % of the measurement data with a maximum power of -55.1 dBm/MHz.
72

9 12 15 18 21 24 27 30 33−120
−110
−100
−90
−80
−70
−60
−50
Temporal Analysis
Time [hour]
Ave
rage
Pow
er [d
Bm
/MH
z]
Horizontal HornVertical HornGPS Antenna50 ohm TerminatorThermal Noise Floor
1565 1570 1575 1580 1585−120
−110
−100
−90
−80
−70
−60
−50
Spectral Analysis
Frequency [MHz]
Pow
er S
pect
rum
[dB
m/M
Hz]
Horizontal HornVertical HornGPS Antenna50 ohm TerminatorThermal Noise Floor
0 60 120 180 240 300 360−120
−110
−100
−90
−80
−70
−60
−50
Angular Analysis
Angle [degree]
Ave
rage
Pow
er [d
Bm
/MH
z]
Horizontal HornVertical HornThermal Noise Floor
0.01 0.1 1 5 10 25 37 50−10
0
10
20
30
40
50
60
Statistical Analysis
Percentile exceeding ordinate
dB a
bove
(kT
0B+
NF
)
Horizontal HornVertical HornGPS Antenna50 ohm TerminatorThermal Noise Floor
Figure A.12. Spectrum Measurements at Palo Alto Downtown (GPS L1)
73

9 12 15 18 21 24 27 30 33−120
−110
−100
−90
−80
−70
−60
−50
Temporal Analysis
Time [hour]
Ave
rage
Pow
er [d
Bm
/MH
z]
Horizontal HornVertical Horn50 ohm TerminatorThermal Noise Floor
2040 2060 2080 2100−120
−110
−100
−90
−80
−70
−60
−50
Spectral Analysis
Frequency [MHz]P
ower
Spe
ctru
m [d
Bm
/MH
z]
Horizontal HornVertical Horn50 ohm TerminatorThermal Noise Floor
0 60 120 180 240 300 360−120
−110
−100
−90
−80
−70
−60
−50
Angular Analysis
Angle [degree]
Ave
rage
Pow
er [d
Bm
/MH
z]
Horizontal HornVertical HornThermal Noise Floor
0.01 0.1 1 5 10 25 37 50−10
0
10
20
30
40
50
60
Statistical Analysis
Percentile exceeding ordinate
dB a
bove
(kT
0B+
NF
)
Horizontal HornVertical Horn50 ohm TerminatorThermal Noise Floor
Figure A.13. Spectrum Measurements at Palo Alto Downtown (UNI-S)
74

9 12 15 18 21 24 27 30 33−120
−110
−100
−90
−80
−70
−60
−50
Temporal Analysis
Time [hour]
Ave
rage
Pow
er [d
Bm
/MH
z]
Horizontal HornVertical Horn50 ohm TerminatorThermal Noise Floor
2400 2420 2440 2460 2480−120
−110
−100
−90
−80
−70
−60
−50
Spectral Analysis
Frequency [MHz]P
ower
Spe
ctru
m [d
Bm
/MH
z]
Horizontal HornVertical Horn50 ohm TerminatorThermal Noise Floor
0 60 120 180 240 300 360−120
−110
−100
−90
−80
−70
−60
−50
Angular Analysis
Angle [degree]
Ave
rage
Pow
er [d
Bm
/MH
z]
Horizontal HornVertical HornThermal Noise Floor
0.01 0.1 1 5 10 25 37 50−10
0
10
20
30
40
50
60
Statistical Analysis
Percentile exceeding ordinate
dB a
bove
(kT
0B+
NF
)
Horizontal HornVertical Horn50 ohm TerminatorThermal Noise Floor
Figure A.14. Spectrum Measurements at Palo Alto Downtown (ISM 2.4)
75

(This page was left intentionally blank)
76

Appendix A.3: Yosemite National Park
Site Description
The Yosemite National Park is a national park region for the protection of the forest and the natural habitat within the area of 3045 km2. Table A.3 and Figures A.15 through A.18 depict the measurement site location and conditions. The LSSM was located at a lodging house inside of the Yosemite National Park. Major objects in close proximity to the LSSM were the lodging houses (1 m away west and 50 m away east) and the surrounding hills (all sides). No pedestrians were observed. Weather was mostly sunny and clear. No WiFi activity was detected during the site survey.
Time Location Weather Distance to Building
Distance to
Pathway
WiFi Channel Address
Nov 5 0900 ~ Nov 6 0900
N37.69 W119.76
Sunny Clear 1 m N/A N/A
1172 Danaway Foresta
CA 95389
Table A.3. Measurement Site Conditions (Yosemite Park)
LSSM
Lodging House
Lodging House
Creek Hill
Figure A.15. Location of LSSM at Yosemite Park
77

Figure A.16. Photo of Spectrum Survey at Yosemite Park
Figure A.17. Aerial Map and Street Map to Yosemite Park (via www.globexplorer.com & www.mapquest.com)
78

9 12 15 18 21 24 27 30 330
5
10
15
20
25
30
35
40 Yosemite Park
Time [hour]
Tem
pera
ture
[o C]
Ambient TemperatureLNA Temperature
Figure A.18. Temperature Variation During Measurements at Yosemite Park
Data Observation
Band Comments
Temporal analysis
The average received power was between -112.8 ~ -111.9 dBm/MHz, below the thermal noise floor for all measurement time periods. The highest power, -111.9 dBm/MHz, was measured at 16:00.
Spectral analysis
The average received power was between -113.3 ~ -110.9 dBm/MHz, below the thermal noise floor for most of the measurement frequencies. The highest power, -110.9 dBm/MHz, was measured at 1575.3 MHz, which is the GPS signal from the GPS satellites.
Angular analysis
The average received power was between -112.8 ~ -111.7 dBm/MHz, below the thermal noise floor for the most of the measurement. The highest power, -111.7 dBm/MHz, was measured at 285 degrees, which is corresponding to the lodging house. It is because the antennas observed less of the sky and more of the building which is at the thermal equilibrium with the Earth.
GPS L1
(Fig A.19)
Statistical analysis
No man-made signal except the GPS signal was detected.
Temporal analysis
The average received power was between -112.1 ~ -111.6 dBm/MHz, at the thermal noise floor for all measurement time periods. The highest power, -111.6 dBm/MHz, was measured at 16:21.
UNI-S
(Fig A.20)
Spectral analysis
The average received power was between -112.7 ~ -111.1 dBm/MHz, at the thermal noise floor for all measurement frequencies. The highest power, -111.1 dBm/MHz, was measured at 2025.0 MHz.
79

Angular analysis
The average received power was between -112.3 ~ -111.5 dBm/MHz, at the thermal noise floor for all measurement angles. The highest power, -111.5 dBm/MHz, was measured at 225 degrees, which is corresponding to the lodging house. It is because the antennas observed less of the sky and more of the building which is at the thermal equilibrium with the Earth.
Statistical analysis
No man-made signal was detected.
Temporal analysis
The average received power was almost always between -111.9 ~ -111.4 dBm/MHz, below the thermal noise floor. At 10, 16 ~ 18 and 32 ~ 33 hours, there were exceptional increases. Among these, the highest power, -71.2 dBm/MHz, was measured at 32:49. Man-made signals were discontinuous and were not measured for the most of measurement time periods. These exceptional signals probably originated from the microwave ovens in the area considering the measured time periods and the high power level.
Spectral analysis
The average received power was variable and high, -111.5 ~ -75.1 dBm/MHz, above the thermal noise floor for all measurement frequencies. The highest power, -75.1 dBm/MHz, was measured at 2462.4 MHz. Man-made signals were continuous in frequency and occupied most of frequency, but the upper end of the frequency band was relatively quiet. Two wide band man-made signals were observed in 2400 ~ 2475 MHz and 2430 ~ 2475 MHz.
Angular analysis
The average received power was variable and high, -111.9 ~ -78.2 dBm/MHz, above the thermal noise floor for the most of the measurement angles. The highest power, - 78.2 dBm/MHz, was measured at 15 degrees. Man-made signals were continuous in the most angles but the angles between 90 and 120 degrees were relatively quiet.
ISM 2.4
(Fig A.21)
Statistical analysis
Man-made signals were clearly indicated. They were present 0.78 % of the measurement data with a maximum power of -50.2 dBm/MHz.
80

9 12 15 18 21 24 27 30 33−120
−110
−100
−90
−80
−70
−60
−50
Temporal Analysis
Time [hour]
Ave
rage
Pow
er [d
Bm
/MH
z]
Horizontal HornVertical HornGPS Antenna50 ohm TerminatorThermal Noise Floor
1565 1570 1575 1580 1585−120
−110
−100
−90
−80
−70
−60
−50
Spectral Analysis
Frequency [MHz]P
ower
Spe
ctru
m [d
Bm
/MH
z]
Horizontal HornVertical HornGPS Antenna50 ohm TerminatorThermal Noise Floor
0 60 120 180 240 300 360−120
−110
−100
−90
−80
−70
−60
−50
Angular Analysis
Angle [degree]
Ave
rage
Pow
er [d
Bm
/MH
z]
Horizontal HornVertical HornThermal Noise Floor
0.01 0.1 1 5 10 25 37 50−10
0
10
20
30
40
50
60
Statistical Analysis
Percentile exceeding ordinate
dB a
bove
(kT
0B+
NF
)
Horizontal HornVertical HornGPS Antenna50 ohm TerminatorThermal Noise Floor
Figure A.19. Spectrum Measurements at Yosemite Park (GPS L1)
81

9 12 15 18 21 24 27 30 33−120
−110
−100
−90
−80
−70
−60
−50
Temporal Analysis
Time [hour]
Ave
rage
Pow
er [d
Bm
/MH
z]
Horizontal HornVertical Horn50 ohm TerminatorThermal Noise Floor
2040 2060 2080 2100−120
−110
−100
−90
−80
−70
−60
−50
Spectral Analysis
Frequency [MHz]P
ower
Spe
ctru
m [d
Bm
/MH
z]
Horizontal HornVertical Horn50 ohm TerminatorThermal Noise Floor
0 60 120 180 240 300 360−120
−110
−100
−90
−80
−70
−60
−50
Angular Analysis
Angle [degree]
Ave
rage
Pow
er [d
Bm
/MH
z]
Horizontal HornVertical HornThermal Noise Floor
0.01 0.1 1 5 10 25 37 50−10
0
10
20
30
40
50
60
Statistical Analysis
Percentile exceeding ordinate
dB a
bove
(kT
0B+
NF
)
Horizontal HornVertical Horn50 ohm TerminatorThermal Noise Floor
Figure A.20. Spectrum Measurements at Yosemite Park (UNI-S)
82

9 12 15 18 21 24 27 30 33−120
−110
−100
−90
−80
−70
−60
−50
Temporal Analysis
Time [hour]
Ave
rage
Pow
er [d
Bm
/MH
z]
Horizontal HornVertical Horn50 ohm TerminatorThermal Noise Floor
2400 2420 2440 2460 2480−120
−110
−100
−90
−80
−70
−60
−50
Spectral Analysis
Frequency [MHz]P
ower
Spe
ctru
m [d
Bm
/MH
z]
Horizontal HornVertical Horn50 ohm TerminatorThermal Noise Floor
0 60 120 180 240 300 360−120
−110
−100
−90
−80
−70
−60
−50
Angular Analysis
Angle [degree]
Ave
rage
Pow
er [d
Bm
/MH
z]
Horizontal HornVertical HornThermal Noise Floor
0.01 0.1 1 5 10 25 37 50−10
0
10
20
30
40
50
60
Statistical Analysis
Percentile exceeding ordinate
dB a
bove
(kT
0B+
NF
)
Horizontal HornVertical Horn50 ohm TerminatorThermal Noise Floor
Figure A.21. Spectrum Measurements at Yosemite Park (ISM 2.4)
83

(This page was left intentionally blank)
84

Appendix A.4: Jasper Ridge Biological Preserve
Site Description
The Jasper Ridge Biological Preserve is a serpentine grassland managed primarily for research and instruction within the area of 4.8 km2 located near Stanford University in the eastern foothills of the Santa Cruz Mountains. Table A.4 and Figures A.22 through A.25 depict the measurement site location and conditions. The LSSM was located at the lakeside away from the major research facilities. Major objects in close proximity to the LSSM were an abandoned facility building (13 m away, northwest) and a WiFi transmitter used for research purposes (10 m away, southwest). No pedestrian was observed during the measurements. Weather was mostly sunny and clear. No WiFi activity was detected during the site survey.
Time Location Weather Distance to Building
Distance to
Pathway
WiFi Channel Address
Oct 9 0900 ~ Oct 10 0900
N37.40 W122.24 Sunny 13 m On
pathway N/A 4001 Sandhill
Rd. Palo Alto CA 94305
Table A.4. Measurement Site Conditions (Jasper Ridge Preserve)
Facility Building
Lake
LSSMHill
Road
WiFi Transmitter
Figure A.22. Location of LSSM at Jasper Ridge Preserve
85

Figure A.23. Photo of Spectrum Survey at Jasper Ridge Preserve
Figure A.24. Aerial Map and Street Map to Jasper Ridge Preserve (via www.globexplorer.com & www.mapquest.com)
86

9 12 15 18 21 24 27 30 330
5
10
15
20
25
30
35
40Jasper Ridge Preserve
Time [hour]
Tem
pera
ture
[o C]
Ambient TemperatureLNA Temperature
Figure A.25. Temperature Variation During Measurements at Jasper Ridge Preserve
Data Observation
Band Comments
Temporal analysis
The average received power was between -112.5 ~ -111.8 dBm/MHz, below the thermal noise floor for all measurement time periods. The highest power, -111.8 dBm/MHz, was measured at 14:00.
Spectral analysis
The average received power was between -112.9 ~ -110.7 dBm/MHz, below the thermal noise floor for most of the measurement frequencies. The highest power, - 110.7 dBm/MHz, was measured at 1575.5 MHz which is the GPS signal from the GPS satellites.
Angular analysis
The average received power was between -112.7 ~ -111.6 dBm/MHz, below the thermal noise floor for most of the measurement angles. The highest power, -111.6 dBm/MHz, was measured at 300 degrees, which is corresponding to the facility building. It is because the antennas observed less of the sky and more of the building which is at the thermal equilibrium with the Earth.
GPS L1
(Fig A.26)
Statistical analysis
No man-made signal except the GPS signal was detected.
Temporal analysis
The average received power was between -112.2 ~ -111.5 dBm/MHz, at the thermal noise floor for all measurement time periods. The highest power, -111.5 dBm/MHz, was measured at 17:21.
UNI-S
(Fig A.27)
Spectral analysis
The average received power was between -112.5 ~ -111.1 dBm/MHz, at the thermal noise floor for all measurement frequencies. The highest power, -111.1 dBm/MHz, was measured at 2110.0 MHz.
87

Angular analysis
The average received power was between -112.3 ~ -111.4 dBm/MHz, at the thermal noise floor for all measurement angels. The highest power, -111.4 dBm/MHz, was measured at 330 degrees which is corresponding to the facility building. It is because the antennas observed less of the sky and more of the building which is at the thermal equilibrium with Earth.
Statistical analysis
No man-made signal was detected.
Temporal analysis
The average received power was almost always between -106.7 ~ -104.1 dBm/MHz, above the thermal noise floor for all measurement time periods. It exceptionally increased to -84.1 dBm/MHz at 10:40. Man-made signals were continuous and probably originated from the WiFi transmitter installed in the area for the purpose of the research data collection.
Spectral analysis
The average received power was variable and high, -111.9 ~ -79.7 dBm/MHz, above the thermal noise floor for all measurement frequencies. The highest power, -79.7 dBm/MHz, was measured at 2433.4 MHz. Man-made signals were observed in the 3 frequency ranges and the upper end of the frequency band was relatively quiet. Three wide band man-made signals were observed in 2405 ~ 2415 MHz, 2425 ~ 2440 MHz and 2445 ~ 2465 MHz.
Angular analysis
The average received power was almost always between -111.2 ~ -108.1 dBm/MHz, at the thermal noise floor for all measurement angles. At the angle between 105 ~ 225 degrees, there were exceptional increases due to the man-made signals. The highest power, -84.5 dBm/MHz, was measured at 120 degrees corresponding to the WiFi transmitter.
ISM 2.4
(Fig A.28)
Statistical analysis
Man-made signals were clearly indicated. They were present 3.67 % of the measurement data with a maximum power of -75.5 dBm/MHz.
88

9 12 15 18 21 24 27 30 33−120
−110
−100
−90
−80
−70
−60
−50
Temporal Analysis
Time [hour]
Ave
rage
Pow
er [d
Bm
/MH
z]
Horizontal HornVertical HornGPS Antenna50 ohm TerminatorThermal Noise Floor
1565 1570 1575 1580 1585−120
−110
−100
−90
−80
−70
−60
−50
Spectral Analysis
Frequency [MHz]P
ower
Spe
ctru
m [d
Bm
/MH
z]
Horizontal HornVertical HornGPS Antenna50 ohm TerminatorThermal Noise Floor
0 60 120 180 240 300 360−120
−110
−100
−90
−80
−70
−60
−50
Angular Analysis
Angle [degree]
Ave
rage
Pow
er [d
Bm
/MH
z]
Horizontal HornVertical HornThermal Noise Floor
0.01 0.1 1 5 10 25 37 50−10
0
10
20
30
40
50
60
Statistical Analysis
Percentile exceeding ordinate
dB a
bove
(kT
0B+
NF
)
Horizontal HornVertical HornGPS Antenna50 ohm TerminatorThermal Noise Floor
Figure A.26. Spectrum Measurements at Jasper Ridge Preserve (GPS L1)
89

9 12 15 18 21 24 27 30 33−120
−110
−100
−90
−80
−70
−60
−50
Temporal Analysis
Time [hour]
Ave
rage
Pow
er [d
Bm
/MH
z]
Horizontal HornVertical Horn50 ohm TerminatorThermal Noise Floor
2040 2060 2080 2100−120
−110
−100
−90
−80
−70
−60
−50
Spectral Analysis
Frequency [MHz]P
ower
Spe
ctru
m [d
Bm
/MH
z]
Horizontal HornVertical Horn50 ohm TerminatorThermal Noise Floor
0 60 120 180 240 300 360−120
−110
−100
−90
−80
−70
−60
−50
Angular Analysis
Angle [degree]
Ave
rage
Pow
er [d
Bm
/MH
z]
Horizontal HornVertical HornThermal Noise Floor
0.01 0.1 1 5 10 25 37 50−10
0
10
20
30
40
50
60
Statistical Analysis
Percentile exceeding ordinate
dB a
bove
(kT
0B+
NF
)
Horizontal HornVertical Horn50 ohm TerminatorThermal Noise Floor
Figure A.27. Spectrum Measurements at Jasper Ridge Preserve (UNI-S)
90

9 12 15 18 21 24 27 30 33−120
−110
−100
−90
−80
−70
−60
−50
Temporal Analysis
Time [hour]
Ave
rage
Pow
er [d
Bm
/MH
z]
Horizontal HornVertical Horn50 ohm TerminatorThermal Noise Floor
2400 2420 2440 2460 2480−120
−110
−100
−90
−80
−70
−60
−50
Spectral Analysis
Frequency [MHz]P
ower
Spe
ctru
m [d
Bm
/MH
z]
Horizontal HornVertical Horn50 ohm TerminatorThermal Noise Floor
0 60 120 180 240 300 360−120
−110
−100
−90
−80
−70
−60
−50
Angular Analysis
Angle [degree]
Ave
rage
Pow
er [d
Bm
/MH
z]
Horizontal HornVertical HornThermal Noise Floor
0.01 0.1 1 5 10 25 37 50−10
0
10
20
30
40
50
60
Statistical Analysis
Percentile exceeding ordinate
dB a
bove
(kT
0B+
NF
)
Horizontal HornVertical Horn50 ohm TerminatorThermal Noise Floor
Figure A.28. Spectrum Measurements at Jasper Ridge Preserve (ISM 2.4)
91

(This page was left intentionally blank)
92

Appendix A.5: San Jose International Airport
Site Description
The San Jose International Airport is an international airport located 3 km away from the San Jose downtown. There are two terminals and three runways used by both passenger airplanes and cargo airplanes. Table A.5 and Figures A.29 through A.32 depict the measurement site location and conditions. The LSSM was located on the rooftop of the two-story terminal building overlooking the runways. Major objects in close proximity to the LSSM were the runways (southwest), the San Jose downtown (east), other terminal buildings (northwest), the communication antennas installed on the roof (three antennas with minimum 20 m separation from the LSSM) and the passenger airplanes around the terminal building. No pedestrian was allowed in the area. Weather was mostly sunny and clear. No WiFi activity was detected during the site survey.
Time Location Weather Distance to Building
Distance to
Pathway
WiFi Channel Address
Oct 7 0900 ~ Oct 8 0900
N37.36 W121.93
Sunny Clear
On Rooftop of
the building
N/A N/A 1661 Airport
Blvd. San Jose CA 95110
Table A.5. Measurement Site Conditions (San Jose Airport)
AirportRunways
San JoseDowntown
LSSM
Rooftop ofAirport Terminal Building Road
Figure A.29. Location of LSSM at San Jose Airport
93

Figure A.30. Photo of Spectrum Survey at San Jose Airport
Figure A.31. Aerial Map and Street Map to San Jose Airport (via www.globexplorer.com & www.mapquest.com)
94
9 12 15 18 21 24 27 30 330
5
10
15
20
25
30
35
40 San Jose Airport
Time [hour]
Tem
pera
ture
[o C]
Ambient TemperatureLNA Temperature
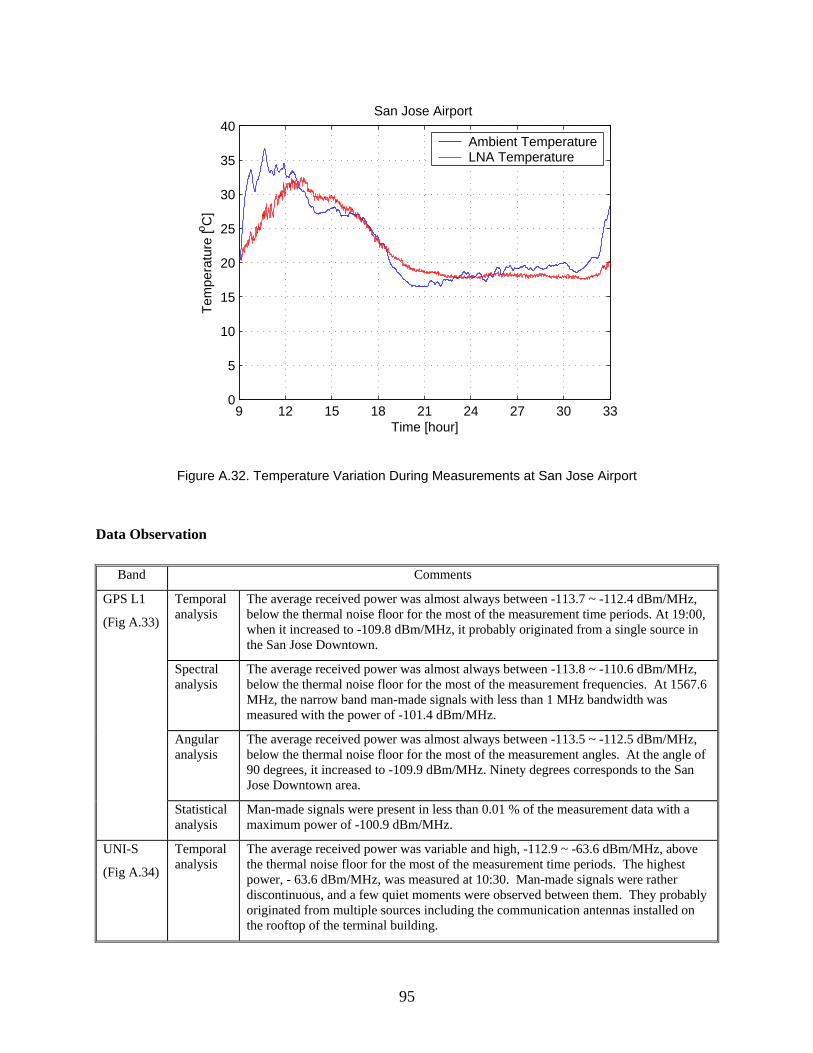
Figure A.32. Temperature Variation During Measurements at San Jose Airport
Data Observation
Band Comments
Temporal analysis
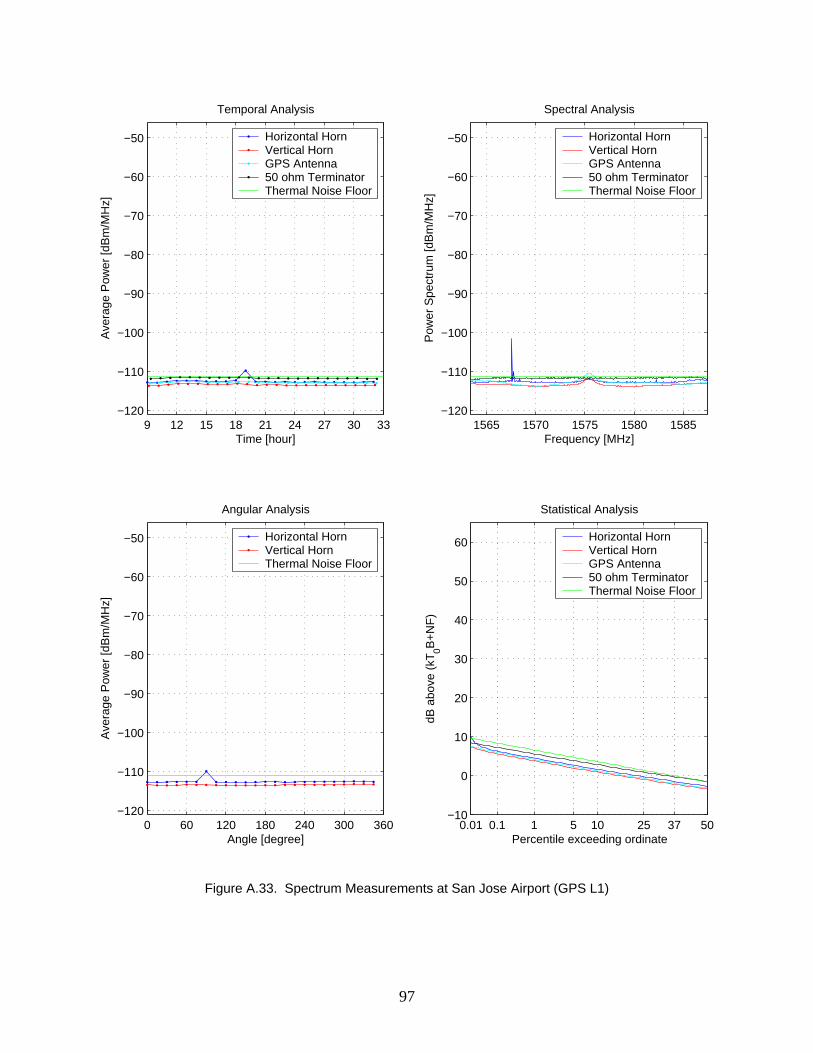
The average received power was almost always between -113.7 ~ -112.4 dBm/MHz, below the thermal noise floor for the most of the measurement time periods. At 19:00, when it increased to -109.8 dBm/MHz, it probably originated from a single source in the San Jose Downtown.
Spectral analysis
The average received power was almost always between -113.8 ~ -110.6 dBm/MHz, below the thermal noise floor for the most of the measurement frequencies. At 1567.6 MHz, the narrow band man-made signals with less than 1 MHz bandwidth was measured with the power of -101.4 dBm/MHz.
Angular analysis
The average received power was almost always between -113.5 ~ -112.5 dBm/MHz, below the thermal noise floor for the most of the measurement angles. At the angle of 90 degrees, it increased to -109.9 dBm/MHz. Ninety degrees corresponds to the San Jose Downtown area.
GPS L1
(Fig A.33)
Statistical analysis
Man-made signals were present in less than 0.01 % of the measurement data with a maximum power of -100.9 dBm/MHz.
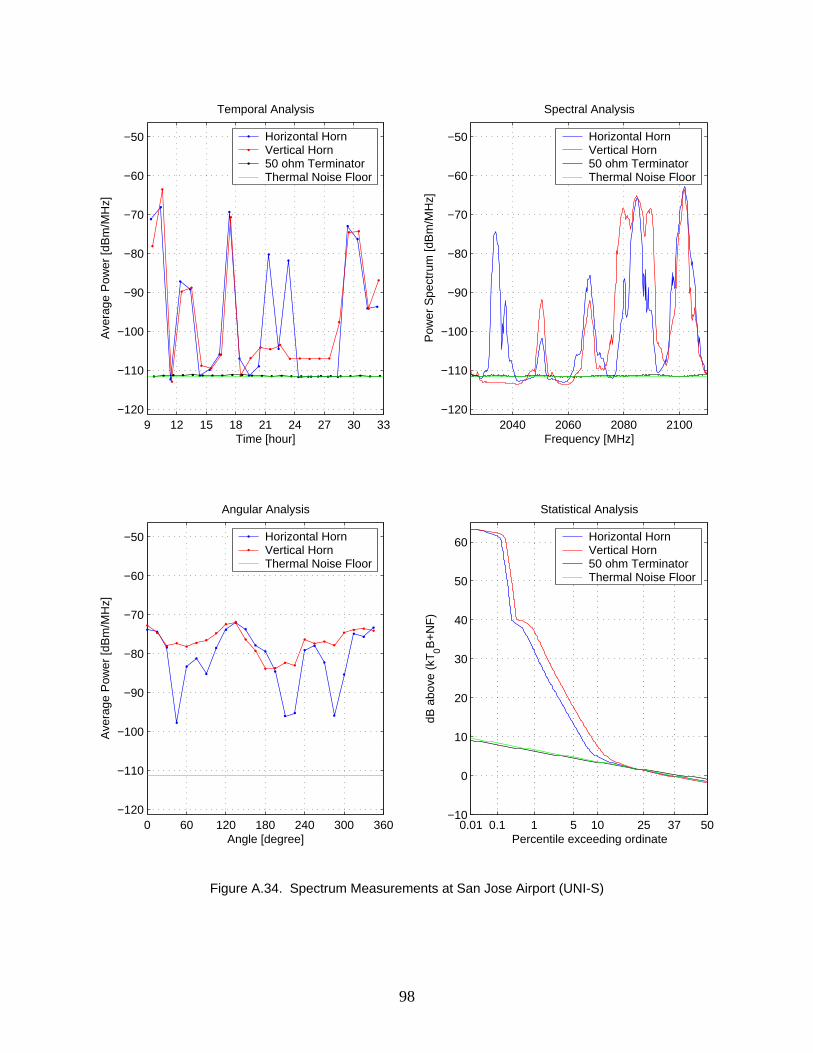
UNI-S
(Fig A.34)
Temporal analysis
The average received power was variable and high, -112.9 ~ -63.6 dBm/MHz, above the thermal noise floor for the most of the measurement time periods. The highest power, - 63.6 dBm/MHz, was measured at 10:30. Man-made signals were rather discontinuous, and a few quiet moments were observed between them. They probably originated from multiple sources including the communication antennas installed on the rooftop of the terminal building.
95

Spectral analysis
The average received power was variable and high, -113.8 ~ -62.8 dBm/MHz, above the thermal noise floor for the most of the measurement frequencies. The highest power, - 62.8 dBm/MHz, was measured at 2101.9 MHz. Man-made signals were discontinuous in frequency, and a few quiet frequencies were observed. The relatively narrow band man-made signals with less than 10 MHz bandwidth were measured at 2034 MHz and 2050 MHz, and the wide band man-made signals with more than 10 MHz bandwidth were measured at 2068 MHz, 2085 MHz and 2102 MHz.
Angular analysis
The average received power was variable and high, -97.8 ~ -71.9 dBm/MHz, above the thermal noise floor for all measurement angles. The highest power, -71.9 dBm/MHz, was measured at 135 degrees corresponding to the airport terminal building. It probably originated from the communication antennas installed on the rooftop of the terminal building. There were three communication antennas each at 0, 150, and 285 degrees. Man-made signals were continuous in angle.
Statistical analysis
Man-made signals were prevalent. They were present 8.71 % of the measurement data with a maximum power of -48.0 dBm/MHz.
Temporal analysis
The average received power was variable and high, -98.7 ~ -74.9 dBm/MHz, above the thermal noise floor for all measurement time periods. The highest power, -74.9 dBm/MHz, was measured at 18:40. Man-made signals were continuous in time and probably originated from multiple sources in the surrounding urban area.
Spectral analysis
The average received power was variable and high, -108.0 ~ -69.8 dBm/MHz, above the thermal noise floor for all measurement frequencies. The highest power, -69.8 dBm/MHz, was measured at 2433.8 MHz. Man-made signals were continuous in frequency. The relatively high power narrow band man-made signals with less than 10 MHz bandwidth were measured at 2420 MHz and 2434 MHz.
Angular analysis
The average received power was variable and high, -99.7 ~ -76.4 dBm/MHz, above the thermal noise floor for all measurement angles. The highest power, -76.4 dBm/MHz, was measured at 270 degrees corresponding to the edge of the airport terminal building. It probably originated from the communication antennas installed on the rooftop. Man-made signals were continuous in angle.
ISM 2.4
(Fig A.35)
Statistical analysis
Man-made signals were prevalent. They were present 26.73 % of the measurement data with a maximum power of -49.4 dBm/MHz.
96
9 12 15 18 21 24 27 30 33−120
−110
−100
−90
−80
−70
−60
−50
Temporal Analysis
Time [hour]
Ave
rage
Pow
er [d
Bm
/MH
z]
Horizontal HornVertical HornGPS Antenna50 ohm TerminatorThermal Noise Floor
1565 1570 1575 1580 1585−120
−110
−100
−90
−80
−70
−60
−50
Spectral Analysis
Frequency [MHz]P
ower
Spe
ctru
m [d
Bm
/MH
z]
Horizontal HornVertical HornGPS Antenna50 ohm TerminatorThermal Noise Floor
0 60 120 180 240 300 360−120
−110
−100
−90
−80
−70
−60
−50
Angular Analysis
Angle [degree]
Ave
rage
Pow
er [d
Bm
/MH
z]
Horizontal HornVertical HornThermal Noise Floor
0.01 0.1 1 5 10 25 37 50−10
0
10
20
30
40
50
60
Statistical Analysis
Percentile exceeding ordinate
dB a
bove
(kT
0B+
NF
)
Horizontal HornVertical HornGPS Antenna50 ohm TerminatorThermal Noise Floor
Figure A.33. Spectrum Measurements at San Jose Airport (GPS L1)
97
9 12 15 18 21 24 27 30 33−120
−110
−100
−90
−80
−70
−60
−50
Temporal Analysis
Time [hour]
Ave
rage
Pow
er [d
Bm
/MH
z]
Horizontal HornVertical Horn50 ohm TerminatorThermal Noise Floor
2040 2060 2080 2100−120
−110
−100
−90
−80
−70
−60
−50
Spectral Analysis
Frequency [MHz]P
ower
Spe
ctru
m [d
Bm
/MH
z]
Horizontal HornVertical Horn50 ohm TerminatorThermal Noise Floor
0 60 120 180 240 300 360−120
−110
−100
−90
−80
−70
−60
−50
Angular Analysis
Angle [degree]
Ave
rage
Pow
er [d
Bm
/MH
z]
Horizontal HornVertical HornThermal Noise Floor
0.01 0.1 1 5 10 25 37 50−10
0
10
20
30
40
50
60
Statistical Analysis
Percentile exceeding ordinate
dB a
bove
(kT
0B+
NF
)
Horizontal HornVertical Horn50 ohm TerminatorThermal Noise Floor
Figure A.34. Spectrum Measurements at San Jose Airport (UNI-S)
98

9 12 15 18 21 24 27 30 33−120
−110
−100
−90
−80
−70
−60
−50
Temporal Analysis
Time [hour]
Ave
rage
Pow
er [d
Bm
/MH
z]
Horizontal HornVertical Horn50 ohm TerminatorThermal Noise Floor
2400 2420 2440 2460 2480−120
−110
−100
−90
−80
−70
−60
−50
Spectral Analysis
Frequency [MHz]P
ower
Spe
ctru
m [d
Bm
/MH
z]
Horizontal HornVertical Horn50 ohm TerminatorThermal Noise Floor
0 60 120 180 240 300 360−120
−110
−100
−90
−80
−70
−60
−50
Angular Analysis
Angle [degree]
Ave
rage
Pow
er [d
Bm
/MH
z]
Horizontal HornVertical HornThermal Noise Floor
0.01 0.1 1 5 10 25 37 50−10
0
10
20
30
40
50
60
Statistical Analysis
Percentile exceeding ordinate
dB a
bove
(kT
0B+
NF
)
Horizontal HornVertical Horn50 ohm TerminatorThermal Noise Floor
Figure A.35. Spectrum Measurements at San Jose Airport (ISM 2.4)
99
(This page was left intentionally blank)
100

Appendix A.6: Palo Alto Airport
Site Description
The Palo Alto Airport is a local municipal airport primarily used by general aviation aircraft. It is bordered by the San Francisco Bay and a public golf course. Table A.6 and Figures A.36 through A.39 depict the measurement site location and conditions. The LSSM was located at the corner of the parking area for the airplanes in close proximity to the runway. Major objects in close proximity to the LSSM were the pilot association building (8 m away, west, vacant during the measurement), the public golf course (10 m away, west), the arrays of airplanes (10 m away, east), and the air traffic control tower (30 m away, south east). Pedestrian traffic was very low all day. Weather was mostly sunny and windy. No WiFi activity was detected during the site survey.
Time Location Weather Distance to Building
Distance to
Pathway
WiFi Channel Address
Sept 4 0700 ~ Sept 4 2300
N37.46 W122.11
Sunny Windy 8 m 2 m N/A
1909 El Camino Rd. Palo Alto
CA 94303
Table A.6. Measurement Site Conditions (Palo Alto Airport)
Pilot Building
ControlTower
Publ
ic G
olf C
ours
e
Airplane Parking
Public Parking
LSSM
Figure A.36. Location of LSSM at Palo Alto Airport
101

Figure A.37. Photo of Spectrum Survey at Palo Alto Airport
Figure A.38. Aerial Map and Street Map to Palo Alto Airport (via www.globexplorer.com & www.mapquest.com)
102

7 9 11 13 15 17 19 21 230
5
10
15
20
25
30
35
40 Palo Alto Airport
Time [hour]
Tem
pera
ture
[o C]
Ambient TemperatureLNA Temperature
Figure C.39. Temperature Variation During Measurements at Palo Alto Airport
Data Observation
Band Comments
Temporal analysis
The average received power was between -112.9 ~ -112.1 dBm/MHz, below the thermal noise floor for all measurement time periods. The highest power, -112.1 dBm/MHz, was measured at 17:00.
Spectral analysis
The average received power was between -113.2 ~ -110.6 dBm/MHz, below the thermal noise floor for the most of the measurement frequencies. The highest power, -110.6 dBm/MHz, was measured at 1575.5 MHz, which is the GPS signal from the GPS satellites.
Angular analysis
The average received power was between -113.3 ~ -111.8 dBm/MHz, below the thermal noise floor for all measurement angles. The highest power, -111.8 dBm/MHz,
t association building. e building which is at
the t
was measured at 225 degrees, which is corresponding to the piloIt is because the antennas observed less of the sky and more of th
hermal equilibrium with the Earth.
GPS L1
(Fig A.40)
Statistical analysis
No man-made signal except the GPS signal was detected.
Temporal analysis
The average received power was between -112.6 ~ -111.8 dBm/MHz, below the thermal noise floor for all measurement time periods. The highest power, -111.8 dBm/MHz, was measured at 17:21.
UNI-S
(Fig A.41)
Spectral analysis
The average received power was between -113.1 ~ -111.3 dBm/MHz, below the thermal noise floor for the most of the measurement frequencies. The highest power, -111.3 dBm/MHz, was measured at 2035MHz.
103

Angular analysis
The average received power was between -113.2 ~ -111.5 dBm/MHz, below the thermal noise floor for all measurement angles. The highest power, -111.5 dBm/MHz, was measured at 210 degrees, which is corresponding to the pilot association building.
Statistical analysis
Man-made signals were present in less than 0.01 % of the measurement data with a maximum power of -102.1 dBm/MHz.
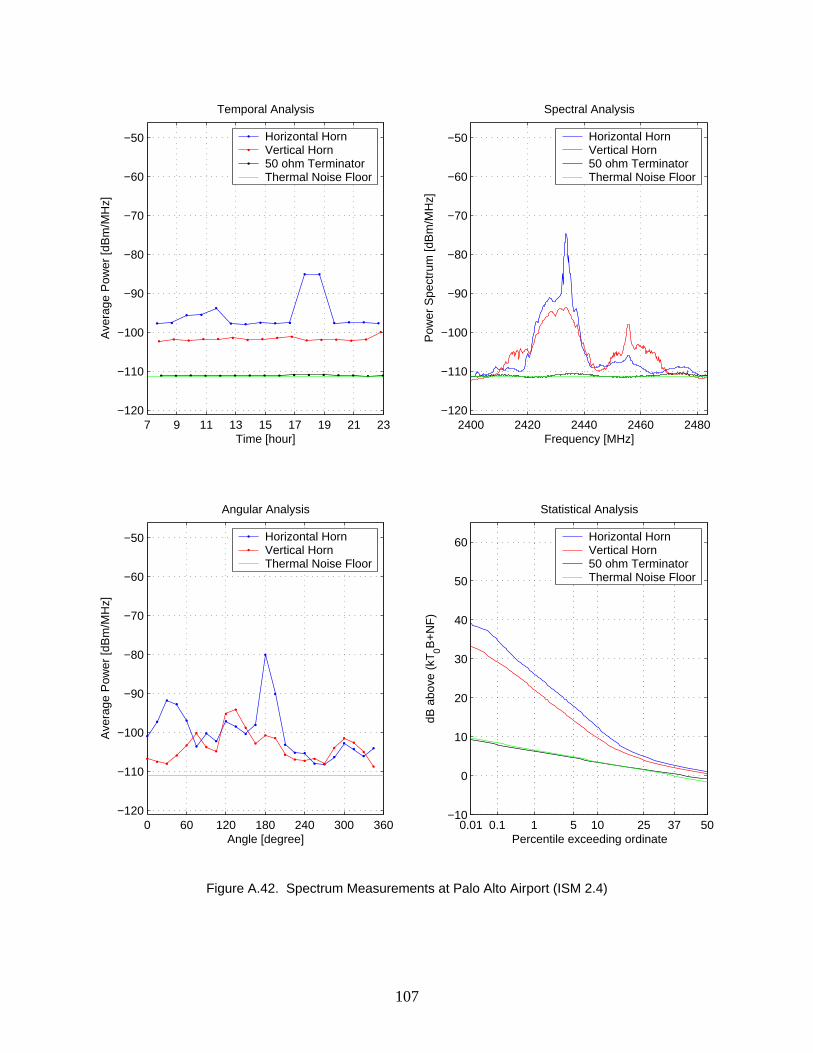
Temporal analysis
The average received power was variable and high, -102.3 ~ -85.1 dBm/MHz, above the thermal noise floor for all measurement time periods. The measurements by the horizontal horn antenna showed high variation, -98.0 ~ -85.1 dBm/MHz but those by the vertical horn antenna were mainly constant, -102.3 ~ -100.0 dBm/MHz. The highest power, -85.1 dBm/MHz, was measured at 17:40 and 18:40. Man-made signals were continuous in time and probably originated from multiple sources including WiFi transmitters in the surrounding urban area.
Spectral analysis
The average received power was variable and high, -112.4 ~ -74.6 dBm/MHz, above the thermal noise floor for the most of the measurement frequencies. The highest power, -74.6 dBm/MHz, was measured at 2433.6 MHz. Man-made signals were observed in the two separate frequency ranges. The relatively high power narrow band man-made signals with less than 10 MHz bandwidth were measured at 2434 MHz and 2456 MHz, and the wide band man-made signals with more than 10 MHz bandwidth were measured at 2420 ~ 2440 MHz and 2450 ~ 2470 MHz. The wide band man-made signals probably originated from WiFi transmitters.
Angular analysis
The average received power was variable and high, -108.8 ~ -80.1 dBm/MHz, above the thermal noise floor for all rement angles. The highest power, -80.1
ings over the public parking lot. Man-made signals probably originated from WiFi transmitters in the surrounding Palo Alto city area. Relatively low power was measured at 200 ~ 300 degrees because the pilot building blocked and attenuated the man-made signals. Man-made signals were rather angle.
measudBm/MHz, was measured at 180 degrees corresponding to the airport build
continuous in
ISM 2.4
(Fig A.42)
nt Statistical analysis
Man-made signals were prevalent. They were present 13.68 % of the measuremedata with a maximum power of -71.9 dBm/MHz.
104

7 9 11 13 15 17 19 21 23−120
−110
−100
−90
−80
−70
−60
−50
Temp
Ti
Ave
rage
Pow
er [d
Bm
/MH
z]oral Analysis
me [hour]
Horizontal HornVertical HornGPS Antenna50 ohm TerminatorThermal Noise Floor
1565 1570 1575 1580 1585−120
−110
−100
−90
−80
−70
−60
−50
Spectral Analysis
Frequency [MHz]P
ower
Spe
ctru
m [d
Bm
/MH
z]
Horizontal HornVertical HornGPS Antenna50 ohm TerminatorThermal Noise Floor
0 60 120 180 240 300 360−120
−110
−100
−90
−80
−70
−60
−50
Ang
Angle [degree]
Ave
rage
Pow
er [d
Bm
/MH
z]
ular Analysis
Horizontal HornVertical HornThermal Noise Floor
0.01 0.1 1 5 10 25 37 50−10
0
10
20
30
40
50
60
Statistical Analysis
Percentile exceeding ordinate
dB a
bove
(kT
0B+
NF
)
Horizontal HornVertical Horn
50 ohm TerminatorThermal Noise Floor
GPS Antenna
Figure A.40. Spectrum Measurements at Palo Alto Airport (GPS L1)
105

7 9 11 13 15 17 19 21 23−120
−110
−100
−90
−80
−70
−60
−50
Temporal Analysis
Time [hour]
Ave
rage
Pow
er [d
Bm
/MH
z]
Horizontal HornVertical Horn50 ohm TerminatorThermal Noise Floor
2040 2060 2080 2100−120
−110
−100
−90
−80
−70
−60
−50
Spectral Analysis
Frequency [MHz]P
ower
Spe
ctru
m [d
Bm
/MH
z]
Horizontal HornVertical Horn50 ohm TerminatorThermal Noise Floor
0 60 120 180 240 300 360−120
−110
−100
−90
−80
−70
−60
−50
Angular Analysis
Angle [degree]
Ave
rage
Pow
er [d
Bm
/MH
z]
Horizontal HornVertical HornThermal Noise Floor
0.01 0.1 1 5 10 25 37 50−10
0
10
20
30
40
50
60
Statistical Analysis
Percentile exceeding ordinate
dB a
bove
(kT
0B+
NF
)
Horizontal HornVertical Horn50 ohm TerminatorThermal Noise Floor
Figure A.41. Spectrum Measurements at Palo Alto Airport (UNI-S)
106
7 9 11 13 15 17 19 21 23−120
−110
−100
−90
−80
−70
−60
−50
Temporal Analysis
Time [hour]
Ave
rage
Pow
er [d
Bm
/MH
z]
Horizontal HornVertical Horn50 ohm TerminatorThermal Noise Floor
2400 2420 2440 2460 2480−120
−110
−100
−90
−80
−70
−60
−50
Spectral Analysis
Frequency [MHz]P
ower
Spe
ctru
m [d
Bm
/MH
z]
Horizontal HornVertical Horn50 ohm TerminatorThermal Noise Floor
0 60 120 180 240 300 360−120
−110
−100
−90
−80
−70
−60
−50
Angular Analysis
Angle [degree]
Ave
rage
Pow
er [d
Bm
/MH
z]
Horizontal HornVertical HornThermal Noise Floor
0.01 0.1 1 5 10 25 37 50−10
0
10
20
30
40
50
60
Statistical Analysis
Percentile exceeding ordinate
dB a
bove
(kT
0B+
NF
)
Horizontal HornVertical Horn50 ohm TerminatorThermal Noise Floor
Figure A.42. Spectrum Measurements at Palo Alto Airport (ISM 2.4)
107

(This page was left intentionally blank)
108

Appendix A.7: Port of Oakland
Site Description
The Port of Oakland is an international cargo ation and distribution hub located on the mainland shore of San Francisco Bay and to the east of the Oakland downtown and to the west of the San Francisco downtown. There are 4.9 km2 of marine terminals, intermodal rail facility, maritime support area, 20 deepwater berths, and 35 container cranes. Table A.1 and Figures A.43 through A.46 depict the measurement site location and conditions. The LSSM was located at the Middle Harbor Shoreline Park between the terminals. Major objects in close proximity to the LSSM were the terminal 30 (north), the terminal 55 (east) and a park facility building (20 m away, east). Pedestrian traffic was very low for all day. Weather was mostly cloudy and windy. No Wi i activity was detected during the site survey.
Time Location Weather Distance to Build g
Distance to
Pathway WiFi Channel Address
transport
F
in
Oct 30 0800 ~ Oct 30 2300
N37.80 W122.33
Cloudy Windy 20 m 2 m N/A
2777 Middle Harbor Rd. Oakland CA
94607
ment Site Conditions (Port of OaklaTable A.7. Measure nd)
ParkFacility
Port of OaklandTerminal 55
LSSM
Middle HarborShoreline Park
San FranciscoBay
Port of OaklandTerminal 30
Figure A.43. Location of LSSM at Port of Oakland
109

A.44 of Sp Survey at Port of Oakland
Figure . Photo ectrum
Figure A.45. Aerial Map and Street Map to Port of Oakland
(via www.globexplorer.com & www.mapquest.com)
110
8 11 14 17 20 230
5
10
15
20
25
30
35
40 Port of Oakland
Tem
pera
ture
[o C]
Time [hour]
Ambient TemperatureLNA Temperature
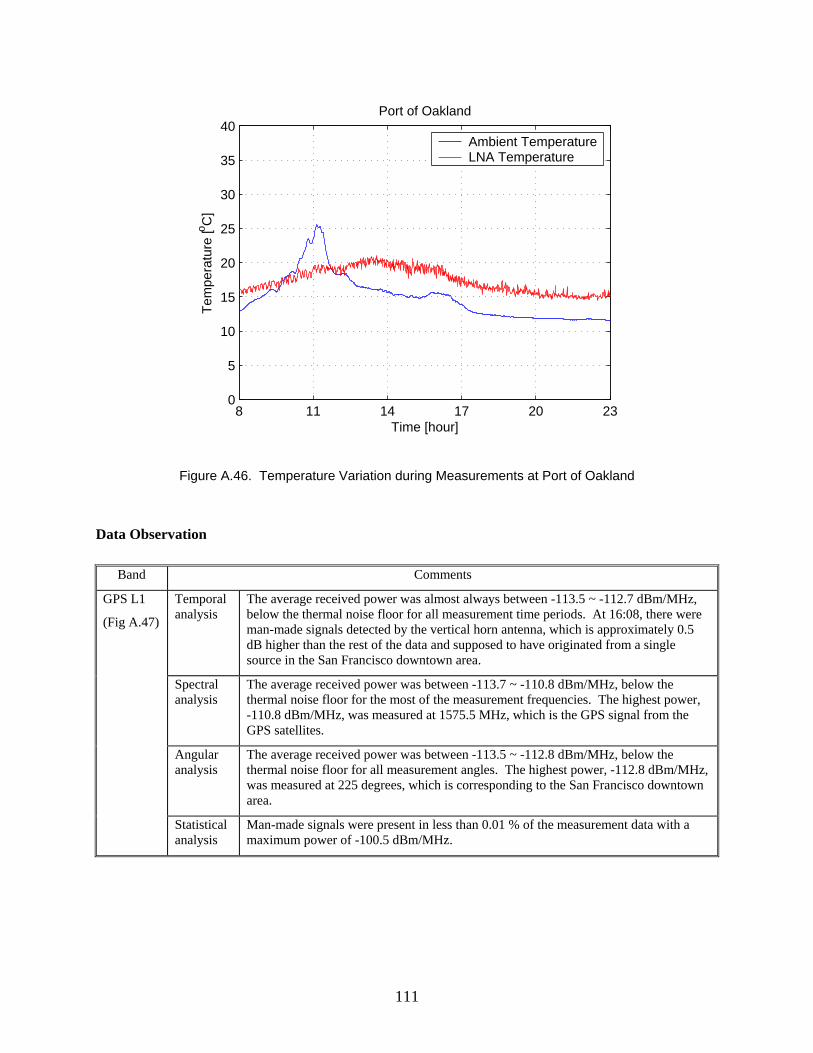
Figure A.46. Temperature Variation during Measurements at Port of Oakland
Data Observation
Band Comments
Temporal analysis
The average received power was almost always between -113.5 ~ -112.7 dBm/MHz, below the thermal noise floor for all measurement time periods. At 16:08, there were man-made signals detected by the vertical horn antenna, which is approximately 0.5 dB higher than the rest of the data and supposed to have originated from a single source in the San Francisco downtown area.
Spectral analysis
The average received power was between -113.7 ~ -110.8 dBm/MHz, below the thermal noise floor for the most of the measurement frequencies. The highest power, -110.8 dBm/MHz, was measured at 1575.5 MHz, which is the GPS signal from the GPS satellites.
Angular analysis
The average received power was between -113.5 ~ -112.8 dBm/MHz, below the thermal noise floor for all me ent angles. The highest power, -112.8 dBm/MHz, was measured at 225 degrees, hich is corresponding to the San Francisco downtown
asurem w
area.
GPS L1
(Fig A.47)
Statistical analysis
Man measurement data with a maximum power of -100.5 dBm/MHz.
-made signals were present in less than 0.01 % of the
111

Temporal analysis
The average received power was -113.0 ~ -91.5 dBm/MHz, above the thermal noise floor for the most of the measurement time periods. During the daytime, it was relatively quiet but it increased sharply after 19:00. The highest power, -91.5 dBm/MHz, was measured at 10:30. Man-made signals were continuous in time, except one quiet moment at 16:00, which probably originated from multiple sources in the San Francisco Downtown area.
Spectral analysis
The average received power was variable and high, -113.7 ~ -82.5 dBm/MHz and above the thermal noise floor in approximately 50 % of the frequencies. The highest power, -62.8 dBm/MHz, was measured at 2051.4 MHz. Man-made signals were discontinuous in frequency, and approximately 50 % of the frequencies were quiet. The relatively narrow band man-made signals with less than 10 MHz bandwidth were measured at 2034, 2040, 2068 and 2101 MHz, and the wide band man-made signals with more than 10 MHz bandwidth were measured at 2051 and 2084 MHz.
Angular analysis
The average received power was variable and high, -111.7 ~ -91.1 dBm/MHz, and above the thermal noise floor in approximately 50 % of the angles. The highest power, -91.1 dBm/MHz, was measured at 240 degrees which is corresponding to the San Francisco downtown area. Man-made signals were continuous in the angle between 150 and 300 degrees.
UNI-S
(Fig A.48)
Statistical analysis
Man-made signals were clearly indicated. They were present 2.77 % of the measurement data with a maximum power of -76.7 dBm/MHz.
Temporal analysis
The average received power was variable and high, -95.6 ~ -72.7 dBm/MHz, above the thermal noise floor for all measurement time periods. The highest power, -72.7
time and probably originated from multiple sources, including WiFi transmitters especially in the San Francisco downtown area.
dBm/MHz, was measured at 16:48. Man-made signals were continuous in
Spectral analysis
The average received power was variable and high, -109.2 ~ -70.3 dBm/MHz, above the thermal noise floor for all measurement frequencies. The highest power, -70.3 dBm/MHz, was measured at 2426 Man-made signals were continuous in frequency. The relatively high band man-made signals with more than 10
.5 MHz. power wide
MHz bandwidth were measured at 2410 ~ 2430 MHz and 2450 ~ 2465 MHz.
Angular analysis
tinuous in angle.
The average received power was variable and high, -102.6 ~ -68.6 dBm/MHz, above the thermal noise floor for all measurement angles. The highest power, -68.6 dBm/MHz, was measured at 270 degrees corresponding to the San Francisco downtown area. Man-made signals were con
ISM 2.4
(Fig A.49)
l Statisticaanalysis
Man-made signals were prevalent. They were present 43.30 % of the measurement data with a maximum power of -49.9 dBm/MHz.
112

8 11 14 17 20 23−120
−110
−100
−90
−80
−70
−60
−50
Temp
Ti
Ave
rage
Pow
er [d
Bm
/MH
z]oral Analysis
me [hour]
Horizontal HornVertical HornGPS Antenna50 ohm TerminatorThermal Noise Floor
1565 1570 1575 1580 1585
−90
−120
−110
−100
−80
−70
−60
−50
Spectral Analysis
Frequency [MHz]P
ower
Spe
ctru
m [d
Bm
/MH
z]
Horizontal HornVertical HornGPS Antenna50 ohm TerminatorThermal Noise Floor
0 60 120 180 240 300 360−120
−110
−100
−90
−80
−70
−60
−50
Ang
Angle [degree]
Ave
rage
Pow
er [d
Bm
/MH
z]
ular Analysis
Horizontal HornVertical HornThermal Noise Floor
0.01 0.1 1 5 10 25 37 50−10
0
10
20
30
40
50
60
Statistical Analysis
Percentile exceeding ordinate
dB a
bove
(kT
0B+
NF
)
Horizontal HorVertical Horn
n
GPS Antenna50 ohm TerminatorThermal Noise Floor
Figure A.47. Spectrum Measurements at Port of Oakland (GPS L1)
113

8 11 14 17 20 23−120
−110
−100
−90
−80
−70
−60
−50
Temporal Analysis
Time [hour]
Ave
rage
Pow
er [d
Bm
/MH
z]
Horizontal HornVertical Horn50 ohm TerminatorThermal Noise Floor
2040 2060 2080 2100−120
−110
−100
−90
−80
−70
−60
−50
Spectral Analysis
Frequency [MHz]P
ower
Spe
ctru
m [d
Bm
/MH
z]
Horizontal HornVertical Horn50 ohm TerminatorThermal Noise Floor
0 60 120 180 240 300 360−120
−110
−100
−90
−80
−70
−60
−50
Angular Analysis
Angle [degree]
Ave
rage
Pow
er [d
Bm
/MH
z]
Horizontal HornVertical HornThermal Noise Floor
0.01 0.1 1 5 10 25 37 50−10
0
10
20
30
40
50
60
Statistical Analysis
Percentile exceeding ordinate
dB a
bove
(kT
0B+
NF
)
Horizontal HornVertical Horn50 ohm TerminatorThermal Noise Floor
Figure A.48. Spectrum Measurements at Port of Oakland (UNI-S)
114

8 11 14 17 20 23−120
−110
−100
−90
−80
−70
−60
−50
Temporal Analysis
Time [hour]
Ave
rage
Pow
er [d
Bm
/MH
z]
Horizontal HornVertical Horn50 ohm TerminatorThermal Noise Floor
2400 2420 2440 2460 2480−120
−110
−100
−90
−80
−70
−60
−50
Spectral Analysis
Frequency [MHz]P
ower
Spe
ctru
m [d
Bm
/MH
z]
Horizontal HornVertical Horn50 ohm TerminatorThermal Noise Floor
0 60 120 180 240 300 360−120
−110
−100
−90
−80
−70
−60
−50
Angular Analysis
Angle [degree]
Ave
rage
Pow
er [d
Bm
/MH
z]
Horizontal HornVertical HornThermal Noise Floor
0.01 0.1 1 5 10 25 37 50−10
0
10
20
30
40
50
60
Statistical Analysis
Percentile exceeding ordinate
dB a
bove
(kT
0B+
NF
)
Horizontal HornVertical Horn50 ohm TerminatorThermal Noise Floor
Figure A.49. Spectrum Measurements at Port of Oakland (ISM 2.4)
115

(This page was left intentionally blank)
116

Appendix A.8: Coyote Point Marina
Site Description
The Coyote Point Marina is a recreational ha Coyote Point Recreation Area. It faces the San Francisco Bay and is bordered by a public golf course. Table A.8 and Figures A.50 through A.53 depict the measurement site location and conditions. The LSSM was located at the corner of the harbor area overlooking the array of the Major objects in close proximity to the LSSM were the single story yacht club house (10 away, north), the array of boats (50 m away, east), the harbor facility buildings (100 m away, south), and the hill (50 m away, west). The distance to the pathway was 1 m but the pedestrian traffic was v low for all day. Weather was sunny and windy with occasional clouds. WiFi activity (channel number = 2, SNR = 48) was detected during the site survey.
Time Location Weather Distanto Build g
Distance to
Pathway
WiFi Channel Address
rbor located within the
docked boats.m
ery
ce in
Aug 28 0700 ~ Aug 28 2300
N37.59 W122.32
Sunny Windy 10 m 1 m Channel 2
SNR = 48
1966 Coyote Point Drive San Mateo CA 94401
Table A.8. Measurement Site Conditions (Coyote Point Marina)
YachtClub
Hill BoatParking
LSSM
HarborFacilityBuilding
PublicParking
San FranciscoBay
Figure A.50. Location of LSSM at Coyote Point Marina
117

Figure A.51. Photo of Spectrum Survey at Coyote Point Marina
Figure A.52. Aerial Map and Street Map to Coyote Point Marina (via www. globexplorer. com & www. mapquest. com)
118

7 9 11 13 15 17 19 21 230
5
10
15
20
25
30
35
40 Coyote Point Marina
Tem
pera
ture
[o C]
Time [hour]
Ambient TemperatureLNA Temperature
Figure A.53. Temperature Variation During Measurements at Coyote Point Marina
Data Observation
Band Comments
Temporal analysis
The average received power was between -112.5 ~ -111.7 dBm/MHz, below the thermal noise floor for all measurement time periods. The highest power, -111.7 dBm/MHz, was measured at 17:00.
Spectral analysis
The average received power was between -113.0 ~ -110.4 dBm/MHz, below the thermal noise floor for the most of the measurement frequencies. The highest power, -110.4 dBm/MHz, was measured at 1575.5 MHz, which is the GPS signal from the GPS satellites.
Angular analysis
The average received power was between -112.7 ~ -111.3 dBm/MHz, below the thermal noise floor for all measurement angles. The highest power, -111.3 dBm/MHz, was measured at 255 degrees, which corresponds to the hill. This is because the antennas observed less of the sky, and more of the hill whose temperature is higher than the sky temperature.
GPS L1
(Fig A.54)
Statistical analysis
No man-made signal except the GPS signal was detected.
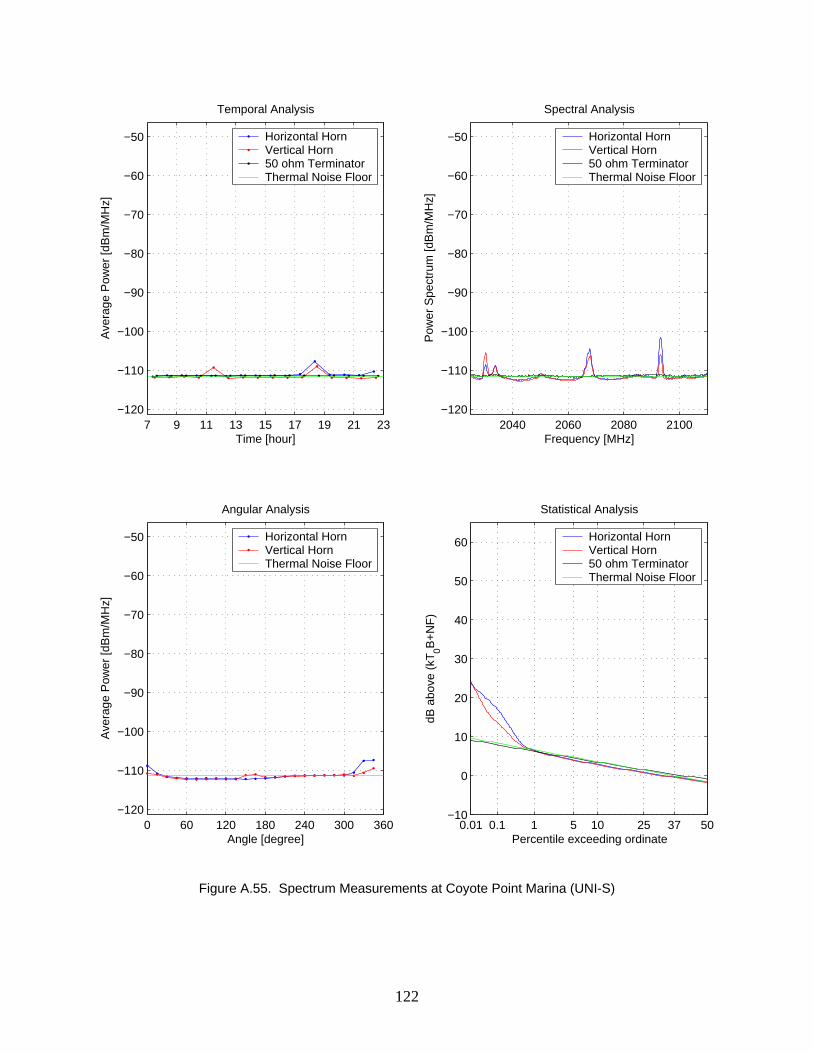
UNI-S
(Fig A.55)
Temporal analysis
The average received power was between -112.1 ~ -107.7 dBm/MHz, at the thermal noise floor for all measurement time periods. The highest power, -107.7 dBm/MHz, was measured at 18:20. Man-made signals were observed only in 11, 18 and 22 hours and probably originated from a single source with the multiple frequencies in the yacht club house.
119

Spectral analysis
The average received power was between -112.9 and -101.7 dBm/MHz, at the thermal noise floor for all measurement frequencies. The highest power, -101.7 dBm/MHz, was measured at 2093.2 MHz. Man-made signals were observed only in 2030 MHz, 2068 MHz, and 2093 MHz.
Angular analysis
The average received power was between -112.4 and -107.4 dBm/MHz, at the thermal noise floor for all measurement frequencies. The highest power, -107.4 dBm/MHz, was measured at 345 degrees corresponding to the yacht club house. Man-made signals were observed only in 150 ~ 165 degrees corresponding to the parked boats where numerous electronic equipments are installed,, as well as at an angle corresponding to the yacht club house.
Statistical analysis
Man-made signals were clearly indicated. They were present 0.40 % of the measurement data with a maximum power of -87.2 dBm/MHz.
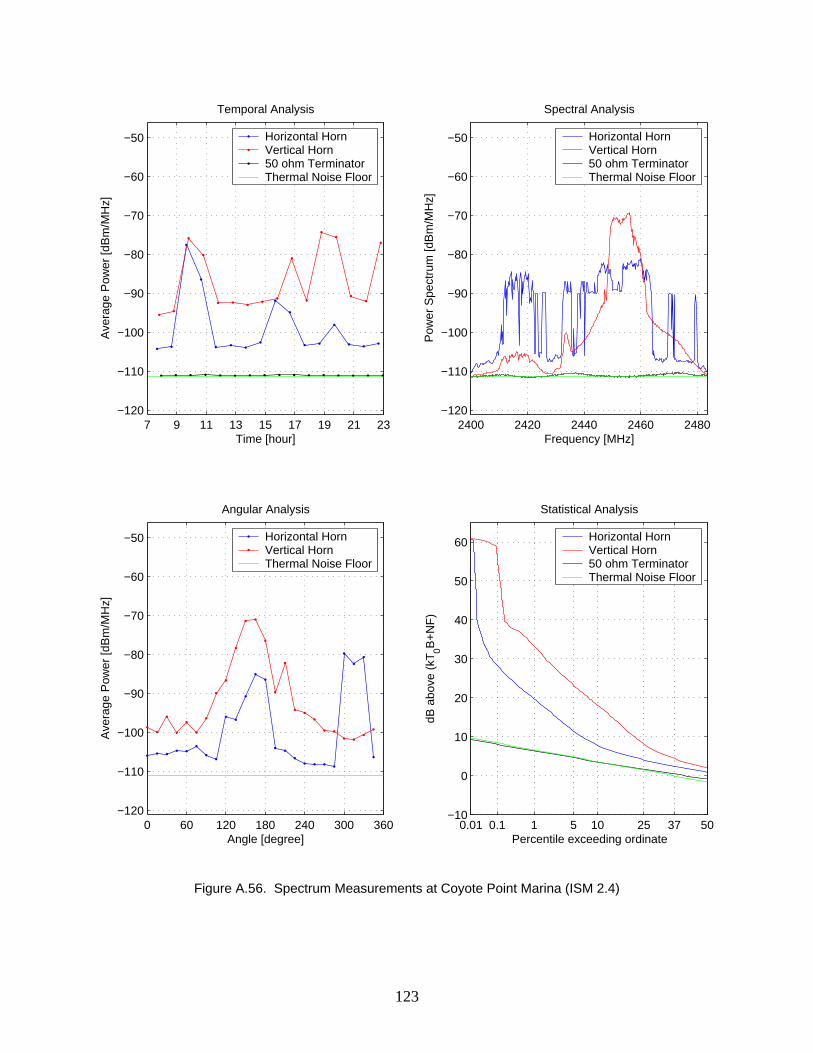
Temporal analysis
The average received power was variable and high, -104.3 ~ -74.3 dBm/MHz, above the thermal noise floor for all measurement time periods. The highest power, -74.3 dBm/MHz, was measured at 18:40. Man-made signals were continuous in time and probably originated from the WiFi hub detected during the site survey and the multiple sources in the yacht club house and the parked boats.
Spectral analysis
The average received power was variable and high, -111.8 ~ -69.2 dBm/MHz, above the thermal noise floor for all measurement frequencies. The highest power, -69.2 dBm/MHz, was measured at 2456.2 MHz. Man-made signals were continuous in frequency. The relatively high power wide band man-made signals with more than 10 MHz bandwidth were measured at 2410 ~ 2425 MHz and 2450 ~ 2465 MHz.
Angular analysis
The average received power was variable and high, -108.8 ~ -71.0 dBm/MHz, above the thermal noise floor for all measurement angles. The highest power, -71.0 dBm/MHz, was measured at 165 degrees corresponding to the harbor facility building. Man-made signals were continuous in angle. Relatively high power was monitored in 120 ~ 180 degrees corresponding to the parked boats and 300 ~ 330 corresponding to the yacht club house.
ISM 2.4
(Fig A.56)
Statistical analysis
Man-made signals were prevalent. They were present 22.31 % of the measurement data with a maximum power of -50.2 dBm/MHz.
120

7 9 11 13 15 17 19 21 23−120
−110
−100
−90
−80
−70
−60
−50
Temporal Analysis
Time [hour]
Ave
rage
Pow
er [d
Bm
/MH
z]Horizontal HornVertical HornGPS Antenna50 ohm TerminatorThermal Noise Floor
1565 1570 1575 1580 1585−120
−110
−100
−90
−80
−70
−60
−50
Spectral Analysis
Frequency [MHz]P
ower
Spe
ctru
m [d
Bm
/MH
z]
Horizontal HornVertical HornGPS Antenna50 ohm TerminatorThermal Noise Floor
0 60 120 180 240 300 360−120
−110
−100
−90
−80
−70
−60
−50
Angular Analysis
Ave
rage
Pow
er [d
Bm
/MH
z]
Horizontal HornVertical HornThermal Noise Floor
0.01 0.1 1 5 10 25 37 50Angle [degree]
−10
0
10
20
30
40
50
60
Statistical Analysis
B+
NF
)
Percentile exceeding ordinate
dB a
bove
(kT
0
Horizontal HornVertical HornGPS Antenna50 ohm Terminator
FloorThermal Noise
Figure A
.54. Spectrum Measurements at Coyote Point Marina (GPS L1)
121
7 9 11 13 15 17 19 21 23−120
−110
−100
−90
−80
−70
−60
−50
Temp
Ti
Ave
rage
Pow
er [d
Bm
/MH
z]oral Analysis
me [hour]
Horizontal HornVertical Horn50 ohm TerminatorThermal Noise Floor
2040 2060 2080 2100−120
−110
−100
−90
−80
−70
−60
−50
Spectral Analysis
Frequency [MHz]P
ower
Spe
ctru
m [d
Bm
/MH
z]
Horizontal HornVertical Horn50 ohm TerminatorThermal Noise Floor
0 60 120 180 240 300 360−120
−110
−100
−90
−80
−70
−60
−50
Ang
Angle [degree]
Ave
rage
Pow
er [d
Bm
/MH
z]
ular Analysis
Horizontal HornVertical HornThermal Noise Floor
0.01 0.1 1 5 10 25 37 50−10
0
10
20
30
40
50
60
Statistical Analysis
Percentile exceeding ordinate
dB a
bove
(kT
0B+
NF
)
Horizontal HornVertical Horn50 ohm TerminatorThermal Noise Floor
Figure A.55. Spectrum Measurements at Coyote Point Marina (UNI-S)
122
7 9 11 13 15 17 19 21 23−120
−110
−100
−90
−80
−70
−60
−50
Temporal Analysis
Time [hour]
Ave
rage
Pow
er [d
Bm
/MH
z]
Horizontal HornVertical Horn50 ohm TerminatorThermal Noise Floor
2400 2420 2440 2460 2480−120
−110
−100
−90
−80
−70
−60
−50
Spectral Analysis
Frequency [MHz]P
ower
Spe
ctru
m [d
Bm
/MH
z]
Horizontal HornVertical Horn50 ohm TerminatorThermal Noise Floor
0 60 120 180 240 300 360−120
−110
−100
−90
−80
−70
−60
−50
Angular Analysis
Angle [degree]
Ave
rage
Pow
er [d
Bm
/MH
z]
Horizontal HornVertical HornThermal Noise Floor
0.01 0.1 1 5 10 25 37 50−10
0
10
20
30
40
50
60
Statistical Analysis
Percentile exceeding ordinate
dB a
bove
(kT
0B+
NF
)
Horizontal HornVertical Horn50 ohm TerminatorThermal Noise Floor
Figure A.56. Spectrum Measurements at Coyote Point Marina (ISM 2.4)
123

(This page was left intentionally blank)
124

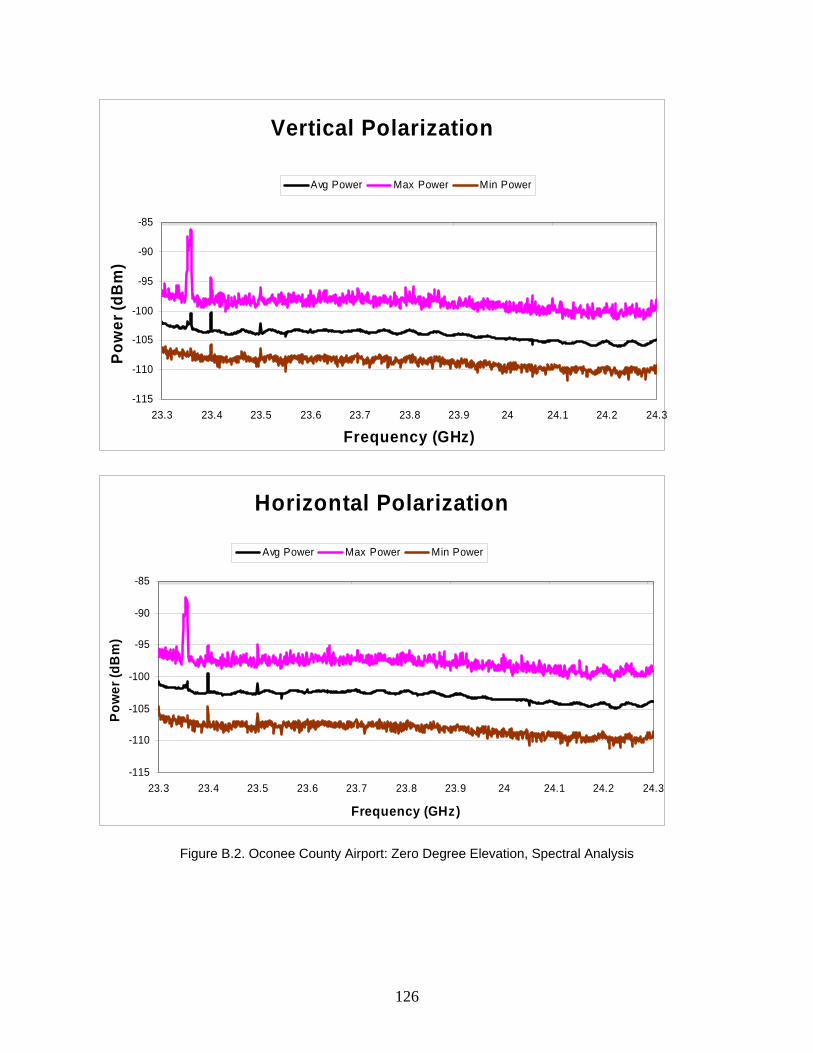
Appendix B: Passive Sensor Band Survey Measurement Data Appendix B.1: Oconee County Airport, Clemson, South Carolina (Site 1) Date: 9/12/03 Map of Location: See Figure B.1 Noteworthy Results:
• Spectral trends: In general, uniform in frequency; spectral peaks at 23.41, 23.43, 23.35, 23.69, 23.85, 24.03, 24.07, 24.02, and 24.12 GHz mainly in the direction of an antenna bed between 1 and 2 p.m. at power levels ranging from 8 to 15 dB above the measured noise floor (Figures B.2, B.6, B.10, B.12, B.13, and B.16).
• Angular trends: Between 8:30 and 9:30 p.m., angular peaks occurred in the general direction of bodies of water (Figures B.3, B.7, and B.11). See map on figure B.1.
• Temporal trends: Lower power levels in the morning hours, temporal peaks occurred between 3 and 5 p.m. (Figures B.4, B.8, B.14, and B.17).
• An anomalous feature of resonances at 23.36, 23.40, and 23.50 GHz appear in this data set. • Pre-measurement calibrated gain: 47.2 dB; Post-measurement calibrated gain: 46.4 dB. • Figures B.5, B.9, B.15, and B.18 depict a statistical analysis.
Figure B.1. Map of Oconee County Airport (Left) and Lake Hartwell Dike (Right) Measurement Sites
125
Vertical Polarization
-115
-110
-105
-100
-95
-90
-85
23.3 23.4 23.5 23.6 23.7 23.8 23.9 24 24.1 24.2 24.3
Frequency (GHz)
Pow
er (d
Bm
)
Avg Power Max Power Min Power
Horizontal Polarization
-115
-110
-105
-100
-95
-90
-85
23.3 23.4 23.5 23.6 23.7 23.8 23.9 24 24.1 24.2 24.3
Frequency (GHz)
Pow
er (d
Bm
)
Avg Power Max Power Min Power
Figure B.2. Oconee County Airport: Zero Degree Elevation, Spectral Analysis
126

Angular Analysis- Vertical Polarization-Zero Degree Elevation
-110
-108
-106
-104
-102
-100
0 15 30 45 60 75 90 105 120 135 150 165 180 195 210 225 240 255 270 285 300 315 330 345
Angle ( Degrees)
Pow
er (d
Bm)
Avg Power at 07:00 Hours Avg Power at 9:40 Hours Avg Power at 12:18 HoursAvg Power at 15:00 Hours Avg Power at 17:47 Hours Avg Power at 20:06 Hours
Angular Analysis- Horizontal Polarization-Zero Degree Elevation
-110
-108
-106
-104
-102
-100
0 15 30 45 60 75 90 105 120 135 150 165 180 195 210 225 240 255 270 285 300 315 330 345
Angle ( Degrees)
Pow
er (d
Bm)
Avg Power at 08:18 Hours Avg Power at 11:02 Hours Avg Power at 13:35 HoursAvg Power at 16:21 Hours Avg Power at 21:50 Hours
Figure B.3. Oconee County Airport: Zero Degree Elevation, Angular Analysis
127

Temporal Analysis-Vertical Polarization- Zero Degree Elevation
-115
-110
-105
-100
-95
-90
-85
7 9.75 12.25 15 17.75 20
Time (Hours)
Pow
er (d
Bm
)
Avg Power Max Power Min Power
Temporal Analysis-Horizontal Polarization- Zero Degree Elevation
-115
-110
-105
-100
-95
-90
-85
8.25 11 13.5 16.25 22
Time (Hours)
Pow
er (d
Bm
)
Avg Power Max Power Min Power
Figure B.4. Oconee County Airport: Zero Degree Elevation, Temporal Analysis
128

Statistical Analysis- Zero Degree Elevation
-15
-10
-5
0
5
10
15
20
0.01 0.1 1 10 100
Percentile exceeding ordinate
dB a
bove
mea
n
Measured APD Theoretical APD
Figure B.5. Oconee County Airport: Zero Degree Elevation, Statistical Analysis
129

Spectral Analysis-Vertical Polarization-Thirty Degree Elevation
-112
-107
-102
-97
-92
23.3 23.4 23.5 23.6 23.7 23.8 23.9 24 24.1 24.2 24.3
Frequency (GHz)
Pow
er (d
Bm
)
Avg Power Max Power Min Power
Spectral Analysis-Horizontal Polarization-Thirty Degree Elevation
-112
-107
-102
-97
-92
23.3 23.4 23.5 23.6 23.7 23.8 23.9 24 24.1 24.2 24.3
Frequency (GHz)
Pow
er (d
Bm
)
Avg Power Max Power Min Power
Figure B.6. Oconee County Airport: Thirty Degree Elevation, Spectral Analysis
130
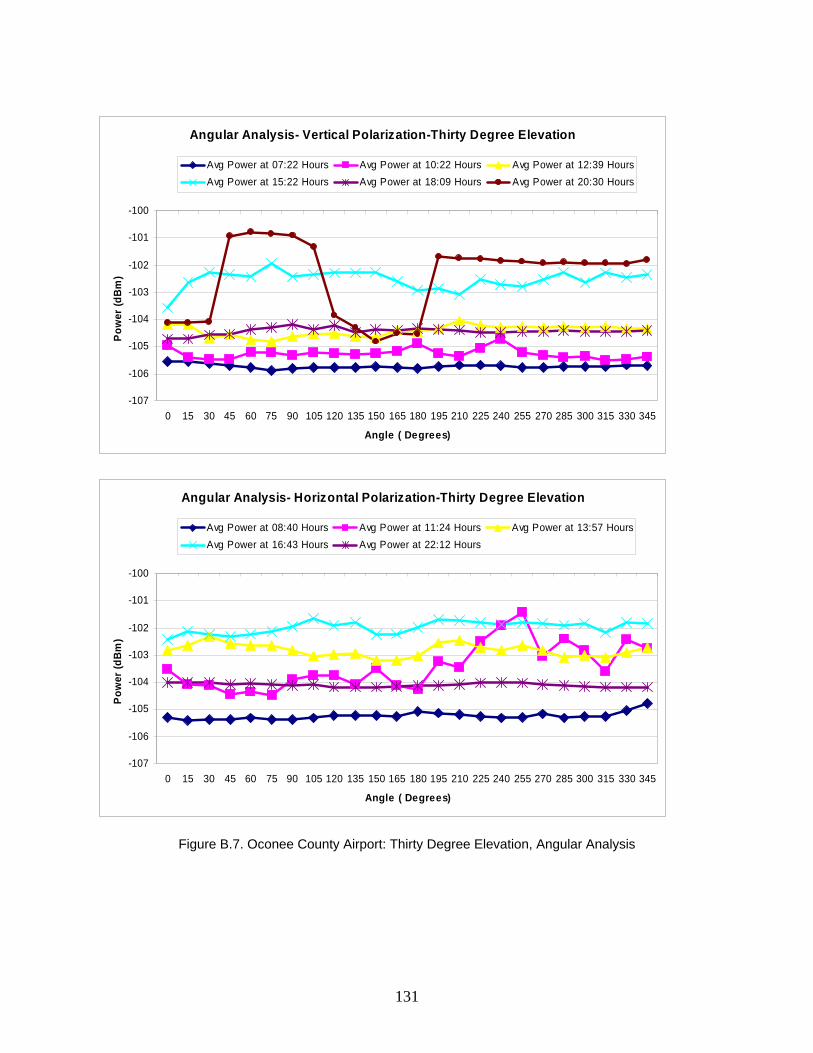
Angular Analysis- Vertical Polarization-Thirty Degree Elevation
-107
-106
-105
-104
-103
-102
-101
-100
0 15 30 45 60 75 90 105 120 135 150 165 180 195 210 225 240 255 270 285 300 315 330 345
Angle ( Degrees)
Pow
er (d
Bm)
Avg Power at 07:22 Hours Avg Power at 10:22 Hours Avg Power at 12:39 HoursAvg Power at 15:22 Hours Avg Power at 18:09 Hours Avg Power at 20:30 Hours
Angular Analysis- Horizontal Polarization-Thirty Degree Elevation
-107
-106
-105
-104
-103
-102
-101
-100
0 15 30 45 60 75 90 105 120 135 150 165 180 195 210 225 240 255 270 285 300 315 330 345
Angle ( Degrees)
Pow
er (d
Bm)
Avg Power at 08:40 Hours Avg Power at 11:24 Hours Avg Power at 13:57 HoursAvg Power at 16:43 Hours Avg Power at 22:12 Hours
Figure B.7. Oconee County Airport: Thirty Degree Elevation, Angular Analysis
131

Temporal Analysis-Vertical Polarization- Thirty Degree Elevation
-115
-110
-105
-100
-95
-90
7.5 10 12.75 15.5 18 20.5
Time (Hours)
Pow
er (d
Bm
)
Avg Power Max Power Min Power
Temporal Analysis-Horizontal Polarization- Thirty Degree Elevation
-115
-110
-105
-100
-95
-90
8.75 11.5 14 16.75 22.25
Time (Hours)
Pow
er (d
Bm
)
Avg Power Max Power Min Power
Figure B.8. Oconee County Airport: Thirty Degree Elevation, Temporal Analysis
132

Statistical Analysis- Thirty Degree Elevation
-15
-10
-5
0
5
10
15
0.01 0.1 1 10 100
Percentile Exceeding Ordinate
dB a
bove
mea
n
Measured APD Theoretical APD
Figure B.9. Oconee County Airport: Thirty Degree Elevation, Statistical Analysis
133

Vertical Polarization
-115
-110
-105
-100
-95
-90
23.3 23.4 23.5 23.6 23.7 23.8 23.9 24 24.1 24.2 24.3
Frequency (GHz)
Pow
er (d
Bm
)
Avg Power Max Power Min Power
Horizontal Polarization
-115
-110
-105
-100
-95
-90
23.3 23.4 23.5 23.6 23.7 23.8 23.9 24 24.1 24.2 24.3
Frequency (GHz)
Pow
er (d
Bm
)
Avg Power Max Power Min Power
Figure B.10. Oconee County Airport: Sixty Degree Elevation, Spectral Analysis
134

Angular Analysis- Vertical Polarization-Sixty Degree Elevation
-106
-105
-104
-103
-102
-101
0 15 30 45 60 75 90 105 120 135 150 165 180 195 210 225 240 255 270 285 300 315 330 345
Angle ( Degrees)
Pow
er (d
Bm
)
Avg Power at 07:44 Hours Avg Power at 10:24 Hours Avg Power at 13:01 HoursAvg Power at 15:44 Hours Avg Power at 18:31 Hours Avg Power at 20:59 Hours
Angular Analysis- Horizontal Polarization-Sixty Degree Elevation
-106
-105
-104
-103
-102
-101
0 15 30 45 60 75 90 105 120 135 150 165 180 195 210 225 240 255 270 285 300 315 330 345
Angle ( Degrees)
Pow
er (d
Bm)
Avg Power at 09:02 Hours Avg Power at 11:46 HoursAvg Power at 14:18 Hours Avg Power at 22:34 Hours
Figure B.11. Oconee County Airport: Sixty Degree Elevation, Angular Analysis
135

Angular Analysis of Peaks at 23.689 and 23.852 GHz
-106-104-102-100
-98-96-94-92-90-88
0 15 30 45 60 75 90 105
120
135
150
165
180
195
210
225
240
255
270
285
300
315
330
345
Angle (degrees)
Pow
er (d
Bm
)
Max Power of Peak at 23.689 GHz Max Power of Peak at 23.852 GHz
Angular Analysis of Peaks at 23.691,24.024 and 24.066 GHz
-106-104-102-100
-98-96-94-92-90-88
0 15 30 45 60 75 90 105
120
135
150
165
180
195
210
225
240
255
270
285
300
315
330
345
Angle (Degrees)
Pow
er (d
Bm
)
Max Power of Peak at 23.691 GHz Max Power of Peak at 24.024 GHzMax Power of Peak at 24.066 GHz
Figure B.12. Oconee County Airport: Sixty Degree Elevation, Angular Analysis
136

Angular Analysis of peaks at 23.353, 23.389 and 24.12 GHz
-106
-104
-102
-100
-98
-96
-94
-92
-90
-88
0 15 30 45 60 75 90 105
120
135
150
165
180
195
210
225
240
255
270
285
300
315
330
345
Angle (degrees)
Pow
er (d
Bm
)
Max Power of Peak at 23.353 GHz Max Power of Peak at 23.489 GHzMax Power of Peak at 24.12 GHz
Angular Analysis of Peaks at 23.399, 23.41 and 23.434 GHz
-106
-104
-102
-100
-98
-96
-94
-92
-90
-88
0 15 30 45 60 75 90 105
120
135
150
165
180
195
210
225
240
255
270
285
300
315
330
345
Angle (degrees)
Pow
er (d
Bm)
Max Power of Peak at 23.41 GHz Max Power of Peak at 23.434 GHz
Figure B.13. Oconee County Airport: Sixty Degree Elevation, Angular Analysis
137
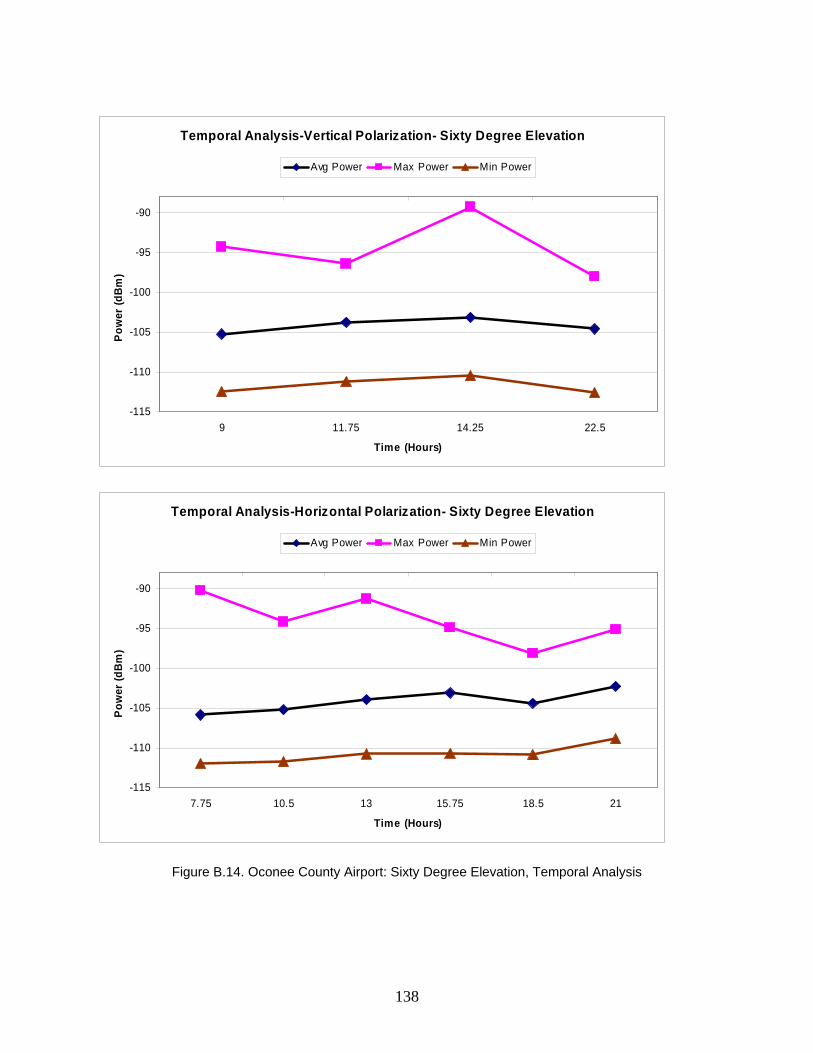
Temporal Analysis-Vertical Polarization- Sixty Degree Elevation
-115
-110
-105
-100
-95
-90
9 11.75 14.25 22.5
Time (Hours)
Pow
er (d
Bm
)
Avg Power Max Power Min Power
Temporal Analysis-Horizontal Polarization- Sixty Degree Elevation
-115
-110
-105
-100
-95
-90
7.75 10.5 13 15.75 18.5 21
Time (Hours)
Pow
er (d
Bm
)
Avg Power Max Power Min Power
Figure B.14. Oconee County Airport: Sixty Degree Elevation, Temporal Analysis
138

Statistical Analysis- Sixty Degree Elewvation
-15
-10
-5
0
5
10
15
20
25
0.01 0.1 1 10 100
Percentile Exceeding Ordinate
dB a
bove
mea
n
Measured APD Theoretical APD
Figure B.15. Oconee County Airport: Sixty Degree Elevation, Statistical Analysis
139

Vertical Polarization
-113
-111
-109
-107
-105
-103
-101
-99
-97
-95
-93
23.3 23.4 23.5 23.6 23.7 23.8 23.9 24 24.1 24.2 24.3
Frequency (GHz)
Pow
ewr (
dBm
)
Avg Power Max Power Min Power
Horizontal Polarization
-113
-111
-109
-107
-105
-103
-101
-99
-97
-95
-93
23.3 23.4 23.5 23.6 23.7 23.8 23.9 24 24.1 24.2 24.3
Frequency (GHz)
Pow
er (d
Bm
)
Avg Power Max Power Min Power
Figure B.16. Oconee County Airport: Ninety Degree Elevation, Spectral Analysis
140

Temporal Analysis- Vertical Polarization-Ninety Degree Elevation
-115
-110
-105
-100
-95
-90
8 10.75 13.5 16 19
Time (Hours)
Pow
er (d
Bm
)
Avg Power Max Power Min Power
Temporal Analysis- Horizontal Polarization-Ninety Degree Elevation
-115
-110
-105
-100
-95
-90
9.5 12 14.75 23
Time (Hours)
Pow
er (d
Bm
)
Avg Power Max Power Min Power
Figure B.17. Oconee County Airport: Ninety Degree Elevation, Temporal Analysis
141

Statistical Analysis
-15
-10
-5
0
5
10
15
20
25
0.01 0.1 1 10 100
Percentile Exceeding Ordinate
dB a
bove
mea
n
Measured APD Thoeretical APD
Figure B.18. Oconee County Airport: Ninety Degree Elevation, Statistical Analysis
142
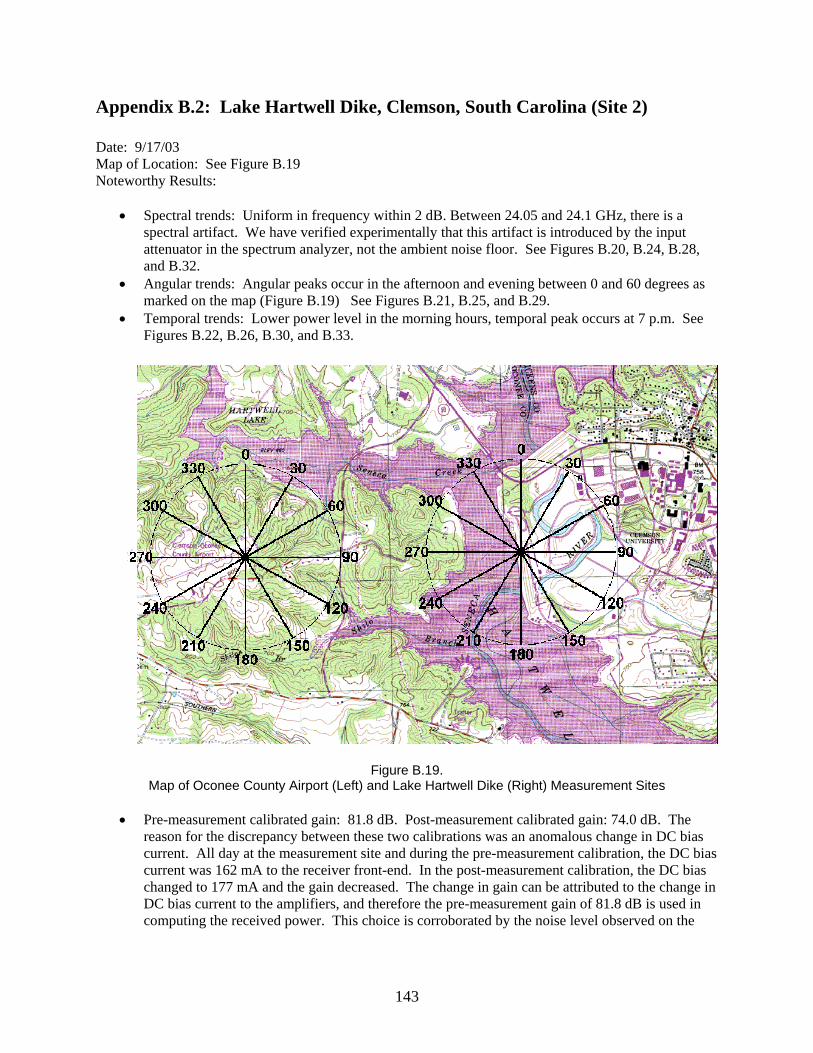
Appendix B.2: Lake Hartwell Dike, Clemson, South Carolina (Site 2) Date: 9/17/03 Map of Location: See Figure B.19 Noteworthy Results:
• Spectral trends: Uniform in frequency within 2 dB. Between 24.05 and 24.1 GHz, there is a spectral artifact. We have verified experimentally that this artifact is introduced by the input attenuator in the spectrum analyzer, not the ambient noise floor. See Figures B.20, B.24, B.28, and B.32.
• Angular trends: Angular peaks occur in the afternoon and evening between 0 and 60 degrees as marked on the map (Figure B.19) See Figures B.21, B.25, and B.29.
• Temporal trends: Lower power level in the morning hours, temporal peak occurs at 7 p.m. See Figures B.22, B.26, B.30, and B.33.
Figure B.19.
Map of Oconee County Airport (Left) and Lake Hartwell Dike (Right) Measurement Sites
• Pre-measurement calibrated gain: 81.8 dB. Post-measurement calibrated gain: 74.0 dB. The reason for the discrepancy between these two calibrations was an anomalous change in DC bias current. All day at the measurement site and during the pre-measurement calibration, the DC bias current was 162 mA to the receiver front-end. In the post-measurement calibration, the DC bias changed to 177 mA and the gain decreased. The change in gain can be attributed to the change in DC bias current to the amplifiers, and therefore the pre-measurement gain of 81.8 dB is used in computing the received power. This choice is corroborated by the noise level observed on the
143

spectrum analyzer for this set of measurements. We believe that a bad solder joint was the source of this problem.
• Figures B.23, B.27, B.31, and B.34 depict a statistical analysis.
Spectral Analysis-Vertical Polarization-Zero Degree Elevation
-115
-110
-105
-100
-95
-90
23.3 23.4 23.5 23.6 23.7 23.8 23.9 24 24.1 24.2 24.3
Frequency (GHz)
Pow
er (d
Bm
)
Avg Power Max Power Min Power
Spectral Analysis-Horizontal Polarization-Zero Degree Elevation
-115
-110
-105
-100
-95
-90
23.3 23.4 23.5 23.6 23.7 23.8 23.9 24 24.1 24.2 24.3
Frequency (GHz)
Pow
er (d
Bm
)
Avg Power Max Power Min Power
Figure B.20. Lake Hartwell Dike: Zero Degree Elevation, Spectral Analysis
144

Angular Analysis- Vertical Polarization-Zero Degree Elevation
-110
-105
-100
0 15 30 45 60 75 90105
120135
150165
180195
210225
240255
270285
300315
330345
Angle ( Degrees)
Pow
er (d
Bm
)
Avg Power at 7 hours Avg Power at 9:42 hours Avg Power at 13 HoursAvg Power at 18:42 Hours Avg Power at 21:29Hours
Angular Analysis- Horizontal Polarization-Zero Degree Elevation
-110
-105
-100
0 15 30 45 60 75 90105
120135
150165
180195
210225
240255
270285
300315
330345
Angle ( Degrees)
Pow
er (d
Bm
)
Avg Power at 8:20 Hours Avg Power at 12:18 Hours Avg Power at 14:25 HoursAvg Power at 17:07 Hours Avg Power at 20:01 Hours
Figure B.21. Lake Hartwell Dike: Zero Degree Elevation, Angular Analysis
145

Temporal Analysis-Vertical Polarization- Zero Degree Elevation
-114
-112
-110
-108
-106
-104
-102
-100
-98
-96
-94
7 9.75 13 15.75 18.75 21.5
Time (Hours)
Pow
er (d
Bm
)
Avg Power Max Power Min Power
Temporal Analysis- Horizontal Polarization- Thirty Degree Elevation
-115
-110
-105
-100
-95
-90
8.75 14.75 17.5 20.5
Time (Hours)
Pow
er (d
Bm
)
Avg Power Max Power Min Power
Figure B.22. Lake Hartwell Dike: Zero Degree Elevation, Temporal Analysis
146

Statistical Analysis- Zero Degree Elevation
-15
-10
-5
0
5
10
15
0.01 0.1 1 10 100
Percentage exceeding ordinate
dB a
bove
mea
n
Measured APD Theoretical APD
Figure B.23. Lake Hartwell Dike: Zero Degree Elevation, Statistical Analysis
147
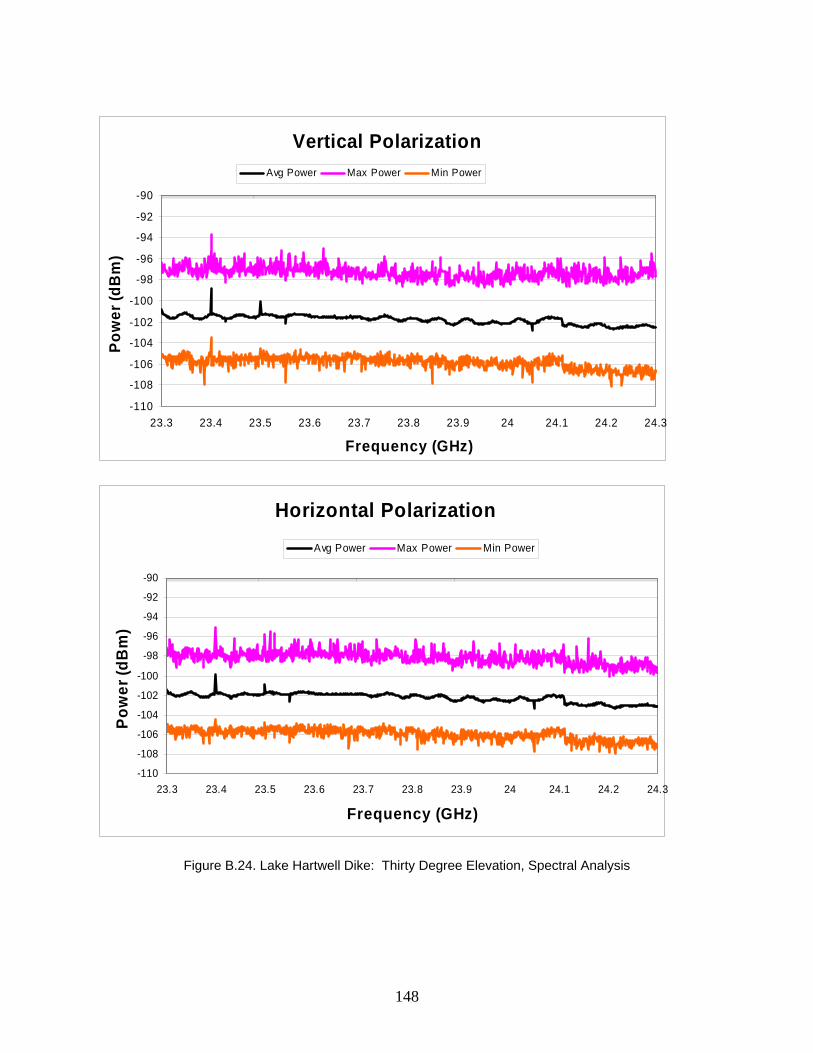
Vertical Polarization
-110
-108
-106
-104
-102
-100
-98
-96
-94
-92
-90
23.3 23.4 23.5 23.6 23.7 23.8 23.9 24 24.1 24.2 24.
Frequency (GHz)
Pow
er (d
Bm
)
3
Avg Power Max Power Min Power
Horizontal Polarization
-110
-108
-106
-104
-102
-100
-98
-96
-94
-92
-90
23.3 23.4 23.5 23.6 23.7 23.8 23.9 24 24.1 24.2 24.3
Frequency (GHz)
Pow
er (d
Bm
)
Avg Power Max Power Min Power
Figure B.24. Lake Hartwell Dike: Thirty Degree Elevation, Spectral Analysis
148

Angular Analysis- Vertical Polarization- Thirty Degree Elevation
-107
-106
-105
-104
-103
-102
-101
-100
-99
-98
0 15 30 45 60 75 90 105
120
135
150
165
180
195
210
225
240
255
270
285
300
315
330
345
Angle (Degrees)
Pow
er (d
Bm
)
Avg Power at 7:23 Hours Avg Power at 10:11 Hours Avg Power at 13:22 HoursAvg Power at 19:04 Hours Avg Power at 21:50 Hours
Angular Analysis- Horizontal Polarization- Thirty Degree Elevation
-107
-106
-105
-104
-103
-102
-101
-100
-99
-98
0 15 30 45 60 75 90 105
120
135
150
165
180
195
210
225
240
255
270
285
300
315
330
345
Angle (Degrees)
Pow
er (d
Bm
)
Avg Power at 8:42 Hours Avg Power at 14:47 HoursAvg Power at 17:28 Hours Avg Power at 20:22 hours
Figure B.25. Lake Hartwell Dike: Thirty Degree Elevation, Angular Analysis
149

Temporal Analysis- Vertical Polarization- Thirty Degree Elevation
-115
-110
-105
-100
-95
-90
7.5 10.1 13.4 16 19 22
Time (Hours)
Pow
er (d
Bm
)
Avg Power Max Power Min Power
Temporal Analysis- Horizontal Polarization- Thirty Degree Elevation
-115
-110
-105
-100
-95
-90
8.75 14.75 17.5 20.5
Time (Hours)
Pow
er (d
Bm
)
Avg Power Max Power Min Power
Figure B. 26 Lake Hartwell Dike: Thirty Degree Elevation, Temporal Analysis
150

Statistical Analysis
-15
-10
-5
0
5
10
15
0.01 0.1 1 10 100
Percentile Exceeding Ordinate
dBm
abo
ve m
ean
Measured APD Theoretical APD
Figure B.27. Lake Hartwell Dike: Thirty Degree Elevation, Statistical Analysis
151

Vertical Polarization
-113
-111
-109
-107
-105
-103
-101
-99
-97
-95
-93
23.3 23.4 23.5 23.6 23.7 23.8 23.9 24 24.1 24.2 24.3
Frequency (GHz)
Pow
er (d
Bm
)
Avg Power Max Power Min Power
Horizontal Polarization
-113
-111
-109
-107
-105
-103
-101
-99
-97
-95
-93
23.3 23.4 23.5 23.6 23.7 23.8 23.9 24 24.1 24.2 24.3
Frequency (GHz)
Pow
er (d
Bm
)
Avg Power Max Power Min Power
Figure B.28. Lake Hartwell Dike: Sixty Degree Elevation, Spectral Analysis
152
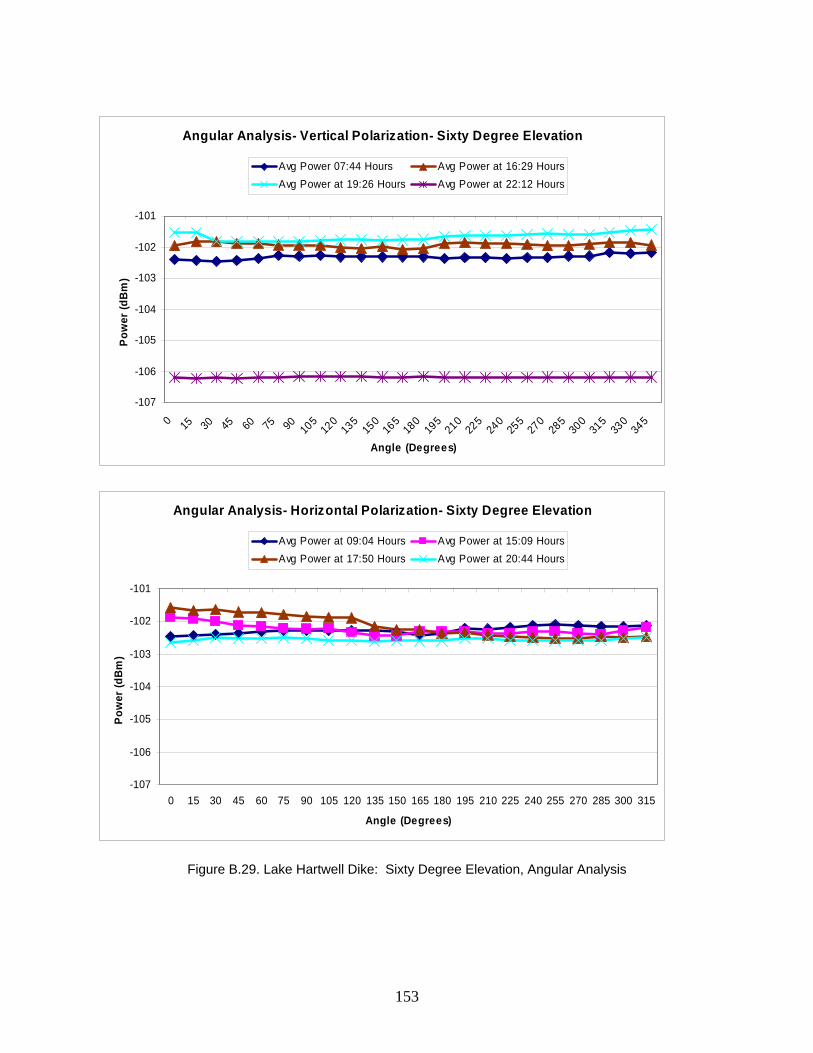
Angular Analysis- Vertical Polarization- Sixty Degree Elevation
-107
-106
-105
-104
-103
-102
-101
0 15 30 45 60 75 90 105
120
135
150
165
180
195
210
225
240
255
270
285
300
315
330
345
Angle (Degrees)
Pow
er (d
Bm)
Avg Power 07:44 Hours Avg Power at 16:29 HoursAvg Power at 19:26 Hours Avg Power at 22:12 Hours
Angular Analysis- Horizontal Polarization- Sixty Degree Elevation
-107
-106
-105
-104
-103
-102
-101
0 15 30 45 60 75 90 105 120 135 150 165 180 195 210 225 240 255 270 285 300 315
Angle (Degrees)
Pow
er (d
Bm)
Avg Power at 09:04 Hours Avg Power at 15:09 HoursAvg Power at 17:50 Hours Avg Power at 20:44 Hours
Figure B.29. Lake Hartwell Dike: Sixty Degree Elevation, Angular Analysis
153

Temporal Analysis- Vertical Polarization- Sixty Degrees Elevation
-115
-110
-105
-100
-95
-90
7.75 10.5 16.5 19.5 22.2
Time (Hours)
Pow
er (d
Bm)
Avg Power Max Power Min Power
Temporal Analysis- Horizontal Polarization- Sixty Degree Elevation
-115
-110
-105
-100
-95
-90
9 15 17.8 20.75
Time (Hours)
Pow
er (d
Bm)
Avg Power Max Power Min Power
Figure B.30. Lake Hartwell Dike: Sixty Degree Elevation, Temporal Analysis
154

Statistical Analysis
-15
-10
-5
0
5
10
15
0.01 0.1 1 10 100
Percentile Exceeding Ordinate
dBm
abo
ve m
ean
Measured APD Theoretical APD
Figure B.31. Lake Hartwell Dike: Sixty Degree Elevation, Statistical Analysis
155

Vertical Polarization
-113
-111
-109
-107
-105
-103
-101
-99
-97
-95
-93
23.3 23.4 23.5 23.6 23.7 23.8 23.9 24 24.1 24.2 24.3
Frequency (GHz)
Pow
er (d
Bm
)
Avg Power Max Power Min Power
Horizontal Polarization
-113
-111
-109
-107
-105
-103
-101
-99
-97
-95
-93
23.3 23.4 23.5 23.6 23.7 23.8 23.9 24 24.1 24.2 24.3
Frequency (GHz)
Pow
er (d
Bm
)
Avg Power Max Power Min Power
Figure B.32. Lake Hartwell Dike: Ninety Degree Elevation, Spectral Analysis
156

Temporal Analysis- Vertical Polarization- Ninety Degree Elevation
-114
-111
-108
-105
-102
-99
-96
-93
8 11 17 19.75 22.5
Time (Hours)
Pow
er (d
Bm
)
Avg Power Max Power Min Power
Temporal analysis- Horizontal Polarization- Ninety Degree Elevation
-114
-111
-108
-105
-102
-99
-96
-93
9.5 12.25 15.5 18.25 21
Time (Hours)
Pow
er (d
Bm
)
Avg Power Max Power Min Power
Figure B.33. Lake Hartwell Dike: Ninety Degree Elevation, Temporal Analysis
157

Statistical Analysis
-15
-10
-5
0
5
10
15
0.01 0.1 1 10 100
Percentile Exceeding Ordinate
dB
abov
e m
ean
Measured APD Theoretical APD
Figure B.34. Lake Hartwell Dike: Ninety Degree Elevation, Statistical Analysis
158

Appendix B.3: Blue Ridge Parkway, North Carolina (Site 3) Date: 9/19/03 Map of Location: See Figure B.35 Noteworthy Results:
• Spectral trends: Uniform in frequency within 2 dB. Between 24.05 and 24.1 GHz, there is a spectral artifact. It has been verified experimentally that this artifact was generated by the input attenuation in the spectrum analyzer, not the ambient noise floor. See Figures B. 36, B.40, B.44, and B.48.
• Angular trends: Uniform in angle within 2 dB. See Figures B.37, B.41, and B.45. • Temporal trends: Temporal peak occurs at noon, otherwise uniform within 2 dB. See Figures
B.38, B.42, B.46, and B.49. • Pre-measurement calibrated gain: 74.0 dB; Post-measurement calibrated gain: 83.8 dB. The
reason for the discrepancy between these two calibrations was an anomalous change in DC bias current discussed in the description of the measurement at Site 2.
Figure B.35. Map of Blue Ridge Parkway Measurement Site (Note the lack of man-made structures in the immediate vicinity of the measurement site)
• The power levels in this measurement are roughly 10 dB above that of the previous
measurements, and the spectral artifact due to the attenuator at the input of the spectrum analyzer is emphasized to a greater extent than previous sites. The lower gain discussed above causes the noise power due to the attenuator to dominate the measured noise floor. The scope of this project
159

is to measure the man-made interference sources. The man-made sources from all other sites listed were at a level of -97 dBm or above. The average observed noise floor of this measurement site existed at this -97 dBm level as can be seen from the figures. Therefore, the ability to detect man-made sources was modestly impaired by this shift in system noise floor.
• Figures B.39, B.43, B.47, and B.50 depict a statistical analysis.
160

Spectral Analysis-Vertical Polarization-Zero Degree Elevation
-106
-104
-102
-100
-98
-96
-94
-92
-90
23.3 23.4 23.5 23.6 23.7 23.8 23.9 24 24.1 24.2 24.3
Frequency (GHz)
Pow
er (d
Bm
)
Avg Power Max Power Min Power
Spectral Analysis-Horizontal Polarization-Zero Degree Elevation
-105
-103
-101
-99
-97
-95
-93
-91
-89
-87
-85
23.3 23.4 23.5 23.6 23.7 23.8 23.9 24 24.1 24.2 24.3
Frequency (GHz)
Pow
er (d
Bm)
Avg Power Max Power Min Power
Figure B.36. Blue Ridge Parkway: Zero Degree Elevation, Spectral Analysis
161

Angular Analysis- Vertical Polarization-Zero Degree Elevation
-99
-98.5
-98
-97.5
-97
-96.5
-96
0 15 30 45 60 75 90 105
120
135
150
165
180
195
210
225
240
255
270
285
300
315
330
345
Angle ( Degrees)
Pow
er (d
Bm
)
Avg Power at 07:01 Hours Avg Power at 09:48 Hours Avg Power at 12:33 HoursAvg Power at 15:34 Hours Avg Power at 18:02 Hours Avg Power at 20:33 Hours
Angular Analysis- Horizontal Polarization-Zero Degree Elevation
-99
-98.5
-98
-97.5
-97
-96.5
-96
0 15 30 45 60 75 90 105
120
135
150
165
180
195
210
225
240
255
270
285
300
315
330
345
Angle ( Degrees)
Pow
er (d
Bm
)
Avg Power at 08:16 Hours Avg Power at 11:15 Hours Avg Power at 14:09 HoursAvg Power at 16:48 Hours Avg Power at 19:16 Hours Avg Power at 21:50 Hours
Figure B.37. Blue Ridge Parkway: Zero Degree Elevation, Angular Analysis
162

Temporal Analysis-Vertical Polarization- Zero Degree Elevation
-105
-103
-101
-99
-97
-95
-93
-91
7 9.75 12.5 15.5 18 20.5
Time (Hours)
Pow
er (d
Bm
)
Avg Power Max Power Min Power
Temporal Analysis-Horizontal Polarization- Zero Degree Elevation
-105
-103
-101
-99
-97
-95
-93
-91
8.25 11.25 14.25 16.75 19.25 21.8
Time (Hours)
Pow
er (d
Bm
)
Avg Power Max Power Min Power
Figure B.38. Blue Ridge Parkway: Zero Degree Elevation, Temporal Analysis
163

Spectral Analysis- Zero Degree Elevation
-10
-5
0
5
10
15
0.01 0.1 1 10 100
Percentile Exceeding Ordinate
dB a
bove
mea
n
Measured APD Theoretical APD
Figure B.39. Blue Ridge Parkway: Zero Degree Elevation, Statistical Analysis
164

Vertical Polarization
-106
-104
-102
-100
-98
-96
-94
-92
-90
23.3 23.4 23.5 23.6 23.7 23.8 23.9 24 24.1 24.2 24.3
Frequency (GHz)
Pow
er (d
Bm
)
Avg Power Max Power Min Power
Horizontal Polarization
-105
-103
-101
-99
-97
-95
-93
-91
-89
23.3 23.4 23.5 23.6 23.7 23.8 23.9 24 24.1 24.2 24.3
Frequency (GHz)
Pow
er (d
Bm
)
Avg Power Max Power Min Power
Figure B.40. Blue Ridge Parkway: Thirty Degree Elevation, Spectral Analysis
165

Angular Analysis- Vertical Polarization-Zero Degree Elevation
-99
-98.5
-98
-97.5
-97
-96.5
-96
-95.5
-95
0 15 30 45 60 75 90 105
120
135
150
165
180
195
210
225
240
255
270
285
300
315
330
345
Angle ( Degrees)
Pow
er (d
Bm
)
Avg Power at 07:22 Hours Avg Power at 10:10 Hours Avg Power at 12:55 HoursAvg Power at 15:56 Hours Avg Power at 18:24 Hours Avg Power at 20:55 Hours
Angular Analysis- Horizontal Polarization-Zero Degree Elevation
-99
-98.5
-98
-97.5
-97
-96.5
-96
-95.5
-95
0 15 30 45 60 75 90 105 120 135 150 165 180 195 210 225 240 255 270 285 300 315 330 345
Angle ( Degrees)
Pow
er (d
Bm)
Avg Power at 08:38 Hours Avg Power at 11:36 Hours Avg Power at 17:10 HoursAvg Power at 19:38 Hours Avg Power at 22:12 Hours
Figure B.41. Blue Ridge Parkway: Thirty Degree Elevation, Angular Analysis
166

Temporal Analysis- Vertical Polarization- Zero Degree Elevation
-106
-104
-102
-100
-98
-96
-94
-92
-90
7.33 10.2 13 16 18.5 21
Time (Hours)
Pow
er (d
Bm)
Avg Power Max Power Min Power
Temporal Analysis-Horizontal Polarization- Zero Degree Elevation
-105
-103
-101
-99
-97
-95
-93
-91
-89
8.75 11.5 14.5 17.2 19.5 22.25
Time (Hours)
Pow
er (d
Bm
)
Avg Power Max Power Min Power
Figure B.42. Blue Ridge Parkway: Thirty Degree Elevation, Temporal Analysis
167

Statistical Analysis
-10
-5
0
5
10
15
0.01 0.1 1 10 100
Percentile Exceeding Ordinate
dB a
bove
mea
n
Measured APD Theoretical APD
Figure B.43. Blue Ridge Parkway: Thirty Degree Elevation, Statistical Analysis
168
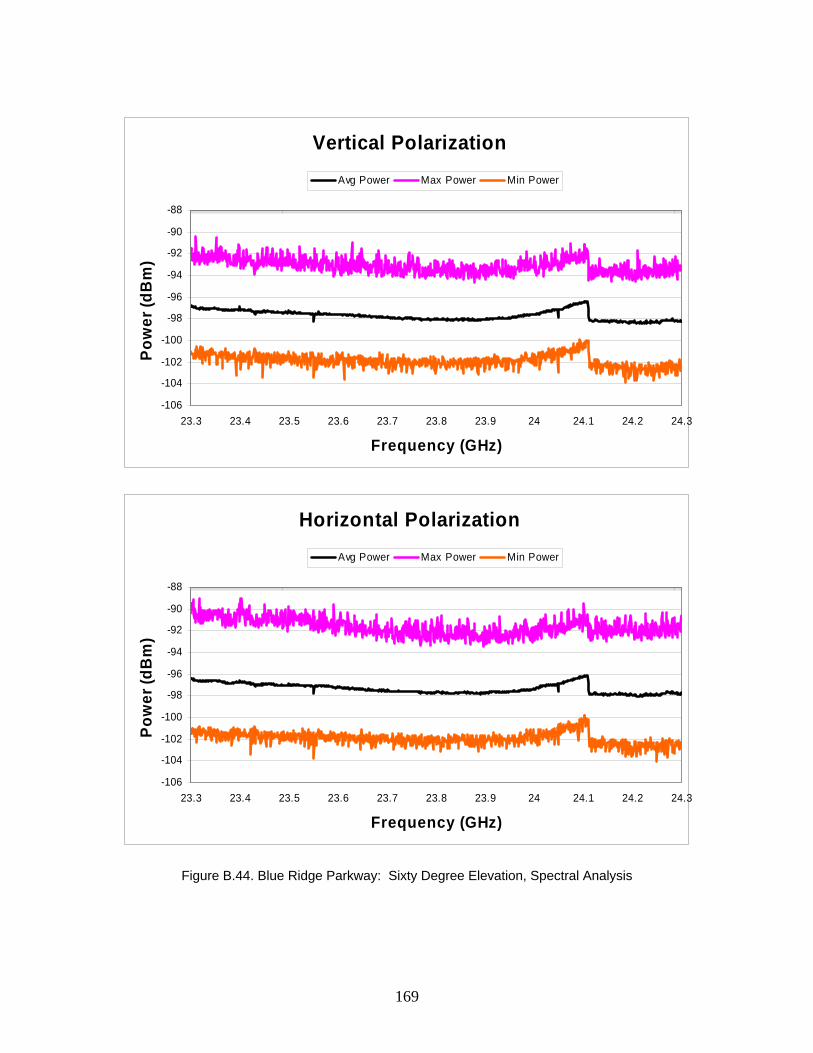
Vertical Polarization
-106
-104
-102
-100
-98
-96
-94
-92
-90
-88
23.3 23.4 23.5 23.6 23.7 23.8 23.9 24 24.1 24.2 24.3
Frequency (GHz)
Pow
er (d
Bm
)
Avg Power Max Power Min Power
Horizontal Polarization
-106
-104
-102
-100
-98
-96
-94
-92
-90
-88
23.3 23.4 23.5 23.6 23.7 23.8 23.9 24 24.1 24.2 24.3
Frequency (GHz)
Pow
er (d
Bm
)
Avg Power Max Power Min Power
Figure B.44. Blue Ridge Parkway: Sixty Degree Elevation, Spectral Analysis
169

Angular Analysis- Vertical Polarization- Sixty Degree Elevation
-99-98.5
-98-97.5
-97-96.5
-96-95.5
-95-94.5
-94-93.5
-93-92.5
-92
0 15 30 45 60 75 90 105
120
135
150
165
180
195
210
225
240
255
270
285
300
315
330
345
Angle (Degrees)
Pow
er (d
Bm)
Avg Power at 07:44 Hours Avg Power at 13:17 Hours Avg Power at 16:18 HoursAvg Power at 18:46 Hours Avg Power at 10:43 Hours Avg Power at 21:17 Hours
Angular Analysis- Horizontal Polarization- Sixty Degree Elevation
-99
-98
-97
-96
-95
-94
-93
-92
0 15 30 45 60 75 90 105 120 135 150 165 180 195 210 225 240 255 270 285 300 315 330 345
Angle (Degrees)
Pow
er (d
Bm
)
Avg Power at 09:00 Hours Avg Power at 11:58 Hours Avg Power at 15:01 HoursAvg Power at 17:32 Hours Avg Power at 20:00 Hours Avg Power at 22:34 Hours
Figure B.45. Blue Ridge Parkway: Sixty Degree Elevation, Angular Analysis
170

Temporal Analysis- Vertical Polarization- Sixty Degrees Elevation
-106
-104
-102
-100
-98
-96
-94
-92
-90
-88
7.75 10.75 13.25 16.25 18.75 21.25
Time (Hours)
Pow
er (d
Bm)
Avg Power Max Power Min Power
Temporal Analysis- Horizontal Polarization- Sixty Degree Elevation
-106
-104
-102
-100
-98
-96
-94
-92
-90
-88
9 12 14.5 17.5 20 22.5
Time (Hours)
Pow
er (d
Bm)
Avg Power Max Power Min Power
Figure B.46. Blue Ridge Parkway: Sixty Degree Elevation, Temporal Analysis
171

Statistical Analysis
-10
-5
0
5
10
15
0.01 0.1 1 10 100
Percentile Exceeding Ordinate
dB a
bove
mea
n
Measured APD Theoretical APD
Figure B.47. Blue Ridge Parkway: Sixty Degree Elevation, Statistical Analysis
172
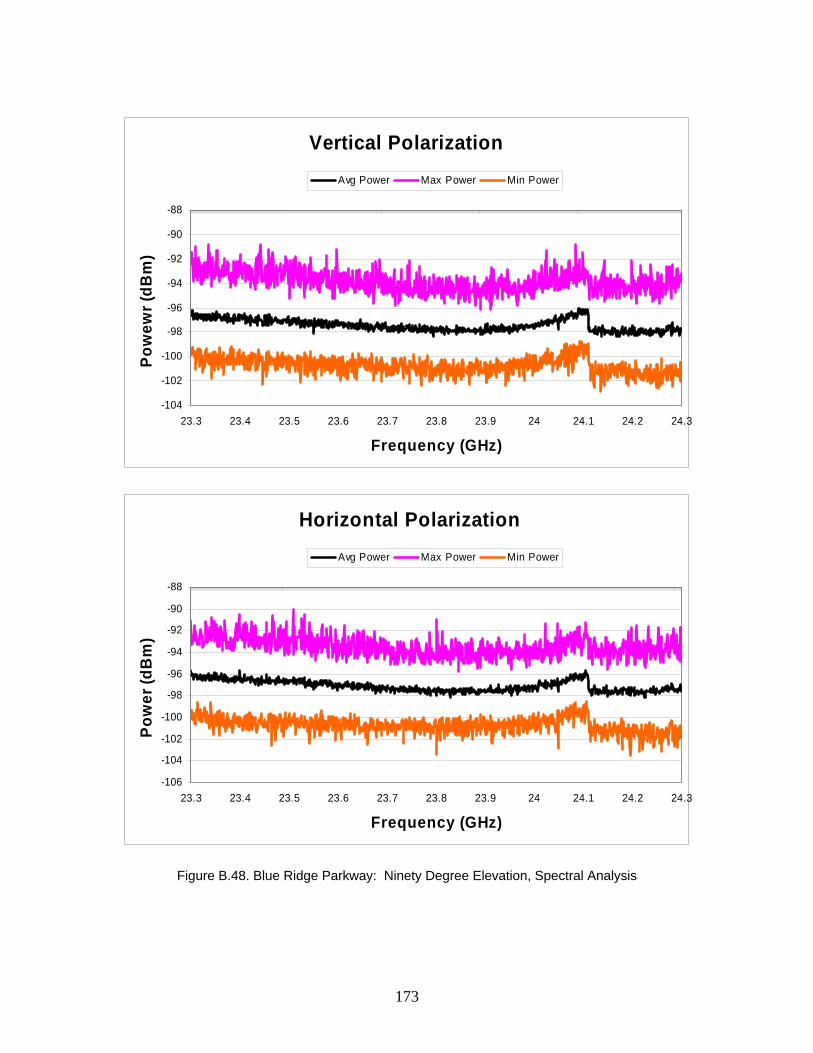
Vertical Polarization
-104
-102
-100
-98
-96
-94
-92
-90
-88
23.3 23.4 23.5 23.6 23.7 23.8 23.9 24 24.1 24.2 24.3
Frequency (GHz)
Pow
ewr (
dBm
)
Avg Power Max Power Min Power
Horizontal Polarization
-106
-104
-102
-100
-98
-96
-94
-92
-90
-88
23.3 23.4 23.5 23.6 23.7 23.8 23.9 24 24.1 24.2 24.3
Frequency (GHz)
Pow
er (d
Bm
)
Avg Power Max Power Min Power
Figure B.48. Blue Ridge Parkway: Ninety Degree Elevation, Spectral Analysis
173

Temporal Analysis- Vertical Polarization-Ninety Degree Elevation
-104
-102
-100
-98
-96
-94
-92
-90
8 13.75 16.75 19 21.75
Time (Hours)
Pow
er (d
Bm
)
Avg Power Max Power Min Power
Temporal Analysis- Horizontal Polarization-Ninety Degree Elevation
-106
-104
-102
-100
-98
-96
-94
-92
-90
9.25 12.25 16.75 21.25 23
Time (Hours)
Pow
er (d
Bm
)
Avg Power Max Power Min Power
Figure B.49. Blue Ridge Parkway: Ninety Degree Elevation. Temporal Analysis.
174

Statistical Analysis
-10
-5
0
5
10
15
0.01 0.1 1 10 100
Percentile Exceeding Ordinate
dB a
bove
mea
n
Measured APD Theoretical APD
Figure B.50. Blue Ridge Parkway: Ninety Degree Elevation, Statistical Analysis
175

(This page was left intentionally blank)
176
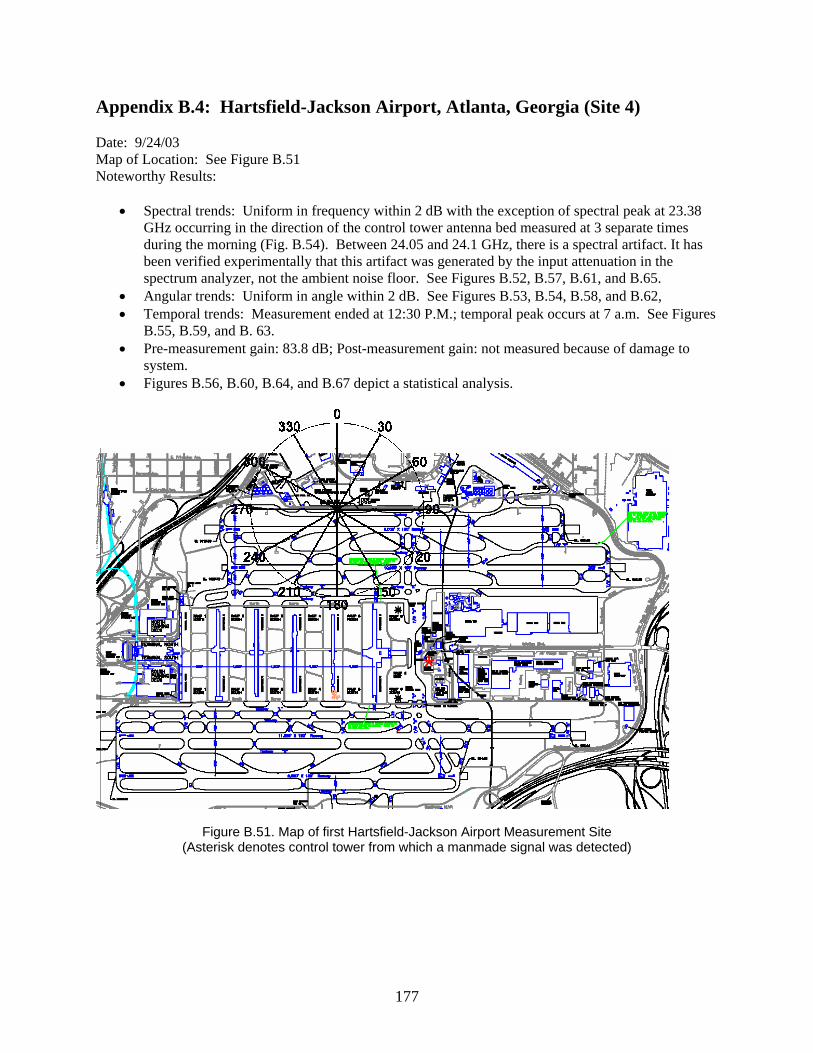
Appendix B.4: Hartsfield-Jackson Airport, Atlanta, Georgia (Site 4) Date: 9/24/03 Map of Location: See Figure B.51 Noteworthy Results:
• Spectral trends: Uniform in frequency within 2 dB with the exception of spectral peak at 23.38 GHz occurring in the direction of the control tower antenna bed measured at 3 separate times during the morning (Fig. B.54). Between 24.05 and 24.1 GHz, there is a spectral artifact. It has been verified experimentally that this artifact was generated by the input attenuation in the spectrum analyzer, not the ambient noise floor. See Figures B.52, B.57, B.61, and B.65.
• Angular trends: Uniform in angle within 2 dB. See Figures B.53, B.54, B.58, and B.62, • Temporal trends: Measurement ended at 12:30 P.M.; temporal peak occurs at 7 a.m. See Figures
B.55, B.59, and B. 63. • Pre-measurement gain: 83.8 dB; Post-measurement gain: not measured because of damage to
system. • Figures B.56, B.60, B.64, and B.67 depict a statistical analysis.
*
Figure B.51. Map of first Hartsfield-Jackson Airport Measurement Site
(Asterisk denotes control tower from which a manmade signal was detected)
177

Vertical Polarization
-115
-110
-105
-100
-95
-90
23.3 23.4 23.5 23.6 23.7 23.8 23.9 24 24.1 24.2 24.3
Frequency ( GHz)
Pow
er (
dBm
)
Avg Power Max Power Min Power
Horizontal Polarization
-115
-110
-105
-100
-95
-90
23.3 23.4 23.5 23.6 23.7 23.8 23.9 24 24.1 24.2 24.3
Frequency ( GHz)
Pow
er (
dBm
)
Avg Power Max Power Min Power
Figure B.52. Hartsfield-Jackson Airport (9/24/03): Zero Degree Elevation, Spectral Analysis
178

Angular Analysis- Vertical Polarization- Zero Degree Elevation
-107
-106
-105
-104
-103
-102
-101
0 15 30 45 60 75 90 105
120
135
150
165
180
195
210
225
240
255
270
285
300
315
330
345
Angle (Degrees)
Pow
er (d
Bm
)
Avg Power at 6:57 Hours Avg Power at 09:27 Hours Avg Power at 11:57 Hours
Angular Analysis- Horizontal Polarization- Zero Degree Elevation
-107
-106
-105
-104
-103
-102
-101
0 15 30 45 60 75 90 105
120
135
150
165
180
195
210
225
240
255
270
285
300
315
330
345
Angle (Degrees)
Pow
er (d
Bm)
Avg Power at 08:14 Hours Avg Power at 10:42 Hours
Figure B.53. Hartsfield-Jackson Airport (9/24/03): Zero Degree Elevation, Angular Analysis
179
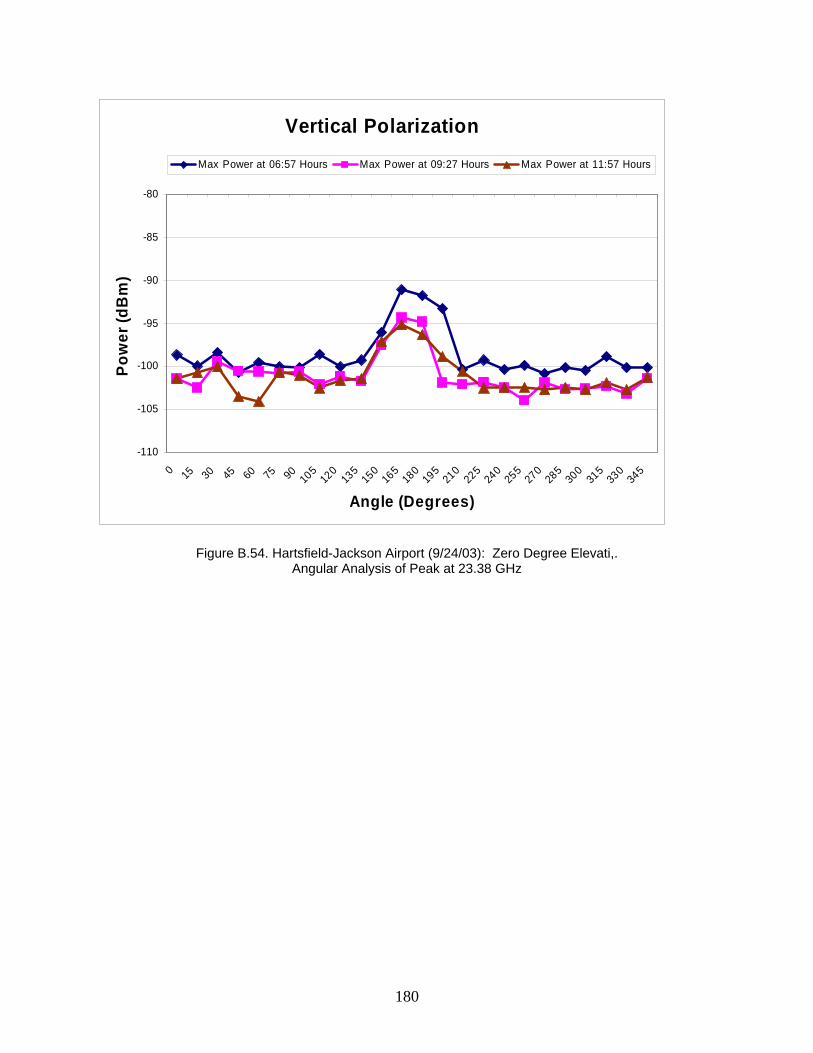
Vertical Polarization
-110
-105
-100
-95
-90
-85
-80
0 15 30 45 60 75 90 105
120
135
150
165
180
195
210
225
240
255
270
285
300
315
330
345
Angle (Degrees)
Pow
er (d
Bm
)
Max Power at 06:57 Hours Max Power at 09:27 Hours Max Power at 11:57 Hours
Figure B.54. Hartsfield-Jackson Airport (9/24/03): Zero Degree Elevati,. Angular Analysis of Peak at 23.38 GHz
180

Temporal Analysis- Vertical Polarization-Zero Degree Elevation
-115
-110
-105
-100
-95
-90
7 9.5 12
Time (Hours)
Pow
er (d
Bm
)
avg power max power min power
Temporal Analysis- Horizontal Polarization-Zero Degree Elevation
-115
-110
-105
-100
-95
-90
8.25 10.75
Time (Hours)
Pow
er (d
Bm)
Avg Power Max Power Min Power
Figure B.55. Hartsfield-Jackson Airport (9/24/03): Zero Degree Elevation, Temporal Analysis
181

Statistical Analysis- Zero Degree Elevation
-10
-5
0
5
10
15
0.01 0.1 1 10 100
Percentile Exceeding Ordinate
dB a
bove
mea
n
Measured APD Theoretical APD
Figure B.56. Hartsfield-Jackson Airport (9/24/03): Zero Degree Elevation, Statistical Analysis
182

Vertical Polarization
-113
-111
-109
-107
-105
-103
-101
-99
-97
-95
23.3 23.4 23.5 23.6 23.7 23.8 23.9 24 24.1 24.2 24.3
Frequency (GHz)
Pow
er (d
Bm
)
Avg Power Max Power Min Power
Horizontal Polarization
-113
-111
-109
-107
-105
-103
-101
-99
-97
-95
23.3 23.4 23.5 23.6 23.7 23.8 23.9 24 24.1 24.2 24.3
Frequency (GHz)
Pow
er (d
Bm
)
Avg Power Max Power Min Power
Figure B.57. Hartsfield-Jackson Airport (9/24/03): Thirty Degree Elevation, Spectral Analysis
183

Angular Analysis- Thirty Degree Elevation- Vertical Polarization
-107
-106.5
-106
-105.5
-105
-104.5
-104
-103.5
-103
-102.5
-102
0 15 30 45 60 75 90 105
120
135
150
165
180
195
210
225
240
255
270
285
300
315
330
345
Angle (Degrees)
Pow
er (d
Bm
)
Avg Power at 07:19 Hours Avg Power at 09:49 Hours
Angular Analysis- Thirty Degree Elevation- Horizontal Polarization
-107
-106.5
-106
-105.5
-105
-104.5
-104
-103.5
-103
-102.5
-102
0 15 30 45 60 75 90 105
120
135
150
165
180
195
210
225
240
255
270
285
300
315
330
345
Angle (Degrees)
Pow
er (d
Bm)
Avg Power at 08:35 Hours Avg Power at 11:04 Hours
Figure B.58. Hartsfield-Jackson Airport (9/24/03): Thirty Degree Elevation, Angular Analysis
184

Temporal Analysis- Vertical Polarization
-113
-111
-109
-107
-105
-103
-101
-99
-97
-95
7.25 9.75
Time (Hours)
Pow
er (d
Bm
)
Avg Power Max Power Min Power
Temporal Analysis- Horizontal Polarization
-114
-112
-110
-108
-106
-104
-102
-100
-98
8.75 11.55
Time (Hours)
Pow
er (d
Bm
)
Avg Power Max Power Min Power
Figure B. 59. Hartsfield-Jackson Airport (9/24/03): Thirty Degree Elevation, Temporal Analysis
185

Statistical Analysis
-10
-5
0
5
10
15
0.01 0.1 1 10 100
Percentile Exceeding Ordinate
dB a
bove
mea
n
Measured APD Theoretical APD
Figure B.60. Hartsfield-Jackson Airport (9/24/03): Thirty Degree Elevation, Statistical Analysis
186

Vertical Polarization
-115
-113
-111
-109
-107
-105
-103
-101
-99
-97
-95
23.3 23.4 23.5 23.6 23.7 23.8 23.9 24 24.1 24.2 24.3
Frequency ( GHz)
Pow
er (
dBm
)
Avg Power Max Power Min Power
Horizontal Polarization
-115
-113
-111
-109
-107
-105
-103
-101
-99
-97
-95
23.3 23.4 23.5 23.6 23.7 23.8 23.9 24 24.1 24.2 24.3
Frequency (GHz)
Pow
er (d
Bm
)
Avg Power Max Power Min Power
Figure B.61. Hartsfield-Jackson Airport (9/24/03): Sixty Degree Elevation, Spectral Analysis
187
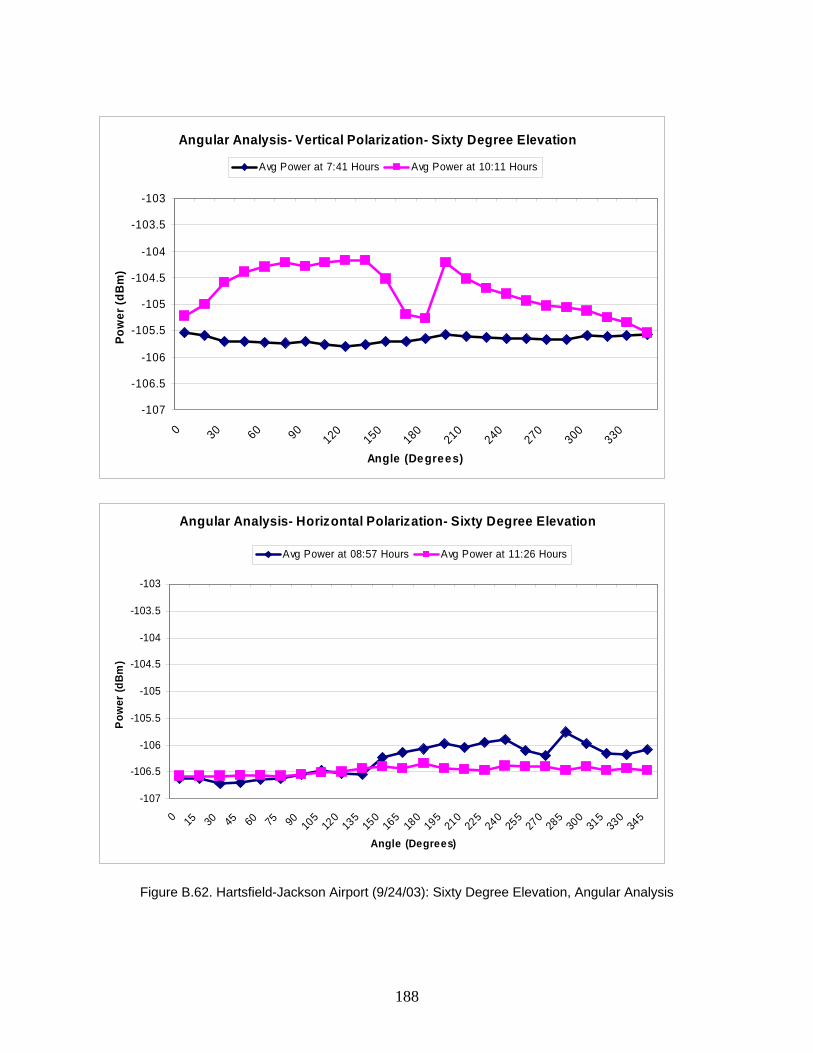
Angular Analysis- Vertical Polarization- Sixty Degree Elevation
-107
-106.5
-106
-105.5
-105
-104.5
-104
-103.5
-103
0 30 60 90120
150180
210240
270300
330
Angle (Degrees)
Pow
er (d
Bm
)
Avg Power at 7:41 Hours Avg Power at 10:11 Hours
Angular Analysis- Horizontal Polarization- Sixty Degree Elevation
-107
-106.5
-106
-105.5
-105
-104.5
-104
-103.5
-103
0 15 30 45 60 75 90 105
120
135
150
165
180
195
210
225
240
255
270
285
300
315
330
345
Angle (Degrees)
Pow
er (d
Bm)
Avg Power at 08:57 Hours Avg Power at 11:26 Hours
Figure B.62. Hartsfield-Jackson Airport (9/24/03): Sixty Degree Elevation, Angular Analysis
188

Temporal Analysis- Vertical Polarization
-115
-113
-111
-109
-107
-105
-103
-101
-99
-97
-95
7.75 10.25
Time (Hours)
Pow
er (d
Bm
)
Avg Power Max Power Min Power
Temporal Analysis- Horizontal Polarization
-115
-113
-111
-109
-107
-105
-103
-101
-99
-97
-95
9 11.5
Time (Hours)
Pow
er (d
Bm
)
Avg Power Max Power Min Power
Figure B.63. Hartsfield-Jackson Airport (9/24/03): Sixty Degree Elevation, Temporal Analysis
189

Statistical Analysis
-13
-8
-3
2
7
12
0.01 0.1 1 10 100
Percentile Exceeding Ordinate
dB a
bove
mea
n
Measured APD Thoeretical APD
Figure B.64. Hartsfield-Jackson Airport (9/24/03): Sixty Degree Elevation, Statistical Analysis
190

Vertical Polarization
-114
-112
-110
-108
-106
-104
-102
-100
-98
23.3 23.4 23.5 23.6 23.7 23.8 23.9 24 24.1 24.2 24.3
Frequency (GHz)
Pow
er (d
Bm
)
Avg Power Max Power Min Power
Horizontal Polarization
-114
-112
-110
-108
-106
-104
-102
-100
-98
23.3 23.4 23.5 23.6 23.7 23.8 23.9 24 24.1 24.2 24.3
Freuency (GHz)
Pow
er (d
Bm
)
Avg Power Max Power Min Power
Figure B.65. Hartsfield-Jackson Airport (9/24/03): Ninety Degree Elevation, Spectral Analysis
191

Temporal Analysis- Vertical Polarization-Ninety Degree Elevation
-112
-110
-108
-106
-104
-102
-100
-98
8 10.5
Time (Hours)
Pow
er (d
Bm
)
Avg Power Max Power Min Power
Temporal Analysis- Horizontal Polarization-Ninety Degree Elevation
-112
-110
-108
-106
-104
-102
-100
-98
9.25 11.75
Time (Hours)
Pow
er (d
Bm
)
Avg Power Max Power Min Power
Figure B.66. Hartsfield-Jackson Airport (9/24/03): Ninety Degree Elevation, Temporal Analysis
192

Statistical Analysis
-10
-5
0
5
10
15
20
0.01 0.1 1 10 100
Percentile Exceeding Ordinate
dB a
bove
mea
n
Measured APD Theoretical APD
Figure B.67. Hartsfield-Jackson Airport (9/24/03): Ninety Degree Elevation, Statistical Analysis
193

(This page was left intentionally blank)
194

Appendix B.5: Hartsfield-Jackson Airport, Atlanta, Georgia (Site 4 Revisited) Date: 10/22/03 Map of Location: See Figure B.68 Noteworthy Results
• Because of the shortened day due to the cable break, this site was repeated. Operating protocol (accompaniment by a paid escort) for measurement on the Airport grounds forced us to leave the system unattended for a period of an hour at noon. This unmonitored period contributed to the cable failure which might have been avoided if an attendant had been present. Consequently, this second set of measurements was performed from the roof of the Renaissance Hotel immediately outside airport limits near the original site.
• Spectral trends: Uniform in frequency within 2 dB. See Figures B. 69, B.72, B.75, and B. 78. • Angular trends: Uniform in angle within 2 dB, with the exception of lower power levels which
occur in the direction of a building in close proximity of the measurement. See Figures B.70, B.73, and B.76.
• Temporal trends: Uniform in time within 2 dB See Figures B.71, B.74, B.77, and B.79. • Pre-measurement calibrated gain: 43.1 dB: Post-measurement gain: 42.9 dB.
*
Figure B.68 Map of second Hartsfield-Jackson Airport
(Asterisk denotes control tower)
195

Vertical Polarization
-103
-101
-99
-97
-95
-93
-91
-89
-87
-85
23.3 23.4 23.5 23.6 23.7 23.8 23.9 24 24.1 24.2 24.3
Frequency (GHz)
Pow
er (d
Bm
)
Avg Power Max Power Min Power
Horizontal Polarization
-103
-101
-99
-97
-95
-93
-91
-89
-87
-85
23.3 23.4 23.5 23.6 23.7 23.8 23.9 24 24.1 24.2 24.3
Frequency (GHz)
Pow
er (d
Bm
)
Avg Power Max Power Min Power
Figure B.69. Hartsfield-Jackson Airport(10/22/03): Zero Degree Elevation, Spectral Analysis
196

Vertical Polarization
-97-96.5
-96-95.5
-95-94.5
-94-93.5
-93-92.5
-92-91.5
-91-90.5
-90
0 15 30 45 60 75 90 105 120 135 150 165 180 195 210 225 240 255 270 285 300 315 330 345
Frequency (GHz)
Pow
er (d
Bm)
Avg Power at 12:46 Hours Avg Power at 15:13 HoursAvg Power at 17:41Hours Avg Power at 21:37 Hours
Horizontal Polarization
-97-96.5
-96-95.5
-95-94.5
-94-93.5
-93-92.5
-92-91.5
-91-90.5
-90
0 15 30 45 60 75 90 105 120 135 150 165 180 195 210 225 240 255 270 285 300 315 330 345
Angle ( Degrees)
Pow
er (d
Bm)
Avg Power at 11:31 Hours Avg Power at 14:00 Hours Avg Power at 16:26 HoursAvg Power at 18:57 Hours Avg Power at 21:54 Hours
Figure B.70. Hartsfield-Jackson Airport (10/22/03): Zero Degree Elevation, Angular Analysis
197

Vertical Polarization
-105
-103
-101
-99
-97
-95
-93
-91
-89
-87
-85
12.75 15.25 17.75 20.5
Time (Hours)
Pow
er (d
Bm)
Avg Power Max Power Min Power
Horizontal Polarization
-105
-103
-101
-99
-97
-95
-93
-91
-89
-87
-85
11.5 14 16.5 19 22
Time (Hours)
Pow
er (d
Bm
)
Avg Power Max Power Min Power
Figure B.71. Hartsfield-Jackson Airport (10/22/03): Zero Degree Elevation, Temporal Analysis
198

Vertical Polarization
-105
-103
-101
-99
-97
-95
-93
-91
-89
-87
-85
23.3 23.4 23.5 23.6 23.7 23.8 23.9 24 24.1 24.2 24.3
Frequency (GHz)
Pow
er (d
Bm
)
Avg Power Max Power Min Power
Horizontal Polarization
-105
-103
-101
-99
-97
-95
-93
-91
-89
-87
-85
23.3 23.4 23.5 23.6 23.7 23.8 23.9 24 24.1 24.2 24.3
Frequency (GHz)
Pow
er (d
Bm
)
Avg Power Max Power Min Power
Figure B.72. Hartsfield-Jackson Airport(10/22/03): Thirty Degree Elevation, Spectral Analysis
199

Vertical Polarization
-100-99.5
-99-98.5
-98-97.5
-97-96.5
-96-95.5
-95-94.5
-94-93.5
-93-92.5
-92
0 15 30 45 60 75 90 105 120 135 150 165 180 195 210 225 240 255 270 285 300 315 330 345
Angle (Degrees)
Pow
er (d
Bm
)
Avg Power at 13:08 Hours Avg Power at 15:35 HoursAvg Power at 18:02 Hours Avg Power at 20:59 Hours
Horizontal Polarization
-100-99.5
-99-98.5
-98-97.5
-97-96.5
-96-95.5
-95-94.5
-94-93.5
-93-92.5
-92
0 15 30 45 60 75 90 105 120 135 150 165 180 195 210 225 240 255 270 285 300 315 330 345
Angle ( Degrees)
Pow
er (d
Bm)
Avg Power at 11:53 Hours Avg Power at 14:22 Hours Avg Power at 16:48 HoursAvg Power at 19:19 Hours Avg Power at 22:16 Hours
Figure B.73. Hartsfield-Jackson Airport (10/22/03): Thirty Degree Elevation, Angular Analysis
200

Vertical Polarization
-105
-103
-101
-99
-97
-95
-93
-91
-89
-87
-85
13 15.5 18 21
Time (Hours)
Pow
er (d
Bm
)
Avg Power Max Power Min Power
Horizontal Polarization
-105
-103
-101
-99
-97
-95
-93
-91
-89
-87
-85
12 14.5 16.75 19.25 22.25
Time (Hours)
Pow
er (d
Bm
)
Avg Power Max Power Min Power
Figure B.74. Hartsfield-Jackson Airport (10/22/03): Thirty Degree Elevation, Temporal Analysis
201
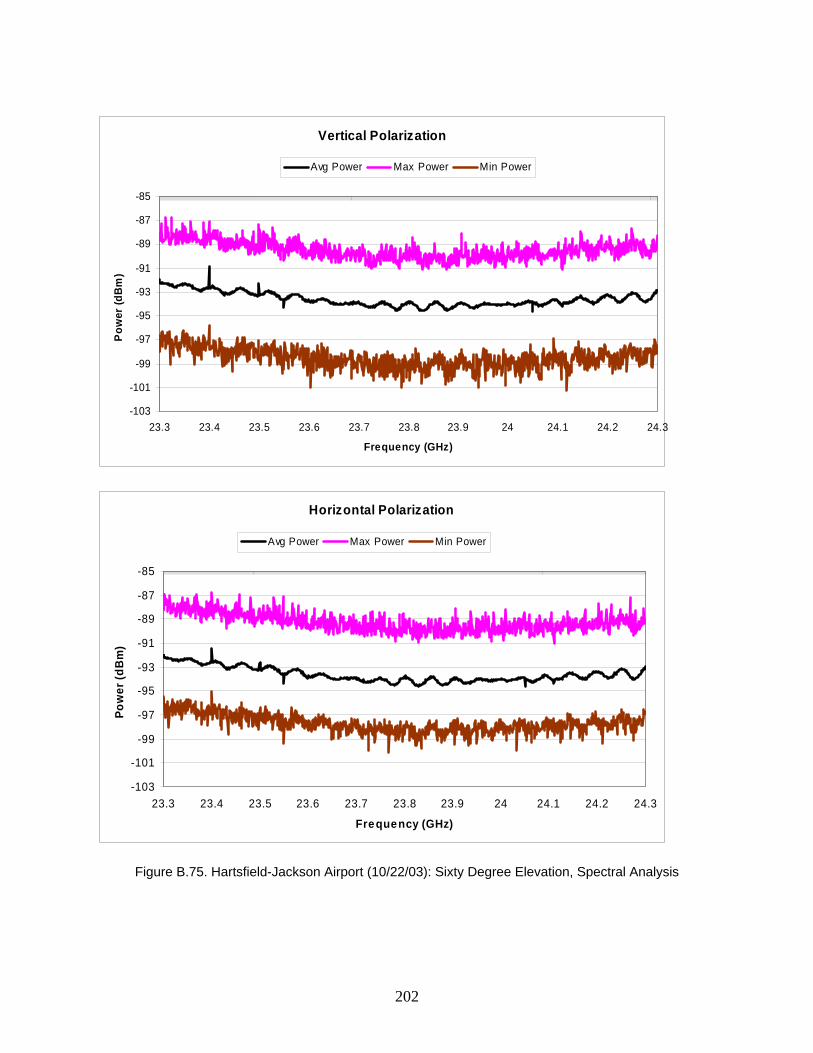
Vertical Polarization
-103
-101
-99
-97
-95
-93
-91
-89
-87
-85
23.3 23.4 23.5 23.6 23.7 23.8 23.9 24 24.1 24.2 24.3
Frequency (GHz)
Pow
er (d
Bm
)
Avg Power Max Power Min Power
Horizontal Polarization
-103
-101
-99
-97
-95
-93
-91
-89
-87
-85
23.3 23.4 23.5 23.6 23.7 23.8 23.9 24 24.1 24.2 24.3
Frequency (GHz)
Pow
er (d
Bm
)
Avg Power Max Power Min Power
Figure B.75. Hartsfield-Jackson Airport (10/22/03): Sixty Degree Elevation, Spectral Analysis
202

Vertical Polarization
-97
-96.5
-96
-95.5
-95
-94.5
-94
-93.5
-93
-92.5
-92
0 15 30 45 60 75 90 105 120 135 150 165 180 195 210 225 240 255 270 285 300 315 330 345Angle (Degrees)
Pow
er (d
Bm)
Avg Power at 13:30 Hours Avg Power at 15:57 HoursAvg Power at 18:24 Hours Avg Power at 21:21 Hours
Horizontal Polarization
-97-96.5
-96-95.5
-95-94.5
-94-93.5
-93
-92.5-92
0 15 30 45 60 75 90105
120135
150165
180195
210225
240255
270285
300315
330345
Angle ( Degrees)
Pow
er (d
Bm
)
Avg Power at 12:15 Hours Avg Power at 14:43 Hours Avg Power at 17:09 HoursAvg Power at 19:41 Hours Avg Power at 22:38 Hours
Figure B.76. Hartsfield-Jackson Airport (10/22/03): Sixty Degree Elevation, Angular Analysis
203
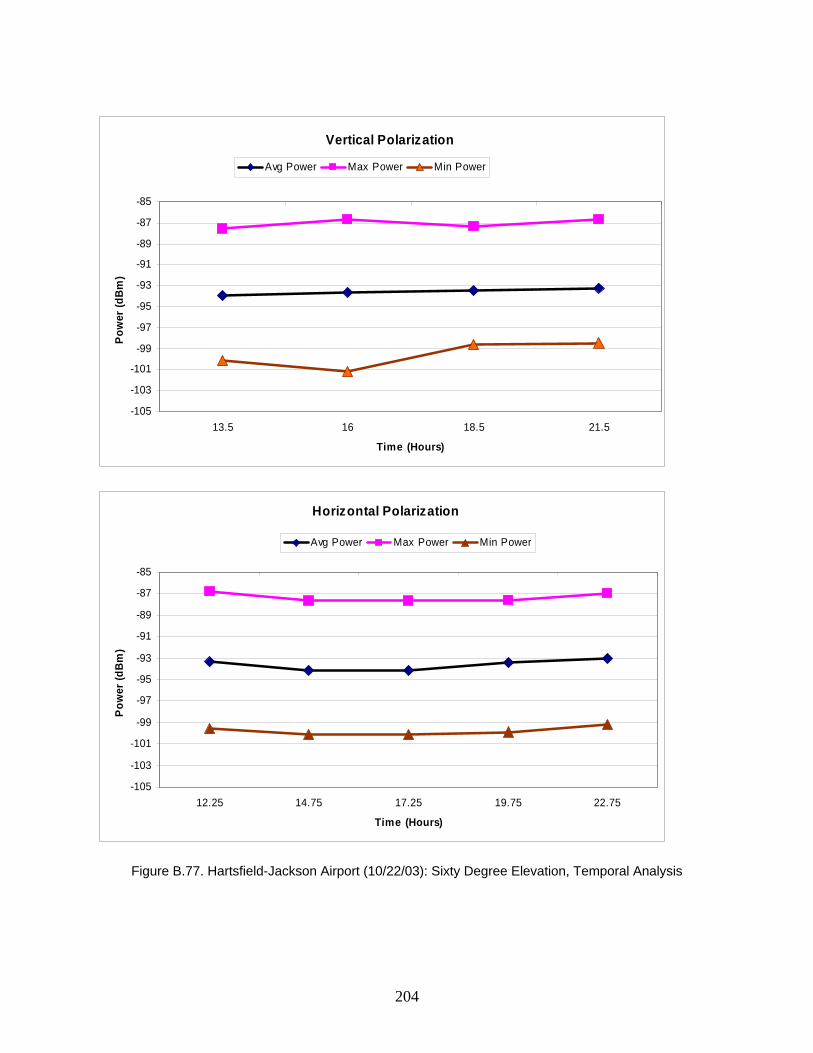
Vertical Polarization
-105
-103
-101
-99
-97
-95
-93
-91
-89
-87
-85
13.5 16 18.5 21.5
Time (Hours)
Pow
er (d
Bm
)
Avg Power Max Power Min Power
Horizontal Polarization
-105
-103
-101
-99
-97
-95
-93
-91
-89
-87
-85
12.25 14.75 17.25 19.75 22.75
Time (Hours)
Pow
er (d
Bm
)
Avg Power Max Power Min Power
Figure B.77. Hartsfield-Jackson Airport (10/22/03): Sixty Degree Elevation, Temporal Analysis
204
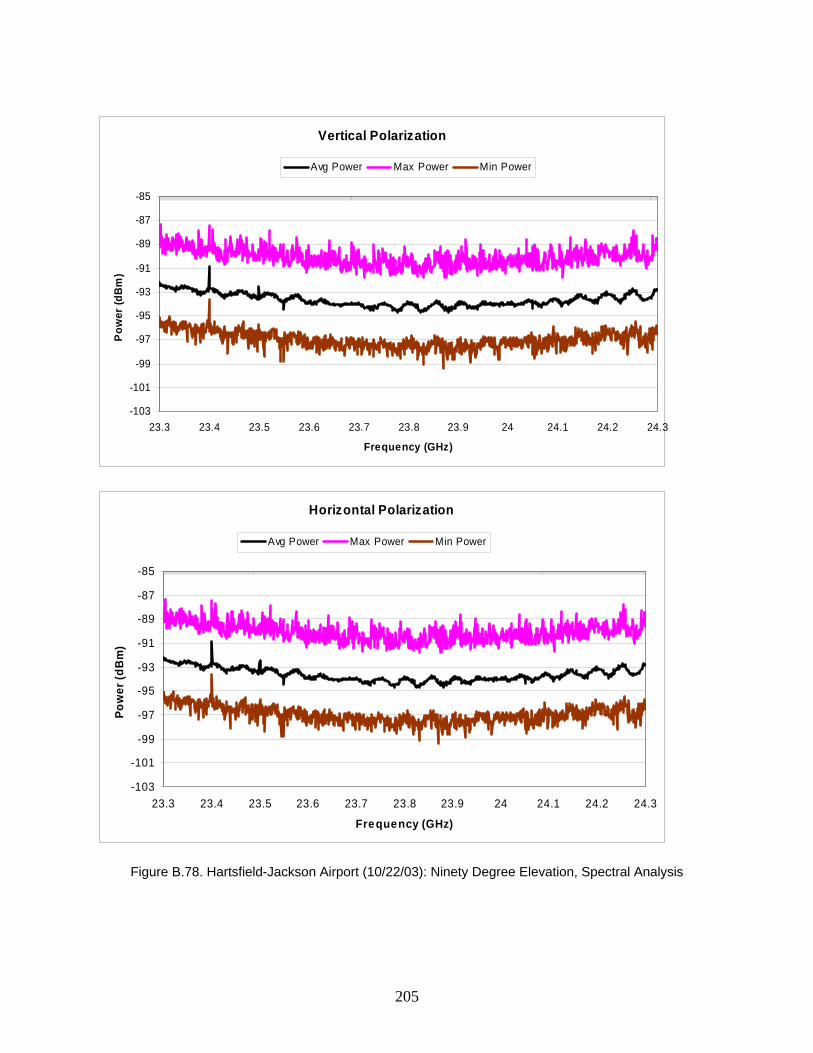
Vertical Polarization
-103
-101
-99
-97
-95
-93
-91
-89
-87
-85
23.3 23.4 23.5 23.6 23.7 23.8 23.9 24 24.1 24.2 24.3
Frequency (GHz)
Pow
er (d
Bm
)
Avg Power Max Power Min Power
Horizontal Polarization
-103
-101
-99
-97
-95
-93
-91
-89
-87
-85
23.3 23.4 23.5 23.6 23.7 23.8 23.9 24 24.1 24.2 24.3
Frequency (GHz)
Pow
er (d
Bm
)
Avg Power Max Power Min Power
Figure B.78. Hartsfield-Jackson Airport (10/22/03): Ninety Degree Elevation, Spectral Analysis
205

Vertical Polarization
-105
-103
-101
-99
-97
-95
-93
-91
-89
-87
-85
14 16 18.75 21.75
Time (Hours)
Pow
er (d
Bm)
Avg Power Max Power Min Power
Horizontal Polarization
-105
-103
-101
-99
-97
-95
-93
-91
-89
-87
-85
12.5 15 17.5 20 23
Time (Hours)
Pow
er (d
Bm
)
Avg Power Max Power MinPower
Figure B.79. Hartsfield-Jackson Airport (10/22/03): Ninety Degree Elevation, Temporal Analysis
206

Appendix B.6: Interstate 85 rest area, Anderson, South Carolina (Site 5)
Date: 4/16/04 Map of Location: See Figure B.80 Noteworthy Results:
• Spectral trends: In general, uniform in frequency; spectral peaks at 23.371 GHz, 23.559 GHz, 23.561 GHz, 23.576 GHz, 23.947 GHz, 23.999 GHz, 24.14 GHz. See Figures B.81, B.83, B.85, B.87, B.89, B.91 and B.93.
• Angular trends: Manmade peaks seem to occur in direction of interstate traffic. See Figures B.82, B.86, andB.90.
• Temporal trends: Increases throughout the day; peak occurs in the early evening. See Figures B.84, B.88, B.92, and B.94.
• An anomalous feature of resonance at 23.40 GHz appears in this data set. • Pre-measurement calibrated gain: 41.3 dB; Post-measurement calibrated gain: 45.3 dB. The
discrepancy is due to the absence of the resonances in the post-measurement calibration. It has been verified that these resonances were present the entire day of measurements.
Figure B.80. Map of Interstate 85 in Anderson, South Carolina
207

Vertical Polarization
-120
-110
-100
-90
-80
-70
-60
23.3 23.4 23.5 23.6 23.7 23.8 23.9 24 24.1 24.2 24.3
Frequency (GHz)
Pow
er (d
Bm
)
Avg Power Max Power Min Power
Horizontal Polarization
-110
-105
-100
-95
-90
-85
-80
23.3 23.4 23.5 23.6 23.7 23.8 23.9 24 24.1 24.2 24.3
Frequency (GHz)
Pow
er (d
Bm
)
Avg Power Max Power Min Power
Figure B.81. I-85 Anderson: Zero Degree Elevation, Spectral Analysis
208

Vertical Polarization
-110
-105
-100
-95
-90
-85
-80
0 30 60 90120 150 180 210 240 270 300 330
Angle ( Degrees)
Pow
er (d
Bm
)
Data at 8.3 hours 10.9 hours 13.4 hours
15.8 hours 18.2 hours 20.6 hours
Horizontal Polarization
-100
-98
-96
-94
-92
-90
-88
-86
-84
0 30 60 90120 150 180 210 240 270 300 330
Frequency (GHz)
Pow
er (d
Bm
)
Data at 9.7 hours 12.2 hours 14.6 hours
17 hours 19.4 hours 21.8 hours
Figure B.82. I-85 Anderson: Zero Degree Elevation, Angular Analysis
209
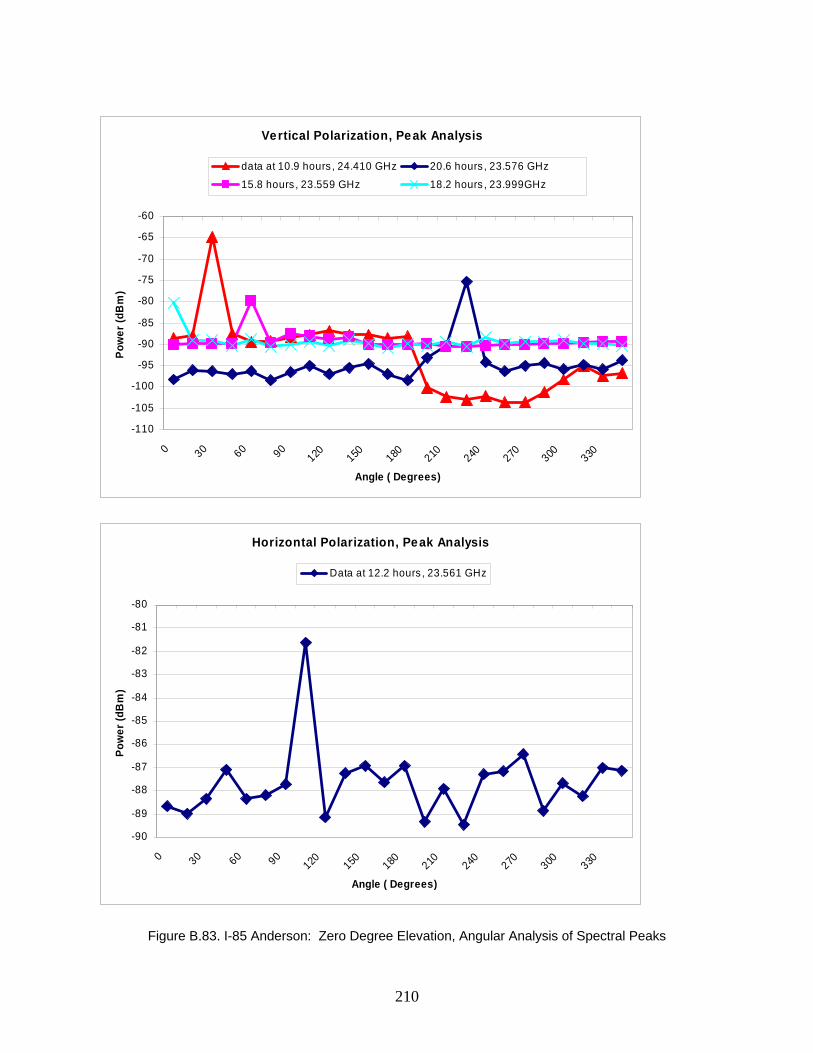
Vertical Polarization, Peak Analysis
-110
-105
-100
-95
-90
-85
-80
-75
-70
-65
-60
0 30 60 90120 150 180 210 240 270 300 330
Angle ( Degrees)
Pow
er (d
Bm
)
data at 10.9 hours , 24.410 GHz 20.6 hours , 23.576 GHz15.8 hours , 23.559 GHz 18.2 hours , 23.999GHz
Horizontal Polarization, Peak Analysis
-90
-89
-88
-87
-86
-85
-84
-83
-82
-81
-80
0 30 60 90120 150 180 210 240 270 300 330
Angle ( Degrees)
Pow
er (d
Bm
)
Data at 12.2 hours , 23.561 GHz
Figure B.83. I-85 Anderson: Zero Degree Elevation, Angular Analysis of Spectral Peaks
210

Vertical Polarization
-120
-110
-100
-90
-80
-70
-60
8.3 10.9 13.4 15.8 18.2 20.6
Time (Hours)
Pow
er (d
Bm
)
Avg Power Max Power Min Power
Horizontal Polarization
-110
-105
-100
-95
-90
-85
-80
9.7 12.2 14.6 17 19.4 21.8
Time (Hours)
Pow
er (d
Bm)
Avg Power Max Power Min Power
Figure B.84. I-85 Anderson: Zero Degree Elevation, Temporal Analysis
211

Vertical Polarization
-115
-110
-105
-100
-95
-90
-85
-80
23.3 23.4 23.5 23.6 23.7 23.8 23.9 24 24.1 24.2 24.3
Frequency (GHz)
Pow
er (d
Bm
)
Avg Power Max Power Min Power
Horizontal Polarization
-110
-105
-100
-95
-90
-85
-80
23.3 23.4 23.5 23.6 23.7 23.8 23.9 24 24.1 24.2 24.3
Frequency (GHz)
Pow
er (d
Bm
)
Avg Power Max Power Min Power
Figure B.85. I-85 Anderson: Thirty Degree Elevation, Spectral Analysis
212

Vertical Polarization
-110
-105
-100
-95
-90
-85
-80
0 30 60 90120 150 180 210 240 270 300 330
Angle ( Degrees)
Pow
er (d
Bm
)
Data at 8.7 hours 11.4 hours 13.8 hours 16.2 hours 18.6 hours 21 hours
Horizontal Polarization
-104
-102
-100
-98
-96
-94
-92
-90
-88
-86
-84
0 30 60 90120 150 180 210 240 270 300 330
Frequency (GHz)
Pow
er (d
Bm
)
Data at 10 hours 12.5 hours 15 hours 17.4 hours 19.8 hours 22.2 hours
Figure B.86. I-85 Anderson: Thirty Degree Elevation, Angular Analysis
213
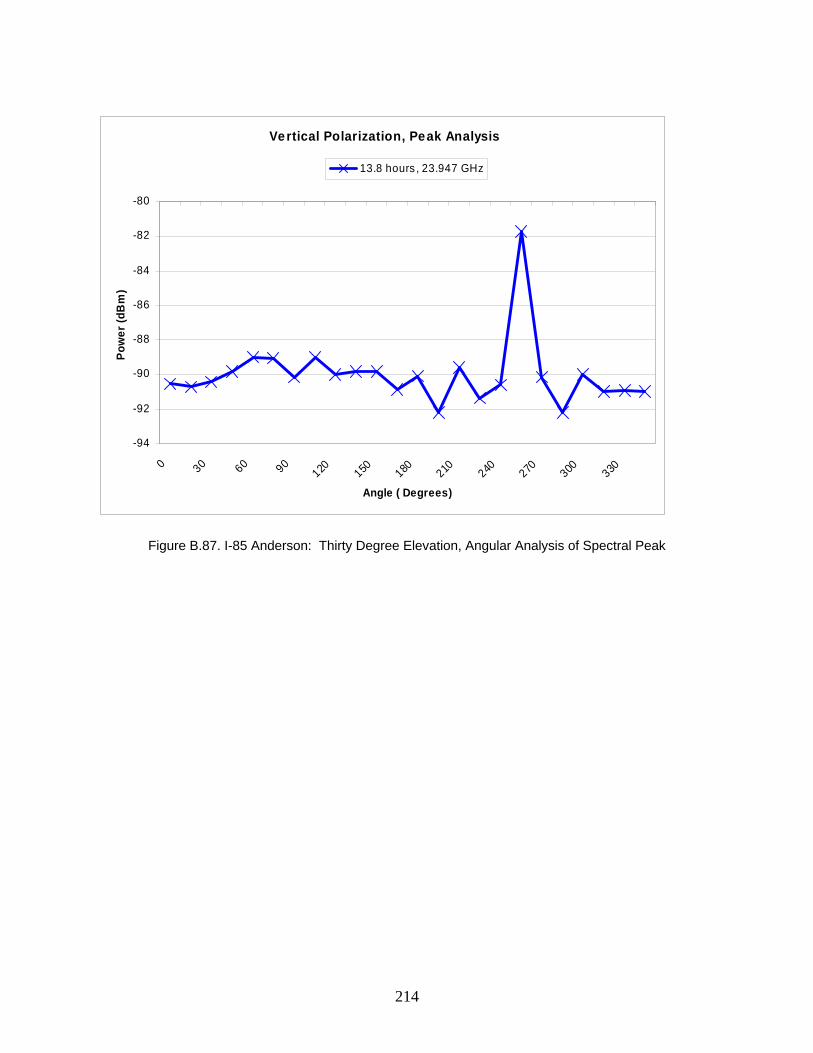
Vertical Polarization, Peak Analysis
-94
-92
-90
-88
-86
-84
-82
-80
0 30 60 90120 150 180 210 240 270 300 330
Angle ( Degrees)
Pow
er (d
Bm
)
13.8 hours , 23.947 GHz
Figure B.87. I-85 Anderson: Thirty Degree Elevation, Angular Analysis of Spectral Peak
214

Vertical Polarization
-115
-110
-105
-100
-95
-90
-85
-80
8.7 11.4 13.8 16.2 18.6 21
Time (Hours)
Pow
er (d
Bm
)
Avg Power Max Power Min Power
Horizontal Polarization
-110
-105
-100
-95
-90
-85
-80
10 12.5 15 17.4 19.8 22.2
Time (Hours)
Pow
er (d
Bm)
Avg Power Max Power Min Power
Figure B.88. I-85 Anderson: Thirty Degree Elevation, Temporal Analysis
215

Vertical Polarization
-115
-110
-105
-100
-95
-90
-85
-80
23.3 23.4 23.5 23.6 23.7 23.8 23.9 24 24.1 24.2 24.3
Frequency (GHz)
Pow
er (d
Bm
)
Avg Power Max Power Min Power
Horizontal Polarization
-110
-105
-100
-95
-90
-85
-80
23.3 23.4 23.5 23.6 23.7 23.8 23.9 24 24.1 24.2 24.3
Frequency (GHz)
Pow
er (d
Bm
)
Avg Power Max Power Min Power
Figure B.89. I-85 Anderson: Sixty Degree Elevation, Spectral Analysis
216

Vertical Polarization
-110
-105
-100
-95
-90
-85
-80
0 15 30 45 60 75 90105 120 135 150 165 180 195 210 225 240 255 270 285 300 315 330 345
Angle ( Degrees)
Pow
er (d
Bm
)
Data at 9.1 hours 11.7 hours 14.2 hours 16.5 hours 18.9 hours 21.3 hours
Horizontal Polarization
-104
-102
-100
-98
-96
-94
-92
-90
-88
-86
-84
0 15 30 45 60 75 90105 120 135 150 165 180 195 210 225 240 255 270 285 300 315 330 345
Frequency (GHz)
Pow
er (d
Bm
)
Data at 10.4 hours 12.9 hours 15.4 hours17.7 hours 20.1 hours 22.5 hours
Figure B.90. I-85 Anderson: Sixty Degree Elevation, Angular Analysis
217
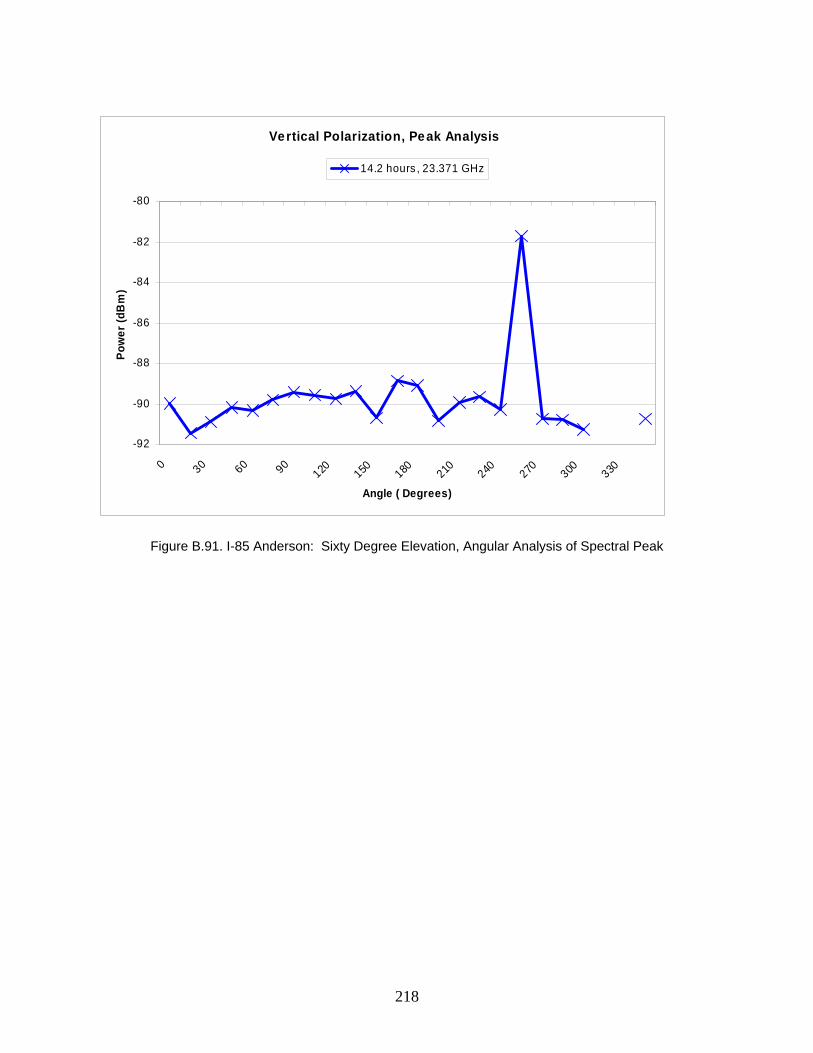
Vertical Polarization, Peak Analysis
-92
-90
-88
-86
-84
-82
-80
0 30 60 90120 150 180 210 240 270 300 330
Angle ( Degrees)
Pow
er (d
Bm
)
14.2 hours , 23.371 GHz
Figure B.91. I-85 Anderson: Sixty Degree Elevation, Angular Analysis of Spectral Peak
218

Vertical Polarization
-120
-110
-100
-90
-80
-70
-60
9.1 11.7 14.2 16.5 18.9 21.3
Time (Hours)
Pow
er (d
Bm
)
Avg Power Max Power Min Power
Horizontal Polarization
-110
-105
-100
-95
-90
-85
-80
10.4 12.9 15.4 17.7 20.1 22.5
Time (Hours)
Pow
er (d
Bm)
Avg Power Max Power Min Power
Figure B.92. I-85 Anderson: Sixty Degree Elevation, Temporal Analysis
219

Vertical Polarization
-110
-105
-100
-95
-90
-85
-80
23.3 23.4 23.5 23.6 23.7 23.8 23.9 24 24.1 24.2 24.3
Frequency (GHz)
Pow
er (d
Bm
)
Avg Power Max Power Min Power
Horizontal Polarization
-110
-105
-100
-95
-90
-85
-80
23.3 23.4 23.5 23.6 23.7 23.8 23.9 24 24.1 24.2 24.3
Frequency (GHz)
Pow
er (d
Bm
)
Avg Power Max Power Min Power
Figure B.93. I-85 Anderson: Ninety Degree Elevation, Spectral Analysis
220

Vertical Polarization
-110
-105
-100
-95
-90
-85
-80
9.1 11.7 14.2 16.5 18.9 21.3
Time (Hours)
Pow
er (d
Bm
)
Avg Power Max Power Min Power
Horizontal Polarization
-110
-105
-100
-95
-90
-85
-80
10.4 12.9 15.4 17.7 20.1 22.5
Time (Hours)
Pow
er (d
Bm)
Avg Power Max Power Min Power
Figure B.94. I-85 Anderson: Ninety Degree Elevation, Temporal Analysis
221

(This page was left intentionally blank)
222
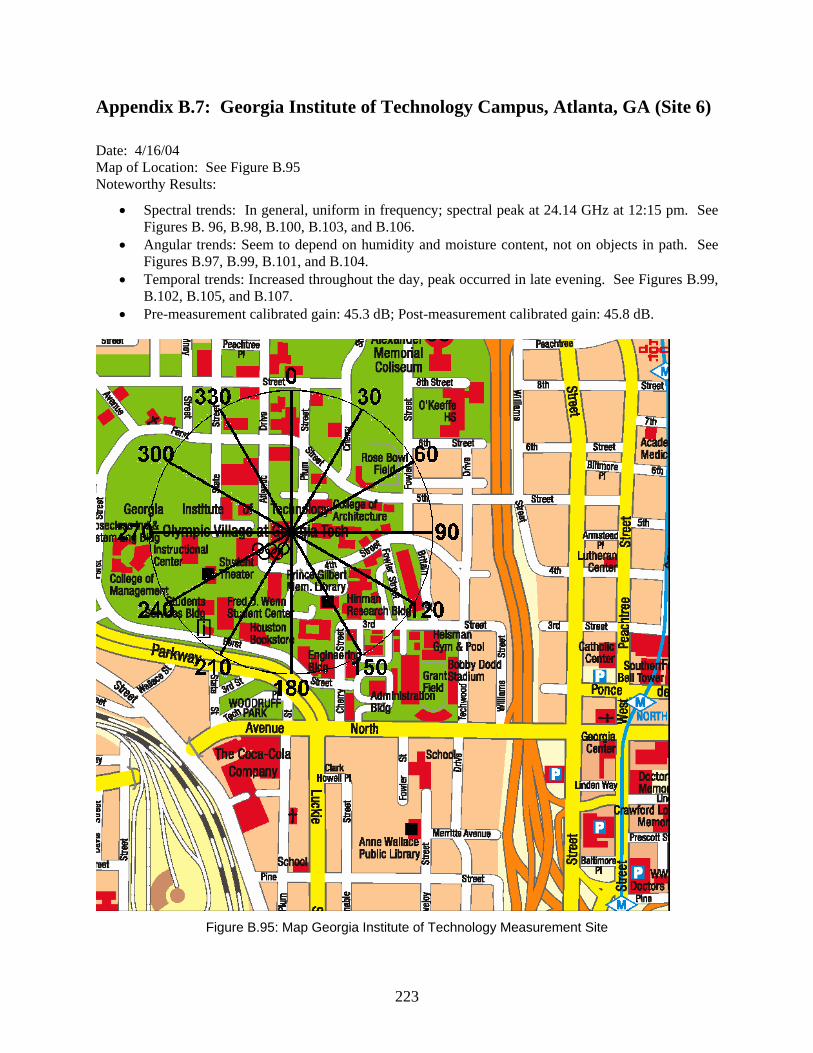
Appendix B.7: Georgia Institute of Technology Campus, Atlanta, GA (Site 6)
Date: 4/16/04 Map of Location: See Figure B.95 Noteworthy Results:
• Spectral trends: In general, uniform in frequency; spectral peak at 24.14 GHz at 12:15 pm. See Figures B. 96, B.98, B.100, B.103, and B.106.
• Angular trends: Seem to depend on humidity and moisture content, not on objects in path. See Figures B.97, B.99, B.101, and B.104.
• Temporal trends: Increased throughout the day, peak occurred in late evening. See Figures B.99, B.102, B.105, and B.107.
• Pre-measurement calibrated gain: 45.3 dB; Post-measurement calibrated gain: 45.8 dB.
Figure B.95: Map Georgia Institute of Technology Measurement Site
223

Vertical Polarization
-120
-115
-110
-105
-100
-95
-90
-85
-80
23.3 23.4 23.5 23.6 23.7 23.8 23.9 24 24.1 24.2 24.3
Frequency (GHz)
Pow
er (d
Bm
)
Avg Power Max Power Min Power
Horizontal Polarization
-120
-115
-110
-105
-100
-95
-90
-85
-80
23.3 23.4 23.5 23.6 23.7 23.8 23.9 24 24.1 24.2 24.3
Frequency (GHz)
Pow
er (d
Bm
)
Avg Power Max Power Min Power
Figure B.96. Georgia Institute of Technology: Zero Degree Elevation, Spectral Analysis
224

Vertical Polarization
-115
-110
-105
-100
-95
-90
-85
0 30 60 90120 150 180 210 240 270 300 330
Angle ( Degrees)
Pow
er (d
Bm
)
Data at 7.2 hours 9.7 hours 12.2 hours
14.8 hours 17.3 hours 19.7 hours
Horizontal Polarization
-115
-110
-105
-100
-95
-90
-85
0 30 60 90120 150 180 210 240 270 300 330
Frequency (GHz)
Pow
er (d
Bm
)
Data at 8.5 hours 11 hours 13.5 hours
16.1 hours 18.5 hours 21.1 hours
Figure B.97. Georgia Institute of Technology: Zero Degree Elevation, Angular Analysis
225
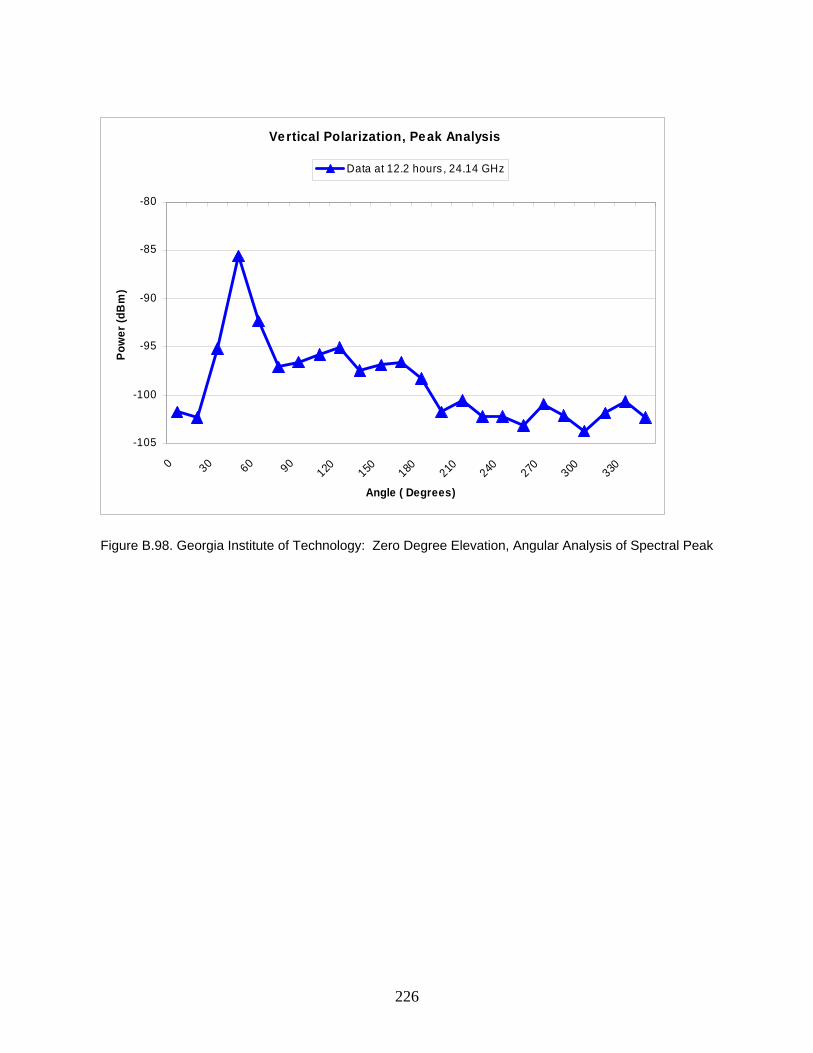
Vertical Polarization, Peak Analysis
-105
-100
-95
-90
-85
-80
0 30 60 90120 150 180 210 240 270 300 330
Angle ( Degrees)
Pow
er (d
Bm
)
Data at 12.2 hours , 24.14 GHz
Figure B.98. Georgia Institute of Technology: Zero Degree Elevation, Angular Analysis of Spectral Peak
226

Vertical Polarization
-120
-115
-110
-105
-100
-95
-90
-85
-80
7.2 9.7 12.2 14.8 17.3 19.7
Time (Hours)
Pow
er (d
Bm
)
Series1 Series2 Series3
Horizontal Polarization
-120
-115
-110
-105
-100
-95
-90
-85
-80
8.5 11 13.5 16.1 18.5 21.1
Time (Hours)
Pow
er (d
Bm)
Avg Power Max Power Min Power
Figure B.99. Georgia Institute of Technology: Zero Degree Elevation, Temporal Analysis
227

Vertical Polarization
-120
-115
-110
-105
-100
-95
-90
-85
-80
23.3 23.4 23.5 23.6 23.7 23.8 23.9 24 24.1 24.2 24.3
Frequency (GHz)
Pow
er (d
Bm
)
Avg Power Max Power Min Power
Horizontal Polarization
-120
-115
-110
-105
-100
-95
-90
-85
-80
23.3 23.4 23.5 23.6 23.7 23.8 23.9 24 24.1 24.2 24.3
Frequency (GHz)
Pow
er (d
Bm
)
Avg Power Max Power Min Power
Figure B.100. Georgia Institute of Technology: Thirty Degree Elevation, Spectral Analysis
228

Vertical Polarization
-115
-110
-105
-100
-95
-90
-85
0 15 30 45 60 75 90105 120 135 150 165 180 195 210 225 240 255 270 285 300 315 330 345
Angle ( Degrees)
Pow
er (d
Bm
)
Data at 7.5 hours 10 hours 12.5 hours 15.1 hours 17.6 hours 20 hours
Horizontal Polarization
-115
-110
-105
-100
-95
-90
-85
0 15 30 45 60 75 90105 120 135 150 165 180 195 210 225 240 255 270 285 300 315 330 345
Frequency (GHz)
Pow
er (d
Bm
)
Data at 8.8 hours 11.3 hours 13.8 hours 16.4 hours 18.8 hours 21.4 hours
Figure B.101. Georgia Institute of Technology: Thirty Degree Elevation, Angular Analysis
229
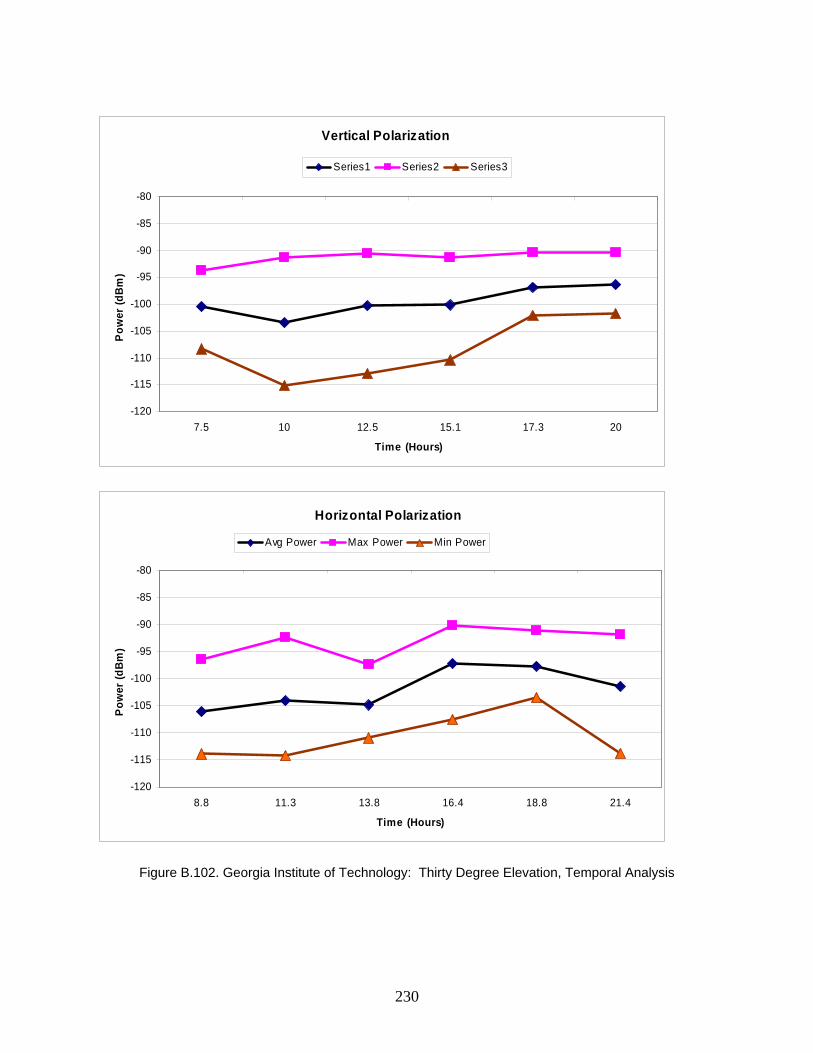
Vertical Polarization
-120
-115
-110
-105
-100
-95
-90
-85
-80
7.5 10 12.5 15.1 17.3 20
Time (Hours)
Pow
er (d
Bm
)
Series1 Series2 Series3
Horizontal Polarization
-120
-115
-110
-105
-100
-95
-90
-85
-80
8.8 11.3 13.8 16.4 18.8 21.4
Time (Hours)
Pow
er (d
Bm)
Avg Power Max Power Min Power
Figure B.102. Georgia Institute of Technology: Thirty Degree Elevation, Temporal Analysis
230

Vertical Polarization
-120
-115
-110
-105
-100
-95
-90
-85
-80
23.3 23.4 23.5 23.6 23.7 23.8 23.9 24 24.1 24.2 24.3
Frequency (GHz)
Pow
er (d
Bm
)
Avg Power Max Power Min Power
Horizontal Polarization
-120
-115
-110
-105
-100
-95
-90
-85
-80
23.3 23.4 23.5 23.6 23.7 23.8 23.9 24 24.1 24.2 24.3
Frequency (GHz)
Pow
er (d
Bm
)
Avg Power Max Power Min Power
Figure B.103. Georgia Institute of Technology: Sixty Degree Elevation, Spectral Analysis
231

Vertical Polarization
-115
-110
-105
-100
-95
-90
-85
0 30 60 90120 150 180 210 240 270 300 330
Angle ( Degrees)
Pow
er (d
Bm
)
Data at 7.9 hours 10.4 hours 12.9 hours 15.5 hours 18 hours 20.4 hours
Horizontal Polarization
-115
-110
-105
-100
-95
-90
-85
0 15 30 45 60 75 90105 120 135 150 165 180 195 210 225 240 255 270 285 300 315 330 345
Frequency (GHz)
Pow
er (d
Bm
)
Data at 9.2 hours 11.7 hours 14.2 hours
16.8 hours 19.2 hours 21.8 hours
Figure B.104. Georgia Institute of Technology: Sixty Degree Elevation, Angular Analysis
232
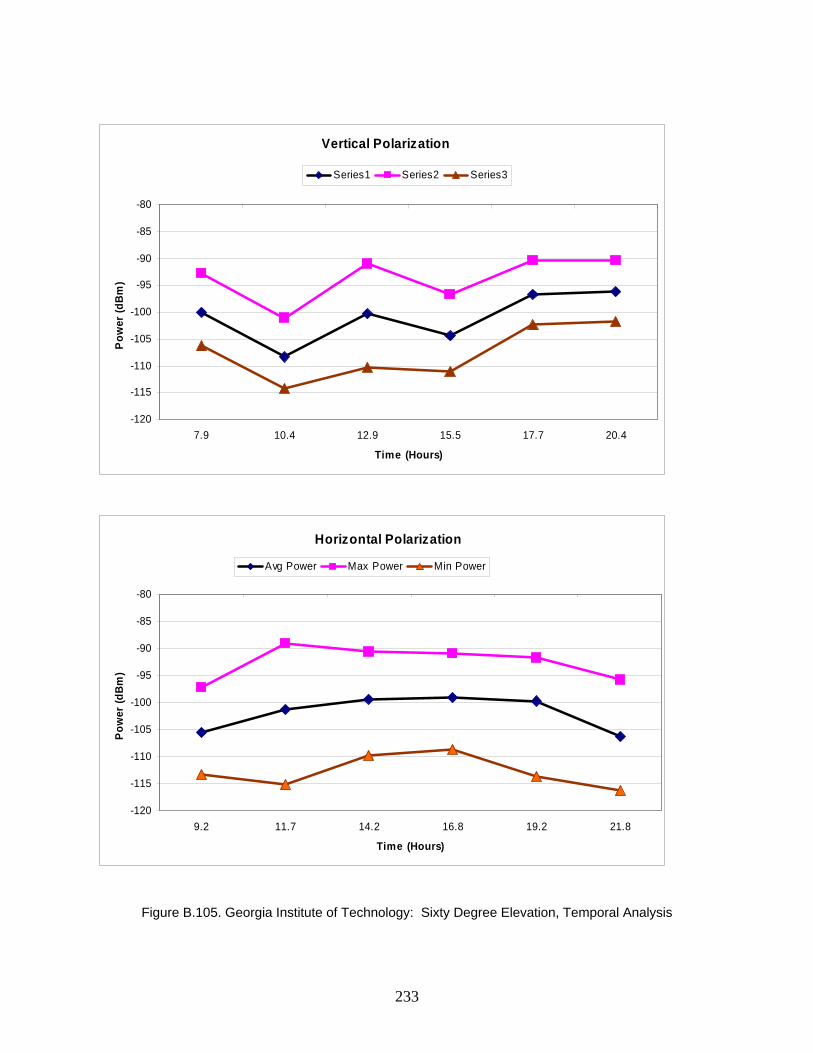
Vertical Polarization
-120
-115
-110
-105
-100
-95
-90
-85
-80
7.9 10.4 12.9 15.5 17.7 20.4
Time (Hours)
Pow
er (d
Bm
)
Series1 Series2 Series3
Horizontal Polarization
-120
-115
-110
-105
-100
-95
-90
-85
-80
9.2 11.7 14.2 16.8 19.2 21.8
Time (Hours)
Pow
er (d
Bm)
Avg Power Max Power Min Power
Figure B.105. Georgia Institute of Technology: Sixty Degree Elevation, Temporal Analysis
233

Vertical Polarization
-115
-110
-105
-100
-95
-90
-85
-80
23.3 23.4 23.5 23.6 23.7 23.8 23.9 24 24.1 24.2 24.3
Frequency (GHz)
Pow
er (d
Bm
)
Avg Power Max Power Min Power
Horizontal Polarization
-115
-110
-105
-100
-95
-90
-85
-80
23.3 23.4 23.5 23.6 23.7 23.8 23.9 24 24.1 24.2 24.3
Frequency (GHz)
Pow
er (d
Bm
)
Avg Power Max Power Min Power
Figure B.106. Georgia Institute of Technology: Ninety Degree Elevation, Spectral Analysis
234
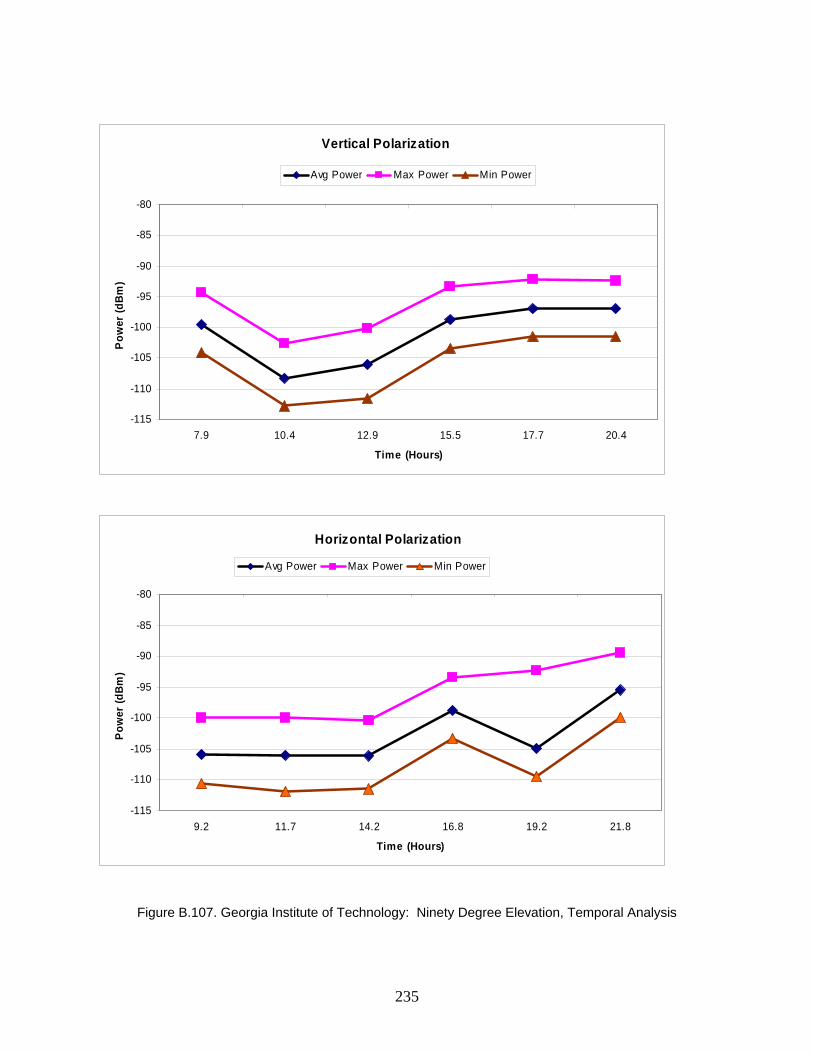
Vertical Polarization
-115
-110
-105
-100
-95
-90
-85
-80
7.9 10.4 12.9 15.5 17.7 20.4
Time (Hours)
Pow
er (d
Bm
)
Avg Power Max Power Min Power
Horizontal Polarization
-115
-110
-105
-100
-95
-90
-85
-80
9.2 11.7 14.2 16.8 19.2 21.8
Time (Hours)
Pow
er (d
Bm)
Avg Power Max Power Min Power
Figure B.107. Georgia Institute of Technology: Ninety Degree Elevation, Temporal Analysis
235

(This page was left intentionally blank)
236

References
1. FCC Technical Advisory Committee (TAC) Report: Third Meeting of the FCC Technological Advisory Council, at 1 and 8. December 1999.
2. Letter from Dr. Robert W. Lucky, TAC Chairman, to the Hon William E. Kennard, FCC Chairman, at 3. January 7, 2000.
3. “Noise Floor Measurements in the Passive Sensor Band (23.6 to 24 GHz) Final Report”. Clemson University, March 2004.
4. “L and S Bands Spectrum Survey in the San Francisco Bay Area”, GPS Laboratory, Stanford University, March 2004.
5. National Telecommunications and Information Administration (NTIA) Report 02-390, “Man-made interference Power Measurements at VHF and UHF Frequencies”, Dec. 2001
6. NTIA Report 99-367, “Broadband Spectrum Survey at San Francisco, California”, July 1999 7. NTIA Report 97-336, “Broadband Spectrum Survey at Los Angeles, California”, May 1997 8. NTIA Report 95-321, “Broadband Spectrum Survey at Denver, Colorado”, Sept. 1995 9. RTCA Special Committee-159, “Assessment of Radio Frequency Interference Relevant to the
GNSS, RTCA DO-235A”, Dec. 2002 10. Titus B., Dafesh P. , Wong W. , Maine K. , Stansell T. , “Assessing Ultra Wide Band (UWB)
Interference to GPS Receivers”, GPS-ION 2002, 15th International Technical Meeting of the Satellite Division of the Institute of Navigation, Portland, OR, Sept. 2002
11. American National Standard Institute (ANSI) C63. 4-2001, “American National Standard for Methods of Measurement of Radio-Noise Emissions from Low-Voltage Electrical and Electronic Equipment in the Range of 9 kHz to 40 GHz”, June 2001
12. ANSI T1.523-2001, American National Standard for Telecommunications - Telecom Glossary 2000.
13. First Report and Order Revision of Part 15 of the Commission’s Rules Regarding Ultra-Wideband Transmission Systems, Federal Communications Commission, Washington, February 14, 2002.
14. “Noise Floor Measurements in the L Band, S Band and Passive Sensor Band (23.6 to 24 GHz) Objectives, Test Plan, Calibration and Test Procedure,” Stanford University, Clemson University, August 22, 2003.
15. “Noise Figure Analyzers, NFA Series,” Agilent Technologies, Palo Alto, CA, May 2001.
237

(This page was left intentionally blank)
238

REPORT DOCUMENTATION PAGE Form Approved OMB No. 0704-0188
The public reporting burden for this collection of information is estimated to average 1 hour per response, including the time for reviewing instructions, searching existingdata sources, gathering and maintaining the data needed, and completing and reviewing the collection of information. Send comments regarding this burden estimate or any other aspect of this collection of information, including suggestions for reducing this burden, to Department of Defense, Washington Headquarters Services, Directorate for Information Operations and Reports (0704-0188), 1215 Jefferson Davis Highway, Suite 1204, Arlington, VA 22202-4302. Respondents should be aware that notwithstanding any other provision of law, no person shall be subject to any penalty for failing to comply with a collection of information if it does not display a currently valid OMB control number. PLEASE DO NOT RETURN YOUR FORM TO THE ABOVE ADDRESS. 1. REPORT DATE (DD-MM-YYYY) 2. REPORT TYPE 3. DATES COVERED (From - To)
4. TITLE AND SUBTITLE 5a. CONTRACT NUMBER
5b. GRANT NUMBER
5c. PROGRAM ELEMENT NUMBER
6. AUTHOR(S) 5d. PROJECT NUMBER
5e. TASK NUMBER
5f. WORK UNIT NUMBER
7. PERFORMING ORGANIZATION NAME(S) AND ADDRESS(ES) 8. PERFORMING ORGANIZATION REPORT NUMBER
9. SPONSORING/MONITORING AGENCY NAME(S) AND ADDRESS(ES) 10. SPONSORING/MONITOR'S ACRONYM(S)
11. SPONSORING/MONITORINGREPORT NUMBER
12. DISTRIBUTION/AVAILABILITY STATEMENT
13. SUPPLEMENTARY NOTES
14. ABSTRACT
15. SUBJECT TERMS
16. SECURITY CLASSIFICATION OF: 17. LIMITATION OF ABSTRACT
18. NUMBER OF PAGES
19a. NAME OF RESPONSIBLE PERSON
a. REPORT b. ABSTRACT c. THIS PAGE 19b. TELEPHONE NUMBER (Include area code)
Standard Form 298 (Rev. 8-98)Prescribed by ANSI Std. Z39-18