appelt, silvia: authorized generic entry prior to …pharma” seeks ways to limit profit erosion...
TRANSCRIPT

Appelt, Silvia:
Authorized Generic Entry prior to Patent Expiry:
Reassessing Incentives for Independent Generic Entry
Munich Discussion Paper No. 2010-23
Department of Economics
University of Munich
Volkswirtschaftliche Fakultät
Ludwig-Maximilians-Universität München
Online at https://doi.org/10.5282/ubm/epub.11476
Authorized Generic Entry prior to Patent Expiry:
Reassessing Incentives for Independent Generic Entry
Silvia Appelt∗
Munich Graduate School of Economics, University of Munich
April 2010
Abstract
Patent holders frequently attempt to mitigate the loss of monopoly power by au-thorizing generic entry prior to patent expiry (early entry). Competition in off-patentpharmaceutical markets may be adversely affected if early entry substantially impairsthe attractiveness of subsequent market entry. I examine generic entry decisions madein the course of recent patent expiries to quantify the impact of early entry on incentivesfor generic entry. Using unique micro data and accounting for the endogeneity of earlyentry, I estimate recursive bivariate probit models of entry. Drug markets’ pre-entryrevenues largely determine both independent generic entry and early entry decisions.Early entry in turn has no significant impact on the likelihood of generic entry. Originaldrug producers appear to authorize generic entry prior to loss of exclusivity primarilyfueled by rent-seeking rather than strategic entry-deterrence motives.
Keywords: Generic Entry, Early Entry, Anticompetitive Practices.JEL Classification Numbers: L41, I11, O34, C35.
∗Address: Kaulbachstr. 45, Room# 308, 80539 Munich, Germany, telephone: +49-89-2180-5761; Mailto: MGSE, Kaulbachstrasse 45, 80539 Munich, Germany; E-mail: [email protected] would like to thank seminar participants at the DRUID-DIME 2009 Winter Ph.D. Conference, at theCEPR 2009 Applied IO School, at the Annual CCC Conference 2009, at the EEA Annual Congress 2009,the EARIE Annual Conference 2009 and at the NBER Productivity Lunch Seminar (April 2010) for theirhelpful comments. I am deeply grateful to Dietmar Harhoff, Georg von Graevenitz, Joachim Winter, ErnstBerndt, Toke Reichstein and Georg Gebhardt for their advice and suggestions. Finally, I would like to thankInsight Health for providing data. All remaining errors are my own.
i

1 Introduction
As blockbuster drugs lose patent protection and drug pipelines have run dry, “Big
Pharma” seeks ways to limit profit erosion following generic entry.1 One increasingly com-
mon practice has become the introduction of a generic version of the original drug prior to
the loss of exclusivity – expiry of patent or supplementary protection certificate (SPC)2 –, ei-
ther through a subsidiary or licensee/supply partner (early entry). The increasing frequency
of early entry has raised policy concerns (FTC, 2002; EUC, 2008; FTC, 2009; EUC, 2009).
First-movers enjoy a sustainable competitive advantage over subsequent entrants (Caves
et al., 1991; Grabowski and Vernon, 1992; Hollis, 2002), and anticipated early entry may
reduce incentives for generic entry and put at risk drug expenditure savings. The prevailing
assumption is that generic firms anticipate early entry based on drug markets’ characteristics
and past experiences. A few empirical studies (Hollis, 2003; Reiffen and Ward, 2007; Berndt
et al., 2007a,b) investigate the impact of early entry – exogenously given – on generic entry,
arriving at different conclusions. Berndt et al. (2007a) concede that authorized generic entry
prior to patent expiry may reduce incentives to generic firms, yet they emphasize that there
is no comprehensive empirical evidence based on recent data that would show early entry
to have had a delaying or deterring effect on generic entry. Except for the study by Berndt
et al. (2007a), peer-reviewed analyses rely on data from the late 80s, early and mid 90s. This
study is the first to employ recent micro data to examine generic and early entry decisions.
The previous debate has largely centered on the effect of anticipated authorized generic
entry on generic firms’ incentives to pursue paragraph IV challenges prior to patent expiry.
In the U.S., the first generic manufacturer to file for market approval with a successful para-
graph IV certification (claim of patent non-infringement or patent invalidity) is granted a
180-day exclusivity period where no other generic firm (except for the authorized generic)
is entitled to market the same version of the drug. If authorized generic entry drastically
lowered generic firms’ incentives to file paragraph IV certifications, generic entry could be
delayed. The 180-day exclusivity period is an institutional feature specific to the U.S. phar-
1The Economist, January 24th 2008: “The bitterest pill”.2A certificate that allows for an extension of market exclusivity for up to five years after patent protection
which – depending on the life cycle of the drug – is granted by the national patent office.
1

maceutical market. Moreover, only a fraction of generic applications seek entry prior to
patent expiry.3 Whether early entry broadly impaired generic entry in recent years, remains
an open question. Providing a complete answer to this question requires the modeling of
original drug producers’ early entry decisions which are endogenous. Original drug producers
appear to decide on early arrangements on a case-by-case basis most often in the year prior
to loss of exclusivity (EUC, 2009). Hollis and Liang (2006); FTC (2009) emphasize that set
of drug markets experiencing early entry is not a random selection of markets.
This study accounts for the endogeneity of early entry and provides comprehensive em-
pirical evidence on the impact of early entry on generic entry decisions made in the course
of recent patent expiries. The analysis relies on a unique micro data set comprising German
pharmaceutical market and exclusivity data (patents and SPCs) for the German pharmaceu-
tical market, the second largest generic drug market in the world, experiencing the largest
number of early entries of all European generic drug markets between 2000 and 2007 (EUC,
2009). 75 substances4 lost exclusivity (patent or SPC protection) between 2002 and 2007.
By the end of 2007, 87 generic firms entered in 48 markets5, resulting in a total of 724 market
entries6 by independent generic firms. Of the 48 drug markets experiencing generic entry,
16 markets were affected by early entry from 2002 to 2007. Early entry occurred on average
four months prior to loss of exclusivity. I estimate univariate and recursive bivariate probit
models of entry to quantify the impact of early entry. Treating early entry as exogenous
(univariate probit model) may give rise to a selection problem and inconsistent estimates
if early entry occurs in markets that are more attractive than given market characteristics
suggest, or in other words, if there is a spurious correlation between early entry and generic
entry decisions. Bivariate probit estimates indicate that early entry decisions are endoge-
neous. The identification strategy in the bivariate probit model relies on the assumption of
normality and the fact that I model sequential entry decisions. Exclusion restrictions are
3From 1998 to 2000, 20% of generic applications included a paragraph IV certificate (FTC, 2002).4Throughout the paper the term substance is equivalently used for mono-substance, i.e. a substance that
contains one active ingredient only. As the allocation of all relevant patents and supplementary protectioncertificates to mono-substances is delicate, the analysis is confined to mono-substances.
5Other studies report similar rates of generic entry, e.g. Magazzini et al. (2004).6As one firm typically enters in more than one market, this yields 724 generic entries in total.
2

not necessarily required to achieve identification in recursive bivariate probit models (Wilde,
2000; Greene, 2008). I do impose one exclusion restriction to improve identification. As
early entry decisions are arguably motivated by pioneers’ financial distress, I add a count
of each original drug producers’ further losses of exclusivity between 2002 and 2007 as an
instrumental variable to the early entry equation. As Evans and Schwab (1995), I provide
tentative empirical evidence on the suitability of the instrument, showing that the instru-
mental variable has no significant effect on generic entry decisions. Determining the average
marginal effect of early entry in the bivariate probit model, I compute the average change in
the probability of generic entry conditional on early entry having and having not occured.
Standard errors are computed using the delta-method (Papke and Wooldridge, 2005). Re-
gardless of the identifying assumption made, early entry turns out to have no significant
impact on the probability of generic entry. Originators appear to authorize generic entry
prior to loss of exclusivity to extract generic profits rather than to deter generic entry. Drugs’
pre-entry market size has a significant, and comparably the strongest impact on generic entry
decisions. A 1% increase in pre-entry revenues induces on average a 14-18% increase in the
likelihood of generic entry. Furthermore, I find that the number of off-patent substitute ac-
tive ingredients has a negative impact on entry, whereas the length of the exclusivity period
and firms’ therapeutic and drug form experience influence generic entry decisions positively.
The organization of the paper is as follows: Section 2 provides relevant industry in-
formation. Section 3 reviews the literature on early entry. Section 4 describes the data,
and Section 5 specifies the empirical implementation. Section 6 presents and discusses the
empirical findings. Concluding remarks follow in Section 7.
2 Industry Background
With a market size of e 4.5 Bn. and a generic penetration (efficiency7) rate of about 20%
(68%) as of 2007, Germany is the second largest generic drug market in the world, and the
largest generic drug market in Europe, experiencing the largest number of generic and early
7The generic efficiency rate indicates the fraction of multi-source drug prescriptions dispensed as generic.Own calculations based on Insight Health prescription data.
3

entries between 2000 and 2007 (EUC, 2009). Hence, it is one of the most important phar-
maceutical markets to examine when seeking insights into generic and early entry decisions.
The following paragraph outlines the market approval process of generic drugs in Germany,
the dynamics of generic competition and the underlying market regulations.
Generic drugs are therapeutically equivalent to off-patent, original drugs, i.e. they con-
tain the same active ingredient, they have identical quality and performance characteristics,
the same strength and the same or a similar route of administration. Generic drugs are most
frequently marketed as INN-generics, i.e. the international-non-proprietary name (INN) of
the active ingredient and a company suffix identify the generic product. The originator’s
market share typically drops quickly after generic entry. The case of Pfizer’s bestseller drug
Norvasc (INN: Amlodipine) illustrated in Appendix [A-1] is only one prominent example.
As a result of price competition and lower R&D outlays, generic firms offer substantial price
discounts of up to 80% and more. Instead of safety and efficacy tests generic firms run
bioequivalence studies8 which are cheaper and faster to conduct (on average four months).
Generic entry is usually permitted as soon as the original drug goes off-patent. Originators
may apply within six month of the drug’s market approval for a supplementary protection
certificate which extend the exclusivity period by up to five years if granted by the national
patent office. Generic entry may occur prior to patent or SPC expiry.9 In the event of
early entry, a generic version of the original drug may be marketed either through a generic
subsidiary or licensee/supply partner.10 Independent generic firms file abridged applications
for market approval, referring to the reviews of experts and clinical test results obtained in
the course of the original drug’s approval process. Current law entitles generic firms to cite
such documents without notice or permission of the originator eight years after the origi-
nal drug’s market entry11 (data exclusivity period).12 If the data exclusivity period elapsed,
8Generic manufacturers prove in bioequivalence studies that the rate and extent of absorption of theactive ingredient is identical to that of the reference drug.
9EUC (2008), pp. 11, 246; The Economist, August 6th 2009: “Friends for Life”; “Something Rotten”.10Original drug producers appear to decide on early arrangements on a case-by-case basis most often in
the year prior to loss of exclusivity to generate substantial profits (EUC, 2009).11Given time and cost-intensive clinical trials and a lengthy approval process, market entry of the original
drug typically occurs 10-12 years after patent application.12With the implementation of the Bolar provision in German law, “working under patent” became legal.
For applications filed in Germany prior to November 2005 the data exclusivity period amounts to 10 years.
4

generics may conduct bioequivalence studies while the reference drug is still patent-protected
(working under patent). However, generic drugs are not to be marketed (marketing exclu-
sivity period) for 10 years after the original drug’s market entry. If the originator obtains
market approval for at least one additional indication within eight years after market entry,
the marketing exclusivity period is extended for another year (8+2+1-Rule). A centralized
application procedure has increasingly been used by generic firms since 2000 (EUC, 2008),
providing market authorization for the European community at once. Applications are sub-
mitted for evaluation to the European Medication Evaluation Agency (EMEA), which gives
a recommendation to the European Commission within 270 days unless major objections are
identified. The European Commission grants market approval and informs the applicant.
In summary, generic firms decide upon market entry about two years prior to loss of exclu-
sivity. Due to the disclosure13 of generic applications until shortly before the grant of market
approval, generic firms sink entry costs simultaneously and can only form expectations about
competitors’ actions.14 Figure 1 below outlines the various exclusivity mechanisms. At the
discretion of original drug producers early entry may either occur prior to patent (1) or SPC
expiry (2). Independent generic firms enter after patent (or SPC) expiry, depending on the
duration of bioequivalence studies and timing of generic drugs’ market approval.
Figure 1: From Patent Application to Generic Entry
An increase in generic substitution has been achieved through the enforcement of the
Drug Expenditure Restriction Act in February 2002, introducing the Aut-idem regulation for
13See also EUC (2008), p. 15.14Entry costs comprise the costs of conducting bioequivalence studies – $40.000-150.000 (WHO, 2005),
market approval fees – at the EMEA, an annual fee of e 21.700 in addition to a basic fee of e 94.100 (EUC,2008) – and legal costs in the event of litigation, settlements etc..
5

prescription drugs. If doctors do not exclude substitution, a pharmacist generally will have
to sell one of the three cheapest generic drugs to the patient. If a more expensive product is
sold instead, the pharmacist incurs the difference in price. Since January 2004, dispensing
fees on prescription drugs15 consist largely of a fixed component.16 As a result, incentives
to sell high-priced drugs have been reduced. In the same year, reimbursement practices
were altered. Patients covered by statutory health insurance have to make a co-payment for
each drug they purchase. The co-payment amounts to 10% of the retail price, the minimum
contribution is e 5 and e 10 is the maximum. As most drugs are sold in packages priced
below e 50, patients are often inclined not to search for a cheaper drug with the same
active ingredient (Accenture, 2005). In addition to the co-payment that patients covered by
statutory health insurance must make, they are reimbursed up to a reference price only. As
of May 2006, co-payments become obsolete if a drug product is priced 30% or more below
the reference price.17 As a result, generic firms often set prices close to, or 30% below, the
reference price18. In April 2007 the Statuatory Health Insurance Competition Reinforcement
Act was enforced, authorizing rebate contracts. Ever since statutory insurance providers may
contract with drug manufacturers that offer the lowest price for a particular drug product.
Thereafter, pharmacists are to provide patients with the drug of the manufacturer their
insurance provider has contracted with. Except for rebate contracts, previous regulations
seem to have provided generally few incentives to switch between identical generic drugs as
long as price differences are minor, conferring a sustainable advantage to generic first-movers.
3 Literature Review
The distinctive features of competition in off-patent drug markets have attracted the
attention of various economists. Previous empirical studies prove pre-entry market size
(Morton, 1999; Saha et al., 2006), firm and drug characteristics (Morton, 1999), and the
brand-name drug’s goodwill stock (Hurwitz and Caves, 1988; Hudson, 2000) to be impor-
15Around 78% of pharmaceutical sales are made on prescription drugs (BPI Pharma-Daten 2008).16Pharmacies receive a fixed fee of e 8.10 on each product sold, plus 3% of the product’s purchase price.17To secure fair competition practices, manufacturers are also prohibited from giving discounts in kind to
pharmacies since May 2006. Financial rebates are restricted to non-prescription drugs.18AOK Press Release June, 2006 (accessed Dec 11th 2008); see also Accenture (2005).
6

tant influencing factors of generic entry. A few empirical studies address the issue of early
entry – also known as authorized, branded or pseudo-generic entry – gauging its potentially
anti-competitive impact on independent generic entry. Early entry is a common phenomenon
in both Europe and the USA. Generic first-movers have been shown to enjoy a long-lasting
advantage over subsequent generic entrants (Caves et al., 1991; Grabowski and Vernon, 1992;
Hollis, 2002).19 Not only can the first generic entrant serve the market for a longer period
of time – with fewer competitors and higher generic profits after patent expiry – but it can
also capture and sustain a substantially larger market share over a period of several years.
On these grounds early entry may drastically reduce incentives for generic entry and harm
off-patent competition. Prior studies draw different conclusions about the effect of early en-
try on generic entry decisions. Whereas Hollis (2003) argues that early entry has a deterring
effect on generic entry and substantial welfare effects, Reiffen and Ward (2007) and Berndt
et al. (2007a) hold a more moderate view on the ultimate impact of early entry.
Hollis (2003) explains that patients’ unwillingness to switch between medications, search
and “persuasion” costs on parts of doctors, and the administrative costs of pharmacies when
stocking several (identical) generic drugs result in switching costs. Switching costs are not
easy to overcome as generic drugs are bio-equivalent and generic competitors match prices
immediately as soon as one entrant lowers its price. Referring to a related study (Hollis,
2002) establishing evidence on generic first-mover advantages in Canada, he concludes that
brand-controlled pseudo-generics substantially lower incentives for generic entry.
Reiffen and Ward (2007) examine the motivation of original drug manufacturers in the
USA to introduce authorized generics pre-patent expiry, addressing the issue of entry deter-
rence. Based on structural estimates from earlier empirical studies (Caves et al., 1991; Reiffen
and Ward, 2005), they calculate the effect of authorized generic entry on generic industry
profits and the number of generic entrants in equilibrium, which in turn affects generic and
brand prices, and eventually original drug producers’ profits. Their calculation shows that
the anticipation of (exogeneously given) authorized generic entry crowds out between 1.7 to
2.4 generic entrants regardless of drugs’ market size. Reiffen and Ward (2007) argue that
19Berndt et al. (2002) provide similar evidence for Rx-to-OTC switches of antiulcer and heartburn drugs.
7

original drug producers introduce authorized generics in large drug markets fueled by rent-
seeking motives, i.e. to capture generic profits without substantially affecting the number
of generic entrants or generic prices. In small and medium-sized markets on the contrary,
entry deterrence motives play an important role as the impact on generic entry and prices is
relatively large. Reiffen and Ward (2007) argue that early entry is least problematic (from
the standpoint of social welfare) and also most profitable in high-revenue drug markets.
Recent evidence on the consumer welfare effects of authorized generic entry in the USA
has been provided by Berndt et al. (2007a,b). The studies examine the impact of (exoge-
neously given) authorized generic entry on the filing of Abbreviated New Drug Approvals
(ANDA)20 with a paragraph IV certification (claim of patent non-infringement or invalidity),
i.e. they look at generic entrants’ incentives to enter timely and not necessarily at the actual
market entry decision. Under the Hatch-Waxman Act of 1984, the first generic firm to file
an ANDA with a successful paragraph IV certification may be granted a 180-day exclusivity
period where no other generic firm (except for the authorized generic) is entitled to market
the same version of the drug. Berndt et al. (2007b) point out that several factors besides
authorized generic entry may limit the profitability of the 180-day exclusivity period.21 They
show that in spite of the increase in authorized generics since 2003, there is little change in
the total number of paragraph IV certifications, paragraph IV certifications per drug, and
timing of filings relative to approvals of new chemical entities. Based on a review of de-
scriptive statistics, they conclude that the effect of authorized generic entry on independent
generic entry and consumer welfare in the U.S. is likely to be small. Berndt et al. (2007a)
emphasize also that there is no comprehensive empirical evidence based on recent data that
would show early entry to have had a delaying or deterring effect on generic entry.
4 Data
Through a matching of national pharmaceutical market and exclusivity data, a unique
data set has been created, tracking substances’ losses of exclusivity and generic entry between
20Abbreviated New Drug Approval: application process for generic entrants in the USA, where therapeuticequivalence to the original drug and quality of the manufacturing process has to be proven.
21Multiple entrants are awarded 180-day exclusivity given they apply for the same dose at the same day.
8

2002 and 2007. Insight Health provides pharmaceutical market, patent and SPC data.22
The pharmaceutical market data comprise information on drugs23, medical products and
manufacturers. Additionally, they provide product-level information on prices, turnover and
revenues generated in the German retail segment. Exclusivity data give information about
patent holders, originators, the date of patent and SPC application, the date of first market
approval. The analysis is limited to human medications containing one active ingredient to
ensure a high matching quality of pharmaceutical and exclusivity data.24 Moreover, it is
confined to data on retail revenues, i.e. wholesale and direct purchase transactions of public
pharmacies. I disregard hospitals sales due to data availability constraints. In Europe, the
turnover generated with prescription medications is significantly larger in the retail segment.
In 2007 the retail turnover was approximately three times as large as the turnover generated
in the hospital segment(EUC, 2008). As a result of quantity discounts, prices charged to
hospitals are also typically much lower than retail prices. Thus, for the vast majority of drugs
in this study (prescription drugs), retail revenues provide a sufficiently reliable measure of
markets’ attractiveness. Furthermore, I have not been able to obtain data on advertising
expenditures. Pharmaceutical firms spend a substantial fraction of profits on advertising25,
yet these data are private and for researchers almost impossible to acquire. Pre-expiration
brand advertising may not be a barrier to generic entry (Morton, 2000) – original drug
producers’ intensity of advertising decreases drastically as exclusivity expires (Berndt et al.,
2003; Janakiraman et al., 2008; EUC, 2009)–, and generic advertising may be rare (Scherer,
2000; Berndt et al., 2003), the lack of advertising data is certainly a limitation of this study.
79 drugs experienced a loss of exclusivity between 2002 and 2007. Four drugs are ex-
cluded from the sample given their uncommon routes of administration (lung, eye and sys-
22Insight Health has obtained exclusivity data from the national patent and trademark office since 2005. Iaccessed the PATDPASPC, Esp@cent Patent, Derwent and Open Drug database, Thomson’s Current PatentGazette, the FDA Orangebook, and online patent expiry reports to complement and verify the data.
23Strength, drug form and therapeutic field(s) of indication are specified. The drug form classificationfollows the New Form Code (NFC) Classification established by the European Pharmaceutical Market Re-search Association (EphMRA), the classification of therapeutic fields in turn rests upon the AnatomicalTherapeutic Chemical (ATC) Classification System which was introduced by the WHO in 1976.
24The consistency of generic entry and exclusivity data was verified. If generic entry occurred prior topatent or SPC expiry, investigations were carried out to find evidence on early entry or patent invaliditycases that would explain entry prior to the official date of patent or SPC expiry.
25Direct advertising of prescription medications to consumers is illegal in the European Union.
9

temic use)26, confining the analysis to 75 markets with a predominantly oral, topical or
parenteral drug form use. SPC extensions were granted for 60 drugs. By the end of 2007,
87 generic firms entered in 48 out of the 75 markets27, resulting in a total of 724 generic
entries.28 As generic firms tend to focus on high revenue markets several entry opportunities
attract no entry (Morton, 1999; Hollis, 2003). Of the 48 drug markets experiencing generic
entry, 16 were affected by early entry – on average four months prior to loss of exclusivity.
Licensing/supply agreements were the preferred mode to arrange for early entry. A generic
version of the original drug was launched through a generic subsidiary in the case of two
drugs only. A total of 26 early entries took place as originators would often cooperate with
two generic firms. Table 1 outlines important characteristics of the 75 entry opportunities
arising between 2002 and 2007: pre-entry market revenues (in eMio., evaluated at producer
prices, two years prior to loss of exclusivity), the extent of generic entry, the duration of
monopoly (number of years from original drug’s market approval to loss of exclusivity) and
the number of off-patent drugs available (substitutes) treating the same indication(s)29.
Table 1: Generic Entry Opportunities (2002–2007)
Markets Pre-Entry Market Size Entries Monopoly (Yrs.) Substitutes
N Mean Median N Mean Median Mean Median
Generic Entry 48 47.8 32.9 724 12.3 12.5 50.7 43.5
Early Entry 16 55.6 39.8 301 12 12.5 45.9 33.5
No Early Entry 32 43.9 25.2 423 12.5 12.5 53.1 45.5
No Generic Entry 27 0.6 0.2 0 11.7 13 42.9 35
Total 75 32.7 14.8 724 12.1 12.5 47.9 39
Notably, very small markets experience no generic entry. The average pre-entry market size
of drug markets experiencing generic entry amounts to of e 47.8 Mio.. Also, early entry
appears to be focused on high revenue markets comparing either mean or median pre-entry
market sizes of the given markets. Grouping the 25 smallest, the 25 intermediate-sized and
25 largest drug markets with an average pre-entry market size of e 2.2 Mio., e 17.6 Mio. and
e 78.3 Mio., I find evidence for a monotonic relationship between generic entry (early entry)
and pre-entry market size. Generic entry (early entry) occurs in 4 (1) small-revenue, in 21
26Only Formoterol attracts generic entry (route of administration: lung).27Other studies report similar rates of generic entry, e.g. Magazzini et al. (2004).28As one firm typically enters in more than one market, this yields 724 generic entries.29Therapeutic fields are classified by the ATC System at the second level of aggregation (ATC2).
10
(4) intermediate-sized and in 23 (11) high-revenue markets. Differences in the duration of
monopoly are generally minor. Original drug producers exclusively supplied drug markets for
approximately 12 years on average. Generic entrants also appear to enter more “crowded”
(profitable) therapeutic fields. The number of available, off-patent drugs (substitutes) treat-
ing the same indication(s) – a measure of the intensity of off-patent competition prior to
generic entry – tends to be larger in the 48 markets experiencing generic entry. Appendix
[A-2] illustrates the patterns of losses of exclusivity, generic entry and early entry from 2002
to 2007 and it sketches the highly left-skewed distribution of pre-entry market sizes.
The unit of observation in the analysis is the market entry decision of a generic firm.
Observing firms that decided to enter, one remains agnostic about those firms which refrained
from entry. For an examination of generic entry decisions, negative entry decisions (zero-
entries) need to be accounted for, however. As in Morton (1999), sets of potential entrants are
constructed for each substance to identify generic firms that could have entered but decided
not to do so.30 The pharmaceutical data set lists around 985 firms that supplied the German
pharmaceutical market between 1999 and 2007. By restricting the set of potential entrants
to manufacturing firms (no re-import31) with at least half of the retail form portfolio being
classified as “generic”, 395 firms remain. By limiting the set of potential entrants further
to those firms with a portfolio of at least 50 retail forms the number of firms is reduced to
101. These 101 firms manufactured 94.4% of all generic retail forms available on the German
market between 1999 and 2007. The first set of potential entrants is defined for each drug
market by including only those firms that are in business as exclusivity expires (Data Set 1).
The criteria might seem arbitrary at first, yet they turn out to predict generic entry decisions
very well. 672 out of 724 generic entries are correctly identified, i.e. a fraction of 92.8% of
all generic entries between 2002 and 2007. The criteria should be similarly apt to identify
potential entry candidates which eventually refrained from entry. A further restriction of
entry candidates may be warranted as not all of those firms were similarly likely to have
decided upon each of the 75 entry opportunities. Morton (1999) finds that generic firms
30Kyle (2007) determines market entry opportunities in a similar context. See also Kyle (2006).31As of 2007 reimport firms have supplied only a minor fraction of 3.9% of all generic retail forms.
11

therapeutic and drug form experiences influence generic entry decisions positively. Two
further sets of potential entrants are created for each and every drug market to account for
potential entrants’ experiences. The second set of potential entrants limits entry candidates
in the first set of potential entrants to those firms which prove to be experienced in the
relevant fields of indication as exclusivity expires, having marketed a positive number of
retail forms in given therapeutic fields (Data Set 2). The third set of potential entrants
lastly restricts the second set of entry candidates to those firms which additionally have
expertise in manufacturing the relevant drug form(s) as exclusivity expires, having launched
a positive number of particular drug forms (Data Set 3). Table 2 below summarizes the sets
of criteria employed, providing an overview of the three data sets which were generated.
Table 2: Outline Data Set Construction
Data Set 1 Data Set 2 Data Set 3
Definition Active generic firms(share generic retailforms ≥50%) supplyingat least 50 retail forms(no reimport firms).
Firms in Data Set 1which are active in therelevant field(s) of indi-cation (ATC2).
Firms in Data Set 2with drug form experi-ence (NFC1).
Potential Entrants
Total 127 126 126
Mean 100.2 37.4 33.7
Median 101 38 34
Zero-Entries
Total 6793 2080 1807
48 4081 1251 1058
27 2712 829 749
Mean 90.6 27.7 24.1
48 85.0 26.1 22.0
27 100.4 30.7 27.7
Median 93 23 21
48 85.5 22 19
27 101 31 30
Generic Entries
Total 724
Mean 15.1
Median 14
Sample Size (N) 7517 2804 2531
Notes: Statistics for generic entries refer to the 48 drug markets experiencing generic entry by 2007, whereas statisticsfor potential entrants and statistics for zero-entries are presented for all 75 drug markets in the sample. Latter statisticsare additionaly disaggregated by drug markets with (48) and without (27) generic entry.
12

With an increasing limitation of the total number of potential entrants from data set 1
to data set 3, the average and median number of potential entrants declines notably.32 The
same applies to the number of zero-entries and sample sizes. There are on average about 100,
37 and 34 potential entrants for one drug market. Given that there are around 50-60 generic
firms in Germany, and given that innovative pharmaceutical firms would supply generic
drugs in various instances (acis Arzneimittel GmbH, 2007), too, these numbers appear to be
reasonable. Between 2002 and 2007, 48 drug markets experienced generic entry. A total of
724 generic entries occurred in the given time period. Approximately 15 generic firms entered
into one drug market. Appendix [B] provides an overview of the distribution of generic
entries and negative entry decisions (zero-entries) over the 75 drug markets. Depending on
the established criteria for sets of potential entrants, a fraction of 9.6%, 26% and 29% of the
various entry opportunities are realized. Morton (1999) examines 123 firms and 363 drug
markets (drug and drug form combinations) and uses a similar methodology, yet somewhat
different criteria to identify potential entrants. Having created substantially more entry
opportunities in each of the three data sets (N1=42059, N2=33979, N3=23811), Morton
(1999) finds that only a fraction of 2%, 3.5% and 7% of observations experience generic
entry. As such, my criteria are not necessarily less restrictive than the criteria employed in
the previous study.33 In general, the more restrictive criteria I employ, the smaller become
not only the sets of potential entrants assigned to drug markets but also the fractions of
correctly predicted generic entry decisions. Some generic firms enter unknown therapeutic
fields and a few firms also launch new drug forms. Using the second (third) set of criteria to
identify potential entrants, 78.7% (76.5%) of generic entry decisions are correctly predicted.
Any of the criteria employed to identify potential entrants in the specific drug markets seem
to predict generic entry decisions sufficiently well. Therefore, any of the criteria should be
similarily suitable to identify generic firms which decided not to enter. Using all of the three
data sets in the empirical analysis allows me to verify the robustness of results.
32Whenever firms which are not tracked in the sets of potential entrants enter markets, the total numberof potential entrants increases from 101 to 127, and to 126 respectively.
33Examining 1444 unique molecules produced by 278 firms in 134 therapeutic classifications over the timeperiod 1980-1999 in 28 European countries, Kyle (2007) identifies 299567 entry opportunities (drug-country-class-year observations), out of which 7,630 had a product launch (2.5%).
13

5 Empirical Implementation
Using the three cross-sectional micro data sets, I examine the impact of early entry
on independent generic entry decisions. Generic first-movers have been shown to enjoy a
long-lasting competitive advantage over subsequent generic entrants (Caves et al., 1991;
Grabowski and Vernon, 1992; Hollis, 2002) as a result of doctors’, patients’ and pharmacists’
switching costs (see Section 2 & 3). Along those lines, early entry is likely to diminish the
expected profitability of subsequent generic entry (EUC, 2009). As generic manufacturers
are uncertain about competitors’ entry decisions until shortly before competitors obtain
market approval, generic firms can only form expectations about the event of early entry
when deciding upon the conduct of bio-equivalence studies and market entry. The underlying
assumption made in all related studies is that generic firms are apt to forsee the occurence
of early entry (Hollis, 2003; Reiffen and Ward, 2005; Berndt et al., 2007a,b). Given its
frequency – firms presumably learning from past experiences – this assumption appears to
be reasonable. The hypothesis which the empirical model fundamentally relies on, is specified
below. I make no further assumptions about the size of the early entry effect.
Hypothesis: Early entry prior to loss of exclusivity has a significantly negative effect
on independent generic entry decisions (deterrence effect).
Both generic entry and early entry are dichotomous variables. One observes market entry
but not the profits generic firms or early entrants (original drug producers) expected to reap
upon entry (latent variable), which in turn motivated firms’ entry decision. For the majority
of generic firms early entry is practically “exogenously” given, i.e. they have no means to
directly influence original drug producers’ decisions. Yet, there is no reason to believe that
early entry is truly exogenous. The set of drug markets in which early entry occurs is not
a random selection of markets (Hollis and Liang, 2006; FTC, 2009). Unobserved factors
determine expected market profits, and thus both the likelihood of generic and early entry.
For instance, therapeutic innovations change the future competitive landscape and may
let entry into a certain market appear less attractive than observed market characteristics
suggest. On the contrary, long-term clinical studies may reveal that a substance is very
effective in a specific therapeutic field, and entry becomes more attractive. Demographic
14
trend projections possibly affect expected profits as well. If generic and early entry occur in
selective drug markets which are more attractive than given market characteristics suggest
– the most likely scenario –, there will be a spurious correlation between early entry and
generic entry decisions. The selection effect may understate the effect of early entry, basically
counterbalancing the presumably negative effect of early entry. In other words, the early
entry dummy may to some extent pick up drug markets’ (unobserved) attractiveness.
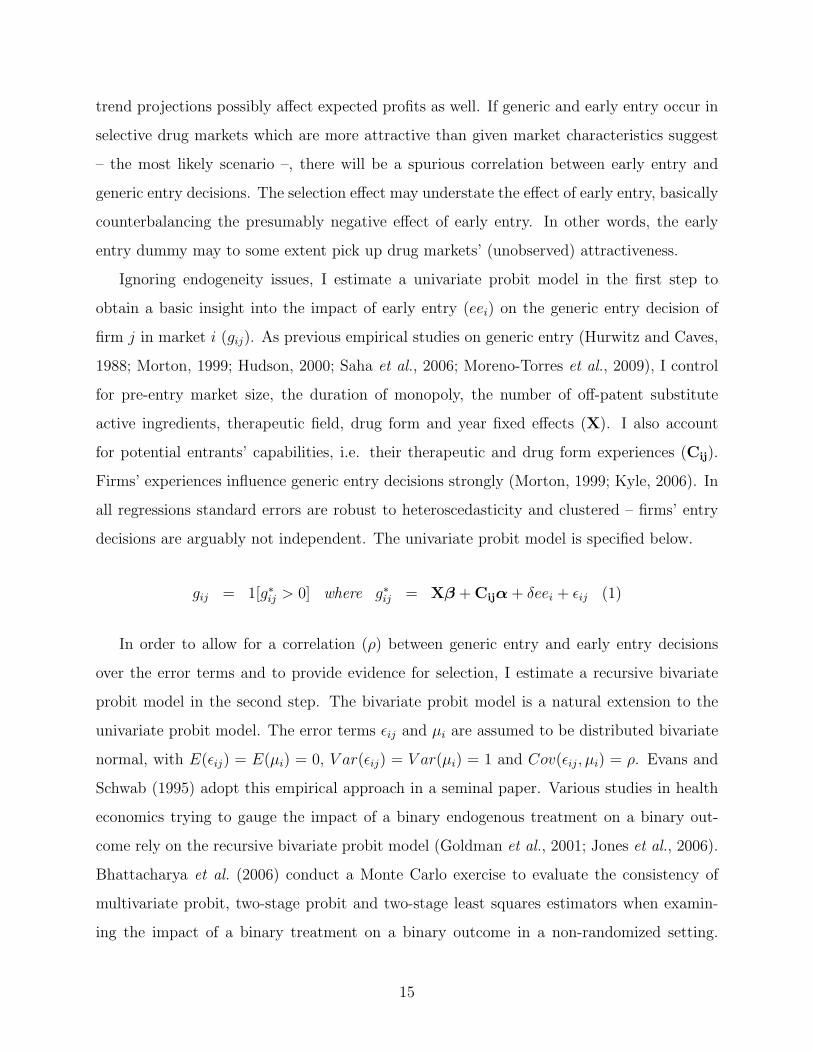
Ignoring endogeneity issues, I estimate a univariate probit model in the first step to
obtain a basic insight into the impact of early entry (eei) on the generic entry decision of
firm j in market i (gij). As previous empirical studies on generic entry (Hurwitz and Caves,
1988; Morton, 1999; Hudson, 2000; Saha et al., 2006; Moreno-Torres et al., 2009), I control
for pre-entry market size, the duration of monopoly, the number of off-patent substitute
active ingredients, therapeutic field, drug form and year fixed effects (X). I also account
for potential entrants’ capabilities, i.e. their therapeutic and drug form experiences (Cij).
Firms’ experiences influence generic entry decisions strongly (Morton, 1999; Kyle, 2006). In
all regressions standard errors are robust to heteroscedasticity and clustered – firms’ entry
decisions are arguably not independent. The univariate probit model is specified below.
gij = 1[g∗ij > 0] where g∗ij = Xβ +Cijα+ δeei + ǫij (1)
In order to allow for a correlation (ρ) between generic entry and early entry decisions
over the error terms and to provide evidence for selection, I estimate a recursive bivariate
probit model in the second step. The bivariate probit model is a natural extension to the
univariate probit model. The error terms ǫij and µi are assumed to be distributed bivariate
normal, with E(ǫij) = E(µi) = 0, V ar(ǫij) = V ar(µi) = 1 and Cov(ǫij, µi) = ρ. Evans and
Schwab (1995) adopt this empirical approach in a seminal paper. Various studies in health
economics trying to gauge the impact of a binary endogenous treatment on a binary out-
come rely on the recursive bivariate probit model (Goldman et al., 2001; Jones et al., 2006).
Bhattacharya et al. (2006) conduct a Monte Carlo exercise to evaluate the consistency of
multivariate probit, two-stage probit and two-stage least squares estimators when examin-
ing the impact of a binary treatment on a binary outcome in a non-randomized setting.
15

Bhattacharya et al. (2006) point out that the results argue in favor the multivariate probit,
especially when the average probability of the dependent variable is close to 0 or 1, or when
the data generating process is not normal. The identification strategy in the bivariate probit
model relies on the assumption of normality and the fact that I am modeling sequential
entry decisions. Exclusion restrictions are not necessarily required to achieve identification
in recursive bivariate probit models (Wilde, 2000; Greene, 2008)34. I do impose one exclu-
sion restriction, however, to improve identification. As early entry decisions are arguably
motivated by original drug producers’ financial distress, I add a count of each original drug
producers’ further losses of exclusivity in the time period 2002 to 2007 as instrumental vari-
able to the early entry equation (I). Past losses of exclusivity are included. Original drug
producer’s financial distress is expected to have a positive effect on the likelihood of early
entry. Original drug producers who do not experience many patent expiries in the given time
period are ceteris paribus financially better off and depend less on current income streams
and their preservation. Out of the 19 originators in the sample, 11 originators conclude early
entry agreements facing on average 3.4 further losses of exclusivity, whereas the remaining
8 originators experience on average only 0.5 further losses of exclusivity between 2002 and
2007. The number of original drug producers’ further losses of exclusivity is exogenously
given, forming only a small subset35 of all entry opportunities in the given time period. The
high frequency of early entry suggests that original drug producers primarily make use of
early entry arrangements to mitigate the loss of monopoly profits. Original drug producers’
advertising efforts in a given market are known to decline around the time of patent expiry
and to drastically decline thereafter (Berndt et al., 2003; Janakiraman et al., 2008; EUC,
2009), suggesting that advertising is not an alternative channel through which original drug
producers’ financial distress would impact independent generic entry decisions.
If, after controlling for other observed drug market and firm characteristics, Financial
Distress is correlated with generic firms’ unobserved propensity to enter into a given market,
it will not provide a valid exclusion restriction. One straightforward way to address this
34Review also online material provided by William Greene (accessed December 2009):pages.stern.nyu.edu/ wgreene/DiscreteChoice/Lectures/Part5-Bivariate&MultivariateProbit.ppt
35Original drug producers face on average 2.2 further losses of exclusivity between 2002 to 2007.
16

issue, yet not a formal test, is to include the instrumental variable in the single-equation
probits. Single-equation models are misspecified if there is selection, but they still offer a
a clear sense of the patterns in the data (Evans and Schwab, 1995). Besides this tentative
empirical evidence for the suitability of the instrument, I conduct a likelihood-ratio test of
the restricted versus unrestricted recursive bivariate probit model showing that the instru-
ment improves identification and the model’s goodness of fit. The recursive bivariate probit
model’s specification is given below. It is identical to the univariate probit model except
for the second equation – the early entry decision eei – which is now additionally to be
estimated. Due to lack of variation in the data, drug form effects are not accounted for in
the early entry equation. Early entry occurs in drug markets with oral drug form use only.
gij = 1[g∗ij > 0] where g∗ij = X1β1 +Cijα+ δeei + ǫij (2)
eei = 1[ee∗i > 0] where ee∗i = X2β2 + Iτ + µi
The dependent variable of particular interest in all regressions is Generic Entry, denot-
ing the market entry decision of an independent generic firm. Generic Entry is coded as
0-1 dummy and it takes on the value one if an independent generic firm decides to enter a
specific drug market post loss of exclusivity. The Early Entry dummy regressor – introduced
to generic entry equations to examine the effect of early entry on generic entry decisions –
similarly takes on the value one if a generic version of the original drug is launched in a
specific drug market prior to loss of exclusivity. Pre-Entry Market Size is a fundamental
control variable in generic (early) entry equations (Berndt et al., 2007a; Fisher Ellison and
Ellison, 2007; Reiffen and Ward, 2007). Pre-Entry Market Size denotes the annual revenues
in logarithms in a given market two calendar years prior to loss of exclusivity (evaluated at
producer prices, in eMio). I use a lagged version of the variable to avoid endogeneity issues.
Monopoly Duration and Substitutes are two further, important control variables in generic
(early) entry equations. Monopoly Duration measures the number of years from the original
drug’s first market approval to loss of exclusivity. Previous studies have shown that the
effective duration of monopoly has a negative effect on generic entry, mainly arguing that
original drug producers’ goodwill stocks are larger (Hurwitz and Caves, 1988; Hudson, 2000).
Substitutes proxies the intensity of off-patent competition in therapeutic fields, indicating
17
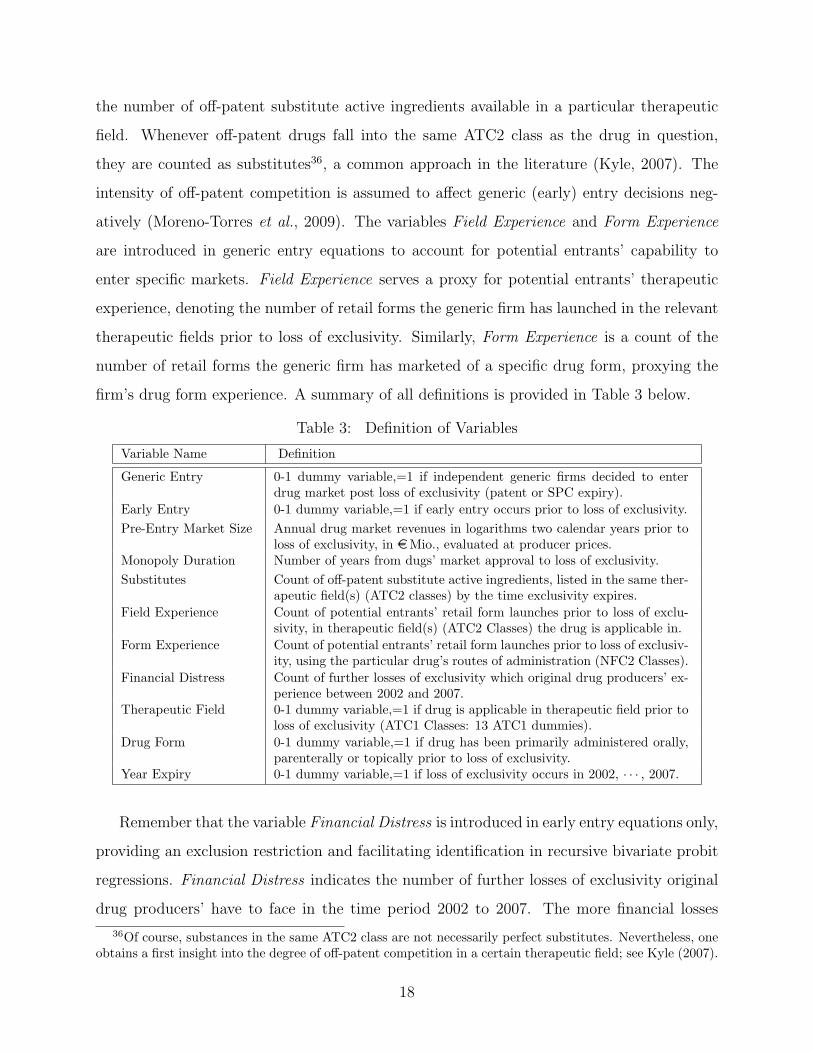
the number of off-patent substitute active ingredients available in a particular therapeutic
field. Whenever off-patent drugs fall into the same ATC2 class as the drug in question,
they are counted as substitutes36, a common approach in the literature (Kyle, 2007). The
intensity of off-patent competition is assumed to affect generic (early) entry decisions neg-
atively (Moreno-Torres et al., 2009). The variables Field Experience and Form Experience
are introduced in generic entry equations to account for potential entrants’ capability to
enter specific markets. Field Experience serves a proxy for potential entrants’ therapeutic
experience, denoting the number of retail forms the generic firm has launched in the relevant
therapeutic fields prior to loss of exclusivity. Similarly, Form Experience is a count of the
number of retail forms the generic firm has marketed of a specific drug form, proxying the
firm’s drug form experience. A summary of all definitions is provided in Table 3 below.
Table 3: Definition of Variables
Variable Name Definition
Generic Entry 0-1 dummy variable,=1 if independent generic firms decided to enterdrug market post loss of exclusivity (patent or SPC expiry).
Early Entry 0-1 dummy variable,=1 if early entry occurs prior to loss of exclusivity.
Pre-Entry Market Size Annual drug market revenues in logarithms two calendar years prior toloss of exclusivity, in eMio., evaluated at producer prices.
Monopoly Duration Number of years from dugs’ market approval to loss of exclusivity.
Substitutes Count of off-patent substitute active ingredients, listed in the same ther-apeutic field(s) (ATC2 classes) by the time exclusivity expires.
Field Experience Count of potential entrants’ retail form launches prior to loss of exclu-sivity, in therapeutic field(s) (ATC2 Classes) the drug is applicable in.
Form Experience Count of potential entrants’ retail form launches prior to loss of exclusiv-ity, using the particular drug’s routes of administration (NFC2 Classes).
Financial Distress Count of further losses of exclusivity which original drug producers’ ex-perience between 2002 and 2007.
Therapeutic Field 0-1 dummy variable,=1 if drug is applicable in therapeutic field prior toloss of exclusivity (ATC1 Classes: 13 ATC1 dummies).
Drug Form 0-1 dummy variable,=1 if drug has been primarily administered orally,parenterally or topically prior to loss of exclusivity.
Year Expiry 0-1 dummy variable,=1 if loss of exclusivity occurs in 2002, · · · , 2007.
Remember that the variable Financial Distress is introduced in early entry equations only,
providing an exclusion restriction and facilitating identification in recursive bivariate probit
regressions. Financial Distress indicates the number of further losses of exclusivity original
drug producers’ have to face in the time period 2002 to 2007. The more financial losses
36Of course, substances in the same ATC2 class are not necessarily perfect substitutes. Nevertheless, oneobtains a first insight into the degree of off-patent competition in a certain therapeutic field; see Kyle (2007).
18

original drug producers experience, the larger is presumably the likelihood of early entry.
Therapeutic field, (drug form)37 and year fixed effects are accounted for by introducing sets
of dummy variables to generic entry and early entry equations. Other variables measuring,
for instance, substances’ therapeutic applicability, or the number of losses of exclusivity
(entry opportunities) in a given year, proved insignificant. Hence, only a parsimonious set
of variables is presented. Summary statistics for data set 3 are presented in Table 4 below.
Appendices [C1] and [C2] provide summary statistics for Data Sets 1 and 2.
Table 4: Summary Statistics Data Set 3
Variable Name Mean Median Min. Max. Sd. N
Generic Entry 0.29 0 0 1 – 2531
Early Entry 0.24 0 0 1 – 2531
Pre-Entry Market Size (eMio.) 37.5 20.1 0 187 44.5 2531
Pre-Entry Market Size (log) 16.08 16.82 0 19.05 3.20 2531
Monopoly Duration 11.86 12.5 5 20 3.0 2531
Substitutes 53.97 44 8 204 36.28 2531
Field Experience 26.38 12 0 374 37.43 2531
Form Experience 178.8 85 0 1679 224.97 2531
Financial Distress 2.92 2 0 6 2.47 2531
Given the different composition of the three data sets (Section 4), the distribution of
variables differs. For instance, with the number of zero-entries decreasing from Data Set
1 to Data Set 3, the fraction of positive generic decisions increases. So does the fraction
of generic entry decisions affected by early entry. The fraction of positive generic entry
decisions amounts to roundabout 29% in Data Set 3. About 24% of generic entry decisions
are affected by early entry. The average generic entry decision is made for a drug market
with pre-entry revenues of e 37.5 Mio., where original drug producers enjoyed a duration of
monopoly of about 11.9 years38, and faced roughly three further losses of exclusivity between
2002 and 2007. Potential entrants decide upon drug launches in therapeutic fields with on
average 54 off-patent, available substitutes prior to drugs’ loss of exclusivity. Before entry
opportunity arose, potential entrants marketed on average 26 retail forms in the relevant
therapeutic fields, and 179 retail forms using the specific drug’s routes of administration.
37As early entry occurs in drug markets with oral drug form use only, drug form fixed effects cannot becontrolled for in early entry equations.
38Grabowski and Kyle (2007) find similar average market exclusivity periods for the same time interval.
19

6 Results
In order to provide basic insights into the impact of early entry on independent generic
entry decision, a univariate probit model, ignoring any endogeneity issues, is estimated at
first. An overview of the estimates obtained from each of the three data sets is given in Table
5 below. Coefficients look remarkably similar, even though the composition of the data sets
varies. Univariate probit estimates indicate that early entry has an adverse effect on generic
entry decisions, the size and precision of the estimate notably decreasing from Data Set 1 to
Data Set 3. The early effect obtained for Data Set 3 is not significant anymore.
Table 5: Univariate Probit – Coefficients
Data Set 1 (N=7517) Data Set 2 (N=2804) Data Set 3 (N=2531)
Generic Entry Generic Entry Generic Entry
Early Entry (0/1) -0.2159*** -0.1554* -0.1392
(0.055) (0.074) (0.076)
Pre-Entry 0.5796*** 0.7311*** 0.7740***Market Size (log) (0.045) (0.049) (0.049)
Monopoly Duration 0.1215*** 0.1441*** 0.1484***
(0.013) (0.016) (0.017)
Substitutes -0.0018 -0.0081*** -0.0079***
(0.001) (0.001) (0.001)
Field Experience 0.0139*** 0.0078*** 0.0075***
(0.002) (0.002) (0.002)
Form Experience 0.0030*** 0.0022*** 0.0021***
(3.1e-04) (3.4e-04) (3.4e-04)
Therap. Field (0/1) yes yes yes
Drug Form (0/1) yes yes yes
Year Expiry (0/1) yes yes yes
Const. -11.4171*** -13.1081*** -13.6092***
Prob > chi2(23) <0.001 <0.001 <0.001
Log-Likelihood -1403.64 -978.15 -914.91
* p<0.05, ** p<0.01, *** p<0.001
Notes: An observation in the regression is the decision of a generic firm to enter a drug market post loss ofexclusivity (generic entry). Heteroskedasticity-robust and clustered standard errors in parentheses. Oral drugs inparasitology and sense organs with loss of exclusivity in 2002 form the reference group in generic entry equations.
Generic entry decisions are significantly and positively influenced by pre-entry market
sizes in turn, regardless which regression estimates one refers to. Monopoly Duration also
has a significantly positive impact on independent generic entry decisions, which is a rather
striking result. Previous studies show that the effective duration of monopoly has a nega-
20

tive effect on generic entry, arguing that original drug producers’ goodwill stocks are larger
(Hurwitz and Caves, 1988; Hudson, 2000). One explanation for the different result is that
the two earlier studies rely on data from the 80s and 90s. Given the recent institutional and
legal changes in Germany (e.g. the enforcement of the Aut-idem regulation in 2002), the
U.S. and many other pharmaceutical markets to foster generic substitution, the length of the
exclusivity period may not necessarily serve as a good proxy for the accumulated goodwill
of pioneers anymore.39 The various initiatives taken to promote generic substitution likely
neutralized pioneers’ reputation advantage, and as a result generic firms will benefit first and
foremost if medications are well-established. The number of available off-patent substitutes –
a measure of the intensity of off-patent competition – appears to affect independent generic
entry decisions negatively. The effect of Substitutes is significant except for the estimate
obtained for Data Set 1. Both therapeutic and drug form experience encourages generic
entry. The effects are generally positive and significant. Therapeutic field, drug form and
year fixed effects are significant in any of the univariate probit regressions.
Remember that if generic entry and early entry occur in selective drug markets which
are more attractive than given market characteristics suggest, there will be a spurious cor-
relation between early entry and generic entry decisions, i.e. univariate probit estimates will
be inconsistent. In order to allow for a correlation between generic entry and early entry
decisions through unobservables, I estimate a recursive bivariate probit model in the second
step. The variable Financial Distress is added as instrument to the early entry equation to
facilitate identification. Univariate probit estimates provide tentative empirical evidence that
Financial Distress provides a valid exclusion restriction. Once added to the single-equation
probit regressions, it turns out not significantly impact generic entry decisions. Appendix
[D] presents the estimates. Note also, that the exclusion restriction is not required to achieve
identification, yet it improves identification notably. Appendix [E-1] provides the bivariate
probit estimates, relying on a functional form identification strategy. The recursive bivari-
ate probit estimates are generally robust to the identification strategy pursued, i.e. results
do not critically hinge on the exclusion restriction. Likelihood-ratio tests of the restricted
39Results are robust to the exclusion of Monopoly Duration from generic entry and early entry equations.
21

versus unrestricted bivariate probit model suggest, however, that the inclusion of the instru-
ment improves the identification and the model’s overall goodness of fit. The results of the
Likelihood-ratio tests are reported in Appendix [E-2]. As Financial Distress appears to be a
suitable instrument, improving the bivariate probit model’s identification, I confine the fol-
lowing interpretation of results to the estimates of the unrestricted recursive bivariate probit
model. Table 6 provides the according estimates. The (residual) correlation between generic
and early entry decisions, denoted by the correlation coefficient ρ, is large and significantly
positive. Wald–Tests show that the null hypothesis of ρ = 0 can be rejected.
Table 6: Recursive Bivariate Probit – Coefficients
Data Set 1 (N=7517) Data Set 2 (N=2804) Data Set 3 (N=2531)
Generic Early Generic Early Generic EarlyEntry Entry Entry Entry Entry Entry
Early Entry (0/1) -1.6490*** -1.5845*** -1.5531***(0.079) (0.057) (0.060)
Pre-Entry 0.8145*** 0.7986*** 0.9221*** 0.8822*** 0.9841*** 0.9386***Market Size (log) (0.035) (0.010) (0.043) (0.038) (0.043) (0.043)
Monopoly Duration 0.1092*** 0.0511*** 0.1459*** 0.0878*** 0.1583*** 0.1155***
(0.009) (0.001) (0.012) (0.011) (0.013) (0.012)
Substitutes -0.0035*** -0.0011*** -0.0060*** 0.0017* -0.0069*** 0.0004
(8.7e-04) (1.6e-04) (0.001) (0.001) (0.001) (0.001)
Field Experience 0.0123*** – 0.0068*** – 0.0067*** –
(0.002) (0.001) (0.001)
Form Experience 0.0022*** – 0.0017*** – 0.0016*** –
(2.7e-04) (2.5e-04) (2.6e-04)
Financial Distress – 0.0676*** – 0.0691*** – 0.0689***
(0.004) (0.011) (0.010)
Therap. Field (0/1) yes yes yes yes yes yes
Drug Form (0/1) yes no yes no yes no
Year Expiry (0/1) yes yes yes yes yes yes
Const. -15.0238*** -15.0655*** -16.4721*** -17.0777*** -17.4244*** -18.1747***
Prob > chi2(36) <0.001 <0.001 <0.001
Log-Likelihood -3870.52 -1903.42 -1775.53
ρ 0.8996*** 0.9478*** 0.9437***
Wald Test: chi2(1) 34.04 60.75 46.25
Prob > chi2(1) <0.001 <0.001 <0.001
* p<0.05, ** p<0.01, *** p<0.001
Notes: In columns (1), (3) and (5) an observation in the regression is the decision of a generic firm to enter a drug market postloss of exclusivity (generic entry). In columns (2), (4) and (6) the occurrence of early entry prior to loss of exclusivity denotes thedependent variable. Heteroskedasticity-robust and clustered standard errors in parentheses. Oral drugs in parasitology and senseorgans with loss of exclusivity in 2002 form the reference group in the generic entry equation. The Wald Test is conducted for thenull hypothesis of ρ = 0, i.e. absence of correlation in the model.
22

The finding is robust to the various criteria established for identifying potential entrants.
Unobserved factors (favorable market characteristics) appear to stimulate both independent
generic and early entry decisions, suggesting that there is a selection effect, or in other words,
that early entry is endogenous. Univariate probit estimates turn out to be inconsistent. The
coefficient of early entry is significantly negative in any of the bivariate probit regressions.
Unless selection is accounted for, the early entry dummy apparently picks up drug markets’
(unobserved) attractiveness, counterbalancing and weakening its negative effect on indepen-
dent generic entry. The coefficient of Financial Distress generally has the expected sign, the
effect turning out to be highly significant. The more financial losses original drug producers
experience between 2002 and 2007, the larger is the likelihood of early entry. The sign and
relative size of all other coefficients in the generic entry equation changes little in comparison
to the univariate probit estimates. Generic entry decisions are strongly driven by pre-entry
revenues (Pre-entry Market Size). The length of the exclusivity period (Monopoly Duration)
also has a significantly positive impact on independent generic entry decisions. Substitutes
– the number of available off-patent substitutes measuring the intensity of off-patent com-
petition – generally affects independent generic entry decisions negatively. Both therapeutic
and drug form experience encourages generic entry. Early entry decisions in turn are also
strongly driven by Pre-entry Market Size. The duration of monopoly affects early entry
decisions positively, providing further evidence that Monopoly Duration is not necessarily a
good proxy for pioneers’ goodwill but rather another market value correlate. Early entry
decisions also appear to be negatively affected by the intensity of off-patent competition.
The effect of Substitutes is negative, mostly significant, yet smaller in size. Therapeutic
field, drug form and year effects are significant in any of the bivariate probit regressions.
Table 7 provides the average marginal effects obtained from the univariate and recursive
bivariate probit regressions. The interpretation of average marginal effects facilitates the
assessment of the size and economic relevance of the early entry effect. Average marginal
effects are reported for the 16 drug markets experiencing early entry between 2002 and
2007, i.e. for the subset of generic entry decisions affected by early entry. The prevailing
assumption is that generic manufacturers are apt to correctly anticipate early entry given
23

drug markets’ characteristics and past experiences. As a result, early entry impairs generic
entry only in drug markets which experience early entry. Appendix [F] provides the average
marginal effects computed for all drug markets. The results and conclusions are similar.
Table 7: Univariate & Recursive Bivariate Probit – Average Marginal Effects
Data Set 1 (N=1581) Data Set 2 (N=633) Data Set 3 (N=599)
Dep.: Generic Entry Univariate Bivariate Univariate Bivariate Univariate BivariateProbit Probit Probit Probit Probit Probit
Early Entry (0/1) -0.0440*** -0.0522 -0.0450* -0.0601 -0.0402 -0.0507
(0.009) (0.0344) (0.021) (0.0316) (0.022) (0.0314)
Pre-Entry 0.1089*** 0.1384*** 0.2113*** 0.1762*** 0.2244*** 0.1847***Market Size (log) (0.012) (0.019) (0.012) (0.025) (0.012) (0.026)
Monopoly Duration 0.0228*** 0.0208*** 0.0417*** 0.0389*** 0.0430*** 0.0370***
(0.003) (0.004) (0.004) (0.007) (0.005) (0.008)
Substitutes -0.0003 -0.0007*** -0.0023*** -0.0030*** -0.0023*** -0.0030***
(2.1e-04) (2.3e-04) (3.9e-04) (6.2e-04) (4.0e-04) (6.3e-04)
Field Experience 0.0026*** 0.0029*** 0.0023*** 0.0028*** 0.0022*** 0.0028***
(3.7e-04) (5.5e-04) (5.5e-04) (7.3e-04) (5.6e-04) (7.5e-04)
Form Experience 0.0006*** 0.0005*** 0.0006*** 0.0007*** 0.0006*** 0.0007***
(5.6-05) (9.3e-05) (8.0e-05) (1.4e-04) (8.3e-05) (1.4e-04)
* p<0.05, ** p<0.01, *** p<0.001
Notes: Average marginal effects are reported for the subset of sixteen drug markets experiencing early entry between 2002and 2007. Average marginal effects presented for the univariate (recursive bivariate) probit model denote average, ceterisparibus changes in the likelihood of independent generic entry (conditional on early entry having occured).
The (relative) size of average marginal effects is generally robust to the micro data em-
ployed, i.e. the estimates obtained from Data Set 1, Data Set 2 and Data Set 3 reveal a
consistent pattern. Univariate probit estimates suggest that early entry lowers the marginal
probability of generic entry by about 4% on average. Except for the estimate obtained for
Data Set 3, the average marginal effects are significant at least at the 5% level. Given
the (residual) correlation between generic entry and early entry decisions, univariate pro-
bit regressions do not provide consistent estimates, whereas the recursive bivariate probit
estimates are consistent. Unlike the average marginal effects obtained from the univariate
probit model, the average marginal effects reported for the bivariate probit model denote
changes in conditional and not marginal probability of generic entry. When determining
the average marginal effect of early entry in the recursive bivariate probit model, interest
lies in the average change in the probability of generic entry conditional on early entry hav-
ing occurred (P (G = 1|E = 1)) and the counterfactual – early entry having not occurred
24

(P (G = 1|E = 0)). The average marginal effects of the other covariates similarly denote
changes in probability of generic entry given that early entry occurred (P (G = 1|E = 1)). I
compute standard errors of the average marginal effects using the delta-method (Papke and
Wooldridge, 2005). The relative size of average marginal effects reported for the univariate
and recursive bivariate probit models tends to be similar. The average marginal effect of
early entry obtained from any of the recursive bivariate probit regressions is insignificant at
the 5% level, however. Accounting for selection, I obtain even stronger evidence that early
entry does not significantly lower incentives for independent generic entry. The recursive
bivariate probit estimates prove again that Pre-entry Market Size has the strongest impact
on generic entry decisions. A mere 1% increase in drug markets’ pre-entry revenues induces
on average a 14-18% increase in the (conditional) probability of independent generic entry.
In drug markets experiencing early entry a one standard deviation increase in pre-entry
revenues relative to mean pre-entry revenues corresponds to a 4.25% (Data Set 1: 4.5%)
increase in pre-entry revenues, boosting the likelihood of generic entry by roughly 60-76%.
Furthermore, the (conditional) probability of generic entry tends to increase on average
by 0.3% (0.07%) with each retail form launch prior to loss of exclusivity in drug relevant
therapeutic fields (using the particular drug’s routes of administration). Morton (1999) finds
positive effects from therapeutic and drug form experience of a similar magnitude. Given
the variation in potential entrants’ experience (retail form launches), the economic effect of
either therapeutic or drug form experience may not be negligible. A one standard deviation
increase in the number of retail form launches in relevant therapeutic fields40 increases the
likelihood of generic entry by 6.5-9.4%. Similarly, a one standard deviation increase in the
number of retail form launches in relevant therapeutic fields41 increases the likelihood of
generic entry up to 18.4%. An increase in the duration of the exclusivity period by one
year in turn raises the (conditional) probability of generic entry by 2-4% on average. Given
a standard deviation of 1.75 years, the effect tends to be small. Lastly, an increase in the
number of off-patent substances by one, reduces the generic entry probability by about 0.1-
40The standard deviation amounts to 21.8, 30.7 and 31.4 retail form launches in Data Set 1, 2, and 3.41The standard deviation amounts to 126, 258.3 and 262.4 retail form launches in Data Set 1, 2, and 3.
25

0.3% on average. The effect turns out to be modest given the variation42 in the number of
off-patent substitutes. The results suggest overall that independent generic entry is primarily
influenced by drug markets’ pre-entry revenues. Early entry turns out to have no significant
effect on generic entry decisions. Figure 2 displays the generic entry patterns in the high-
revenue drug markets experiencing early entry. The generic entry patterns observed confirm
the notion that drug markets’ pre-entry revenues stimulated generic entry greatly.
Figure 2: Generic Entry in Drug Markets experiencing Early Entry
I computed generic firms’ market shares in the bestseller segment – the dosage and drug
form yielding the largest generic revenues by 2007 – for drug markets experiencing at least
one year of off-patent competition. Comparing the turnover and revenue market shares of
first-movers entering post loss of exclusivity and those of early entrants, the latter appear
to obtain a considerably larger market share with respect to both turnover and revenue.
Multiple first generic entry, occurring in the majority of drug markets in Germany post loss
of exclusivity, appears to reduce first-mover advantages. Plotting turnover market shares
of generic firms against firms’ order of entry – including and excluding early entrants in
the sample of firms – one finds that generic first-movers entering post loss of exclusivity
42The standard deviation amounts to roughly 34, 37 and 37 substances in Data Set 1, 2, and 3.
26

tend to nevertheless have a considerable market share advantage over subsequent entrants.
Thus, even first-movers entering post loss of exclusivity pose a threat to subsequent generic
entrants’ profits. Appendix [G] provides the according graphs. This finding may in turn
explain why early entry does not significantly deter independent generic entry. Examining
the US pharmaceutical market, Berndt et al. (2007a) find that additional generic entrants
after the first four or five generic entrants do not significantly affect long-run generic-to-
brand price ratios. A relevant implication of this finding is that a reduction in the number
of independent generic firms as a result of early entry is unlikely to substantially impair
generic price competition, unless it results in fewer than four or five generic entrants. The
generic entry patterns in the majority of drug markets satisfy this criterion, suggesting that
the welfare effects of early entry are most likely to be minor. The monotonistic relationship
of early entry and pre-entry market revenues – intermediate-sized and high-revenue markets
experience early entry proportionally more often – indicate also that original drug producers
authorized generic entry prior to loss of exclusivity first and foremost fueled by rent-seeking
rather than strategic entry-deterrence motives (Fisher Ellison and Ellison, 2007).
7 Conclusion
This study provides recent empirical evidence on the impact of early entry – also known
as authorized, branded or pseudo-generic entry – on independent generic entry decisions
accounting for the endogeneity of early entry decisions. The results strongly suggest that
independent generic entry decisions are primarily influenced by drug markets’ pre-entry
revenues. Early entry turns out to have no significant impact on independent generic entry
decisions. Originators appear to authorize generic entry prior to loss of exclusivity to extract
generic profits rather than to deter generic entry. The European Commission’s survey of
originators conducted in course of its Pharmaceutical Market Sector Inquiry supports this
conclusion. Generic first-movers have been shown to enjoy a long-lasting advantage over
subsequent generic entrants (Caves et al., 1991; Grabowski and Vernon, 1992; Hollis, 2002) as
a result of doctors’, patients’ and pharmacists’ switching costs. Some economists accordingly
argue that anticipated early entry has an anti-competitive, deterring effect on independent
27

generic entry. Based on a unique micro data set comprising pharmaceutical market and
exclusivity data, I examine the impact of early entry on independent generic entry decisions
in the German pharmaceutical market within the time period 2002-2007. If generic and
early entry occurs in selective drug markets which are more (or less) attractive than given
market characteristics suggest (Hollis and Liang, 2006; FTC, 2009), there will be a spurious
correlation between early entry and generic entry decisions. Accounting for the endogeneity
of early entry decisions, I employ unique micro data and estimate univariate and recursive
bivariate probit models of entry. Recursive bivariate probit estimates indicate that early
entry decisions are endogeneous, rendering univariate probit estimates inconsistent. The
identification strategy in the bivariate probit model relies on the assumption of normality
and the fact that I model sequential entry decisions. As early entry decisions are arguably
motivated by pioneers’ financial distress, I add a count of each original drug producers’
further losses of exclusivity between 2002 and 2007 as an instrumental variable to the early
entry equation which improves identification. Regardless of the identifying assumption made,
I find no evidence that early entry significantly reduces the likelihood of generic entry.
Drug markets’ pre-entry revenues influence both independent generic entry and early
entry decisions most strongly. Just like previous related studies on generic entry, I also show
that the degree of off-patent competition affects generic entry decisions negatively, whereas
firms’ therapeutic and drug form experiences encourage generic entry. Monopoly duration
surprisingly influences generic entry decisions positively and not negatively, indicating that
the length of the exclusivity period is not necessarily a good proxy for pioneers’ accumulated
goodwill stock as suggested by Hurwitz and Caves (1988); Hudson (2000). Generic manufac-
turers appear to benefit first and foremost if medications are well-established. Government
scrutiny targeting early entry would be appropriate if small drug markets turned out to
experience early entry more frequently in the future. Further research is also warranted to
assess the welfare effects of early entry. Early entry may not impair generic entry decisions,
yet it could adversely affect competition in off-patent pharmaceutical markets. Gauging the
impact of early entry on generic manufacturers’ prices and market shares, and the rate of
price erosion, are important areas of research which I intend to examine in the future.
28

Appendix
[A-1] Brand Market Share post Generic Entry – Pfizer (Norvasc)
[A-2] Losses of Exclusivity, Early Entry & Generic Entry 2002–2007
29

30

[B] Allocation of Generic Entries and Zero-Entries to Substances
Data Set 1 Data Set 2 Data Set 3
Generic Early Generic
Substances Entry Entry Entries Zero-Entries Total Zero-Entries Total Zero-Entries Total
Acamprosate no no 0 100 100 16 16 11 11
Adapalene no no 0 101 101 23 23 11 11
Alfuzosine yes yes 13 87 100 21 34 20 33
Amisulpride yes no 13 86 99 41 54 41 54
Amlodipine yes no 32 70 102 22 54 18 50
Amorolfine no no 0 100 100 34 34 33 33
Azithromycin yes no 17 84 101 44 61 44 61
Benazepril yes no 8 92 100 37 45 37 45
Cabergoline yes no 8 93 101 29 37 22 30
Calcipotriol yes no 3 98 101 10 13 10 13
Carmustine no no 0 101 101 16 16 15 15
Carvedilole yes no 25 75 100 22 47 22 47
Cefixime yes yes 7 89 96 51 58 51 58
Cefpodoxime yes no 10 90 100 49 59 47 57
Ceftazidime yes no 6 95 101 52 58 14 20
Ceftibuten no no 0 101 101 61 61 59 59
Ceftriaxone yes no 10 92 102 48 58 12 22
Cilazapril no no 0 100 100 45 45 45 45
Citalopram yes no 28 70 98 12 40 12 40
Clarithromycin yes no 18 83 101 42 60 42 60
Croconazole no no 0 100 100 34 34 33 33
Didanosine no no 0 101 101 22 22 21 21
Ebastine no no 0 100 100 31 31 30 30
Epoetin alfa yes no 3 98 101 20 23 5 8
Fexofenadine no no 0 100 100 31 31 30 30
Filgrastim no no 0 101 101 4 4 3 3
Finasteride yes yes 20 80 100 24 44 16 36
Fleroxacin no no 0 101 101 60 60 57 57
Fluconazole yes no 19 81 100 3 22 3 22
Flumazenile yes no 5 98 103 15 20 6 11
Fosinopril yes no 3 97 100 42 45 42 45
Gabapentin yes yes 22 76 98 10 32 8 30
Ganciclovir no no 0 101 101 34 34 34 34
Glimepirid yes yes 21 79 100 20 41 20 41
Granisetron yes yes 1 97 98 18 19 17 18
Itraconazole yes yes 13 85 98 5 18 5 18
31
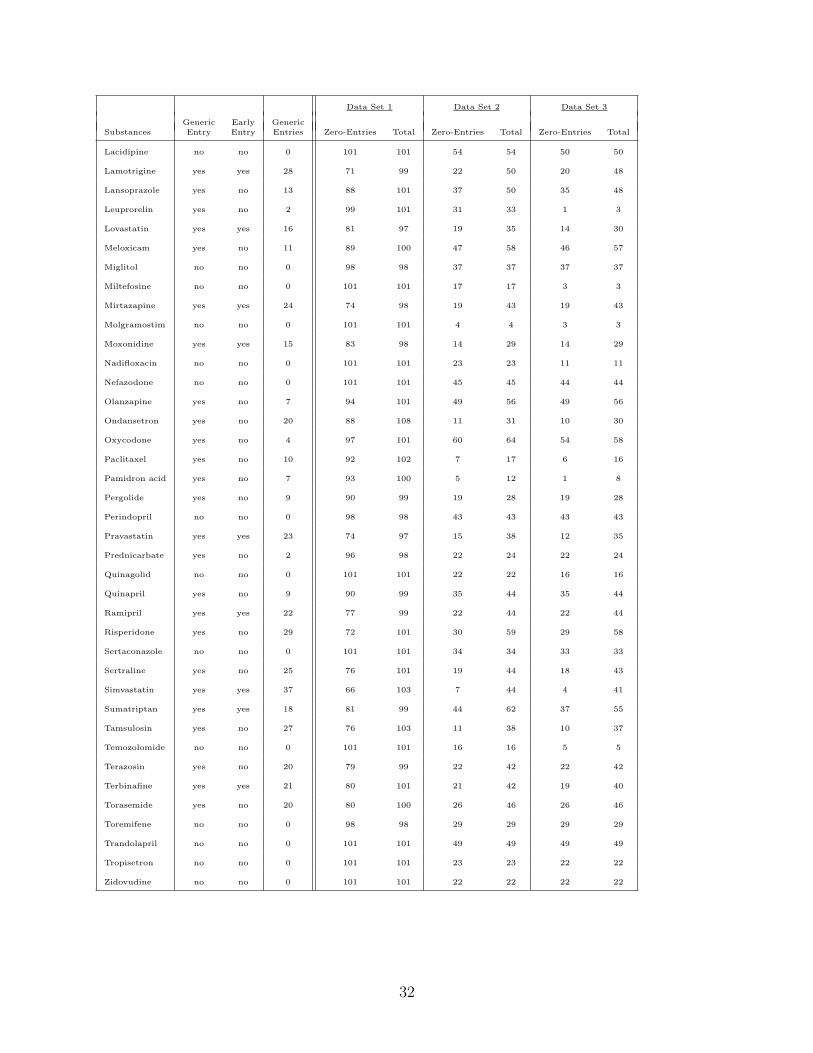
Data Set 1 Data Set 2 Data Set 3
Generic Early Generic
Substances Entry Entry Entries Zero-Entries Total Zero-Entries Total Zero-Entries Total
Lacidipine no no 0 101 101 54 54 50 50
Lamotrigine yes yes 28 71 99 22 50 20 48
Lansoprazole yes no 13 88 101 37 50 35 48
Leuprorelin yes no 2 99 101 31 33 1 3
Lovastatin yes yes 16 81 97 19 35 14 30
Meloxicam yes no 11 89 100 47 58 46 57
Miglitol no no 0 98 98 37 37 37 37
Miltefosine no no 0 101 101 17 17 3 3
Mirtazapine yes yes 24 74 98 19 43 19 43
Molgramostim no no 0 101 101 4 4 3 3
Moxonidine yes yes 15 83 98 14 29 14 29
Nadifloxacin no no 0 101 101 23 23 11 11
Nefazodone no no 0 101 101 45 45 44 44
Olanzapine yes no 7 94 101 49 56 49 56
Ondansetron yes no 20 88 108 11 31 10 30
Oxycodone yes no 4 97 101 60 64 54 58
Paclitaxel yes no 10 92 102 7 17 6 16
Pamidron acid yes no 7 93 100 5 12 1 8
Pergolide yes no 9 90 99 19 28 19 28
Perindopril no no 0 98 98 43 43 43 43
Pravastatin yes yes 23 74 97 15 38 12 35
Prednicarbate yes no 2 96 98 22 24 22 24
Quinagolid no no 0 101 101 22 22 16 16
Quinapril yes no 9 90 99 35 44 35 44
Ramipril yes yes 22 77 99 22 44 22 44
Risperidone yes no 29 72 101 30 59 29 58
Sertaconazole no no 0 101 101 34 34 33 33
Sertraline yes no 25 76 101 19 44 18 43
Simvastatin yes yes 37 66 103 7 44 4 41
Sumatriptan yes yes 18 81 99 44 62 37 55
Tamsulosin yes no 27 76 103 11 38 10 37
Temozolomide no no 0 101 101 16 16 5 5
Terazosin yes no 20 79 99 22 42 22 42
Terbinafine yes yes 21 80 101 21 42 19 40
Torasemide yes no 20 80 100 26 46 26 46
Toremifene no no 0 98 98 29 29 29 29
Trandolapril no no 0 101 101 49 49 49 49
Tropisetron no no 0 101 101 23 23 22 22
Zidovudine no no 0 101 101 22 22 22 22
32

[C-1] Summary Statistics Data Set1
Variable Name Mean Median Min. Max. Sd. N
Generic Entry 0.10 0 0 1 – 7517
Early Entry 0.21 0 0 1 – 7517
Pre-Entry Market Size (eMio.) 32.8 14.8 0 187 41.5 7517
Pre-Entry Market Size (log) 15.76 16.51 0 19.05 3.40 7517
Monopoly Duration 12.12 12.5 5 20 3.27 7517
Substitutes 47.86 39 8 204 34.91 7517
Field Experience 9.39 0 0 374 25.40 7517
Form Experience 84.19 26 0 1679 157.00 7517
Financial Distress 2.95 2 0 6 2.43 7517
[C-2] Summary Statistics Data Set2
Variable Name Mean Median Min. Max. Sd. N
Generic Entry 0.26 0 0 1 – 2804
Early Entry 0.23 0 0 1 – 2804
Pre-Entry Market Size (eMio.) 37.3 19.1 0 187 44.6 2804
Pre-Entry Market Size (log) 16.05 16.76 0 19.05 3.15 2804
Monopoly Duration 12.12 12.5 5 20 3.23 2804
Substitutes 54.51 44 8 204 35.81 2804
Field Experience 25.18 11 0 374 36.50 2804
Form Experience 165.21 75 0 1679 218.67 2804
Financial Distress 2.94 2 0 6 2.46 2804
33

[D] Univariate Probit (incl. Instrument) – Coefficients
Data Set 1 (N=7517) Data Set 2 (N=2804) Data Set 3 (N=2531)
Generic Entry Generic Entry Generic Entry
Early Entry (0/1) -0.2157*** -0.1534* -0.1390
(0.055) (0.074) (0.076)
Pre-Entry 0.5797*** 0.7328*** 0.7743***Market Size (log) (0.045) (0.049) (0.049)
Monopoly Duration 0.1218*** 0.1441*** 0.1482***
(0.014) (0.016) (0.017)
Substitutes -0.0018 -0.0084*** -0.0079***
(0.001) (0.001) (0.001)
Field Experience 0.0139*** 0.0078*** 0.0075***
(0.002) (0.001) (0.002)
Form Experience 0.0030*** 0.0023*** 0.0022***
(3.1e-04) (3.4e-04) (3.4e-04)
Financial Distress 0.0015 -0.0168 -0.0020
(0.012) (0.014) (0.015)
Therap. Field (0/1) yes yes yes
Drug Form (0/1) yes yes yes
Year Expiry (0/1) yes yes yes
Const. -11.4209*** -13.0998*** -13.6102***
Prob > chi2(24) <0.001 <0.001 <0.001
Log-Likelihood -1403.63 -977.68 -914.90
* p<0.05, ** p<0.01, *** p<0.001
Notes: An observation in the regression is the decision of a generic firm to enter a drug market post loss ofexclusivity (generic entry). Heteroskedasticity-robust and clustered standard errors in parentheses. Oral drugs inparasitology and sense organs with loss of exclusivity in 2002 form the reference group in generic entry equations.
34

[E-1] Recursive Bivariate Probit (excl. Instrument) – Coefficients
Data Set 1 (N=7517) Data Set 2 (N=2804) Data Set 3 (N=2531)
Generic Early Generic Early Generic EarlyEntry Entry Entry Entry Entry Entry
Early Entry (0/1) -1.6293*** -1.5228*** -1.5034***(0.062) (0.053) (0.054)
Pre-Entry 0.7987*** 0.7867*** 0.9086*** 0.8634*** 0.9739*** 0.9209***Market Size (log) (0.033) (0.011) (0.044) (0.037) (0.043) (0.043)
Monopoly Duration 0.0531*** 0.1053*** 0.1430*** 0.0888*** 0.1551*** 0.1160***
(0.009) (0.002) (0.012) (0.010) (0.013) (0.011)
Substitutes -0.0035*** -0.0022*** -0.0064*** 0.0003 -0.0071*** -0.0011
(0.001) (1.7e-04) (0.001) (0.010) (0.001) (0.001)
Field Experience 0.0121*** – 0.0069*** – 0.0068*** –
(0.002) (0.001) (0.001)
Form Experience 0.0021*** – 0.0016*** – 0.0016*** –
(2.7e-04) (2.5e-04) (2.6e-04)
Therap. Field (0/1) yes yes yes yes yes yes
Drug Form (0/1) yes no yes no yes no
Year Expiry (0/1) yes yes yes yes yes yes
Const. -14.5317*** -14.6976*** -16.0689*** -16.5732*** -17.0781*** -17.6726***
Prob > chi2(35) <0.001 <0.001 <0.001
Log-Likelihood -3903.83 -1919.02 -1789.76
ρ 0.9209*** 0.9363*** 0.9382***
Wald Test: chi2(1) 52.02 101.04 90.55
Prob > chi2(1) <0.001 <0.001 <0.001
* p<0.05, ** p<0.01, *** p<0.001
Notes: In columns (1), (3) and (5) an observation in the regression is the decision of a generic firm to enter a drug market postloss of exclusivity (generic entry). In columns (2), (4) and (6) the occurrence of early entry prior to loss of exclusivity denotes thedependent variable. Heteroskedasticity-robust and clustered standard errors in parentheses. Oral drugs in parasitology and senseorgans with loss of exclusivity in 2002 form the reference group in the generic entry equation. The Wald Test is conducted for thenull hypothesis of ρ = 0, i.e. absence of correlation in the model.
[E-2] Likelihood-ratio test: Restricted vs. Unrestricted Model
Data Set 1 (N=7517) Data Set 2 (N=2804) Data Set 3 (N=2531)
Model Restricted Unrestricted Restricted Unrestricted Restricted Unrestricted
Log-Likelihood -3903.83 -3870.52 -1919.02 -1903.42 -1789.76 -1775.53
LR chi2(1) 66.62 31.20 28.45
Prob > chi2 <0.001 <0.001 <0.001
35

[F] Univariate & Rec. Bivariate Probit – Avg. Marginal Effects (All Drugs)
Data Set 1 (N=7517) Data Set 2 (N=2804) Data Set 3 (N=2531)
Dep.: Generic Entry Univariate Bivariate Univariate Bivariate Univariate BivariateProbit Probit Probit Probit Probit Probit
Early Entry (0/1) -0.0215*** -0.0122 -0.0298* 0.0375 -0.0278 0.0484
(0.005) (0.019) (0.014) (0.045) (0.015) (0.045)
Pre-Entry 0.0597*** 0.0676*** 0.1441*** 0.1230*** 0.1578*** 0.1328***Market Size (log) (0.006) (0.016) (0.010) (0.025) (0.009) (0.026)
Monopoly Duration 0.0125*** 0.0110*** 0.0284*** 0.0310*** 0.0303*** 0.0286***
(0.002) (0.002) (0.003) (0.009) (0.003) (0.008)
Substitutes -0.0002 -0.0003* -0.0016*** -0.0026*** -0.0016*** -0.0027***
(1.2e-04) (1.4e-04) (8.5e-04) (7.8e-04) (8.5e-04) (7.5e-04)
Field Experience 0.0014*** 0.0016*** 0.0015*** 0.0025** 0.0015*** 0.0025**
(1.9e-04) (4.1e-04) (3.6e-04) (8.7e-04) (2.8e-04) (8.9e-04)
Form Experience 0.0003*** 0.0003*** 0.0004*** 0.0006** 0.0004*** 0.0006**
(2.9e-05) (7.4e-05) (5.7e-05) (1.9e-04) (6.1e-05) (1.9e-04)
* p<0.05, ** p<0.01, *** p<0.001
Notes: Average marginal effects are reported for the 75 drug markets experiencing a loss of exclusivity between 2002and 2007. Average marginal effects presented for the univariate (recursive bivariate) probit model denote average, ceterisparibus changes in the likelihood of independent generic entry (conditional on early entry having occured).
[G] Generic Market Shares & Entry Order (Bestseller Segment)
36
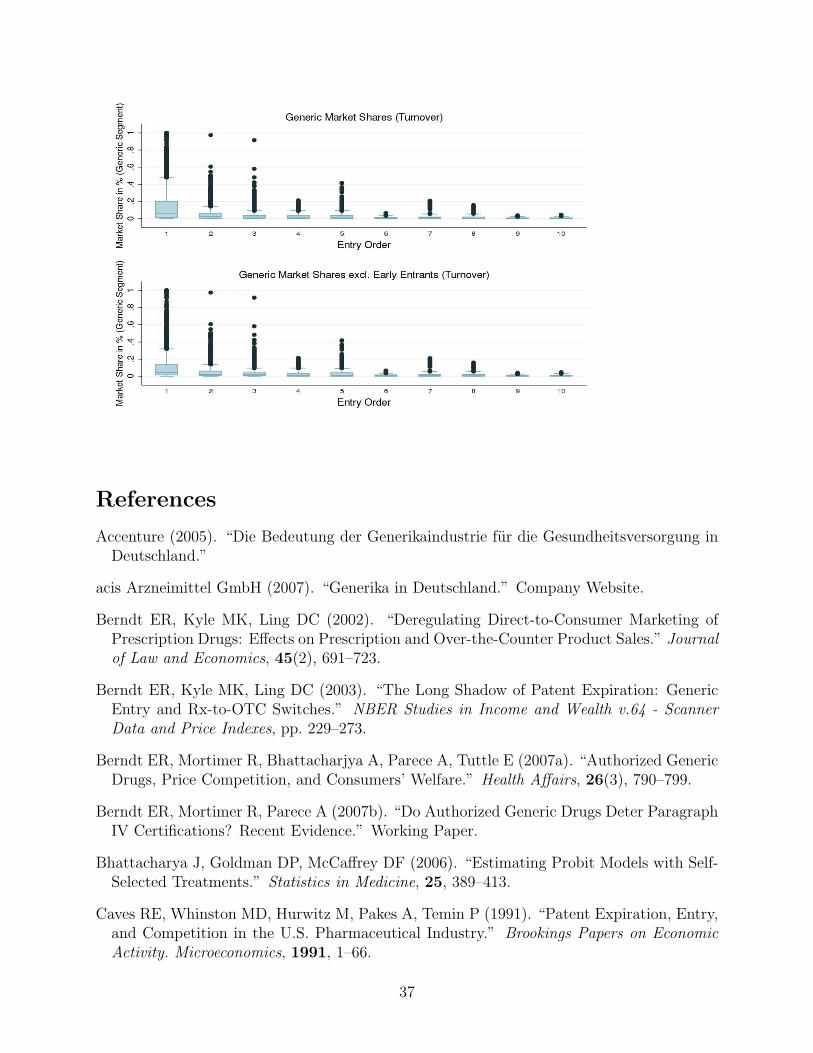
References
Accenture (2005). “Die Bedeutung der Generikaindustrie fur die Gesundheitsversorgung inDeutschland.”
acis Arzneimittel GmbH (2007). “Generika in Deutschland.” Company Website.
Berndt ER, Kyle MK, Ling DC (2002). “Deregulating Direct-to-Consumer Marketing ofPrescription Drugs: Effects on Prescription and Over-the-Counter Product Sales.” Journalof Law and Economics, 45(2), 691–723.
Berndt ER, Kyle MK, Ling DC (2003). “The Long Shadow of Patent Expiration: GenericEntry and Rx-to-OTC Switches.” NBER Studies in Income and Wealth v.64 - ScannerData and Price Indexes, pp. 229–273.
Berndt ER, Mortimer R, Bhattacharjya A, Parece A, Tuttle E (2007a). “Authorized GenericDrugs, Price Competition, and Consumers’ Welfare.” Health Affairs, 26(3), 790–799.
Berndt ER, Mortimer R, Parece A (2007b). “Do Authorized Generic Drugs Deter ParagraphIV Certifications? Recent Evidence.” Working Paper.
Bhattacharya J, Goldman DP, McCaffrey DF (2006). “Estimating Probit Models with Self-Selected Treatments.” Statistics in Medicine, 25, 389–413.
Caves RE, Whinston MD, Hurwitz M, Pakes A, Temin P (1991). “Patent Expiration, Entry,and Competition in the U.S. Pharmaceutical Industry.” Brookings Papers on EconomicActivity. Microeconomics, 1991, 1–66.
37
EUC (2008). “European Commission: Pharmaceutical Sector Inquiry – Preliminary Report.”
EUC (2009). “European Commission: Pharmaceutical Sector Inquiry – Final Report.”
Evans WN, Schwab RM (1995). “Finishing High School and Starting College: Do CatholicSchools Make a Difference?” The Quarterly Journal of Economics, 110(4), 941–974.
Fisher Ellison S, Ellison G (2007). “Strategic Entry Deterrence and the Behavior of Phar-maceutical Incumbents Prior to Patent Expiration.” NBER Working Paper No. W13069.
FTC (2002). “Federal Trade Commission: Generic Drug Entry Prior to Patent Expiration– An FTC Study.”
FTC (2009). “Federal Trade Commission: Authorized Generics – An Interim Report.”
Goldman DP, Bhattacharya J, McCaffrey DF, Duan N, Leibowitz AA, Joyce GF, MortonSC (2001). “Effect of Insurance on Mortality in an HIV-Positive Population in Care.”Journal of the American Statistical Association, 96, 883–894.
Grabowski HG, Kyle MK (2007). “Generic Competition and Market Exclusivity in Phar-maceuticals.” Managerial and Decision Economics, 28, 491–502.
Grabowski HG, Vernon JM (1992). “Brand Loyalty, Entry, and Price Competition in Phar-maceuticals after the 1984 Drug Act.” Journal of Law and Economics, 35, 331–350.
Greene WH (2008). Econometric Analysis – Sixth Edition. Pearson Prentice Hall.
Hollis A (2002). “The Importance of Being First: Evidence from Canadian Generic Phar-maceuticals.” Health Economics, 11, 723–734.
Hollis A (2003). “The Anti-Competitive Effects of Brand-Controlled “Pseudo-Generics” inthe Canadian Pharmaceutical Market.” Canadian Public Policy / Analyse de Politiques,29, 21–32.
Hollis A, Liang BA (2006). “An Assessment of the Effect of Authorized Generics on Con-sumer Prices.” Working Paper.
Hudson J (2000). “Generic Take-up in the Pharmaceutical Market following Patent Expiry- A Multi-Country Study.” International Review of Law and Economics, 20, 205–221.
Hurwitz MA, Caves RE (1988). “Persuasion or Information? Promotion and the Shares ofBrand Name and Generic Pharmaceuticals.” Journal of Law and Economics, 31, 299–320.
Janakiraman R, Dutta S, Sismeiro C, Stern P (2008). “Physicians’ Persistence and Its Im-plications for Their Response to Promotion of Prescription Drugs.” Management Science,54, 1080–1093.
Jones AM, Xander K, van Doorslaer E (2006). “The Impact of Having Supplementary PrivateHealth Insurance on the Use of Specialists.” Annales D’Economie et De Statistique, 83,251–275.
38

Kyle MK (2006). “The Role of Firm Characteristics in Pharmaceutical Product Launches.”The Rand Journal of Economics, 37, 602–618.
Kyle MK (2007). “Pharmaceutical Price Controls and Entry Strategies.” The Review ofEconomics and Statistics, 89, 88–99.
Magazzini L, Pammolli F, Riccaboni M (2004). “Dynamic Competition in Pharmaceuticals:Patent Expiry, Generic Penetration, and Industry Structure.” The Europen Journal ofHealth Economics, 5, 175–182.
Moreno-Torres I, Puig-Junoy J, Borrell-Arque JR (2009). “Generic Entry into a RegulatedPharmaceutical Market.” Review of Industrial Organization, 34, 373–388.
Morton FMS (1999). “Entry Decisions in the Generic Pharmaceutical Industry.” The RANDJournal of Economics, 30, 421–440.
Morton FMS (2000). “Barriers to Entry, Brand Advertising, and Generic Entry in the U.S.Pharmaceutical Industry.” International Journal of Industrial Organization, 18, 1085–1104.
Papke LE, Wooldridge JM (2005). “A computational trick for delta-method standard errors.”Economics Letters, 86, 413–417.
Reiffen D, Ward MR (2005). “Generic Drug Industry Dynamics.” Review of Economics andStatistics, 87, 37–49.
Reiffen D, Ward MR (2007). “Branded Generics as a Strategy to Limit Cannibalization ofPharmaceutical Markets.” Managerial and Decision Economics, 28, 251–265.
Saha A, Grabowski H, Birnbaum H, Greenberg P, Bizan O (2006). “Generic Competition inthe U.S. Pharmaceutical Industry.” International Journal of the Economics of Business,13, 15–38.
Scherer FM (2000). The Pharmaceutical Industry. Handbook of Health Economics, I. Else-vier. Culyer, A.J., Newhouse, J.P. (Eds.), Amsterdam.
WHO (2005). “The WHO/United Nations – Pre-qualification Project.”
Wilde J (2000). “Identification of Multiple Equation Probit Models with Endogenous DummyRegressors.” Economics Letters, 69, 309–312.
39