appdynamics vs new relic – the complete guide
TRANSCRIPT

AppDynamics VS New Relic – The Complete Guide
www.takipi.comTakipi

Table of Contents
1. What is APM?2. Supported Languages and Environments3. Features
• Backend Monitoring• Frontend & Mobile Monitoring
4. How to Solve the Errors You Find5. Installation6. Dashboard and Usage7. Integrations and Plugins8. Pricing9. Conclusion
Takipiwww.takipi.com
What is APM
• APM(Application Performance Management) provides analytics around application’s performance – at the core i.e., timing how long it takes to execute different areas in the code and complete transactions
• Achieved by : • Instrumenting the code
• Monitoring logs or
• Including network / hardware metrics.
Takipiwww.takipi.com

Supported Environments
AppDynamics
• Java, Scala, .NET, PHP, Node.js, iOS and Android; including most of database and cloud platform.
• provides frontend support for iOS, Android, and JavaScript.
New Relic
• Java, Scala, .NET, PHP, Node.js, Ruby and Python. Supported variety of databases, cloud platforms and readily available plug-ins.
• provides frontend support for iOS, Android, and JavaScript.
Takipiwww.takipi.com
Main difference : New Relic’s Ruby and Python support, different levels of support for various platforms.

Features
• Both New Relic and AppDynamics can be broken down into 6 different products, all reporting to a main dashboard interface.
• Let’s compare them via:1. Backend Monitoring
2. Mobile and Frontend Monitoring.
Takipiwww.takipi.com
1.Backend Monitoring
Takipiwww.takipi.com
Application Performance Management
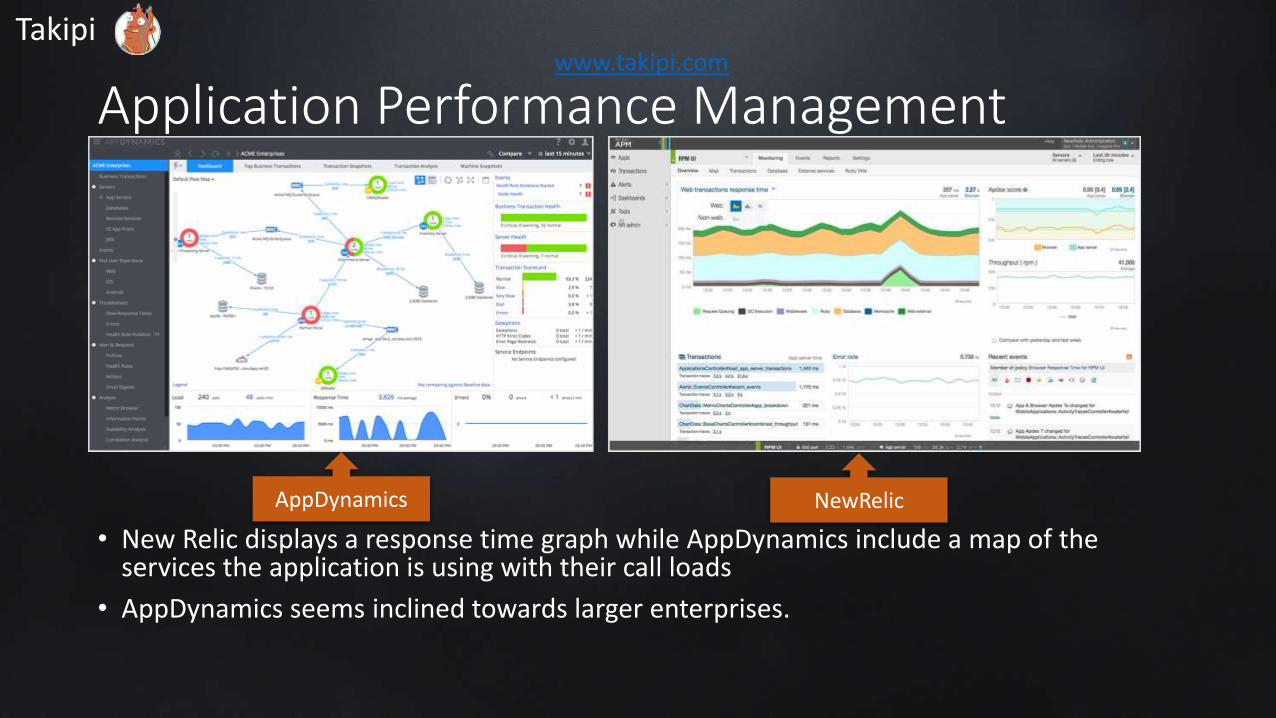
• New Relic displays a response time graph while AppDynamics include a map of the services the application is using with their call loads
• AppDynamics seems inclined towards larger enterprises.
AppDynamics NewRelic
Takipiwww.takipi.com
Alerting and Reporting
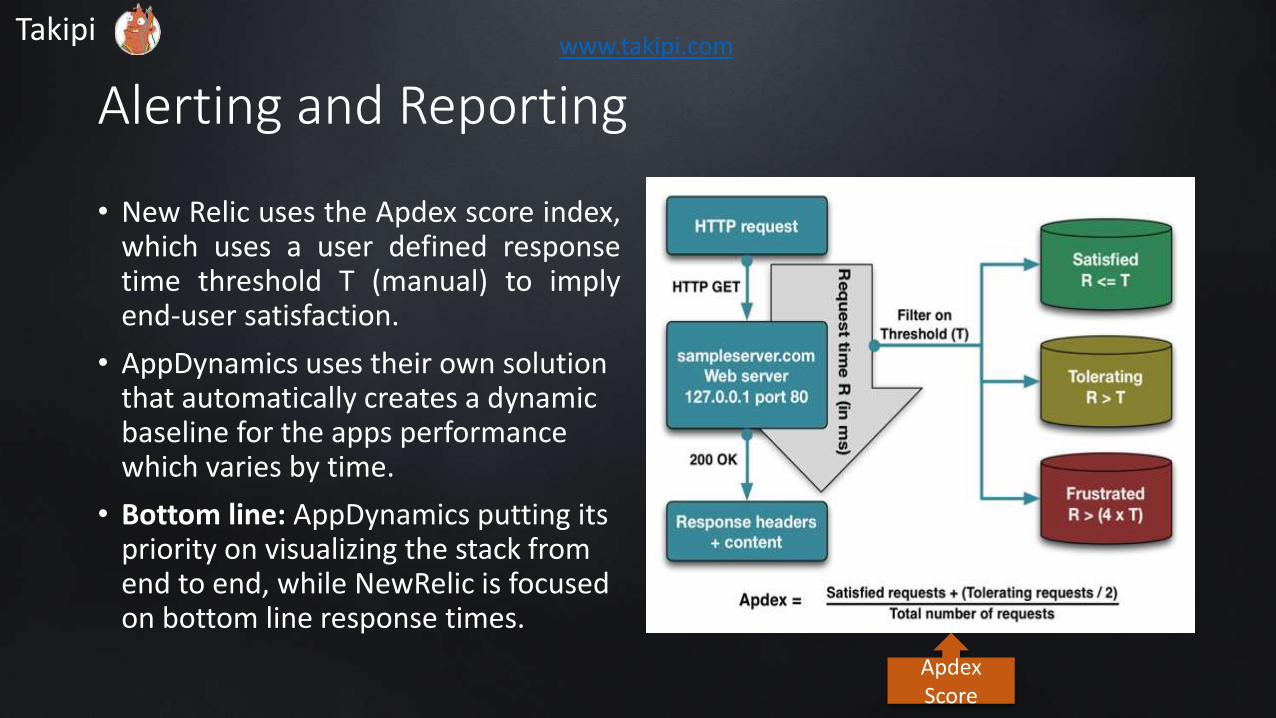
• New Relic uses the Apdex score index,which uses a user defined responsetime threshold T (manual) to implyend-user satisfaction.
• AppDynamics uses their own solution that automatically creates a dynamic baseline for the apps performance which varies by time.
• Bottom line: AppDynamics putting its priority on visualizing the stack from end to end, while NewRelic is focused on bottom line response times.
ApdexScore
Takipiwww.takipi.com
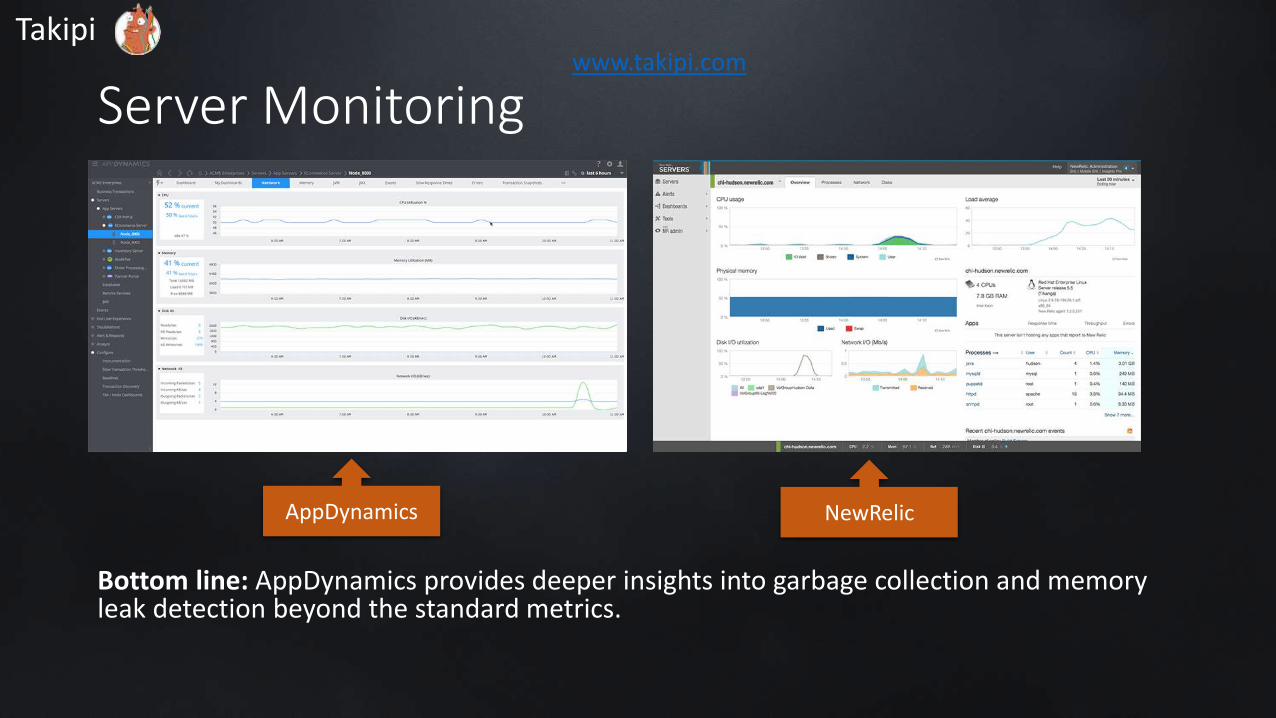
Server Monitoring
Bottom line: AppDynamics provides deeper insights into garbage collection and memory leak detection beyond the standard metrics.
AppDynamics NewRelic
Takipiwww.takipi.com
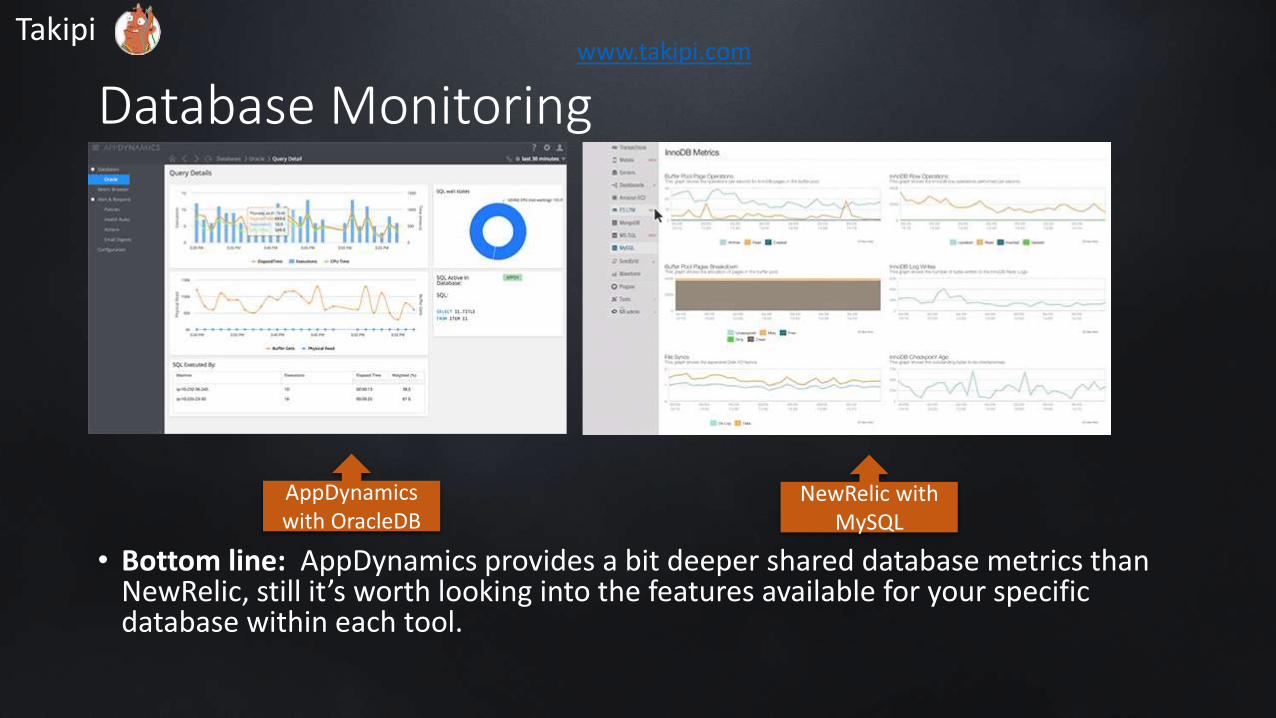
Database Monitoring
• Bottom line: AppDynamics provides a bit deeper shared database metrics than NewRelic, still it’s worth looking into the features available for your specific database within each tool.
AppDynamics with OracleDB
NewRelic with MySQL
Takipiwww.takipi.com
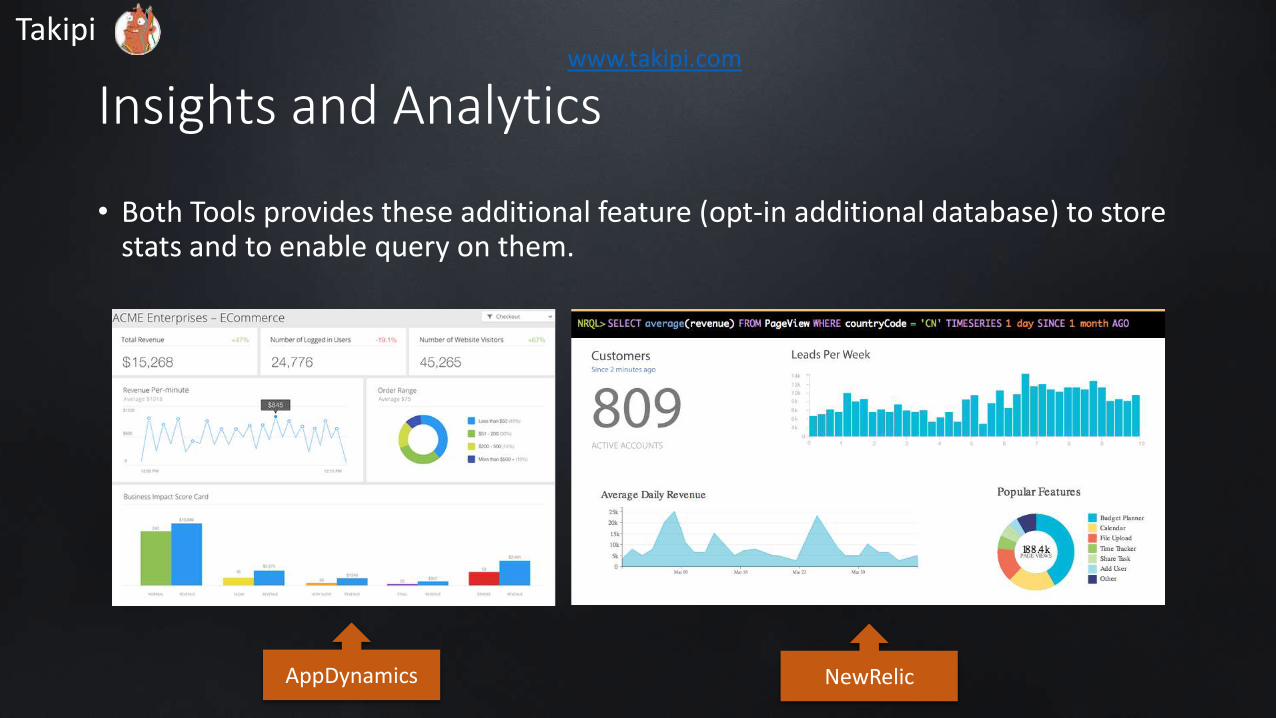
Insights and Analytics
• Both Tools provides these additional feature (opt-in additional database) to store stats and to enable query on them.
AppDynamics NewRelic
Takipiwww.takipi.com
Takipiwww.takipi.com
2.Frontend & Mobile Monitoring
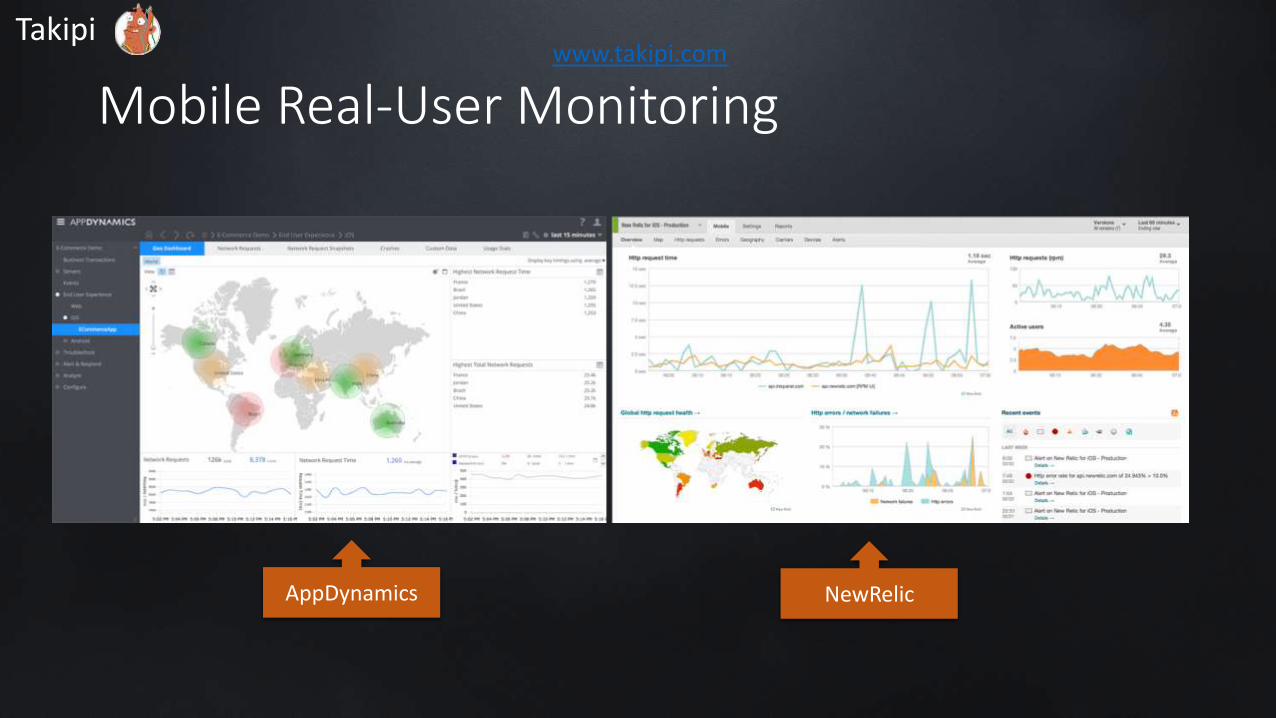
Mobile Real-User Monitoring
AppDynamics NewRelic
Takipiwww.takipi.com

Browser Real-User Monitroing
• Bottom line: New Relic’s focus is on response time bottom lines while AppDynamics emphasizes the global picture.
AppDynamics NewRelic
Takipiwww.takipi.com

How to Solve the errors you find?
Takipiwww.takipi.com
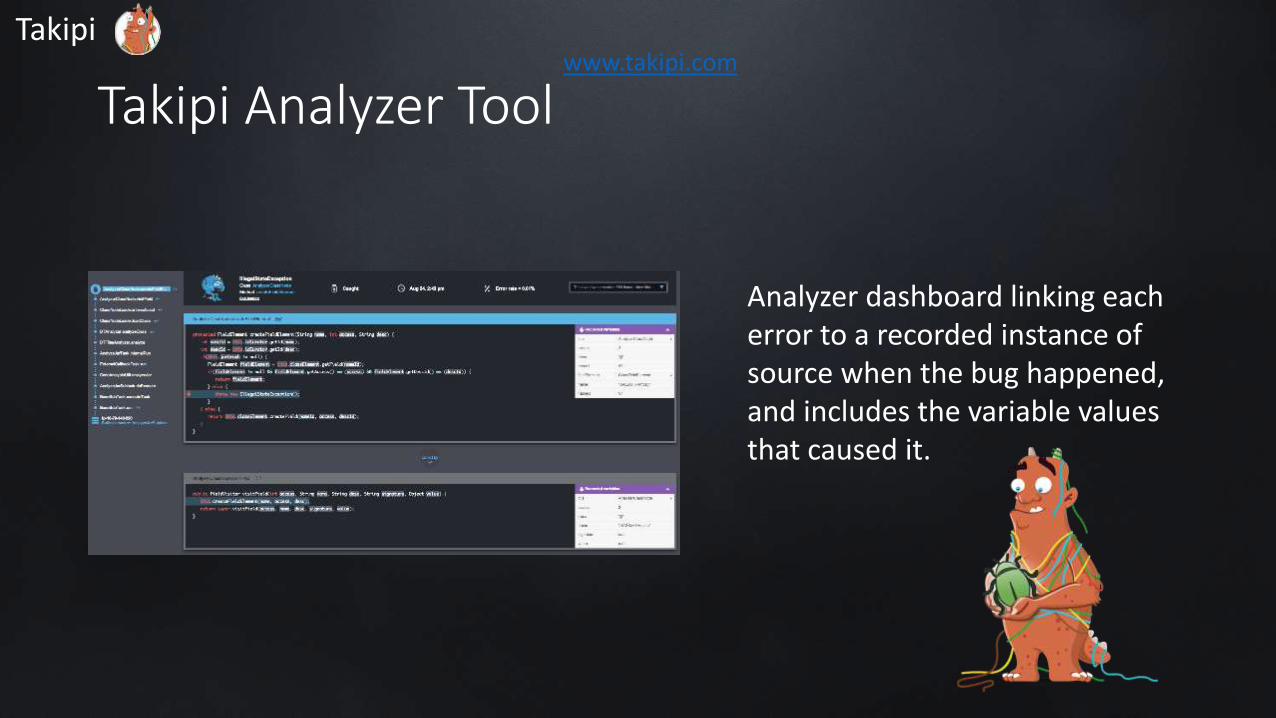
Takipi Analyzer Tool
Analyzer dashboard linking each error to a recorded instance of source when the bug happened, and includes the variable values that caused it.
Takipiwww.takipi.com

Contd.
• Takipi’s New Relic plug-in that displays an exception and log error dashboard:
Takipiwww.takipi.com
Dashboard and Usage
• Browse following videos for better feel of each tool’s user experience and way of solving problems.
• AppDynamics
• NewRelic
Takipiwww.takipi.com

Installation
• Bottom line: Pick AppDynamics if on-premise version is a requirement, else ease of installation is pretty much the same – mind the alerting though.
Parameters New Relic AppDynamics
SaaS/On-Premise Only available through SaaS Offers a few modes of operation –SaaS, on-premises and a hybrid approach, each with its installation instructions
Agents uses a Java agent to collect the performance data in order to solve the error instead of pointing on it, Takipi uses a native agent.
Same as new relic
Alerting Relies on custom thresholds defined by user for its Apdex index
Computes response time thresholds by itself and might take some time to learn user’s system.
Takipiwww.takipi.com
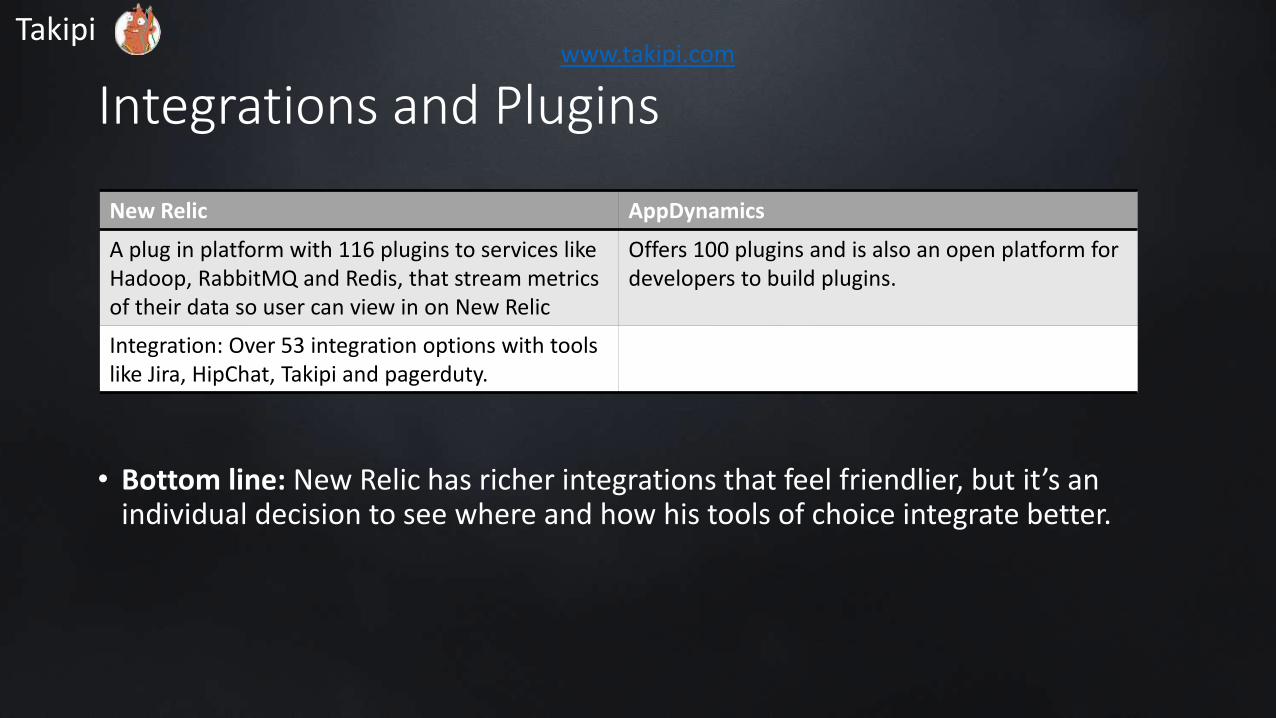
Integrations and Plugins
• Bottom line: New Relic has richer integrations that feel friendlier, but it’s an individual decision to see where and how his tools of choice integrate better.
New Relic AppDynamics
A plug in platform with 116 plugins to services like Hadoop, RabbitMQ and Redis, that stream metrics of their data so user can view in on New Relic
Offers 100 plugins and is also an open platform for developers to build plugins.
Integration: Over 53 integration options with tools like Jira, HipChat, Takipi and pagerduty.
Takipiwww.takipi.com
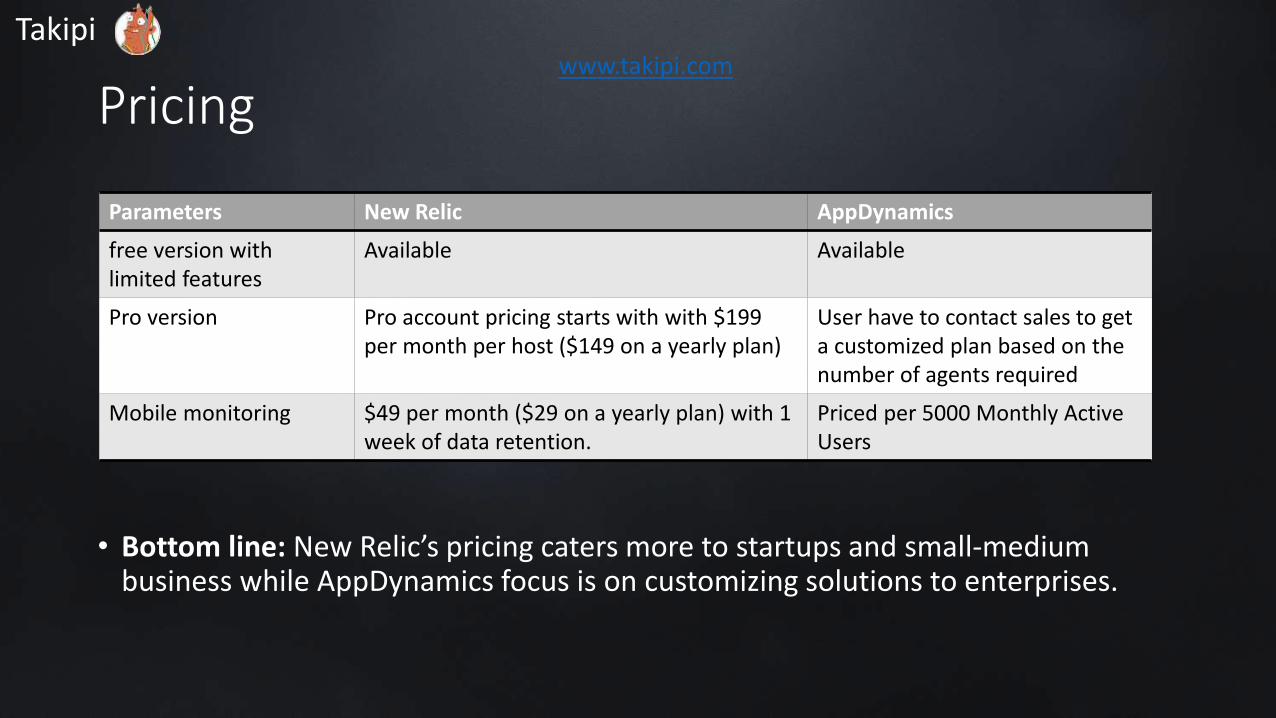
Pricing
• Bottom line: New Relic’s pricing caters more to startups and small-medium business while AppDynamics focus is on customizing solutions to enterprises.
Parameters New Relic AppDynamics
free version with limited features
Available Available
Pro version Pro account pricing starts with with $199 per month per host ($149 on a yearly plan)
User have to contact sales to get a customized plan based on the number of agents required
Mobile monitoring $49 per month ($29 on a yearly plan) with 1 week of data retention.
Priced per 5000 Monthly Active Users
Takipiwww.takipi.com

Conclusion
• Both AppDynamics and New Relic are top of the line APM tools, each traditionally targeted a different type of developers, from enterprises to startups.
• On premises - pick AppDynamics. Otherwise, it’s an individual call depends on which better fits your stack and which of all these features are going to be useful.
Takipiwww.takipi.com

Originally Posted on
Here is the link
Takipi Blog
Takipiwww.takipi.com