app 06 flotation manual
TRANSCRIPT

8/8/2019 App 06 Flotation Manual
http://slidepdf.com/reader/full/app-06-flotation-manual 1/10

8/8/2019 App 06 Flotation Manual
http://slidepdf.com/reader/full/app-06-flotation-manual 2/10
2 Markku Huhtamäki
Introduction
At waste water treatment plants where post clarification is wide enough, it is possible toreach 0.1 mg P/l residual phosphorus level by optimizing the used chemicals and by minorimprovements (Jokinen 2005). If there is a need to invest in a separate post treatment unitflotation is a considerable choice for sand- and other filtrations.
Nowadays often 0.3 mg/l phosphor is required. The demands are going to be tightenedwith implementation of the water framework directive probably to a level of 0.15 mg P/l(Uijterlinde et al 2005). In order to fulfil these demands tertiary treatment but alsomanagement and treatment of bypass waters have to be taken care of. 2% of bypass waterscause 0.1 mg/l phosphor and the permissions may demand to treat them. Flotation equipmentbuilt for tertiary treatment can be utilized for treatment of storm water peaks to lower theenvironmental load without significant additional investments.
In this report flotation technology is evaluated for municipal effluent treatment. Thisreport is produced in the Ripesca-project (LIFE03 ENV/FIN/000237) at Raisio town and
with the contribution of the LIFE financial instrument of the European Community.
Flotation process
Microflotation (= dissolved air flotation) is a process used to separate solid particles fromliquid with the aid of air bubbles. Very small air bubbles are created by dissolving of air towater under pressure followed by release of pressure in a flotation basin. The bubbles attachto the particles and they rise to the surface. The sludge is scraped off from the surface.Chemicals can be used to precipitate soluble material and to increase separation of particles.At potable water treatment typically a flocculation time 15 – 30 min has been used before theflotation. With better understanding this has reduced to 5 minutes. The industrial flotationsystems are often without the flocculation basin or the residence time is short (figure 1).
Key benefits of flotation process are good separation efficiency for bulking sludge, thecapacity of tolerating high solid-load fluctuations, thick separated sludge and small spacerequirement and residence time. The drawbacks are high energy consumption and need forchemicals. However, when used for tertiary treatment the chemical consumption can bedecreased correspondingly in other parts of the process. The total costs for flotation andcompeting technologies consist mainly of the capital costs.
Pressurized air
Water
Polymer
Precipitation chem.
Water Sludge
Dispersion water cycle
Flocculation
Flotation basin
Contact zone
Figure 1. Diagram of a flotation process
8/8/2019 App 06 Flotation Manual
http://slidepdf.com/reader/full/app-06-flotation-manual 3/10
Markku Huhtamäki 3
Technical solutions
Flotation has been used more than one hundred year. It is widely used in industrialprocesses, e.g. in separation of oils and fats and in treating process water cycles in paper
industry. In some cases the feed water contains 1000 – 2000 mg/l and even 6000 – 10000mg/l clay and fiber which are removed in flotation to a level of 20 – 100 mg/l.
Dissolved air flotation for potable water treatment became popular in Scandinavia in the1960’s. The benefits of the process were its compact nature and ability to treat cold, softcoloured waters and the fact that no polymer addition was required. During 1970’s theprocess was launched to UK particularly for waters that suffered algal blooms. In UK it camepopular in the early 1990´s and has spread after that to North American and Asian markets.
The biggest plants treat over million m3 /d water (e.g. Tai Po/Hong Kong 1 200 000m3 /d).The surface area of the smallest commercial units is 1 m2 and the capacity a few m3 /h.
The knowledge of the flocculation and flotation processes as well as the equipments hasdeveloped remarkably during the past years. During 1980´s a typical surface load was 2 - 4(m3 /h)/m2, when it is now on a level of 7 m/h. There are new high rate flotation types
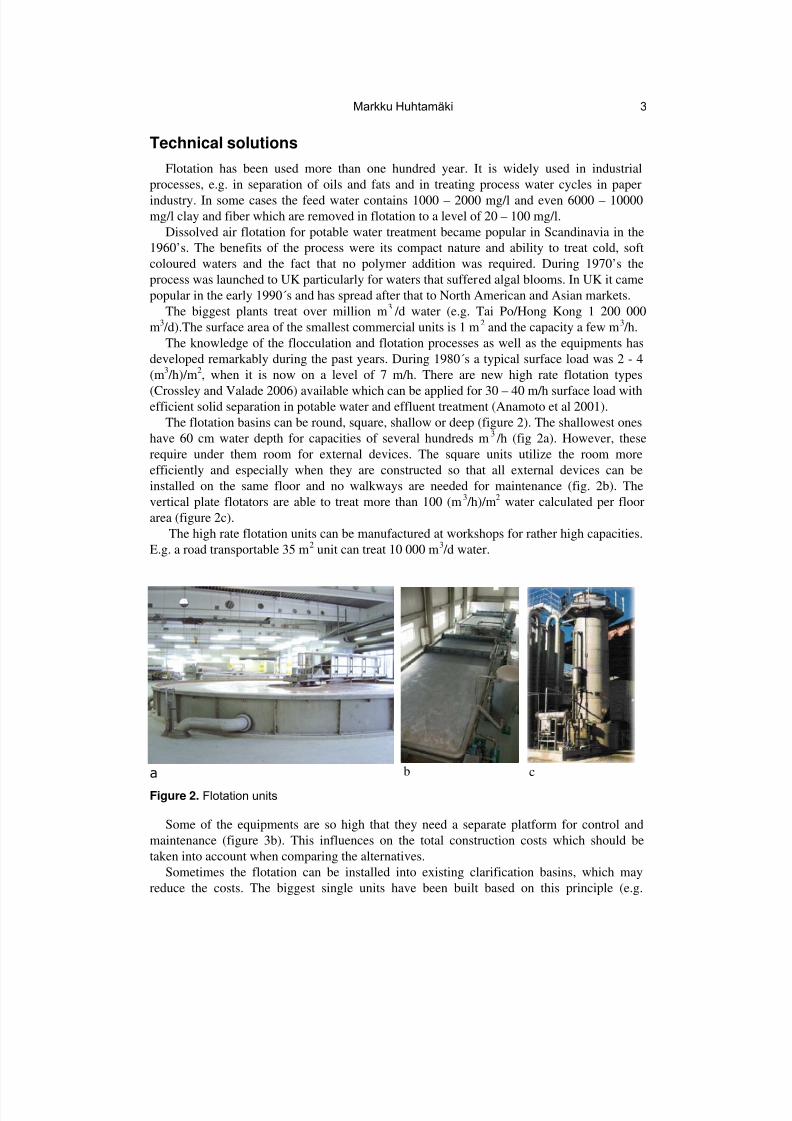
(Crossley and Valade 2006) available which can be applied for 30 – 40 m/h surface load withefficient solid separation in potable water and effluent treatment (Anamoto et al 2001).The flotation basins can be round, square, shallow or deep (figure 2). The shallowest ones
have 60 cm water depth for capacities of several hundreds m3 /h (fig 2a). However, theserequire under them room for external devices. The square units utilize the room moreefficiently and especially when they are constructed so that all external devices can beinstalled on the same floor and no walkways are needed for maintenance (fig. 2b). Thevertical plate flotators are able to treat more than 100 (m3 /h)/m2 water calculated per floorarea (figure 2c).
The high rate flotation units can be manufactured at workshops for rather high capacities.E.g. a road transportable 35 m2 unit can treat 10 000 m3 /d water.
a b c
Figure 2. Flotation units
Some of the equipments are so high that they need a separate platform for control andmaintenance (figure 3b). This influences on the total construction costs which should betaken into account when comparing the alternatives.
Sometimes the flotation can be installed into existing clarification basins, which mayreduce the costs. The biggest single units have been built based on this principle (e.g.

8/8/2019 App 06 Flotation Manual
http://slidepdf.com/reader/full/app-06-flotation-manual 4/10
4 Markku Huhtamäki
Ipoh/Malaysia a´ 225 m2. Capacity 275000 m3 /d treating river water from inlet turbidity of 80 – 400 NTU to 2 NTU residual turbidity).
In effluent treatment high amounts of thick sludge can be produced. The surface sludgesystems have to be designed for that (figure 4). When raw, screened effluent is treated, theunit should be equipped with bottom sludge removal and especially the dispersion watersystem has to be designed to tolerate the solids in the pre-screened effluent. The flotationunits used for potable water treatment are often designed for small sludge amounts and onlyfor fine particles. Without modifications these may not fulfil the practical requirements foreffluent treatment. Flotation units which are used in paper industry are often suitable also foreffluent treatment.
3a 3b
Figure 3. Dispersion nozzle systems in two cases – on the left a unit with 12 nozzles, at right
320 nozzles). The capacity of each unit is 750 m3/h
4a 4b
Figure 4. Surface sludge can be removed using chain scrapers or sludge rollers (flippers)
In potable water treatment and in pulp and paper industry there are fully automated plantswhich need only minor supervision and maintenance.
However, if the technical construction of the unit is not in balance with the application itwill require excess maintenance and manpower.
In effluent treatment the units should be robust and designed to handle hairs and sand aswell as high amounts of thick and sticky surface sludge.
8/8/2019 App 06 Flotation Manual
http://slidepdf.com/reader/full/app-06-flotation-manual 5/10
Markku Huhtamäki 5
Flotation for direct precipitation and by-pass effluent treatment
In Norway there are several flotation units in direct precipitation. There often only solid andBOD removal has been required and the compact flotation units have been the mosteconomic alternatives in several cases.Odegaard (2001) has evaluated the treatment efficiencies of these direct-precipitationflotation processes in size classes of >2000 population equivalent (=pe) units (23 pc) and<2000 pe (25 pc). The average surface loads were 2 – 5 m/h and they reached 0.06 – 0.4 mg/lresidual phosphors concentration (92 – 98 % P removal) and about 70 – 90%:n COD-removal. The average solid reduction in both size classes was more than 90% and the BODreduction was on the same level.
With efficient process control and chemical dosage 95 % phosphor and solid reductions aswell as 70 - 90 % BOD- and COD –removal can be achieved in municipal effluent treatment.Nitrogen removal is typically 20 – 30%. The chemical dosage can easily be controlled due toshort residence time. Influent and effluent turbidity measurements help in saving of
chemicals.In direct precipitation the BOD-reduction in flotation is clearly better than can be
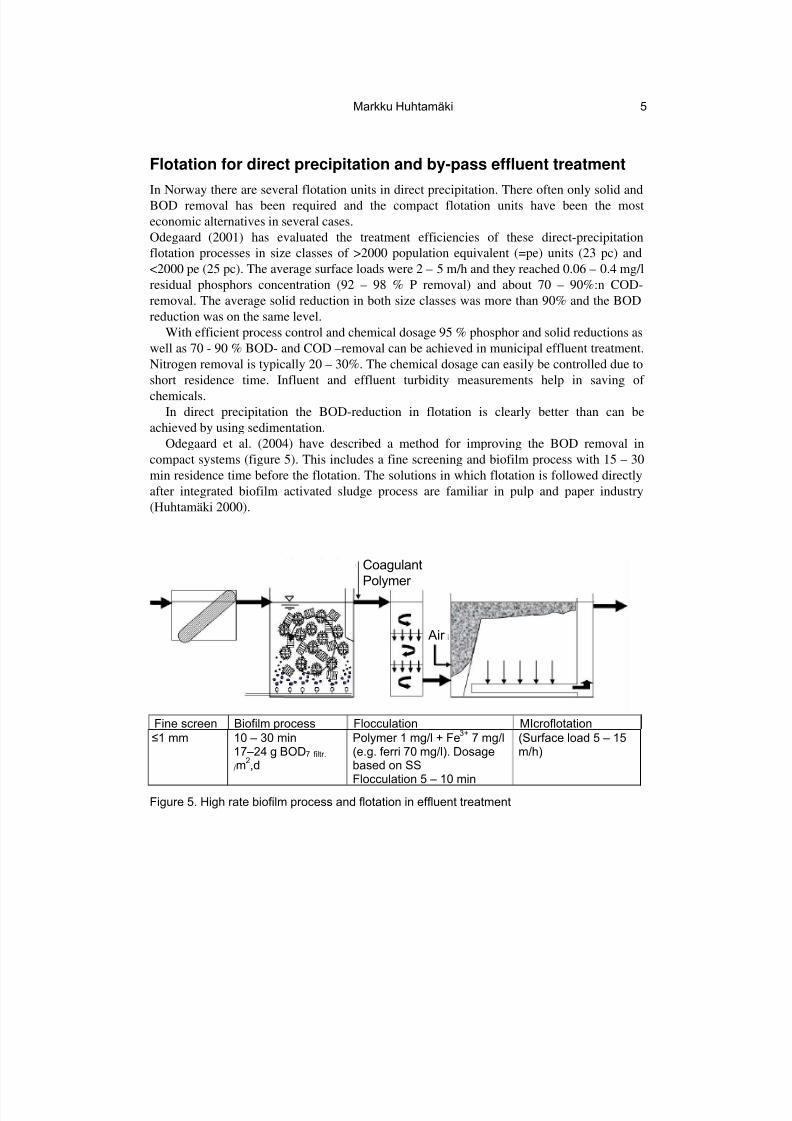
achieved by using sedimentation.Odegaard et al. (2004) have described a method for improving the BOD removal in
compact systems (figure 5). This includes a fine screening and biofilm process with 15 – 30min residence time before the flotation. The solutions in which flotation is followed directlyafter integrated biofilm activated sludge process are familiar in pulp and paper industry(Huhtamäki 2000).
Fine screen Biofilm process Flocculation MIcroflotation
Coagulant
Polymer
Air
≤1 mm 10 – 30 min17–24 g BOD7 filtr./m
2,d
Polymer 1 mg/l + Fe3+
7 mg/l(e.g. ferri 70 mg/l). Dosagebased on SSFlocculation 5 – 10 min
(Surface load 5 – 15m/h)
Figure 5. High rate biofilm process and flotation in effluent treatment
8/8/2019 App 06 Flotation Manual
http://slidepdf.com/reader/full/app-06-flotation-manual 6/10
6 Markku Huhtamäki
The quality of by-pass effluents is similar to raw influent except that they are more dilutedthan typical raw water.
If a flotation unit is built for tertiary treatment, the same unit might be used for by-passeffluent treatment during storm water periods.
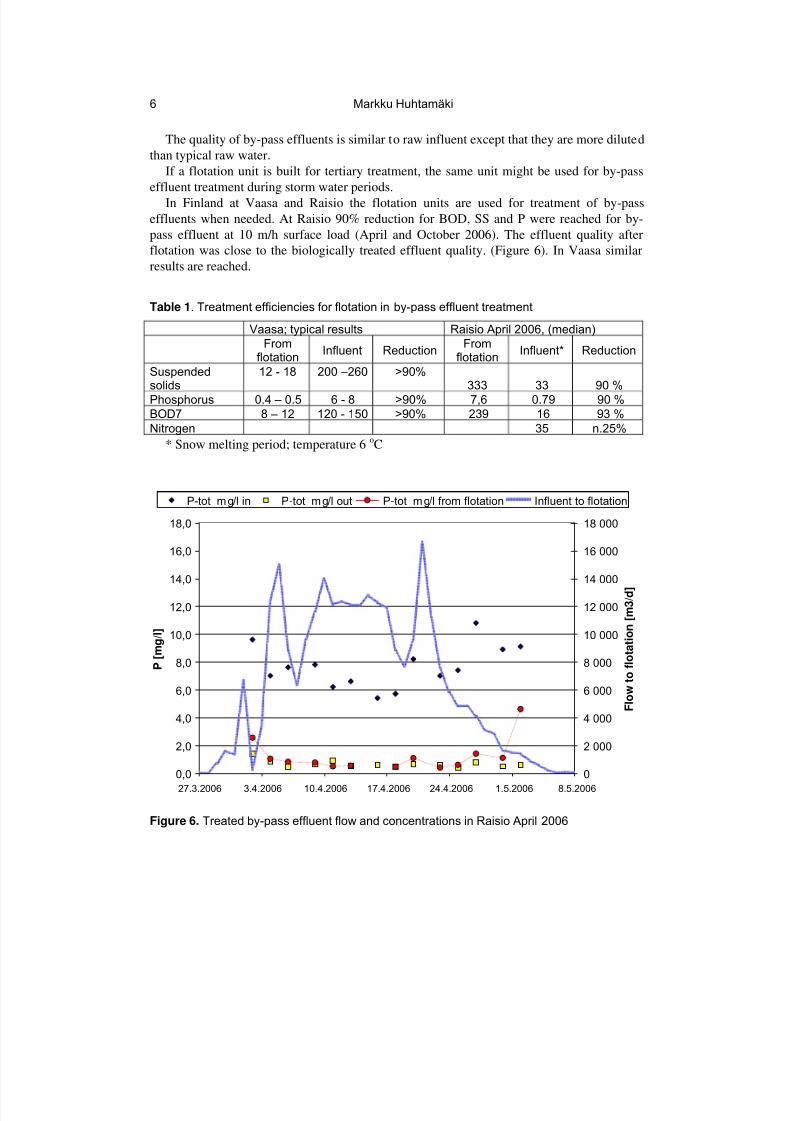
In Finland at Vaasa and Raisio the flotation units are used for treatment of by-passeffluents when needed. At Raisio 90% reduction for BOD, SS and P were reached for by-pass effluent at 10 m/h surface load (April and October 2006). The effluent quality afterflotation was close to the biologically treated effluent quality. (Figure 6). In Vaasa similarresults are reached.
Table 1. Treatment efficiencies for flotation in by-pass effluent treatment
Vaasa; typical results Raisio April 2006, (median)
Fromflotation
Influent ReductionFrom
flotationInfluent* Reduction
Suspendedsolids
12 - 18 200 –260 >90%333 33 90 %
Phosphorus 0.4 – 0.5 6 - 8 >90% 7,6 0.79 90 %
BOD7 8 – 12 120 - 150 >90% 239 16 93 %
Nitrogen 35 n.25%
* Snow melting period; temperature 6 oC
0,0
2,0
4,0
6,0
8,0
10,0
12,0
14,0
16,0
18,0
27.3.2006 3.4.2006 10.4.2006 17.4.2006 24.4.2006 1.5.2006 8.5.2006
P [ m g / l ]
0
2 000
4 000
6 000
8 000
10 000
12 000
14 000
16 000
18 000
F l o w
t o f l o t a t i o n [ m 3 / d ]
P-tot mg/l in P-tot mg/l out P-tot mg/l from flotation Influent to flotation
Figure 6. Treated by-pass effluent flow and concentrations in Raisio April 2006
8/8/2019 App 06 Flotation Manual
http://slidepdf.com/reader/full/app-06-flotation-manual 7/10
Markku Huhtamäki 7
Flotation in tertiary treatment
In Finland most of the existing flotation units for municipal effluent treatment are built fortertiary treatment during the 1970’s and 1980´s. Units are e.g. at Vaasa (average actual flow17000 m3 /d), Raisio (11000 m3 /d), Pietarsaari (8500 m3 /d), Eura (7500 m3 /d), Pieksämäki(4500 m3 /d), Tammisaari (2800 m3 /d), Ähtäri (1800 m3 /d) and Laihia (1100 m3 /d).
As an example the flotation in Tammisaari is built in the middle of 1980´s. It is used fulltime for tertiary treatment separating about 90% of the suspended solids and phosphor fromsecondary treated effluent. The total P and SS reduction at the treatment plant is as yearlyaverage about 99%. The chemical consumption at Tammisaari wwtp is remarkably lowercompared to the Finnish municipal effluent treatment plants as an average (Kangas 2005). Inthis case 70 mg/l ferrosulphate is used for simultaneous precipitation and 60 mg/l aluminumsulphate for the flotation process. The surface load in secondary clarification is on theaverage 0.2 m/h and max. 0.6 m/h and respectively in flotation on the average 1 m/h andmax. 3 m/h. There are no by-pass effluents at the plant.
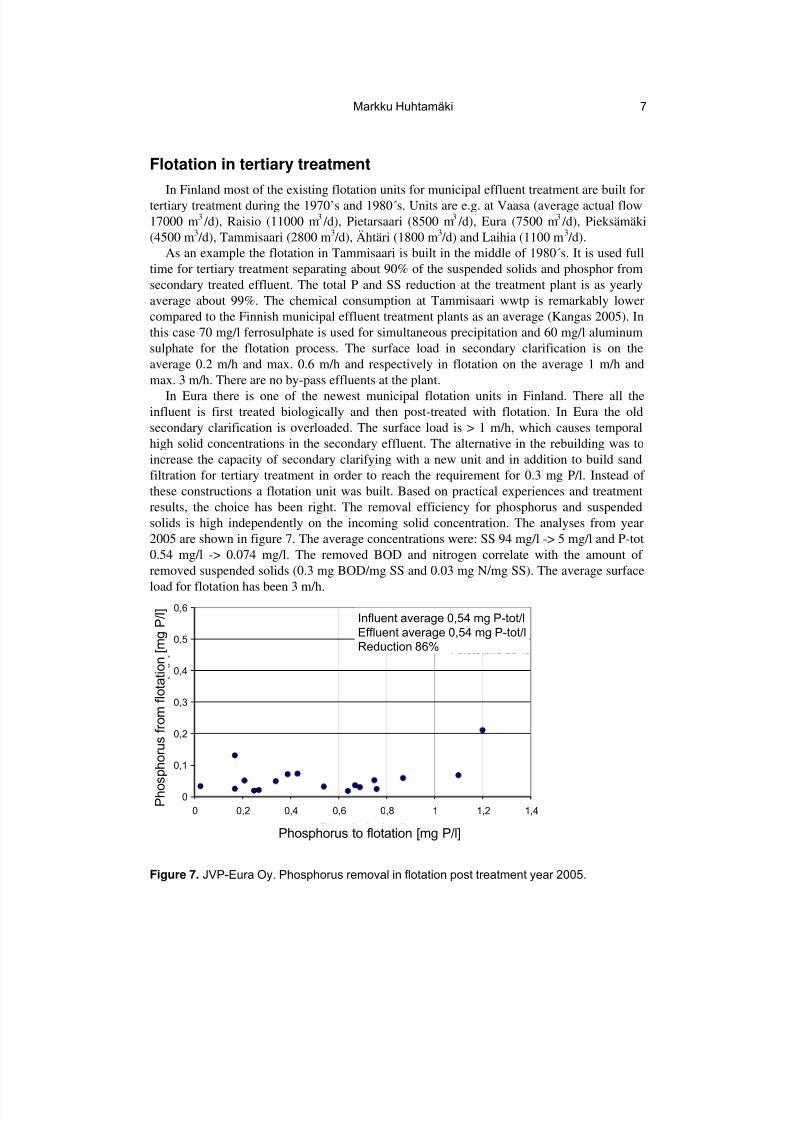
In Eura there is one of the newest municipal flotation units in Finland. There all theinfluent is first treated biologically and then post-treated with flotation. In Eura the oldsecondary clarification is overloaded. The surface load is > 1 m/h, which causes temporalhigh solid concentrations in the secondary effluent. The alternative in the rebuilding was toincrease the capacity of secondary clarifying with a new unit and in addition to build sandfiltration for tertiary treatment in order to reach the requirement for 0.3 mg P/l. Instead of these constructions a flotation unit was built. Based on practical experiences and treatmentresults, the choice has been right. The removal efficiency for phosphorus and suspendedsolids is high independently on the incoming solid concentration. The analyses from year2005 are shown in figure 7. The average concentrations were: SS 94 mg/l -> 5 mg/l and P-tot0.54 mg/l -> 0.074 mg/l. The removed BOD and nitrogen correlate with the amount of removed suspended solids (0.3 mg BOD/mg SS and 0.03 mg N/mg SS). The average surface
load for flotation has been 3 m/h.
0
0,1
0,2
0,3
0,4
0,5
0,6
0 0,2 0,4 0,6 0,8 1 1,2 1,4
Tuleva fosfori [mg/l]
P o i s t u v a f o s f o r i [ m g / l ]
Tuleva keskim 0,54 mg P-tot/l
Lähtevä keskim 0,074 mg P-tot/l
Poistoteho 86 %
Phosphorus to flotation [mg P/l]
P h o s p h o r u s f r o m f l o
t a t i o n [ m g P / l ]
Influent average 0,54 mg P-tot/l
Effluent average 0,54 mg P-tot/lReduction 86%
Figure 7. JVP-Eura Oy. Phosphorus removal in flotation post treatment year 2005.
8/8/2019 App 06 Flotation Manual
http://slidepdf.com/reader/full/app-06-flotation-manual 8/10
8 Markku Huhtamäki
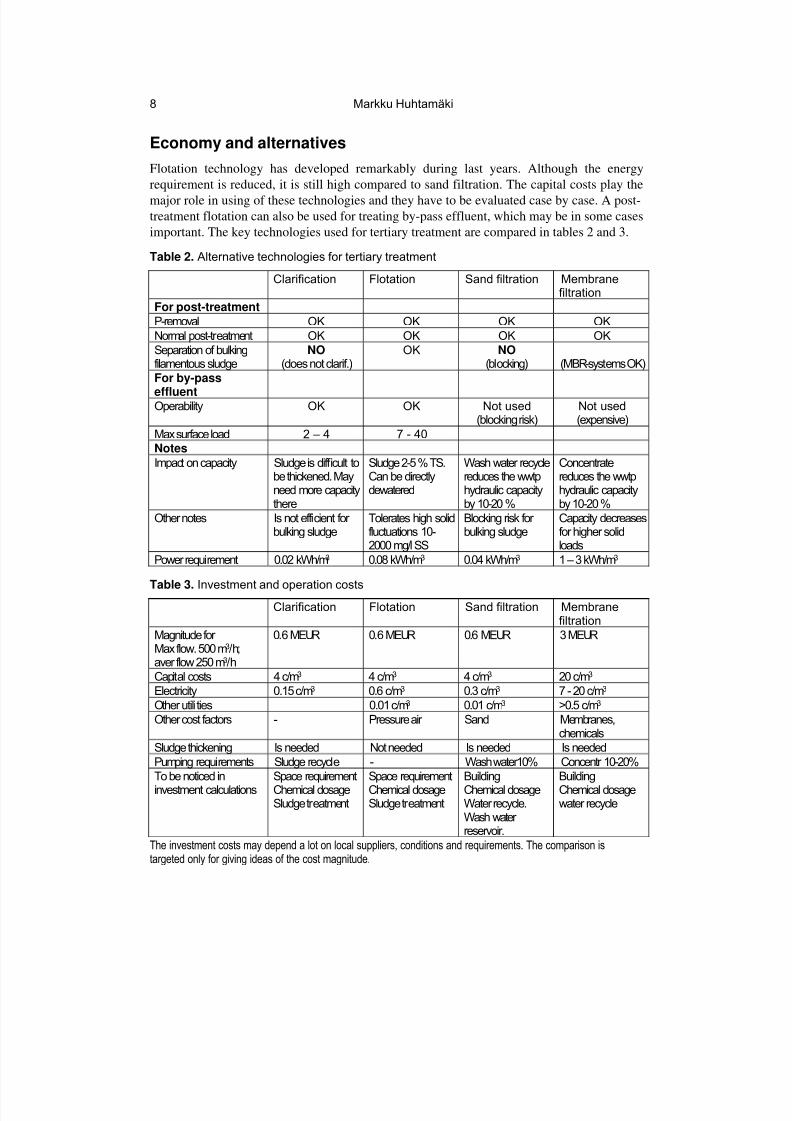
Economy and alternatives
Flotation technology has developed remarkably during last years. Although the energyrequirement is reduced, it is still high compared to sand filtration. The capital costs play the
major role in using of these technologies and they have to be evaluated case by case. A post-treatment flotation can also be used for treating by-pass effluent, which may be in some casesimportant. The key technologies used for tertiary treatment are compared in tables 2 and 3.
Table 2. Alternative technologies for tertiary treatment
Clarification Flotation Sand filtration Membranefiltration
For post-treatmentP-removal OK OK OK OK
Normal post-treatment OK OK OK OK
Separation of bulkingfilamentous sludge
NO (does not clarif.)
OK NO(blocking) (MBR-systems OK)
For by-pass
effluentOperability OK OK Not used
(blocking risk) Not used(expensive)
Max surface load 2 – 4 7 - 40Notes
Impact on capacity Sludge is difficult tobe thickened. Mayneed more capacitythere
Sludge 2-5 % TS.Can be directlydewatered
Wash water recyclereduces the wwtphydraulic capacityby 10-20 %
Concentratereduces the wwtphydraulic capacityby 10-20 %
Other notes Is not efficient for bulking sludge
Tolerates high solidfluctuations 10-2000 mg/l SS
Blocking risk for bulking sludge
Capacity decreasesfor higher solidloads
Power requirement 0.02 kWh/m3 0.08 kWh/m3 0.04 kWh/m3 1 – 3 kWh/m3
Table 3. Investment and operation costsClarification Flotation Sand filtration Membrane
filtration
Magnitude for Max flow. 500 m3/h;aver flow 250 m3/h
0.6 MEUR 0.6 MEUR 0.6 MEUR 3 MEUR
Capital costs 4 c/m3 4 c/m3 4 c/m3 20 c/m3
Electricity 0.15 c/m3 0.6 c/m3 0.3 c/m3 7 - 20 c/m3
Other utilities 0.01 c/m3 0.01 c/m3 >0.5 c/m3
Other cost factors - Pressure air Sand Membranes,chemicals
Sludge thickening Is needed Not needed Is needed Is needed
Pumping requirements Sludge recycle - Wash water10% Concentr 10-20%
To be noticed in
investment calculations
Space requirement
Chemical dosageSludge treatment
Space requirement
Chemical dosageSludge treatment
Building
Chemical dosageWater recycle.Wash water reservoir.
Building
Chemical dosagewater recycle
The investment costs may depend a lot on local suppliers, conditions and requirements. The comparison istargeted only for giving ideas of the cost magnitude.

8/8/2019 App 06 Flotation Manual
http://slidepdf.com/reader/full/app-06-flotation-manual 9/10
Markku Huhtamäki 9
Notes for supplying and operation a flotation process
Flotation used in effluent treatment should be robust and designed for this purpose. Inpotable water treatment plants and in pulp and paper industry there are fully automated plants
which need only minor supervision and maintenance. In these applications the reliability andoperability are the major selection criteria.
The requirements for potable water treatment and pulp and paper industry are quitedifferent concerning the influent solid amount and quality. In pulp and paper industry thewaters contain hundreds or thousand of mg/l fiber and clay containing solids. The waterquality in municipal effluent treatment plant resembles more the paper industry waters andtypically the units targeted for paper industry can be applied also for effluent treatment. Mostof the units designed for potable water treatment are not capable to treat the solid quality andthe amount which has to be separated at municipal effluent treatment.
If the technical construction of the unit is not in balance with the application it will requireabundant excess maintenance and manpower.
In municipal effluent treatment the flow variation between day and night time and dry and
wet seasons are much higher than in other applications. This has to be taken into account inflotation level control and sludge removal system. The separated surface sludge can be thick(often 5 – 6% TS) and sticky e.g. in bulking sludge situations, which have to be taken intoaccount in questionnaires and in design. If the unit is designed both for tertiary treatment andfor by-pass effluent treatment, the future 0.1 – 0.15 mg/l P level may be reached withoutadditional investment.
The chemical dosage and control of the purification efficiency can be arranged cost-effectively by installing turbidity meters for flotation influent and effluent. Even in case theydon’t directly control the chemical system and dispersion water system, they can givevaluable information for optimizing the treatment efficiency and operational costs.
Typically the result can be improved by using coagulants and/ or flocculants. The suitablechemicals / chemical combination depend on the influent quality and biological process andshould be tested case by case. The amount of flocculant (polymer) depends on the influentsolid concentration. In exceptional situations, when the influent solid concentration is high(e.g. heavy bulking sludge > 1000 mg/l) both the chemical dosage and the dispersion watercycle has to be increased (more air bubbles are needed to lift the particles).
The dispersion water system is typically designed for 6 – 10 bar pressure. That is oftenalso the operation pressure, although a 2-3 bar pressure in the dispersion water system wouldbe enough for efficient solid separation. In large treatment plants the pressure can becontrolled based on turbidity measurement – if the measurement exists and if the unit isdesigned for pressure control. In smaller plants however, simple robust systems may be moreeconomic than very sophisticated ones.
In case of poor treatment result the reason can typically be found in the following list- Disturbances in chemical dosage- Exceptional high incoming solid load, which would need more chemicals and/or
higher dispersion water cycle or pressure.- Mechanical problems in pumps, scrapers etc.- Flocs are not generated – chemicals should be dosed or the chemical type should be
changed
8/8/2019 App 06 Flotation Manual
http://slidepdf.com/reader/full/app-06-flotation-manual 10/10
10 Markku Huhtamäki
Conclusions and discussion
Flotation is proven to be an economic and efficient alternative in effluent treatment. It isanticipated that the technology is going to be more common also for effluent treatmentcorresponding the development in potable water treatment. The higher energy costs forflotation are compensated typically with lower capital costs and better purification efficiency.
Above all tertiary treatment is needed at effluent treatment plants during bulking sludgesituations. In such situations the sand filtration may be blocked and it is often by-passed. Thetreatment results of flotation are excellent under such conditions.
The practical results have showed that in tertiary effluent treatment in normal goodconditions the results for flotation and sand filtration are on the same level.
The tighter requirements in future may require that all effluents passing the biologicaltreatment should be purified chemically. That can be done by using clarification or flotation.These alternatives are both efficient for solid and phosphor removal, but the BOD removalefficiency in flotation is better. The benefit of a flotation unit is that the same unit which is
used for by-pass effluent treatment can be used for tertiary treatment when there are no by-pass effluents.
In effluent treatment high amounts of thick, sticky sludge may be produced. The sludgeremoval system in flotation has to be designed for this purpose. In effluent treatment theunits should be robust and designed to handle hairs and other particles passing through thepre-screening. Typically the application requires different constructions from the ones usedfor potable water treatment.
References
Amato, T., Edzwald, J.K., Tobiason, J.E., Dahlquist J. and Hedberg, T. (2001). An integrated approachto dissolved air flotation, Wat. Sci. Tech. 43:8 pp 19–26
Crossley, I.A. and Valade, M.T. (2006) A review of the technological developments of dissolved airflotation Journal of Water Supply: Research and Technology—AQUA Vol 55 No 7-8 pp 479–491Edzwald, J.K. (1995). Principles and applications of dissolved air flotation Wat. Sci. Tech. 31: 3-4 pp
1–23Huhtamäki, M. (2000). A New Compact Method for Waste Water Treatment based on Bioreactor and
Microflotation; DAF 2000. 4th International Seminar on Microflotation, September 10th – 11th2000, Helsinki.
Jokinen, O. (2005). Completion of phosforus removal with polymer – case Vihti WWTP NummelaNionde Nordiska Avloppskonferensen, Stockholm, November 7–9
Ødegaard, H. (2001). The use of dissolved air flotation in municipal wastewater treatment, Wat. Sci.Tech. 43:8 pp 75–81
Ødegaard, H., Z. Liao, Z., E. Melin E. and H. Helness, H. (2004).Compact high-rate treatment of wastewater, Water Supply 4:1 pp 23–3
Ødegaard,H., (2005a), Combining CEPT and Biofilm Systems, The Conf. Proc. of IWA SpecializedConference on Nutrient Management in Wastewater Treatment Processes and Recycle Streams,
Krakow, Poland Sept. 19-21, pp. 257-269.Ødegaard, H. (2005b). Innovations in wastewater treatment - The moving bed biofilm process, IWA
Conference 'Future of Urban Wastewater Systems - Decentralisation and Reuse', Xian 18-20.5.2005
Ødegaard, H. The use of dissolved air flotation in municipal wastewater treatment, Wat. Sci. Tech. 43:8 pp 75–81
Uijterlinde, C., Hofstra, M., Kraaij, E., Leenen, J. (2005). The MRB in board Dutch perspective. H2O,No 4, 31-35