apollo tricoat tubes ltd
TRANSCRIPT

Apollo Tricoat Tubes Ltd January 2021
1

Safe Harbour
Except for the historical information contained herein, statements in this presentation and the subsequent
discussions, which include words or phrases such as "will", "aim", "will likely result", "would", "believe", "may", "expect", "will
continue", "anticipate", "estimate", "intend", "plan", "contemplate", seek to", "future", "objective", "goal", "likely", "project",
"should", "potential", "will pursue", and similar expressions of such expressions may constitute "forward-looking
statements“. These forward looking statements involve a number of risks, uncertainties and other factors that could
cause actual results to differ materially from those suggested by the forward-looking statements. These risks and
uncertainties include, but are not limited to our ability to successfully implement our strategy, our growth and
expansion plans, obtain regulatory approvals, our provisioning policies, technological changes, investment and
business income, cash flow projections, our exposure to market risks as well as other risks. The Company does not
undertake any obligation to update forward-looking statements to reflect events or circumstances after the date
thereof.
2

3
Apollo Tricoat at a glance..
Innovative home improvement company
Unique environmental friendly products
Manufacturing for the first time in India
Replacing conventional construction products
55.8% subsidiary of APL Apollo Tubes Ltd
Acquired in 2019
Started operations in Q1FY20
4 Products
Signature
Elegant
Chaukhat
Plank
2 Plants
Malur Plant (14 acres)
Dujana (6.5 acres)
APOLLO
TRICOAT

About Group
4
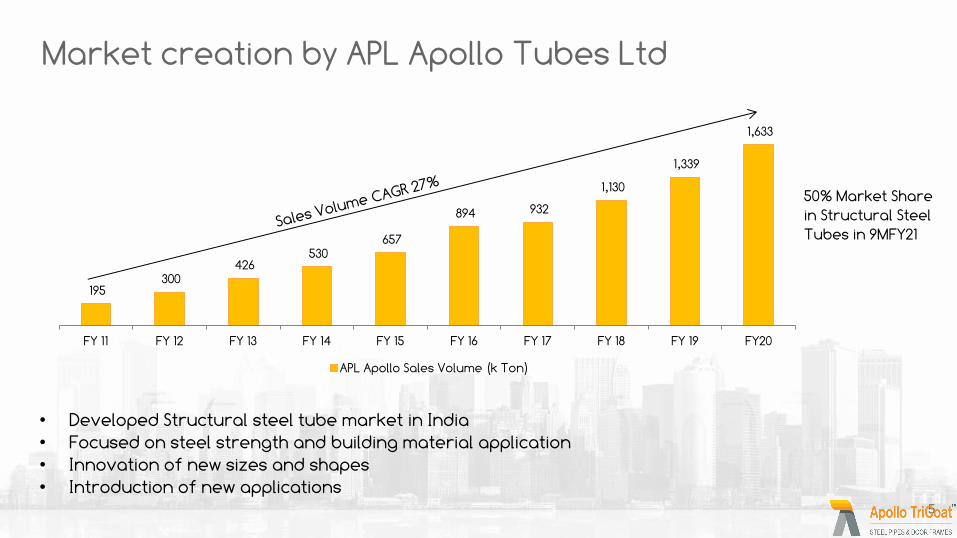
195 300
426 530
657
894 932
1,130
1,339
1,633
FY 11 FY 12 FY 13 FY 14 FY 15 FY 16 FY 17 FY 18 FY 19 FY20
APL Apollo Sales Volume (k Ton)
• Developed Structural steel tube market in India
• Focused on steel strength and building material application
• Innovation of new sizes and shapes
• Introduction of new applications
50% Market Share
in Structural Steel
Tubes in 9MFY21
Market creation by APL Apollo Tubes Ltd
5

Conventional
Construction Products Applications
Why Structural Steel Tube
replaces these products?
Steel Angle/Channels Structural support,
Towers infrastructure
Uniform Strength,
Lower steel consumption
Wood Furniture, Door
Frames, Planks
Cost Effective, Termite Proof,
Environmental Friendly
Aluminum Profiles Facades & Glazing Cost Effective,
Higher Strength
Reinforced Cement
Concrete
Construction of
Buildings
Faster Construction
Environmental Friendly
Fabricated Metal Sheet Pre-Engineered Steel
Buildings
Lower steel consumption
Reduces overall project cost
Low Diameter
Steel Tubes/Low
Load Bearing/Light
Structures
High Diameter
Steel Tubes/High
Load
Bearing/Heavy
Structures
How to replace
the conventional
products ??
How has the group created market..
6
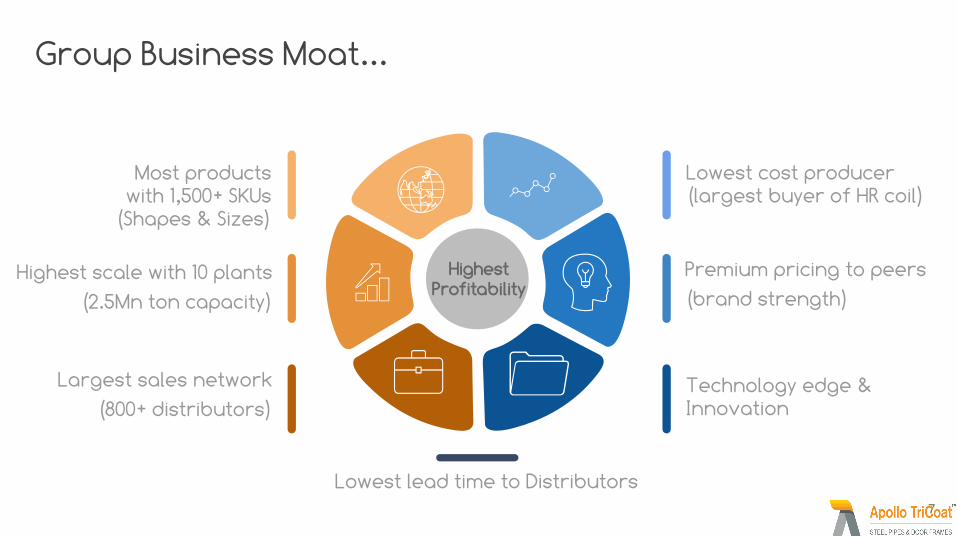
Most products with 1,500+ SKUs
(Shapes & Sizes)
Lowest cost producer (largest buyer of HR coil)
Premium pricing to peers
(brand strength)
Technology edge & Innovation
Group Business Moat...
Highest Profitability
Highest scale with 10 plants
(2.5Mn ton capacity)
Largest sales network
(800+ distributors)
7
Lowest lead time to Distributors

800+ Distributors – Solid Relationships, Incentive plans
Group’s B2C Channel
50,000+ Retailers – Retailer bonding program
200,000+ Fabricators, Architects, Structural Engineers & Developers – Apollo Connect Programs, Fabricator/Architect meets for Brand promotion
End Customer Connect– Indian Premier League, Football, Kabaddi League, Amitabh Bachchan Campaign, TV Commercials, Radio, Social Media
Distributors
Retailers
Fabricators, Architects & Structural Engineers
End Consumer
8

Apollo Tricoat Tubes Product Portfolio
9
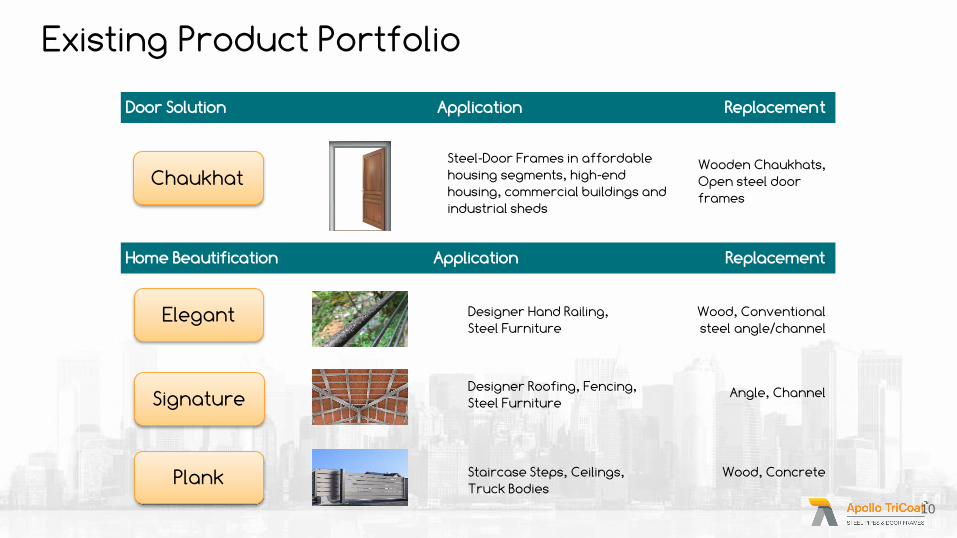
Existing Product Portfolio
Signature
Elegant
Plank
Designer Roofing, Fencing,
Steel Furniture
Chaukhat
Designer Hand Railing,
Steel Furniture
Staircase Steps, Ceilings,
Truck Bodies
Steel-Door Frames in affordable
housing segments, high-end
housing, commercial buildings and
industrial sheds
Home Beautification Application Replacement
Door Solution Application Replacement
10
Wooden Chaukhats,
Open steel door
frames
Wood, Conventional
steel angle/channel
Angle, Channel
Wood, Concrete

Chaukhat
11
• India’s first closed steel door frame which is easy to install & termite proof
• Shining example of our innovative spirit for introducing newer products
• Available for single door frame, double door frame & four door frame
Single Door Frame Double Door Frame Four Door Frame

Chaukhat
12
• Apollo Chaukhat is a ready to install door frame that is ideal for Living Room, Bedroom, Kitchen, Store Room,
Terrace, Staircase and Bathroom
• Game changer in replacing wooden door frame with steel door frame
Chaukhat Pipe Painting/Coating Installation
Wooden
door frame
Open section
steel frame
(need to pour
concrete)
Fabrication
Old Conventional Door Frame
Closed section
steel frame
Newer Door Frame
13
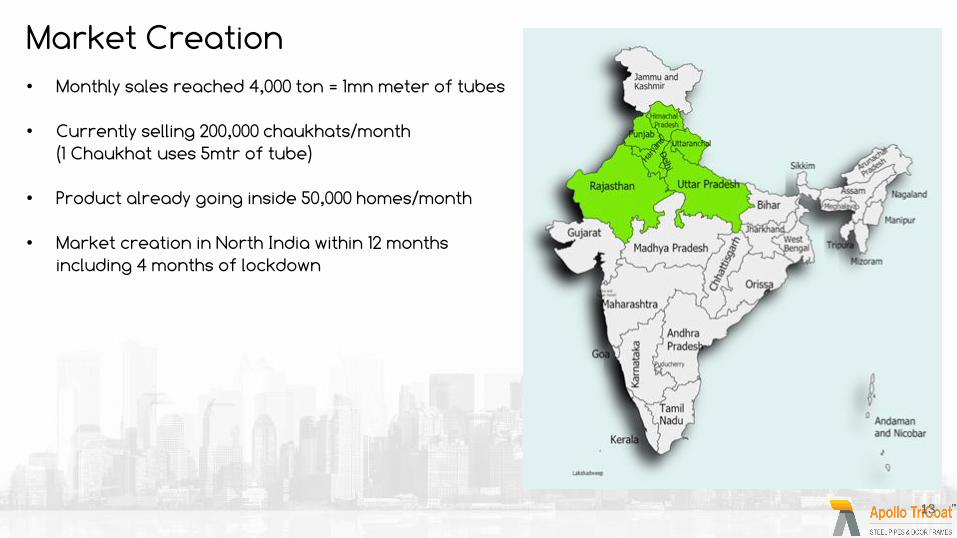
Market Creation
• Monthly sales reached 4,000 ton = 1mn meter of tubes
• Currently selling 200,000 chaukhats/month
(1 Chaukhat uses 5mtr of tube)
• Product already going inside 50,000 homes/month
• Market creation in North India within 12 months
including 4 months of lockdown

14
Apollo Chaukhat – Saving Nature

Designer Tubes (Signature & Elegant)
15
• Designer tubes are an upgrade to the conventional steel angle/channel by virtue of engraved designs
• Aesthetically superior tubes which impart great elegance to the structures
• Highly resistant to corrosion and rust because of their galvanized layer
• Two product categories in designer pipes:
Apollo Signature Apollo Elegant

16
Planks • Apollo Plank is a new-age steel tube product that is conceived to completely replace wood with steel
• Rectangular tubes are available in width to height ratio upto 3. Apollo Planks have width to height ratio upto 10
• This signifies the spirit for innovation for developing newer products for sustainable and environment-
friendly home solutions
x
3x
x
10x
Rectangular Tube Plank

17
Apollo Planks : Applications
Fencing

18
Apollo Plank: Applications
Rooftops Benches

19
Apollo Plank : Applications
Scaffolding Rack

20
Fabricator Meet for Apollo Planks
Fabricator meet organized in Himachal Pradesh to
promote plank

Operational Performance
Note 2: In-Line Galvanizing (ILG) Machine is not operational currently; however the same is fungible to produce other products. Therefore it is being used to produce Signature and Elegant. Alfa Tube mill can be used to produce Chaukhat
Note 1: Figures for the corresponding period last year are not comparable as the Company started commercial production gradually from Q1FY20 onwards.
Also the Q1FY21 sales volume figures are for period ’28 April 2020 to 30 June 2020’ as the company had shut its operations in April 2020 owing to COVID 19 pandemic
21
Brands (Tons) Q1FY20 Q2FY20 Q3FY20 Q4FY20 FY20 Q1FY21 Q2FY21 Q3FY21 Annual
Capacity
Apollo Signature 9,689 15,635 24,970 20,241 70,535 18,584 17,968 28,058 1,25,000
Apollo Chaukhat - 6,612 12,850 8,604 28,066 4,397 15,185 16,310 75,000
Apollo Elegant 631 4,962 7,995 8,281 21,869 8,490 26,749 27,158 1,25,000
Apollo Plank - 320 1,333 957 2610 452 921 1,078 25,000
Total 10,320 27,529 47,148 38,083 123,080 31,923 60,823 72,604 3,50,000

Working Capital (Days: 0)
Asset Turnover: 5.6x
Sales Realization: Rs55,000/ton
Gross Block:
Rs 9,820/ton
Core Business
ROCE: 60%
Tricoat’s Unique Products
+
Group Distribution
+
Apollo Brand
Superior Return Profile (steady state performance*)
Total Capital Employed:
Rs9,820/ton
EBITDA Margin: 12% (Rs6,600/ton)
EBIT Margin: 11% (Rs6,000/ton)
*On full capacity utilization

Q3FY’21 at a Glance
72,604 ton
Q3 FY21 Volume
54% YoY increase
₹ 572mn
EBITDA
101% YoY increase
₹ 379mn
Net Profit
110% YoY increase
7.5% Net Margin
34 bps YoY decrease
0.2x Debt-to-equity ratio
FY20 was 0.5x
Net WC days
FY20 was -2 days
Branding Resumed TV Ad Campaign
for Apollo Chaukhat
350,000 ton
Capacity
as on 31 Dec 2020
₹ 1,123mn
9M Operating Cash flow
FY20 was ₹830mn
₹ 7,872
EBITDA per ton
31% YoY increase EBITDA Margin
104bps YoY decrease
` 40.3%
ROCE
FY20 was 20.2%
-4
Apollo Tricoat – Innovative Home Improvement Solutions
11.4%
23
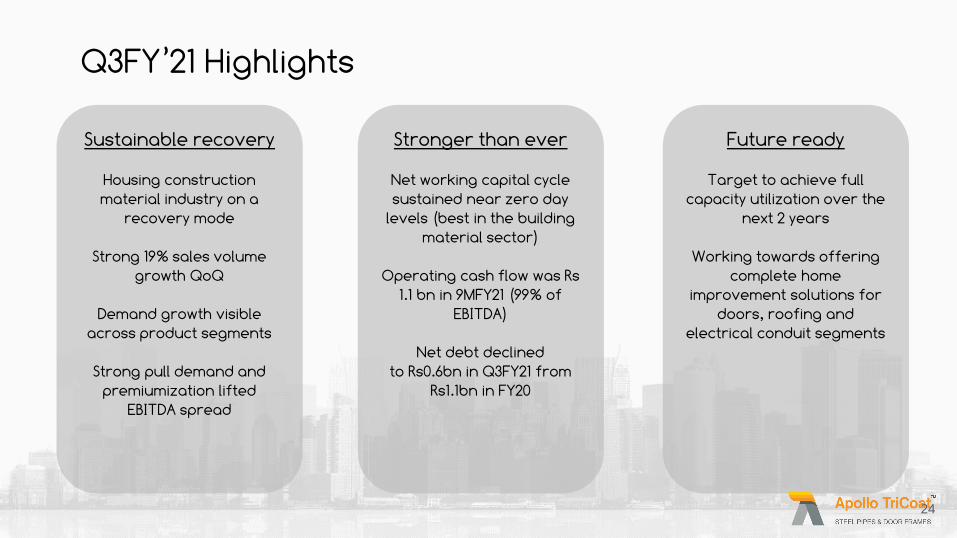
Sustainable recovery
Housing construction
material industry on a
recovery mode
Strong 19% sales volume
growth QoQ
Demand growth visible
across product segments
Strong pull demand and
premiumization lifted
EBITDA spread
Q3FY’21 Highlights
Stronger than ever
Net working capital cycle
sustained near zero day
levels (best in the building
material sector)
Operating cash flow was Rs
1.1 bn in 9MFY21 (99% of
EBITDA)
Net debt declined
to Rs0.6bn in Q3FY21 from
Rs1.1bn in FY20
Future ready
Target to achieve full
capacity utilization over the
next 2 years
Working towards offering
complete home
improvement solutions for
doors, roofing and
electrical conduit segments
24

Financial Performance
Note: Figures for the corresponding period last year are not comparable as the Company started commercial production gradually from Q1FY20 onwards.
Also the Q1FY21 sales volume figures are for period ’28 April 2020 to 30 June 2020’ as the company had shut its operations in April 2020 owing to COVID 19 pandemic
25
10.3
27.5
47.1
38.1 31.9
60.8
72.6
Q1FY20 Q2FY20 Q3FY20 Q4FY20 Q1FY21 Q2FY21 Q3FY21
Volume (000's Ton)
61
154
284 244
185
373
572
Q1FY20 Q2FY20 Q3FY20 Q4FY20 Q1FY21 Q2FY21 Q3FY21
EBITDA (Rsm)
517
1,537
2,290 2,289
1,710
3,305
5,034
Q1FY20 Q2FY20 Q3FY20 Q4FY20 Q1FY21 Q2FY21 Q3FY21
Revenue (Rsm)
5,887 5,603 6,021
6,394 5,786 6,137
7,872
Q1FY20 Q2FY20 Q3FY20 Q4FY20 Q1FY21 Q2FY21 Q3FY21
EBITDA/Ton (Rs)
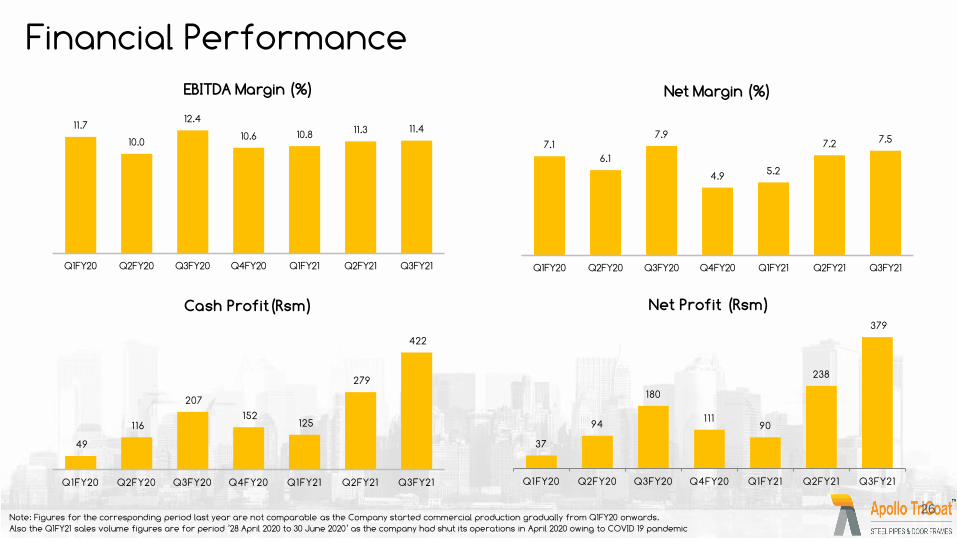
Financial Performance
Note: Figures for the corresponding period last year are not comparable as the Company started commercial production gradually from Q1FY20 onwards.
Also the Q1FY21 sales volume figures are for period ’28 April 2020 to 30 June 2020’ as the company had shut its operations in April 2020 owing to COVID 19 pandemic
26
11.7
10.0
12.4
10.6 10.8 11.3 11.4
Q1FY20 Q2FY20 Q3FY20 Q4FY20 Q1FY21 Q2FY21 Q3FY21
EBITDA Margin (%)
7.1
6.1
7.9
4.9 5.2
7.2 7.5
Q1FY20 Q2FY20 Q3FY20 Q4FY20 Q1FY21 Q2FY21 Q3FY21
Net Margin (%)
49
116
207
152 125
279
422
Q1FY20 Q2FY20 Q3FY20 Q4FY20 Q1FY21 Q2FY21 Q3FY21
Cash Profit(Rsm)
37
94
180
111 90
238
379
Q1FY20 Q2FY20 Q3FY20 Q4FY20 Q1FY21 Q2FY21 Q3FY21
Net Profit (Rsm)

Financial Performance (9MFY21)
27
ROE &ROCE (%)
20
3
27
-4 Inventory Debtors Creditor days Net Working Capital
Working Capital (Days)
0.2 0.4
13.4
Debt/ Equity (x) Debt/EBITDA (x) Interest Coverage (x)
Leverage Ratio (x)
-107
647
2,700
3,436
Net Working Capital Net Debt Networth Gross Block
Key Financials (Rsm)
40.1
30.4
21.2
40.3
30.7
20.2
9MFY21 H1 FY21 FY20
ROE ROCE

Financial Performance
Note: Figures for the corresponding period last year are not comparable as the Company started commercial production gradually from Q1FY20 onwards.
Also the Q1FY21 sales volume figures are for period ’28 April 2020 to 30 June 2020’ as the company had shut its operations in April 2020 owing to COVID 19 pandemic
28
Particulars (Rsm) Q1FY20 Q2FY20 Q3FY20 Q4FY20 FY20 Q1FY21 Q2FY21 Q3FY21 9MFY21
Volume (Ton) 10,320 27,529 47,148 38,083 123,080 31,923 60,823 72,604 165,350
Revenue 517 1,537 2,290 2,289 6,633 1,710 3,305 5,034 10,049
Raw Material costs 421 1,297 1,804 1,851 5,373 1,358 2,635 4,165 8,158
Employee costs 12 20 45 44 121 39 51 53 142
Other expenses 24 65 156 150 396 128 246 245 619
EBITDA 61 154 284 244 742 185 373 572 1,129
EBITDA/Ton 5,887 5,603 6,021 6,394 6,032 5,786 6,137 7,872 6,831
Other income 2 3 1 6 11 3 6 4 13
Finance costs 1 5 22 32 60 32 19 25 77
Depreciation & Amortization 12 22 27 41 101 35 41 43 120
PBT 51 130 235 177 592 120 320 507 946
Tax expense 14 36 55 65 170 30 82 128 240
Net Profit 37 94 180 111 423 90 238 379 707

Financial Performance
Note: Figures for the corresponding period last year are not comparable as the Company started commercial production gradually from Q1FY20 onwards.
Also the Q1FY21 sales volume figures are for period ’28 April 2020 to 30 June 2020’ as the company had shut its operations in April 2020 owing to COVID 19 pandemic
29
Assets (Rsm) 9MFY21 FY20 Cash Flow (Rsm) 9MFY21 FY20
Cash & equivalent 5 48 EBITDA 1,129 742
Receivables 144 379 Accounts receivables 235 -364
Inventories 723 768 Inventory 45 -689
Other current assets 392 198 Other Working capital changes -299 1,130
Fixed assets (net) 3,351 3,021 Other Income 13 11
Capital work in progress 77 14 Operating cashflow 1,123 830
Other assets 111 123 Tax -170 -85
Total Assets 4,803 4,551 Interest -68 -60
Equity & Libailities (Rsm) 9MFY21 FY20 Fixed assets -454 -1,453
Trade payables 974 1,124 Investments 1 2
Other Current Liability 141 139 Free cashflow 431 -766
Debt 652 1,126 Capital increase 0 243
Others 325 163 Dividend payments 0 0
Provision 12 4 Net change in cash flow 431 -523
Shareholders' funds 2,700 1,995 Net debt at the beginning -1,078 -555
Total Equity & Liabilities 4,803 4,551 Net debt at the end -647 -1,078
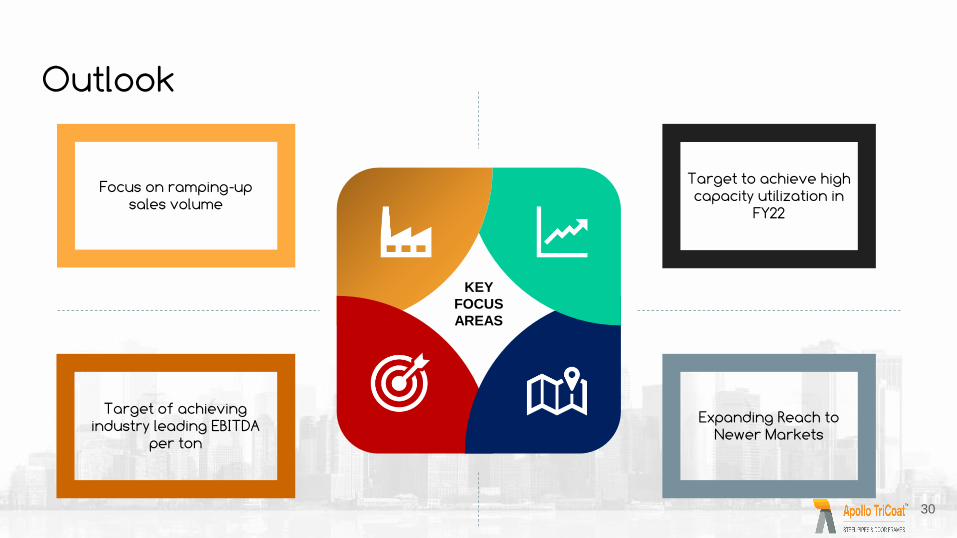
Outlook
KEY
FOCUS
AREAS
Focus on ramping-up sales volume
Target of achieving industry leading EBITDA
per ton
Target to achieve high capacity utilization in
FY22
Expanding Reach to Newer Markets
30

Thank You
For further information, please contact:
Anubhav Gupta
Tel: +91 120 404 1452
Email: [email protected]
Deepak Goyal
Tel: +91 120 404 1400
Email: [email protected]
31