apollo investment corporation investor presentation
TRANSCRIPT
Apollo Investment Corporation Investor Presentation
March 2018Information is as of December 31, 2017 except as otherwise noted. It should not be assumed that investments made in the future will be profitable or will equal the performance of investments in this document.
Disclaimers, Definitions, and Important NotesForward-Looking Statements
We make forward-looking statements in this presentation and other filings we make with the Securities and Exchange Commission (“SEC”) within the meaning of Section 27A of the SecuritiesAct of 1933, as amended, and Section 21E of the Securities Exchange Act of 1934, as amended. Forward-looking statements are subject to substantial risks and uncertainties, many of which aredifficult to predict and are generally beyond our control. These forward-looking statements include information about possible or assumed future results of our business, financial condition,liquidity, results of operations, plans and objectives, including information about our ability to generate attractive returns while attempting to mitigate risk. When used in this release, the words“believe,” “expect,” “anticipate,” “estimate,” “plan,” “continue,” “intend,” “should,” “may” or similar expressions, are intended to identify forward-looking statements. Statements regarding thefollowing subjects, among others, may be forward-looking: the return on equity; the yield on investments; the ability to borrow to finance assets; and other risks associated with changes in businessconditions and the general economy.
The forward-looking statements are based on our beliefs, assumptions and expectations of our future performance, taking into account all information currently available to us. Forward-lookingstatements are not predictions of future events. These beliefs, assumptions and expectations can change as a result of many possible events or factors, not all of which are known to us. Some ofthese factors are described in the company's filings with the SEC. If a change occurs, our business, financial condition, liquidity and results of operations may vary materially from those expressedin our forward-looking statements. Any forward-looking statement speaks only as of the date on which it is made. New risks and uncertainties arise over time, and it is not possible for us to predictthose events or how they may affect us. Except as required by law, we are not obligated to, and do not intend to, update or revise any forward-looking statements, whether as a result of newinformation, future events or otherwise. This presentation may contain statistics and other data that in some cases has been obtained from or compiled from information made available by third-party service providers.
Past Performance
Past performance is not indicative nor a guarantee of future returns, the realization of which is dependent on many factors, many of which are beyond the control of Apollo Global Management,LLC (“AGM”); Apollo Investment Management, L.P.; and Apollo Investment Corporation (collectively “Apollo”). There can be no assurances that future dividends will match or exceed historicones, or that they will be made at all. Net returns give effect to all fees and expenses. Unless otherwise noted, information included herein is presented as of the date indicated on the cover pageand may change at any time without notice. Apollo Investment Corporation (the “Corporation” or “AINV” or the “Fund”) is subject to certain significant risks relating to our business andinvestment objective. For more detailed information on risks relating to the Corporation, see the latest Form 10-K and subsequent quarterly reports filed on Form 10-Q.
Financial Data
Financial data used in this presentation for the periods shown is from the Corporation’s Form 10-K and Form 10-Q filings with the SEC during such periods. Unless otherwise indicated, thenumbers shown herein are rounded and unaudited. Quarterly financial information about the Company refers to fiscal quarters. The Company’s fiscal year 2017 ended March 31, 2017.
AUM Definition
Assets Under Management (“AUM”) refers to the investments AGM manages or with respect to which it has control, including capital it has the right to call from its investors pursuant to theircapital commitments to various funds. AGM’s AUM equals the sum of: (i) the fair value of its private equity investments plus the capital that it is entitled to call from its investors pursuant to theterms of their capital commitments plus non-recallable capital to the extent a fund is within the commitment period in which management fees are calculated based on total commitments to thefund; (ii) the net asset value of AGM’s capital markets funds, other than certain senior credit funds, which are structured as collateralized loan obligations or certain collateralized loan obligationand collateralized debt obligation credit funds that have a fee generating basis other than mark-to-market asset values, plus used or available leverage and/or capital commitments; (iii) the grossasset values or net asset values of AGM’s real estate entities and the structured portfolio vehicle investments included within the funds AGM manages, which includes the leverage used by suchstructured portfolio vehicles; (iv) the incremental value associated with the reinsurance investments of the portfolio company assets that AGM manages; and (v) the fair value of any otherinvestments that AGM manages plus unused credit facilities, including capital commitments for investments that may require pre-qualification before investment plus any other capitalcommitments available for investment that are not otherwise included in the clauses above. AGM’s AUM measure includes AUM for which it charges either no or nominal fees and may includecertain assets for which Apollo may earn investment-related services fees rather than management or advisory fees. AGM’s definition of AUM is not based on any definition of AUM contained inits operating agreement or in any of its Apollo fund management agreements. AGM considers multiple factors for determining what should be included in its definition of AUM. Such factorsinclude but are not limited to (1) its ability to influence the investment decisions for existing and available assets; (2) its ability to generate income from the underlying assets in its funds; and (3)the AUM measures that it uses internally or believes are used by other investment managers. Given the differences in the investment strategies and structures among other alternative investmentmanagers, AGM’s calculation of AUM may differ from the calculations employed by other investment managers and, as a result, this measure may not be directly comparable to similar measurespresented by other investment managers.
1
Agenda
Apollo Investment Corporation (AINV) Overview
Investment Strategy & Portfolio Repositioning
Portfolio Review
Conclusion
Appendices
2

3
Overview
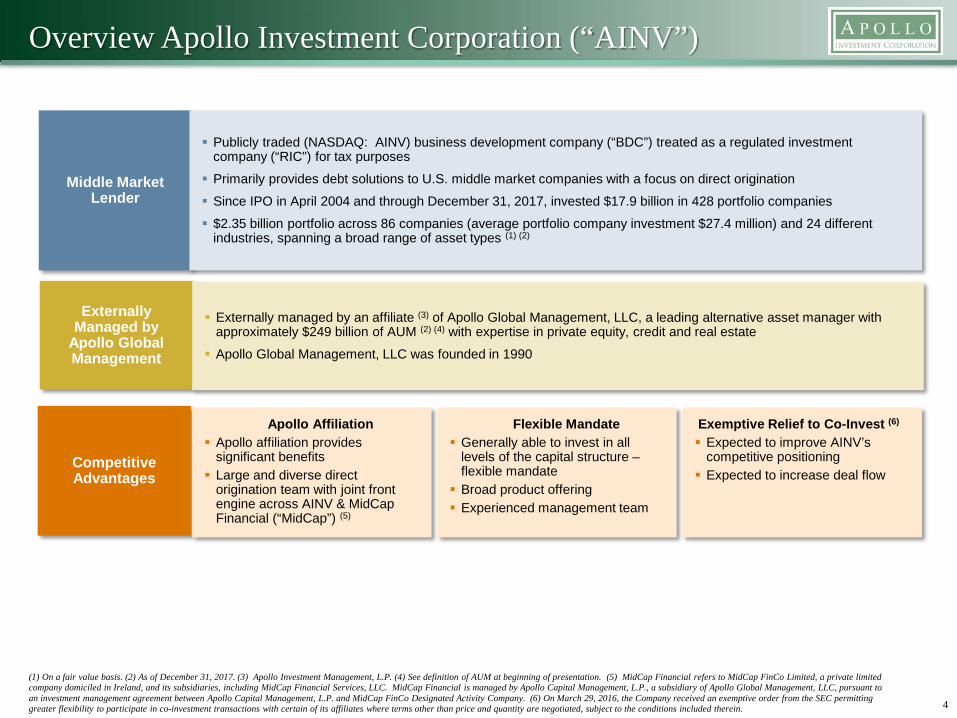
Overview Apollo Investment Corporation (“AINV”)
4
(1) On a fair value basis. (2) As of December 31, 2017. (3) Apollo Investment Management, L.P. (4) See definition of AUM at beginning of presentation. (5) MidCap Financial refers to MidCap FinCo Limited, a private limited company domiciled in Ireland, and its subsidiaries, including MidCap Financial Services, LLC. MidCap Financial is managed by Apollo Capital Management, L.P., a subsidiary of Apollo Global Management, LLC, pursuant to an investment management agreement between Apollo Capital Management, L.P. and MidCap FinCo Designated Activity Company. (6) On March 29, 2016, the Company received an exemptive order from the SEC permitting greater flexibility to participate in co-investment transactions with certain of its affiliates where terms other than price and quantity are negotiated, subject to the conditions included therein.
Middle Market Lender
Competitive Advantages
Externally Managed by
Apollo Global Management
Apollo Affiliation Apollo affiliation provides
significant benefits Large and diverse direct
origination team with joint front engine across AINV & MidCap Financial (“MidCap”) (5)
Externally managed by an affiliate (3) of Apollo Global Management, LLC, a leading alternative asset manager with approximately $249 billion of AUM (2) (4) with expertise in private equity, credit and real estate Apollo Global Management, LLC was founded in 1990
Publicly traded (NASDAQ: AINV) business development company (“BDC”) treated as a regulated investment company (“RIC”) for tax purposes Primarily provides debt solutions to U.S. middle market companies with a focus on direct origination Since IPO in April 2004 and through December 31, 2017, invested $17.9 billion in 428 portfolio companies $2.35 billion portfolio across 86 companies (average portfolio company investment $27.4 million) and 24 different
industries, spanning a broad range of asset types (1) (2)
Exemptive Relief to Co-Invest (6)
Expected to improve AINV’s competitive positioning Expected to increase deal flow
Flexible Mandate Generally able to invest in all
levels of the capital structure –flexible mandate Broad product offering Experienced management team
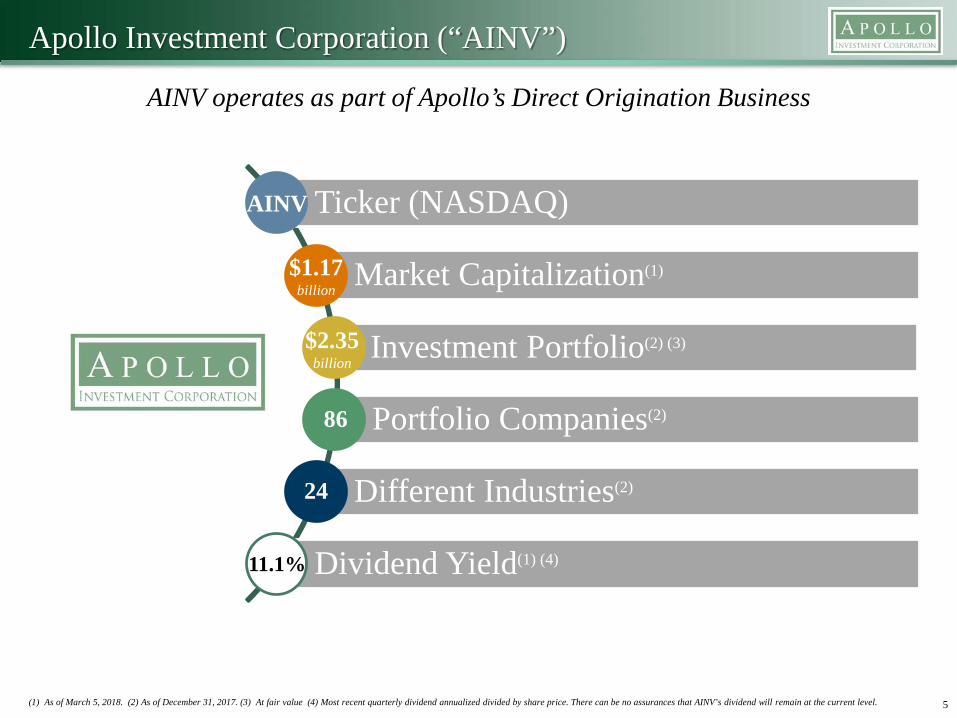
(1) As of March 5, 2018. (2) As of December 31, 2017. (3) At fair value (4) Most recent quarterly dividend annualized divided by share price. There can be no assurances that AINV’s dividend will remain at the current level. 5
Ticker (NASDAQ)
Market Capitalization(1)
Investment Portfolio(2) (3)
Portfolio Companies(2)
Different Industries(2)
Dividend Yield(1) (4)
AINV
$1.17billion
$2.35billion
86
24
11.1%
Apollo Investment Corporation (“AINV”)
AINV operates as part of Apollo’s Direct Origination Business
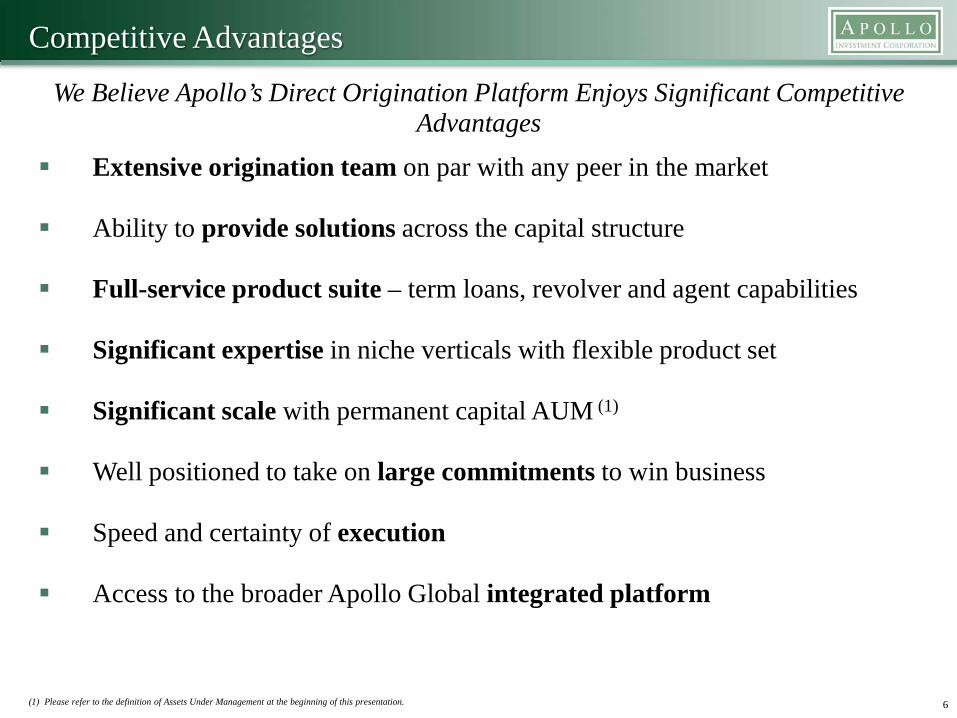
Competitive Advantages
Extensive origination team on par with any peer in the market
Ability to provide solutions across the capital structure
Full-service product suite – term loans, revolver and agent capabilities
Significant expertise in niche verticals with flexible product set
Significant scale with permanent capital AUM (1)
Well positioned to take on large commitments to win business
Speed and certainty of execution
Access to the broader Apollo Global integrated platform
We Believe Apollo’s Direct Origination Platform Enjoys Significant Competitive Advantages
6(1) Please refer to the definition of Assets Under Management at the beginning of this presentation.
Founded: 1990
AUM: $249bn
Employees: 1,047
Inv. Professionals: 384
Global Offices: 15
7(1) AINV refers to Apollo Investment Corporation. (2) As of December 31, 2017. Please refer to the definition of Assets Under Management at the beginning of this presentation. Note: AUM components may not sum due to rounding.
Global Footprint
Credit$164bn AUM
Opportunistic buyouts Distressed buyouts and debt
investments Corporate carve-outs
Private Equity$72bn AUM
Drawdown Liquid / Performing Permanent Capital Vehicles:
-Athene -MidCap -BDCs -Closed-End Funds
Advisory
Real Assets$12 AUM
Commercial real estate Global private equity and debt
investments Performing fixed income
(CMBS, CRE Loans)
Firm Profile (2)
Investment Approach
Value-oriented
Contrarian
Integrated investment platform
Opportunistic across market cycles and capital structures
Focus on nine core industries
Business Segments
Toronto
Bethesda
Chicago
New YorkBethesdaLos Angeles
Houston
ChicagoToronto
Madrid
London FrankfurtLuxembourg
Mumbai
Delhi
Singapore
Hong Kong
Shanghai
AINV(1) Benefits From a Strong External Manager
Apollo Global Management, LLC is one of the world’s largest alternative asset managers
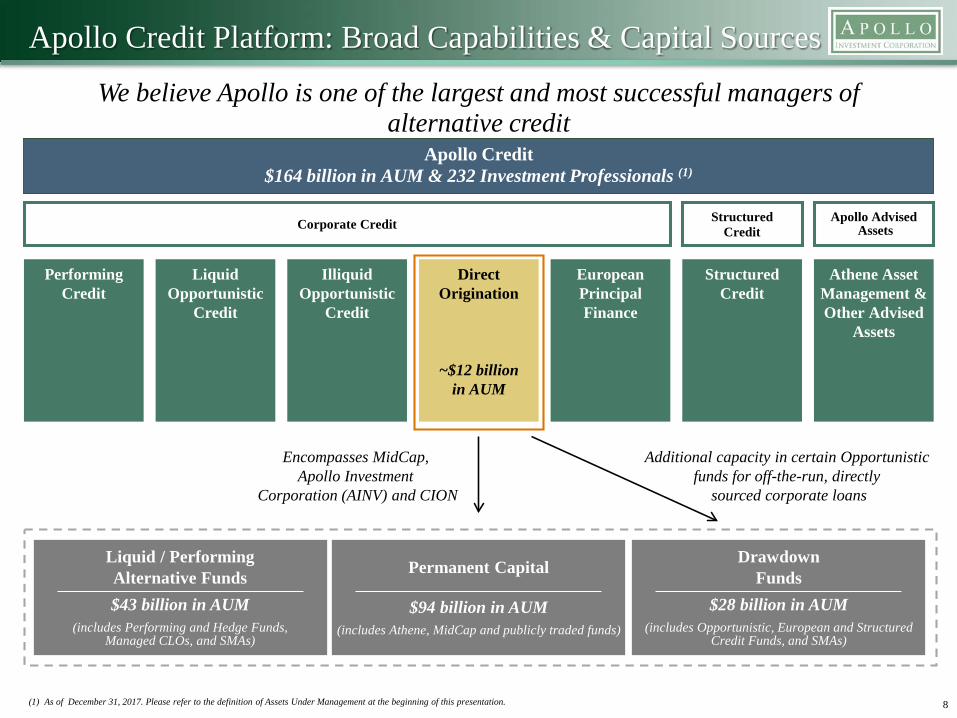
Apollo Credit Platform: Broad Capabilities & Capital Sources
We believe Apollo is one of the largest and most successful managers of alternative credit
8(1) As of December 31, 2017. Please refer to the definition of Assets Under Management at the beginning of this presentation.
Apollo Credit$164 billion in AUM & 232 Investment Professionals (1)
Corporate Credit Structured Credit
Apollo AdvisedAssets
Performing Credit
Liquid Opportunistic
Credit
Illiquid Opportunistic
Credit
Structured Credit
Athene AssetManagement &Other Advised
Assets
DirectOrigination
~$12 billionin AUM
European Principal Finance
Drawdown Funds
$28 billion in AUM(includes Opportunistic, European and Structured
Credit Funds, and SMAs)
Permanent Capital
$94 billion in AUM(includes Athene, MidCap and publicly traded funds)
Liquid / Performing Alternative Funds$43 billion in AUM
(includes Performing and Hedge Funds, Managed CLOs, and SMAs)
Encompasses MidCap, Apollo Investment
Corporation (AINV) and CION
Additional capacity in certain Opportunistic funds for off-the-run, directly
sourced corporate loans
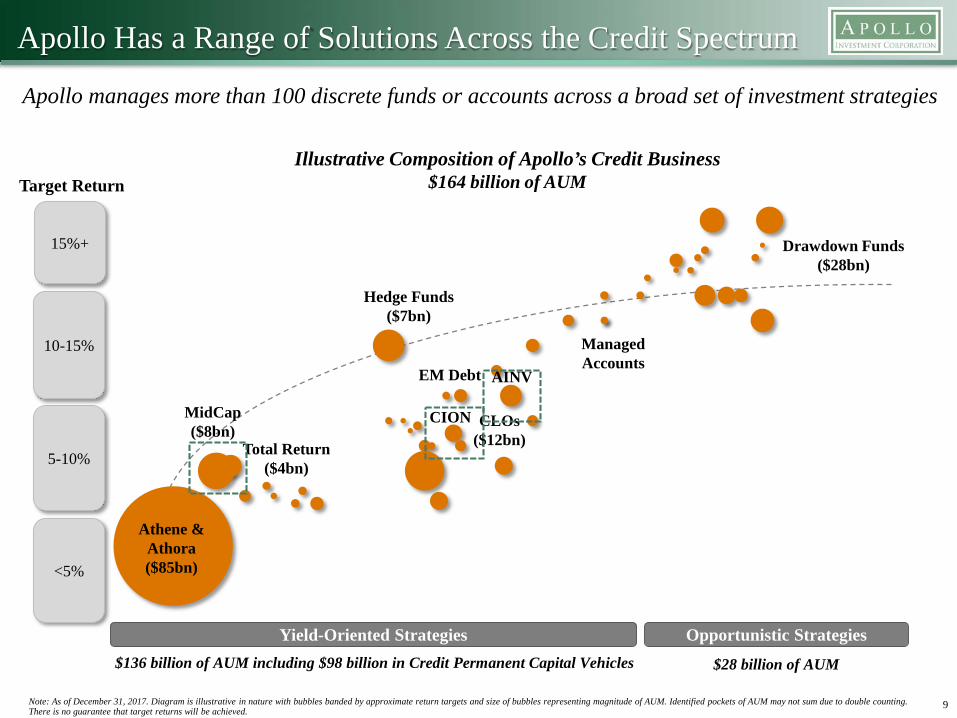
Apollo Has a Range of Solutions Across the Credit Spectrum
9
Illustrative Composition of Apollo’s Credit Business$164 billion of AUM
Yield-Oriented Strategies Opportunistic Strategies
Target Return
<5%
5-10%
10-15%
15%+
Athene & Athora($85bn)
CLOs($12bn)
MidCap($8bn)
Hedge Funds($7bn)
Drawdown Funds($28bn)
Managed Accounts
Total Return($4bn)
EM Debt
Apollo manages more than 100 discrete funds or accounts across a broad set of investment strategies
Note: As of December 31, 2017. Diagram is illustrative in nature with bubbles banded by approximate return targets and size of bubbles representing magnitude of AUM. Identified pockets of AUM may not sum due to double counting. There is no guarantee that target returns will be achieved.
$136 billion of AUM including $98 billion in Credit Permanent Capital Vehicles $28 billion of AUM
AINV
CION
(1) As of December 31, 2017. (2) As of September 30, 2017. 10
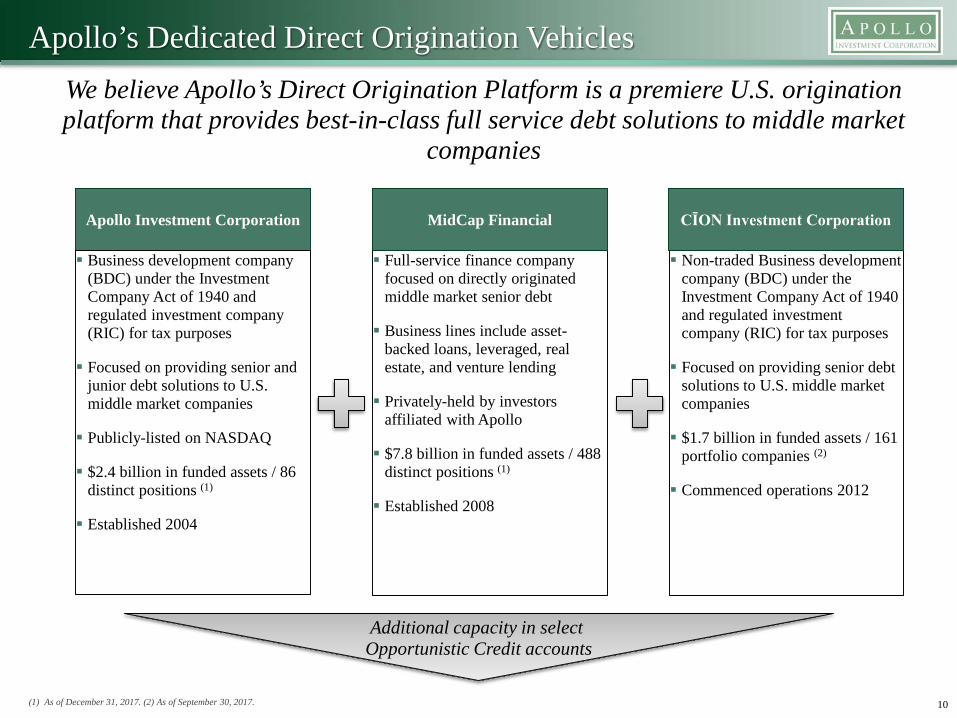
Apollo’s Dedicated Direct Origination VehiclesWe believe Apollo’s Direct Origination Platform is a premiere U.S. origination platform that provides best-in-class full service debt solutions to middle market
companies
Additional capacity in select Opportunistic Credit accounts
Non-traded Business development company (BDC) under the Investment Company Act of 1940 and regulated investment company (RIC) for tax purposes
Focused on providing senior debt solutions to U.S. middle market companies
$1.7 billion in funded assets / 161 portfolio companies (2)
Commenced operations 2012
Full-service finance company focused on directly originated middle market senior debt
Business lines include asset-backed loans, leveraged, real estate, and venture lending
Privately-held by investors affiliated with Apollo
$7.8 billion in funded assets / 488 distinct positions (1)
Established 2008
Apollo Investment Corporation MidCap Financial
Business development company (BDC) under the Investment Company Act of 1940 and regulated investment company (RIC) for tax purposes
Focused on providing senior and junior debt solutions to U.S. middle market companies
Publicly-listed on NASDAQ
$2.4 billion in funded assets / 86 distinct positions (1)
Established 2004
CĪON Investment Corporation
Comprehensive Approach to Originations
11
We believe that Apollo has one of the largest and most diverse origination teams in the marketplace covering a diverse array of end markets
Combined with the recent receipt of exemptive relief to co-invest, we believe that the Apollo platform is one that very few alternative asset managers can compete against
Financial Sponsors
Origination Channels
Wall StreetNiche Markets AINV has completed
transactions with 100+ different sponsors
AINV and MidCap unified calling effort into financial sponsors
Ability to offer full suite of products increases relevancy
Specialized industry expertise in areas with high barriers to entry AINV and MidCap specialized
teams AINV has access to all MidCap
specialized teams
Leverage Apollo’s deep relationship with Wall Street intermediaries Apollo buying power provides
good access Potential source of liquidity that
may be used to fund core investments
Direct Origination
Corporate Lending Life Sciences, ABL, Lender Finance and Aviation
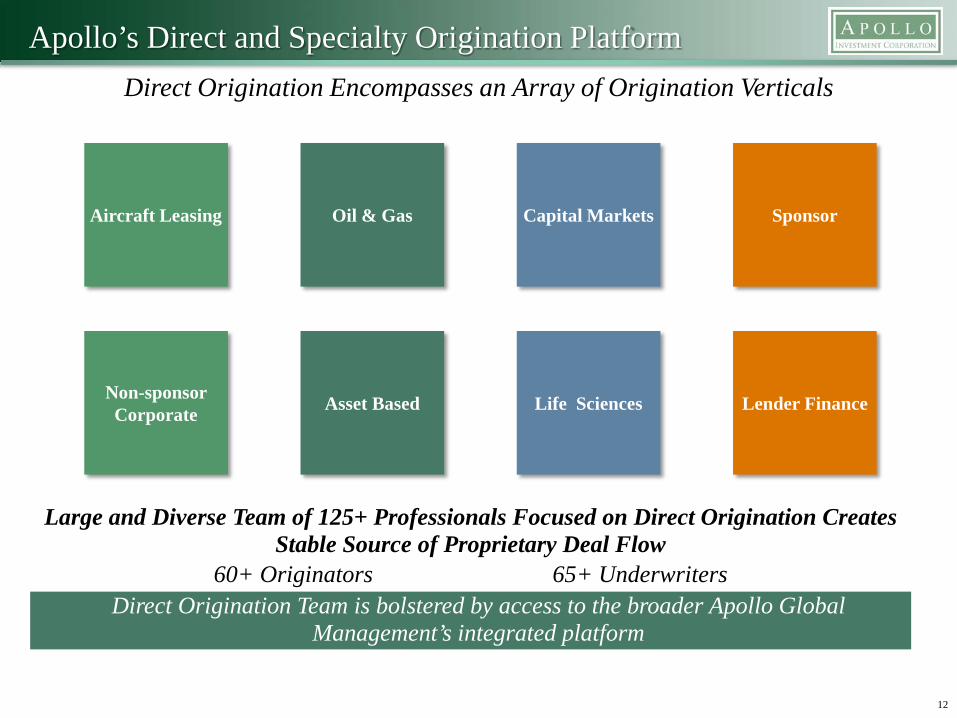
Apollo’s Direct and Specialty Origination Platform
Direct Origination Team is bolstered by access to the broader Apollo Global Management’s integrated platform
12
Direct Origination Encompasses an Array of Origination Verticals
Large and Diverse Team of 125+ Professionals Focused on Direct Origination Creates Stable Source of Proprietary Deal Flow
60+ Originators 65+ Underwriters
Aircraft Leasing Capital Markets Sponsor
Non-sponsor Corporate Asset Based Lender Finance
Oil & Gas
Life Sciences
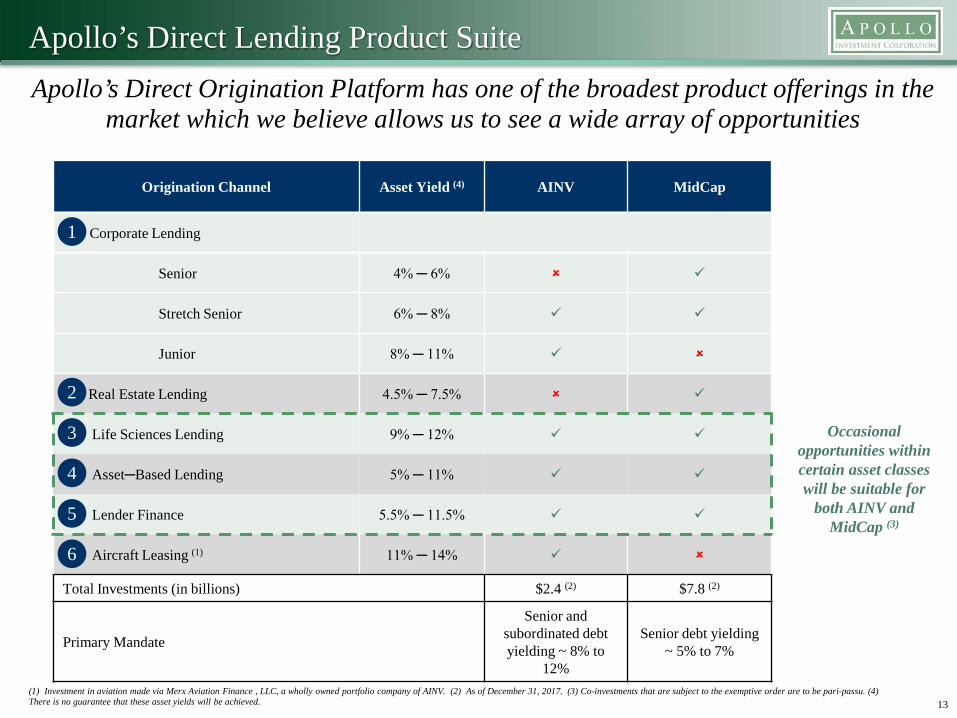
Apollo’s Direct Lending Product Suite
13
Origination Channel Asset Yield (4) AINV MidCap
Corporate Lending
Senior 4% ─ 6%
Stretch Senior 6% ─ 8%
Junior 8% ─ 11%
Real Estate Lending 4.5% ─ 7.5%
Life Sciences Lending 9% ─ 12%
Asset─Based Lending 5% ─ 11%
Lender Finance 5.5% ─ 11.5%
Aircraft Leasing (1) 11% ─ 14%
Total Investments (in billions) $2.4 (2) $7.8 (2)
Primary Mandate
Senior and subordinated debt yielding ~ 8% to
12%
Senior debt yielding ~ 5% to 7%
Apollo’s Direct Origination Platform has one of the broadest product offerings in the market which we believe allows us to see a wide array of opportunities
1
2
3
4
5
6
(1) Investment in aviation made via Merx Aviation Finance , LLC, a wholly owned portfolio company of AINV. (2) As of December 31, 2017. (3) Co-investments that are subject to the exemptive order are to be pari-passu. (4) There is no guarantee that these asset yields will be achieved.
Occasional opportunities within certain asset classes will be suitable for
both AINV and MidCap (3)
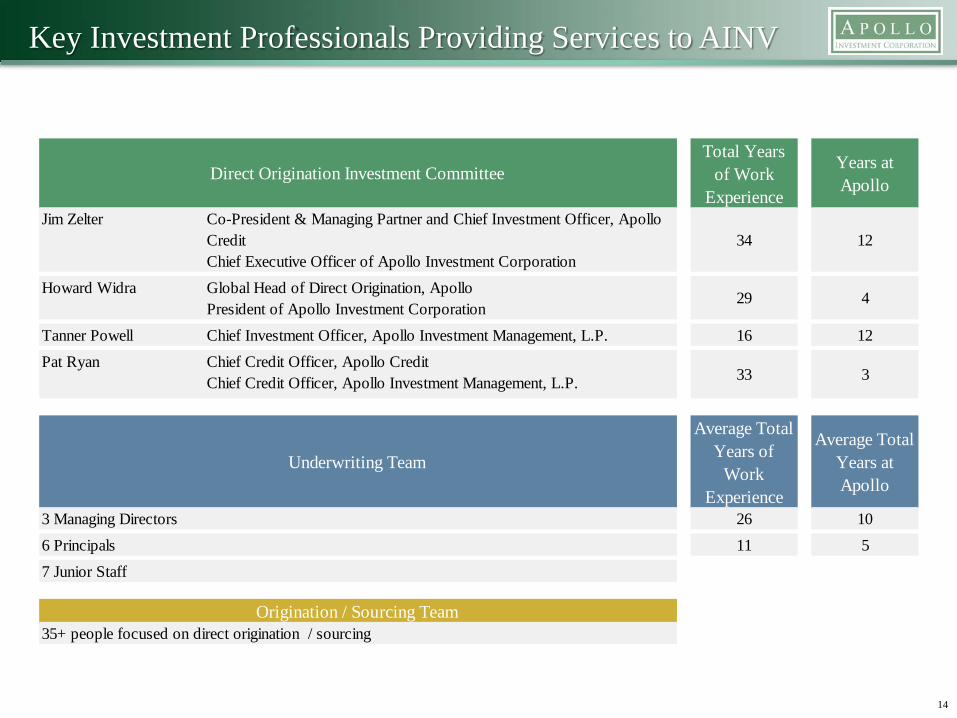
Key Investment Professionals Providing Services to AINV
14
Total Years of Work
Experience
Years at Apollo
Jim Zelter Co-President & Managing Partner and Chief Investment Officer, Apollo Credit Chief Executive Officer of Apollo Investment Corporation
34 12
Howard Widra Global Head of Direct Origination, ApolloPresident of Apollo Investment Corporation
29 4
Tanner Powell Chief Investment Officer, Apollo Investment Management, L.P. 16 12Pat Ryan Chief Credit Officer, Apollo Credit
Chief Credit Officer, Apollo Investment Management, L.P. 33 3
Average Total Years of
Work Experience
Average Total Years at Apollo
3 Managing Directors 26 106 Principals 11 57 Junior Staff
35+ people focused on direct origination / sourcing
Direct Origination Investment Committee
Underwriting Team
Origination / Sourcing Team
Co-Investment Opportunities
15(1) On March 29, 2016, the Company received an exemptive order from the SEC permitting greater flexibility to participate in co-investment transactions with certain of its affiliates where terms other than price and quantity are negotiated, subject to the conditions included therein. (2) Through December 31, 2017.
AINV received exemptive relief from the SEC permitting it to enter into previously prohibited negotiated joint transactions with other funds / entities managed by AGM, including MidCap (1)
We believe that the scale of AINV, MidCap and other Apollo managed capital, on a combined basis, makes us one of the largest market participants well
positioned to make large commitments
We believe exemptive relief to co-invest should improve AINV’s competitive positioning
– Allows AINV to compete more on the basis of size / scale and certainty of execution, rather than simply on price
– Enhances ability to originate larger transactions with the ability to hold and / or syndicate loans
– Expected to increase deal flow ─ number and variety of deals
– Ability to partner with MidCap which provides AINV with access to MidCap’s expertise in niche markets with high barriers to entry
– Already seeing a strong pipeline of co-investment opportunities with MidCap
AINV does not lend to portfolio companies owned by AGM’s private equity funds
Since receiving the order, AINV has invested $511 million across 22 companies, pursuant to the co-investment exemptive order (2)
16
Investment Strategy & Portfolio Repositioning
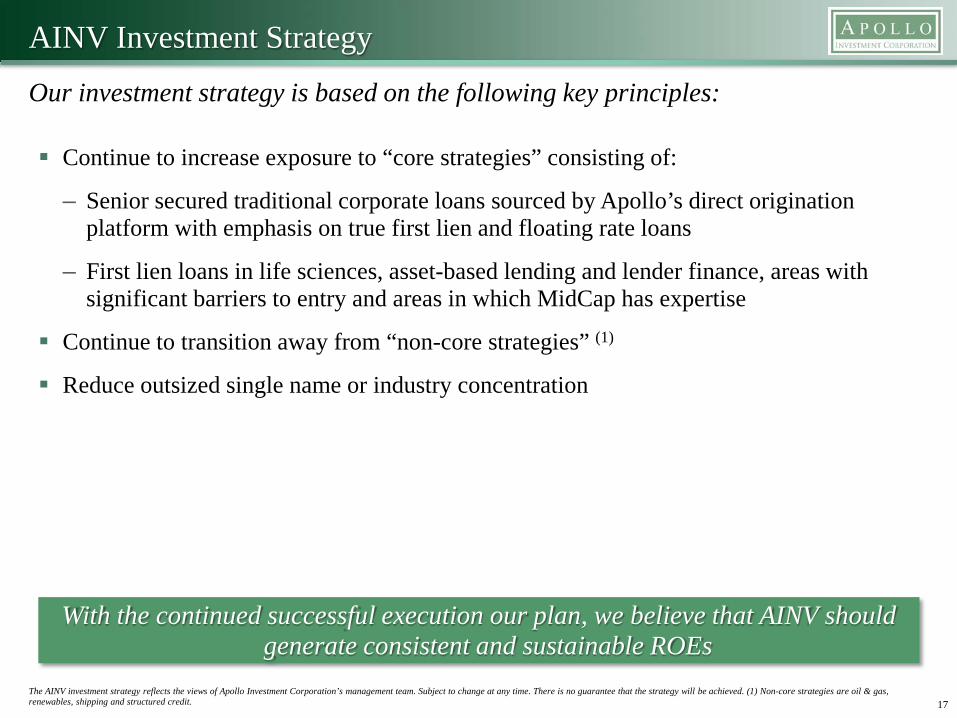
AINV Investment Strategy
Continue to increase exposure to “core strategies” consisting of:
– Senior secured traditional corporate loans sourced by Apollo’s direct origination platform with emphasis on true first lien and floating rate loans
– First lien loans in life sciences, asset-based lending and lender finance, areas with significant barriers to entry and areas in which MidCap has expertise
Continue to transition away from “non-core strategies” (1)
Reduce outsized single name or industry concentration
Our investment strategy is based on the following key principles:
17The AINV investment strategy reflects the views of Apollo Investment Corporation’s management team. Subject to change at any time. There is no guarantee that the strategy will be achieved. (1) Non-core strategies are oil & gas, renewables, shipping and structured credit.
With the continued successful execution our plan, we believe that AINV should generate consistent and sustainable ROEs
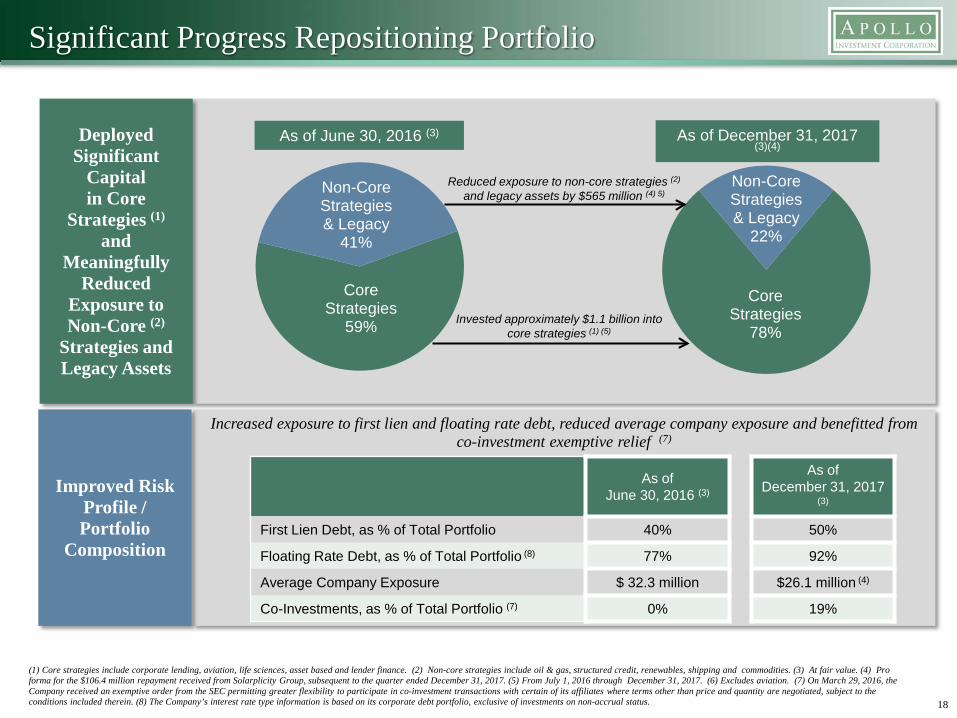
Core Strategies
59%
Non-Core Strategies & Legacy
41%
As of June 30, 2016 (3)
Core Strategies
78%
Non-Core Strategies & Legacy
22%
As of December 31, 2017 (3)(4)
Significant Progress Repositioning Portfolio
18
(1) Core strategies include corporate lending, aviation, life sciences, asset based and lender finance. (2) Non-core strategies include oil & gas, structured credit, renewables, shipping and commodities. (3) At fair value. (4) Pro forma for the $106.4 million repayment received from Solarplicity Group, subsequent to the quarter ended December 31, 2017. (5) From July 1, 2016 through December 31, 2017. (6) Excludes aviation. (7) On March 29, 2016, the Company received an exemptive order from the SEC permitting greater flexibility to participate in co-investment transactions with certain of its affiliates where terms other than price and quantity are negotiated, subject to the conditions included therein. (8) The Company’s interest rate type information is based on its corporate debt portfolio, exclusive of investments on non-accrual status.
Deployed Significant
Capitalin Core
Strategies (1)
and Meaningfully
Reduced Exposure to Non-Core (2)
Strategies and Legacy Assets
As of June 30, 2017 (3)Increased exposure to first lien and floating rate debt, reduced average company exposure and benefitted from
co-investment exemptive relief (7)
Improved Risk Profile / Portfolio
Composition
As of June 30, 2016 (3)
As of December 31, 2017
(3)
First Lien Debt, as % of Total Portfolio 40% 50%
Floating Rate Debt, as % of Total Portfolio (8) 77% 92%
Average Company Exposure $ 32.3 million $26.1 million (4)
Co-Investments, as % of Total Portfolio (7) 0% 19%
Invested approximately $1.1 billion into core strategies (1) (5)
Reduced exposure to non-core strategies (2)
and legacy assets by $565 million (4) 5)
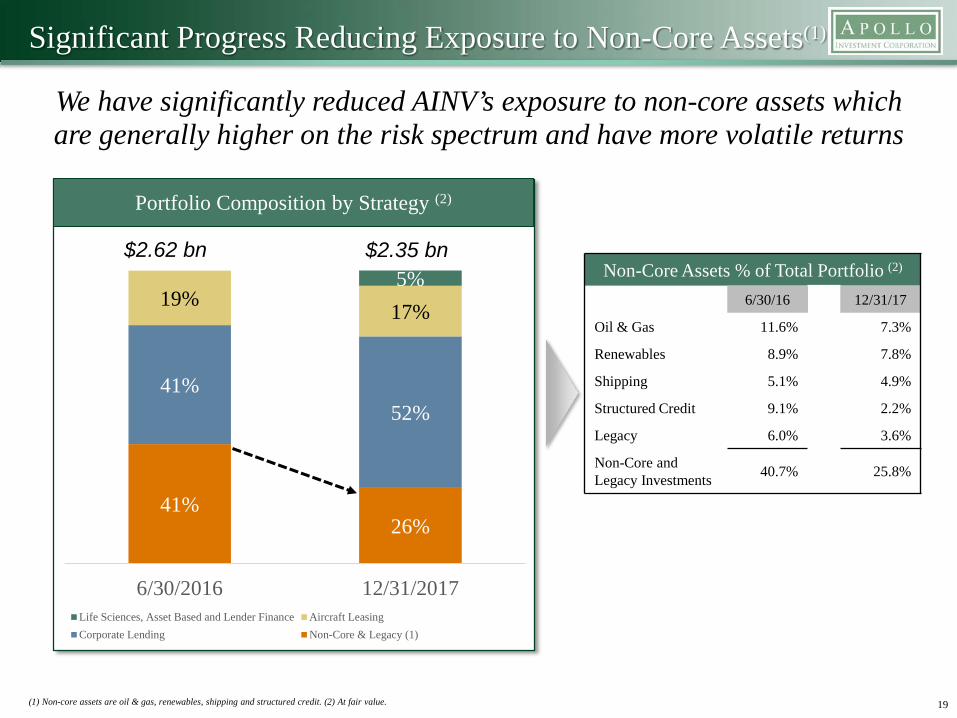
Significant Progress Reducing Exposure to Non-Core Assets(1)
We have significantly reduced AINV’s exposure to non-core assets which are generally higher on the risk spectrum and have more volatile returns
19
41%26%
41%52%
19% 17%5%
6/30/2016 12/31/2017Life Sciences, Asset Based and Lender Finance Aircraft LeasingCorporate Lending Non-Core & Legacy (1)
$2.62 bn $2.35 bnNon-Core Assets % of Total Portfolio (2)
6/30/16 12/31/17
Oil & Gas 11.6% 7.3%
Renewables 8.9% 7.8%
Shipping 5.1% 4.9%
Structured Credit 9.1% 2.2%
Legacy 6.0% 3.6%
Non-Core and Legacy Investments 40.7% 25.8%
(1) Non-core assets are oil & gas, renewables, shipping and structured credit. (2) At fair value.
Portfolio Composition by Strategy (2)
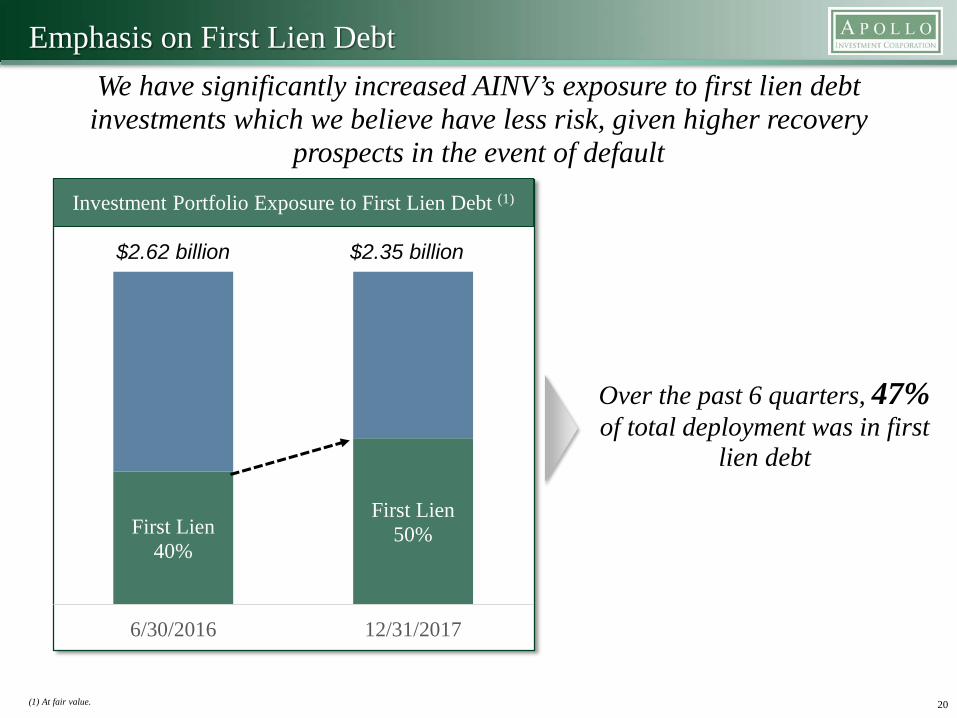
Emphasis on First Lien Debt We have significantly increased AINV’s exposure to first lien debt investments which we believe have less risk, given higher recovery
prospects in the event of default
20
First Lien40%
First Lien50%
6/30/2016 12/31/2017
$2.62 billion $2.35 billion
(1) At fair value.
Investment Portfolio Exposure to First Lien Debt (1)
Over the past 6 quarters, 47%of total deployment was in first
lien debt

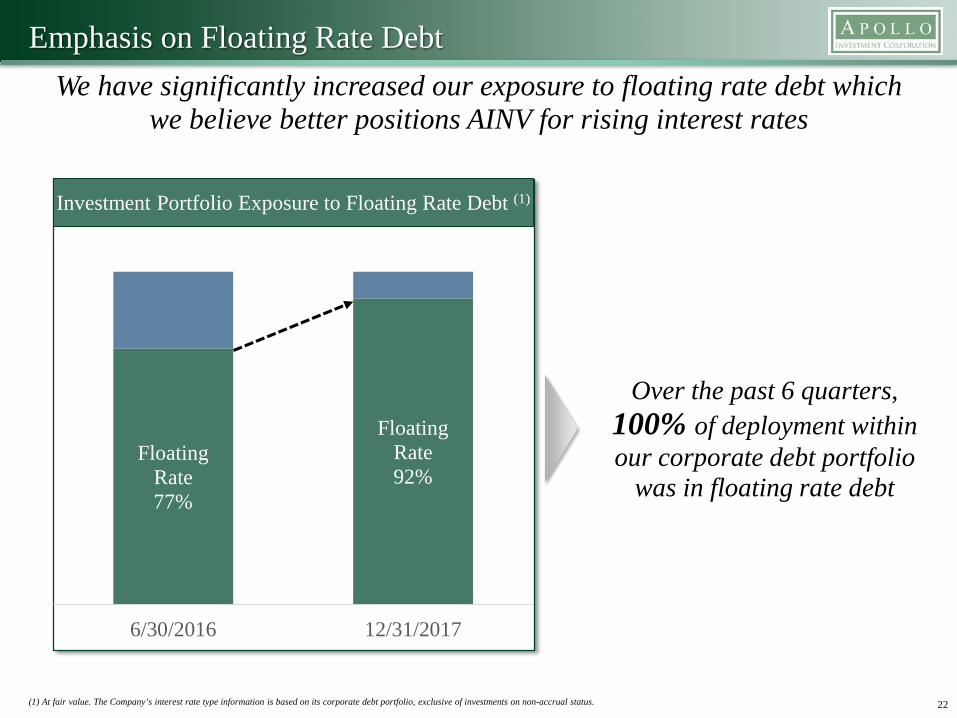
Emphasis on Floating Rate Debt We have significantly increased our exposure to floating rate debt which
we believe better positions AINV for rising interest rates
21
Floating Rate77%
Floating Rate92%
6/30/2016 12/31/2017
(1) At fair value. The Company’s interest rate type information is based on its corporate debt portfolio, exclusive of investments on non-accrual status.
Investment Portfolio Exposure to Floating Rate Debt (1)
Over the past 6 quarters, 100% of deployment within our corporate debt portfolio
was in floating rate debt
Emphasis on Floating Rate Debt We have significantly increased our exposure to floating rate debt which
we believe better positions AINV for rising interest rates
22
Floating Rate77%
Floating Rate92%
6/30/2016 12/31/2017
(1) At fair value. The Company’s interest rate type information is based on its corporate debt portfolio, exclusive of investments on non-accrual status.
Investment Portfolio Exposure to Floating Rate Debt (1)
Over the past 6 quarters, 100% of deployment within our corporate debt portfolio
was in floating rate debt
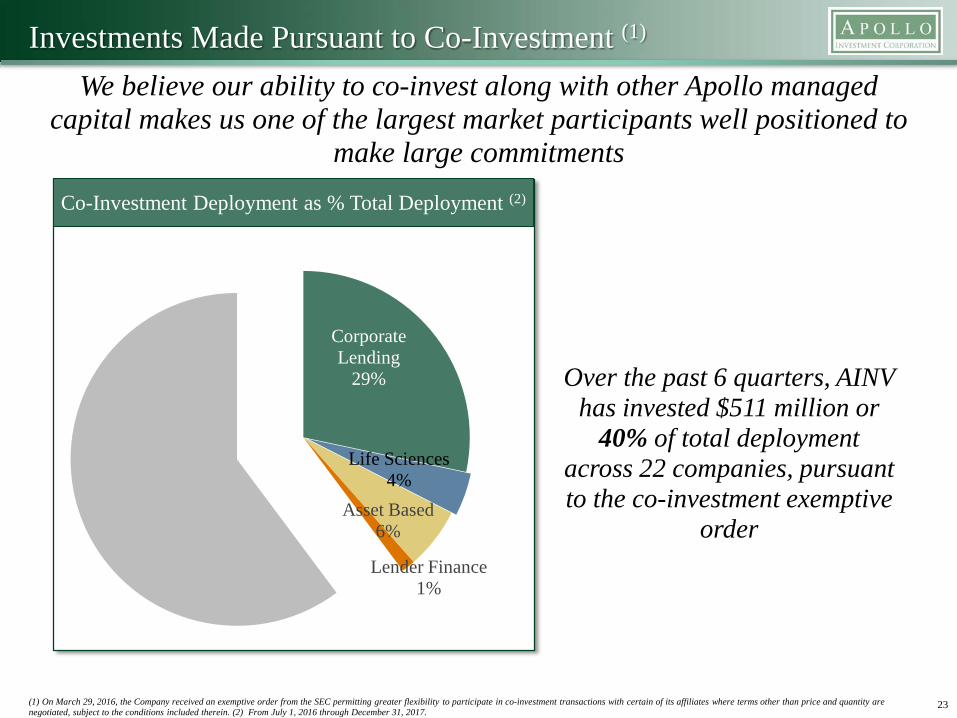
Investments Made Pursuant to Co-Investment (1)
We believe our ability to co-invest along with other Apollo managed capital makes us one of the largest market participants well positioned to
make large commitments
23(1) On March 29, 2016, the Company received an exemptive order from the SEC permitting greater flexibility to participate in co-investment transactions with certain of its affiliates where terms other than price and quantity are negotiated, subject to the conditions included therein. (2) From July 1, 2016 through December 31, 2017.
Co-Investment Deployment as % Total Deployment (2)
Over the past 6 quarters, AINV has invested $511 million or
40% of total deployment across 22 companies, pursuant to the co-investment exemptive
order
Corporate Lending
29%
Life Sciences4%
Asset Based6%
Lender Finance1%
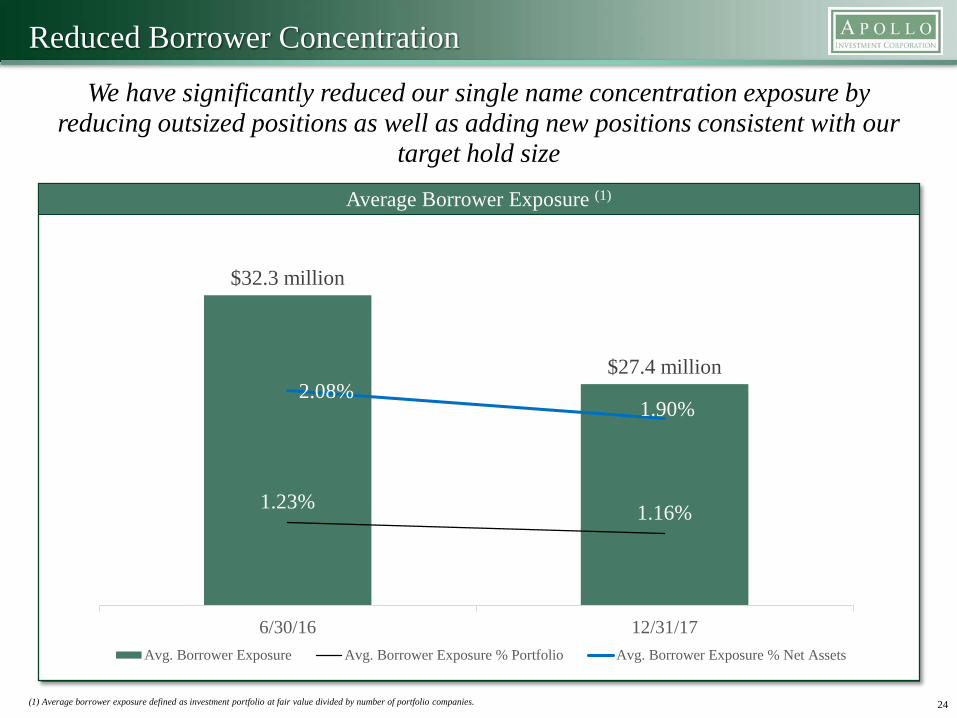
Reduced Borrower Concentration
We have significantly reduced our single name concentration exposure by reducing outsized positions as well as adding new positions consistent with our
target hold size
Average Borrower Exposure (1)
24
$32.3 million
$27.4 million
1.23% 1.16%
2.08%1.90%
0.70%
1.20%
1.70%
2.20%
2.70%
$15.0
$17.0
$19.0
$21.0
$23.0
$25.0
$27.0
$29.0
$31.0
$33.0
$35.0
6/30/16 12/31/17Avg. Borrower Exposure Avg. Borrower Exposure % Portfolio Avg. Borrower Exposure % Net Assets
(1) Average borrower exposure defined as investment portfolio at fair value divided by number of portfolio companies.
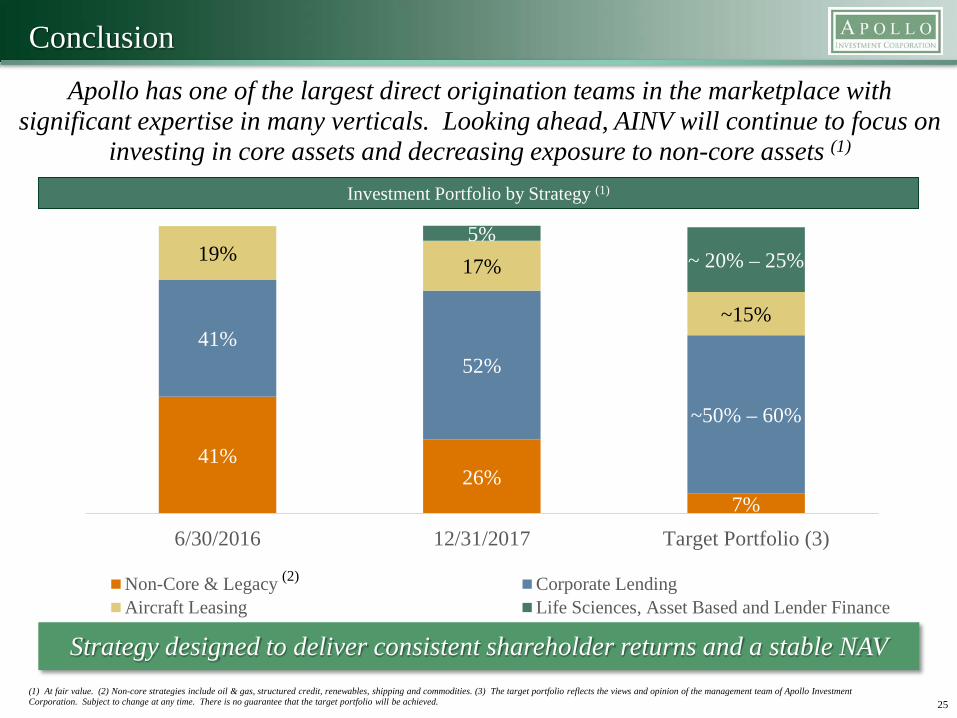
Conclusion
Investment Portfolio by Strategy (1)
41%26%
7%
41%52%
~50% – 60%
19% 17%
~15%
5%~ 20% – 25%
6/30/2016 12/31/2017 Target Portfolio (3)
Non-Core & Legacy Corporate LendingAircraft Leasing Life Sciences, Asset Based and Lender Finance
(2)
25(1) At fair value. (2) Non-core strategies include oil & gas, structured credit, renewables, shipping and commodities. (3) The target portfolio reflects the views and opinion of the management team of Apollo Investment Corporation. Subject to change at any time. There is no guarantee that the target portfolio will be achieved.
Apollo has one of the largest direct origination teams in the marketplace with significant expertise in many verticals. Looking ahead, AINV will continue to focus on
investing in core assets and decreasing exposure to non-core assets (1)
Strategy designed to deliver consistent shareholder returns and a stable NAV

26
Portfolio Review
Corporate Lending
52%Aircraft Leasing
17%
Existing Specialty Verticals
22%
Life Sciences & Asset Based
5%
Other4%
1st Lien50%
2nd Lien32%
Unsecured5%
Structured Products and
Other4%
Preferred Equity
1%
Common Equity and Warrants
9%
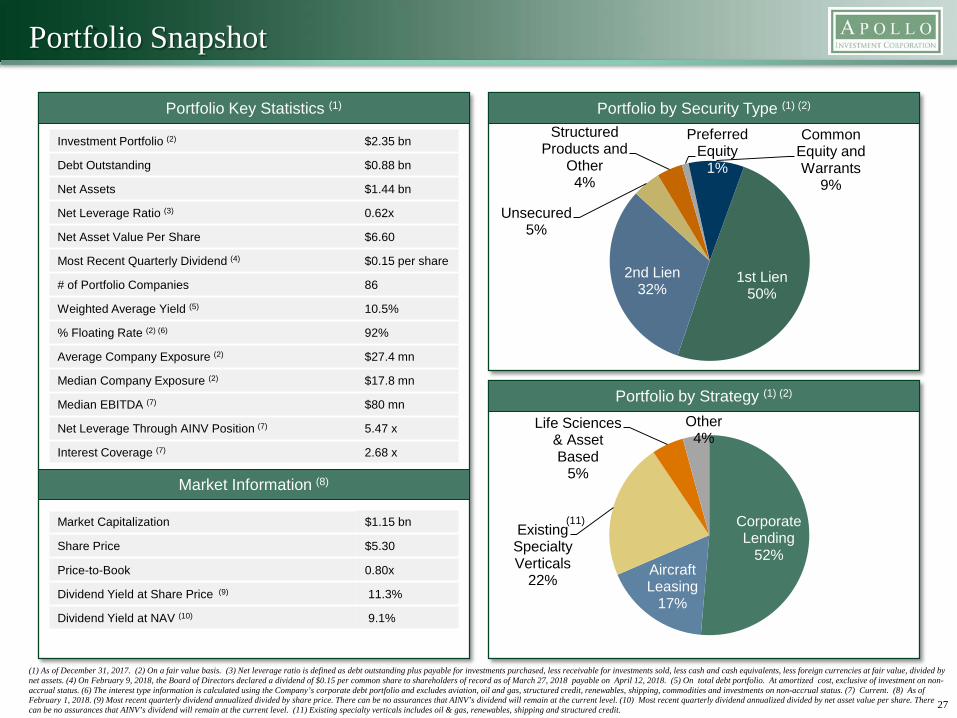
Portfolio Snapshot
Portfolio Key Statistics (1)
Investment Portfolio (2) $2.35 bn
Debt Outstanding $0.88 bn
Net Assets $1.44 bn
Net Leverage Ratio (3) 0.62x
Net Asset Value Per Share $6.60
Most Recent Quarterly Dividend (4) $0.15 per share
# of Portfolio Companies 86
Weighted Average Yield (5) 10.5%
% Floating Rate (2) (6) 92%
Average Company Exposure (2) $27.4 mn
Median Company Exposure (2) $17.8 mn
Median EBITDA (7) $80 mn
Net Leverage Through AINV Position (7) 5.47 x
Interest Coverage (7) 2.68 x
27
(1) As of December 31, 2017. (2) On a fair value basis. (3) Net leverage ratio is defined as debt outstanding plus payable for investments purchased, less receivable for investments sold, less cash and cash equivalents, less foreign currencies at fair value, divided by net assets. (4) On February 9, 2018, the Board of Directors declared a dividend of $0.15 per common share to shareholders of record as of March 27, 2018 payable on April 12, 2018. (5) On total debt portfolio. At amortized cost, exclusive of investment on non-accrual status. (6) The interest type information is calculated using the Company’s corporate debt portfolio and excludes aviation, oil and gas, structured credit, renewables, shipping, commodities and investments on non-accrual status. (7) Current. (8) As of February 1, 2018. (9) Most recent quarterly dividend annualized divided by share price. There can be no assurances that AINV’s dividend will remain at the current level. (10) Most recent quarterly dividend annualized divided by net asset value per share. There can be no assurances that AINV’s dividend will remain at the current level. (11) Existing specialty verticals includes oil & gas, renewables, shipping and structured credit.
Portfolio by Security Type (1) (2)
Portfolio by Strategy (1) (2)
Market Information (8)
Market Capitalization $1.15 bn
Share Price $5.30
Price-to-Book 0.80x
Dividend Yield at Share Price (9) 11.3%
Dividend Yield at NAV (10) 9.1%
(11)
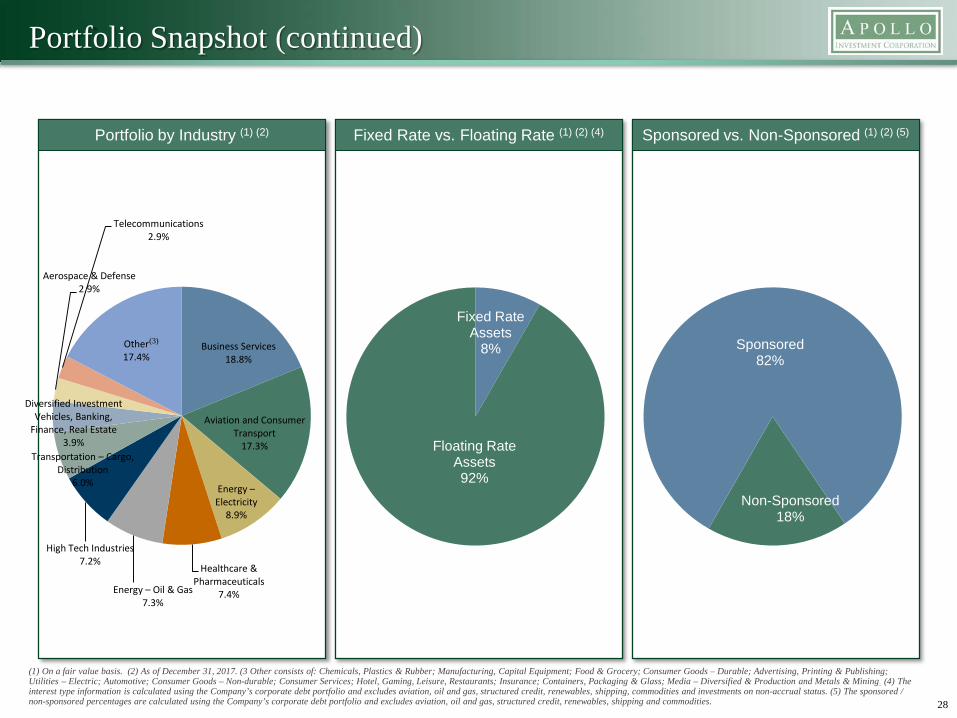
Non-Sponsored18%
Sponsored82%
Fixed Rate Assets
8%
Floating Rate Assets92%
Portfolio Snapshot (continued)
Fixed Rate vs. Floating Rate (1) (2) (4) Sponsored vs. Non-Sponsored (1) (2) (5)
28
Portfolio by Industry (1) (2)
(1) On a fair value basis. (2) As of December 31, 2017. (3 Other consists of: Chemicals, Plastics & Rubber; Manufacturing, Capital Equipment; Food & Grocery; Consumer Goods – Durable; Advertising, Printing & Publishing; Utilities – Electric; Automotive; Consumer Goods – Non-durable; Consumer Services; Hotel, Gaming, Leisure, Restaurants; Insurance; Containers, Packaging & Glass; Media – Diversified & Production and Metals & Mining. (4) The interest type information is calculated using the Company’s corporate debt portfolio and excludes aviation, oil and gas, structured credit, renewables, shipping, commodities and investments on non-accrual status. (5) The sponsored / non-sponsored percentages are calculated using the Company’s corporate debt portfolio and excludes aviation, oil and gas, structured credit, renewables, shipping and commodities.
Business Services18.8%
Aviation and Consumer Transport
17.3%
Energy –Electricity
8.9%
Healthcare & Pharmaceuticals
7.4%Energy – Oil & Gas7.3%
High Tech Industries7.2%
Transportation – Cargo, Distribution
6.0%
Diversified Investment Vehicles, Banking,
Finance, Real Estate3.9%
Aerospace & Defense2.9%
Telecommunications2.9%
Other17.4%
(3)
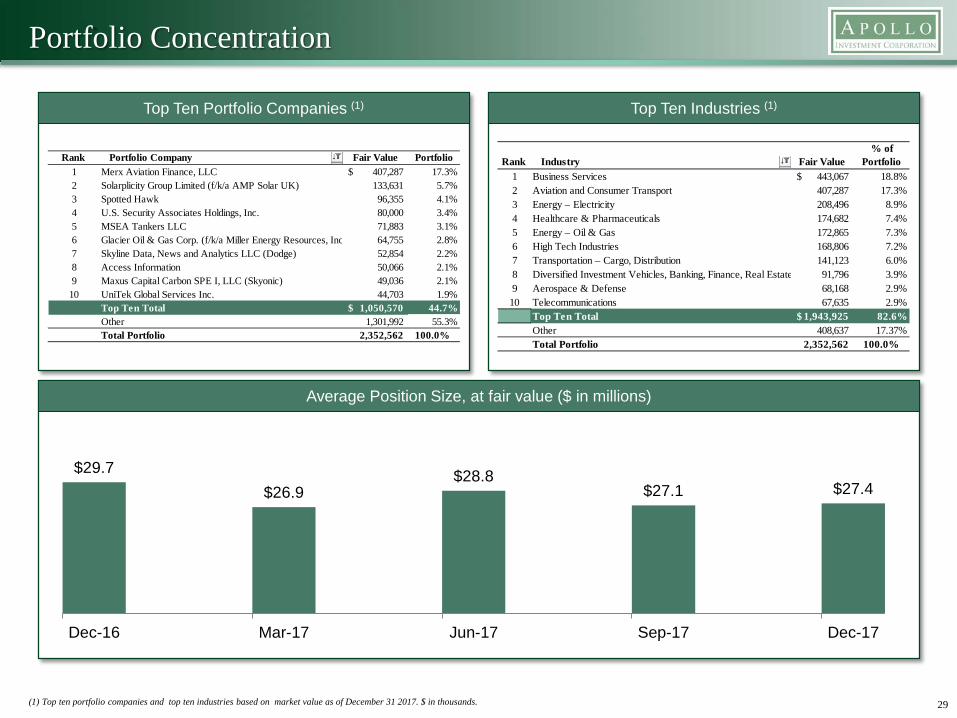
Portfolio Concentration
Top Ten Industries (1)
Average Position Size, at fair value ($ in millions)
29(1) Top ten portfolio companies and top ten industries based on market value as of December 31 2017. $ in thousands.
Top Ten Portfolio Companies (1)
Rank Portfolio Company Fair Value
Portfolio1 Merx Aviation Finance, LLC 407,287$ 17.3%2 Solarplicity Group Limited (f/k/a AMP Solar UK) 133,631 5.7%3 Spotted Hawk 96,355 4.1%4 U.S. Security Associates Holdings, Inc. 80,000 3.4%5 MSEA Tankers LLC 71,883 3.1%6 Glacier Oil & Gas Corp. (f/k/a Miller Energy Resources, Inc 64,755 2.8%7 Skyline Data, News and Analytics LLC (Dodge) 52,854 2.2%8 Access Information 50,066 2.1%9 Maxus Capital Carbon SPE I, LLC (Skyonic) 49,036 2.1%
10 UniTek Global Services Inc. 44,703 1.9%Top Ten Total 1,050,570$ 44.7%Other 1,301,992 55.3%Total Portfolio 2,352,562 100.0%
Rank Industry Fair Value% of
Portfolio1 Business Services 443,067$ 18.8%2 Aviation and Consumer Transport 407,287 17.3%3 Energy – Electricity 208,496 8.9%4 Healthcare & Pharmaceuticals 174,682 7.4%5 Energy – Oil & Gas 172,865 7.3%6 High Tech Industries 168,806 7.2%7 Transportation – Cargo, Distribution 141,123 6.0%8 Diversified Investment Vehicles, Banking, Finance, Real Estate 91,796 3.9%9 Aerospace & Defense 68,168 2.9%
10 Telecommunications 67,635 2.9%Top Ten Total 1,943,925$ 82.6%Other 408,637 17.37%Total Portfolio 2,352,562 100.0%
$29.7$26.9
$28.8$27.1 $27.4
Dec-16 Mar-17 Jun-17 Sep-17 Dec-17
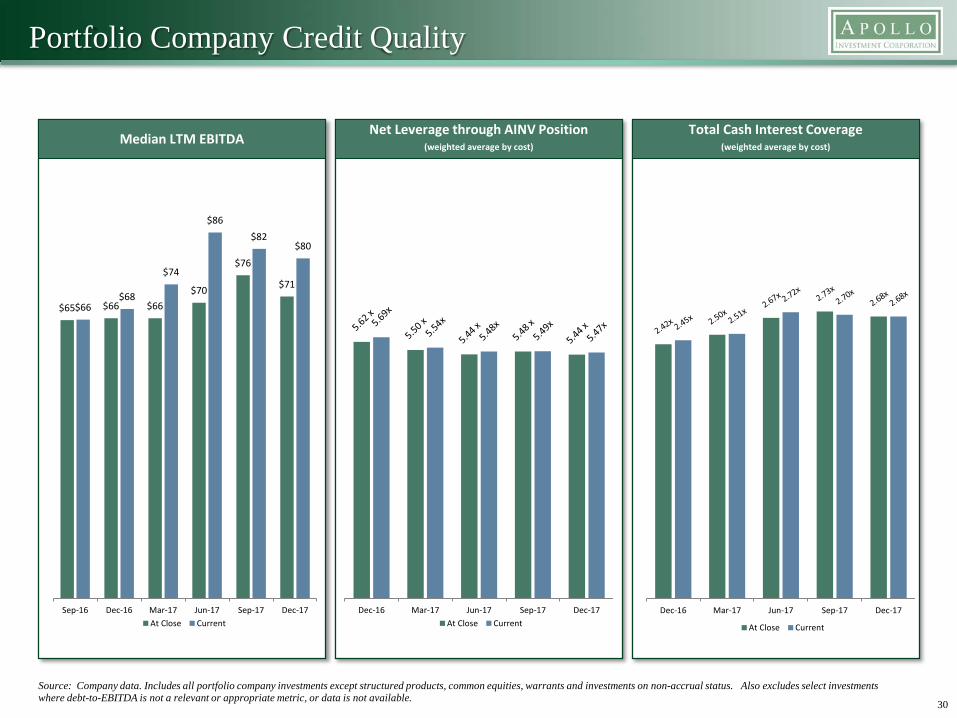
Portfolio Company Credit Quality
Net Leverage through AINV Position(weighted average by cost)
30
Median LTM EBITDA
$65 $66 $66$70
$76
$71
$66$68
$74
$86$82
$80
Sep-16 Dec-16 Mar-17 Jun-17 Sep-17 Dec-17At Close Current
Source: Company data. Includes all portfolio company investments except structured products, common equities, warrants and investments on non-accrual status. Also excludes select investments where debt-to-EBITDA is not a relevant or appropriate metric, or data is not available.
Total Cash Interest Coverage(weighted average by cost)
Dec-16 Mar-17 Jun-17 Sep-17 Dec-17
At Close Current
Dec-16 Mar-17 Jun-17 Sep-17 Dec-17At Close Current
8%
6%
6%
4%
4%4%
4%
3%3%3%3%3%
3% 3%
2%
2%2%
2%
2%
2%2%
29%
25 Lessees Each < 2%
46 Lessees
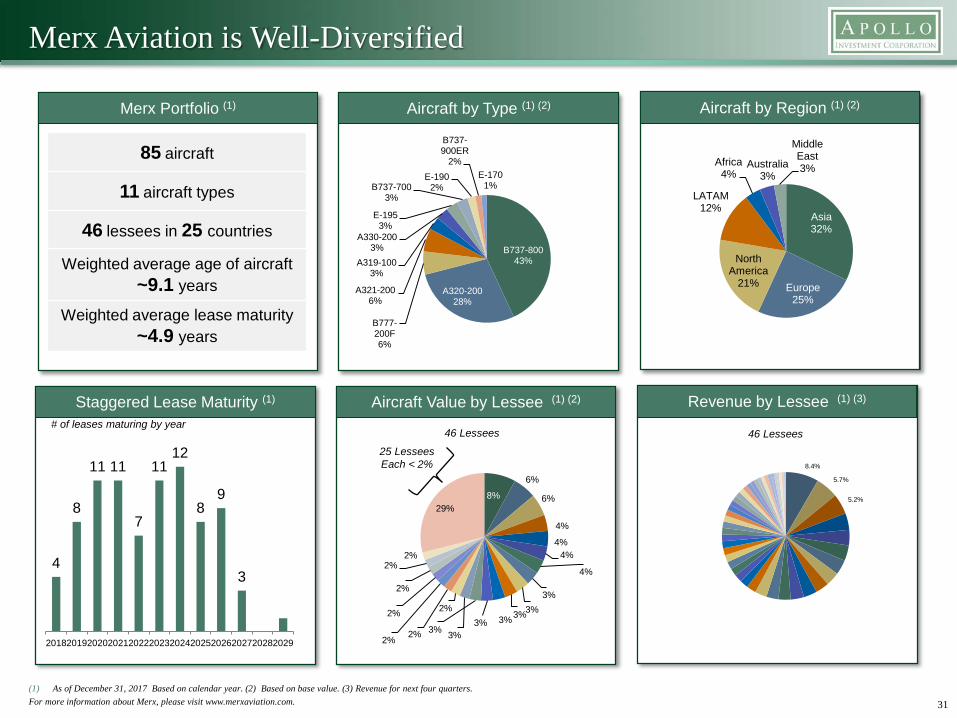
Merx Aviation is Well-Diversified
Aircraft by Type (1) (2)
31
85 aircraft
11 aircraft types
46 lessees in 25 countries
Weighted average age of aircraft~9.1 years
Weighted average lease maturity ~4.9 years
B737-80043%
A320-20028%
B777-200F6%
A321-2006%
A319-1003%
A330-2003%
E-1953%
B737-7003%
E-1902%
B737-900ER
2%E-170
1%
(1) As of December 31, 2017 Based on calendar year. (2) Based on base value. (3) Revenue for next four quarters. For more information about Merx, please visit www.merxaviation.com.
Merx Portfolio (1) Aircraft by Region (1) (2)
Asia32%
Europe25%
North America
21%
LATAM12%
Africa4%
Australia3%
Middle East3%
Aircraft Value by Lessee (1) (2)
4
8
11 11
7
1112
89
3
201820192020202120222023202420252026202720282029
# of leases maturing by year
Staggered Lease Maturity (1) Revenue by Lessee (1) (3)
8.4%
5.7%
5.2%
46 Lessees
32
Conclusion
Reasons to Own AINV
Apollo affiliation provides significant benefits
Origination platform is highly differentiated versus other market participants
Receipt of exemptive relief to co-invest enhances competitive positioning
Positioned to benefit from rising interest rates
Strategy designed to deliver consistent shareholder returns and a stable NAV
Strong balance sheet and diverse funding sources
Active share repurchase program
33

34
Appendices
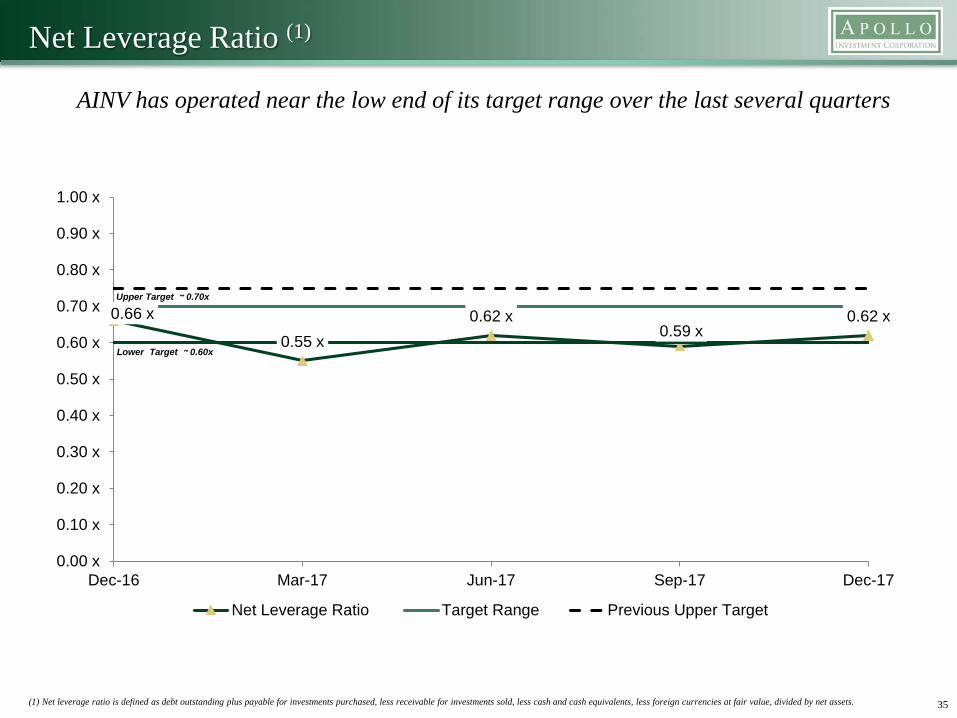
Net Leverage Ratio (1)
35(1) Net leverage ratio is defined as debt outstanding plus payable for investments purchased, less receivable for investments sold, less cash and cash equivalents, less foreign currencies at fair value, divided by net assets.
0.66 x
0.55 x0.62 x
0.59 x0.62 x
0.00 x
0.10 x
0.20 x
0.30 x
0.40 x
0.50 x
0.60 x
0.70 x
0.80 x
0.90 x
1.00 x
Dec-16 Mar-17 Jun-17 Sep-17 Dec-17
Net Leverage Ratio Target Range Previous Upper Target
Upper Target ~ 0.70x
Lower Target ~ 0.60x
AINV has operated near the low end of its target range over the last several quarters
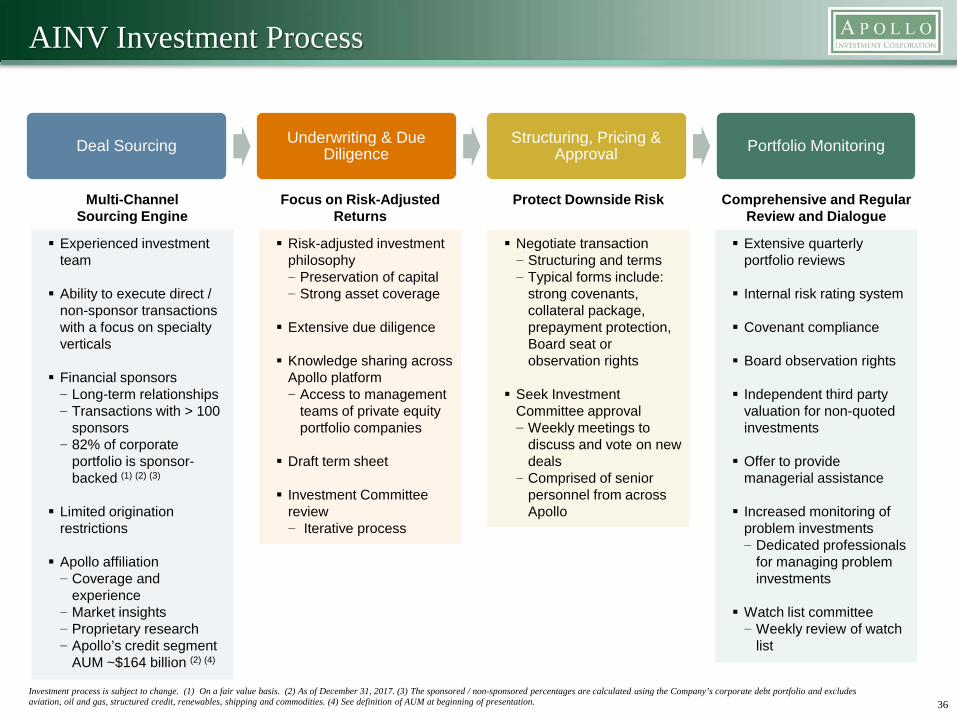
AINV Investment Process
36Investment process is subject to change. (1) On a fair value basis. (2) As of December 31, 2017. (3) The sponsored / non-sponsored percentages are calculated using the Company’s corporate debt portfolio and excludes aviation, oil and gas, structured credit, renewables, shipping and commodities. (4) See definition of AUM at beginning of presentation.
Deal Sourcing Underwriting & Due Diligence
Structuring, Pricing & Approval Portfolio Monitoring
Experienced investment team
Ability to execute direct / non-sponsor transactions with a focus on specialty verticals
Financial sponsors− Long-term relationships− Transactions with > 100
sponsors− 82% of corporate
portfolio is sponsor-backed (1) (2) (3)
Limited origination restrictions
Apollo affiliation − Coverage and
experience − Market insights− Proprietary research− Apollo’s credit segment
AUM ~$164 billion (2) (4)
Risk-adjusted investment philosophy − Preservation of capital − Strong asset coverage
Extensive due diligence
Knowledge sharing across Apollo platform− Access to management
teams of private equity portfolio companies
Draft term sheet
Investment Committee review− Iterative process
Extensive quarterly portfolio reviews
Internal risk rating system
Covenant compliance
Board observation rights
Independent third party valuation for non-quoted investments
Offer to provide managerial assistance
Increased monitoring of problem investments− Dedicated professionals
for managing problem investments
Watch list committee− Weekly review of watch
list
Negotiate transaction− Structuring and terms− Typical forms include:
strong covenants, collateral package, prepayment protection, Board seat or observation rights
Seek Investment Committee approval− Weekly meetings to
discuss and vote on new deals
− Comprised of senior personnel from across Apollo
Multi-Channel Sourcing Engine
Focus on Risk-Adjusted Returns
Protect Downside Risk Comprehensive and Regular Review and Dialogue
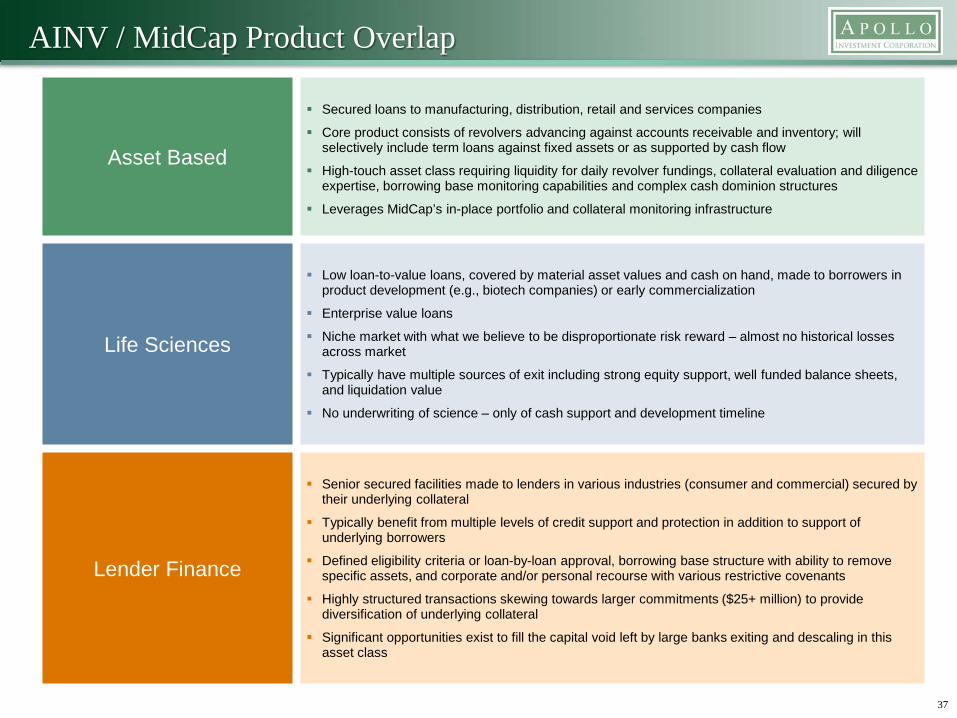
AINV / MidCap Product Overlap
Asset Based
Secured loans to manufacturing, distribution, retail and services companies
Core product consists of revolvers advancing against accounts receivable and inventory; will selectively include term loans against fixed assets or as supported by cash flow
High-touch asset class requiring liquidity for daily revolver fundings, collateral evaluation and diligence expertise, borrowing base monitoring capabilities and complex cash dominion structures
Leverages MidCap’s in-place portfolio and collateral monitoring infrastructure
Life Sciences
Low loan-to-value loans, covered by material asset values and cash on hand, made to borrowers in product development (e.g., biotech companies) or early commercialization
Enterprise value loans
Niche market with what we believe to be disproportionate risk reward – almost no historical losses across market
Typically have multiple sources of exit including strong equity support, well funded balance sheets, and liquidation value
No underwriting of science – only of cash support and development timeline
Lender Finance
Senior secured facilities made to lenders in various industries (consumer and commercial) secured by their underlying collateral
Typically benefit from multiple levels of credit support and protection in addition to support of underlying borrowers
Defined eligibility criteria or loan-by-loan approval, borrowing base structure with ability to remove specific assets, and corporate and/or personal recourse with various restrictive covenants
Highly structured transactions skewing towards larger commitments ($25+ million) to provide diversification of underlying collateral
Significant opportunities exist to fill the capital void left by large banks exiting and descaling in this asset class
37
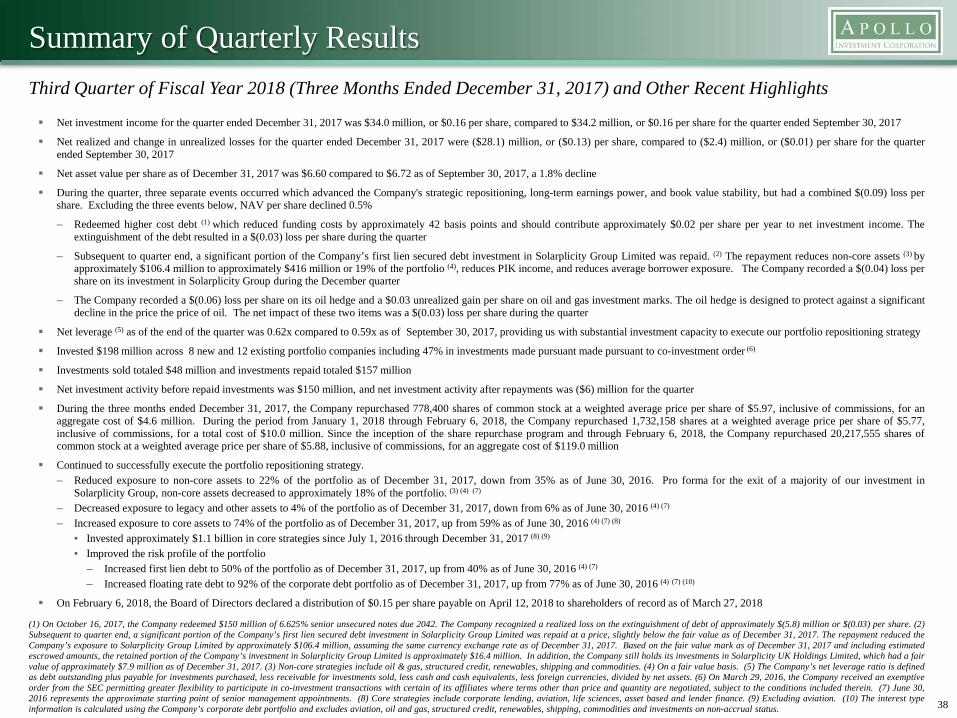
Summary of Quarterly Results
Net investment income for the quarter ended December 31, 2017 was $34.0 million, or $0.16 per share, compared to $34.2 million, or $0.16 per share for the quarter ended September 30, 2017
Net realized and change in unrealized losses for the quarter ended December 31, 2017 were ($28.1) million, or ($0.13) per share, compared to ($2.4) million, or ($0.01) per share for the quarterended September 30, 2017
Net asset value per share as of December 31, 2017 was $6.60 compared to $6.72 as of September 30, 2017, a 1.8% decline
During the quarter, three separate events occurred which advanced the Company's strategic repositioning, long-term earnings power, and book value stability, but had a combined $(0.09) loss pershare. Excluding the three events below, NAV per share declined 0.5%
– Redeemed higher cost debt (1) which reduced funding costs by approximately 42 basis points and should contribute approximately $0.02 per share per year to net investment income. Theextinguishment of the debt resulted in a $(0.03) loss per share during the quarter
– Subsequent to quarter end, a significant portion of the Company’s first lien secured debt investment in Solarplicity Group Limited was repaid. (2) The repayment reduces non-core assets (3) byapproximately $106.4 million to approximately $416 million or 19% of the portfolio (4), reduces PIK income, and reduces average borrower exposure. The Company recorded a $(0.04) loss pershare on its investment in Solarplicity Group during the December quarter
– The Company recorded a $(0.06) loss per share on its oil hedge and a $0.03 unrealized gain per share on oil and gas investment marks. The oil hedge is designed to protect against a significantdecline in the price the price of oil. The net impact of these two items was a $(0.03) loss per share during the quarter
Net leverage (5) as of the end of the quarter was 0.62x compared to 0.59x as of September 30, 2017, providing us with substantial investment capacity to execute our portfolio repositioning strategy
Invested $198 million across 8 new and 12 existing portfolio companies including 47% in investments made pursuant made pursuant to co-investment order (6)
Investments sold totaled $48 million and investments repaid totaled $157 million
Net investment activity before repaid investments was $150 million, and net investment activity after repayments was ($6) million for the quarter
During the three months ended December 31, 2017, the Company repurchased 778,400 shares of common stock at a weighted average price per share of $5.97, inclusive of commissions, for anaggregate cost of $4.6 million. During the period from January 1, 2018 through February 6, 2018, the Company repurchased 1,732,158 shares at a weighted average price per share of $5.77,inclusive of commissions, for a total cost of $10.0 million. Since the inception of the share repurchase program and through February 6, 2018, the Company repurchased 20,217,555 shares ofcommon stock at a weighted average price per share of $5.88, inclusive of commissions, for an aggregate cost of $119.0 million
Continued to successfully execute the portfolio repositioning strategy.– Reduced exposure to non-core assets to 22% of the portfolio as of December 31, 2017, down from 35% as of June 30, 2016. Pro forma for the exit of a majority of our investment in
Solarplicity Group, non-core assets decreased to approximately 18% of the portfolio. (3) (4) (7)
– Decreased exposure to legacy and other assets to 4% of the portfolio as of December 31, 2017, down from 6% as of June 30, 2016 (4) (7)
– Increased exposure to core assets to 74% of the portfolio as of December 31, 2017, up from 59% as of June 30, 2016 (4) (7) (8)
• Invested approximately $1.1 billion in core strategies since July 1, 2016 through December 31, 2017 (8) (9)
• Improved the risk profile of the portfolio– Increased first lien debt to 50% of the portfolio as of December 31, 2017, up from 40% as of June 30, 2016 (4) (7)
– Increased floating rate debt to 92% of the corporate debt portfolio as of December 31, 2017, up from 77% as of June 30, 2016 (4) (7) (10)
On February 6, 2018, the Board of Directors declared a distribution of $0.15 per share payable on April 12, 2018 to shareholders of record as of March 27, 2018
Third Quarter of Fiscal Year 2018 (Three Months Ended December 31, 2017) and Other Recent Highlights
38
(1) On October 16, 2017, the Company redeemed $150 million of 6.625% senior unsecured notes due 2042. The Company recognized a realized loss on the extinguishment of debt of approximately $(5.8) million or $(0.03) per share. (2)Subsequent to quarter end, a significant portion of the Company’s first lien secured debt investment in Solarplicity Group Limited was repaid at a price, slightly below the fair value as of December 31, 2017. The repayment reduced theCompany’s exposure to Solarplicity Group Limited by approximately $106.4 million, assuming the same currency exchange rate as of December 31, 2017. Based on the fair value mark as of December 31, 2017 and including estimatedescrowed amounts, the retained portion of the Company’s investment in Solarplicity Group Limited is approximately $16.4 million. In addition, the Company still holds its investments in Solarplicity UK Holdings Limited, which had a fairvalue of approximately $7.9 million as of December 31, 2017. (3) Non-core strategies include oil & gas, structured credit, renewables, shipping and commodities. (4) On a fair value basis. (5) The Company’s net leverage ratio is definedas debt outstanding plus payable for investments purchased, less receivable for investments sold, less cash and cash equivalents, less foreign currencies, divided by net assets. (6) On March 29, 2016, the Company received an exemptiveorder from the SEC permitting greater flexibility to participate in co-investment transactions with certain of its affiliates where terms other than price and quantity are negotiated, subject to the conditions included therein. (7) June 30,2016 represents the approximate starting point of senior management appointments. (8) Core strategies include corporate lending, aviation, life sciences, asset based and lender finance. (9) Excluding aviation. (10) The interest typeinformation is calculated using the Company’s corporate debt portfolio and excludes aviation, oil and gas, structured credit, renewables, shipping, commodities and investments on non-accrual status.
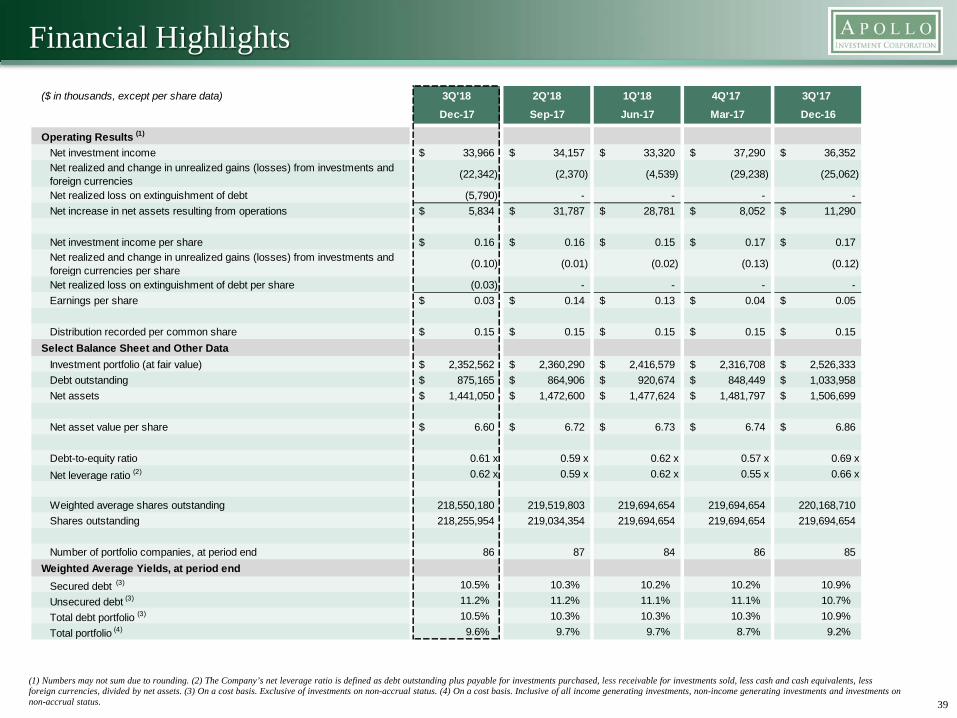
Financial Highlights
39
(1) Numbers may not sum due to rounding. (2) The Company’s net leverage ratio is defined as debt outstanding plus payable for investments purchased, less receivable for investments sold, less cash and cash equivalents, less foreign currencies, divided by net assets. (3) On a cost basis. Exclusive of investments on non-accrual status. (4) On a cost basis. Inclusive of all income generating investments, non-income generating investments and investments on non-accrual status.
($ in thousands, except per share data) 3Q'18 2Q'18 1Q'18 4Q'17 3Q'17 Dec-17 Sep-17 Jun-17 Mar-17 Dec-16
Operating Results (1)
Net investment income 33,966$ 34,157$ 33,320$ 37,290$ 36,352$ Net realized and change in unrealized gains (losses) from investments and foreign currencies (22,342) (2,370) (4,539) (29,238) (25,062)
Net realized loss on extinguishment of debt (5,790) - - - - Net increase in net assets resulting from operations 5,834$ 31,787$ 28,781$ 8,052$ 11,290$
Net investment income per share 0.16$ 0.16$ 0.15$ 0.17$ 0.17$ Net realized and change in unrealized gains (losses) from investments and foreign currencies per share (0.10) (0.01) (0.02) (0.13) (0.12)
Net realized loss on extinguishment of debt per share (0.03) - - - - Earnings per share 0.03$ 0.14$ 0.13$ 0.04$ 0.05$
Distribution recorded per common share 0.15$ 0.15$ 0.15$ 0.15$ 0.15$ Select Balance Sheet and Other Data
Investment portfolio (at fair value) 2,352,562$ 2,360,290$ 2,416,579$ 2,316,708$ 2,526,333$ Debt outstanding 875,165$ 864,906$ 920,674$ 848,449$ 1,033,958$ Net assets 1,441,050$ 1,472,600$ 1,477,624$ 1,481,797$ 1,506,699$
Net asset value per share 6.60$ 6.72$ 6.73$ 6.74$ 6.86$
Debt-to-equity ratio 0.61 x 0.59 x 0.62 x 0.57 x 0.69 xNet leverage ratio (2) 0.62 x 0.59 x 0.62 x 0.55 x 0.66 x
Weighted average shares outstanding 218,550,180 219,519,803 219,694,654 219,694,654 220,168,710 Shares outstanding 218,255,954 219,034,354 219,694,654 219,694,654 219,694,654
Number of portfolio companies, at period end 86 87 84 86 85 Weighted Average Yields, at period end
Secured debt (3) 10.5% 10.3% 10.2% 10.2% 10.9%Unsecured debt (3) 11.2% 11.2% 11.1% 11.1% 10.7%Total debt portfolio (3) 10.5% 10.3% 10.3% 10.3% 10.9%Total portfolio (4) 9.6% 9.7% 9.7% 8.7% 9.2%
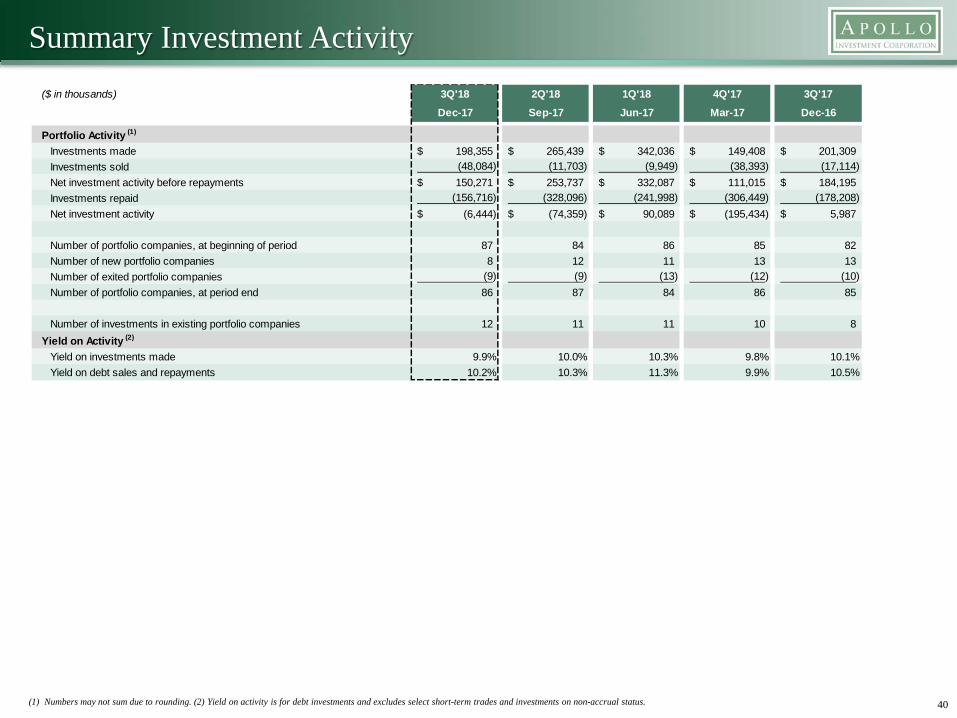
Summary Investment Activity
40(1) Numbers may not sum due to rounding. (2) Yield on activity is for debt investments and excludes select short-term trades and investments on non-accrual status.
($ in thousands) 3Q'18 2Q'18 1Q'18 4Q'17 3Q'17Dec-17 Sep-17 Jun-17 Mar-17 Dec-16
Portfolio Activity (1)
Investments made 198,355$ 265,439$ 342,036$ 149,408$ 201,309$ Investments sold (48,084) (11,703) (9,949) (38,393) (17,114) Net investment activity before repayments 150,271$ 253,737$ 332,087$ 111,015$ 184,195$ Investments repaid (156,716) (328,096) (241,998) (306,449) (178,208) Net investment activity (6,444)$ (74,359)$ 90,089$ (195,434)$ 5,987$
Number of portfolio companies, at beginning of period 87 84 86 85 82 Number of new portfolio companies 8 12 11 13 13 Number of exited portfolio companies (9) (9) (13) (12) (10) Number of portfolio companies, at period end 86 87 84 86 85
Number of investments in existing portfolio companies 12 11 11 10 8 Yield on Activity (2)
Yield on investments made 9.9% 10.0% 10.3% 9.8% 10.1%Yield on debt sales and repayments 10.2% 10.3% 11.3% 9.9% 10.5%
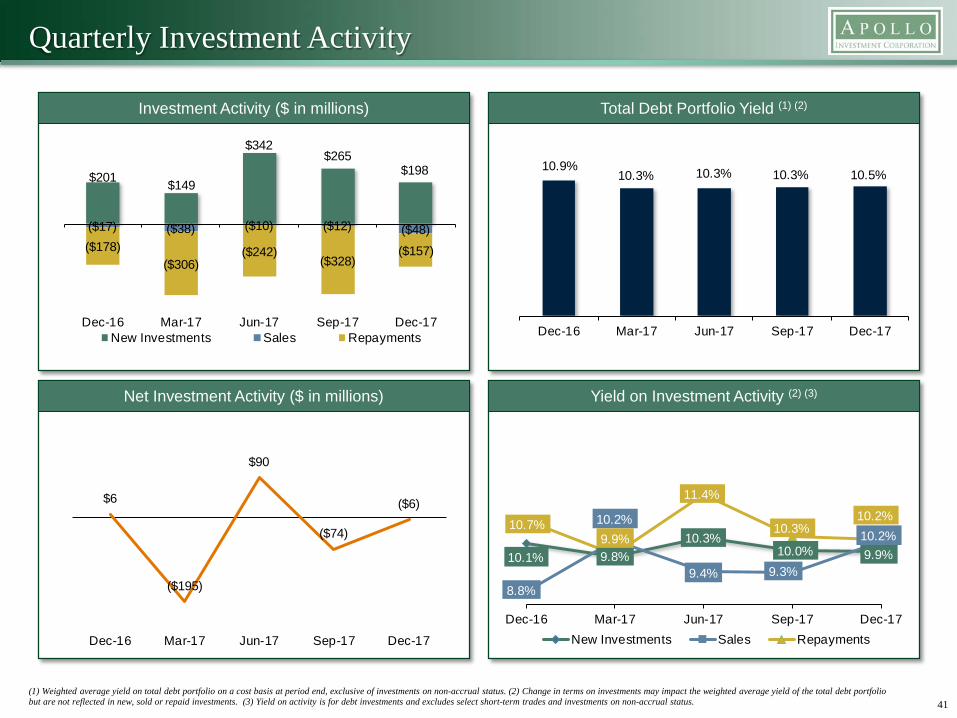
Quarterly Investment Activity
Total Debt Portfolio Yield (1) (2)
Net Investment Activity ($ in millions) Yield on Investment Activity (2) (3)
41(1) Weighted average yield on total debt portfolio on a cost basis at period end, exclusive of investments on non-accrual status. (2) Change in terms on investments may impact the weighted average yield of the total debt portfolio but are not reflected in new, sold or repaid investments. (3) Yield on activity is for debt investments and excludes select short-term trades and investments on non-accrual status.
Investment Activity ($ in millions)
$6
($195)
$90
($74)
($6)
Dec-16 Mar-17 Jun-17 Sep-17 Dec-17
10.1% 9.8%10.3%
10.0% 9.9%
8.8%
10.2%
9.4% 9.3%
10.2%10.7%
9.9%
11.4%
10.3%10.2%
Dec-16 Mar-17 Jun-17 Sep-17 Dec-17New Investments Sales Repayments
$201 $149
$342$265
$198
($17) ($38) ($10) ($12) ($48)($178)
($306)($242)
($328)($157)
Dec-16 Mar-17 Jun-17 Sep-17 Dec-17New Investments Sales Repayments
10.9%10.3% 10.3% 10.3% 10.5%
Dec-16 Mar-17 Jun-17 Sep-17 Dec-17
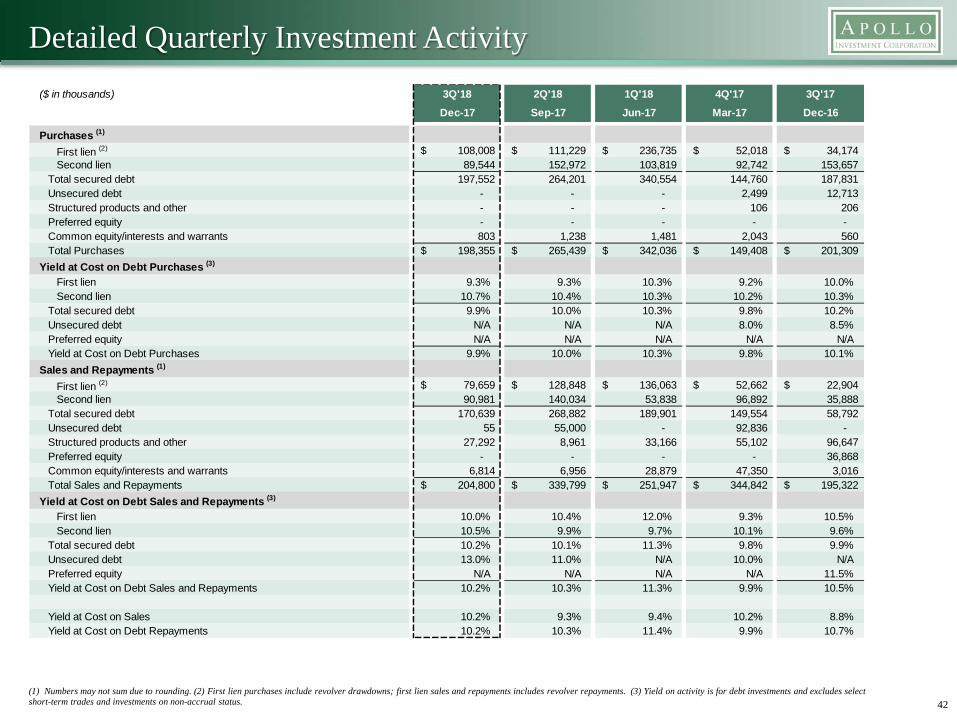
Detailed Quarterly Investment Activity
42(1) Numbers may not sum due to rounding. (2) First lien purchases include revolver drawdowns; first lien sales and repayments includes revolver repayments. (3) Yield on activity is for debt investments and excludes select short-term trades and investments on non-accrual status.
($ in thousands) 3Q'18 2Q'18 1Q'18 4Q'17 3Q'17Dec-17 Sep-17 Jun-17 Mar-17 Dec-16
Purchases (1)
First lien (2) 108,008$ 111,229$ 236,735$ 52,018$ 34,174$ Second lien 89,544 152,972 103,819 92,742 153,657
Total secured debt 197,552 264,201 340,554 144,760 187,831 Unsecured debt - - - 2,499 12,713 Structured products and other - - - 106 206 Preferred equity - - - - - Common equity/interests and warrants 803 1,238 1,481 2,043 560 Total Purchases 198,355$ 265,439$ 342,036$ 149,408$ 201,309$
Yield at Cost on Debt Purchases (3)
First lien 9.3% 9.3% 10.3% 9.2% 10.0%Second lien 10.7% 10.4% 10.3% 10.2% 10.3%
Total secured debt 9.9% 10.0% 10.3% 9.8% 10.2%Unsecured debt N/A N/A N/A 8.0% 8.5%Preferred equity N/A N/A N/A N/A N/AYield at Cost on Debt Purchases 9.9% 10.0% 10.3% 9.8% 10.1%
Sales and Repayments (1)
First lien (2) 79,659$ 128,848$ 136,063$ 52,662$ 22,904$ Second lien 90,981 140,034 53,838 96,892 35,888
Total secured debt 170,639 268,882 189,901 149,554 58,792 Unsecured debt 55 55,000 - 92,836 - Structured products and other 27,292 8,961 33,166 55,102 96,647 Preferred equity - - - - 36,868 Common equity/interests and warrants 6,814 6,956 28,879 47,350 3,016 Total Sales and Repayments 204,800$ 339,799$ 251,947$ 344,842$ 195,322$
Yield at Cost on Debt Sales and Repayments (3)
First lien 10.0% 10.4% 12.0% 9.3% 10.5%Second lien 10.5% 9.9% 9.7% 10.1% 9.6%
Total secured debt 10.2% 10.1% 11.3% 9.8% 9.9%Unsecured debt 13.0% 11.0% N/A 10.0% N/APreferred equity N/A N/A N/A N/A 11.5%Yield at Cost on Debt Sales and Repayments 10.2% 10.3% 11.3% 9.9% 10.5%
Yield at Cost on Sales 10.2% 9.3% 9.4% 10.2% 8.8%Yield at Cost on Debt Repayments 10.2% 10.3% 11.4% 9.9% 10.7%
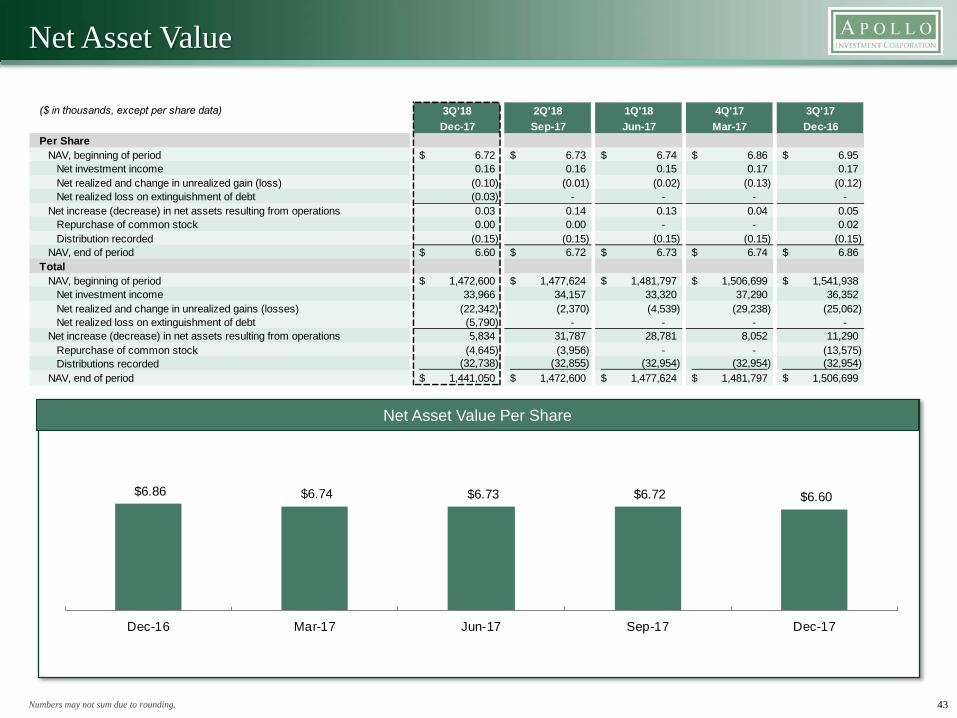
Net Asset Value
Net Asset Value Per Share
Numbers may not sum due to rounding. 43
$6.60 $6.72 $6.73 $6.74 $6.86
Dec-17Sep-17Jun-17Mar-17Dec-16
($ in thousands, except per share data) 3Q'18 2Q'18 1Q'18 4Q'17 3Q'17 Dec-17 Sep-17 Jun-17 Mar-17 Dec-16
Per ShareNAV, beginning of period 6.72$ 6.73$ 6.74$ 6.86$ 6.95$
Net investment income 0.16 0.16 0.15 0.17 0.17 Net realized and change in unrealized gain (loss) (0.10) (0.01) (0.02) (0.13) (0.12) Net realized loss on extinguishment of debt (0.03) - - - -
Net increase (decrease) in net assets resulting from operations 0.03 0.14 0.13 0.04 0.05 Repurchase of common stock 0.00 0.00 - - 0.02 Distribution recorded (0.15) (0.15) (0.15) (0.15) (0.15)
NAV, end of period 6.60$ 6.72$ 6.73$ 6.74$ 6.86$ Total
NAV, beginning of period 1,472,600$ 1,477,624$ 1,481,797$ 1,506,699$ 1,541,938$ Net investment income 33,966 34,157 33,320 37,290 36,352 Net realized and change in unrealized gains (losses) (22,342) (2,370) (4,539) (29,238) (25,062) Net realized loss on extinguishment of debt (5,790) - - - -
Net increase (decrease) in net assets resulting from operations 5,834 31,787 28,781 8,052 11,290 Repurchase of common stock (4,645) (3,956) - - (13,575) Distributions recorded (32,738) (32,855) (32,954) (32,954) (32,954)
NAV, end of period 1,441,050$ 1,472,600$ 1,477,624$ 1,481,797$ 1,506,699$
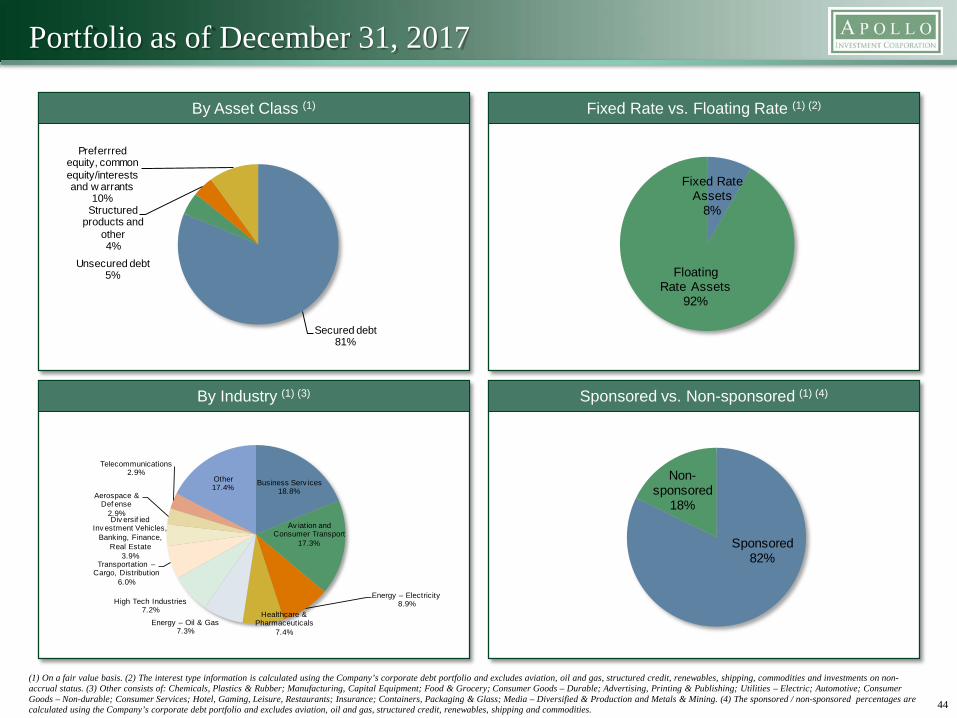
Portfolio as of December 31, 2017
Fixed Rate vs. Floating Rate (1) (2)
By Industry (1) (3) Sponsored vs. Non-sponsored (1) (4)
44
(1) On a fair value basis. (2) The interest type information is calculated using the Company’s corporate debt portfolio and excludes aviation, oil and gas, structured credit, renewables, shipping, commodities and investments on non-accrual status. (3) Other consists of: Chemicals, Plastics & Rubber; Manufacturing, Capital Equipment; Food & Grocery; Consumer Goods – Durable; Advertising, Printing & Publishing; Utilities – Electric; Automotive; Consumer Goods – Non-durable; Consumer Services; Hotel, Gaming, Leisure, Restaurants; Insurance; Containers, Packaging & Glass; Media – Diversified & Production and Metals & Mining. (4) The sponsored / non-sponsored percentages are calculated using the Company’s corporate debt portfolio and excludes aviation, oil and gas, structured credit, renewables, shipping and commodities.
By Asset Class (1)
Secured debt81%
Unsecured debt5%
Structured products and
other4%
Preferrred equity, common equity/interests and w arrants
10%Fixed Rate
Assets8%
Floating Rate Assets
92%
Business Serv ices18.8%
Av iation and Consumer Transport
17.3%
Energy – Electricity8.9%
Healthcare & Pharmaceuticals
7.4%Energy – Oil & Gas
7.3%
High Tech Industries7.2%
Transportation –Cargo, Distribution
6.0%
Div ersif ied Inv estment Vehicles,
Banking, Finance, Real Estate
3.9%
Aerospace & Def ense
2.9%
Telecommunications2.9%
Other17.4%
Sponsored82%
Non-sponsored
18%
Portfolio Composition
45
($ in thousands) 3Q'18 2Q'18 1Q'18 4Q'17 3Q'17Dec-17 Sep-17 Jun-17 Mar-17 Dec-16
Portfolio Composition, measured at fair value ($)First lien 1,169,317$ 1,142,148$ 1,140,215$ 1,049,232$ 1,052,890$ Second lien 743,299 750,710 734,946 685,268 683,858
Total secured debt 1,912,616$ 1,892,857$ 1,875,161$ 1,734,500$ 1,736,748$ Unsecured debt 107,678 107,558 162,028 161,385 249,121 Structured products and other 97,884 124,269 135,863 166,893 217,748 Preferred equity 25,690 25,780 25,754 25,637 30,785 Common equity/interests and warrants 208,694 209,826 217,772 228,293 291,930 Total investment portfolio 2,352,562$ 2,360,290$ 2,416,579$ 2,316,708$ 2,526,333$
Portfolio Composition, measured at fair value (%)First lien 50% 48% 47% 45% 42%Second lien 32% 32% 30% 30% 27%
Total secured debt 81% 80% 78% 75% 69%Unsecured debt 5% 5% 7% 7% 10%Structured products and other 4% 5% 6% 7% 9%Preferred equity 1% 1% 1% 1% 1%Common equity/interests and warrants 9% 9% 9% 10% 11%
Portfolio Composition by Strategy, measured at fair value (%)Core strategies (1) 74% 73% 74% 71% 66%Non-core strategies (2) 22% 23% 23% 24% 29%Legacy & Other 4% 4% 4% 5% 5%
Interest Rate Type, measured at fair value (3)
Fixed rate % 8% 9% 14% 16% 16%Floating rate % 92% 91% 86% 84% 84%
Sponsored / Non-sponsored, measured at fair value (4)
Sponsored % 82% 81% 83% 86% 86%Non-sponsored % 18% 19% 17% 14% 14%
(1) Core strategies include corporate lending, aviation, life sciences, asset based and lender finance. (2) Non-core strategies include oil & gas, structured credit, renewables, shipping and commodities. (3) The interest type information is calculated using the Company’s corporate debt portfolio and excludes aviation, oil and gas, structured credit, renewables, shipping, commodities and investments on non-accrual status. (4) The sponsored / non-sponsored percentages are calculated using the Company’s corporate debt portfolio and excludes aviation, oil and gas, structured credit, renewables, shipping and commodities.
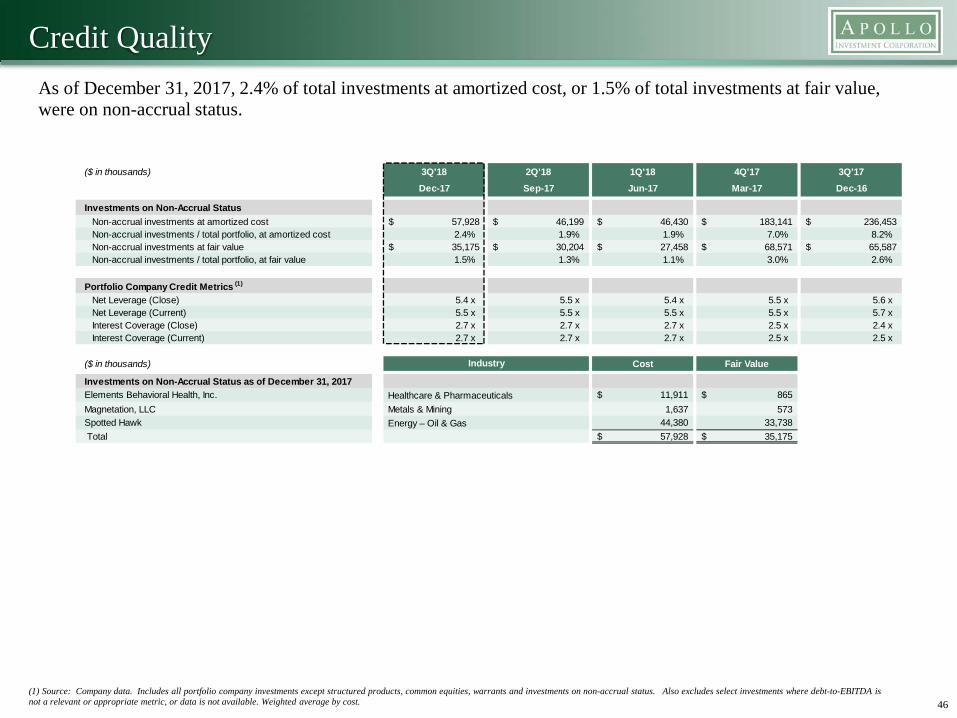
Credit QualityAs of December 31, 2017, 2.4% of total investments at amortized cost, or 1.5% of total investments at fair value, were on non-accrual status.
46(1) Source: Company data. Includes all portfolio company investments except structured products, common equities, warrants and investments on non-accrual status. Also excludes select investments where debt-to-EBITDA is not a relevant or appropriate metric, or data is not available. Weighted average by cost.
($ in thousands) 3Q'18 2Q'18 1Q'18 4Q'17 3Q'17Dec-17 Sep-17 Jun-17 Mar-17 Dec-16
Investments on Non-Accrual StatusNon-accrual investments at amortized cost 57,928$ 46,199$ 46,430$ 183,141$ 236,453$ Non-accrual investments / total portfolio, at amortized cost 2.4% 1.9% 1.9% 7.0% 8.2%Non-accrual investments at fair value 35,175$ 30,204$ 27,458$ 68,571$ 65,587$ Non-accrual investments / total portfolio, at fair value 1.5% 1.3% 1.1% 3.0% 2.6%
Portfolio Company Credit Metrics (1)
Net Leverage (Close) 5.4 x 5.5 x 5.4 x 5.5 x 5.6 xNet Leverage (Current) 5.5 x 5.5 x 5.5 x 5.5 x 5.7 xInterest Coverage (Close) 2.7 x 2.7 x 2.7 x 2.5 x 2.4 xInterest Coverage (Current) 2.7 x 2.7 x 2.7 x 2.5 x 2.5 x
($ in thousands) Cost Fair Value
Investments on Non-Accrual Status as of December 31, 2017Elements Behavioral Health, Inc. 11,911$ 865$
Magnetation, LLC 1,637 573 Spotted Hawk 44,380 33,738
Total 57,928$ 35,175$
Healthcare & Pharmaceuticals Metals & Mining
Industry
Energy – Oil & Gas
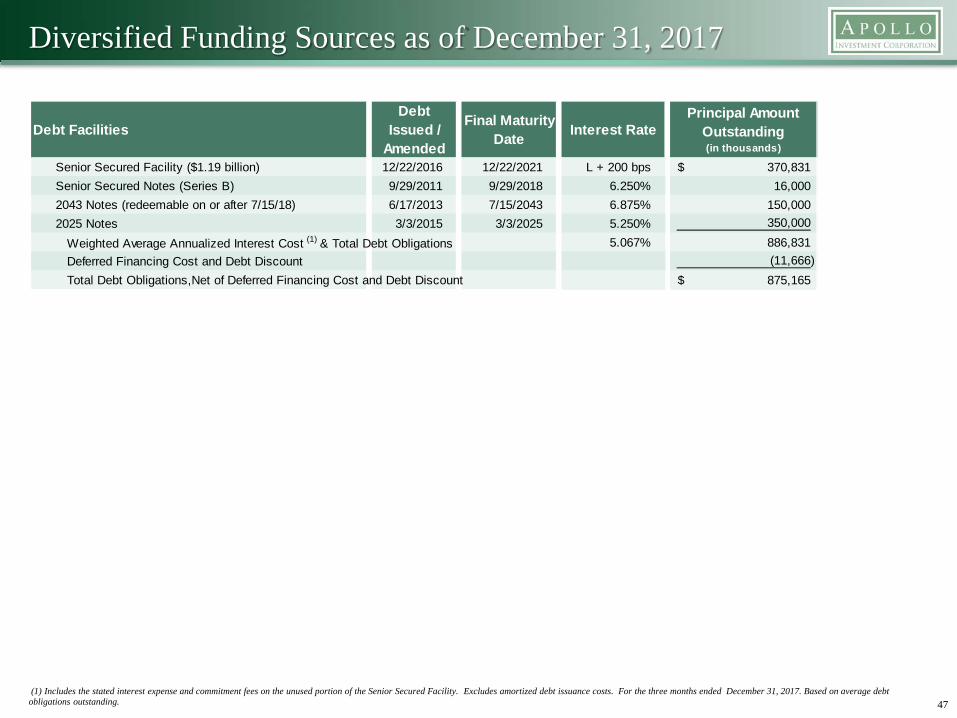
Diversified Funding Sources as of December 31, 2017
47(1) Includes the stated interest expense and commitment fees on the unused portion of the Senior Secured Facility. Excludes amortized debt issuance costs. For the three months ended December 31, 2017. Based on average debt
obligations outstanding.
Debt FacilitiesDebt
Issued / Amended
Final Maturity Date Interest Rate
Principal Amount Outstanding (in thousands)
Senior Secured Facility ($1.19 billion) 12/22/2016 12/22/2021 L + 200 bps 370,831$ Senior Secured Notes (Series B) 9/29/2011 9/29/2018 6.250% 16,000 2043 Notes (redeemable on or after 7/15/18) 6/17/2013 7/15/2043 6.875% 150,000 2025 Notes 3/3/2015 3/3/2025 5.250% 350,000
Weighted Average Annualized Interest Cost (1) & Total Debt Obligations 5.067% 886,831 Deferred Financing Cost and Debt Discount (11,666) Total Debt Obligations,Net of Deferred Financing Cost and Debt Discount 875,165$
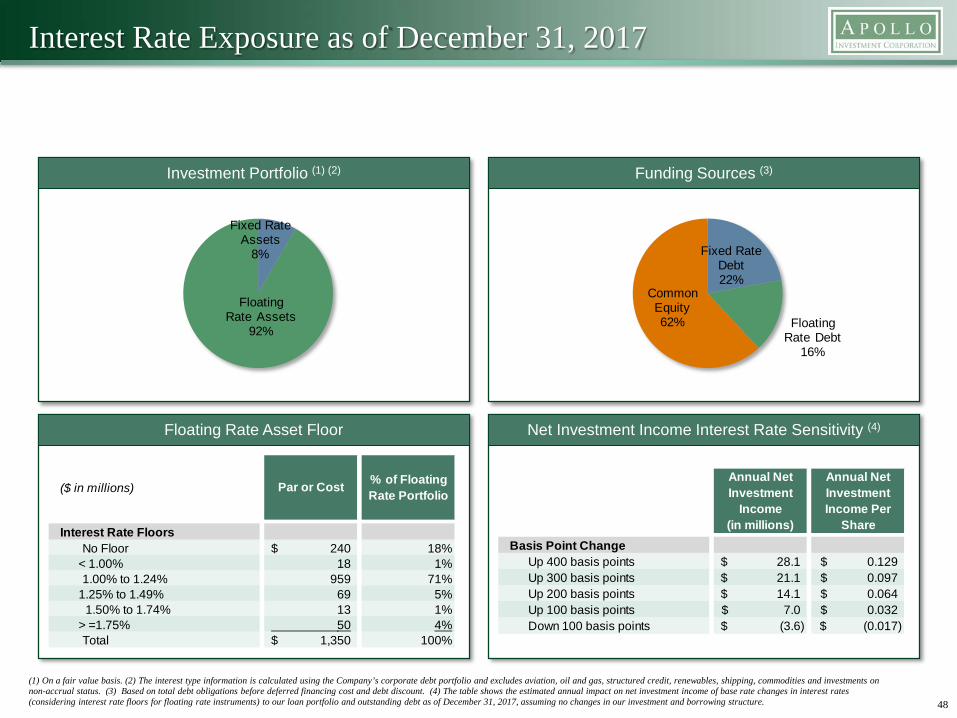
Interest Rate Exposure as of December 31, 2017
Funding Sources (3)
Floating Rate Asset Floor Net Investment Income Interest Rate Sensitivity (4)
48
(1) On a fair value basis. (2) The interest type information is calculated using the Company’s corporate debt portfolio and excludes aviation, oil and gas, structured credit, renewables, shipping, commodities and investments on non-accrual status. (3) Based on total debt obligations before deferred financing cost and debt discount. (4) The table shows the estimated annual impact on net investment income of base rate changes in interest rates (considering interest rate floors for floating rate instruments) to our loan portfolio and outstanding debt as of December 31, 2017, assuming no changes in our investment and borrowing structure.
Investment Portfolio (1) (2)
Fixed Rate Debt22%
Floating Rate Debt
16%
Common Equity62%
Fixed Rate Assets
8%
Floating Rate Assets
92%
($ in millions) Par or Cost % of Floating Rate Portfolio
Interest Rate FloorsNo Floor 240$ 18%
< 1.00% 18 1%1.00% to 1.24% 959 71%
1.25% to 1.49% 69 5% 1.50% to 1.74% 13 1%
> =1.75% 50 4%Total 1,350$ 100%
Annual Net Investment
Income (in millions)
Annual Net Investment Income Per
ShareBasis Point Change
Up 400 basis points 28.1$ 0.129$ Up 300 basis points 21.1$ 0.097$ Up 200 basis points 14.1$ 0.064$ Up 100 basis points 7.0$ 0.032$ Down 100 basis points (3.6)$ (0.017)$

Contact Information
For more information, please contact:
Elizabeth BesenInvestor Relations ManagerPhone: (212) 822-0625Email: [email protected]
Gregory W. HuntChief Financial Officer and TreasurerPhone: (212) 822-0655Email: [email protected]
49
50