api economic impacts marcellus shale
TRANSCRIPT
The Economic Impacts of the Marcellus Shale: Implications for New York, Pennsylvania, and West Virginia
A Report to The American Petroleum Institute
By
Timothy J. Considine, Ph.D. Natural Resource Economics, Inc.
2833 Dover Drive Laramie, WY 82072
Phone: (307) 460-3005 Cell: (307) 760-8400
Email: [email protected]
July 14, 2010
The author gratefully acknowledges comments and suggestions from Carl Carlson, Paul Dudenas, and Robert Watson. The findings and opinions expressed in this report are those of the author and do not necessarily reflect the views of the reviewers or the American Petroleum Institute.
ii
Executive Summary
Deep beneath the rolling hills and mountains of Appalachia from West Virginia in the south to upstate New York in the north lies a natural gas deposit known as the Marcellus Shale. After more than five years of hard work, gas producers are convinced that this field contains an enormous reserve of natural gas. Some studies estimate recoverable reserves in the Marcellus at over 489 trillion cubic feet (TCF), which would place the Marcellus second only to the South Pars field in Qatar and Iran. So within a couple hundred miles of the Washington-New York corridor with a significant population and demand for energy lays a super giant natural gas field of Middle East proportions.
Given this close location to consumers, the value of this reserve is immense, over two
trillion dollars at current natural gas prices, which are relatively low. As a result, investment is pouring into the Marcellus region. Development is now well underway in Pennsylvania and West Virginia. Promising Marcellus prospects also exist in upstate New York.
This study estimates the economic impacts of current and future Marcellus development
activity. Natural gas development stimulates the economy through business-to-business spending and via payments to land owners. Natural gas development involves exploration, drilling, building gas processing plants, and pipeline construction. Each of these activities requires goods and services from many sectors of the economy, including construction, truck transportation, iron and steel, and engineering construction services. Natural gas companies also pay lease and royalty payments to land owners, who in turn pay taxes and spend this income on goods and services. This study estimates these economic impacts using an input-output model developed by the Minnesota IMPLAN Group, Inc. Development of the Marcellus also produces additional domestic energy that improves environmental quality but without the need for public subsidies.
Our analysis estimates the economic impacts of Marcellus development activity during
2009. The study then develops Marcellus gas drilling and production forecasts and estimates the associated economic impacts for each of the three states mentioned above out to the year 2020. The Marcellus industry in West Virginia and Pennsylvania expanded considerably during 2009. Our analysis indicates that 1,121 wells were drilled in these two states during 2009. Output of dry natural gas and petroleum liquids increased to over 600 million cubic feet of gas equivalents during calendar year 2009. Total value added or contribution to gross regional product for these two states increased by $4.8 billion as a result of Marcellus production activities.1 This increase in value added is distributed across a broad swath of the economy, generating more than 57,357 jobs and $1.7 billion in local, state, and federal tax collections. The gains in value added are broad based, which dispels the notion that natural gas production contributes benefits to only a select few sectors or individuals.
Future Marcellus shale gas development depends upon the vicissitudes of economics,
geology, and politics. Several sources of uncertainty affect the outlook for Marcellus drilling and production. Tax and regulatory policies at local, state, and federal levels have an important bearing on the costs and returns from drilling. New York currently has a de facto moratorium on horizontal drilling. Politicians in Pennsylvania are debating the relative merits of a severance tax on Marcellus gas production. The outcome of these policy debates is unknown. Likewise, the regulatory and tax environment continues to be a challenge for Marcellus producers in West Virginia. Economic uncertainties also prevail as natural gas producers continuously reassess the
1 Gross regional product is valued added or the regional version of gross domestic product (gdp).
iii
rates of return from drilling in the Marcellus relative to other shale gas plays. No doubt the outcomes of the aforementioned policy debates will also affect these economic evaluations. In addition to the costs of drilling, economic returns are also affected by the amount of natural gas in place, which varies significantly within the Marcellus region.
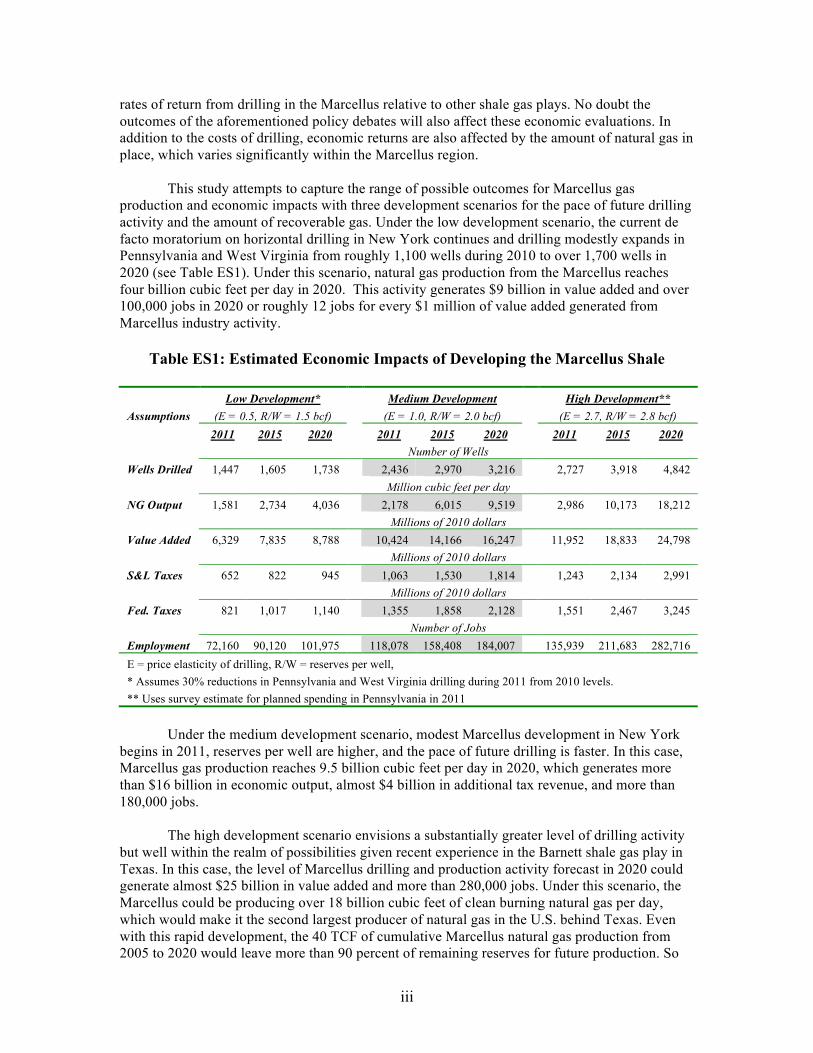
This study attempts to capture the range of possible outcomes for Marcellus gas production and economic impacts with three development scenarios for the pace of future drilling activity and the amount of recoverable gas. Under the low development scenario, the current de facto moratorium on horizontal drilling in New York continues and drilling modestly expands in Pennsylvania and West Virginia from roughly 1,100 wells during 2010 to over 1,700 wells in 2020 (see Table ES1). Under this scenario, natural gas production from the Marcellus reaches four billion cubic feet per day in 2020. This activity generates $9 billion in value added and over 100,000 jobs in 2020 or roughly 12 jobs for every $1 million of value added generated from Marcellus industry activity.
Table ES1: Estimated Economic Impacts of Developing the Marcellus Shale
Low Development* Medium Development High Development** Assumptions (E = 0.5, R/W = 1.5 bcf) (E = 1.0, R/W = 2.0 bcf) (E = 2.7, R/W = 2.8 bcf) 2011 2015 2020 2011 2015 2020 2011 2015 2020 Number of Wells Wells Drilled 1,447 1,605 1,738 2,436 2,970 3,216 2,727 3,918 4,842 Million cubic feet per day NG Output 1,581 2,734 4,036 2,178 6,015 9,519 2,986 10,173 18,212 Millions of 2010 dollars Value Added 6,329 7,835 8,788 10,424 14,166 16,247 11,952 18,833 24,798 Millions of 2010 dollars S&L Taxes 652 822 945 1,063 1,530 1,814 1,243 2,134 2,991 Millions of 2010 dollars Fed. Taxes 821 1,017 1,140 1,355 1,858 2,128 1,551 2,467 3,245 Number of Jobs Employment 72,160 90,120 101,975 118,078 158,408 184,007 135,939 211,683 282,716 E = price elasticity of drilling, R/W = reserves per well, * Assumes 30% reductions in Pennsylvania and West Virginia drilling during 2011 from 2010 levels. ** Uses survey estimate for planned spending in Pennsylvania in 2011
Under the medium development scenario, modest Marcellus development in New York
begins in 2011, reserves per well are higher, and the pace of future drilling is faster. In this case, Marcellus gas production reaches 9.5 billion cubic feet per day in 2020, which generates more than $16 billion in economic output, almost $4 billion in additional tax revenue, and more than 180,000 jobs.
The high development scenario envisions a substantially greater level of drilling activity
but well within the realm of possibilities given recent experience in the Barnett shale gas play in Texas. In this case, the level of Marcellus drilling and production activity forecast in 2020 could generate almost $25 billion in value added and more than 280,000 jobs. Under this scenario, the Marcellus could be producing over 18 billion cubic feet of clean burning natural gas per day, which would make it the second largest producer of natural gas in the U.S. behind Texas. Even with this rapid development, the 40 TCF of cumulative Marcellus natural gas production from 2005 to 2020 would leave more than 90 percent of remaining reserves for future production. So
iv
the Marcellus resource will last generations. Increasing domestic energy production and employment without subsidies comes at an opportune time when our nation faces record budget deficits and many states are struggling with fiscal solvency.
These benefits depend upon the Marcellus maintaining its relative competitive position.
There are at least four other major shale gas plays competing with the Marcellus, including the Barnett, Haynesville, Fayetteville, and Eagle Ford formations. Expanding supply from these fields will lower prices for natural gas and increase pressure for cost containment.
The pace of Marcellus development across the region varies considerably by state. Prior
to 2008, West Virginia led in Marcellus development. Since then Pennsylvania has emerged as the leader in development. There is currently no Marcellus activity in New York due to a de facto moratorium on hydro fracturing. This study finds that these restrictive policies could cost New Yorkers between $11 and $15 billion in lost economic output and between $1.4 and $2 billion in lost state tax revenues just between 2011 and 2020.
Higher gas development costs in the Marcellus due to regulations, climate conditions,
topography, labor markets, and other structural factors are partially offset by the absence of severance taxes in Pennsylvania and New York. Currently Marcellus drilling is soaring in Pennsylvania and falling in West Virginia. While other factors may account for this stark difference, the absence of a severance tax in Pennsylvania may account for a significant share of this difference. The imposition of any significant severance tax on Marcellus natural gas output could induce a redirection of investment flows to other shale plays or other profitable investments. Any revenues gained from a severance tax could be limited by losses in sales and income tax receipts resulting from lower drilling activity and natural gas production as producers shift their capital spending to other plays.
Policy makers need to keep in mind the unique features of unconventional gas production. Simply put, maintaining production growth is like running on a treadmill, slowdown drilling and production quickly slips back. Societal welfare is improved with policies that encourage the growth of the industry, the economy, and ultimately the tax base.
There are additional economic impacts from Marcellus development not measured in this report. The availability of natural gas could attract gas intensive manufacturing industries to expand capacity in the Middle Atlantic and Northeast regions. Similarly, abundant supplies of natural gas would enable electricity producers to cost effectively reduce greenhouse gas emissions because natural gas has considerably less carbon content than coal and oil. New industrial development spurred by the availability of abundant natural gas and electricity would generate additional gains in employment, output, and tax revenues.
v
Table of Contents List of Tables ...................................................................................................................................vi
List of Figures..................................................................................................................................vi
I. Introduction.............................................................................................................................1
II. The Nature of the Marcellus Shale Play .................................................................................2
III. The Marcellus and National Energy Markets .........................................................................7
IV. Recent Marcellus Industry Activity......................................................................................12
V. Economic Impacts of the Marcellus during 2009.................................................................16 Pennsylvania ..................................................................................................................19 West Virginia .................................................................................................................23 Summing-Up: The Regional Impacts of the Marcellus during 2009.............................26
VI. Future Development Prospects .............................................................................................26 A Development Scenario for New York ........................................................................26 Marcellus Prospects out to 2020 ....................................................................................30
VII. Concluding Comments .........................................................................................................36
References ......................................................................................................................................38
vi
List of Tables
Table ES1: Estimated Economic Impacts of Developing the Marcellus Shale ........................................... iii Table 1: Total Marcellus Spending in millions of current dollars, 2008-2009 ...................................... 16 Table 2: Estimated Impacts on Gross Output in Pennsylvania by Sector during 2009 ......................... 19 Table 3: Estimated Impacts on Value Added in Pennsylvania by Sector during 2009.......................... 20 Table 4: Estimated Employment Impacts in Pennsylvania during 2009 ............................................... 21 Table 5: Estimated Tax Impacts in Pennsylvania during 2009 .............................................................. 22 Table 6: Estimated Impacts on Gross Output in West Virginia by Sector in 2009................................ 23 Table 7: Estimated Impacts on Value Added in West Virginia by Sector in 2009................................ 24 Table 8: Estimated Employment Impacts in West Virginia in 2009...................................................... 24 Table 9: Estimated Tax Impacts in West Virginia in 2009 .................................................................... 25 Table 10: Potential Marcellus Activity in New York, 2011-2020 ........................................................... 28 Table 11: Potential Impacts on Value Added in New York by Sector during 2015 ................................ 29 Table 12: Potential Employment Impacts in New York during 2015...................................................... 29 Table 13: Potential Tax Impacts in New York in 2015............................................................................ 30 Table 14: Estimated Future Economic Impacts under Three Development Scenarios............................ 34 Table 15: Estimated Multiregional Impacts under Medium Development Scenario ............................... 36
List of Figures
Figure 1: Natural Gas Shale Plays in the United States ............................................................................ 3 Figure 2: Depth of the Marcellus Shale..................................................................................................... 4 Figure 3: Thickness of the Marcellus Shale .............................................................................................. 5 Figure 4: Typical Marcellus Production Decline Curve for a Horizontal Well ........................................ 6 Figure 5: Real Natural Gas and Oil Prices in million BTUs, 1994-2010 .................................................. 8 Figure 6: Composition of U.S. Natural Gas Consumption, 2001-2009 .................................................... 9 Figure 7: Regional U.S. Natural Gas Production, 2001-2009 ................................................................. 10 Figure 8: Current and Potential Markets for Marcellus Gas, 2008 ......................................................... 11 Figure 9: Comparison of City Gate Gas Prices, U.S. versus Pennsylvania............................................. 12 Figure 10: Marcellus Gas Drilling Pennsylvania and West Virginia, 2005-2009..................................... 13 Figure 11: Marcellus Gas Drilling during 2008 ........................................................................................ 14 Figure 12: Marcellus Gas Drilling during 2009 ........................................................................................ 14 Figure 13: Marcellus Gas Production Pennsylvania and West Virginia, 2007-2009 ................................ 15 Figure 14: Natural Gas Development Activities and Local Beneficiaries ................................................ 17 Figure 15: Northern Pennsylvania Marcellus Drilling and New York State............................................. 27 Figure 16: Medium Development Forecast for Marcellus Natural Gas Drilling....................................... 32 Figure 17: Medium Development Forecast for Marcellus Natural Gas Production.................................. 32 Figure 18: Marcellus Reserves and Cumulative Production under High Development Scenario............. 35
I. Introduction
Deep beneath the rolling hills and mountains of Appalachia from West Virginia in the south, through central Pennsylvania into upstate New York lies a layer of shale rock known as the Marcellus. This geological formation was known for decades to contain significant amounts of natural gas but the recoverable gas was never considered economic. Technological progress, however, can transform uneconomic resources into marketable assets. This principle of mineral economics is once again demonstrated as innovations in natural gas exploration and drilling have greatly enhanced the profitability of producing natural gas from shale resources.
Development of the Marcellus Shale is now well underway in Pennsylvania and West Virginia. Promising Marcellus prospects also exist in upstate New York, and western Maryland and Virginia. Investment is now pouring into the region. One reason for this growing interest is the belief that the Marcellus reserve base is so large. While estimated resource reserves entails a great deal of uncertainty, Engelder (2009) believes that there is a very large amount of natural gas embedded in this shale and even with assumptions on recovery rates that are relatively low, the recoverable reserves could be as large as 489 trillion cubic feet, which would make the Marcellus the second largest gas field in the world behind the super-giant South Pars field in Qatar and Iran. At current gas prices, which are relatively low, the value of recoverable reserves in the Marcellus is roughly two trillion dollars. The development of the Marcellus Shale will play an important role in our nation’s energy future. Natural gas is widely viewed as a critical fuel while facilitating the expanded use of nuclear, solar, wind, and biomass resources. Natural gas also could play a pivotal role in reducing greenhouse gas (GHG) emissions. Natural gas has roughly 60 and 30 percent lower carbon emissions than coal and oil respectively. Many states have enacted renewable energy portfolio standards. Given the intermittent nature of wind and solar energy electricity generation, back-up reserves would be required to balance system load. Natural gas is the most likely fuel to service these requirements. Moreover, natural gas could be used in coal-fired power plants to reduce carbon dioxide emissions. The development of the Marcellus Shale will have significant economic impacts for the economy of Marcellus region. Leasing, exploring, drilling, and developing these natural gas reserves will directly generate thousands of high-paying jobs and indirectly create many others as employment is stimulated in support industries and as workers spend these wages and households spend royalty income. The economic stimulus from natural gas development and production will increase gross regional product, income, and tax receipts. Longer term, the analysis below suggests that the Marcellus could become a significant net exporter of natural gas to surrounding states and eastern Canada, which would provide additional economic stimulus by keeping money once spent on imported fuels within the region. Natural gas development, however, is a very competitive business prone to sharp contractions in drilling activity from adverse swings in costs, prices and taxes. As a result, many states have adopted policies that promote development. As the Marcellus
Marcellus Prospects – Page 2
shale industry develops, policy makers should keep in mind the trade-offs between any gains from taxation with the long-term effects on industry development. A larger industry in the long run will be a far greater generator of government tax revenues than an industry stunted by high taxes or excessive regulations. The next section of this report provides a brief introduction to the Marcellus natural gas play, discussing the history of the development, experience from other shale gas regions, and a geographical overview of the extent of the formation. Section three of the report discusses the strategic significance of the Marcellus shale play, its potential contribution to eastern energy markets, and the potential market for Marcellus gas that will affect the value of Marcellus gas and the pace of its future development. The fourth section describes current Marcellus drilling and production activities and spending levels in Pennsylvania and West Virginia. Section five presents the estimates of the economic impacts of the Marcellus on the economies of these two states, including effects on gross output, value added, employment, and tax revenues. Section six includes projections of Marcellus industry activity from 2010 to 2020 under three alternative development scenarios and their associated economic impacts. The report concludes with a summary of our major findings, and a discussion of policies that affect the long-term health and vitality of the industry.
II. The Nature of the Marcellus Shale Play
The Marcellus Shale is an unconventional gas resource. These resources include reservoirs that have low permeability, requiring some form of stimulation to achieve commercial production. Sandstone, coal-bed methane, and shale deposits are the three major categories of unconventional gas reserves. Collectively unconventional gas resources are enormous. The National Petroleum Council (2007) estimates that world reserves of unconventional gas are 32,560 trillion cubic feet. With world consumption of natural gas at 105 TCF during 2008, these resources could last over three centuries. The expansion of shale gas development over the last two years will lead to yet another upward revision of these potential resources. The key to developing these resources is technology.
The rate of technological progress supporting unconventional gas production has been remarkable. Technological advancements in seismology, drilling, and well stimulation have transformed these resources into economic reserves that support actual production. Multi-dimensional seismology allows much more accurate views of potential gas deposits. Advances in drilling technology also has been remarkable, enabling producers to drill vertically several thousand feet and then turn 90 degrees and drill horizontally, dramatically expanding the amount of shale rock exposed for extraction. Well stimulation techniques, such as hydro fracturing have been another key and evolving development. This half-century-old process injects water solutions with small particles, usually sand, under high pressure, which cracks the rock and greatly increases the amount of gas that can be extracted.
Since the early 1990s, the application of these technologies has steadily improved
and continues to reach new levels of sophistication. The best example of this success is
Economic Impacts – Page 3
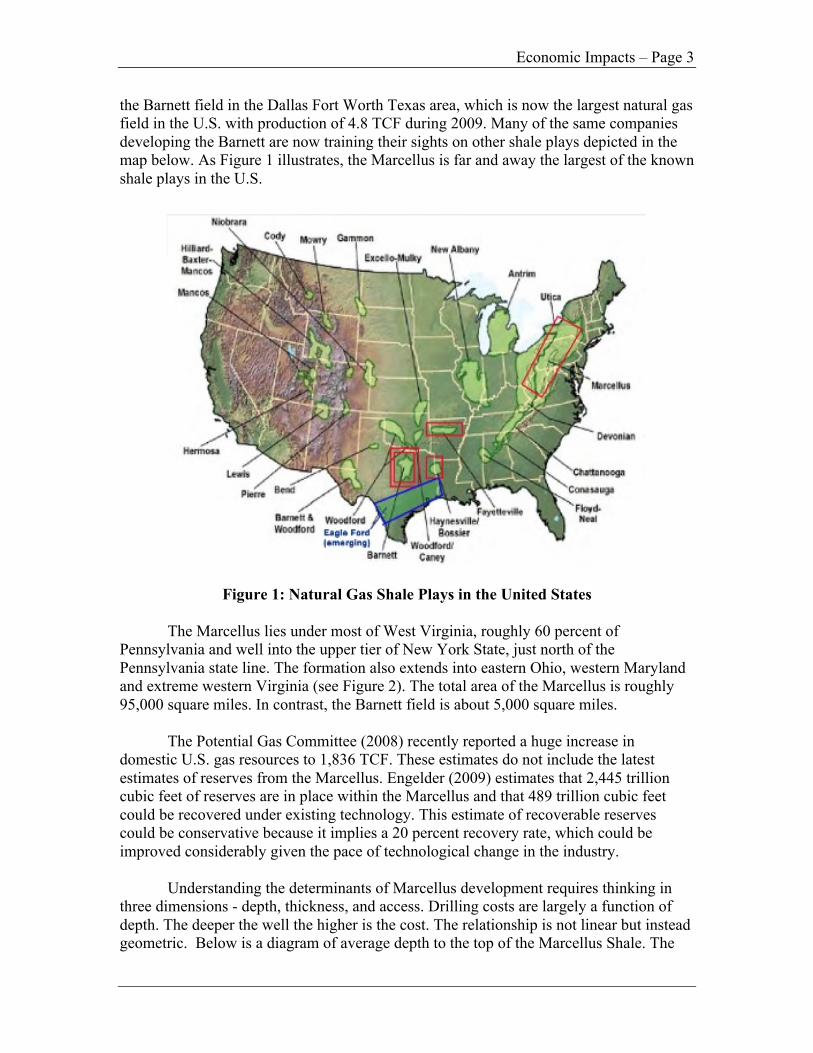
the Barnett field in the Dallas Fort Worth Texas area, which is now the largest natural gas field in the U.S. with production of 4.8 TCF during 2009. Many of the same companies developing the Barnett are now training their sights on other shale plays depicted in the map below. As Figure 1 illustrates, the Marcellus is far and away the largest of the known shale plays in the U.S.
Figure 1: Natural Gas Shale Plays in the United States
The Marcellus lies under most of West Virginia, roughly 60 percent of Pennsylvania and well into the upper tier of New York State, just north of the Pennsylvania state line. The formation also extends into eastern Ohio, western Maryland and extreme western Virginia (see Figure 2). The total area of the Marcellus is roughly 95,000 square miles. In contrast, the Barnett field is about 5,000 square miles.
The Potential Gas Committee (2008) recently reported a huge increase in domestic U.S. gas resources to 1,836 TCF. These estimates do not include the latest estimates of reserves from the Marcellus. Engelder (2009) estimates that 2,445 trillion cubic feet of reserves are in place within the Marcellus and that 489 trillion cubic feet could be recovered under existing technology. This estimate of recoverable reserves could be conservative because it implies a 20 percent recovery rate, which could be improved considerably given the pace of technological change in the industry.
Understanding the determinants of Marcellus development requires thinking in
three dimensions - depth, thickness, and access. Drilling costs are largely a function of depth. The deeper the well the higher is the cost. The relationship is not linear but instead geometric. Below is a diagram of average depth to the top of the Marcellus Shale. The
Marcellus Prospects – Page 4
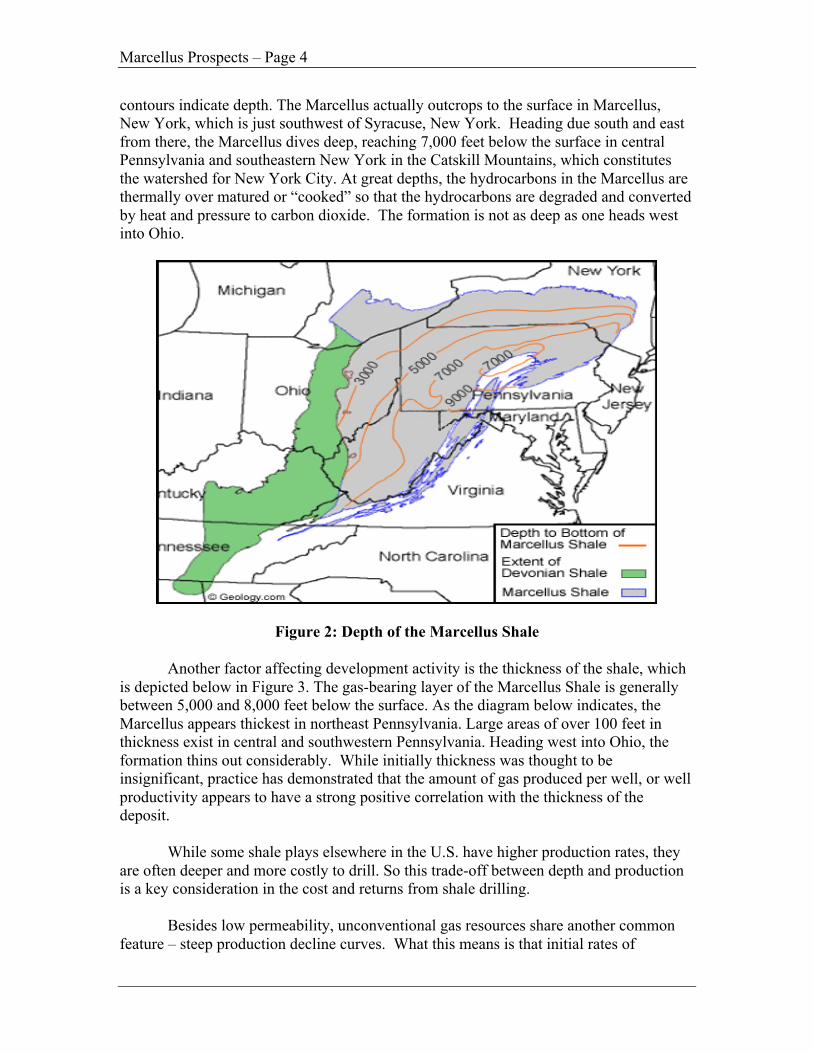
contours indicate depth. The Marcellus actually outcrops to the surface in Marcellus, New York, which is just southwest of Syracuse, New York. Heading due south and east from there, the Marcellus dives deep, reaching 7,000 feet below the surface in central Pennsylvania and southeastern New York in the Catskill Mountains, which constitutes the watershed for New York City. At great depths, the hydrocarbons in the Marcellus are thermally over matured or “cooked” so that the hydrocarbons are degraded and converted by heat and pressure to carbon dioxide. The formation is not as deep as one heads west into Ohio.
Figure 2: Depth of the Marcellus Shale
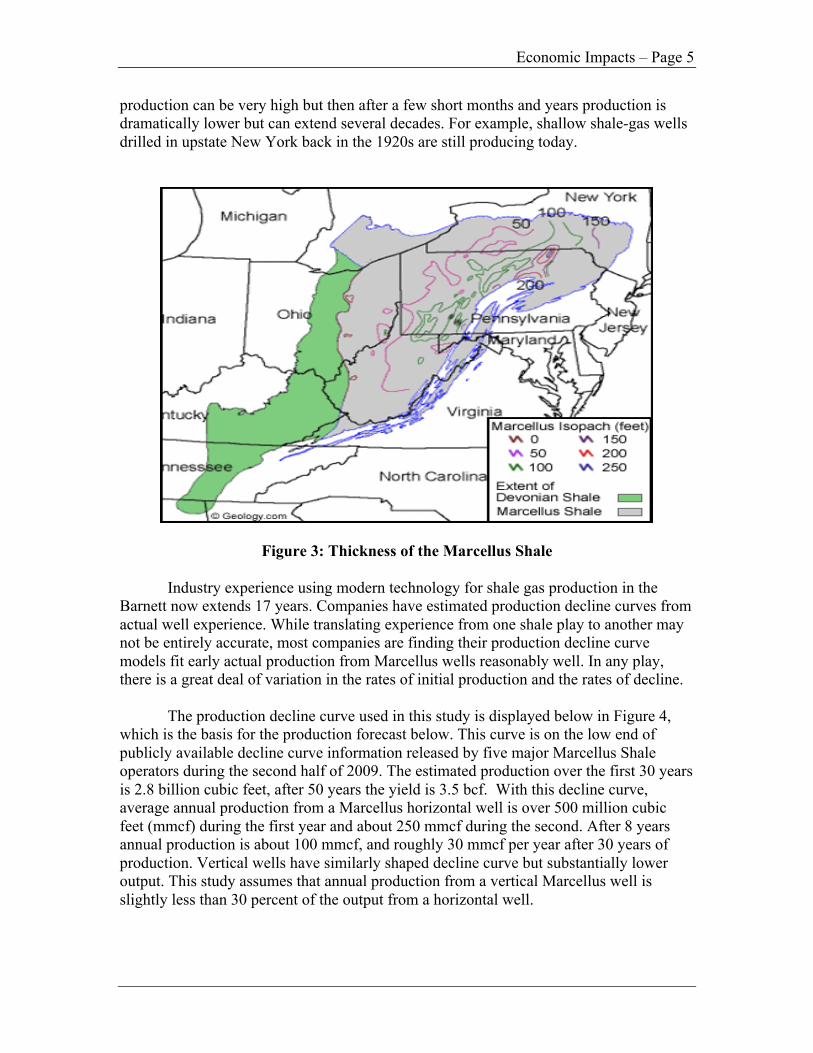
Another factor affecting development activity is the thickness of the shale, which is depicted below in Figure 3. The gas-bearing layer of the Marcellus Shale is generally between 5,000 and 8,000 feet below the surface. As the diagram below indicates, the Marcellus appears thickest in northeast Pennsylvania. Large areas of over 100 feet in thickness exist in central and southwestern Pennsylvania. Heading west into Ohio, the formation thins out considerably. While initially thickness was thought to be insignificant, practice has demonstrated that the amount of gas produced per well, or well productivity appears to have a strong positive correlation with the thickness of the deposit.
While some shale plays elsewhere in the U.S. have higher production rates, they are often deeper and more costly to drill. So this trade-off between depth and production is a key consideration in the cost and returns from shale drilling.
Besides low permeability, unconventional gas resources share another common
feature – steep production decline curves. What this means is that initial rates of
Economic Impacts – Page 5
production can be very high but then after a few short months and years production is dramatically lower but can extend several decades. For example, shallow shale-gas wells drilled in upstate New York back in the 1920s are still producing today.
Figure 3: Thickness of the Marcellus Shale
Industry experience using modern technology for shale gas production in the Barnett now extends 17 years. Companies have estimated production decline curves from actual well experience. While translating experience from one shale play to another may not be entirely accurate, most companies are finding their production decline curve models fit early actual production from Marcellus wells reasonably well. In any play, there is a great deal of variation in the rates of initial production and the rates of decline.
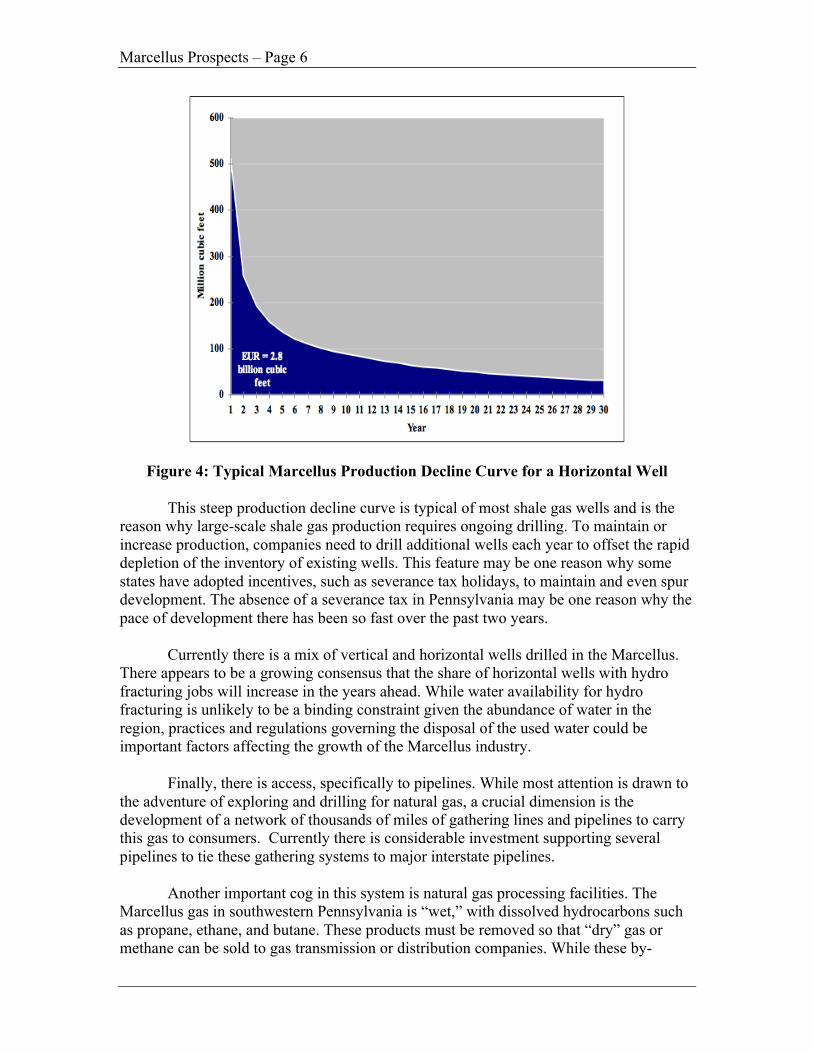
The production decline curve used in this study is displayed below in Figure 4,
which is the basis for the production forecast below. This curve is on the low end of publicly available decline curve information released by five major Marcellus Shale operators during the second half of 2009. The estimated production over the first 30 years is 2.8 billion cubic feet, after 50 years the yield is 3.5 bcf. With this decline curve, average annual production from a Marcellus horizontal well is over 500 million cubic feet (mmcf) during the first year and about 250 mmcf during the second. After 8 years annual production is about 100 mmcf, and roughly 30 mmcf per year after 30 years of production. Vertical wells have similarly shaped decline curve but substantially lower output. This study assumes that annual production from a vertical Marcellus well is slightly less than 30 percent of the output from a horizontal well.
Marcellus Prospects – Page 6
Figure 4: Typical Marcellus Production Decline Curve for a Horizontal Well
This steep production decline curve is typical of most shale gas wells and is the reason why large-scale shale gas production requires ongoing drilling. To maintain or increase production, companies need to drill additional wells each year to offset the rapid depletion of the inventory of existing wells. This feature may be one reason why some states have adopted incentives, such as severance tax holidays, to maintain and even spur development. The absence of a severance tax in Pennsylvania may be one reason why the pace of development there has been so fast over the past two years.
Currently there is a mix of vertical and horizontal wells drilled in the Marcellus.
There appears to be a growing consensus that the share of horizontal wells with hydro fracturing jobs will increase in the years ahead. While water availability for hydro fracturing is unlikely to be a binding constraint given the abundance of water in the region, practices and regulations governing the disposal of the used water could be important factors affecting the growth of the Marcellus industry.
Finally, there is access, specifically to pipelines. While most attention is drawn to
the adventure of exploring and drilling for natural gas, a crucial dimension is the development of a network of thousands of miles of gathering lines and pipelines to carry this gas to consumers. Currently there is considerable investment supporting several pipelines to tie these gathering systems to major interstate pipelines.
Another important cog in this system is natural gas processing facilities. The
Marcellus gas in southwestern Pennsylvania is “wet,” with dissolved hydrocarbons such as propane, ethane, and butane. These products must be removed so that “dry” gas or methane can be sold to gas transmission or distribution companies. While these by-
Economic Impacts – Page 7
products of dry gas production can be quite valuable, building a processing facility takes considerable time and incurs significant capital costs. Moreover, large volume production of these natural gas liquids, which appears likely, would require separate pipelines, rail facilities, or truck terminal facilities. These natural gas liquids are priced at a premium relative to dry natural gas and are another source of value. Developing these transportation and processing networks also takes time, in some cases, years.
While many citizens may view natural gas as yet another extractive industry that
employs only roughnecks and drillers, the construction of supporting infrastructure is a very significant undertaking that requires thousands of suppliers of steel, machines, and equipment. Moreover, land payments in the form of lease and bonus payments and eventually royalties are a broad stimulus to local communities by stimulating the demand for a broad range of goods and services. These suppliers would have to ramp-up to meet this new demand by hiring thousands of workers, often in relatively high paying manufacturing and construction jobs.
III. The Marcellus and National Energy Markets
The Marcellus Shale will likely play a significant role in the future as the U.S. economy seeks to expand domestic energy resources and attempts to reduce greenhouse gas emissions. The projections below envision a very significant expansion in Marcellus production in the years ahead. Historically, unconventional gas, such as shale gas, was considered a high cost source of supply. The technological changes discussed above along with large reserves, however, have contributed to falling average extraction costs for these resources.
It is very difficult to empirically estimate average and marginal extraction costs
for the Marcellus industry when the companies have negative cash flow during the early phase of development as wells gradually get connected to pipeline systems and produce marketable gas. Nevertheless, discounted cash flow analyses of individual Marcellus wells suggest strong rates of return given drilling and gatherings costs and, of course, market price, which is a key factor affecting the development of the Marcellus. Since natural gas prices are volatile, gas drillers may lock in a price with a futures contract.
Prices for immediate and future delivery are a function of market conditions for
natural gas. Among other factors, oil prices affect gas supply and demand. A substantial share of gas production is in association with oil production. In other words, they are co-products. As the price of oil goes up, companies drill for more oil, find it, pump it and along the way produce natural gas as the oil is extracted from the well. On the demand side crude oil prices affect the prices of refined petroleum by-products, such as propane and ethane that directly compete with natural gas as an input in petrochemical production. As oil prices increase, petrochemical producers shift their mix of inputs away from propane to natural gas. Both of these channels tend to generate a positive relationship between prices for crude oil and natural gas. On the other hand, natural gas also competes with coal, nuclear, and renewable energy in the power generation market. Interfuel competition from this area tends to confound the relationship between crude oil and natural gas prices.
Marcellus Prospects – Page 8
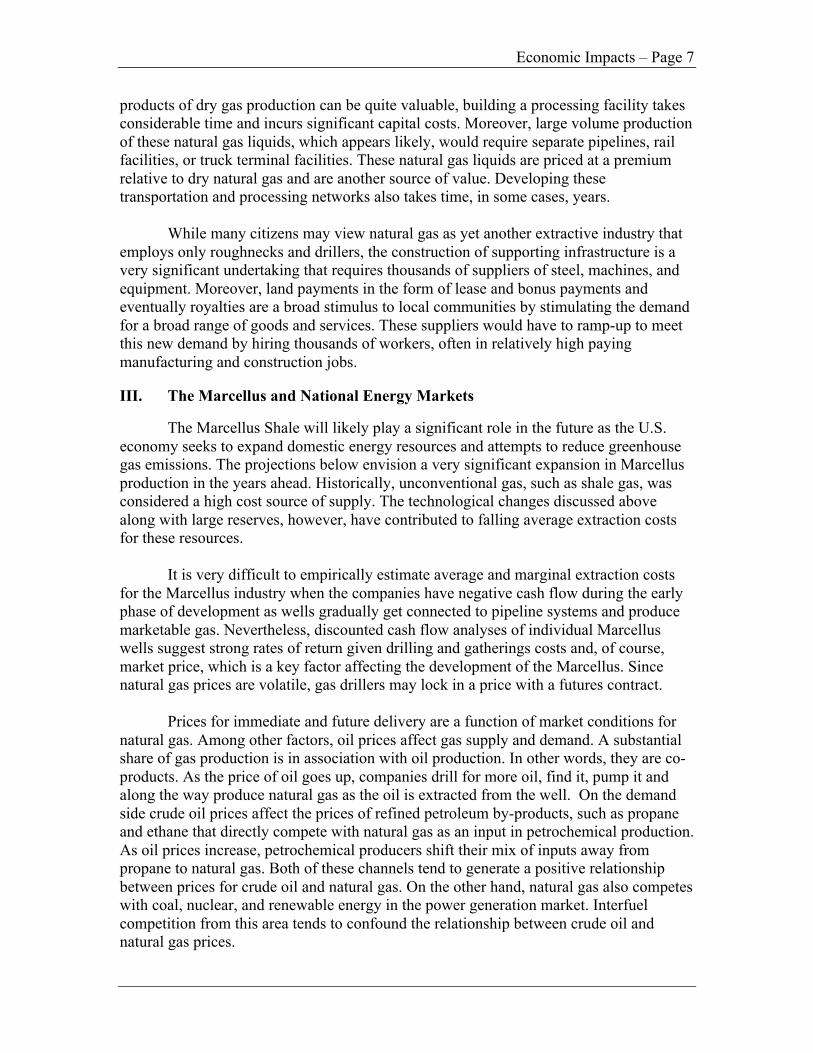
Nevertheless, historically natural gas prices do track oil prices but with some
notable departures and only rarely achieving parity with oil prices. Over the long term, natural gas prices have generally been below oil prices measured in heat equivalent units, known as British Thermal Units (BTUs). For example, over the sixty years period from 1922 to 1992, the year when natural gas markets were largely deregulated, oil prices averaged three times the price of natural gas. This ratio dropped to 1.5 from 1994 to 2008.
The relationship between natural gas and oil prices from 1994 through April 2010 is displayed in Figure 5. During the 1990s real natural gas prices averaged about $3 per million BTUs (MMBTU). Since then natural gas prices averaged more than $6.88 per MMBTU. Notice that the trend in oil prices was upward until the summer of 2008. After a sharp downward adjustment during the winter of 2008-2009, oil prices recovered during the rest of 2009 into 2010.
Figure 5: Real Natural Gas and Oil Prices in million BTUs, 1994-2010
Real natural gas prices, however, have not yet recovered and in early 2010 were at levels last seen during 2002. One temporary factor is the sharp reduction in industrial gas consumption due to the recession. This pattern has been repeated in the past. Oil prices during 2006 and 2007 generally tracked upward and natural gas prices finally spiked during the summer of 2008 with the historic rise in oil prices. Nevertheless, apart from the oil price shock during the summer of 2008, natural gas prices have been drifting
Economic Impacts – Page 9
lower since 2005. The opening of unconventional shale gas resources is a contributing factor to this trend toward declining real natural gas prices.
Such a divergence between oil and natural gas prices has occurred in the past.
Moreover, there are several factors contributing to a tenuous relationship. During the 1960s through 1980s natural gas competed with residual fuel in the boiler fuel and petrochemical markets. Residual fuel oil use in power generation is substantially lower today. Instead, natural gas competes with coal-fired electric power generation in many regions of the country. Another emerging competitor with natural gas is wind power. During 2008, wind captured 42 percent of new power generation capacity added in the U.S., likely due to generous federal subsidies and state mandates for renewable energy in electricity generation.
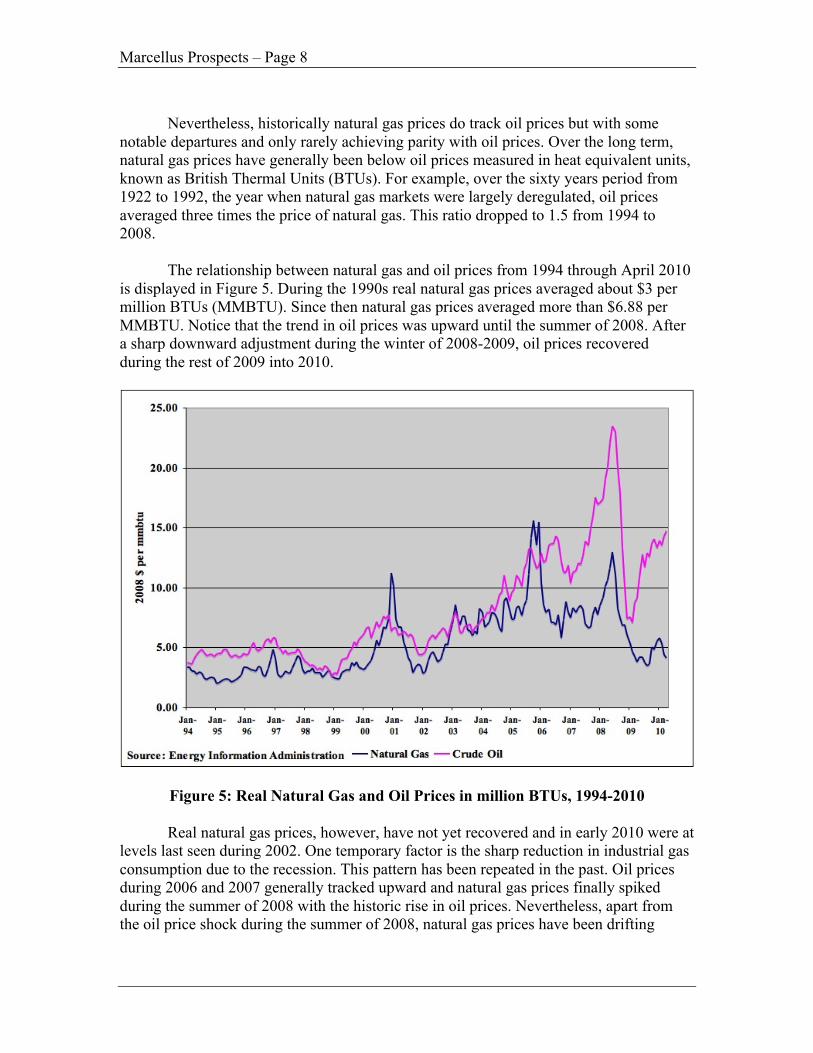
Since deregulation in the early 1990s, most new electric power generation capacity has been based upon natural gas. Lower capital costs and strategic environmental considerations have contributed to this increased reliance on natural gas in power generation. Indeed, most of the growth in natural gas consumption has come from the electric utility sector (see Figure 6). In 2001, electric utilities consumed 14.6 billion cubic feet (BCF) per day. By 2009, they were consuming 18.8 BCF per day.
Figure 6: Composition of U.S. Natural Gas Consumption, 2001-2009
Another factor affecting market prices and the development of the Marcellus Shale is competition from other sources of natural gas. After reaching a peak in 1973 at 22.6 trillion cubic feet (TCF) U.S. natural gas production fell precipitously during the era
Marcellus Prospects – Page 10
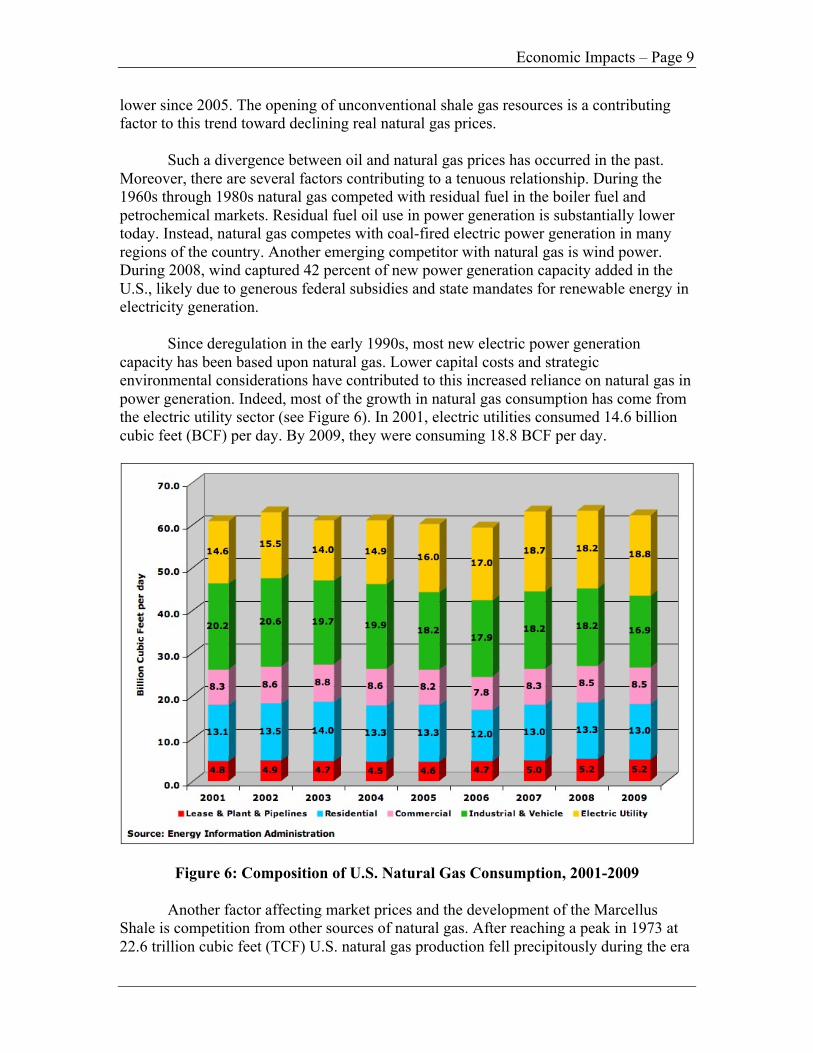
of price controls in the 1970s, reaching a low of 16.8 TCF in 1983. Production then staged a steady recovery, reaching 20.6 TCF in 2001. Between then and 2005, however, U.S. natural gas production declined to 18.9 TCF. Expanding use of gas in power generation and declining production, contributed to rising prices during this period (see Figure 5). Since 2005, however, U.S. natural gas production has increased at an average annual rate of 3.7 percent. Where is all this additional gas coming from? Wyoming and shale gas are the two primary sources of new supply. As Figure 7 below illustrates, Wyoming production increased 2 BCF per day between 2005 and 2009. Production from the Barnett Shale in Texas increased by 3.5 BCF per day over the same period. An additional BCF per day came from three other shale plays, including the Antrim in Michigan, Fayetteville in Arkansas, and Woodford in Oklahoma. Collectively these shale plays and Wyoming constituted almost 75 percent of the growth in U.S. domestic natural gas production from 2005 to 2009. This is an encouraging development for the future of natural gas in our nation’s energy supply portfolio because it demonstrates the potential of unconventional sources of natural gas. These supplies will be critical as production from old, shallow conventional onshore gas fields continue its inexorable decline.
Figure 7: Regional U.S. Natural Gas Production, 2001-2009
Another implication of this supply picture is that several new sources of natural gas supply are emerging and likely will be in competition with the Marcellus play. This
Economic Impacts – Page 11
suggests that small margins in relative costs may be important in determining the growth and vitality of these various sources of supply. Indeed, the slower pace of development of the Marcellus in West Virginia compared with the boom in Pennsylvania is in part a reflection of relatively higher costs in West Virginia.
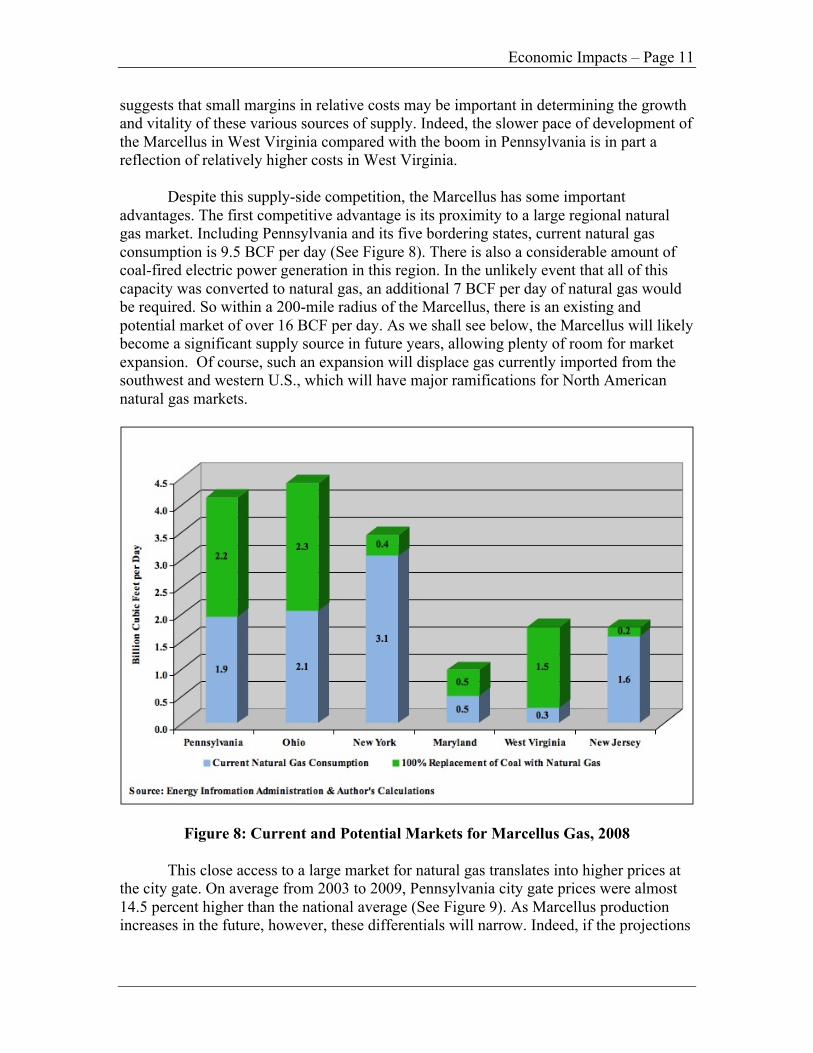
Despite this supply-side competition, the Marcellus has some important advantages. The first competitive advantage is its proximity to a large regional natural gas market. Including Pennsylvania and its five bordering states, current natural gas consumption is 9.5 BCF per day (See Figure 8). There is also a considerable amount of coal-fired electric power generation in this region. In the unlikely event that all of this capacity was converted to natural gas, an additional 7 BCF per day of natural gas would be required. So within a 200-mile radius of the Marcellus, there is an existing and potential market of over 16 BCF per day. As we shall see below, the Marcellus will likely become a significant supply source in future years, allowing plenty of room for market expansion. Of course, such an expansion will displace gas currently imported from the southwest and western U.S., which will have major ramifications for North American natural gas markets.
Figure 8: Current and Potential Markets for Marcellus Gas, 2008
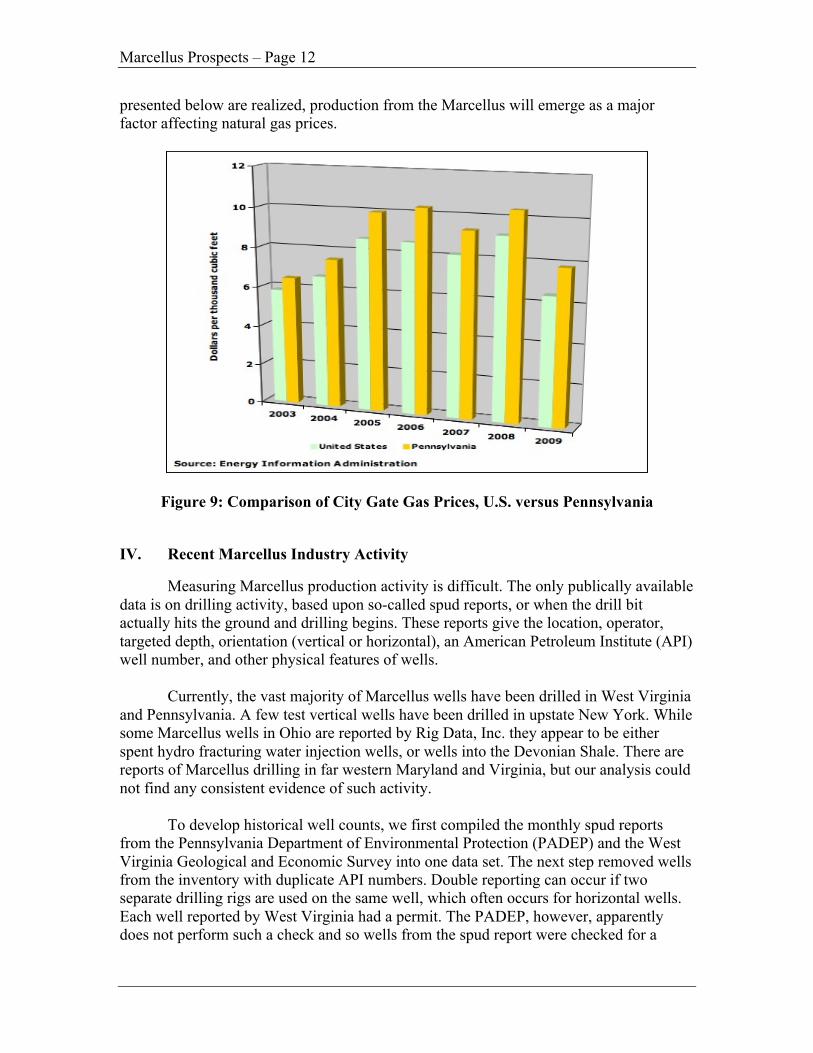
This close access to a large market for natural gas translates into higher prices at the city gate. On average from 2003 to 2009, Pennsylvania city gate prices were almost 14.5 percent higher than the national average (See Figure 9). As Marcellus production increases in the future, however, these differentials will narrow. Indeed, if the projections
Marcellus Prospects – Page 12
presented below are realized, production from the Marcellus will emerge as a major factor affecting natural gas prices.
Figure 9: Comparison of City Gate Gas Prices, U.S. versus Pennsylvania
IV. Recent Marcellus Industry Activity
Measuring Marcellus production activity is difficult. The only publically available data is on drilling activity, based upon so-called spud reports, or when the drill bit actually hits the ground and drilling begins. These reports give the location, operator, targeted depth, orientation (vertical or horizontal), an American Petroleum Institute (API) well number, and other physical features of wells.
Currently, the vast majority of Marcellus wells have been drilled in West Virginia
and Pennsylvania. A few test vertical wells have been drilled in upstate New York. While some Marcellus wells in Ohio are reported by Rig Data, Inc. they appear to be either spent hydro fracturing water injection wells, or wells into the Devonian Shale. There are reports of Marcellus drilling in far western Maryland and Virginia, but our analysis could not find any consistent evidence of such activity.
To develop historical well counts, we first compiled the monthly spud reports
from the Pennsylvania Department of Environmental Protection (PADEP) and the West Virginia Geological and Economic Survey into one data set. The next step removed wells from the inventory with duplicate API numbers. Double reporting can occur if two separate drilling rigs are used on the same well, which often occurs for horizontal wells. Each well reported by West Virginia had a permit. The PADEP, however, apparently does not perform such a check and so wells from the spud report were checked for a
Economic Impacts – Page 13
permit from the DEP permit database. For each state, the process was repeated to ensure consistency and accuracy.
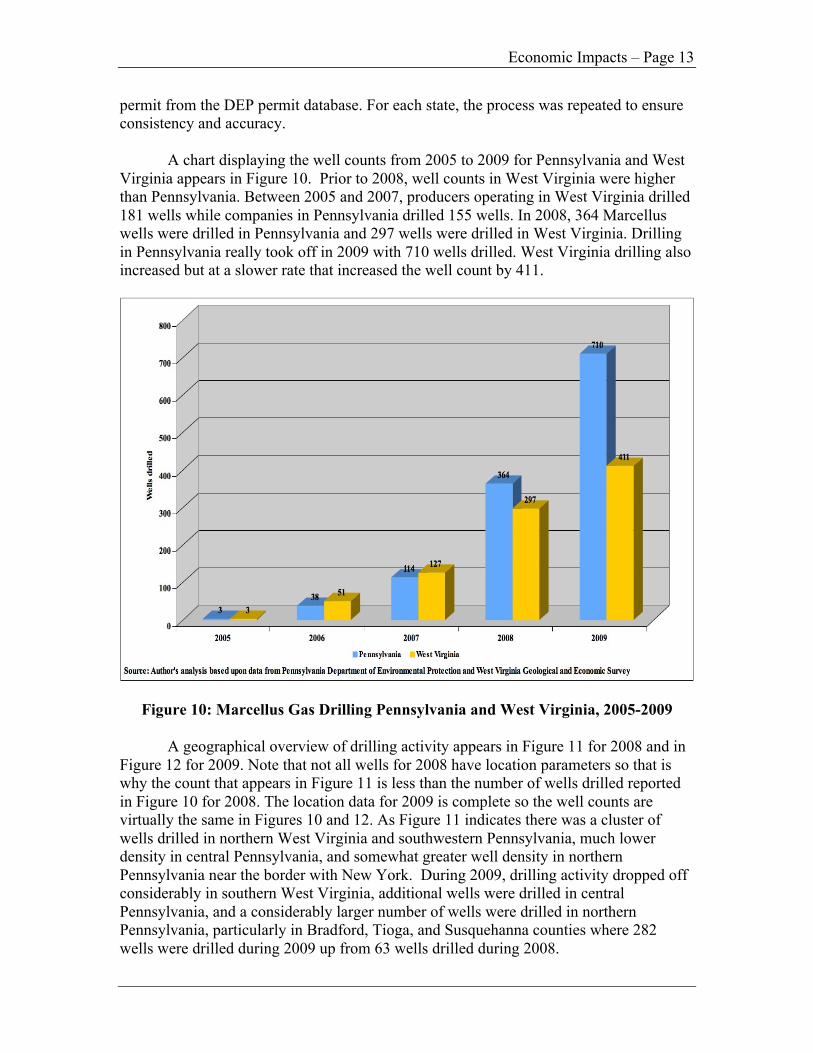
A chart displaying the well counts from 2005 to 2009 for Pennsylvania and West
Virginia appears in Figure 10. Prior to 2008, well counts in West Virginia were higher than Pennsylvania. Between 2005 and 2007, producers operating in West Virginia drilled 181 wells while companies in Pennsylvania drilled 155 wells. In 2008, 364 Marcellus wells were drilled in Pennsylvania and 297 wells were drilled in West Virginia. Drilling in Pennsylvania really took off in 2009 with 710 wells drilled. West Virginia drilling also increased but at a slower rate that increased the well count by 411.
Figure 10: Marcellus Gas Drilling Pennsylvania and West Virginia, 2005-2009
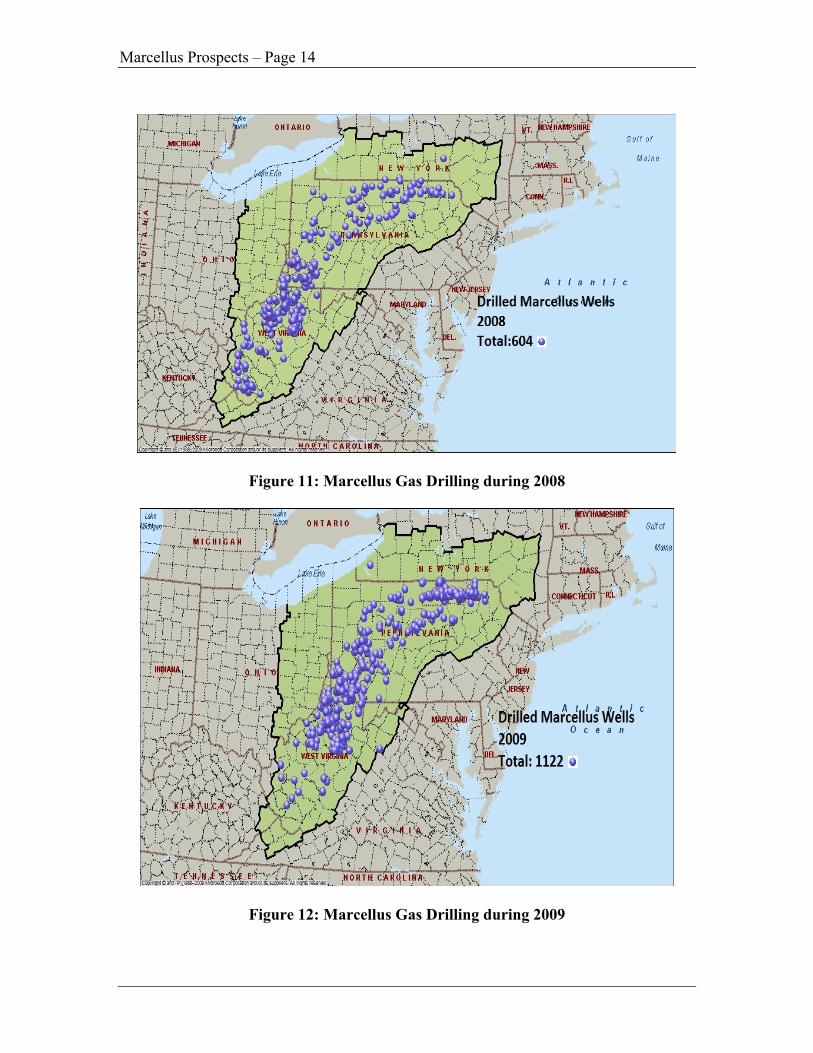
A geographical overview of drilling activity appears in Figure 11 for 2008 and in Figure 12 for 2009. Note that not all wells for 2008 have location parameters so that is why the count that appears in Figure 11 is less than the number of wells drilled reported in Figure 10 for 2008. The location data for 2009 is complete so the well counts are virtually the same in Figures 10 and 12. As Figure 11 indicates there was a cluster of wells drilled in northern West Virginia and southwestern Pennsylvania, much lower density in central Pennsylvania, and somewhat greater well density in northern Pennsylvania near the border with New York. During 2009, drilling activity dropped off considerably in southern West Virginia, additional wells were drilled in central Pennsylvania, and a considerably larger number of wells were drilled in northern Pennsylvania, particularly in Bradford, Tioga, and Susquehanna counties where 282 wells were drilled during 2009 up from 63 wells drilled during 2008.
Marcellus Prospects – Page 14
Figure 11: Marcellus Gas Drilling during 2008
Figure 12: Marcellus Gas Drilling during 2009
Economic Impacts – Page 15
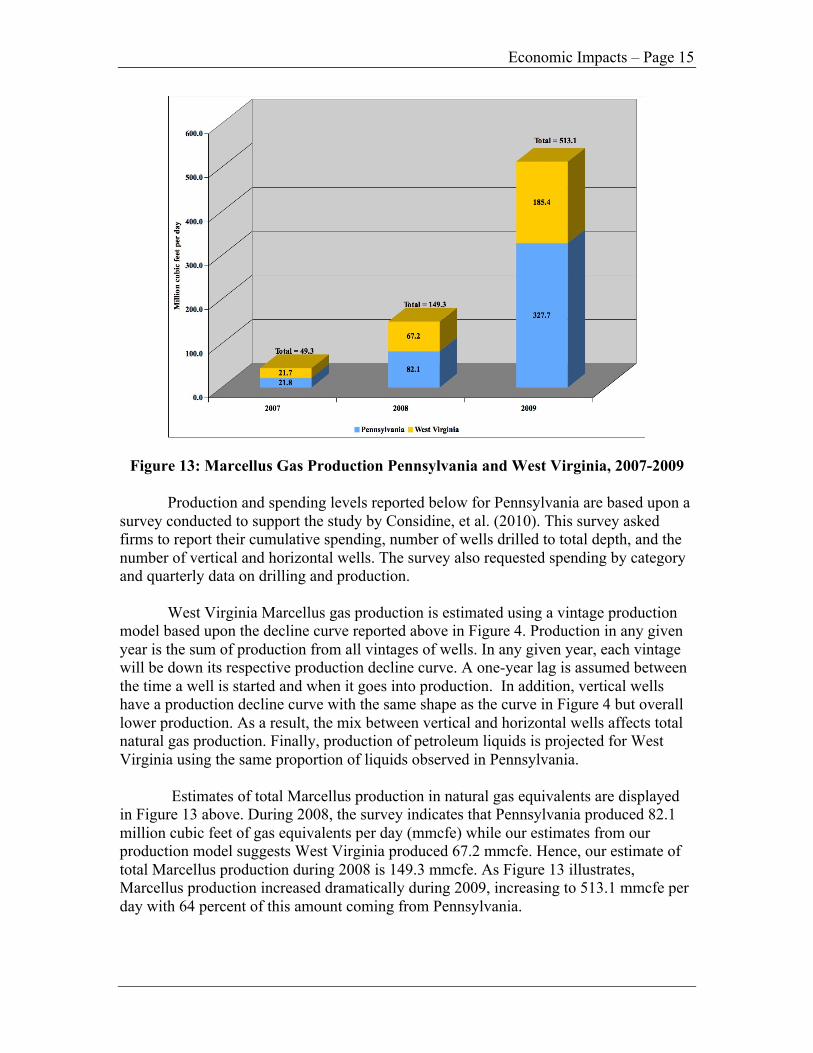
Figure 13: Marcellus Gas Production Pennsylvania and West Virginia, 2007-2009
Production and spending levels reported below for Pennsylvania are based upon a survey conducted to support the study by Considine, et al. (2010). This survey asked firms to report their cumulative spending, number of wells drilled to total depth, and the number of vertical and horizontal wells. The survey also requested spending by category and quarterly data on drilling and production.
West Virginia Marcellus gas production is estimated using a vintage production model based upon the decline curve reported above in Figure 4. Production in any given year is the sum of production from all vintages of wells. In any given year, each vintage will be down its respective production decline curve. A one-year lag is assumed between the time a well is started and when it goes into production. In addition, vertical wells have a production decline curve with the same shape as the curve in Figure 4 but overall lower production. As a result, the mix between vertical and horizontal wells affects total natural gas production. Finally, production of petroleum liquids is projected for West Virginia using the same proportion of liquids observed in Pennsylvania. Estimates of total Marcellus production in natural gas equivalents are displayed in Figure 13 above. During 2008, the survey indicates that Pennsylvania produced 82.1 million cubic feet of gas equivalents per day (mmcfe) while our estimates from our production model suggests West Virginia produced 67.2 mmcfe. Hence, our estimate of total Marcellus production during 2008 is 149.3 mmcfe. As Figure 13 illustrates, Marcellus production increased dramatically during 2009, increasing to 513.1 mmcfe per day with 64 percent of this amount coming from Pennsylvania.
Marcellus Prospects – Page 16
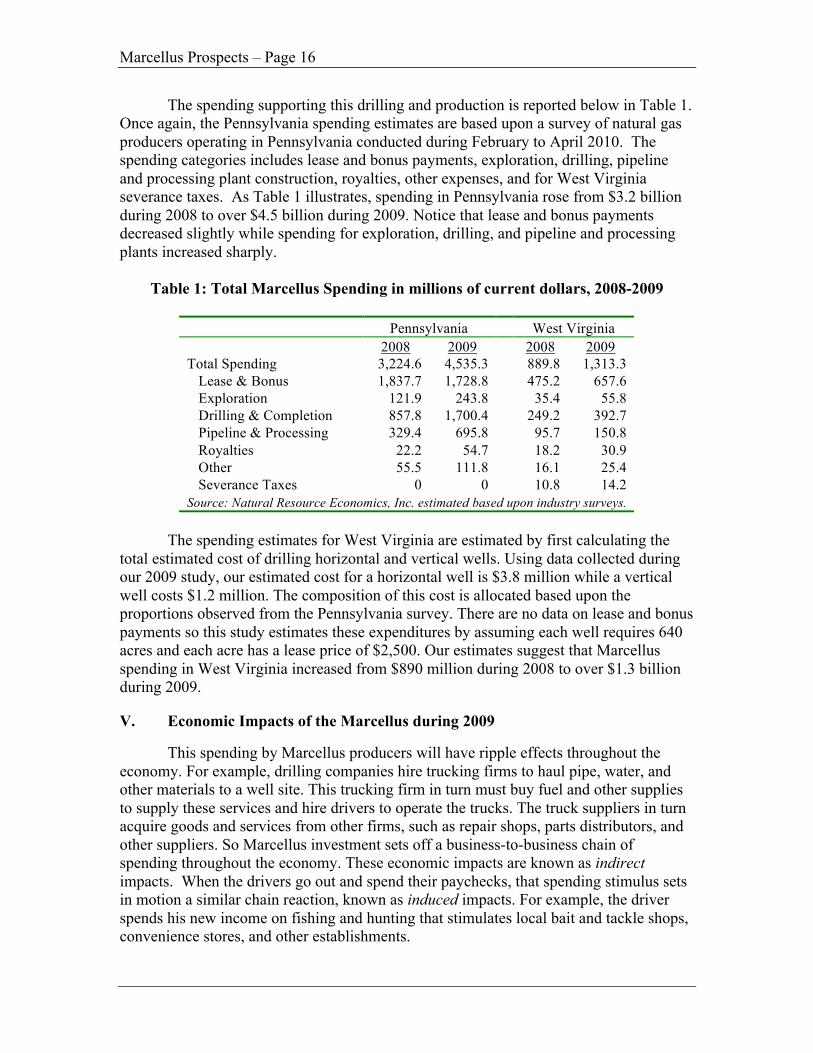
The spending supporting this drilling and production is reported below in Table 1. Once again, the Pennsylvania spending estimates are based upon a survey of natural gas producers operating in Pennsylvania conducted during February to April 2010. The spending categories includes lease and bonus payments, exploration, drilling, pipeline and processing plant construction, royalties, other expenses, and for West Virginia severance taxes. As Table 1 illustrates, spending in Pennsylvania rose from $3.2 billion during 2008 to over $4.5 billion during 2009. Notice that lease and bonus payments decreased slightly while spending for exploration, drilling, and pipeline and processing plants increased sharply.
Table 1: Total Marcellus Spending in millions of current dollars, 2008-2009
Pennsylvania West Virginia 2008 2009 2008 2009 Total Spending 3,224.6 4,535.3 889.8 1,313.3
Lease & Bonus 1,837.7 1,728.8 475.2 657.6 Exploration 121.9 243.8 35.4 55.8 Drilling & Completion 857.8 1,700.4 249.2 392.7 Pipeline & Processing 329.4 695.8 95.7 150.8 Royalties 22.2 54.7 18.2 30.9 Other 55.5 111.8 16.1 25.4 Severance Taxes 0 0 10.8 14.2
Source: Natural Resource Economics, Inc. estimated based upon industry surveys. The spending estimates for West Virginia are estimated by first calculating the total estimated cost of drilling horizontal and vertical wells. Using data collected during our 2009 study, our estimated cost for a horizontal well is $3.8 million while a vertical well costs $1.2 million. The composition of this cost is allocated based upon the proportions observed from the Pennsylvania survey. There are no data on lease and bonus payments so this study estimates these expenditures by assuming each well requires 640 acres and each acre has a lease price of $2,500. Our estimates suggest that Marcellus spending in West Virginia increased from $890 million during 2008 to over $1.3 billion during 2009.
V. Economic Impacts of the Marcellus during 2009
This spending by Marcellus producers will have ripple effects throughout the economy. For example, drilling companies hire trucking firms to haul pipe, water, and other materials to a well site. This trucking firm in turn must buy fuel and other supplies to supply these services and hire drivers to operate the trucks. The truck suppliers in turn acquire goods and services from other firms, such as repair shops, parts distributors, and other suppliers. So Marcellus investment sets off a business-to-business chain of spending throughout the economy. These economic impacts are known as indirect impacts. When the drivers go out and spend their paychecks, that spending stimulus sets in motion a similar chain reaction, known as induced impacts. For example, the driver spends his new income on fishing and hunting that stimulates local bait and tackle shops, convenience stores, and other establishments.
Economic Impacts – Page 17
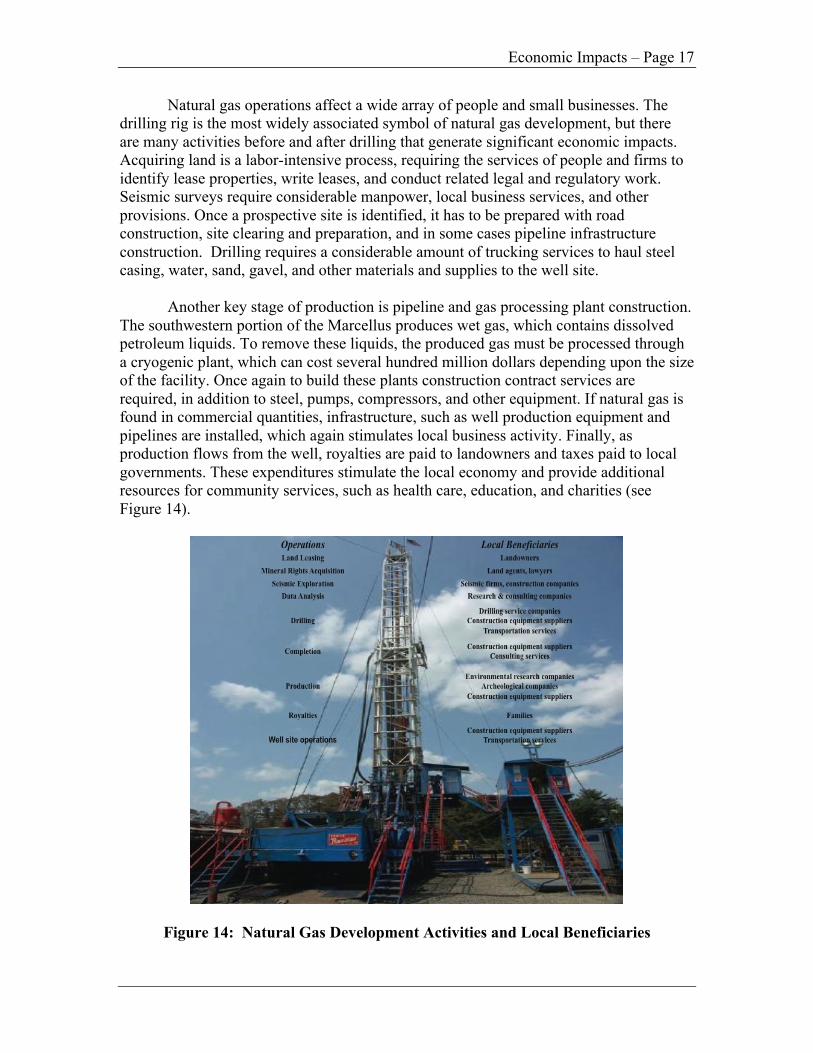
Natural gas operations affect a wide array of people and small businesses. The drilling rig is the most widely associated symbol of natural gas development, but there are many activities before and after drilling that generate significant economic impacts. Acquiring land is a labor-intensive process, requiring the services of people and firms to identify lease properties, write leases, and conduct related legal and regulatory work. Seismic surveys require considerable manpower, local business services, and other provisions. Once a prospective site is identified, it has to be prepared with road construction, site clearing and preparation, and in some cases pipeline infrastructure construction. Drilling requires a considerable amount of trucking services to haul steel casing, water, sand, gavel, and other materials and supplies to the well site.
Another key stage of production is pipeline and gas processing plant construction.
The southwestern portion of the Marcellus produces wet gas, which contains dissolved petroleum liquids. To remove these liquids, the produced gas must be processed through a cryogenic plant, which can cost several hundred million dollars depending upon the size of the facility. Once again to build these plants construction contract services are required, in addition to steel, pumps, compressors, and other equipment. If natural gas is found in commercial quantities, infrastructure, such as well production equipment and pipelines are installed, which again stimulates local business activity. Finally, as production flows from the well, royalties are paid to landowners and taxes paid to local governments. These expenditures stimulate the local economy and provide additional resources for community services, such as health care, education, and charities (see Figure 14).
Figure 14: Natural Gas Development Activities and Local Beneficiaries
Marcellus Prospects – Page 18
These economic impacts can be measured using input-output (IO) tables and related IO models. Input-output analysis provides a quantitative model of the inter-industry transactions and how spending in one sector affects other sectors of the economy. IO tables for states and counties are available from Minnesota IMPLAN Group, Inc. based upon data from the Bureau of Economic Analysis in the US Department of Commerce.2 This project uses these tables to estimate the economic impacts from the Marcellus industry spending.
The economic impact analysis involves a comparison of the economy with and
without Marcellus industry spending. The baseline model solution is a representation of the economy, including estimates of gross sales or output, value added, employment, and taxes paid to local, state, and federal governments. For this study, IO models are used for Pennsylvania, West Virginia, and New York. Since the Marcellus industry is less than five years old, it is not included in the state level IO tables. As a result, this study adopts a standard technique developed by Miller and Blair (2009) that models the impacts of new industries within an input-output model of a regional economy. This technique involves linking the spending estimates presented above in Table 1 with the inter-industry transactions in the input-output model.
This linkage was accomplished by using results from our previous research that
supported the study by Considine et al. (2009). That study is unique because it involved collecting detailed accounting data from a sample of Marcellus producers in Pennsylvania. These data included all purchases by producers from other businesses, taxes paid, payroll, and expenditures for royalties and lease and bonus payments. The location and industrial sector code of each supplier were identified from business databases, such as Hoover. This effort provided a detailed breakdown of total Marcellus spending at the four-digit level of the North American Industrial Code System (NAICS). This information then provided a column or vector of sales from other businesses to Marcellus producers to support their natural gas production activities. This vector provides a benchmark for determining how Marcellus industry spending affects other sectors in the economy.
This study uses this benchmark to disaggregate the spending totals reported above
in Table 1. For example, the total spending on exploration, drilling, pipeline and processing plants, and other spending is multiplied by the spending ratios by sector from the benchmark year 2008. Payments by Marcellus producers for payroll and state and local taxes are treated in a similar fashion. Land payments, which include lease and bonus payments and royalties, are adjusted for taxes and modeled as an increase in disposable income to households. The IMPLAN model then accounts for the amount spent on locally produced versus imported goods and services. In summary, the spending stimulus from Marcellus producers contains four major components: inter-industry supply requirements across hundreds of sectors, land payments to households, state and local tax payments to the non-education government sector, and payroll income to employees.
2 http://www.implan.com/index.html
Economic Impacts – Page 19
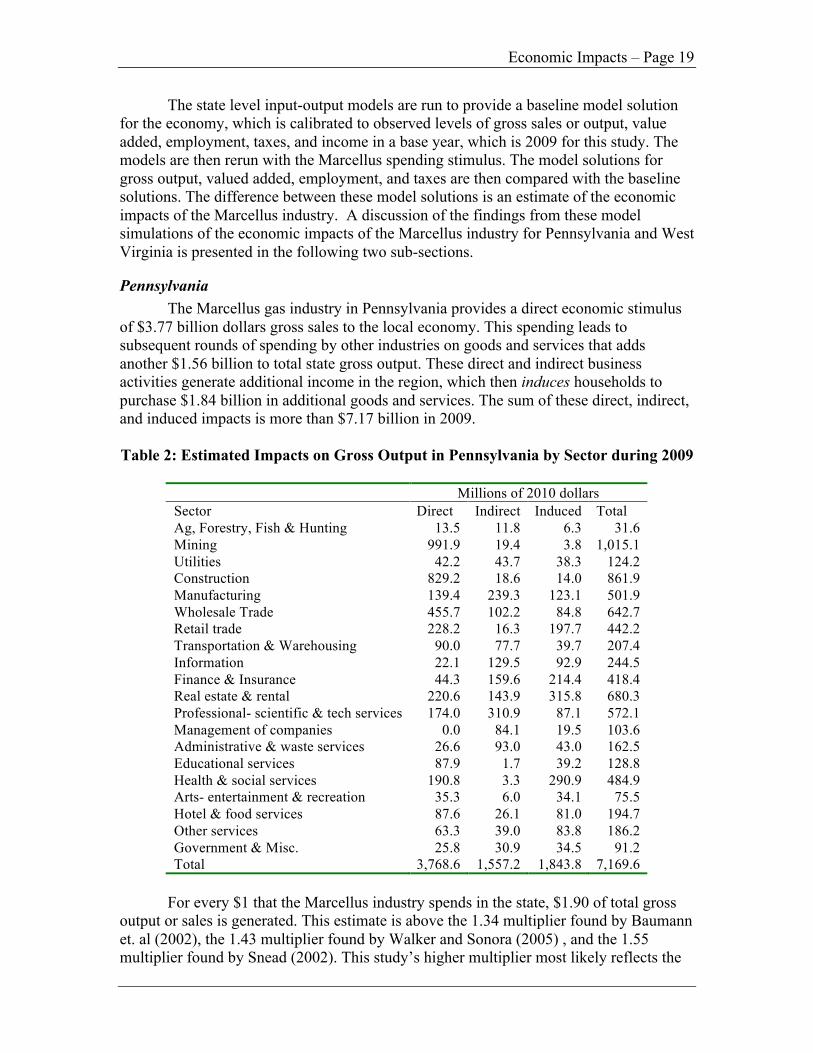
The state level input-output models are run to provide a baseline model solution for the economy, which is calibrated to observed levels of gross sales or output, value added, employment, taxes, and income in a base year, which is 2009 for this study. The models are then rerun with the Marcellus spending stimulus. The model solutions for gross output, valued added, employment, and taxes are then compared with the baseline solutions. The difference between these model solutions is an estimate of the economic impacts of the Marcellus industry. A discussion of the findings from these model simulations of the economic impacts of the Marcellus industry for Pennsylvania and West Virginia is presented in the following two sub-sections.
Pennsylvania The Marcellus gas industry in Pennsylvania provides a direct economic stimulus
of $3.77 billion dollars gross sales to the local economy. This spending leads to subsequent rounds of spending by other industries on goods and services that adds another $1.56 billion to total state gross output. These direct and indirect business activities generate additional income in the region, which then induces households to purchase $1.84 billion in additional goods and services. The sum of these direct, indirect, and induced impacts is more than $7.17 billion in 2009. Table 2: Estimated Impacts on Gross Output in Pennsylvania by Sector during 2009
Millions of 2010 dollars Sector Direct Indirect Induced Total Ag, Forestry, Fish & Hunting 13.5 11.8 6.3 31.6 Mining 991.9 19.4 3.8 1,015.1 Utilities 42.2 43.7 38.3 124.2 Construction 829.2 18.6 14.0 861.9 Manufacturing 139.4 239.3 123.1 501.9 Wholesale Trade 455.7 102.2 84.8 642.7 Retail trade 228.2 16.3 197.7 442.2 Transportation & Warehousing 90.0 77.7 39.7 207.4 Information 22.1 129.5 92.9 244.5 Finance & Insurance 44.3 159.6 214.4 418.4 Real estate & rental 220.6 143.9 315.8 680.3 Professional- scientific & tech services 174.0 310.9 87.1 572.1 Management of companies 0.0 84.1 19.5 103.6 Administrative & waste services 26.6 93.0 43.0 162.5 Educational services 87.9 1.7 39.2 128.8 Health & social services 190.8 3.3 290.9 484.9 Arts- entertainment & recreation 35.3 6.0 34.1 75.5 Hotel & food services 87.6 26.1 81.0 194.7 Other services 63.3 39.0 83.8 186.2 Government & Misc. 25.8 30.9 34.5 91.2 Total 3,768.6 1,557.2 1,843.8 7,169.6
For every $1 that the Marcellus industry spends in the state, $1.90 of total gross
output or sales is generated. This estimate is above the 1.34 multiplier found by Baumann et. al (2002), the 1.43 multiplier found by Walker and Sonora (2005) , and the 1.55 multiplier found by Snead (2002). This study’s higher multiplier most likely reflects the
Marcellus Prospects – Page 20
detailed expenditure analysis in our benchmark year 2008 based upon company accounting data, which provide a more accurate measurement of inter-industry purchases.
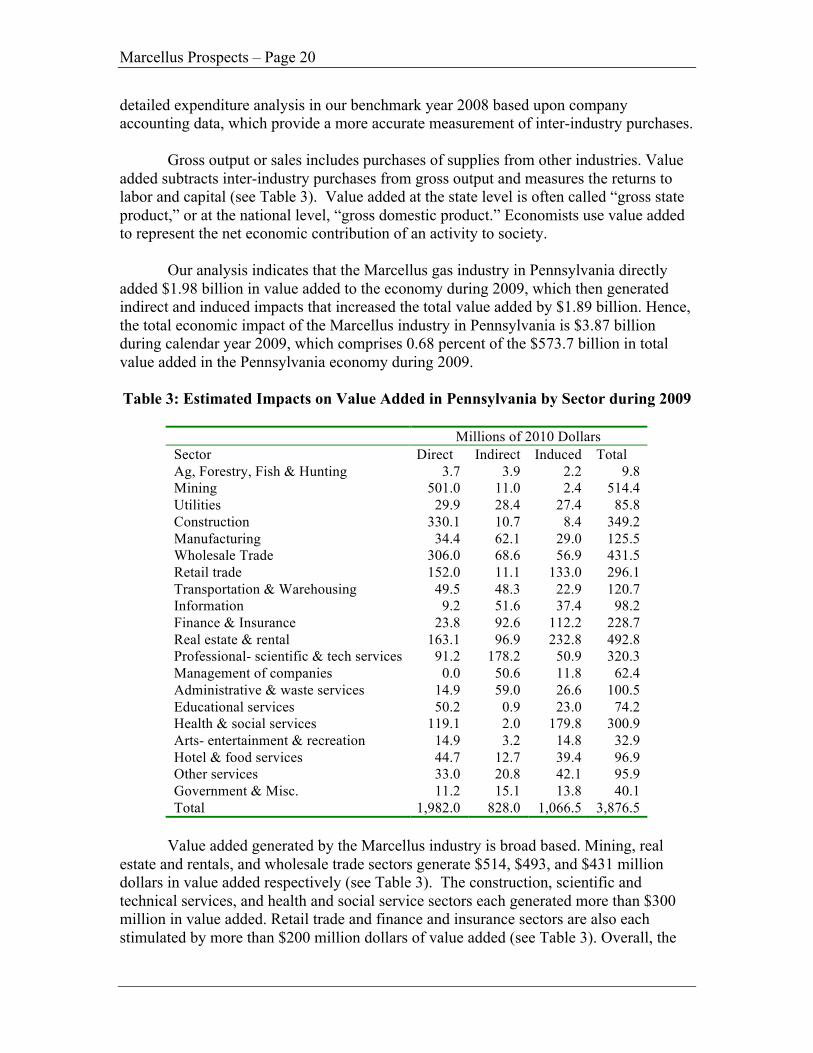
Gross output or sales includes purchases of supplies from other industries. Value added subtracts inter-industry purchases from gross output and measures the returns to labor and capital (see Table 3). Value added at the state level is often called “gross state product,” or at the national level, “gross domestic product.” Economists use value added to represent the net economic contribution of an activity to society.
Our analysis indicates that the Marcellus gas industry in Pennsylvania directly
added $1.98 billion in value added to the economy during 2009, which then generated indirect and induced impacts that increased the total value added by $1.89 billion. Hence, the total economic impact of the Marcellus industry in Pennsylvania is $3.87 billion during calendar year 2009, which comprises 0.68 percent of the $573.7 billion in total value added in the Pennsylvania economy during 2009.
Table 3: Estimated Impacts on Value Added in Pennsylvania by Sector during 2009
Millions of 2010 Dollars Sector Direct Indirect Induced Total Ag, Forestry, Fish & Hunting 3.7 3.9 2.2 9.8 Mining 501.0 11.0 2.4 514.4 Utilities 29.9 28.4 27.4 85.8 Construction 330.1 10.7 8.4 349.2 Manufacturing 34.4 62.1 29.0 125.5 Wholesale Trade 306.0 68.6 56.9 431.5 Retail trade 152.0 11.1 133.0 296.1 Transportation & Warehousing 49.5 48.3 22.9 120.7 Information 9.2 51.6 37.4 98.2 Finance & Insurance 23.8 92.6 112.2 228.7 Real estate & rental 163.1 96.9 232.8 492.8 Professional- scientific & tech services 91.2 178.2 50.9 320.3 Management of companies 0.0 50.6 11.8 62.4 Administrative & waste services 14.9 59.0 26.6 100.5 Educational services 50.2 0.9 23.0 74.2 Health & social services 119.1 2.0 179.8 300.9 Arts- entertainment & recreation 14.9 3.2 14.8 32.9 Hotel & food services 44.7 12.7 39.4 96.9 Other services 33.0 20.8 42.1 95.9 Government & Misc. 11.2 15.1 13.8 40.1 Total 1,982.0 828.0 1,066.5 3,876.5
Value added generated by the Marcellus industry is broad based. Mining, real
estate and rentals, and wholesale trade sectors generate $514, $493, and $431 million dollars in value added respectively (see Table 3). The construction, scientific and technical services, and health and social service sectors each generated more than $300 million in value added. Retail trade and finance and insurance sectors are also each stimulated by more than $200 million dollars of value added (see Table 3). Overall, the
Economic Impacts – Page 21
Marcellus gas industry generates widespread increases in value added across many sectors of the economy.
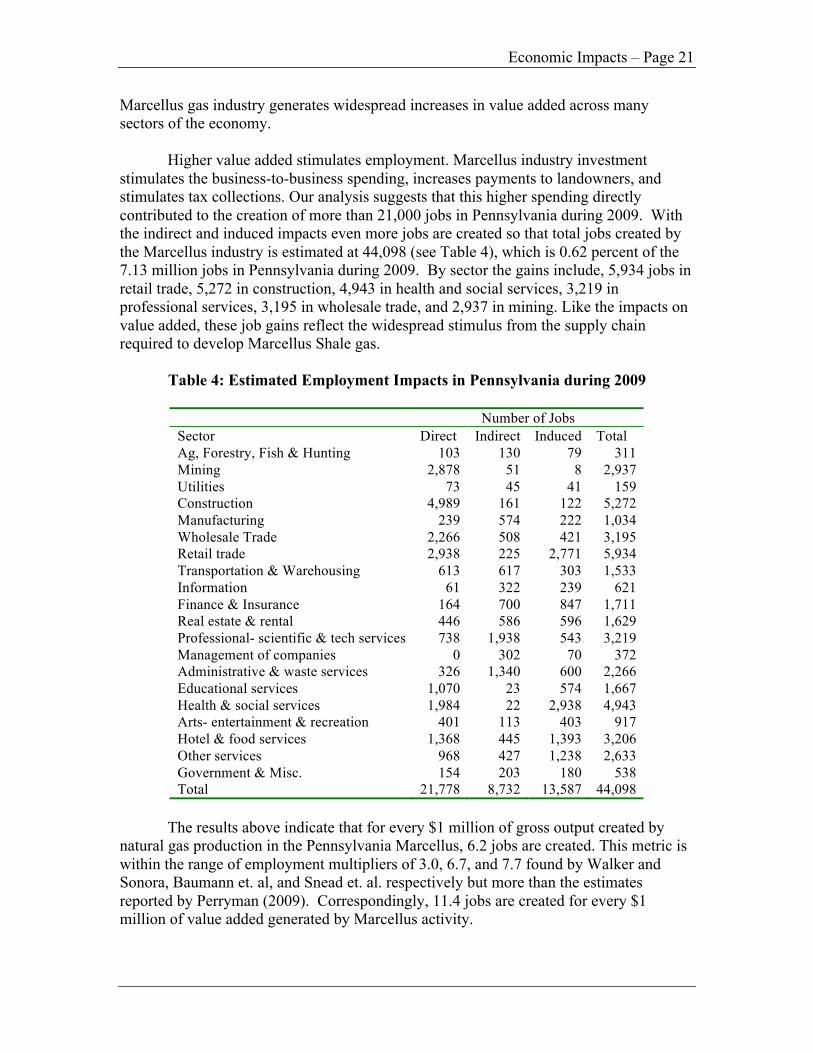
Higher value added stimulates employment. Marcellus industry investment stimulates the business-to-business spending, increases payments to landowners, and stimulates tax collections. Our analysis suggests that this higher spending directly contributed to the creation of more than 21,000 jobs in Pennsylvania during 2009. With the indirect and induced impacts even more jobs are created so that total jobs created by the Marcellus industry is estimated at 44,098 (see Table 4), which is 0.62 percent of the 7.13 million jobs in Pennsylvania during 2009. By sector the gains include, 5,934 jobs in retail trade, 5,272 in construction, 4,943 in health and social services, 3,219 in professional services, 3,195 in wholesale trade, and 2,937 in mining. Like the impacts on value added, these job gains reflect the widespread stimulus from the supply chain required to develop Marcellus Shale gas.
Table 4: Estimated Employment Impacts in Pennsylvania during 2009
Number of Jobs Sector Direct Indirect Induced Total Ag, Forestry, Fish & Hunting 103 130 79 311 Mining 2,878 51 8 2,937 Utilities 73 45 41 159 Construction 4,989 161 122 5,272 Manufacturing 239 574 222 1,034 Wholesale Trade 2,266 508 421 3,195 Retail trade 2,938 225 2,771 5,934 Transportation & Warehousing 613 617 303 1,533 Information 61 322 239 621 Finance & Insurance 164 700 847 1,711 Real estate & rental 446 586 596 1,629 Professional- scientific & tech services 738 1,938 543 3,219 Management of companies 0 302 70 372 Administrative & waste services 326 1,340 600 2,266 Educational services 1,070 23 574 1,667 Health & social services 1,984 22 2,938 4,943 Arts- entertainment & recreation 401 113 403 917 Hotel & food services 1,368 445 1,393 3,206 Other services 968 427 1,238 2,633 Government & Misc. 154 203 180 538 Total 21,778 8,732 13,587 44,098
The results above indicate that for every $1 million of gross output created by
natural gas production in the Pennsylvania Marcellus, 6.2 jobs are created. This metric is within the range of employment multipliers of 3.0, 6.7, and 7.7 found by Walker and Sonora, Baumann et. al, and Snead et. al. respectively but more than the estimates reported by Perryman (2009). Correspondingly, 11.4 jobs are created for every $1 million of value added generated by Marcellus activity.
Marcellus Prospects – Page 22
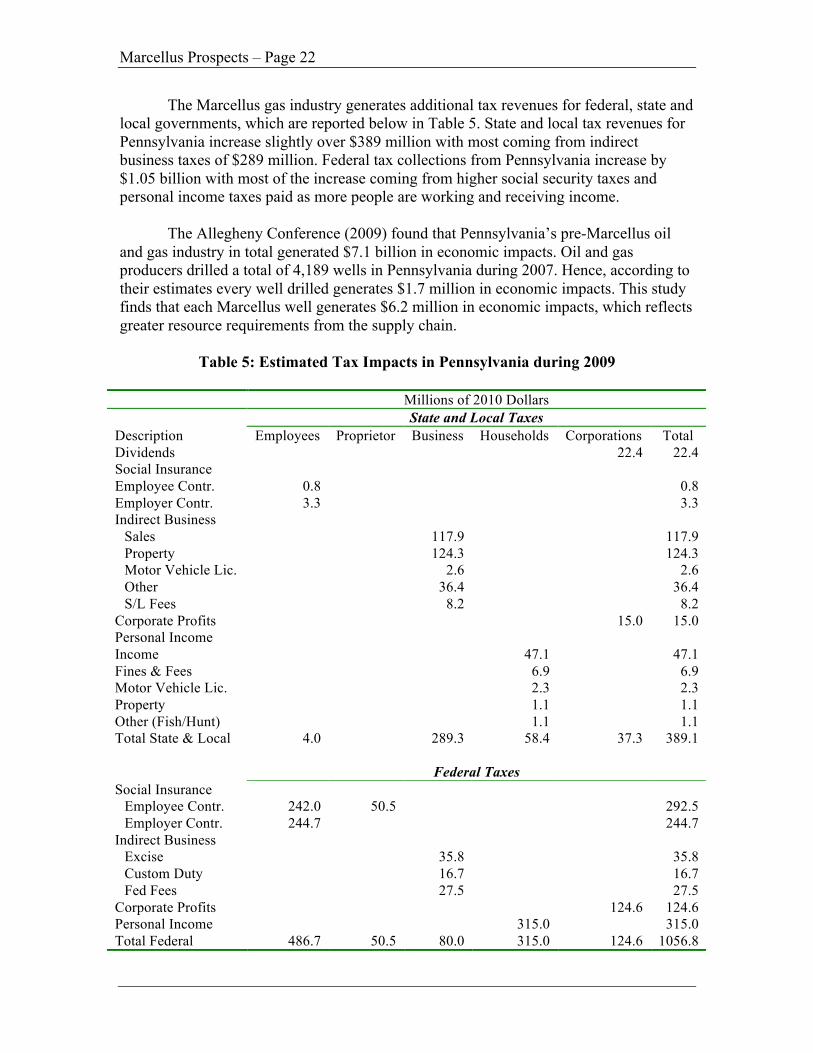
The Marcellus gas industry generates additional tax revenues for federal, state and local governments, which are reported below in Table 5. State and local tax revenues for Pennsylvania increase slightly over $389 million with most coming from indirect business taxes of $289 million. Federal tax collections from Pennsylvania increase by $1.05 billion with most of the increase coming from higher social security taxes and personal income taxes paid as more people are working and receiving income.
The Allegheny Conference (2009) found that Pennsylvania’s pre-Marcellus oil and gas industry in total generated $7.1 billion in economic impacts. Oil and gas producers drilled a total of 4,189 wells in Pennsylvania during 2007. Hence, according to their estimates every well drilled generates $1.7 million in economic impacts. This study finds that each Marcellus well generates $6.2 million in economic impacts, which reflects greater resource requirements from the supply chain.
Table 5: Estimated Tax Impacts in Pennsylvania during 2009
Millions of 2010 Dollars State and Local Taxes Description Employees Proprietor Business Households Corporations Total Dividends 22.4 22.4 Social Insurance Employee Contr. 0.8 0.8 Employer Contr. 3.3 3.3 Indirect Business
Sales 117.9 117.9 Property 124.3 124.3 Motor Vehicle Lic. 2.6 2.6 Other 36.4 36.4 S/L Fees 8.2 8.2
Corporate Profits 15.0 15.0 Personal Income Income 47.1 47.1 Fines & Fees 6.9 6.9 Motor Vehicle Lic. 2.3 2.3 Property 1.1 1.1 Other (Fish/Hunt) 1.1 1.1 Total State & Local 4.0 289.3 58.4 37.3 389.1 Federal Taxes Social Insurance
Employee Contr. 242.0 50.5 292.5 Employer Contr. 244.7 244.7
Indirect Business Excise 35.8 35.8 Custom Duty 16.7 16.7 Fed Fees 27.5 27.5
Corporate Profits 124.6 124.6 Personal Income 315.0 315.0 Total Federal 486.7 50.5 80.0 315.0 124.6 1056.8
Economic Impacts – Page 23
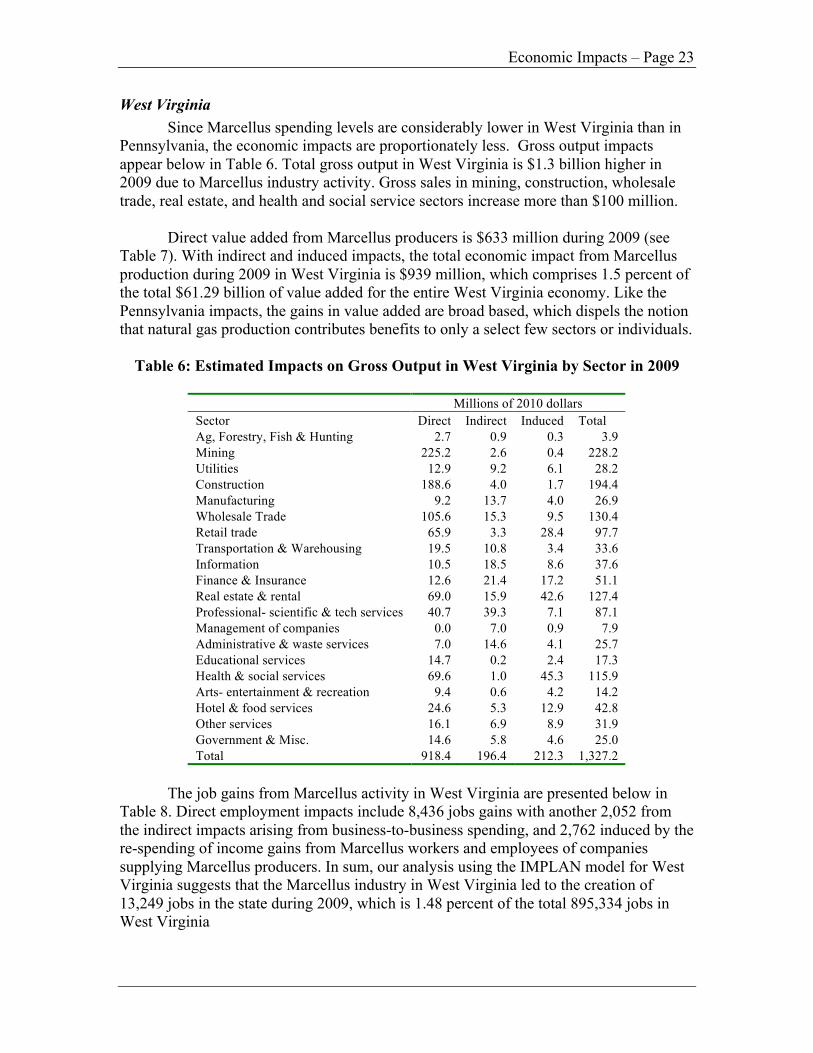
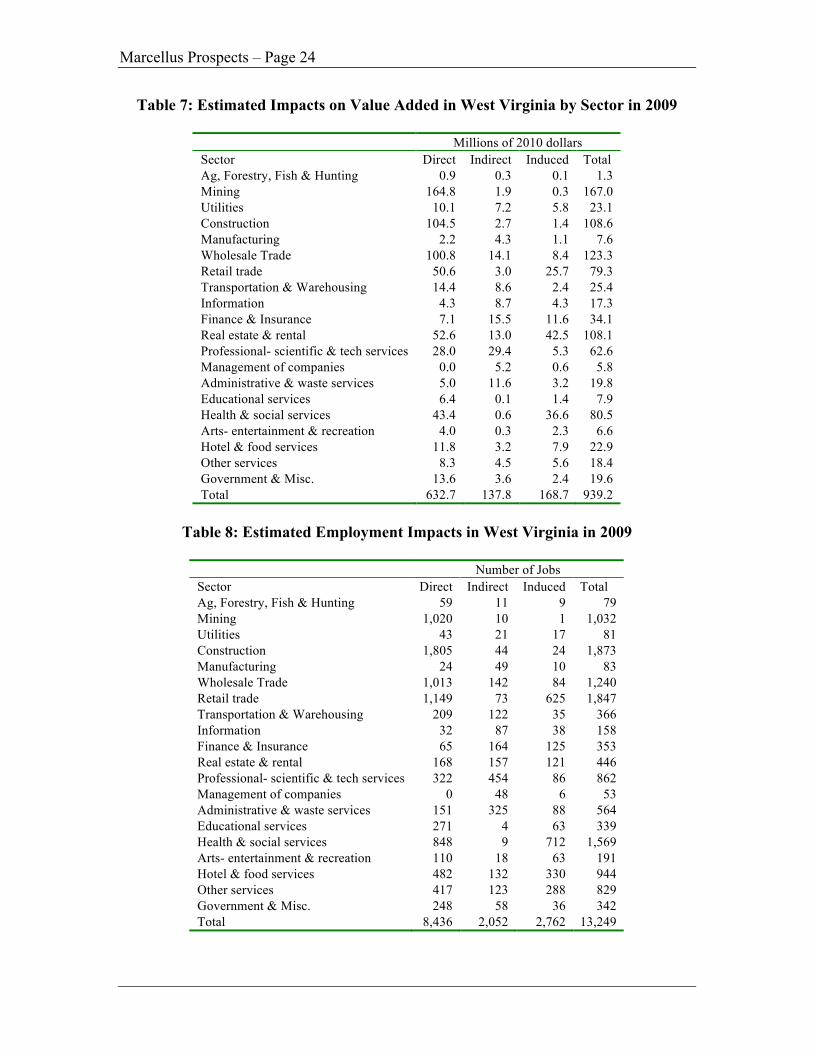
West Virginia Since Marcellus spending levels are considerably lower in West Virginia than in Pennsylvania, the economic impacts are proportionately less. Gross output impacts appear below in Table 6. Total gross output in West Virginia is $1.3 billion higher in 2009 due to Marcellus industry activity. Gross sales in mining, construction, wholesale trade, real estate, and health and social service sectors increase more than $100 million. Direct value added from Marcellus producers is $633 million during 2009 (see Table 7). With indirect and induced impacts, the total economic impact from Marcellus production during 2009 in West Virginia is $939 million, which comprises 1.5 percent of the total $61.29 billion of value added for the entire West Virginia economy. Like the Pennsylvania impacts, the gains in value added are broad based, which dispels the notion that natural gas production contributes benefits to only a select few sectors or individuals.
Table 6: Estimated Impacts on Gross Output in West Virginia by Sector in 2009
Millions of 2010 dollars Sector Direct Indirect Induced Total Ag, Forestry, Fish & Hunting 2.7 0.9 0.3 3.9 Mining 225.2 2.6 0.4 228.2 Utilities 12.9 9.2 6.1 28.2 Construction 188.6 4.0 1.7 194.4 Manufacturing 9.2 13.7 4.0 26.9 Wholesale Trade 105.6 15.3 9.5 130.4 Retail trade 65.9 3.3 28.4 97.7 Transportation & Warehousing 19.5 10.8 3.4 33.6 Information 10.5 18.5 8.6 37.6 Finance & Insurance 12.6 21.4 17.2 51.1 Real estate & rental 69.0 15.9 42.6 127.4 Professional- scientific & tech services 40.7 39.3 7.1 87.1 Management of companies 0.0 7.0 0.9 7.9 Administrative & waste services 7.0 14.6 4.1 25.7 Educational services 14.7 0.2 2.4 17.3 Health & social services 69.6 1.0 45.3 115.9 Arts- entertainment & recreation 9.4 0.6 4.2 14.2 Hotel & food services 24.6 5.3 12.9 42.8 Other services 16.1 6.9 8.9 31.9 Government & Misc. 14.6 5.8 4.6 25.0 Total 918.4 196.4 212.3 1,327.2
The job gains from Marcellus activity in West Virginia are presented below in Table 8. Direct employment impacts include 8,436 jobs gains with another 2,052 from the indirect impacts arising from business-to-business spending, and 2,762 induced by the re-spending of income gains from Marcellus workers and employees of companies supplying Marcellus producers. In sum, our analysis using the IMPLAN model for West Virginia suggests that the Marcellus industry in West Virginia led to the creation of 13,249 jobs in the state during 2009, which is 1.48 percent of the total 895,334 jobs in West Virginia
Marcellus Prospects – Page 24
Table 7: Estimated Impacts on Value Added in West Virginia by Sector in 2009
Millions of 2010 dollars Sector Direct Indirect Induced Total Ag, Forestry, Fish & Hunting 0.9 0.3 0.1 1.3 Mining 164.8 1.9 0.3 167.0 Utilities 10.1 7.2 5.8 23.1 Construction 104.5 2.7 1.4 108.6 Manufacturing 2.2 4.3 1.1 7.6 Wholesale Trade 100.8 14.1 8.4 123.3 Retail trade 50.6 3.0 25.7 79.3 Transportation & Warehousing 14.4 8.6 2.4 25.4 Information 4.3 8.7 4.3 17.3 Finance & Insurance 7.1 15.5 11.6 34.1 Real estate & rental 52.6 13.0 42.5 108.1 Professional- scientific & tech services 28.0 29.4 5.3 62.6 Management of companies 0.0 5.2 0.6 5.8 Administrative & waste services 5.0 11.6 3.2 19.8 Educational services 6.4 0.1 1.4 7.9 Health & social services 43.4 0.6 36.6 80.5 Arts- entertainment & recreation 4.0 0.3 2.3 6.6 Hotel & food services 11.8 3.2 7.9 22.9 Other services 8.3 4.5 5.6 18.4 Government & Misc. 13.6 3.6 2.4 19.6 Total 632.7 137.8 168.7 939.2
Table 8: Estimated Employment Impacts in West Virginia in 2009
Number of Jobs Sector Direct Indirect Induced Total Ag, Forestry, Fish & Hunting 59 11 9 79 Mining 1,020 10 1 1,032 Utilities 43 21 17 81 Construction 1,805 44 24 1,873 Manufacturing 24 49 10 83 Wholesale Trade 1,013 142 84 1,240 Retail trade 1,149 73 625 1,847 Transportation & Warehousing 209 122 35 366 Information 32 87 38 158 Finance & Insurance 65 164 125 353 Real estate & rental 168 157 121 446 Professional- scientific & tech services 322 454 86 862 Management of companies 0 48 6 53 Administrative & waste services 151 325 88 564 Educational services 271 4 63 339 Health & social services 848 9 712 1,569 Arts- entertainment & recreation 110 18 63 191 Hotel & food services 482 132 330 944 Other services 417 123 288 829 Government & Misc. 248 58 36 342 Total 8,436 2,052 2,762 13,249
Economic Impacts – Page 25
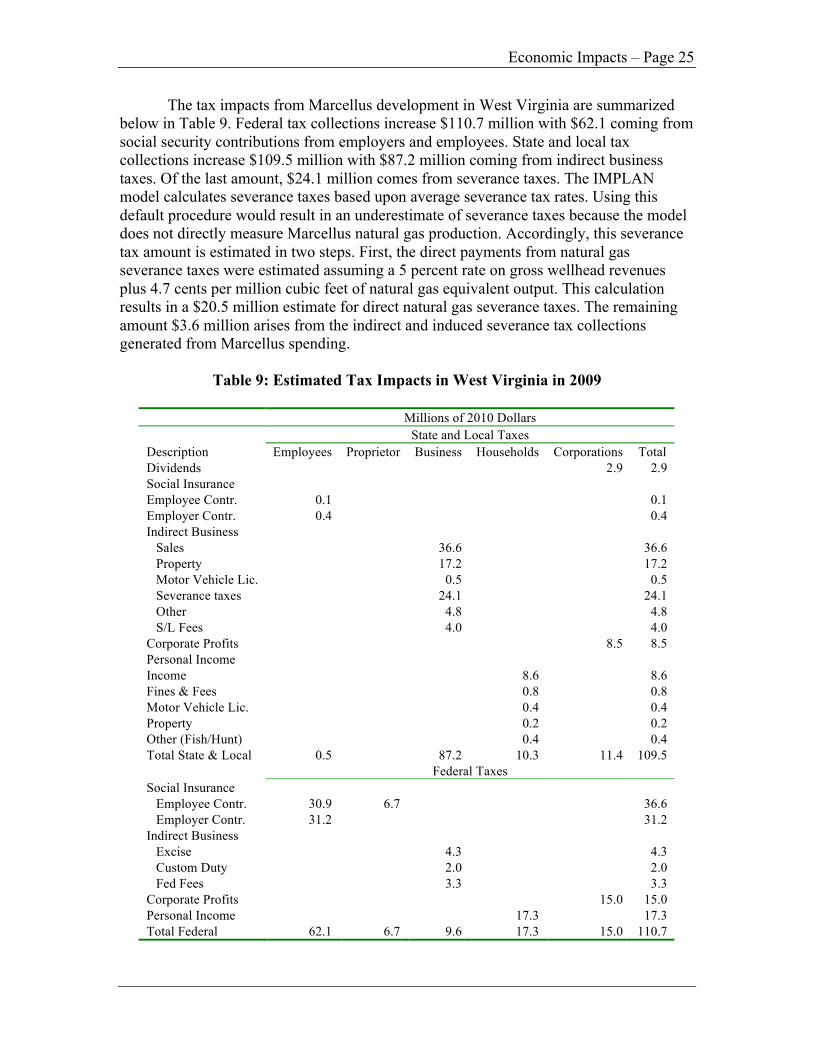
The tax impacts from Marcellus development in West Virginia are summarized below in Table 9. Federal tax collections increase $110.7 million with $62.1 coming from social security contributions from employers and employees. State and local tax collections increase $109.5 million with $87.2 million coming from indirect business taxes. Of the last amount, $24.1 million comes from severance taxes. The IMPLAN model calculates severance taxes based upon average severance tax rates. Using this default procedure would result in an underestimate of severance taxes because the model does not directly measure Marcellus natural gas production. Accordingly, this severance tax amount is estimated in two steps. First, the direct payments from natural gas severance taxes were estimated assuming a 5 percent rate on gross wellhead revenues plus 4.7 cents per million cubic feet of natural gas equivalent output. This calculation results in a $20.5 million estimate for direct natural gas severance taxes. The remaining amount $3.6 million arises from the indirect and induced severance tax collections generated from Marcellus spending.
Table 9: Estimated Tax Impacts in West Virginia in 2009
Millions of 2010 Dollars State and Local Taxes Description Employees Proprietor Business Households Corporations Total Dividends 2.9 2.9 Social Insurance Employee Contr. 0.1 0.1 Employer Contr. 0.4 0.4 Indirect Business
Sales 36.6 36.6 Property 17.2 17.2 Motor Vehicle Lic. 0.5 0.5 Severance taxes 24.1 24.1 Other 4.8 4.8 S/L Fees 4.0 4.0
Corporate Profits 8.5 8.5 Personal Income Income 8.6 8.6 Fines & Fees 0.8 0.8 Motor Vehicle Lic. 0.4 0.4 Property 0.2 0.2 Other (Fish/Hunt) 0.4 0.4 Total State & Local 0.5 87.2 10.3 11.4 109.5 Federal Taxes Social Insurance
Employee Contr. 30.9 6.7 36.6 Employer Contr. 31.2 31.2
Indirect Business Excise 4.3 4.3 Custom Duty 2.0 2.0 Fed Fees 3.3 3.3
Corporate Profits 15.0 15.0 Personal Income 17.3 17.3 Total Federal 62.1 6.7 9.6 17.3 15.0 110.7
Marcellus Prospects – Page 26
Summing-Up: The Regional Impacts of the Marcellus during 2009 The Marcellus industry in West Virginia and Pennsylvania expanded considerably during 2009. Our analysis indicates that 1,121 wells were drilled in these two states during 2009. Output of dry natural gas and petroleum liquids increased to over 600 million cubic feet of gas equivalents during calendar year 2009. Total value added for these two states increased by $4.8 billion as a result of Marcellus production activities. This increase in value added is distributed across a broad swath of the economy, generating more than 57,357 jobs and $1.7 billion in local, state, and federal tax collections.
VI. Future Development Prospects
In assessing the future prospects of the Marcellus industry, regulatory policy in each of the three main states examined in this study must be taken into consideration. Currently, development prospects are strongest for Pennsylvania, although the imposition of severance taxes and overly excessive environmental regulations pose a significant risk to future activity. West Virginia already has a severance tax and faces limitations on excess pipeline capacity and relatively higher pipeline construction costs due to mountainous terrain. The Marcellus formation extends into upstate New York but policies that limit the amount of water that can be used for hydro fracturing amount to an effective moratorium on horizontal drilling in the state.
These policies impose a cost on the New York State economy that are equal to foregone value added, jobs, and tax revenues from Marcellus development. These costs of policies to limit drilling in New York then can be compared with any perceived benefits from them. The following section postulates a possible development path for the Marcellus in New York and estimates the opportunity costs of current policies. The section concludes with an analysis of the prospects for Marcellus development in the entire region out to the year 2020.
A Development Scenario for New York If restrictions on drilling are removed, commercial development of the Marcellus in New York State is a distinct possibility. Under this scenario, the key question for assessing the economic impacts of such a development concerns the level of drilling activity that could take place. Evidence of substantial drilling activity in northern Pennsylvania suggests a similar level of activity just north in New York.
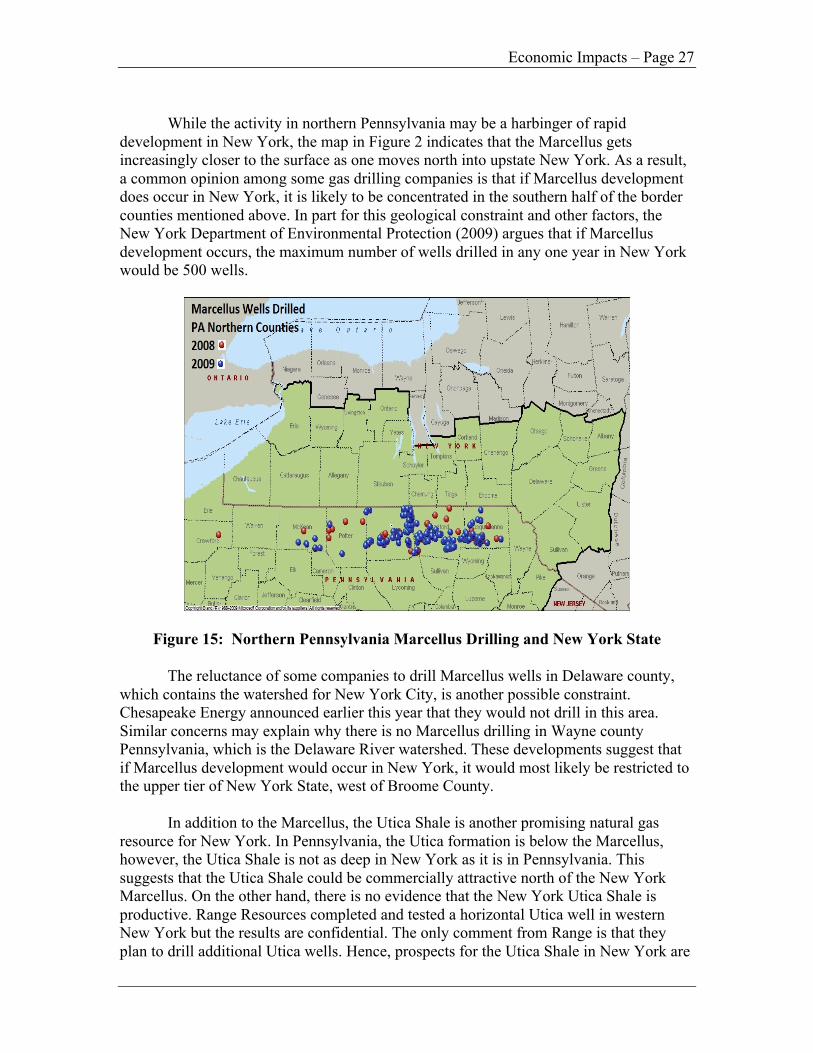
During 2008, 52 Marcellus wells were drilled in the five northern counties of McKean, Potter, Tioga, Bradford, and Susquehanna. The number of Marcellus wells drilled in the same five counties during 2009 was 296. A map of this dramatic expansion of activity and its proximity to New York is displayed below in Figure 15. The New York counties due north of this northern Pennsylvania Marcellus zone include from west to east Allegheny, Steuben, Chemung, Tioga, and Broome counties. Steuben and Chemung counties are accustomed to natural gas development with the production from a much deeper resource called the Trenton Black River formation. Citizens and their leaders in these counties are well aware of the benefits that natural gas development can bring to their communities.
Economic Impacts – Page 27
While the activity in northern Pennsylvania may be a harbinger of rapid
development in New York, the map in Figure 2 indicates that the Marcellus gets increasingly closer to the surface as one moves north into upstate New York. As a result, a common opinion among some gas drilling companies is that if Marcellus development does occur in New York, it is likely to be concentrated in the southern half of the border counties mentioned above. In part for this geological constraint and other factors, the New York Department of Environmental Protection (2009) argues that if Marcellus development occurs, the maximum number of wells drilled in any one year in New York would be 500 wells.
Figure 15: Northern Pennsylvania Marcellus Drilling and New York State
The reluctance of some companies to drill Marcellus wells in Delaware county, which contains the watershed for New York City, is another possible constraint. Chesapeake Energy announced earlier this year that they would not drill in this area. Similar concerns may explain why there is no Marcellus drilling in Wayne county Pennsylvania, which is the Delaware River watershed. These developments suggest that if Marcellus development would occur in New York, it would most likely be restricted to the upper tier of New York State, west of Broome County.
In addition to the Marcellus, the Utica Shale is another promising natural gas resource for New York. In Pennsylvania, the Utica formation is below the Marcellus, however, the Utica Shale is not as deep in New York as it is in Pennsylvania. This suggests that the Utica Shale could be commercially attractive north of the New York Marcellus. On the other hand, there is no evidence that the New York Utica Shale is productive. Range Resources completed and tested a horizontal Utica well in western New York but the results are confidential. The only comment from Range is that they plan to drill additional Utica wells. Hence, prospects for the Utica Shale in New York are
Marcellus Prospects – Page 28
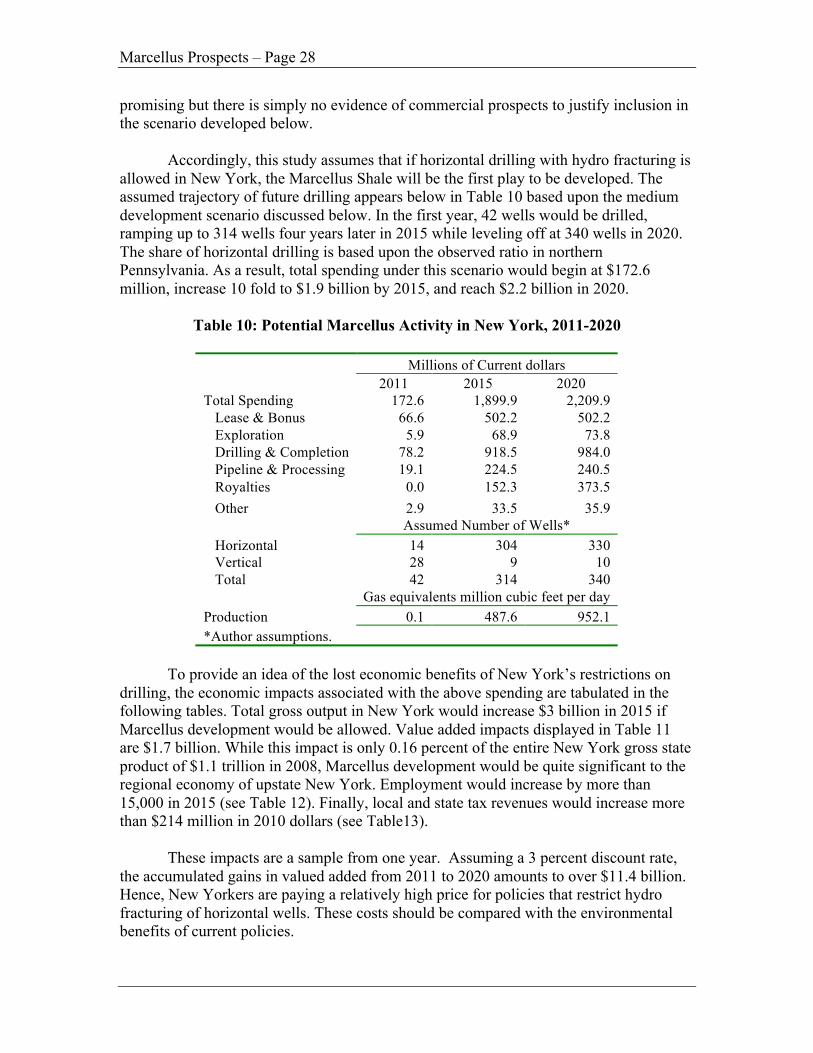
promising but there is simply no evidence of commercial prospects to justify inclusion in the scenario developed below. Accordingly, this study assumes that if horizontal drilling with hydro fracturing is allowed in New York, the Marcellus Shale will be the first play to be developed. The assumed trajectory of future drilling appears below in Table 10 based upon the medium development scenario discussed below. In the first year, 42 wells would be drilled, ramping up to 314 wells four years later in 2015 while leveling off at 340 wells in 2020. The share of horizontal drilling is based upon the observed ratio in northern Pennsylvania. As a result, total spending under this scenario would begin at $172.6 million, increase 10 fold to $1.9 billion by 2015, and reach $2.2 billion in 2020.
Table 10: Potential Marcellus Activity in New York, 2011-2020
Millions of Current dollars 2011 2015 2020 Total Spending 172.6 1,899.9 2,209.9
Lease & Bonus 66.6 502.2 502.2 Exploration 5.9 68.9 73.8 Drilling & Completion 78.2 918.5 984.0 Pipeline & Processing 19.1 224.5 240.5 Royalties 0.0 152.3 373.5 Other 2.9 33.5 35.9 Assumed Number of Wells* Horizontal 14 304 330 Vertical 28 9 10 Total 42 314 340 Gas equivalents million cubic feet per day
Production 0.1 487.6 952.1 *Author assumptions.
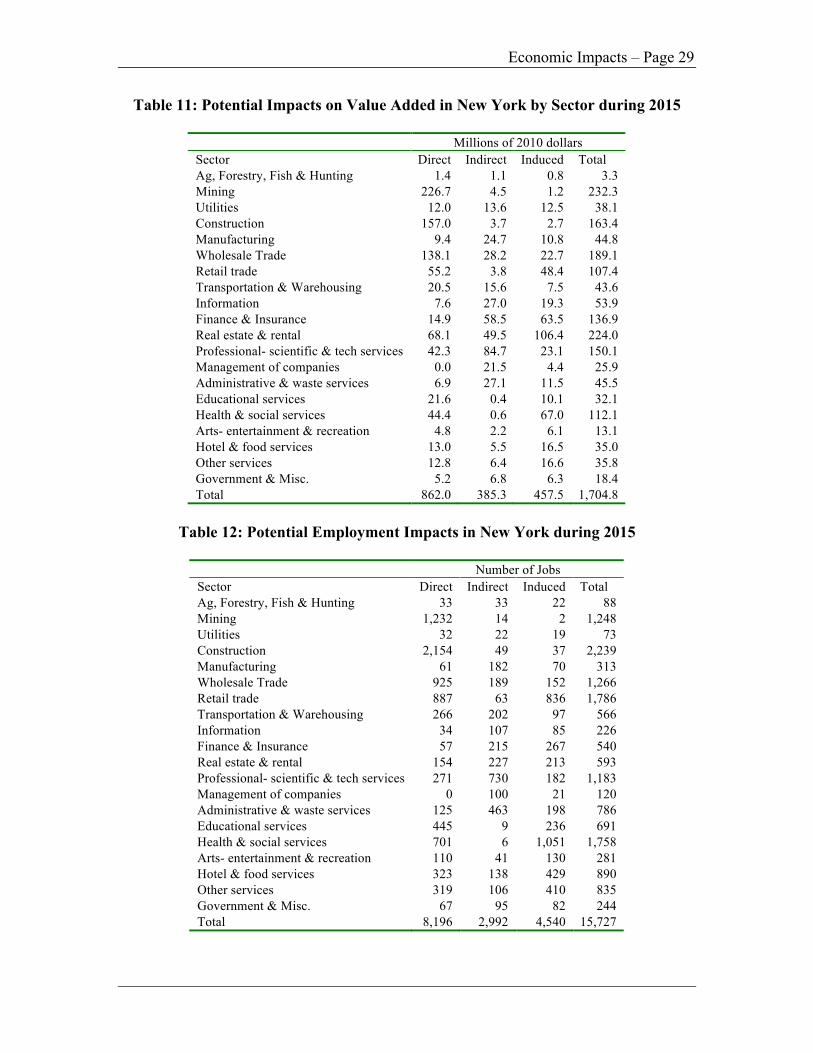
To provide an idea of the lost economic benefits of New York’s restrictions on drilling, the economic impacts associated with the above spending are tabulated in the following tables. Total gross output in New York would increase $3 billion in 2015 if Marcellus development would be allowed. Value added impacts displayed in Table 11 are $1.7 billion. While this impact is only 0.16 percent of the entire New York gross state product of $1.1 trillion in 2008, Marcellus development would be quite significant to the regional economy of upstate New York. Employment would increase by more than 15,000 in 2015 (see Table 12). Finally, local and state tax revenues would increase more than $214 million in 2010 dollars (see Table13).
These impacts are a sample from one year. Assuming a 3 percent discount rate, the accumulated gains in valued added from 2011 to 2020 amounts to over $11.4 billion. Hence, New Yorkers are paying a relatively high price for policies that restrict hydro fracturing of horizontal wells. These costs should be compared with the environmental benefits of current policies.
Economic Impacts – Page 29
Table 11: Potential Impacts on Value Added in New York by Sector during 2015
Millions of 2010 dollars Sector Direct Indirect Induced Total Ag, Forestry, Fish & Hunting 1.4 1.1 0.8 3.3 Mining 226.7 4.5 1.2 232.3 Utilities 12.0 13.6 12.5 38.1 Construction 157.0 3.7 2.7 163.4 Manufacturing 9.4 24.7 10.8 44.8 Wholesale Trade 138.1 28.2 22.7 189.1 Retail trade 55.2 3.8 48.4 107.4 Transportation & Warehousing 20.5 15.6 7.5 43.6 Information 7.6 27.0 19.3 53.9 Finance & Insurance 14.9 58.5 63.5 136.9 Real estate & rental 68.1 49.5 106.4 224.0 Professional- scientific & tech services 42.3 84.7 23.1 150.1 Management of companies 0.0 21.5 4.4 25.9 Administrative & waste services 6.9 27.1 11.5 45.5 Educational services 21.6 0.4 10.1 32.1 Health & social services 44.4 0.6 67.0 112.1 Arts- entertainment & recreation 4.8 2.2 6.1 13.1 Hotel & food services 13.0 5.5 16.5 35.0 Other services 12.8 6.4 16.6 35.8 Government & Misc. 5.2 6.8 6.3 18.4 Total 862.0 385.3 457.5 1,704.8
Table 12: Potential Employment Impacts in New York during 2015
Number of Jobs Sector Direct Indirect Induced Total Ag, Forestry, Fish & Hunting 33 33 22 88 Mining 1,232 14 2 1,248 Utilities 32 22 19 73 Construction 2,154 49 37 2,239 Manufacturing 61 182 70 313 Wholesale Trade 925 189 152 1,266 Retail trade 887 63 836 1,786 Transportation & Warehousing 266 202 97 566 Information 34 107 85 226 Finance & Insurance 57 215 267 540 Real estate & rental 154 227 213 593 Professional- scientific & tech services 271 730 182 1,183 Management of companies 0 100 21 120 Administrative & waste services 125 463 198 786 Educational services 445 9 236 691 Health & social services 701 6 1,051 1,758 Arts- entertainment & recreation 110 41 130 281 Hotel & food services 323 138 429 890 Other services 319 106 410 835 Government & Misc. 67 95 82 244 Total 8,196 2,992 4,540 15,727
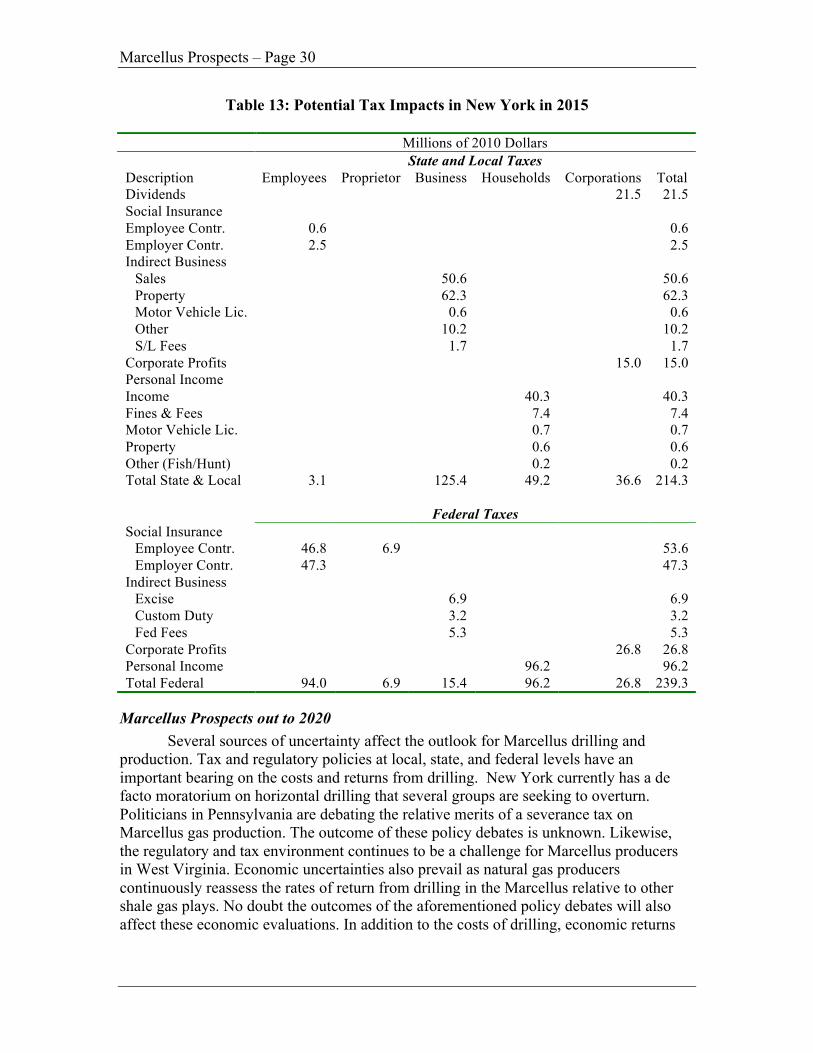
Marcellus Prospects – Page 30
Table 13: Potential Tax Impacts in New York in 2015 Millions of 2010 Dollars State and Local Taxes Description Employees Proprietor Business Households Corporations Total Dividends 21.5 21.5 Social Insurance Employee Contr. 0.6 0.6 Employer Contr. 2.5 2.5 Indirect Business
Sales 50.6 50.6 Property 62.3 62.3 Motor Vehicle Lic. 0.6 0.6 Other 10.2 10.2 S/L Fees 1.7 1.7
Corporate Profits 15.0 15.0 Personal Income Income 40.3 40.3 Fines & Fees 7.4 7.4 Motor Vehicle Lic. 0.7 0.7 Property 0.6 0.6 Other (Fish/Hunt) 0.2 0.2 Total State & Local 3.1 125.4 49.2 36.6 214.3 Federal Taxes Social Insurance
Employee Contr. 46.8 6.9 53.6 Employer Contr. 47.3 47.3
Indirect Business Excise 6.9 6.9 Custom Duty 3.2 3.2 Fed Fees 5.3 5.3
Corporate Profits 26.8 26.8 Personal Income 96.2 96.2 Total Federal 94.0 6.9 15.4 96.2 26.8 239.3
Marcellus Prospects out to 2020 Several sources of uncertainty affect the outlook for Marcellus drilling and production. Tax and regulatory policies at local, state, and federal levels have an important bearing on the costs and returns from drilling. New York currently has a de facto moratorium on horizontal drilling that several groups are seeking to overturn. Politicians in Pennsylvania are debating the relative merits of a severance tax on Marcellus gas production. The outcome of these policy debates is unknown. Likewise, the regulatory and tax environment continues to be a challenge for Marcellus producers in West Virginia. Economic uncertainties also prevail as natural gas producers continuously reassess the rates of return from drilling in the Marcellus relative to other shale gas plays. No doubt the outcomes of the aforementioned policy debates will also affect these economic evaluations. In addition to the costs of drilling, economic returns
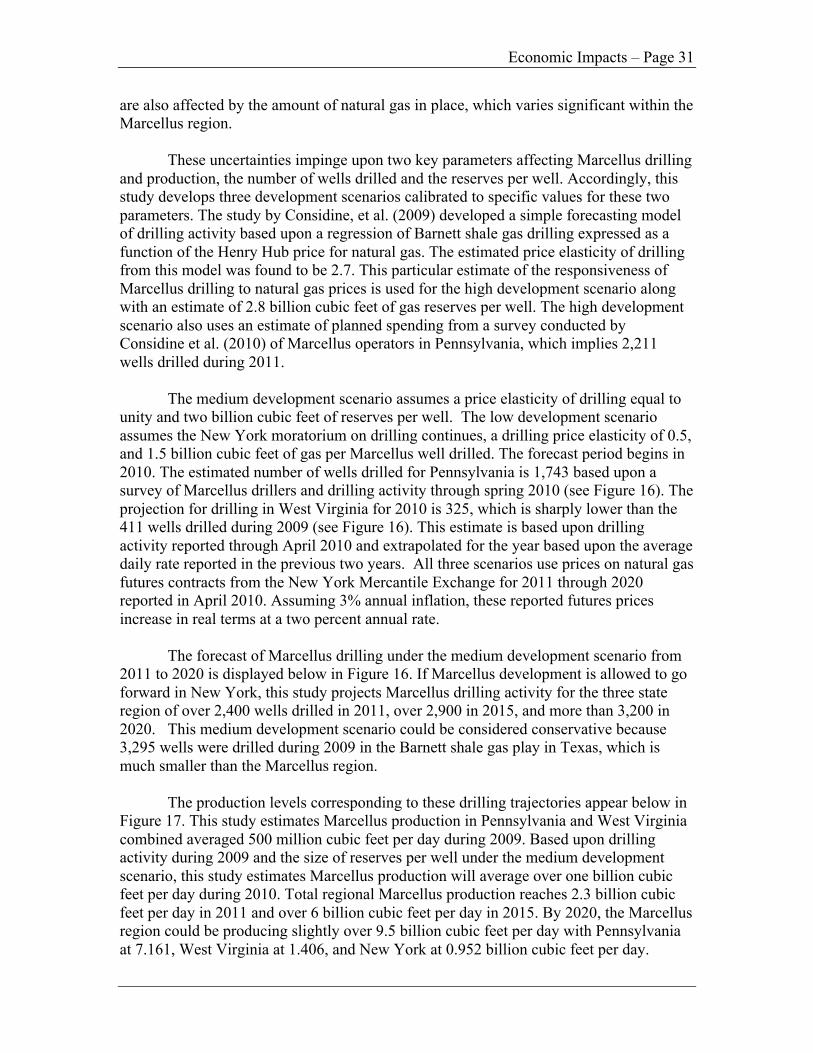
Economic Impacts – Page 31
are also affected by the amount of natural gas in place, which varies significant within the Marcellus region.
These uncertainties impinge upon two key parameters affecting Marcellus drilling
and production, the number of wells drilled and the reserves per well. Accordingly, this study develops three development scenarios calibrated to specific values for these two parameters. The study by Considine, et al. (2009) developed a simple forecasting model of drilling activity based upon a regression of Barnett shale gas drilling expressed as a function of the Henry Hub price for natural gas. The estimated price elasticity of drilling from this model was found to be 2.7. This particular estimate of the responsiveness of Marcellus drilling to natural gas prices is used for the high development scenario along with an estimate of 2.8 billion cubic feet of gas reserves per well. The high development scenario also uses an estimate of planned spending from a survey conducted by Considine et al. (2010) of Marcellus operators in Pennsylvania, which implies 2,211 wells drilled during 2011.
The medium development scenario assumes a price elasticity of drilling equal to
unity and two billion cubic feet of reserves per well. The low development scenario assumes the New York moratorium on drilling continues, a drilling price elasticity of 0.5, and 1.5 billion cubic feet of gas per Marcellus well drilled. The forecast period begins in 2010. The estimated number of wells drilled for Pennsylvania is 1,743 based upon a survey of Marcellus drillers and drilling activity through spring 2010 (see Figure 16). The projection for drilling in West Virginia for 2010 is 325, which is sharply lower than the 411 wells drilled during 2009 (see Figure 16). This estimate is based upon drilling activity reported through April 2010 and extrapolated for the year based upon the average daily rate reported in the previous two years. All three scenarios use prices on natural gas futures contracts from the New York Mercantile Exchange for 2011 through 2020 reported in April 2010. Assuming 3% annual inflation, these reported futures prices increase in real terms at a two percent annual rate.
The forecast of Marcellus drilling under the medium development scenario from
2011 to 2020 is displayed below in Figure 16. If Marcellus development is allowed to go forward in New York, this study projects Marcellus drilling activity for the three state region of over 2,400 wells drilled in 2011, over 2,900 in 2015, and more than 3,200 in 2020. This medium development scenario could be considered conservative because 3,295 wells were drilled during 2009 in the Barnett shale gas play in Texas, which is much smaller than the Marcellus region.
The production levels corresponding to these drilling trajectories appear below in Figure 17. This study estimates Marcellus production in Pennsylvania and West Virginia combined averaged 500 million cubic feet per day during 2009. Based upon drilling activity during 2009 and the size of reserves per well under the medium development scenario, this study estimates Marcellus production will average over one billion cubic feet per day during 2010. Total regional Marcellus production reaches 2.3 billion cubic feet per day in 2011 and over 6 billion cubic feet per day in 2015. By 2020, the Marcellus region could be producing slightly over 9.5 billion cubic feet per day with Pennsylvania at 7.161, West Virginia at 1.406, and New York at 0.952 billion cubic feet per day.
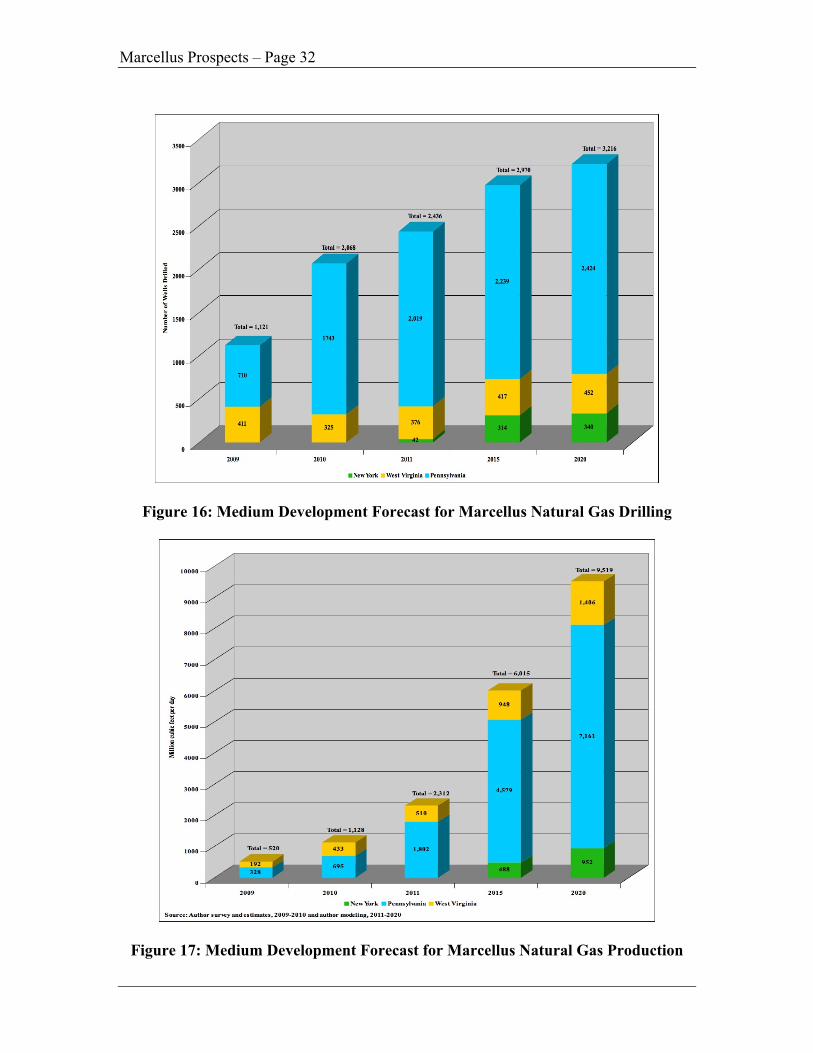
Marcellus Prospects – Page 32
Figure 16: Medium Development Forecast for Marcellus Natural Gas Drilling
Figure 17: Medium Development Forecast for Marcellus Natural Gas Production
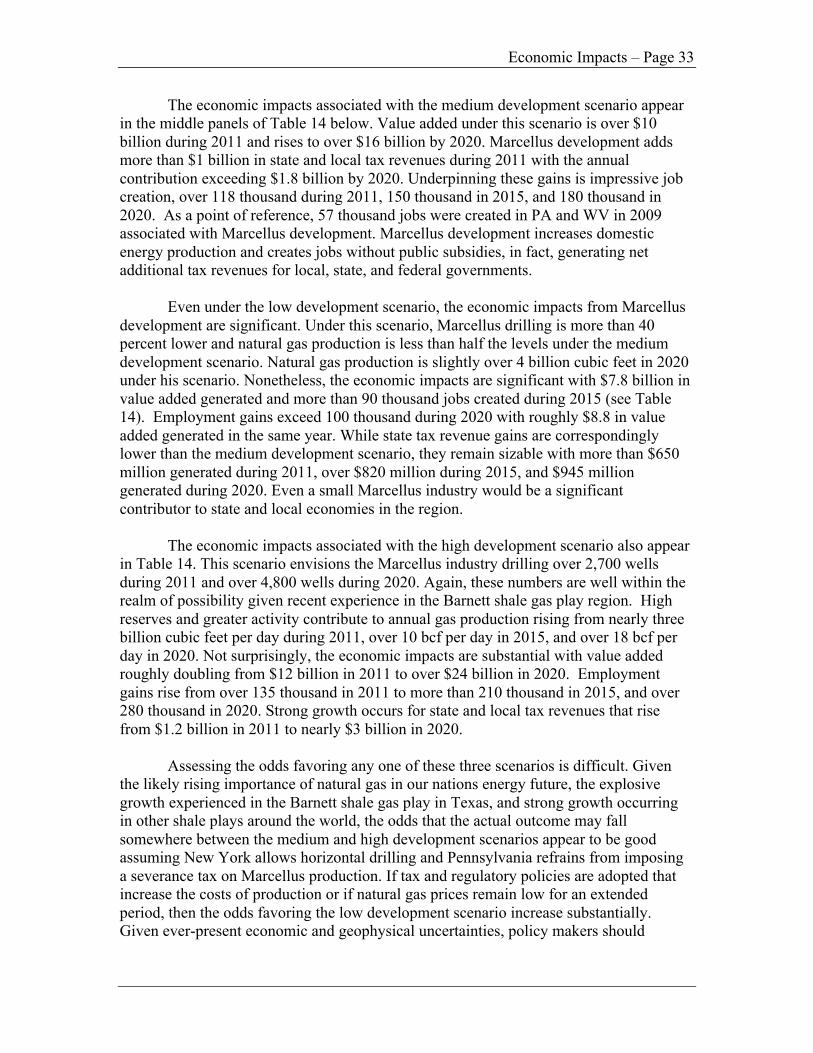
Economic Impacts – Page 33
The economic impacts associated with the medium development scenario appear in the middle panels of Table 14 below. Value added under this scenario is over $10 billion during 2011 and rises to over $16 billion by 2020. Marcellus development adds more than $1 billion in state and local tax revenues during 2011 with the annual contribution exceeding $1.8 billion by 2020. Underpinning these gains is impressive job creation, over 118 thousand during 2011, 150 thousand in 2015, and 180 thousand in 2020. As a point of reference, 57 thousand jobs were created in PA and WV in 2009 associated with Marcellus development. Marcellus development increases domestic energy production and creates jobs without public subsidies, in fact, generating net additional tax revenues for local, state, and federal governments.
Even under the low development scenario, the economic impacts from Marcellus development are significant. Under this scenario, Marcellus drilling is more than 40 percent lower and natural gas production is less than half the levels under the medium development scenario. Natural gas production is slightly over 4 billion cubic feet in 2020 under his scenario. Nonetheless, the economic impacts are significant with $7.8 billion in value added generated and more than 90 thousand jobs created during 2015 (see Table 14). Employment gains exceed 100 thousand during 2020 with roughly $8.8 in value added generated in the same year. While state tax revenue gains are correspondingly lower than the medium development scenario, they remain sizable with more than $650 million generated during 2011, over $820 million during 2015, and $945 million generated during 2020. Even a small Marcellus industry would be a significant contributor to state and local economies in the region. The economic impacts associated with the high development scenario also appear in Table 14. This scenario envisions the Marcellus industry drilling over 2,700 wells during 2011 and over 4,800 wells during 2020. Again, these numbers are well within the realm of possibility given recent experience in the Barnett shale gas play region. High reserves and greater activity contribute to annual gas production rising from nearly three billion cubic feet per day during 2011, over 10 bcf per day in 2015, and over 18 bcf per day in 2020. Not surprisingly, the economic impacts are substantial with value added roughly doubling from $12 billion in 2011 to over $24 billion in 2020. Employment gains rise from over 135 thousand in 2011 to more than 210 thousand in 2015, and over 280 thousand in 2020. Strong growth occurs for state and local tax revenues that rise from $1.2 billion in 2011 to nearly $3 billion in 2020.
Assessing the odds favoring any one of these three scenarios is difficult. Given the likely rising importance of natural gas in our nations energy future, the explosive growth experienced in the Barnett shale gas play in Texas, and strong growth occurring in other shale plays around the world, the odds that the actual outcome may fall somewhere between the medium and high development scenarios appear to be good assuming New York allows horizontal drilling and Pennsylvania refrains from imposing a severance tax on Marcellus production. If tax and regulatory policies are adopted that increase the costs of production or if natural gas prices remain low for an extended period, then the odds favoring the low development scenario increase substantially. Given ever-present economic and geophysical uncertainties, policy makers should
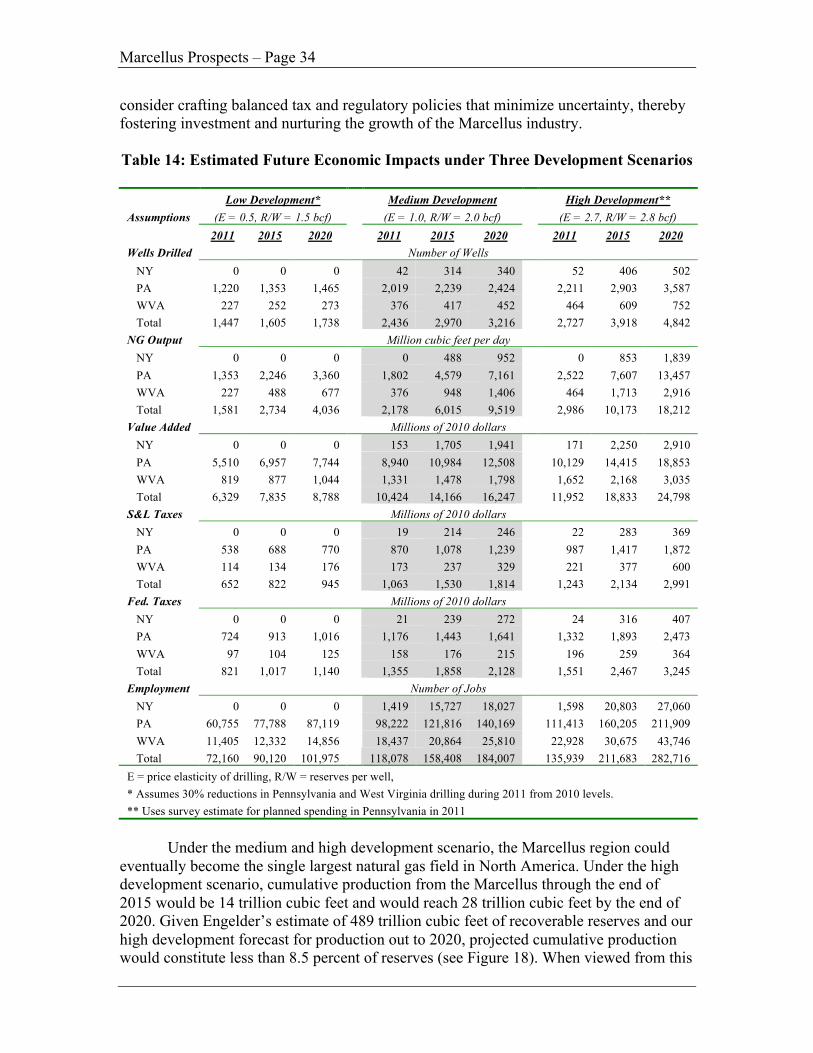
Marcellus Prospects – Page 34
consider crafting balanced tax and regulatory policies that minimize uncertainty, thereby fostering investment and nurturing the growth of the Marcellus industry.
Table 14: Estimated Future Economic Impacts under Three Development Scenarios
Low Development* Medium Development High Development** Assumptions (E = 0.5, R/W = 1.5 bcf) (E = 1.0, R/W = 2.0 bcf) (E = 2.7, R/W = 2.8 bcf) 2011 2015 2020 2011 2015 2020 2011 2015 2020 Wells Drilled Number of Wells
NY 0 0 0 42 314 340 52 406 502 PA 1,220 1,353 1,465 2,019 2,239 2,424 2,211 2,903 3,587 WVA 227 252 273 376 417 452 464 609 752 Total 1,447 1,605 1,738 2,436 2,970 3,216 2,727 3,918 4,842
NG Output Million cubic feet per day NY 0 0 0 0 488 952 0 853 1,839 PA 1,353 2,246 3,360 1,802 4,579 7,161 2,522 7,607 13,457 WVA 227 488 677 376 948 1,406 464 1,713 2,916 Total 1,581 2,734 4,036 2,178 6,015 9,519 2,986 10,173 18,212
Value Added Millions of 2010 dollars NY 0 0 0 153 1,705 1,941 171 2,250 2,910 PA 5,510 6,957 7,744 8,940 10,984 12,508 10,129 14,415 18,853 WVA 819 877 1,044 1,331 1,478 1,798 1,652 2,168 3,035 Total 6,329 7,835 8,788 10,424 14,166 16,247 11,952 18,833 24,798
S&L Taxes Millions of 2010 dollars NY 0 0 0 19 214 246 22 283 369 PA 538 688 770 870 1,078 1,239 987 1,417 1,872 WVA 114 134 176 173 237 329 221 377 600 Total 652 822 945 1,063 1,530 1,814 1,243 2,134 2,991
Fed. Taxes Millions of 2010 dollars NY 0 0 0 21 239 272 24 316 407 PA 724 913 1,016 1,176 1,443 1,641 1,332 1,893 2,473 WVA 97 104 125 158 176 215 196 259 364 Total 821 1,017 1,140 1,355 1,858 2,128 1,551 2,467 3,245
Employment Number of Jobs NY 0 0 0 1,419 15,727 18,027 1,598 20,803 27,060 PA 60,755 77,788 87,119 98,222 121,816 140,169 111,413 160,205 211,909 WVA 11,405 12,332 14,856 18,437 20,864 25,810 22,928 30,675 43,746 Total 72,160 90,120 101,975 118,078 158,408 184,007 135,939 211,683 282,716
E = price elasticity of drilling, R/W = reserves per well, * Assumes 30% reductions in Pennsylvania and West Virginia drilling during 2011 from 2010 levels. ** Uses survey estimate for planned spending in Pennsylvania in 2011
Under the medium and high development scenario, the Marcellus region could
eventually become the single largest natural gas field in North America. Under the high development scenario, cumulative production from the Marcellus through the end of 2015 would be 14 trillion cubic feet and would reach 28 trillion cubic feet by the end of 2020. Given Engelder’s estimate of 489 trillion cubic feet of recoverable reserves and our high development forecast for production out to 2020, projected cumulative production would constitute less than 8.5 percent of reserves (see Figure 18). When viewed from this
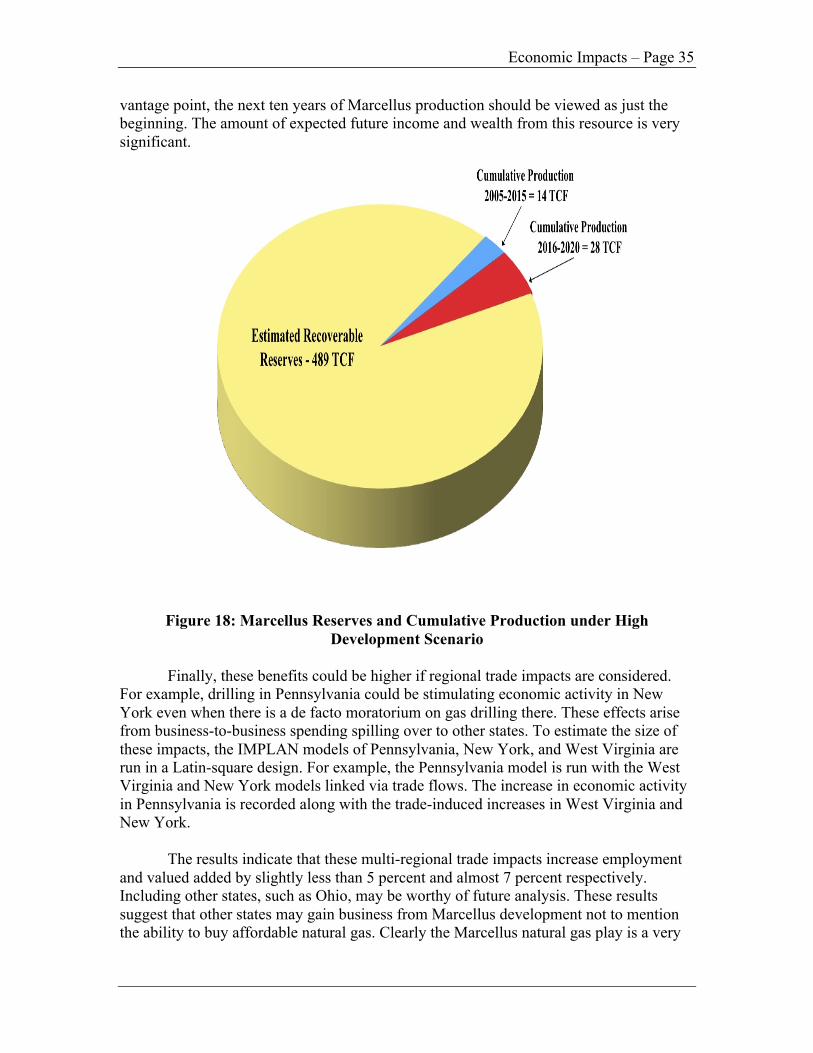
Economic Impacts – Page 35
vantage point, the next ten years of Marcellus production should be viewed as just the beginning. The amount of expected future income and wealth from this resource is very significant.
Figure 18: Marcellus Reserves and Cumulative Production under High
Development Scenario Finally, these benefits could be higher if regional trade impacts are considered.
For example, drilling in Pennsylvania could be stimulating economic activity in New York even when there is a de facto moratorium on gas drilling there. These effects arise from business-to-business spending spilling over to other states. To estimate the size of these impacts, the IMPLAN models of Pennsylvania, New York, and West Virginia are run in a Latin-square design. For example, the Pennsylvania model is run with the West Virginia and New York models linked via trade flows. The increase in economic activity in Pennsylvania is recorded along with the trade-induced increases in West Virginia and New York. The results indicate that these multi-regional trade impacts increase employment and valued added by slightly less than 5 percent and almost 7 percent respectively. Including other states, such as Ohio, may be worthy of future analysis. These results suggest that other states may gain business from Marcellus development not to mention the ability to buy affordable natural gas. Clearly the Marcellus natural gas play is a very
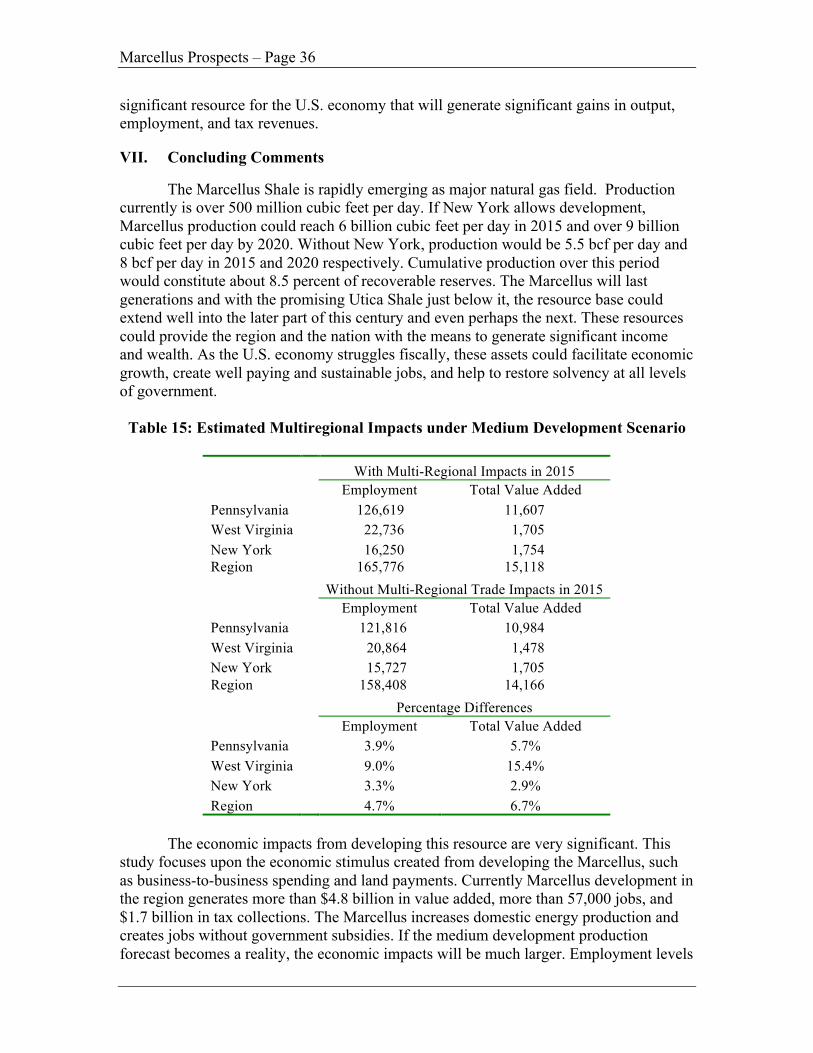
Marcellus Prospects – Page 36
significant resource for the U.S. economy that will generate significant gains in output, employment, and tax revenues.
VII. Concluding Comments
The Marcellus Shale is rapidly emerging as major natural gas field. Production currently is over 500 million cubic feet per day. If New York allows development, Marcellus production could reach 6 billion cubic feet per day in 2015 and over 9 billion cubic feet per day by 2020. Without New York, production would be 5.5 bcf per day and 8 bcf per day in 2015 and 2020 respectively. Cumulative production over this period would constitute about 8.5 percent of recoverable reserves. The Marcellus will last generations and with the promising Utica Shale just below it, the resource base could extend well into the later part of this century and even perhaps the next. These resources could provide the region and the nation with the means to generate significant income and wealth. As the U.S. economy struggles fiscally, these assets could facilitate economic growth, create well paying and sustainable jobs, and help to restore solvency at all levels of government.
Table 15: Estimated Multiregional Impacts under Medium Development Scenario
With Multi-Regional Impacts in 2015 Employment Total Value Added Pennsylvania 126,619 11,607 West Virginia 22,736 1,705 New York 16,250 1,754 Region 165,776 15,118 Without Multi-Regional Trade Impacts in 2015 Employment Total Value Added Pennsylvania 121,816 10,984 West Virginia 20,864 1,478 New York 15,727 1,705 Region 158,408 14,166 Percentage Differences Employment Total Value Added Pennsylvania 3.9% 5.7% West Virginia 9.0% 15.4% New York 3.3% 2.9% Region 4.7% 6.7%
The economic impacts from developing this resource are very significant. This study focuses upon the economic stimulus created from developing the Marcellus, such as business-to-business spending and land payments. Currently Marcellus development in the region generates more than $4.8 billion in value added, more than 57,000 jobs, and $1.7 billion in tax collections. The Marcellus increases domestic energy production and creates jobs without government subsidies. If the medium development production forecast becomes a reality, the economic impacts will be much larger. Employment levels
Economic Impacts – Page 37
in 2020 would be more than 180,000 higher, and gross regional product almost $16 billion higher. The accumulated gains in valued added over the forecast period for this scenario is $116 billion in present value terms. Regulatory policy is a significant factor affecting this outlook. Current policies in New York that restrict Marcellus development cost that state more than $11 billion in lost economic output between 2011 and 2020 – a very high opportunity cost to New Yorkers of the de facto drilling moratorium. A more rational approach to balancing costs and benefits could improve overall social wellbeing. Severance tax policy also is an important issue. Currently Marcellus drilling is soaring in Pennsylvania and falling in West Virginia. While other factors may account for this stark difference, the absence of a severance tax in Pennsylvania may account for a significant share of this difference. If the public demands severance tax collections, policy makers need to keep in mind the unique features of unconventional gas production. Simply put, maintaining production growth is like running on a treadmill, slowdown drilling and production quickly slips back. Societal welfare is improved with policies that encourage the growth of the industry, the economy, and ultimately the tax base.
Marcellus Prospects – Page 38
References
Allegheny Conference (2009) “The Economic Impact of the Oil and Gas Industry in Pennsylvania,” Allegheny Conference on Community Development, June.
Baumann, Robert H., D.E. Dismukes, D.V. Mesyanzhinov, and A.G. Pulsipher (2002)
“Analysis of the Economic Impact Associated with Oil and Gas Activities on State Leases,” Louisiana State University Center for Energy Studies, Baton Rouge, La. 11 pgs.
Considine, T.J. (2010) “The Economic Impacts of the Pennsylvania Marcellus Shale
Natural Gas Play: An Update,” The Pennsylvania State University, Department of Energy and Mineral Engineering, 21 pages.
Engelder, T. (2010) “Marcellus 2008: Report card on the breakout year for gas
production in the Appalachian Basin,” Fort Worth Basin Oil and Gas Magazine 29, May.
IHS Global Insight, (2009) “Measuring the Economic and Energy Impacts of Proposals
to Regulate Hydraulic Fracturing,” 17 pages. Marcellus Shale Committee, (2009) “MSC Industry Progress Report Survey Results,”
May 18. Miller, R.E. and P.D. Blair (2009) Input-output Analysis Foundations and Extensions Cambridge University Press in 2009 , 2nd Revised edition. National Petroleum Council (2007) “Unconventional Gas,” Topic Paper #29. Potential Gas Committee (2008) Potential Supply of Natural Gas in the United States
(December 31, 2008) Potential Gas Agency, Colorado School of Mines, Golden, CO 80401-1887.
Snead, Mark C. (2002) “The Economic Impact of Oil and Gas production and Drilling on
the Oklahoma Economy.” Office of Business and Economic Research, College of Business Administration, Oklahoma State University, 22 pgs.
United States Geological Survey (2002) “Assessment of Undiscovered Oil and Gas
Resources of the Appalachian Province,” U.S. Department of Interior, Open-File Report 2008–1287.
Walker, D. and N. Sonora (2005) “The Economic Impacts of the Natural Gas Industry in
La Plata County, 2003-2004.” School of Business Administration, Fort Lewis College, Durango, CO. 18 pgs.