aperiodicity extraction and control using mixed mode ... voice training systems, santarosa, ca...
TRANSCRIPT

2nd MAVEBA, September 13-15, 2001, Firenze, Italy
Aperiodicity extraction and control using mixed mode excitation andgroup delay manipulation for a high quality speech analysis, modification
and synthesis system STRAIGHT
Hideki Kawaharaab ∗, Jo Estillc and Osamu Fujimurad
aFaculty of Systems Engineering, Wakayama University, 930 Sakaedani, Wakayama, 640-8510 JapanbInformation Sciences Division, ATR, Hikaridai Seika-cho, Kyoto, 619-0288 Japan
cEstill Voice Training Systems, SantaRosa, CA 95403, U.S.A.dDepartment of Speech & Hearing Science, The Ohio State University, Columbus, OH, 43210-1002 U.S.A.
Abstract
A new control paradigm of source signals for high quality speech synthesis is introduced to handle a variety of speech quality, based on time-frequency analyses by the use of an instantaneous frequency and group delay. The proposed signal representation consists of a frequency domainaperiodicity measure and a time domain energy concentration measure to represent source attributes, which supplement the conventional sourceinformation, such as F0 and power. The frequency domain aperiodicity measure is defined as a ratio between the lower and upper smoothedspectral envelopes to represent the relative energy distribution of aperiodic components. The time domain measure is defined as an effectiveduration of the aperiodic component. These aperiodicity parameters and F0 as time functions are used to generate the source signal for syntheticspeech by controlling relative noise levels and the temporal envelope of the noise component of the mixed mode excitation signal, includingfine timing and amplitude fluctuations. A series of preliminary simulation experiments was conducted to test and to demonstrate consistencyof the proposed method. Examples sung in different voice qualities were also analyzed and resynthesized using the proposed method.
Keywords: Fundamental frequency; Voice perturbation; Instantaneous frequency; Group delay; Aperiodicity; Fluctuation
1. Introduction
This paper introduces a new analysis and control paradigmof source signals for high quality speech synthesis. A speechsynthesis system that allows flexible and precise control ofperceptually relevant signal parameters without introducingquality degradation due to such manipulations is potentiallyvery useful for understanding voice emission and perception.A software system called STRAIGHT[1,2] (Speech Trans-formation and Representation based on Adaptive Interpola-tion of weiGHTed spectrogram) was designed to provide auseful research tool to meet such demands. Even though theprimary advantage of using STRAIGHT is its F 0-adaptivetime-frequency amplitude representation, the importance oftemporal aspects of source information (in other words finetemporal structure) is becoming more and more clear.
It is important to mention that the conventional source at-tributes, such as jitter and shimmer, can well be representedin the extracted F0 and the time-frequency spectral envelope,because these parameters extracted in STRAIGHT system∗The primary investigator is in the Auditory Brain Project of CREST. Hiswork is supported by CREST (Core Research for Evolving Science andTechnology) of Japan Science and Technology Corporation. It is partly sup-ported by MEXT (Ministry of Education, Culture, Sports, Science and Tech-nology) grant (C) 11650425. E-mail address: [email protected]
have enough temporal resolution to represent cycle-by-cycleparameter fluctuations. Aperiodicity discussed in this paperis represented in terms of more detailed source attributes[3]which are still perceptually significant.
2. A brief sketch of STRAIGHT
STRAIGHT is a channel VOCODER based on advancedF0 adaptive procedures. The procedures are grouped intothree subsystems; a source information extractor, a smoothedtime-frequency representation extractor, and a synthesis en-gine consisting of an excitation source and a time varying fil-ter. Outline of the second and the third component are givenin the following paragraph. Principles and implementationalissues in source information extractor, which also are centralissues in this paper, are described in the next section.
Separating speech information into mutually independentfilter parameters and source parameters is important for flexi-ble speech manipulation. A F0 adaptive complimentary timewindow pair and F0 adaptive spectral smoothing based ona cardinal B-spline basis function effectively remove inter-ferences due to signal periodicity from the time-frequencyrepresentation of the signal. The time varying filter is imple-mented as the minimum phase impulse response calculatedfrom the smoothed time-frequency representation through
MAVEBA 2001, Firenze, Italy 59
ISCA Archivehttp://www.isca-speech.org/archive
Models and Analysis of Vocal Emissions forBiomedical Applications (MAVEBA)
2nd
International WorkshopFlorence, Italy
September 13-15, 2001

2 Kawahara, Estill & Fujimura / 2nd MAVEBA, September 13-15, 2001, Firenze, Italy
several stages of FFTs. This FFT-based implementation en-ables source F0 control with a finer frequency resolution thanthat is determined by the sampling interval of the speech sig-nal. This implementation also enables suppression of “buzz-like” timbre, which is common in conventional pulse excita-tion, by introducing group delay randomization in the higherfrequency region. However, in previous studies, there wasno dependable methodology to extract control parameters ofthis group delay randomization from the speech signal un-der study. This paper introduces new procedures to extendthe source information extractor and the excitation source ofSTRAIGHT to solve this problem.
3. Source information extraction and control
This section briefly introduces tools for source informationextraction using instantaneous frequency and group delay askey concepts[4]. Source information extracted in this stageconsists of the F0 and aperiodicity measures both in the fre-quency and in the time domain. Both source information ex-traction procedures in the frequency domain and in the timedomain also rely on a concept called fixed point, which isdescribed in the next paragraph.
3.1. Fixed point
Imagine a following situation; When you steer a stirringwheel of a car 30 degrees to the left, the car moves its direc-tion 10 degrees to the left. When you steer the steering wheel20 degrees to the right, the car moves 9 degrees to the right.Then you can expect that there can be a special steering an-gle that moves the car’s direction exactly the same angle withthe steering wheel. The angle is an example of fixed point.Mathematically, fixed point is defined as a point x that hasthe following property.
F (x) = x, (1)
where F ( ) is a mapping. It is known that there is a uniquefixed point, if the mapping is continuous and contracting.
This situation holds when a sinusoidal component is lo-cated around the center of a band-pass filter, and when asound burst is located around the center of a time window.In the following paragraphs, the former case is used in thefrequency domain analysis and the latter case is used in thetime domain analysis.
3.2. Frequency domain analysis
Speech signals are not exactly periodic. F 0s and wave-forms are always changing and fluctuating. The instanta-neous frequency based F0 extraction method used in thispaper was proposed[5] to represent these nonstationaryspeech behavior and was designed to produce continuousand high-resolution F0 trajectories suitable for high-qualityspeech modifications. The estimation of the aperiodicitymeasures in the frequency domain is dependent on this ini-tial F0 estimate, which is based on a fixed point analysis of amapping from filter center frequencies to their output instan-taneous frequencies.
3.2.1. F0 estimation
The F0 estimation method of STRAIGHT assumes that thesignal has the following nearly harmonic structure.
x(t) =
N∑k=1
ak(t) cos
(∫ t
0(kω0(τ) + ωk(τ))dτ + φk(0)
), (2)
where ak(t) represents a slowly changing instantaneous am-plitude. ωk(τ) also represents slowly changing perturbationof the k-th harmonic component. In this representation, F 0 isthe instantaneous frequency of the fundamental componentwhere k = 1. The F0 extraction procedure also uses instan-taneous frequencies of other harmonic components to refineF0 estimates.
By using band-pass filters with complex number impulseresponses, filter center frequencies and instantaneous fre-quencies of filter outputs provide an interesting means for thesinusoidal component extraction. Let λ(ωc, t) be the mappingfrom the filter center angular frequency ω c to the instanta-neous frequency of filter output. Then, angular frequenciesof sinusoidal components are extracted as a set of fixed pointsΨ based on the following definition.
Ψ(t) = {ψ | λ(ψ, t) = ψ, −1 <∂
∂ψ(λ(ψ, t) − ψ) < 0}. (3)
This relation between filter center frequencies and har-monic components were reported by number of authors[6,7].Similar relation to resonant frequencies was also described inmodeling auditory perception[8]. In addition to these find-ings, a geometrical properties of the mapping around fixedpoints was found very useful in source information analy-sis[5].
The signal to noise ratio of the sinusoidal component andthe background noise (represented as C/N: carrier to noise ra-tio hereafter) is approximately represented using ∂λ
∂ψand ∂λ
∂ψt .Please refer to [5] for details. Combined with this C/N esti-mation method, the following nearly isotropic filter impulseresponse is designed.
ws(t, ωc) = (w(t, ωc) � h(t, ωc)) e jωct , (4)
w(t, ωc) = exp(−ω2ct2/4πη2),
h(t, ωc) = max
{0, 1 −
∣∣∣∣∣ ωct2πη
∣∣∣∣∣}, (5)
where � represents convolution and η represents a timestretching factor, that is slightly larger than 1 to refine fre-quency resolution (1.2 is used in the current implementation).With a log-linear arrangement of filters (6 filters in one oc-tave), fundamental harmonic component can be selected asthe fixed point having the highest C/N. Finally, the initial F 0
estimate is used to select several (in our case, lower three)harmonic components for refining F 0 estimate using C/N andthe instantaneous frequency for each harmonic component.
Figure 1 shows an example to illustrate how the log-linearfilter arrangement makes the fundamental component relatedfixed point salient. It is clearly seen that the mappings stayflat only around the fundamental component.
2
MAVEBA 2001, Firenze, Italy 60
Kawahara, Estill & Fujimura / 2nd MAVEBA, September 13-15, 2001, Firenze, Italy 3
102
103
102
103
Filter center frequency (Hz)
Out
put i
nsta
ntan
eous
freq
uenc
y (H
z)
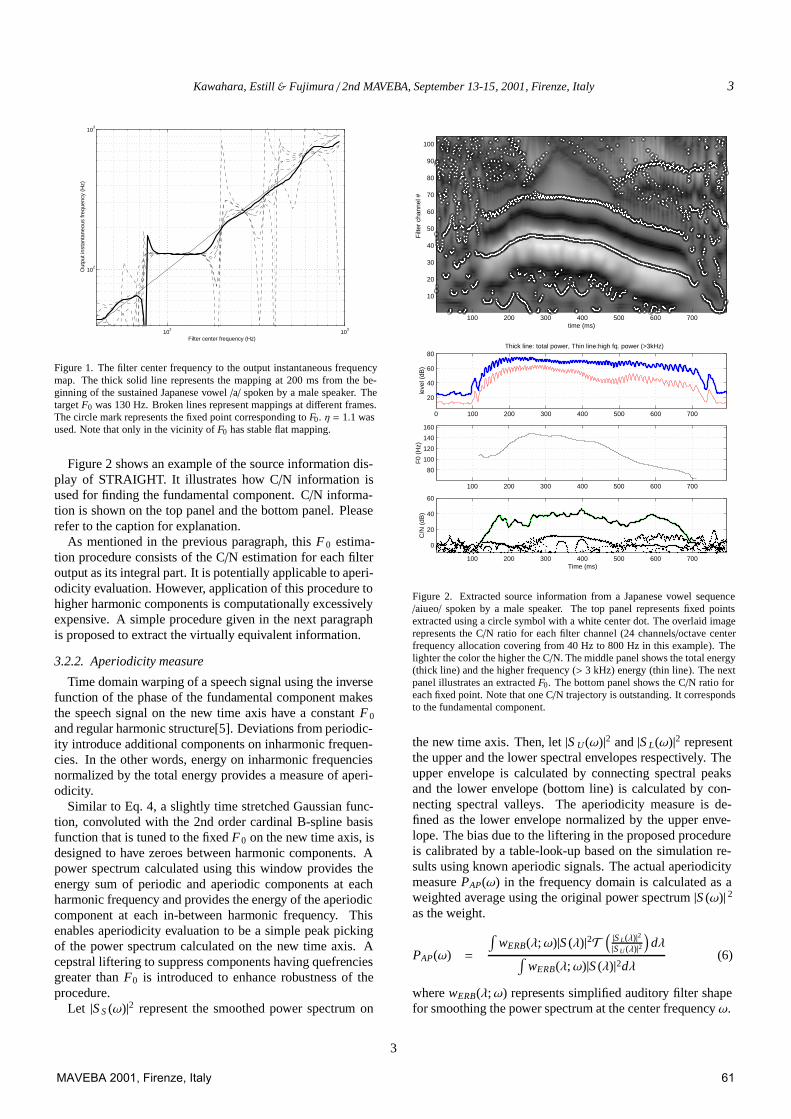
Figure 1. The filter center frequency to the output instantaneous frequencymap. The thick solid line represents the mapping at 200 ms from the be-ginning of the sustained Japanese vowel /a/ spoken by a male speaker. Thetarget F0 was 130 Hz. Broken lines represent mappings at different frames.The circle mark represents the fixed point corresponding to F0. η = 1.1 wasused. Note that only in the vicinity of F0 has stable flat mapping.
Figure 2 shows an example of the source information dis-play of STRAIGHT. It illustrates how C/N information isused for finding the fundamental component. C/N informa-tion is shown on the top panel and the bottom panel. Pleaserefer to the caption for explanation.
As mentioned in the previous paragraph, this F 0 estima-tion procedure consists of the C/N estimation for each filteroutput as its integral part. It is potentially applicable to aperi-odicity evaluation. However, application of this procedure tohigher harmonic components is computationally excessivelyexpensive. A simple procedure given in the next paragraphis proposed to extract the virtually equivalent information.
3.2.2. Aperiodicity measure
Time domain warping of a speech signal using the inversefunction of the phase of the fundamental component makesthe speech signal on the new time axis have a constant F 0
and regular harmonic structure[5]. Deviations from periodic-ity introduce additional components on inharmonic frequen-cies. In the other words, energy on inharmonic frequenciesnormalized by the total energy provides a measure of aperi-odicity.
Similar to Eq. 4, a slightly time stretched Gaussian func-tion, convoluted with the 2nd order cardinal B-spline basisfunction that is tuned to the fixed F 0 on the new time axis, isdesigned to have zeroes between harmonic components. Apower spectrum calculated using this window provides theenergy sum of periodic and aperiodic components at eachharmonic frequency and provides the energy of the aperiodiccomponent at each in-between harmonic frequency. Thisenables aperiodicity evaluation to be a simple peak pickingof the power spectrum calculated on the new time axis. Acepstral liftering to suppress components having quefrenciesgreater than F0 is introduced to enhance robustness of theprocedure.
Let |S S (ω)|2 represent the smoothed power spectrum on
time (ms)
Filt
er c
hann
el #
100 200 300 400 500 600 700
10
20
30
40
50
60
70
80
90
100
0 100 200 300 400 500 600 700
20
40
60
80
leve
l (dB
)
Thick line: total power, Thin line:high fq. power (>3kHz)
100 200 300 400 500 600 700
80
100
120
140
160
F0
(Hz)
100 200 300 400 500 600 700
0
20
40
60
Time (ms)
C/N
(dB
)
Figure 2. Extracted source information from a Japanese vowel sequence/aiueo/ spoken by a male speaker. The top panel represents fixed pointsextracted using a circle symbol with a white center dot. The overlaid imagerepresents the C/N ratio for each filter channel (24 channels/octave centerfrequency allocation covering from 40 Hz to 800 Hz in this example). Thelighter the color the higher the C/N. The middle panel shows the total energy(thick line) and the higher frequency (> 3 kHz) energy (thin line). The nextpanel illustrates an extracted F0. The bottom panel shows the C/N ratio foreach fixed point. Note that one C/N trajectory is outstanding. It correspondsto the fundamental component.
the new time axis. Then, let |S U(ω)|2 and |S L(ω)|2 representthe upper and the lower spectral envelopes respectively. Theupper envelope is calculated by connecting spectral peaksand the lower envelope (bottom line) is calculated by con-necting spectral valleys. The aperiodicity measure is de-fined as the lower envelope normalized by the upper enve-lope. The bias due to the liftering in the proposed procedureis calibrated by a table-look-up based on the simulation re-sults using known aperiodic signals. The actual aperiodicitymeasure PAP(ω) in the frequency domain is calculated as aweighted average using the original power spectrum |S (ω)| 2as the weight.
PAP(ω) =
∫wERB(λ;ω)|S (λ)|2T
( |S L(λ)|2|S U (λ)|2
)dλ∫
wERB(λ;ω)|S (λ)|2dλ(6)
where wERB(λ;ω) represents simplified auditory filter shapefor smoothing the power spectrum at the center frequency ω.
3
MAVEBA 2001, Firenze, Italy 61
4 Kawahara, Estill & Fujimura / 2nd MAVEBA, September 13-15, 2001, Firenze, Italy
115 120 125 130 135 140 145 150 155 160 165 170
120
130
140
150
160
170
180
190
energy centroid location (ms)
win
dow
cen
ter
loca
tion
(ms)
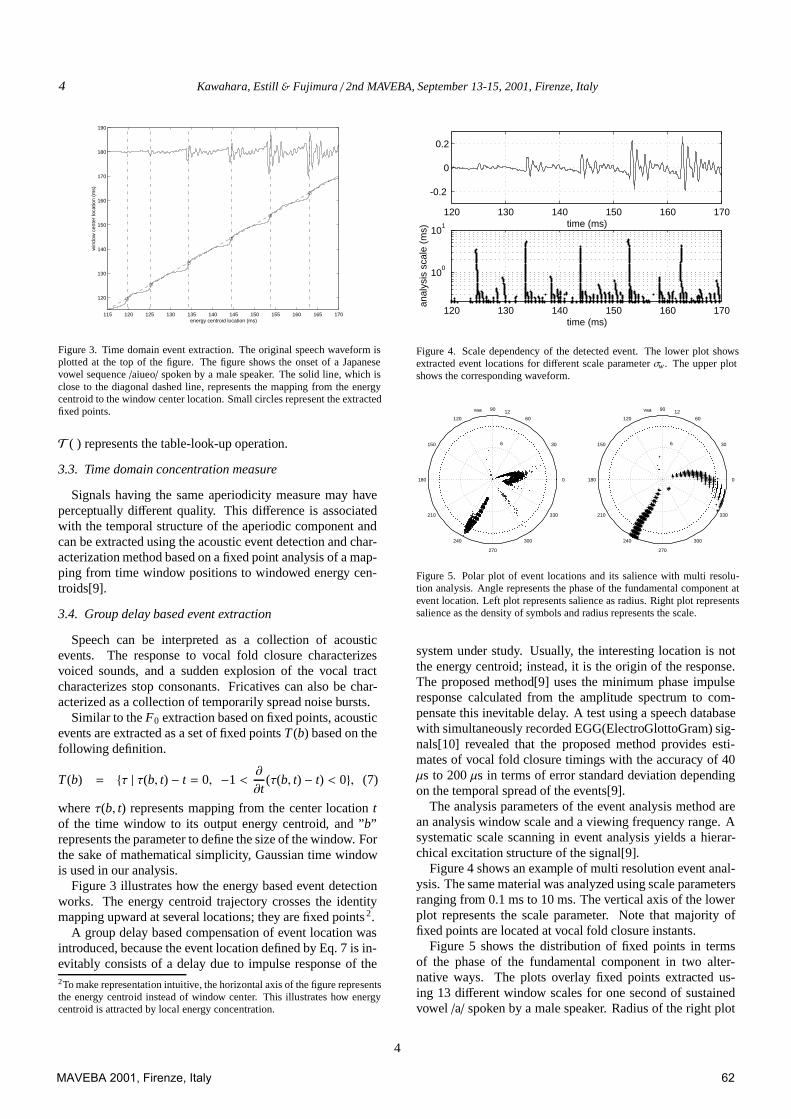
Figure 3. Time domain event extraction. The original speech waveform isplotted at the top of the figure. The figure shows the onset of a Japanesevowel sequence /aiueo/ spoken by a male speaker. The solid line, which isclose to the diagonal dashed line, represents the mapping from the energycentroid to the window center location. Small circles represent the extractedfixed points.
T ( ) represents the table-look-up operation.
3.3. Time domain concentration measure
Signals having the same aperiodicity measure may haveperceptually different quality. This difference is associatedwith the temporal structure of the aperiodic component andcan be extracted using the acoustic event detection and char-acterization method based on a fixed point analysis of a map-ping from time window positions to windowed energy cen-troids[9].
3.4. Group delay based event extraction
Speech can be interpreted as a collection of acousticevents. The response to vocal fold closure characterizesvoiced sounds, and a sudden explosion of the vocal tractcharacterizes stop consonants. Fricatives can also be char-acterized as a collection of temporarily spread noise bursts.
Similar to the F0 extraction based on fixed points, acousticevents are extracted as a set of fixed points T (b) based on thefollowing definition.
T (b) = {τ | τ(b, t) − t = 0, −1 <∂
∂t(τ(b, t) − t) < 0}, (7)
where τ(b, t) represents mapping from the center location tof the time window to its output energy centroid, and ”b”represents the parameter to define the size of the window. Forthe sake of mathematical simplicity, Gaussian time windowis used in our analysis.
Figure 3 illustrates how the energy based event detectionworks. The energy centroid trajectory crosses the identitymapping upward at several locations; they are fixed points 2.
A group delay based compensation of event location wasintroduced, because the event location defined by Eq. 7 is in-evitably consists of a delay due to impulse response of the2To make representation intuitive, the horizontal axis of the figure representsthe energy centroid instead of window center. This illustrates how energycentroid is attracted by local energy concentration.
120 130 140 150 160 170
100
101
time (ms)
anal
ysis
sca
le (
ms)
120 130 140 150 160 170
-0.2
0
0.2
time (ms)
Figure 4. Scale dependency of the detected event. The lower plot showsextracted event locations for different scale parameter σw. The upper plotshows the corresponding waveform.
vaa
6
12
30
210
60
240
90
270
120
300
150
330
180 0
vaa
6
12
30
210
60
240
90
270
120
300
150
330
180 0
Figure 5. Polar plot of event locations and its salience with multi resolu-tion analysis. Angle represents the phase of the fundamental component atevent location. Left plot represents salience as radius. Right plot representssalience as the density of symbols and radius represents the scale.
system under study. Usually, the interesting location is notthe energy centroid; instead, it is the origin of the response.The proposed method[9] uses the minimum phase impulseresponse calculated from the amplitude spectrum to com-pensate this inevitable delay. A test using a speech databasewith simultaneously recorded EGG(ElectroGlottoGram) sig-nals[10] revealed that the proposed method provides esti-mates of vocal fold closure timings with the accuracy of 40µs to 200 µs in terms of error standard deviation dependingon the temporal spread of the events[9].
The analysis parameters of the event analysis method arean analysis window scale and a viewing frequency range. Asystematic scale scanning in event analysis yields a hierar-chical excitation structure of the signal[9].
Figure 4 shows an example of multi resolution event anal-ysis. The same material was analyzed using scale parametersranging from 0.1 ms to 10 ms. The vertical axis of the lowerplot represents the scale parameter. Note that majority offixed points are located at vocal fold closure instants.
Figure 5 shows the distribution of fixed points in termsof the phase of the fundamental component in two alter-native ways. The plots overlay fixed points extracted us-ing 13 different window scales for one second of sustainedvowel /a/ spoken by a male speaker. Radius of the right plot
4
MAVEBA 2001, Firenze, Italy 62

Kawahara, Estill & Fujimura / 2nd MAVEBA, September 13-15, 2001, Firenze, Italy 5
Table 1Average fundamental frequencies and their standard deviations. (Hz) Statis-tics were calculated for each selected portion of one second in length.
File name Average F0 S.D of F0 IDJ1SPEECH.WAV 210.3 3.45 j01J2SPEECH.WAV 212.0 3.65 j02JSPEECH3.WAV 333.0 2.23 j03JFALSETT.WAV 336.0 2.57 j04JSOB349.WAV 340.4 8.97 j05JNASALTW.WAV 334.0 2.91 j06JORALTWA.WAV 334.8 3.78 j07JOPERA34.WAV 341.0 3.75 j08JBELTING.WAV 330.7 3.19 j09JFALSET2.WAV 520.8 2.46 j10
represents the scale parameter using logarithmic conversion20 log(σwF0) + 30. A clear alignment of fixed points around240 degree corresponds to closure of vocal fold and the otheralignment around 0 degree seems to corresponds to its open-ing. By using these hierarchical representations and the fre-quency domain aperiodicity measure, a method to design ex-citation source can be derived.
3.5. Excitation source control
Intervals between excitation pulses are controlled basedon the extracted F0 trajectory. The fractional interval con-trol is implemented by linear phase rotation in the frequencydomain. Jitter is implicitly implemented at this stage. (Shim-mer is also implicitly implemented as level fluctuations of thefilter impulse responses.) The additional aperiodic attributesare implemented by shaping a frequency and time dependentnoise. The frequency domain aperiodicity measure controlsthe spectral shape of the noise and the time domain concen-tration measure defines the temporal envelope of the noise.An interesting representation of the temporal shape is expo-nential envelope, because it can be controlled using only oneparameter. It is also interesting, because it can implementtemporal asymmetry, which was found to have perceptuallysignificant effects.
4. Analysis examples
This section illustrates analysis examples using the pro-posed method for materials sang using several different voicequalities. The materials were produced by one of the authors,and recorded in an anechoic chamber in OSU.
4.1. Summary statistics
Table 1 shows voice sample file names and their F 0 statis-tics. IDs in the table are referred in the following plots. File-names represent voice qualities.
4.2. Frequency domain aperiodicity analysis
Figure 6 shows relative level of aperiodicity component ineach frequency band. Random signals have 0dB aperiodicitylevel. Generally, frequency bands higher than 3kHz mainly
102
103
104
-50
-40
-30
-20
-10
0j01
frequency (Hz)10
210
310
4-50
-40
-30
-20
-10
0j02
frequency (Hz)
102
103
104
-50
-40
-30
-20
-10
0j03
frequency (Hz)10
210
310
4-50
-40
-30
-20
-10
0j04
frequency (Hz)
102
103
104
-50
-40
-30
-20
-10
0j05
frequency (Hz)10
210
310
4-50
-40
-30
-20
-10
0j06
frequency (Hz)
102
103
104
-50
-40
-30
-20
-10
0j07
frequency (Hz)10
210
310
4-50
-40
-30
-20
-10
0j08
frequency (Hz)
102
103
104
-50
-40
-30
-20
-10
0j09
frequency (Hz)10
210
310
4-50
-40
-30
-20
-10
0j10
frequency (Hz)
Figure 6. Frequency domain representation of average aperiodicity. Verticalaxis represents relative level of aperiodic component. Horizontal axis is log-linearly scaled frequency.
consist of aperiodic components. It also suggests that thereare several classes, in which frequency pattern of aperiodicitymeasure can be categorized.
4.3. Time domain aperiodicity analysis
Figure 7 shows normalized energy concentration as a func-tion of the phase of fundamental component. The analysisscale parameter was systematically scanned from 0.04/F 0 to0.11/F0 in 20.125 steps. The scale parameter is representedas radius of the plots. It is observed that the event distribu-tion patterns can be categorized into several patterns. Threeplots have a dominant excitation around 240 degree, similarto the male example. The others show more complex eventdistribution patterns, especially ‘sob’ quality (j05).
5. Discussion
The proposed method yields a rich source of informationfor characterizing various voice quality in an objective man-ner. Frequency dependent aperiodicity pattern and temporalaperiodic energy concentration are extracted and controlled
5
MAVEBA 2001, Firenze, Italy 63

6 Kawahara, Estill & Fujimura / 2nd MAVEBA, September 13-15, 2001, Firenze, Italy
j01
6
12
18
30
210
60
240
90
270
120
300
150
330
180 0
j02
6
12
18
30
210
60
240
90
270
120
300
150
330
180 0
j03
6
12
18
30
210
60
240
90
270
120
300
150
330
180 0
j04
6
12
18
30
210
60
240
90
270
120
300
150
330
180 0
j05
6
12
18
30
210
60
240
90
270
120
300
150
330
180 0
j06
6
12
18
30
210
60
240
90
270
120
300
150
330
180 0
j07
6
12
18
30
210
60
240
90
270
120
300
150
330
180 0
j08
6
12
18
30
210
60
240
90
270
120
300
150
330
180 0
j09
6
12
18
30
210
60
240
90
270
120
300
150
330
180 0
j10
6
12
18
30
210
60
240
90
270
120
300
150
330
180 0
Figure 7. Time domain representation of event locations and energy concen-tration. Angle represents phase of fundamental component. Radius repre-sents analysis scale parameter. The density of symbol represents normalizedenergy concentration.
in the proposed scheme. Simulation studies illustrated thatthe proposed method for analysis and control of aperiodiccomponent is consistent in reproducing extracted parameters.
But this does not guarantee that the synthetic voice gener-ated using the proposed method can perfectly reproduce thedesired voice quality. Further investigations based on audi-tory perception, especially time-frequency masking[11] andauditory scene analysis[12], as well as voice production areindispensable.
6. Conclusion
A new paradigm for extraction and control of aperiodiccomponent in excitation source for voice synthesis is in-troduced. The proposed paradigm extends applicability ofSTRAIGHT, a high-quality speech analysis, modificationand synthesis system. The new parameters provide means torepresent and control on additional aspects of voice qualityto conventional descriptions. Demonstrations using variousvoice quality examples illustrate how the proposed methodcan contribute in understanding voice emission and percep-tion.
References
[1] H. Kawahara, Speech representation and transformation usingadaptive interpolation of weighted spectrum: Vocoder revis-ited, in: Proceedings of IEEE int. Conf. Acoust., Speech andSignal Processing, Vol. 2, Muenich, 1997, pp. 1303–1306.
[2] H. Kawahara, I. Masuda-Katsuse, A. de Cheveigne, Restruc-turing speech representations using a pitch-adaptive time-frequency smoothing and an instantaneous-frequency-based F0extraction, Speech Communication 27 (3-4) (1999) 187–207.
[3] O. Fujimura, An approximation to voice aperiodicity, IEEETrans. Aud. Eng. 16 (1968) 68–72.
[4] L. Cohen, Time-frequency analysis, Prentice Hall, EnglewoodCliffs, NJ, 1995.
[5] H. Kawahara, H. Katayose, A. de Cheveigne, R. D. Patterson,Fixed point analysis of frequency to instantaneous frequencymapping for accurate estimation of F0 and periodicity, in: Proc.Eurospeech’99, Vol. 6, 1999, pp. 2781–2784.
[6] F. J. Charpentier, Pitch detection using the short-term phasespectrum, Proceedings of ICASSP’86 (1986) 113–116.
[7] T. Abe, T. Kobayashi, S. Imai, Harmonics estimation based oninstantaneous frequency and its application to pitch determina-tion, IEICE Trans. Information and Systems E78-D (9) (1995)1188–1194.
[8] M. Cooke, Modelling Auditory Processing and Organization,Cambridge University Press, Cambridge, UK, 1993.
[9] H. Kawahara, Y. Atake, P. Zolfaghari, Accurate vocal eventdetection method based on a fixed-point analysis of mappingfrom time to weighted average group delay, in: Proc. IC-SLP’2000, Beijin China, 2000, pp. 664–667.
[10] Y. Atake, T. Irino, H. Kawahara, J. Lu, S. Nakamura,K. Shikano, Robust fundamental frequency estimation usinginstantaneous frequencies of harmonic components, in: Proc.ICSLP’2000, PB(2)-26, Beijing China, 2000, pp. 907–910.
[11] J. Skoglund, W. B. Kleijn, On time-frequency masking invoiced speech, IEEE Trans. on Speech and Audio Processing8 (4).
[12] A. S. Bregman, Auditory Scene Analysis, MIT Press, Cam-bridge, MA, 1990.
6
MAVEBA 2001, Firenze, Italy 64